
Glasdegib Dimaleate: Synthesis, Characterization and Comparison of Its Properties with Monomaleate Analogue


 , , and
Abstract
:
1. Introduction

2. Materials and Methods
2.1. Materials
2.2. Characterization Methods
2.2.1. Fourier Transform Infrared (FTIR) Measurements
2.2.2. Raman Measurements
2.2.3. Differential Scanning Calorimetry (DSC) and Thermogravimetric Analysis (TGA) Measurements
2.2.4. Powder X-ray Diffraction (PXRD) Measurements
2.2.5. Nuclear Magnetic Resonance (NMR) Spectroscopy
2.2.6. Solid-State Nuclear Magnetic Resonance (ssNMR) Analysis
2.2.7. X-ray Single-Crystal Analysis
2.2.8. Ultra-High-Performance Liquid Chromatography (UHPLC) Method
2.2.9. Chiral High-Performance Liquid Chromatography (HPLC) Method
2.2.10. Stress Stability Testing
2.2.11. Dissolution and Solubility Testing
2.3. Synthesis Methods and Characterization Data
2.3.1. Characterization of Glasdegib Monomaleate
2.3.2. Synthesis of Amorphous Glasdegib Base
2.3.3. Synthesis and Characterization of Crystalline Glasdegib Base
2.3.4. Synthesis and Characterization of Glasdegib Dihydrochloride Hydrate
2.3.5. Synthesis and Characterization of Glasdegib Dimaleate
3. Results
3.1. Synthesis of Glasdegib Dimaleate
3.2. Characterization of Glasdegib Dimaleate
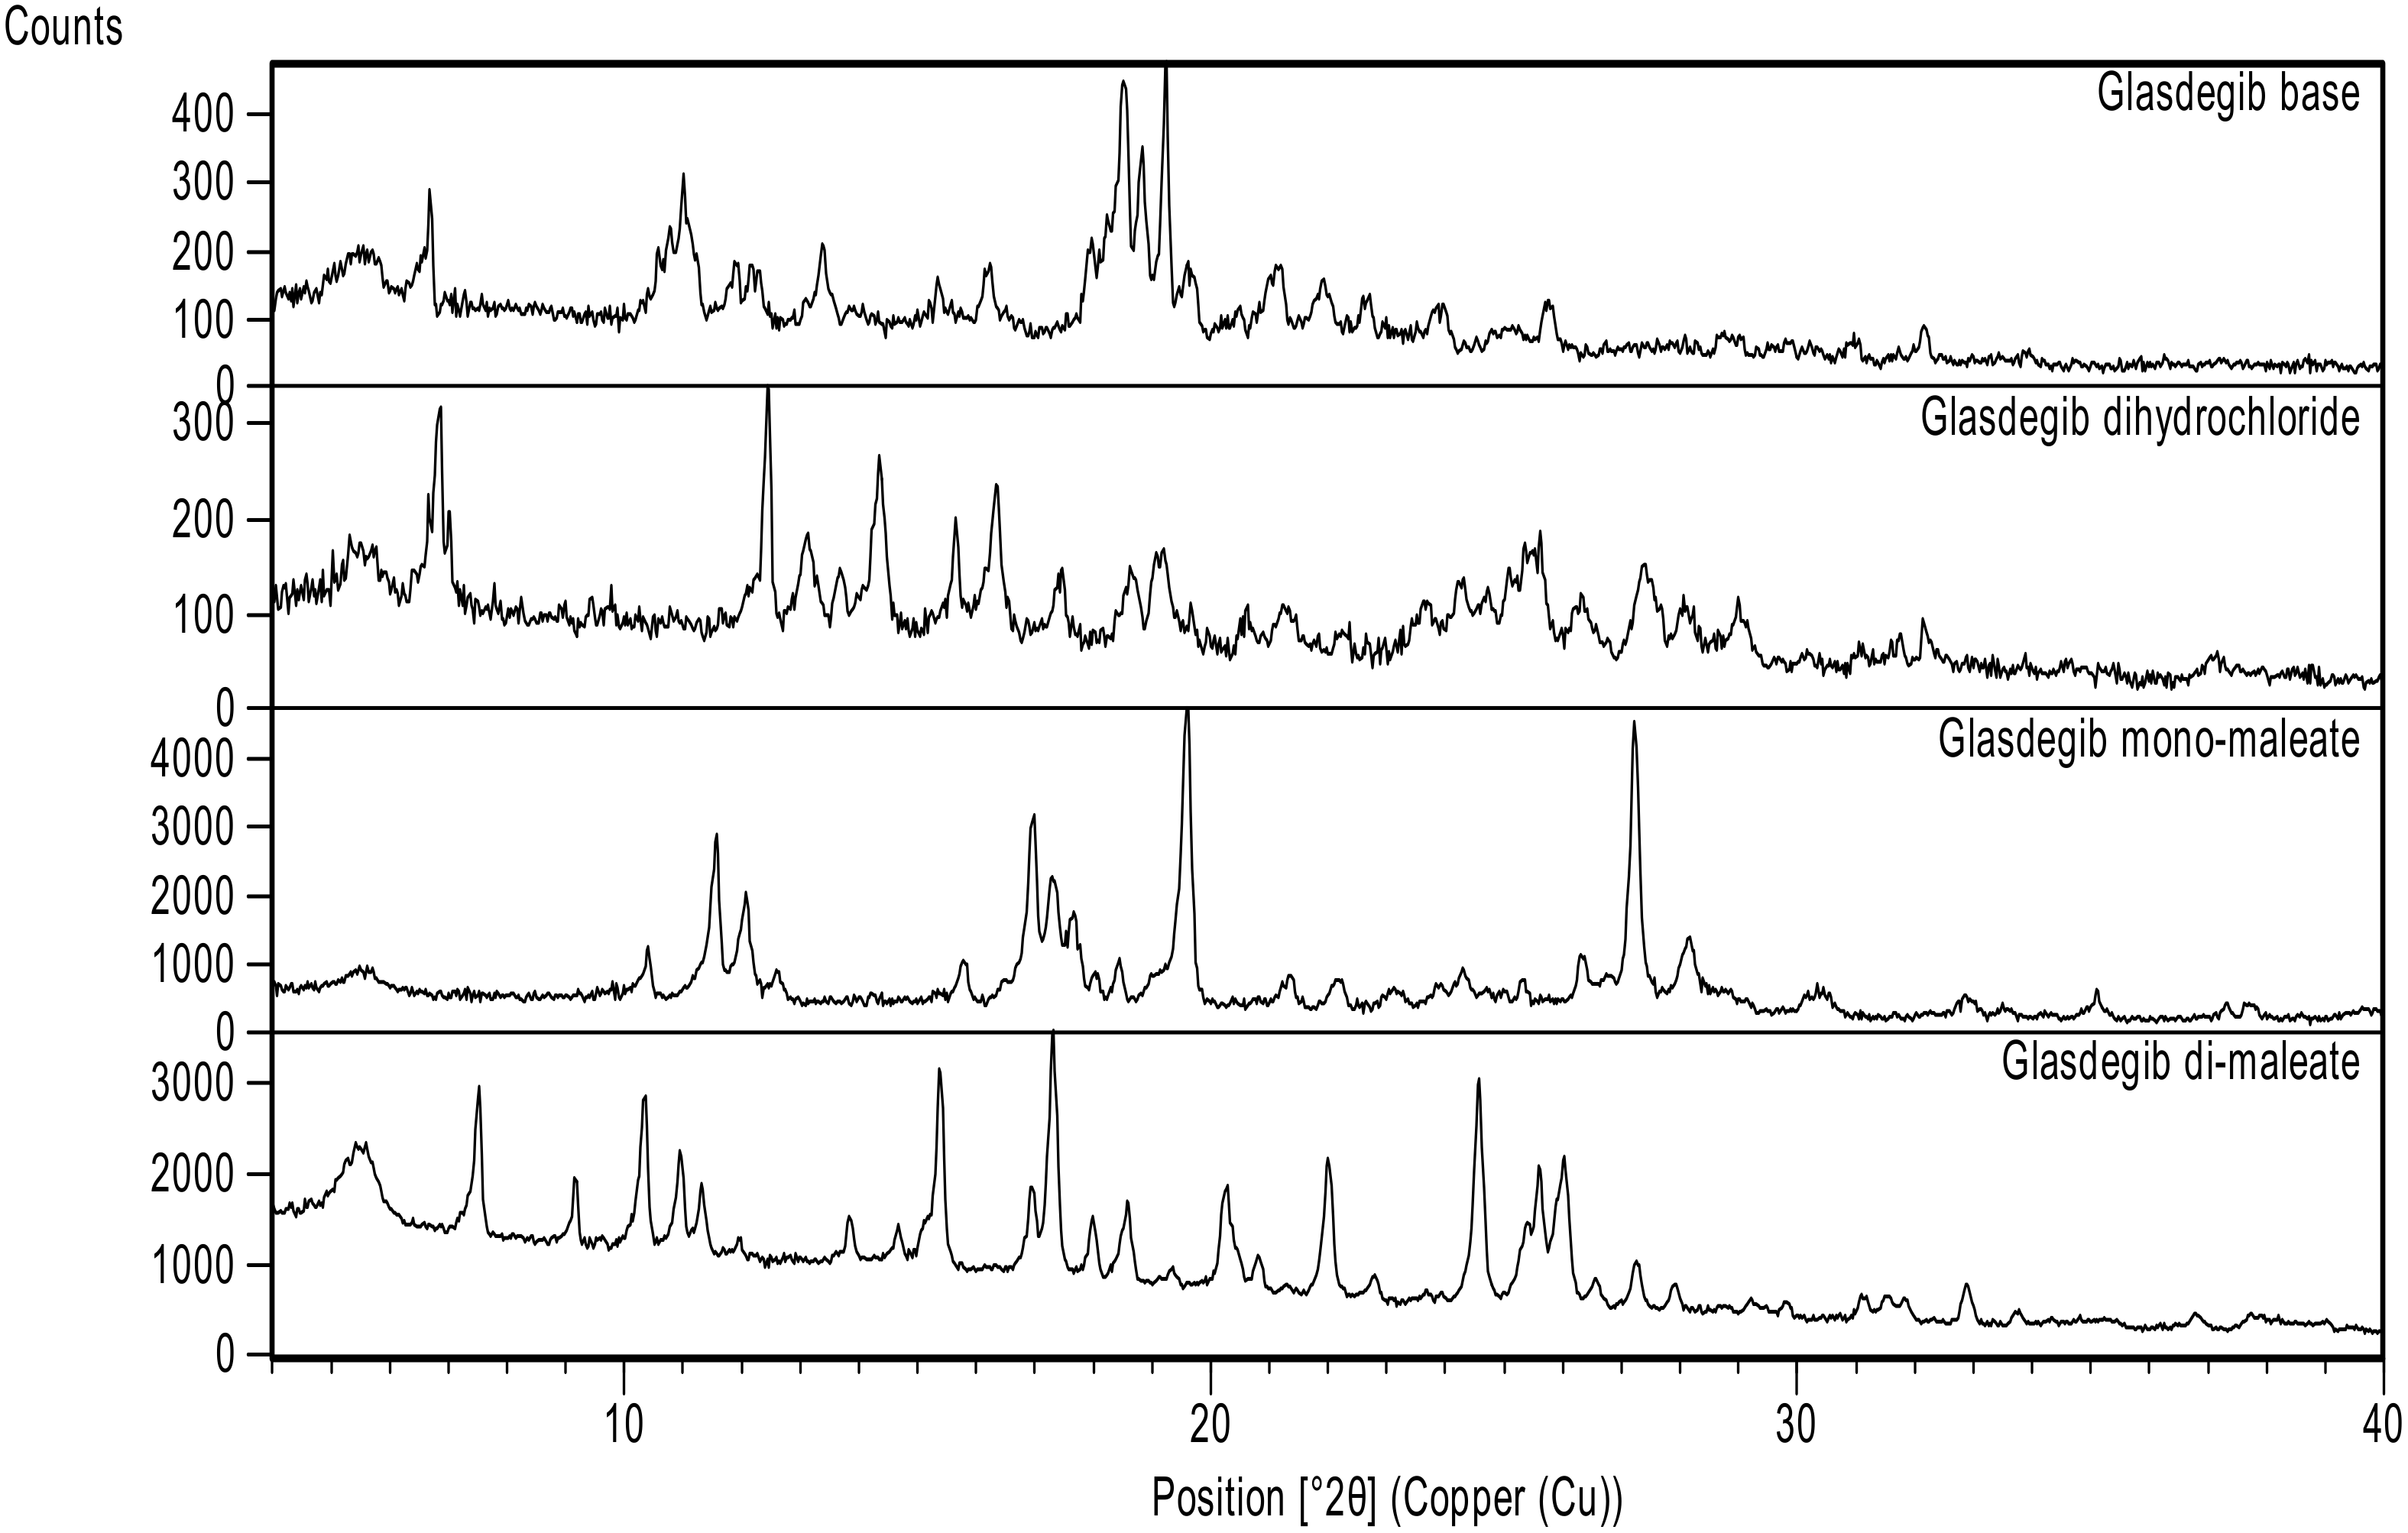
3.2.1. PXRD Analysis
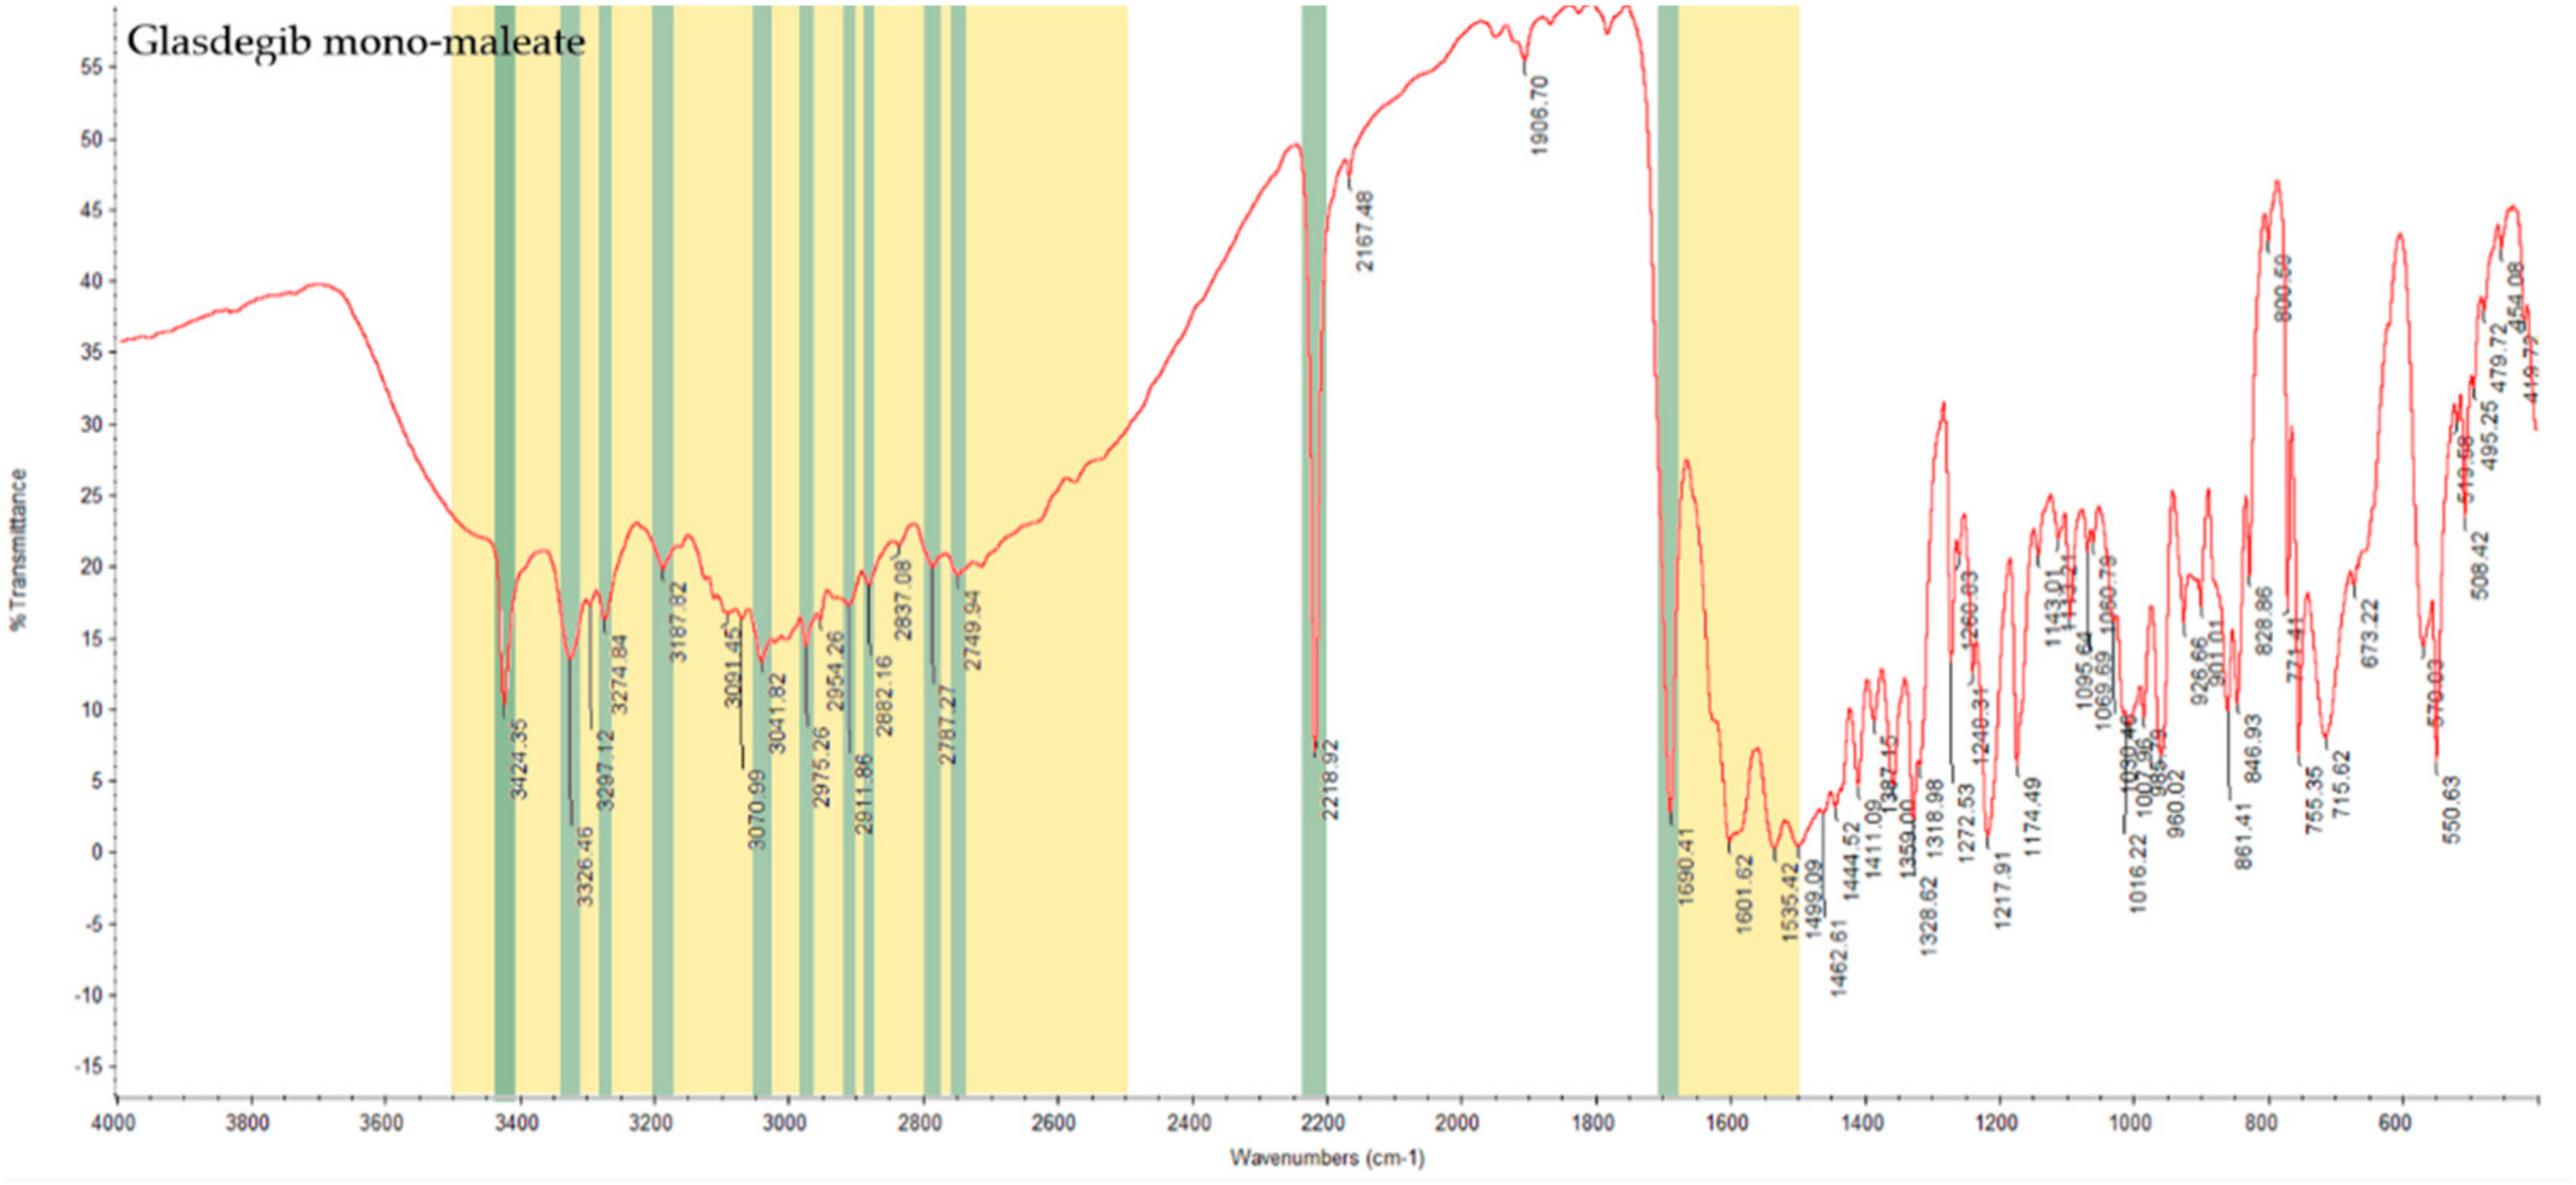
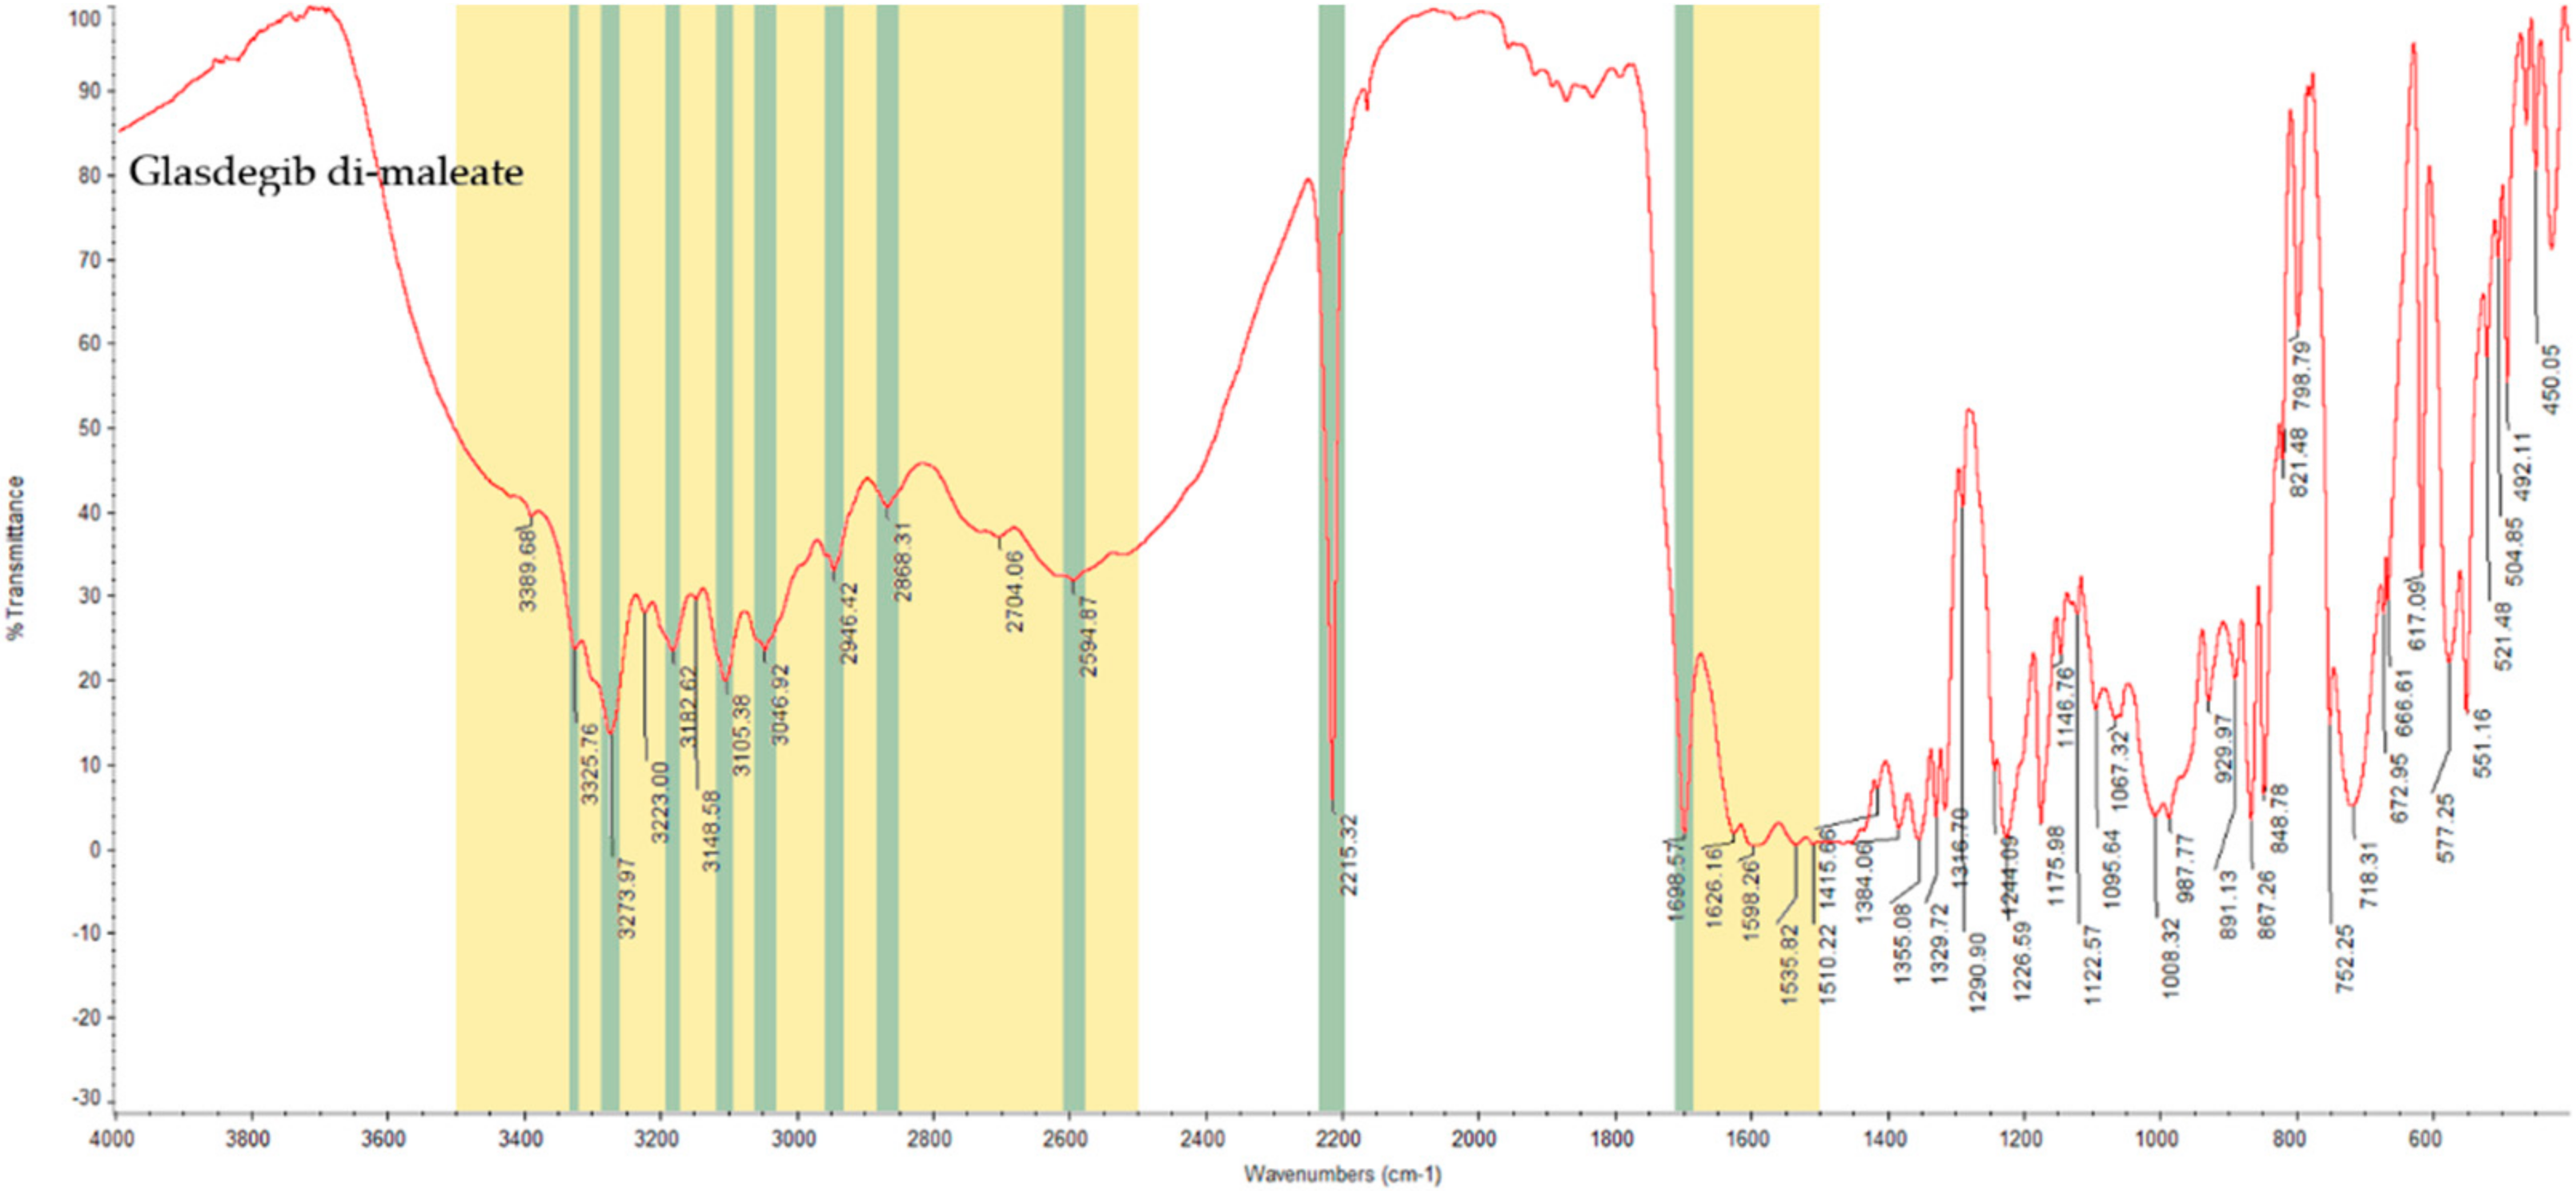
3.2.2. Infrared Spectral Analysis
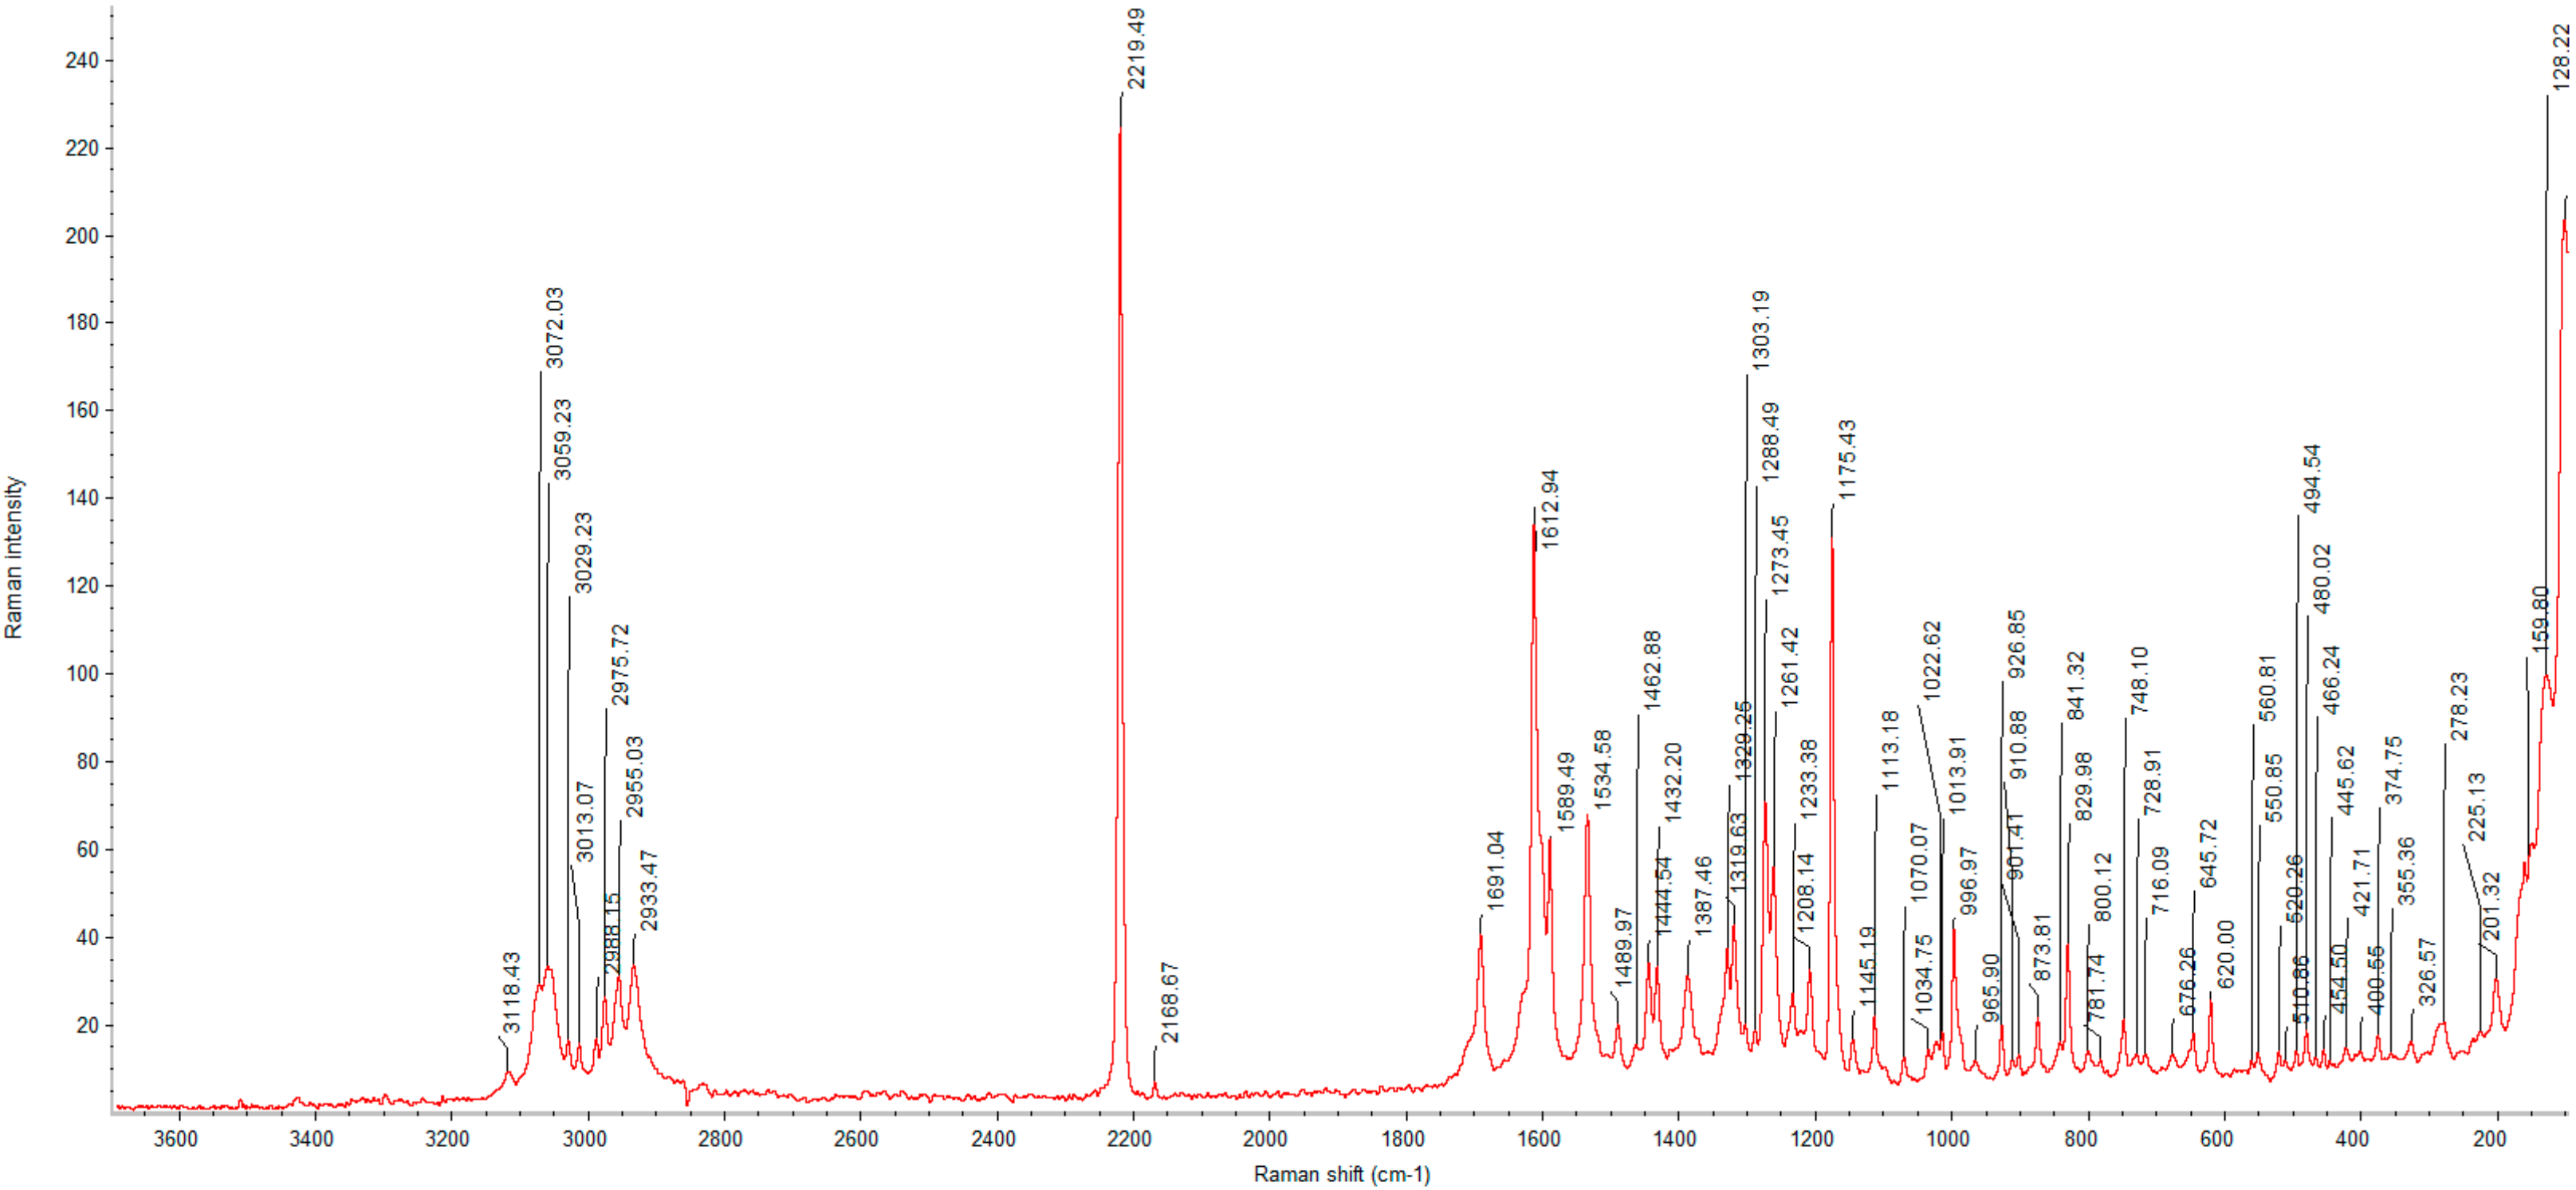
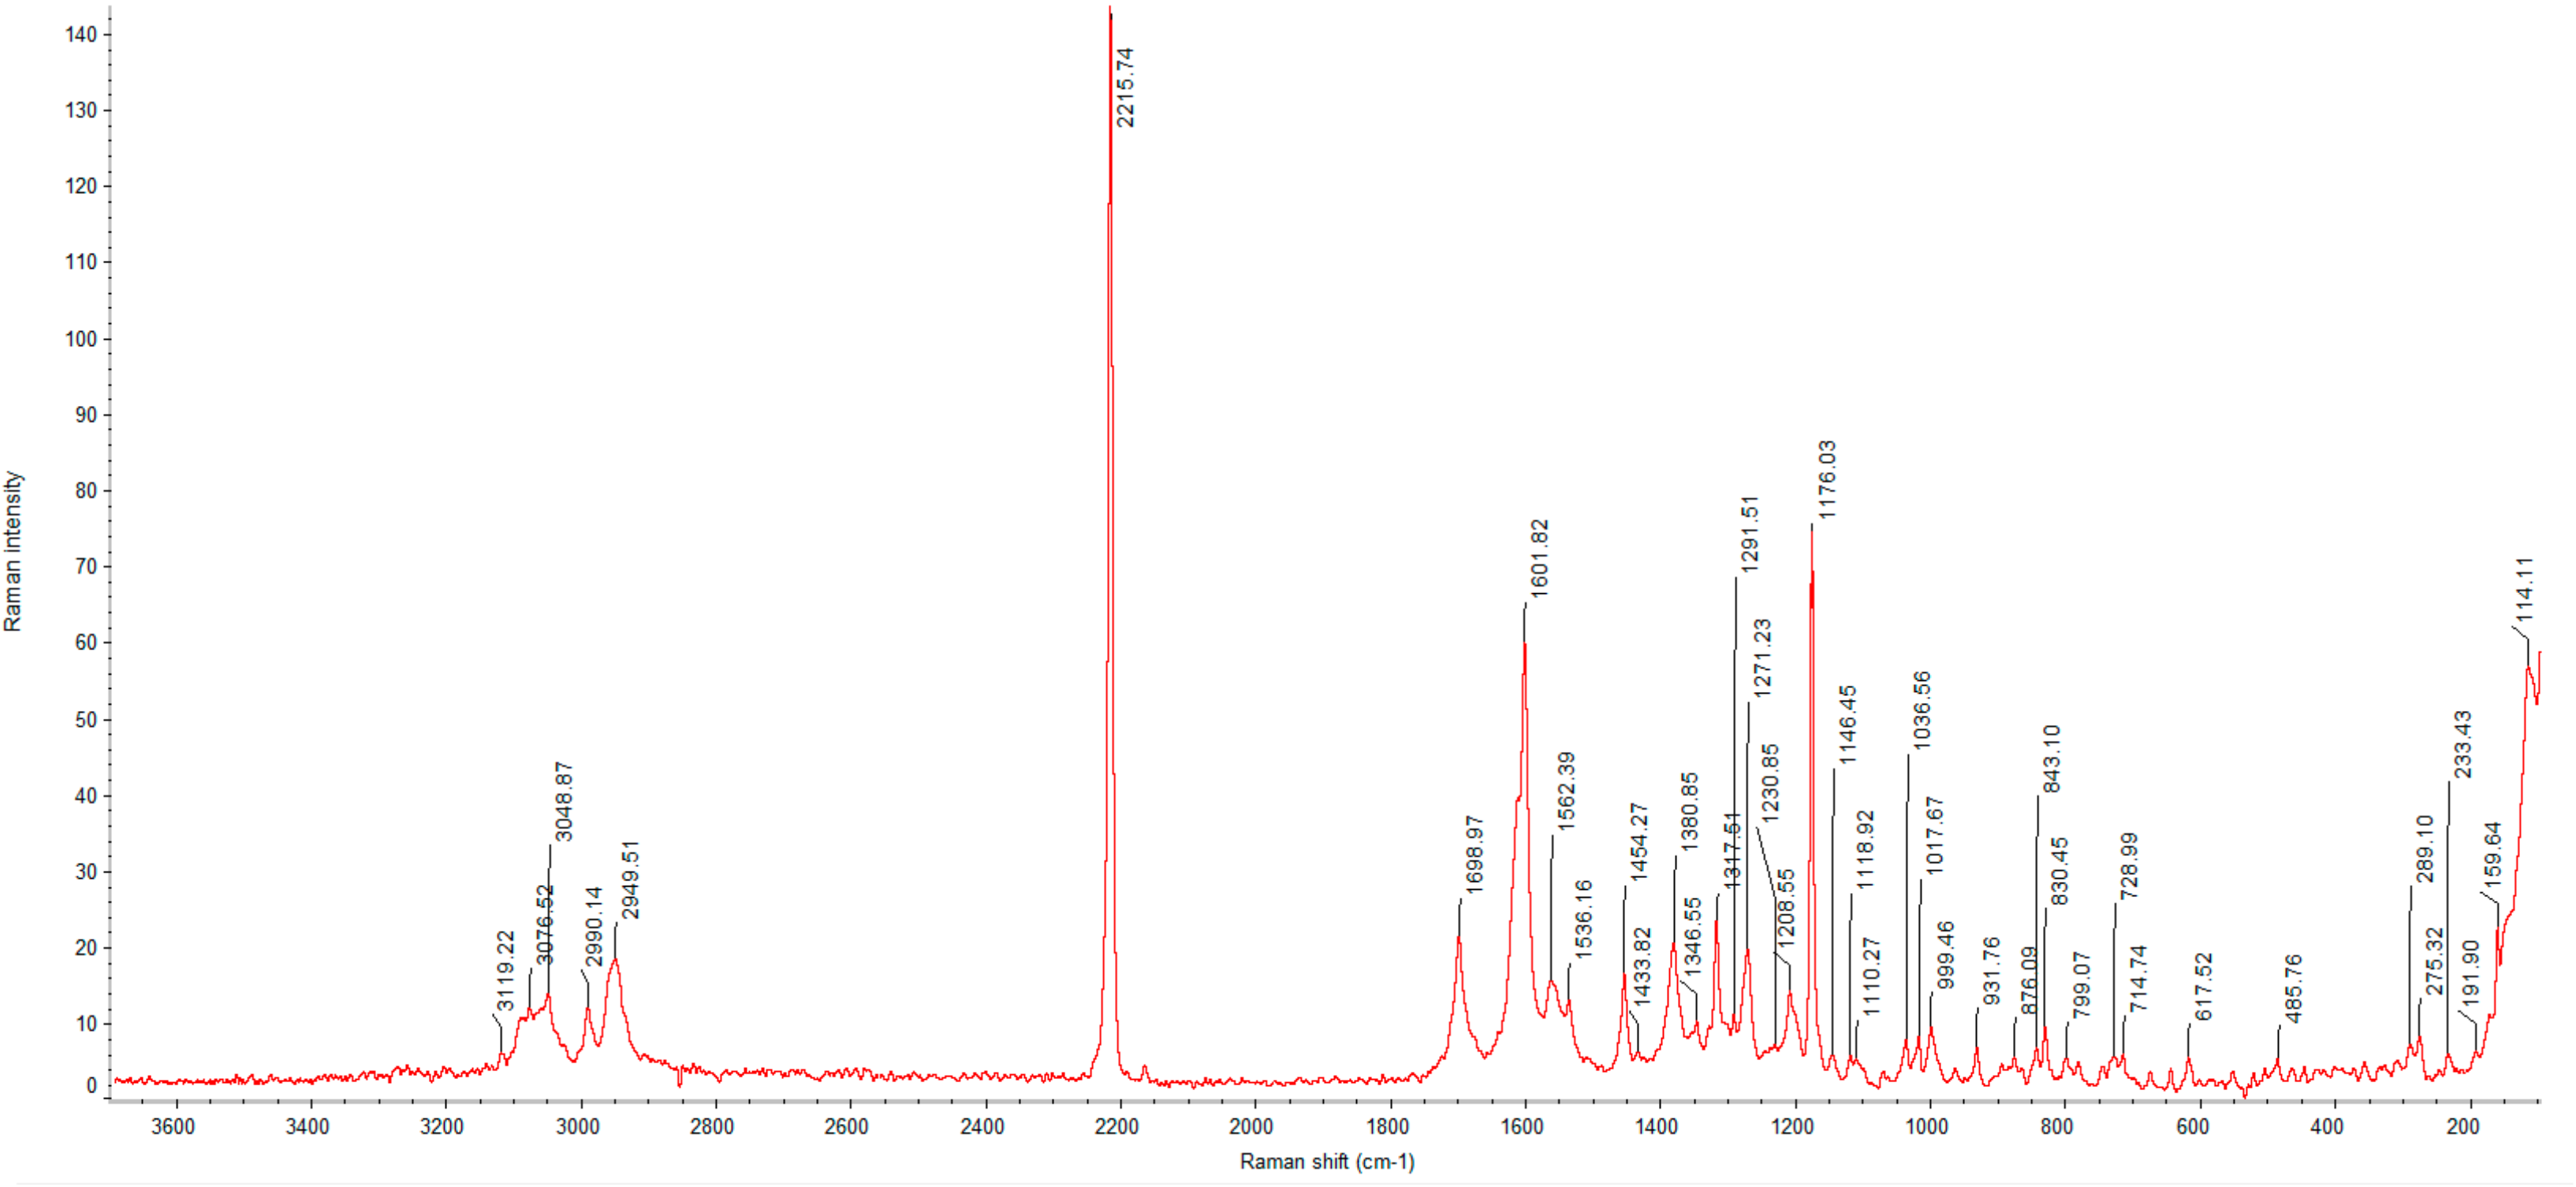
3.2.3. Raman Analysis
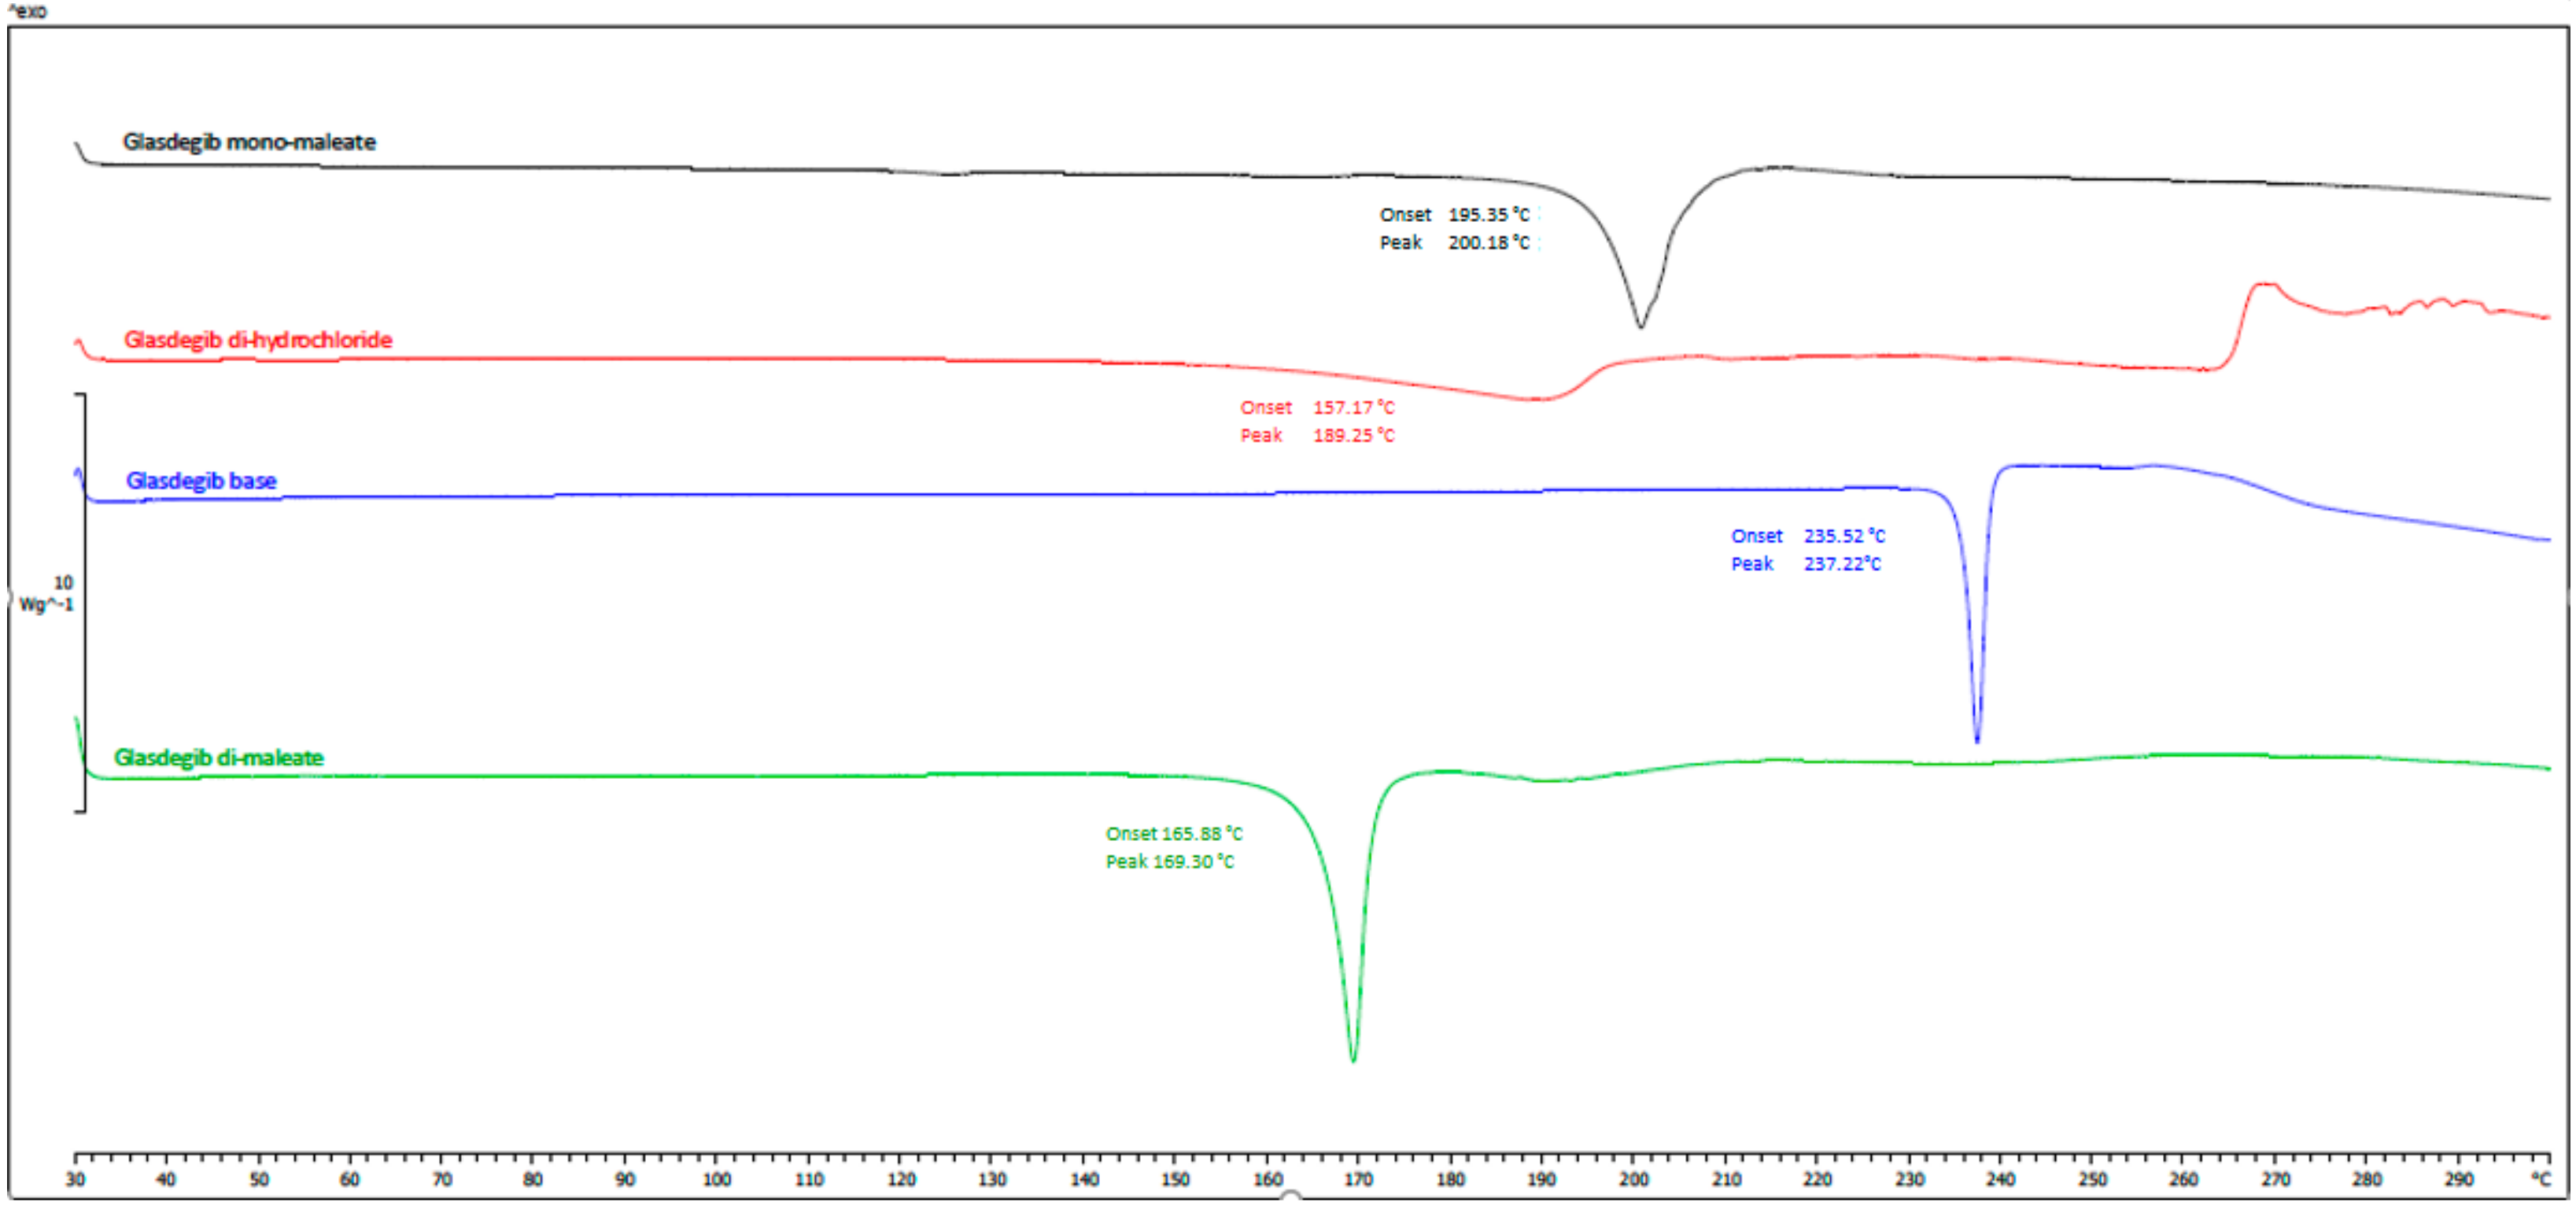
3.2.4. DSC and TGA Analysis
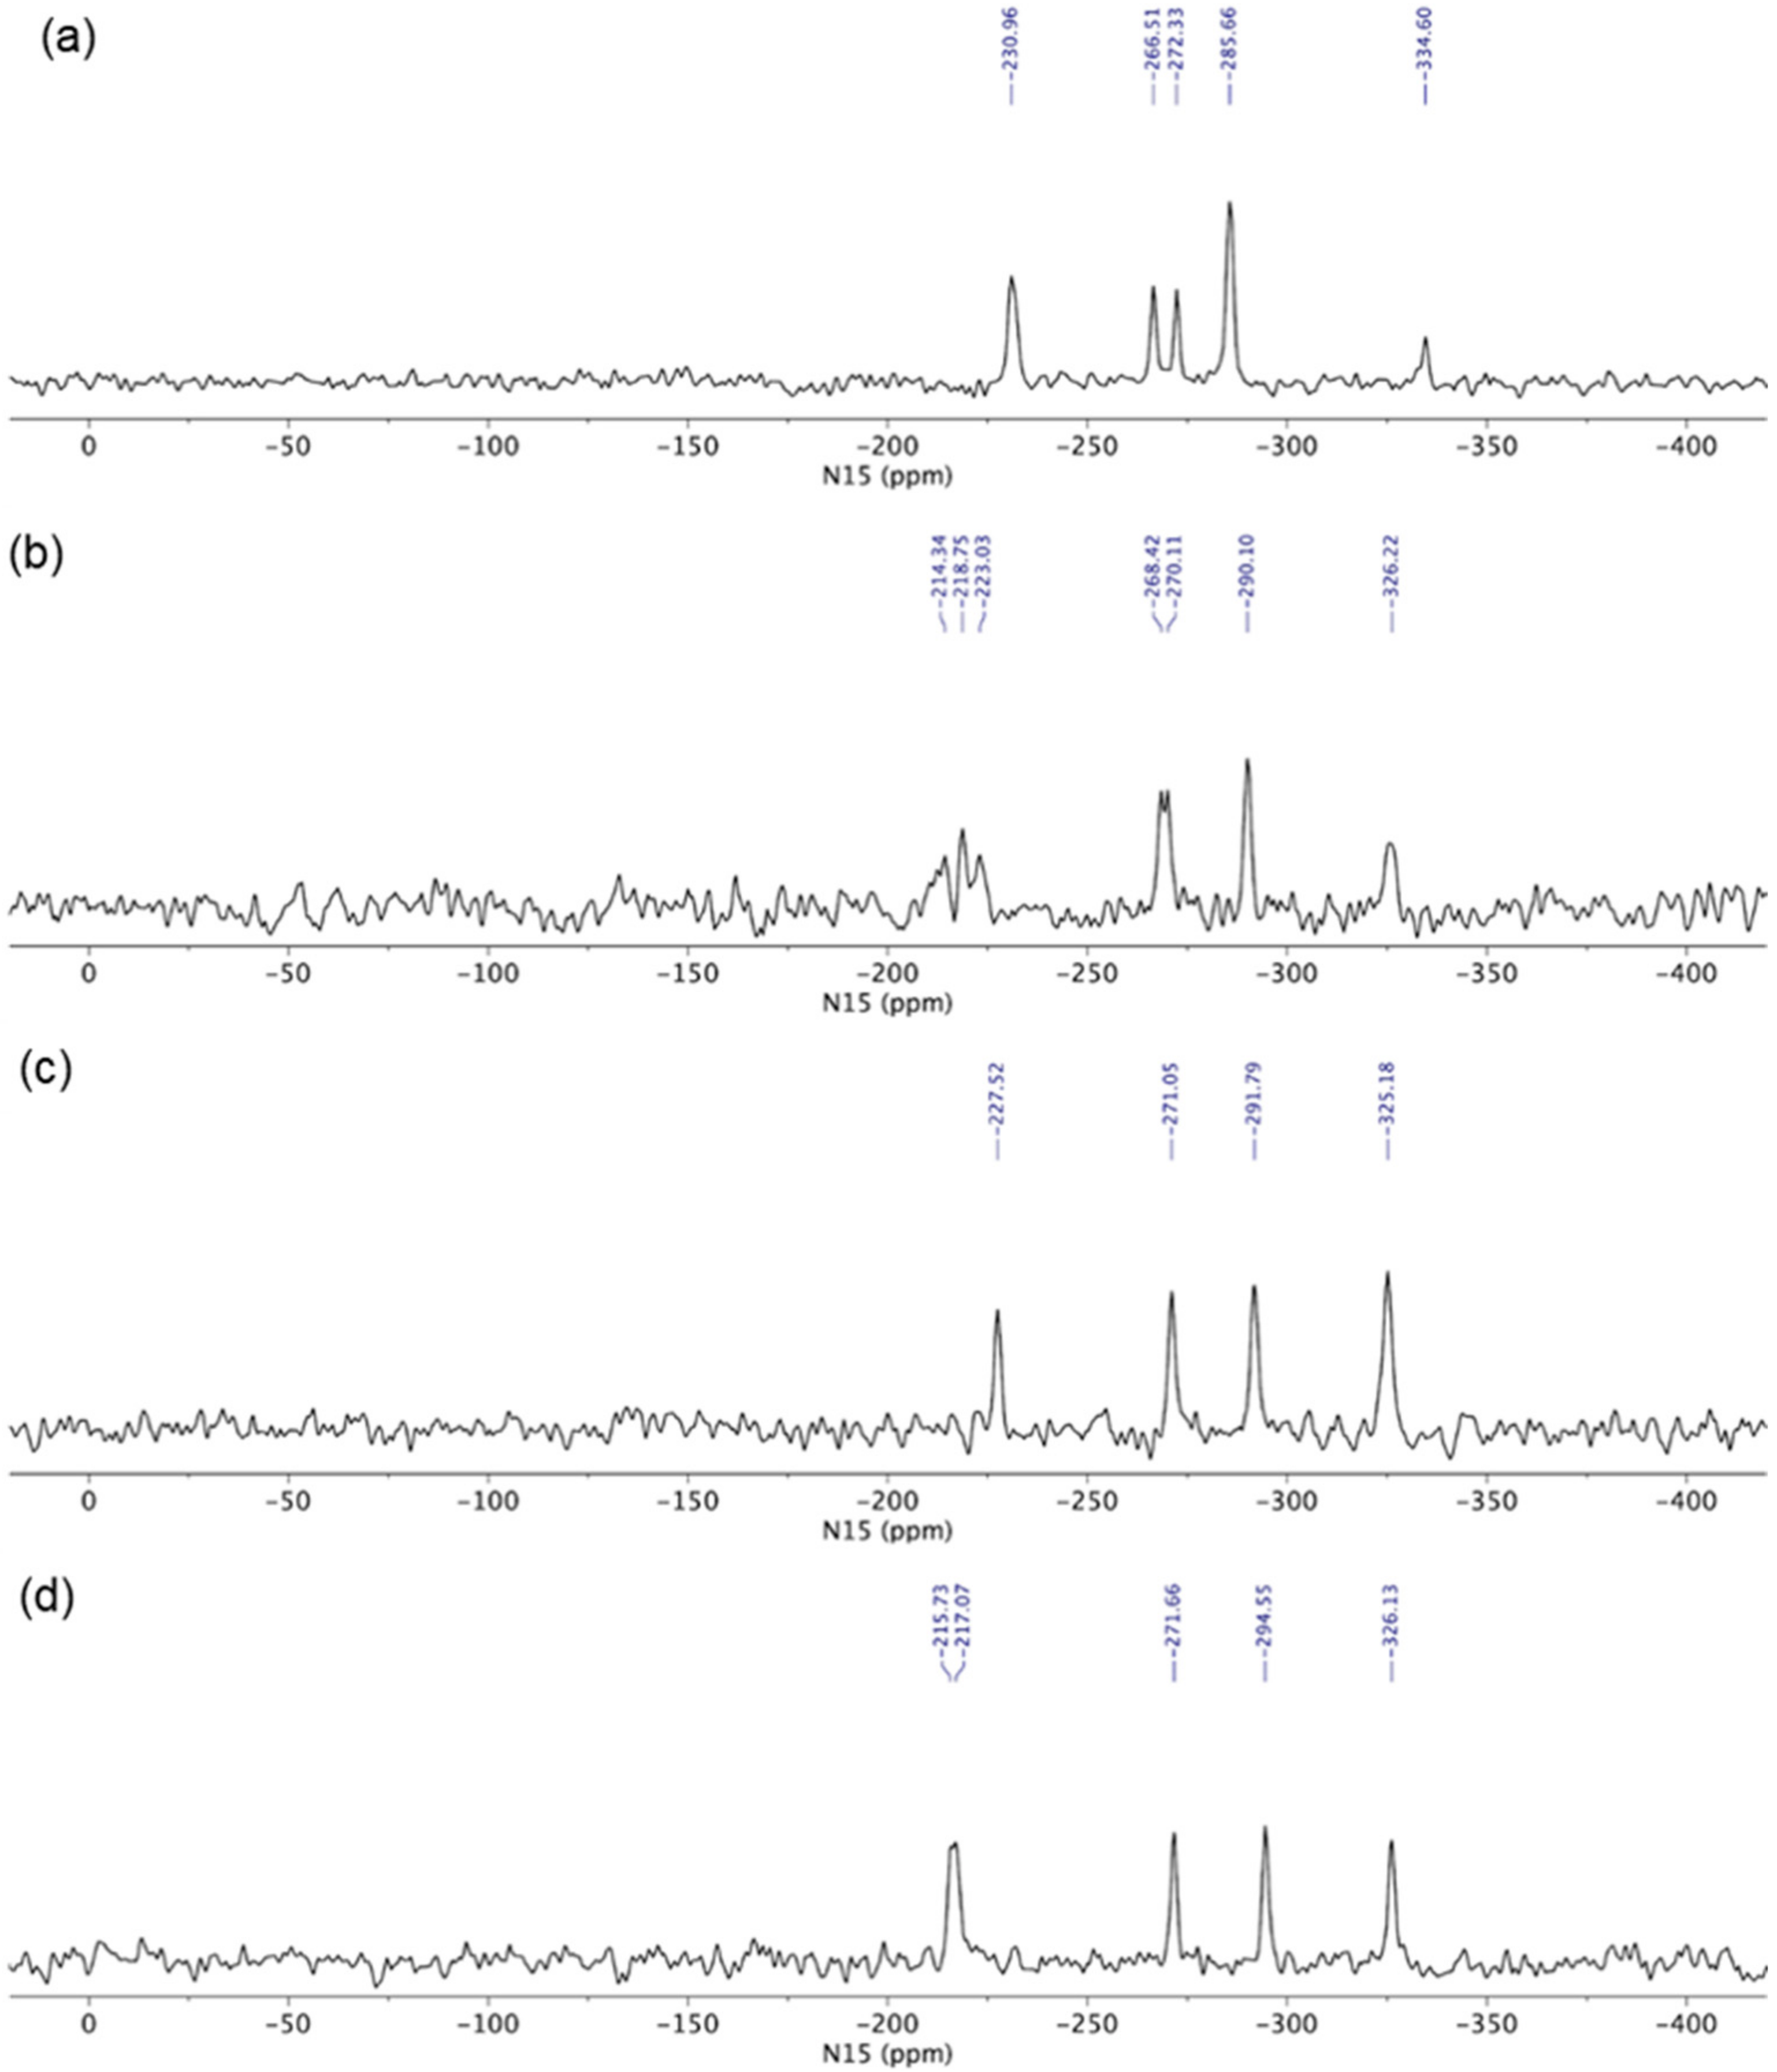
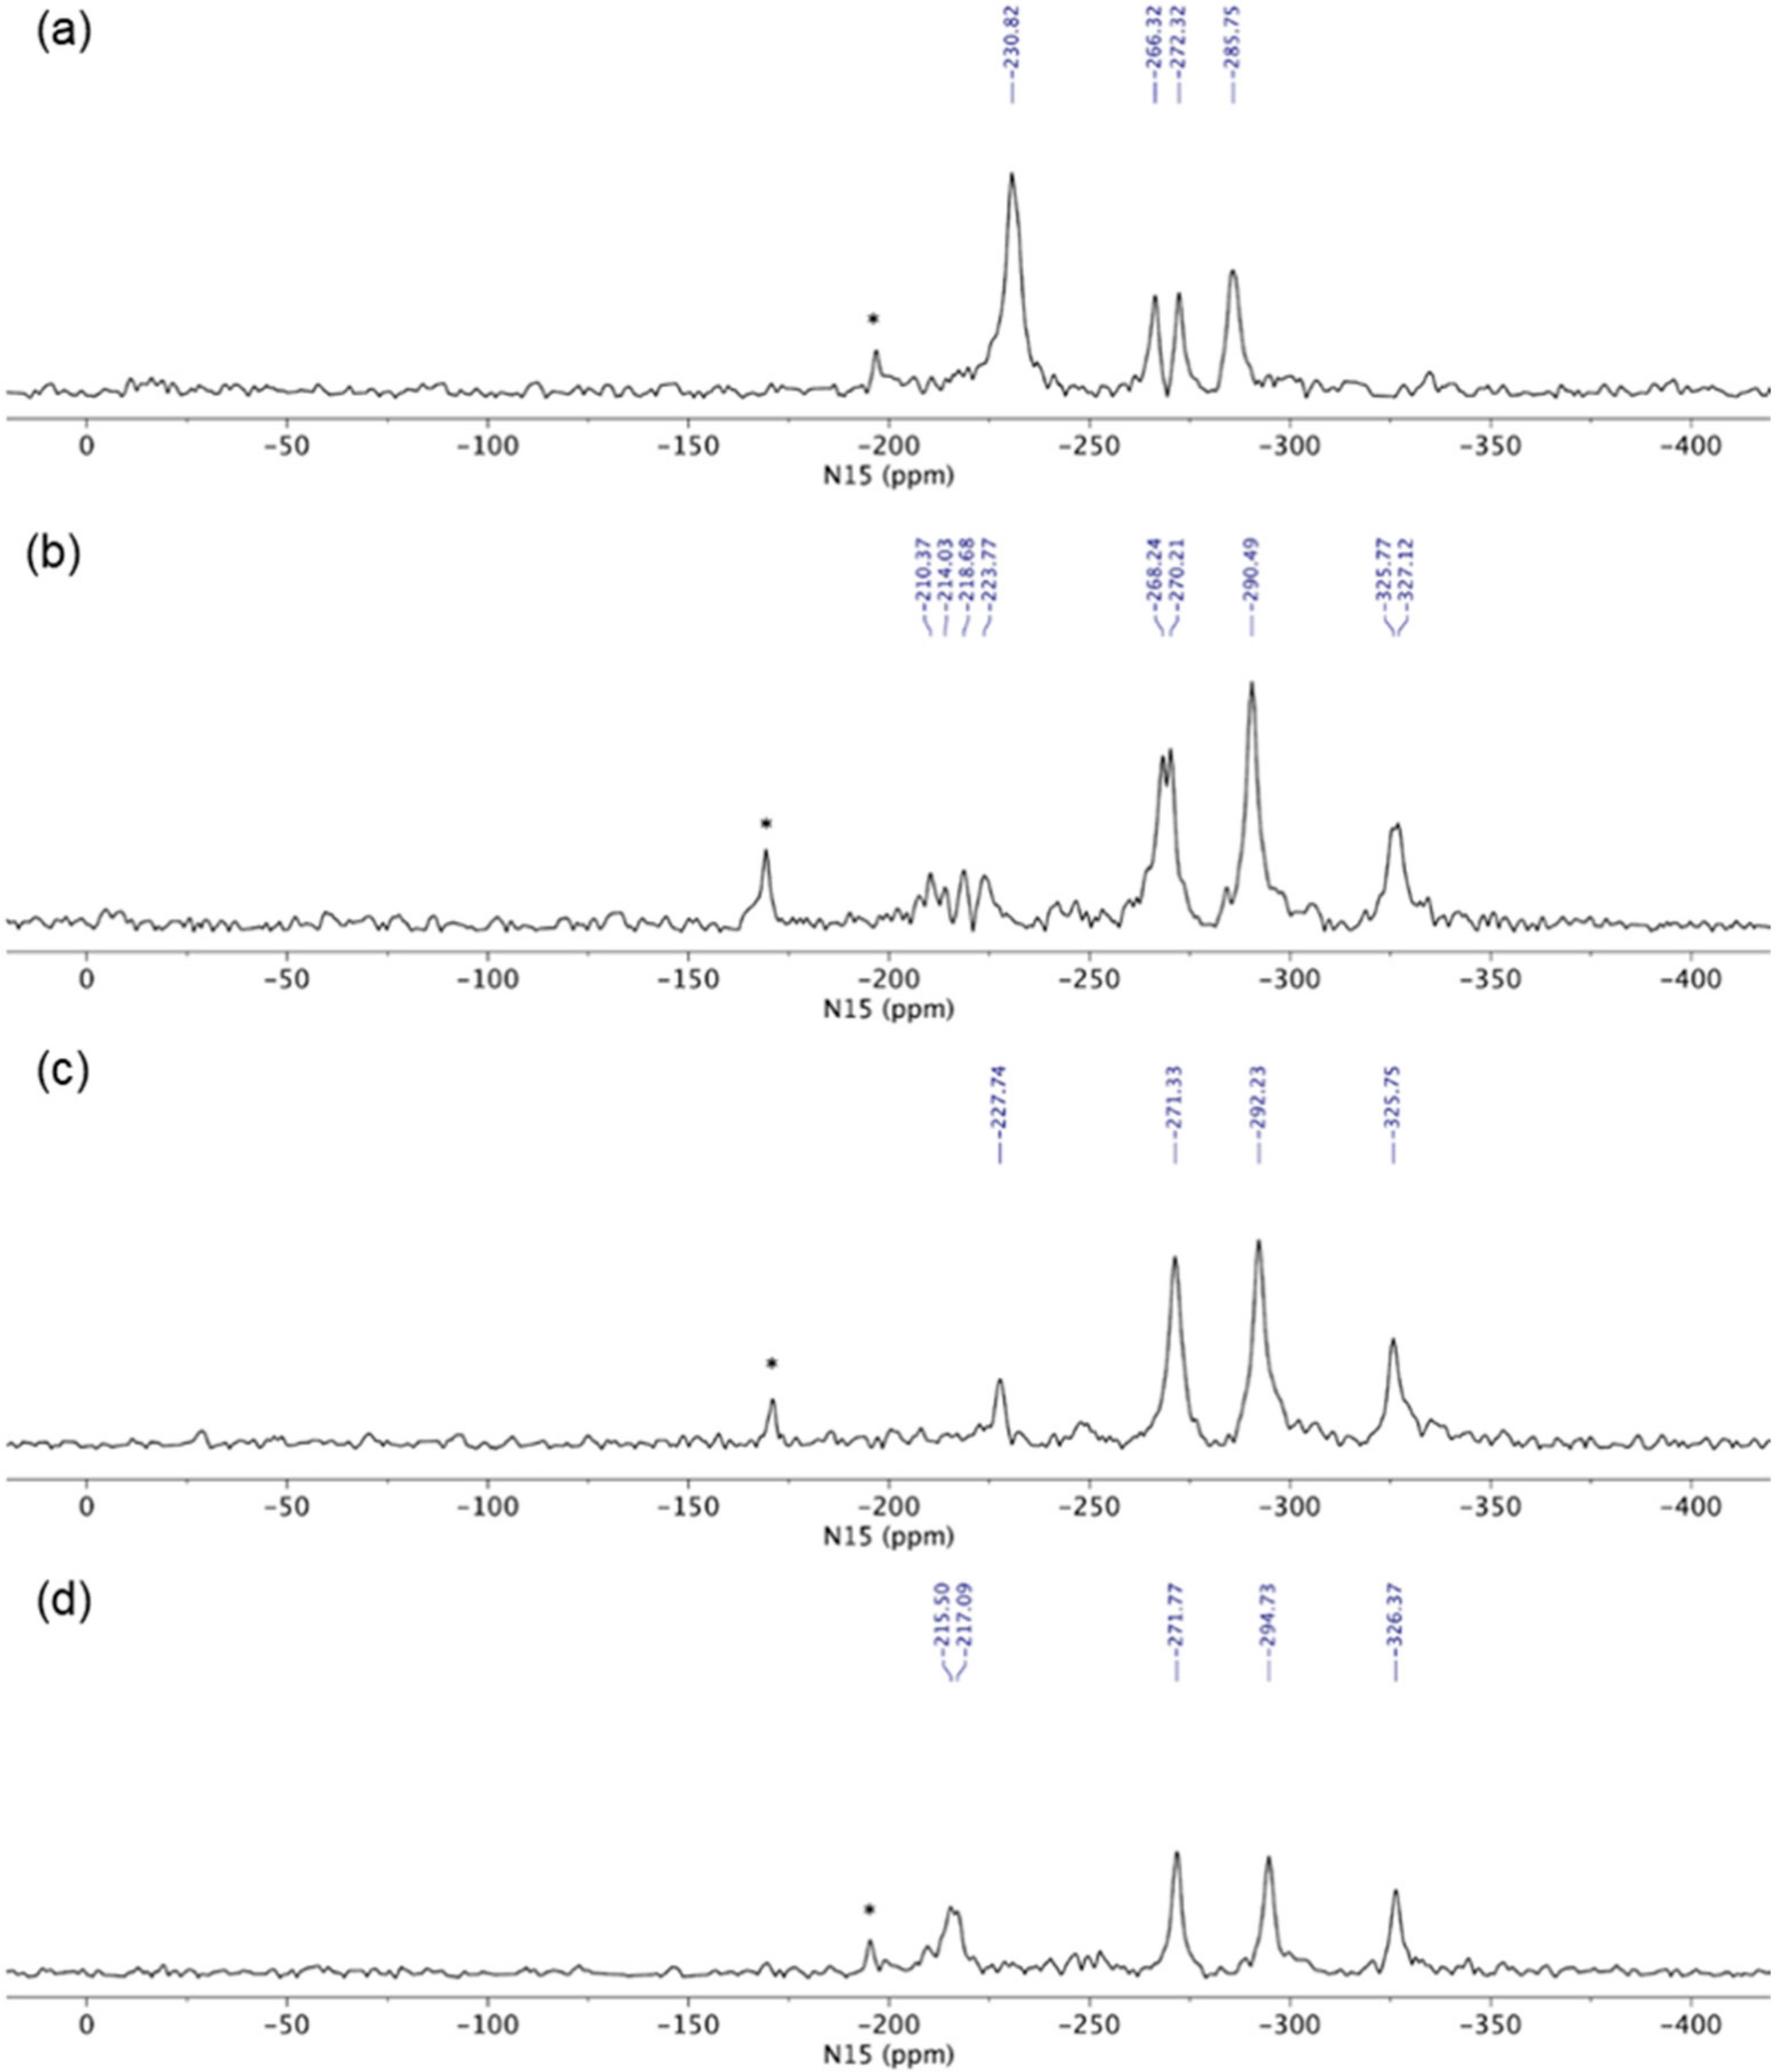
3.2.5. Solid-State Nuclear Magnetic Resonance Analysis
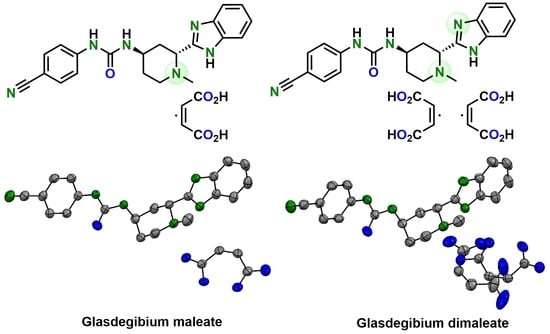
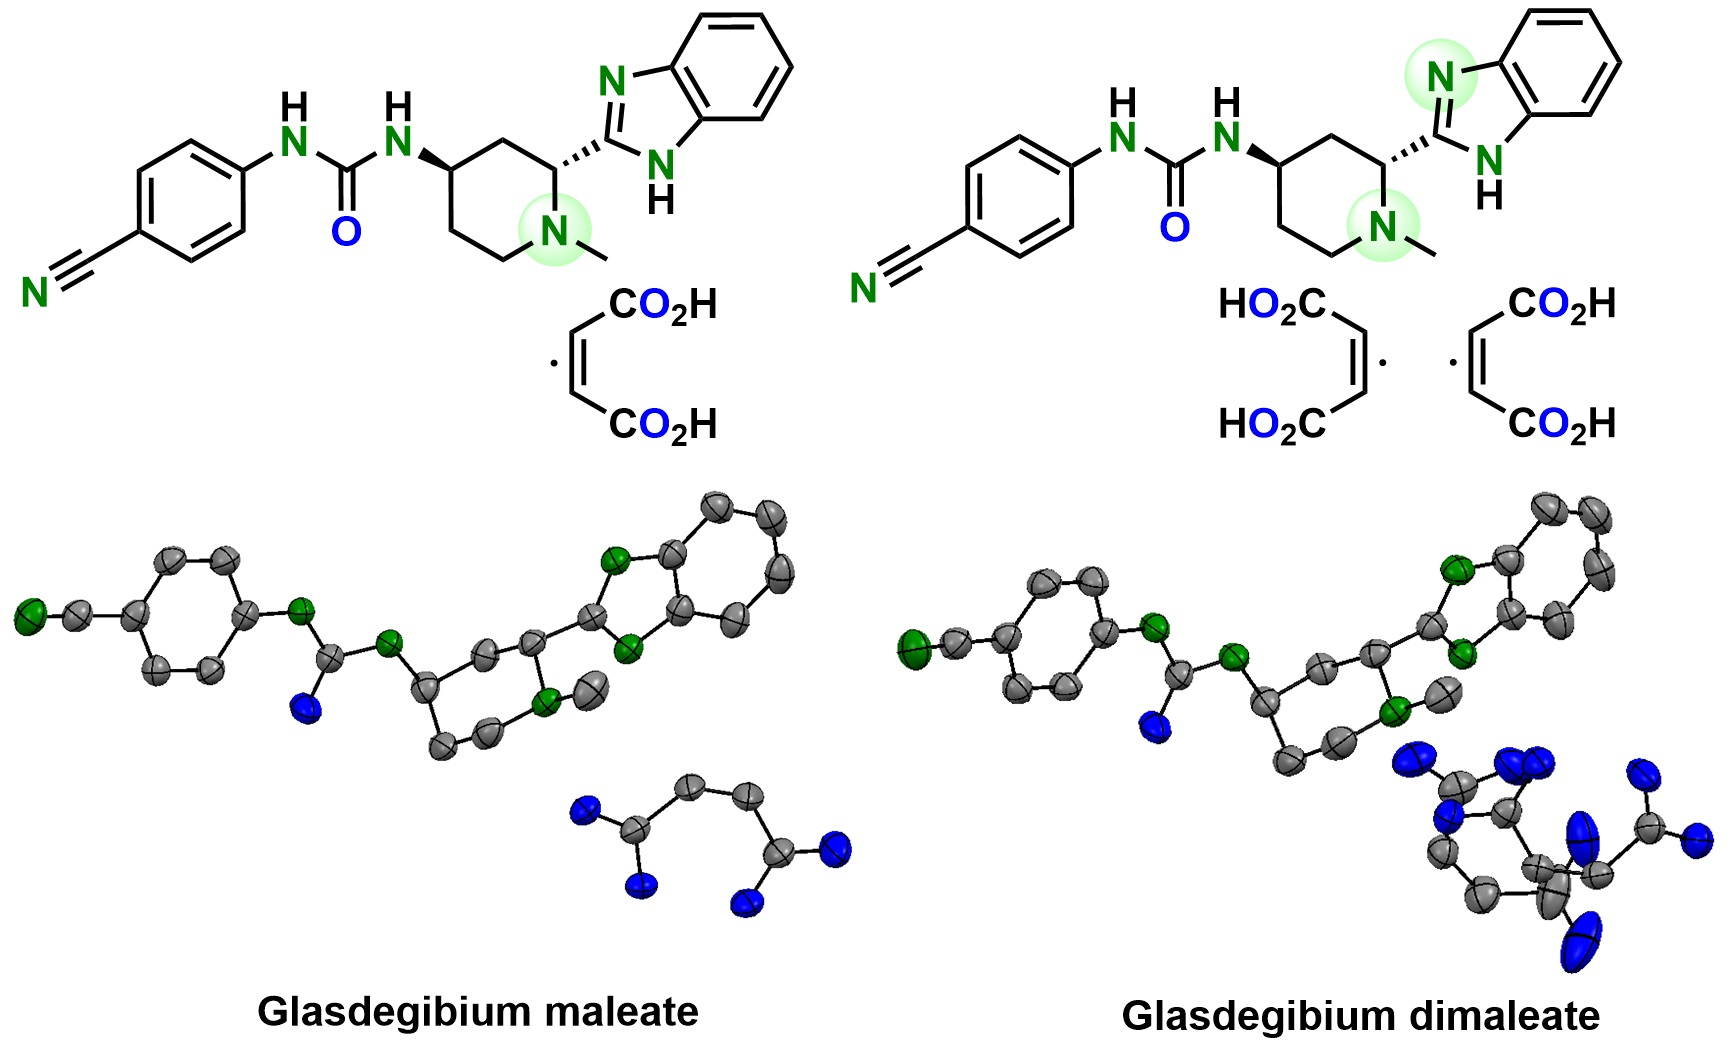
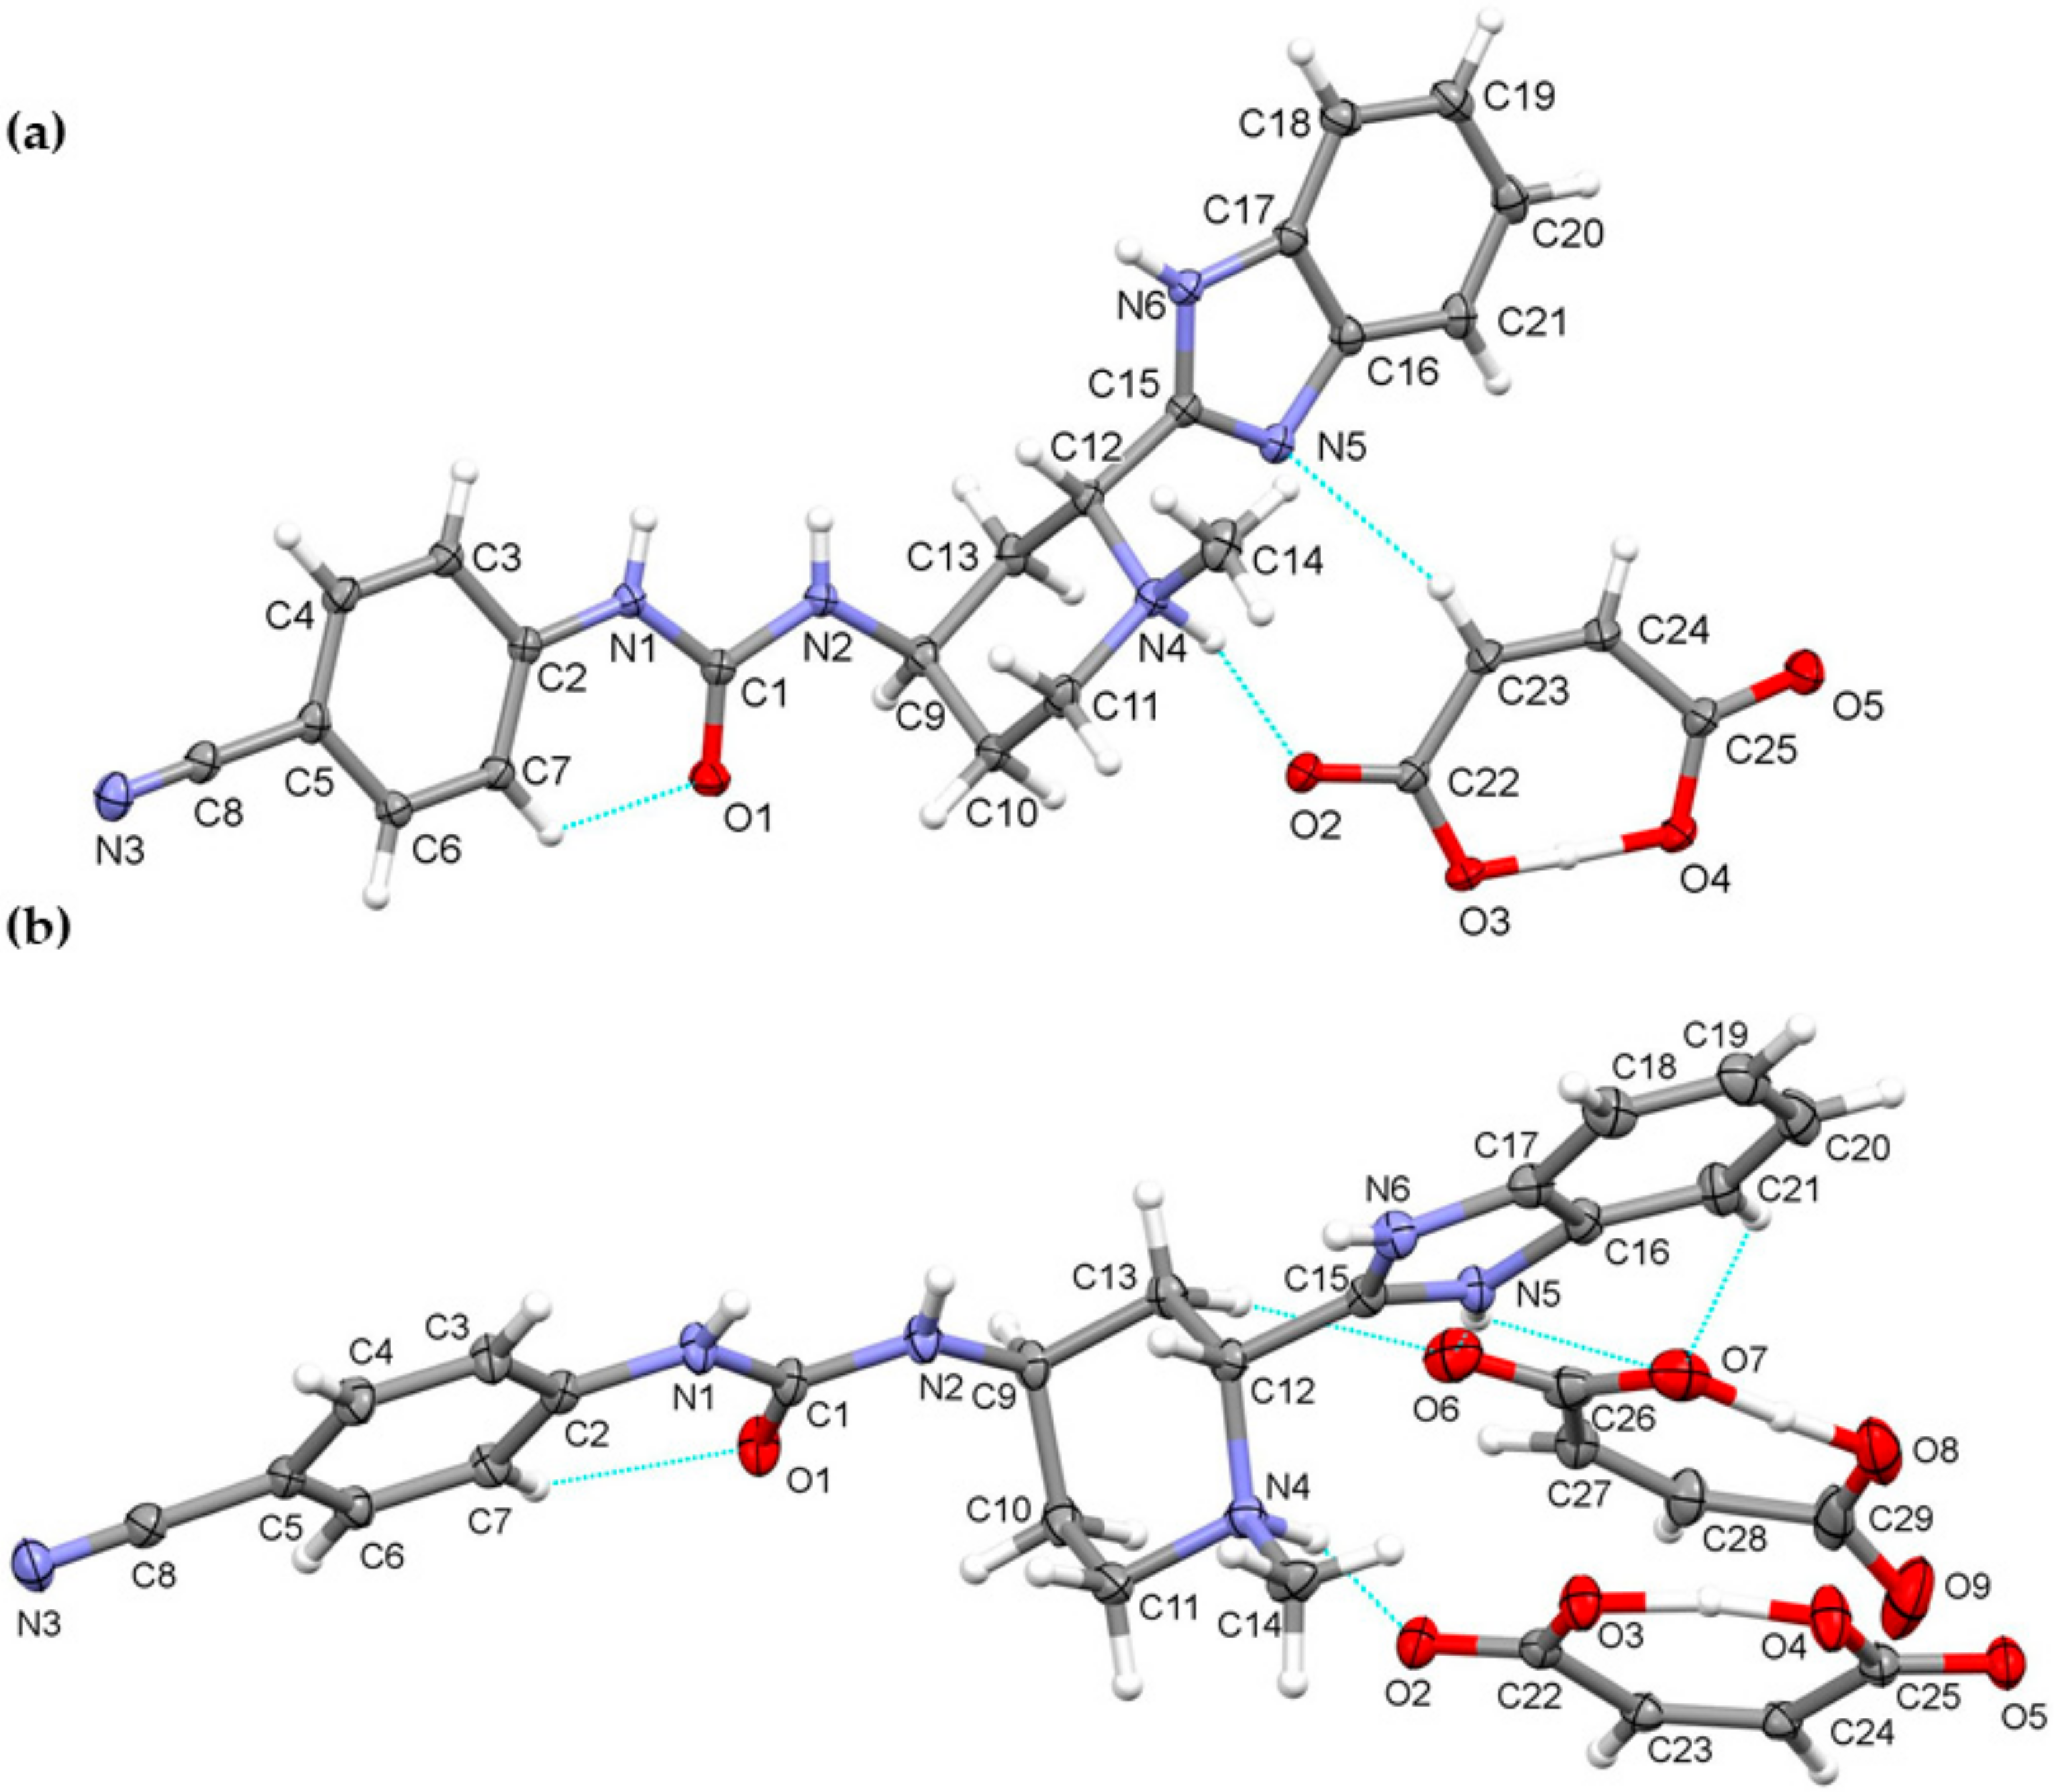
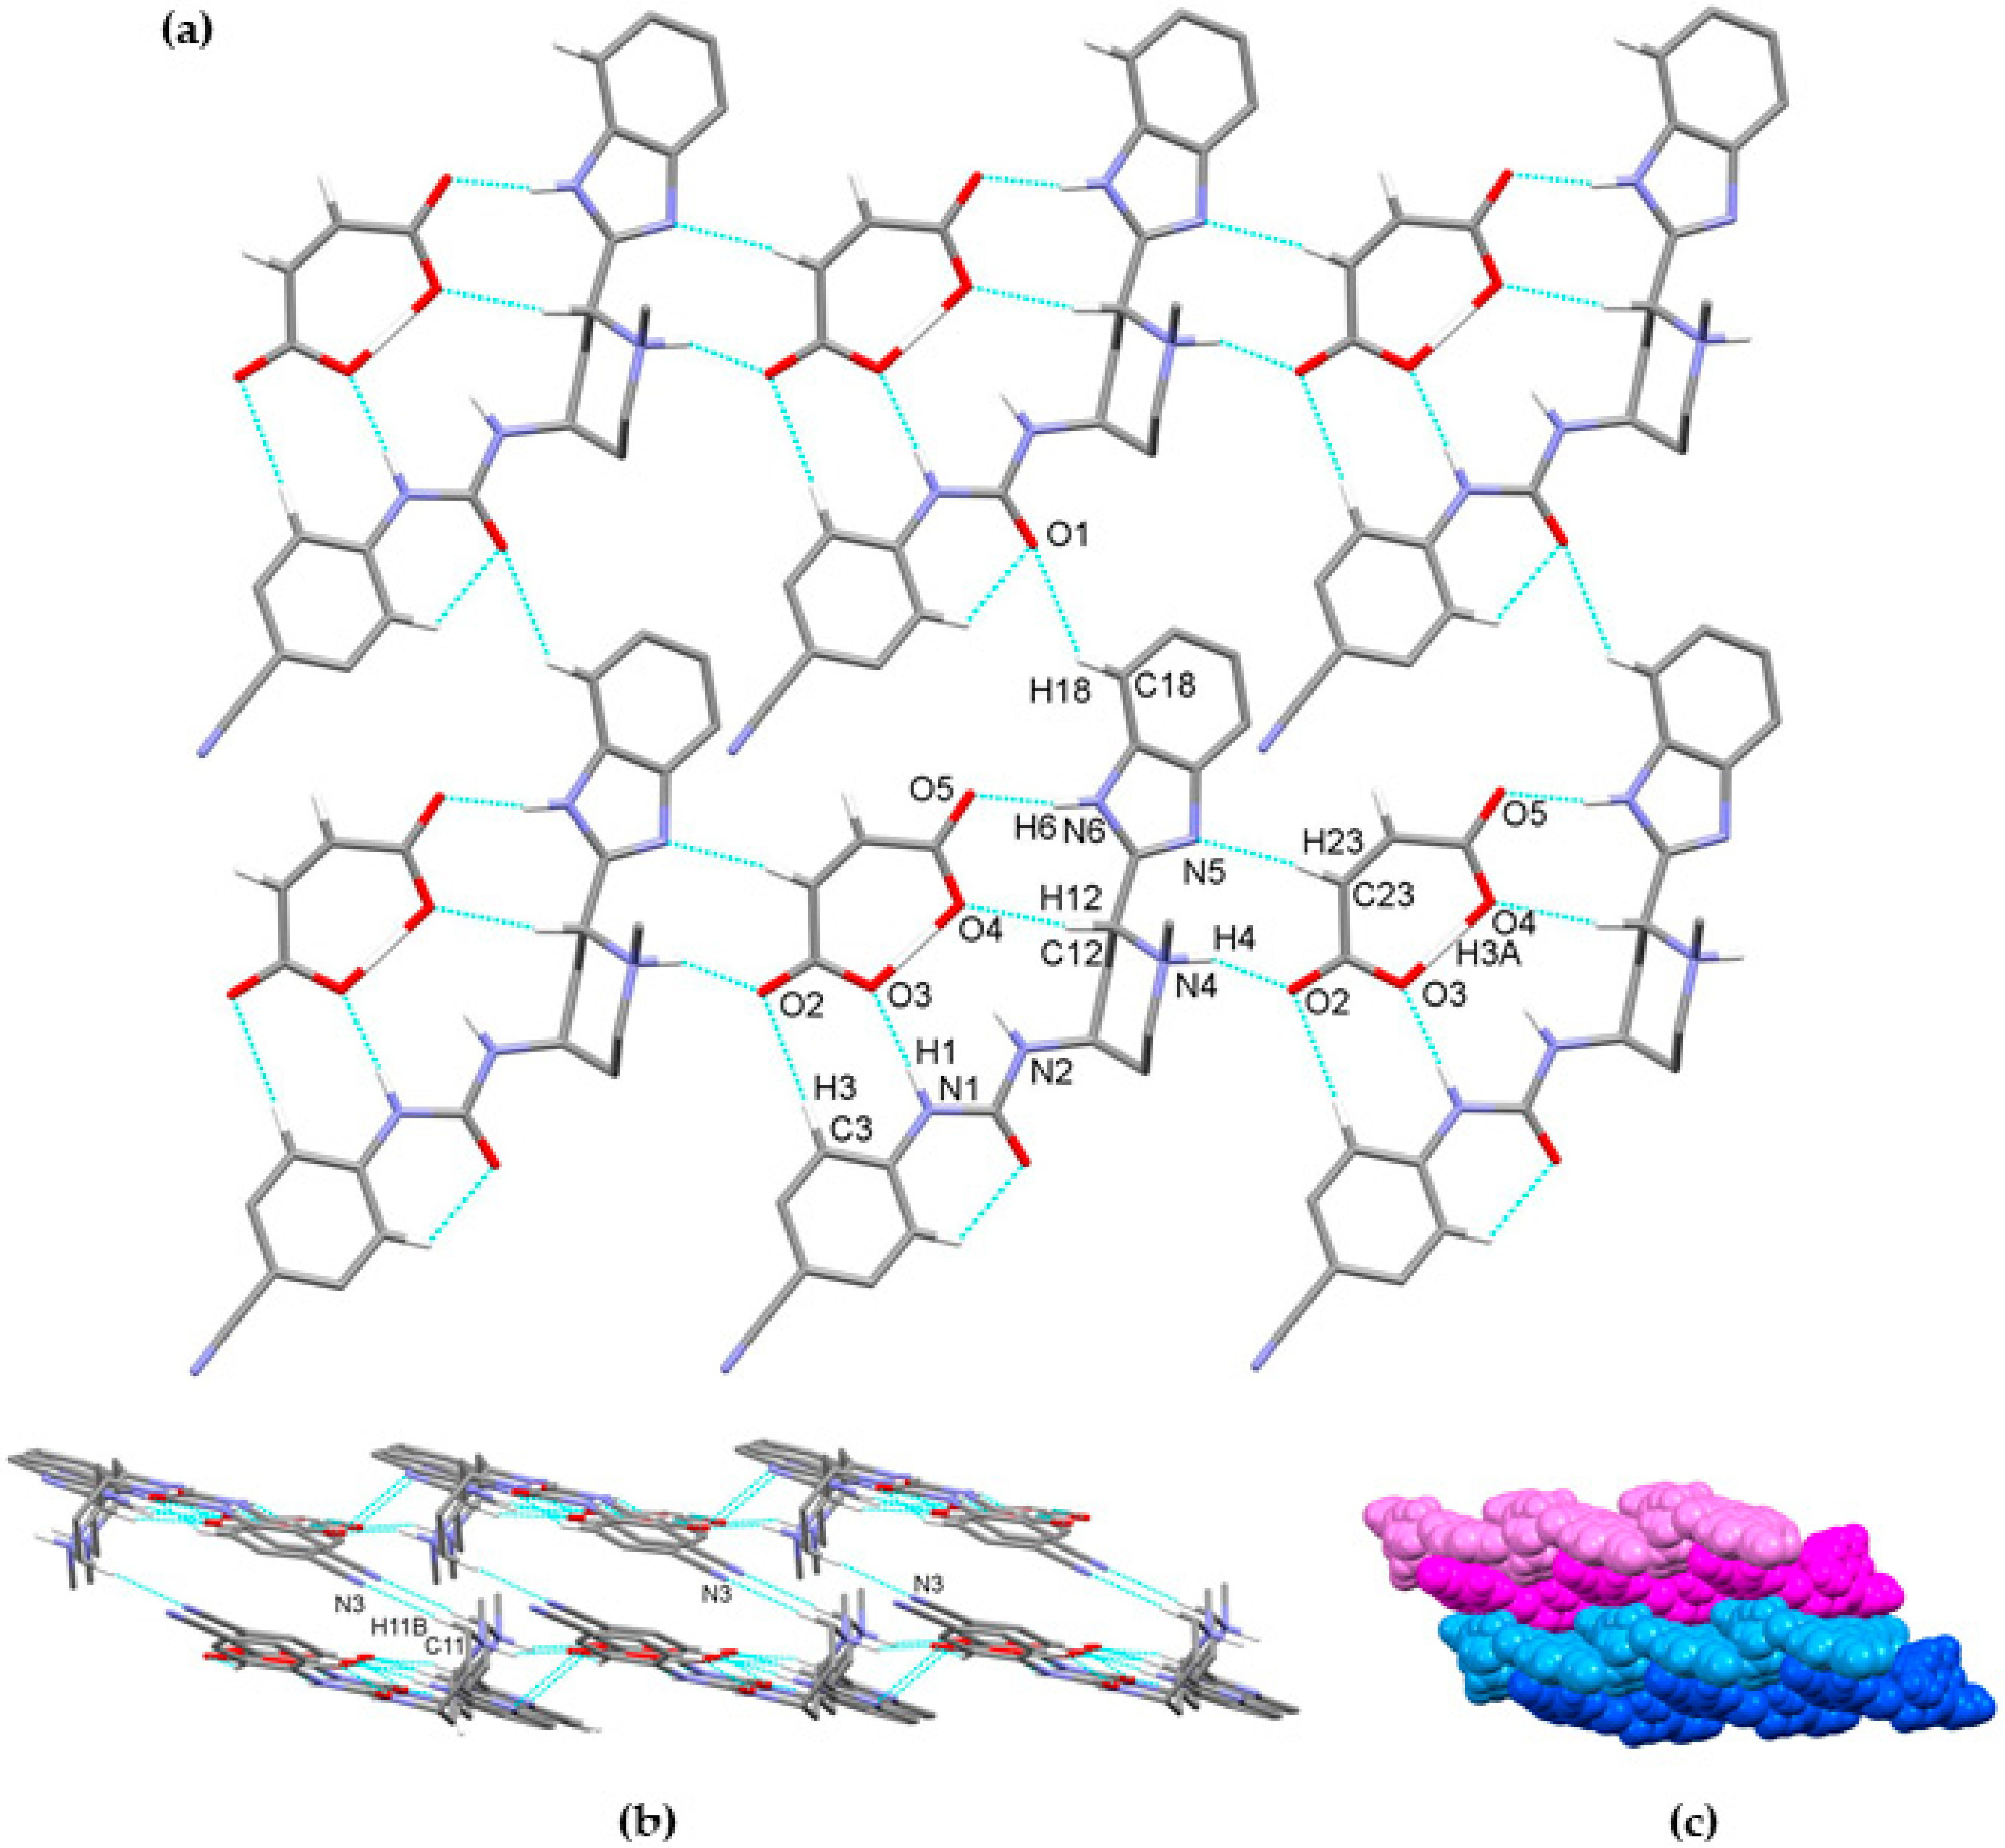
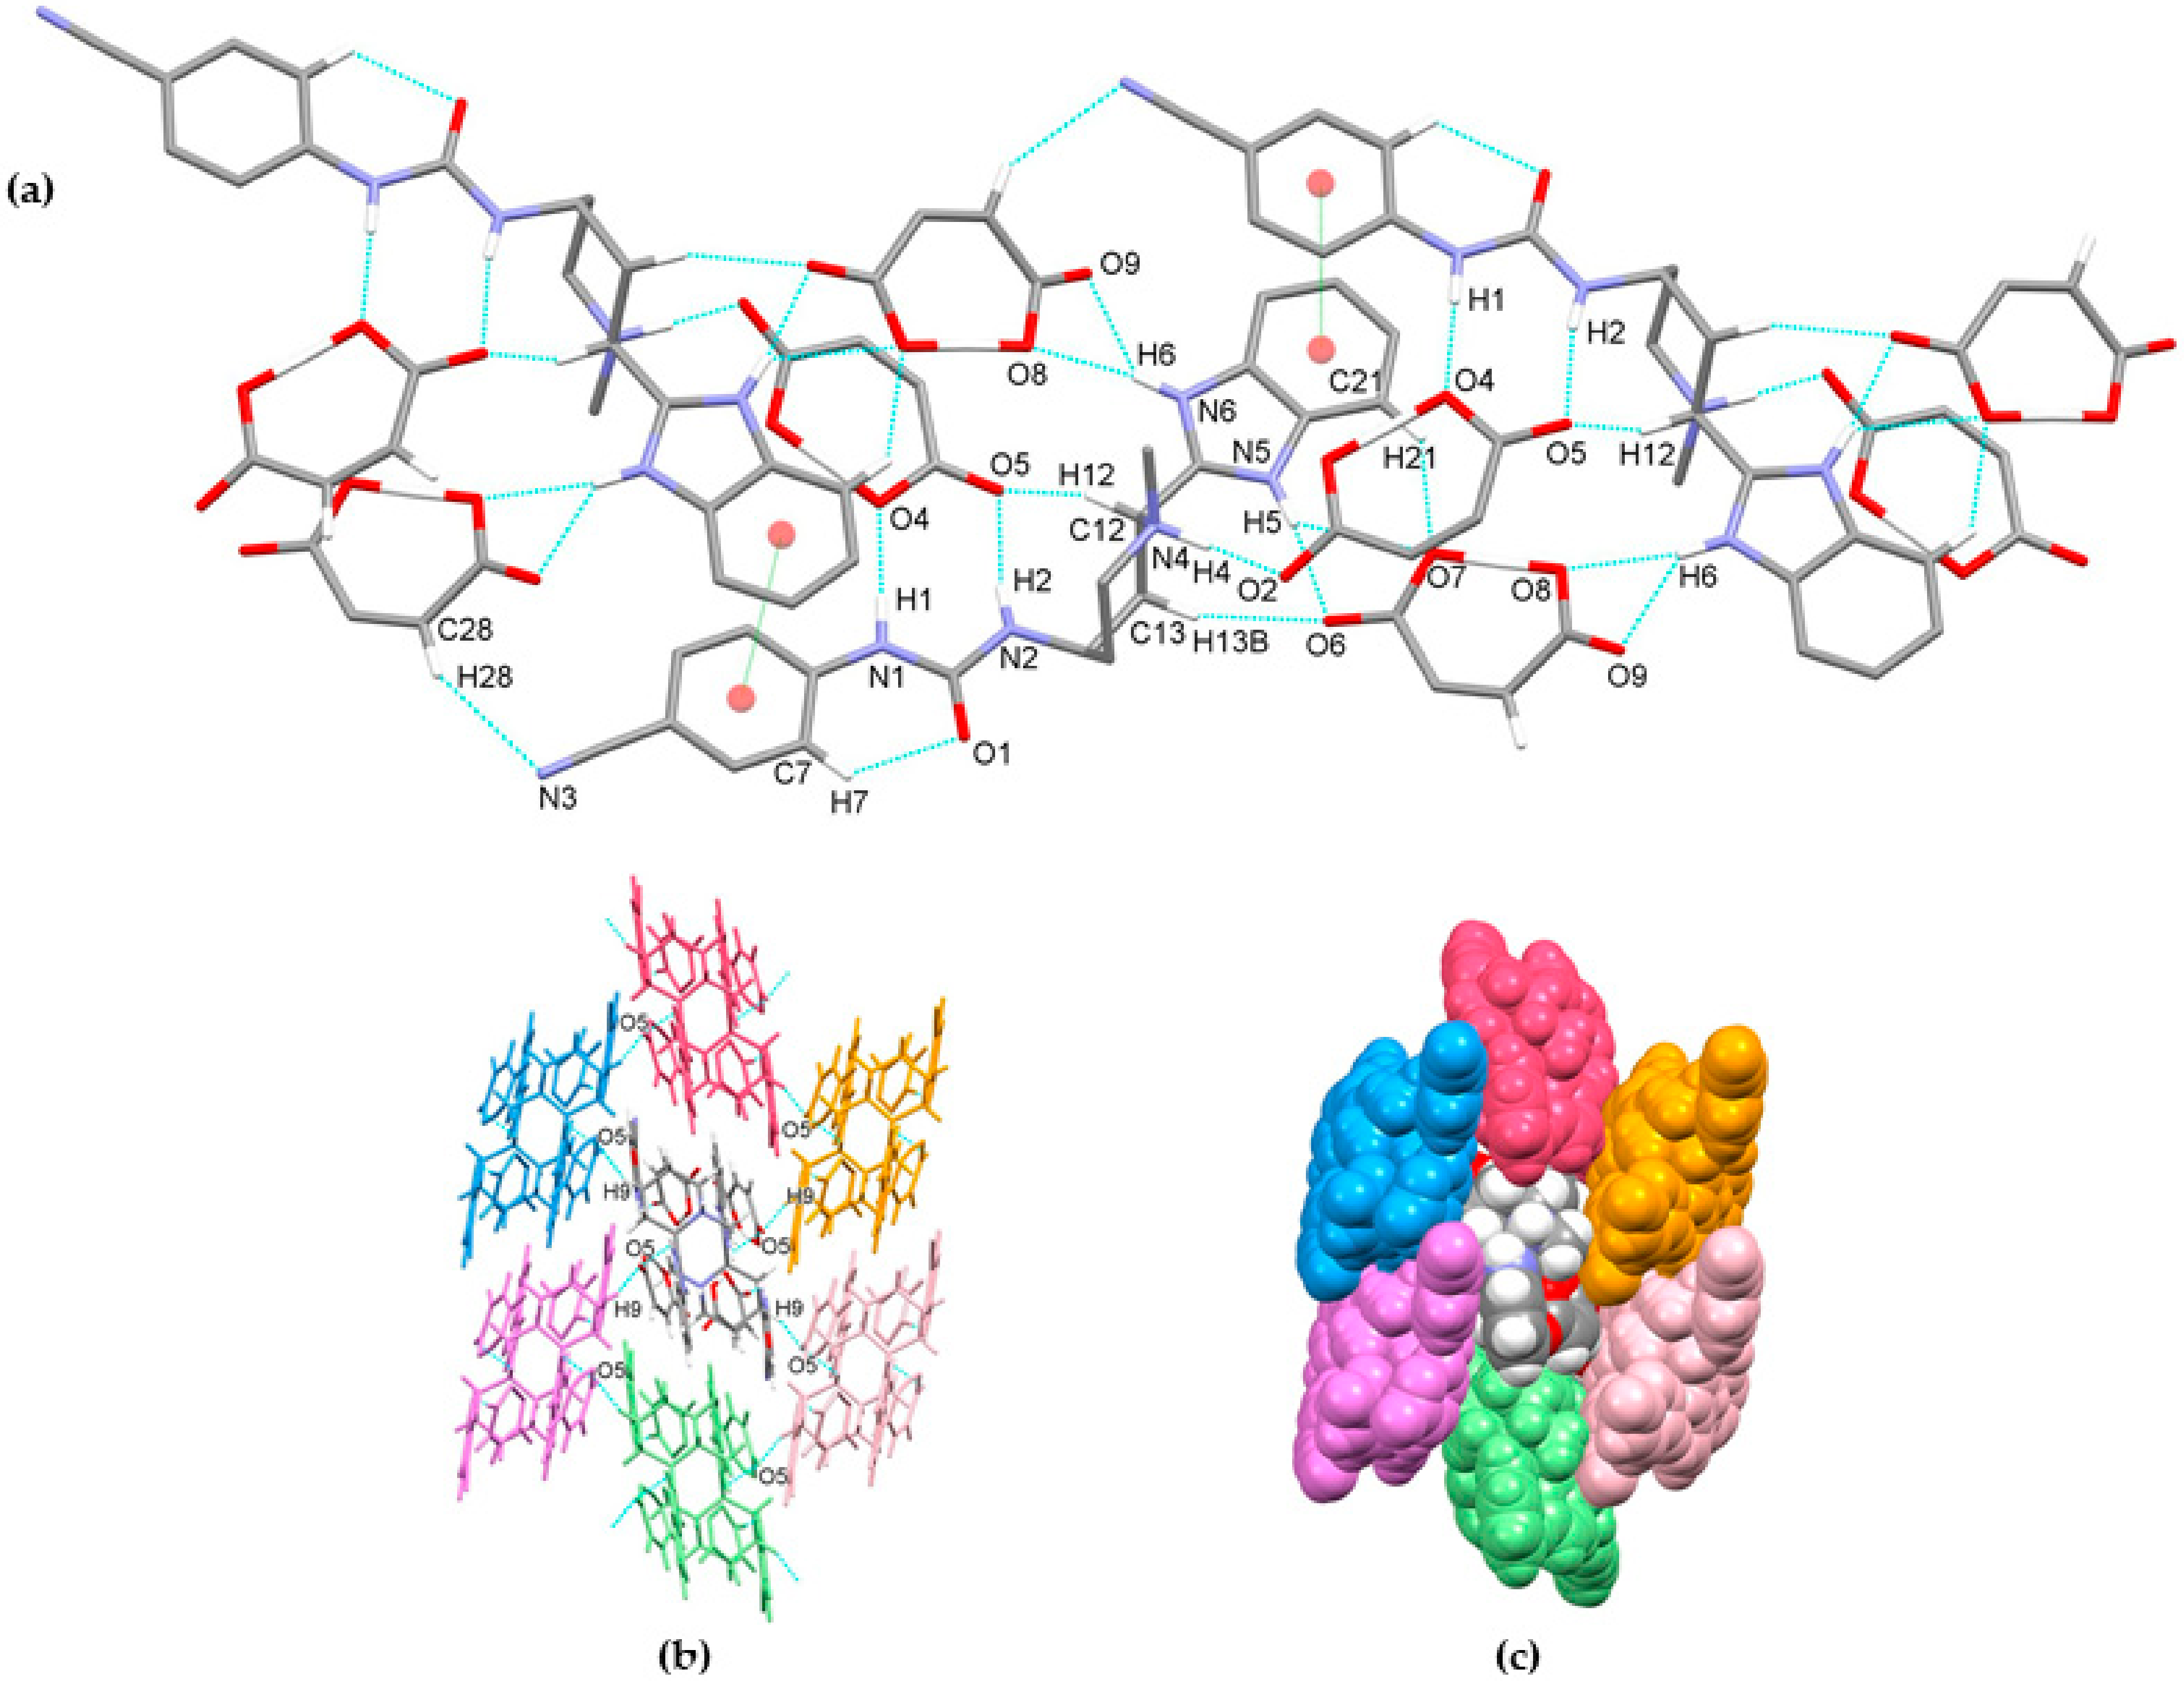
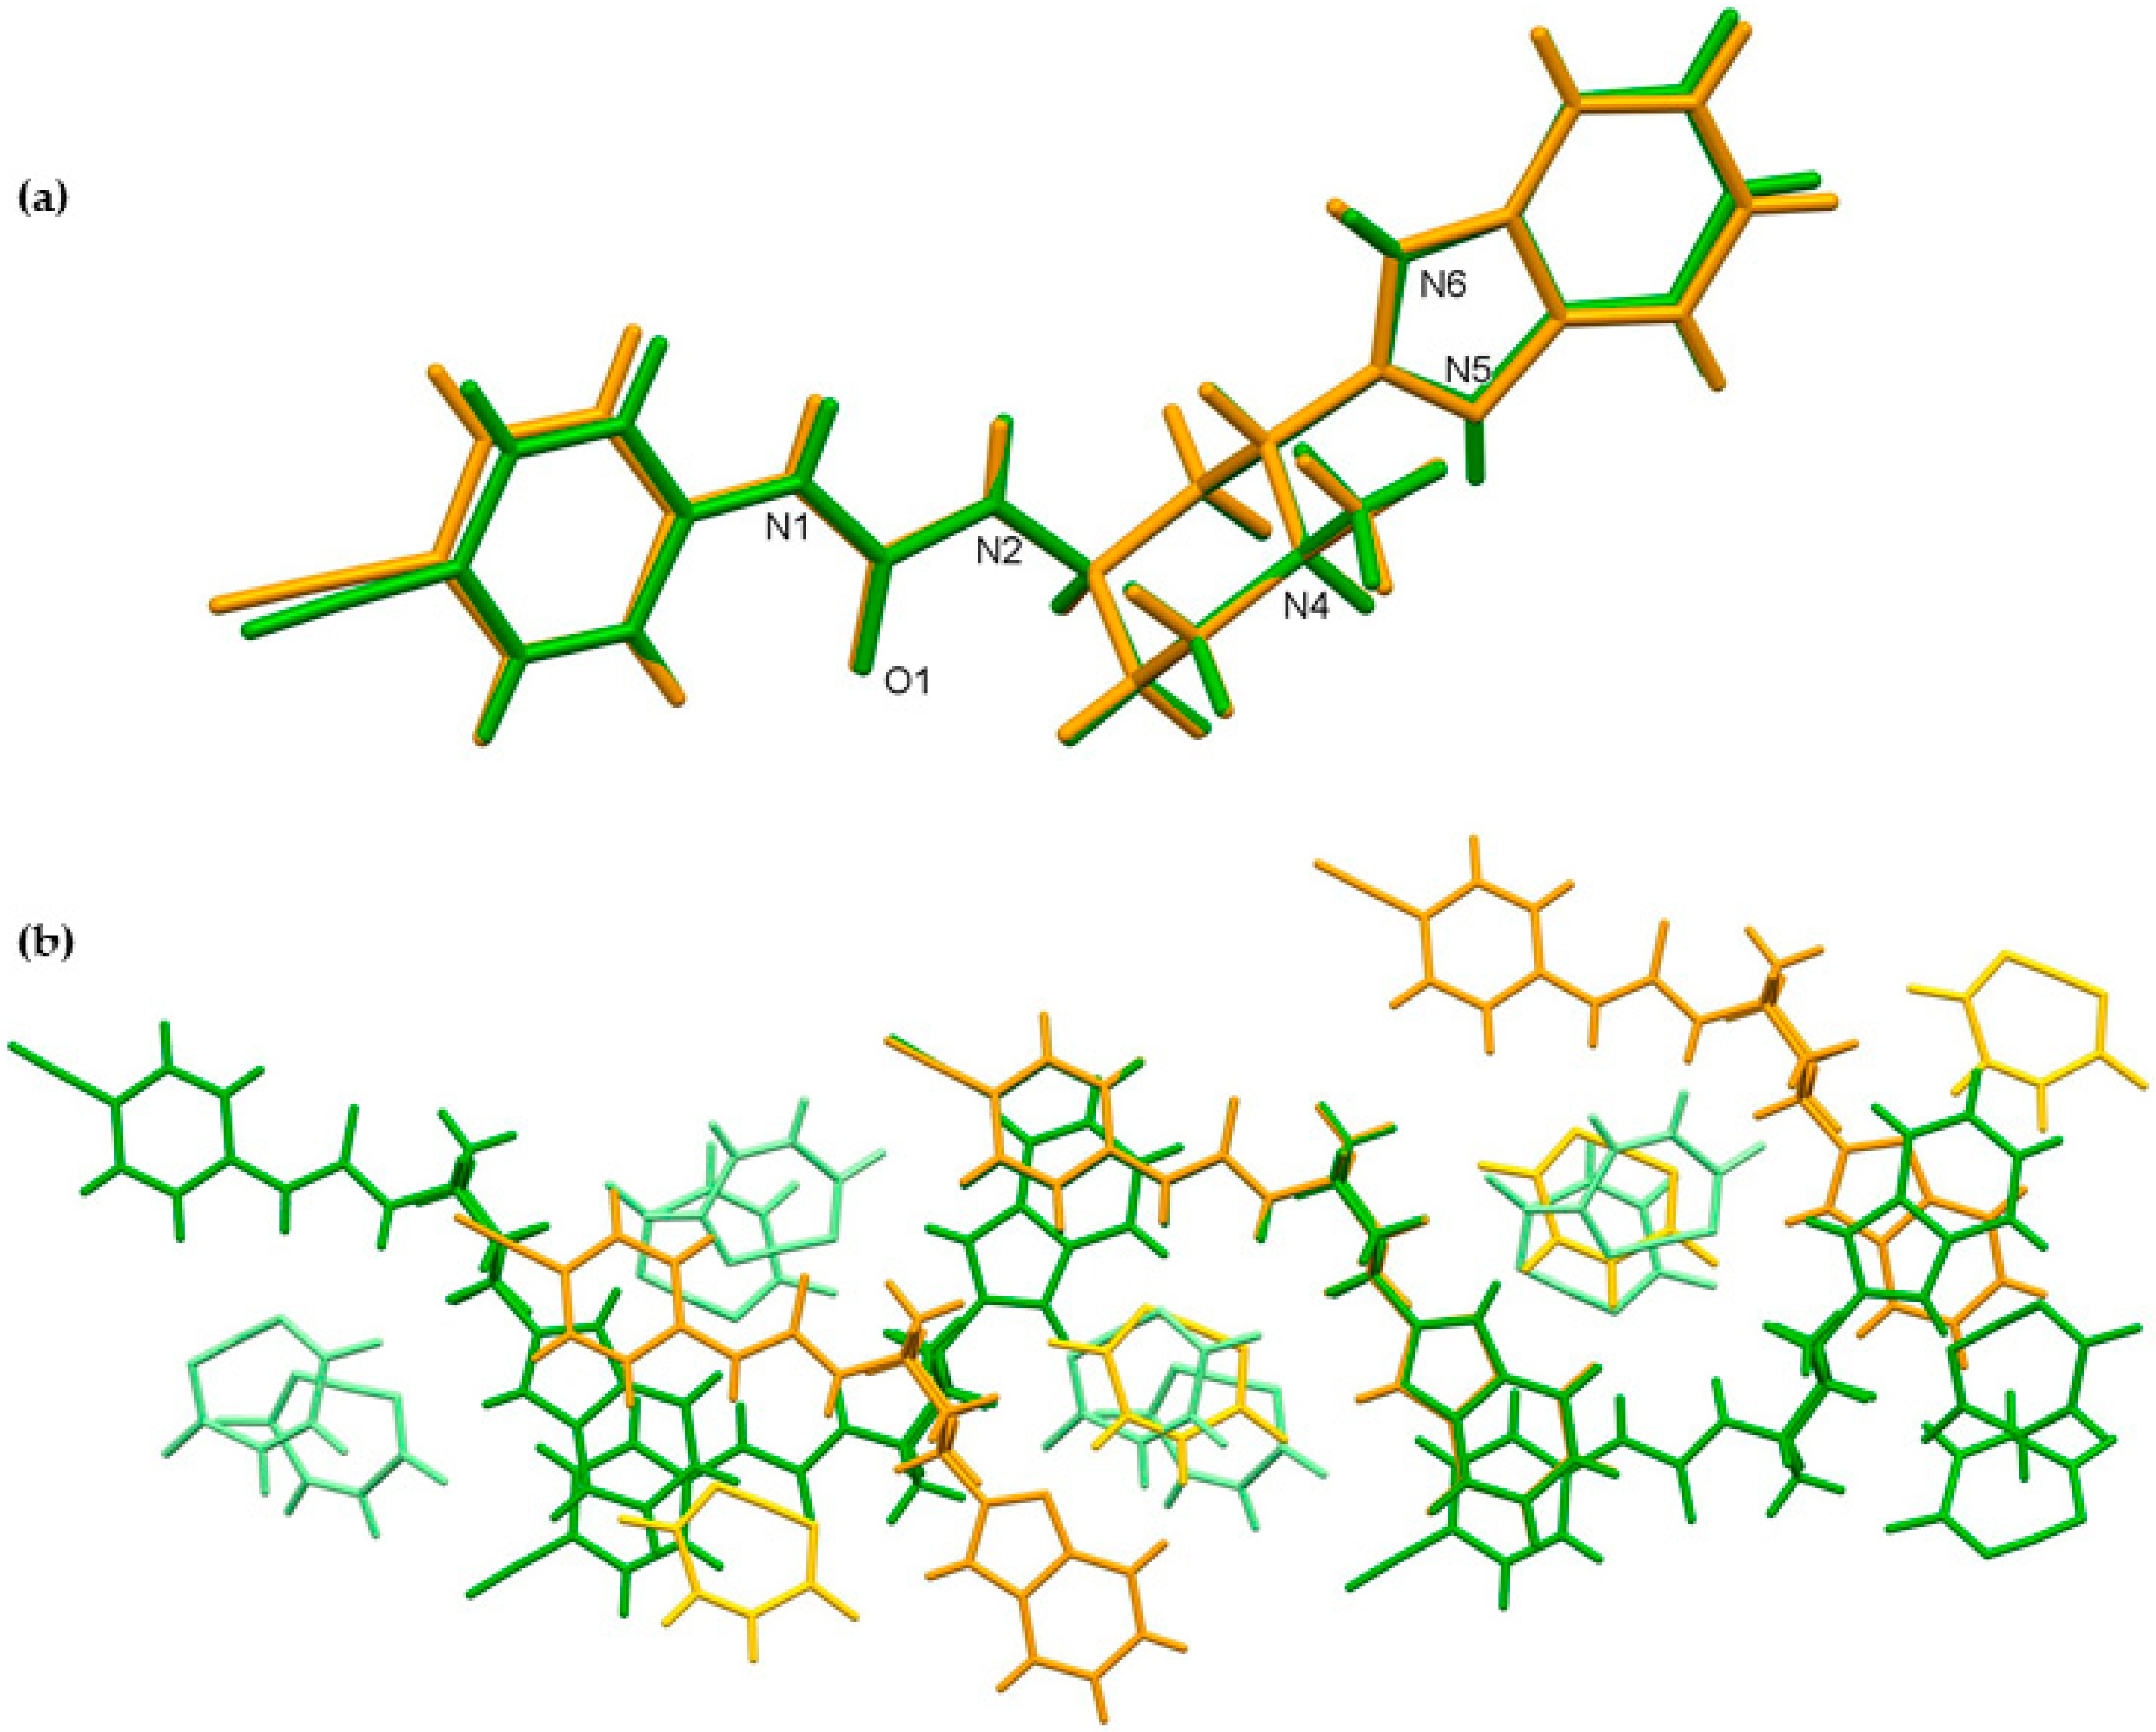
3.2.6. X-ray Single-Crystal Determination
3.2.7. Stability Testing
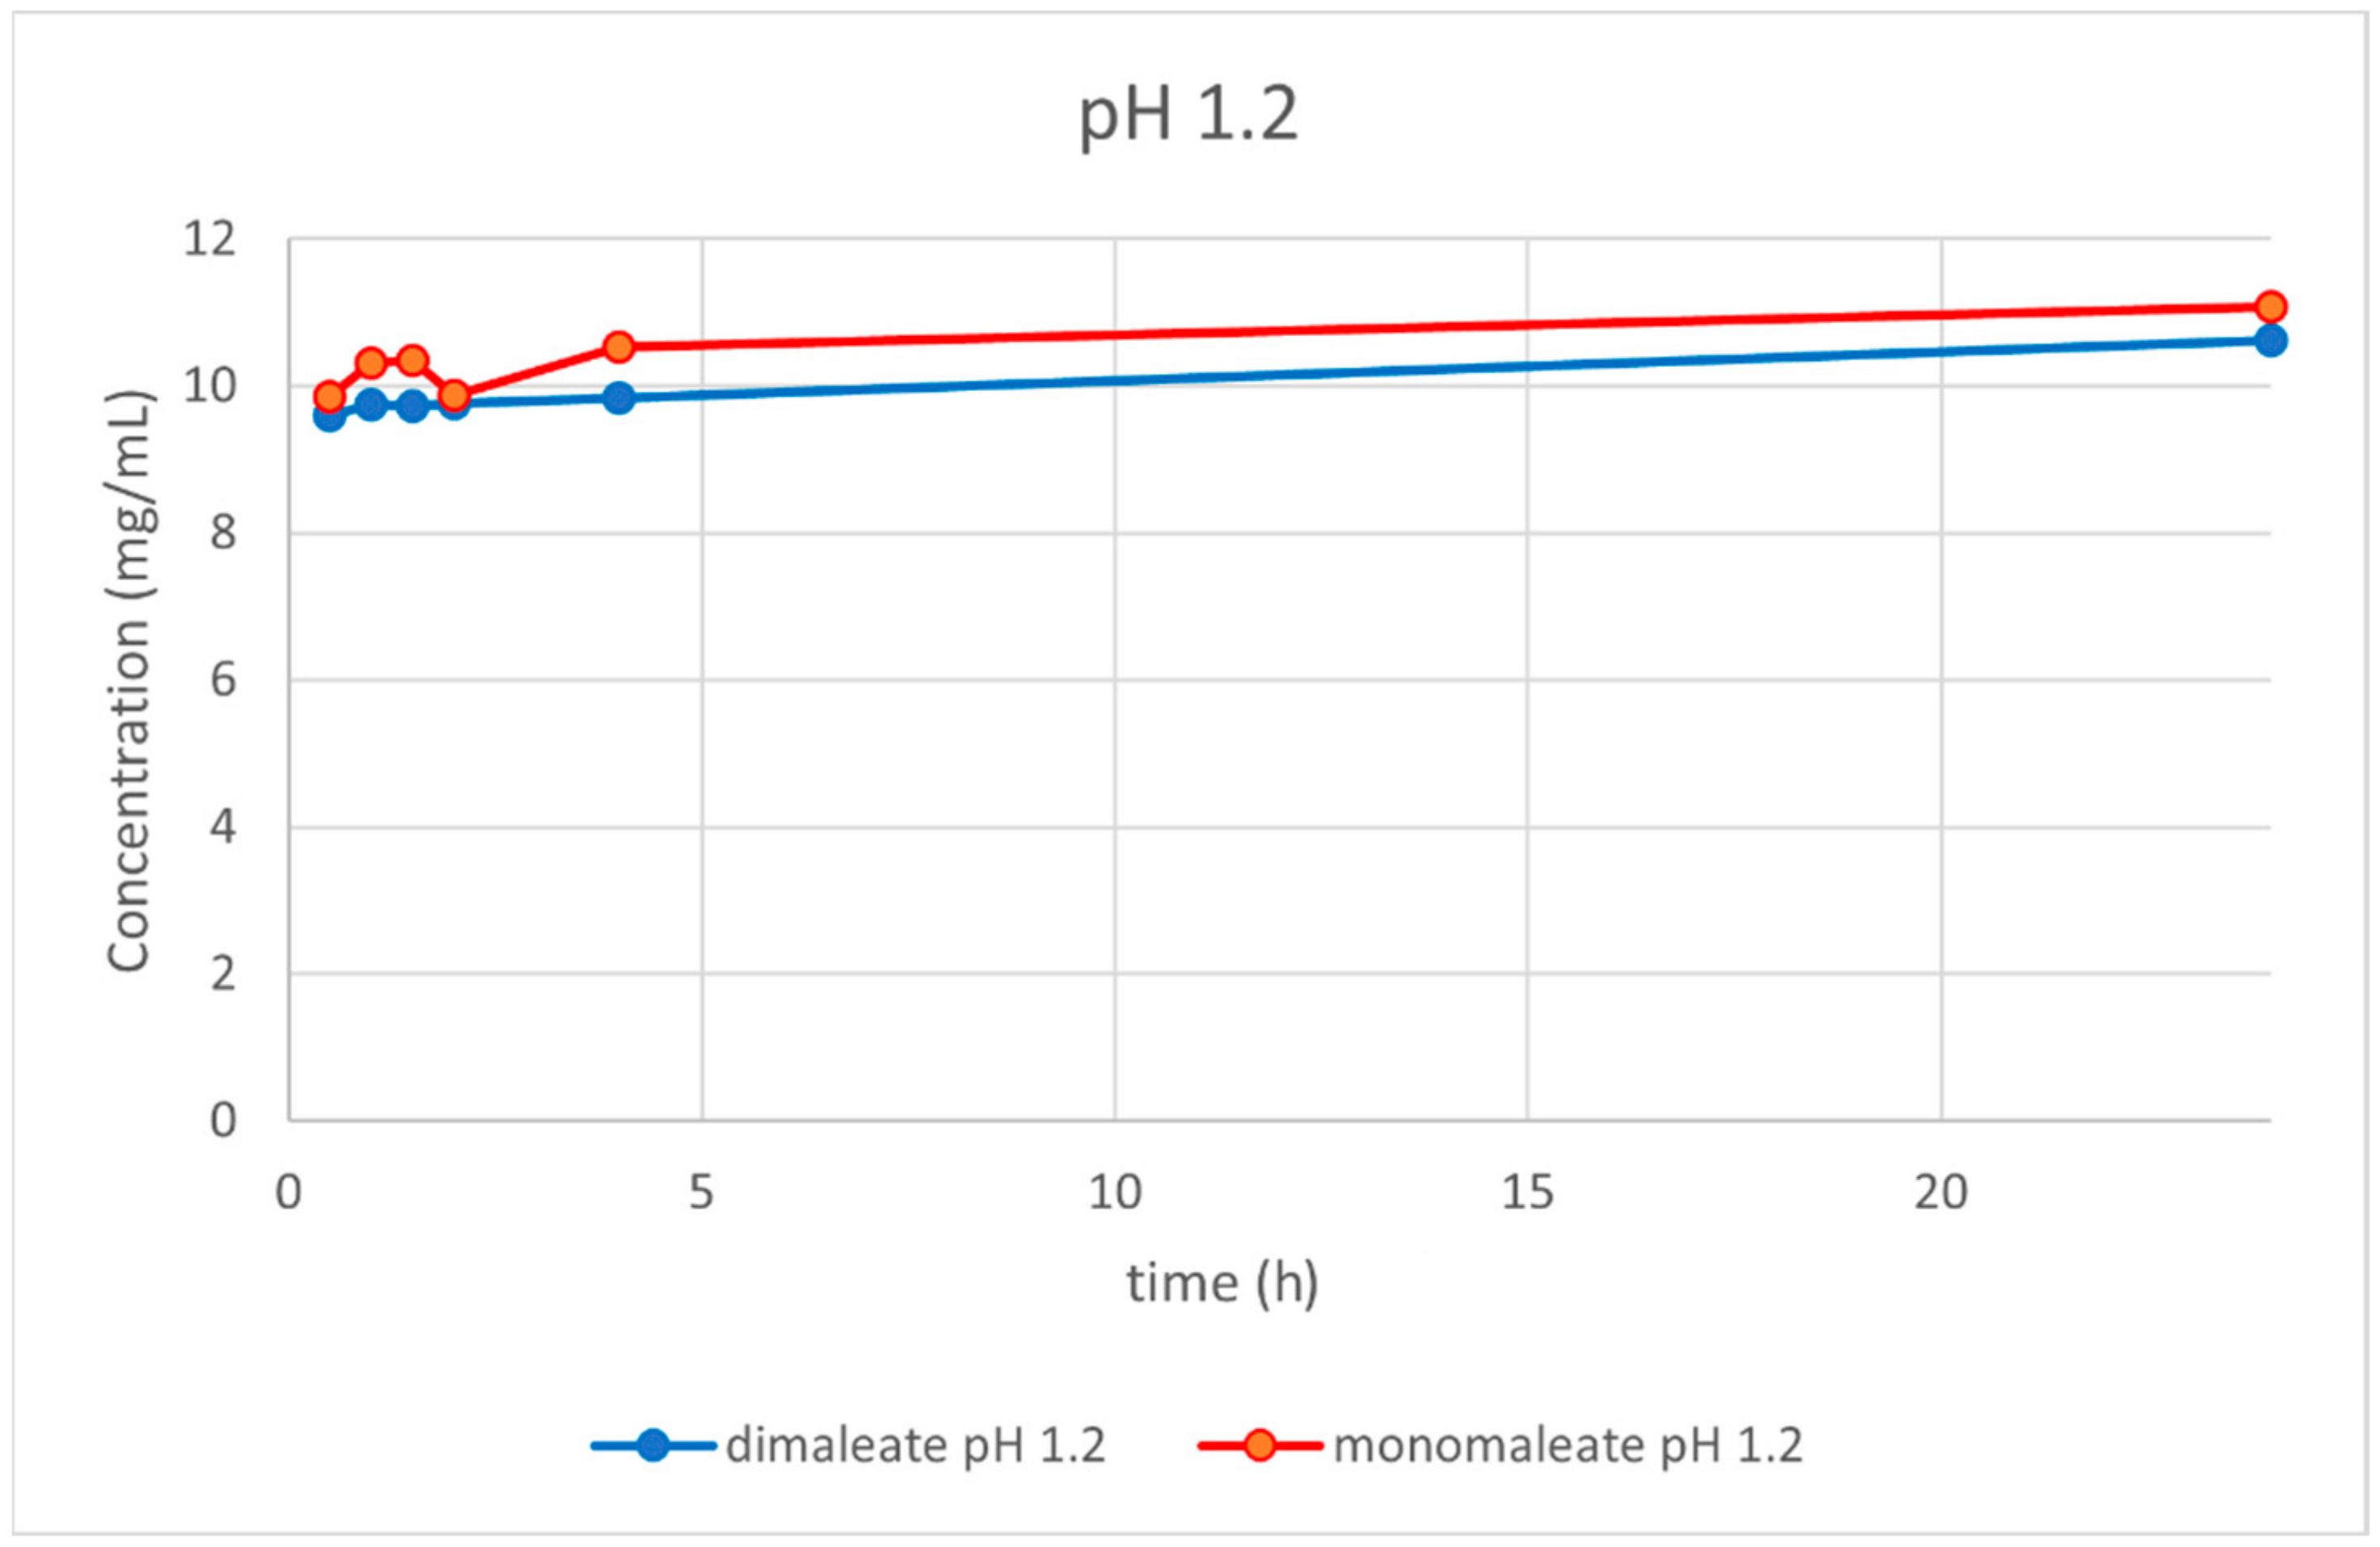
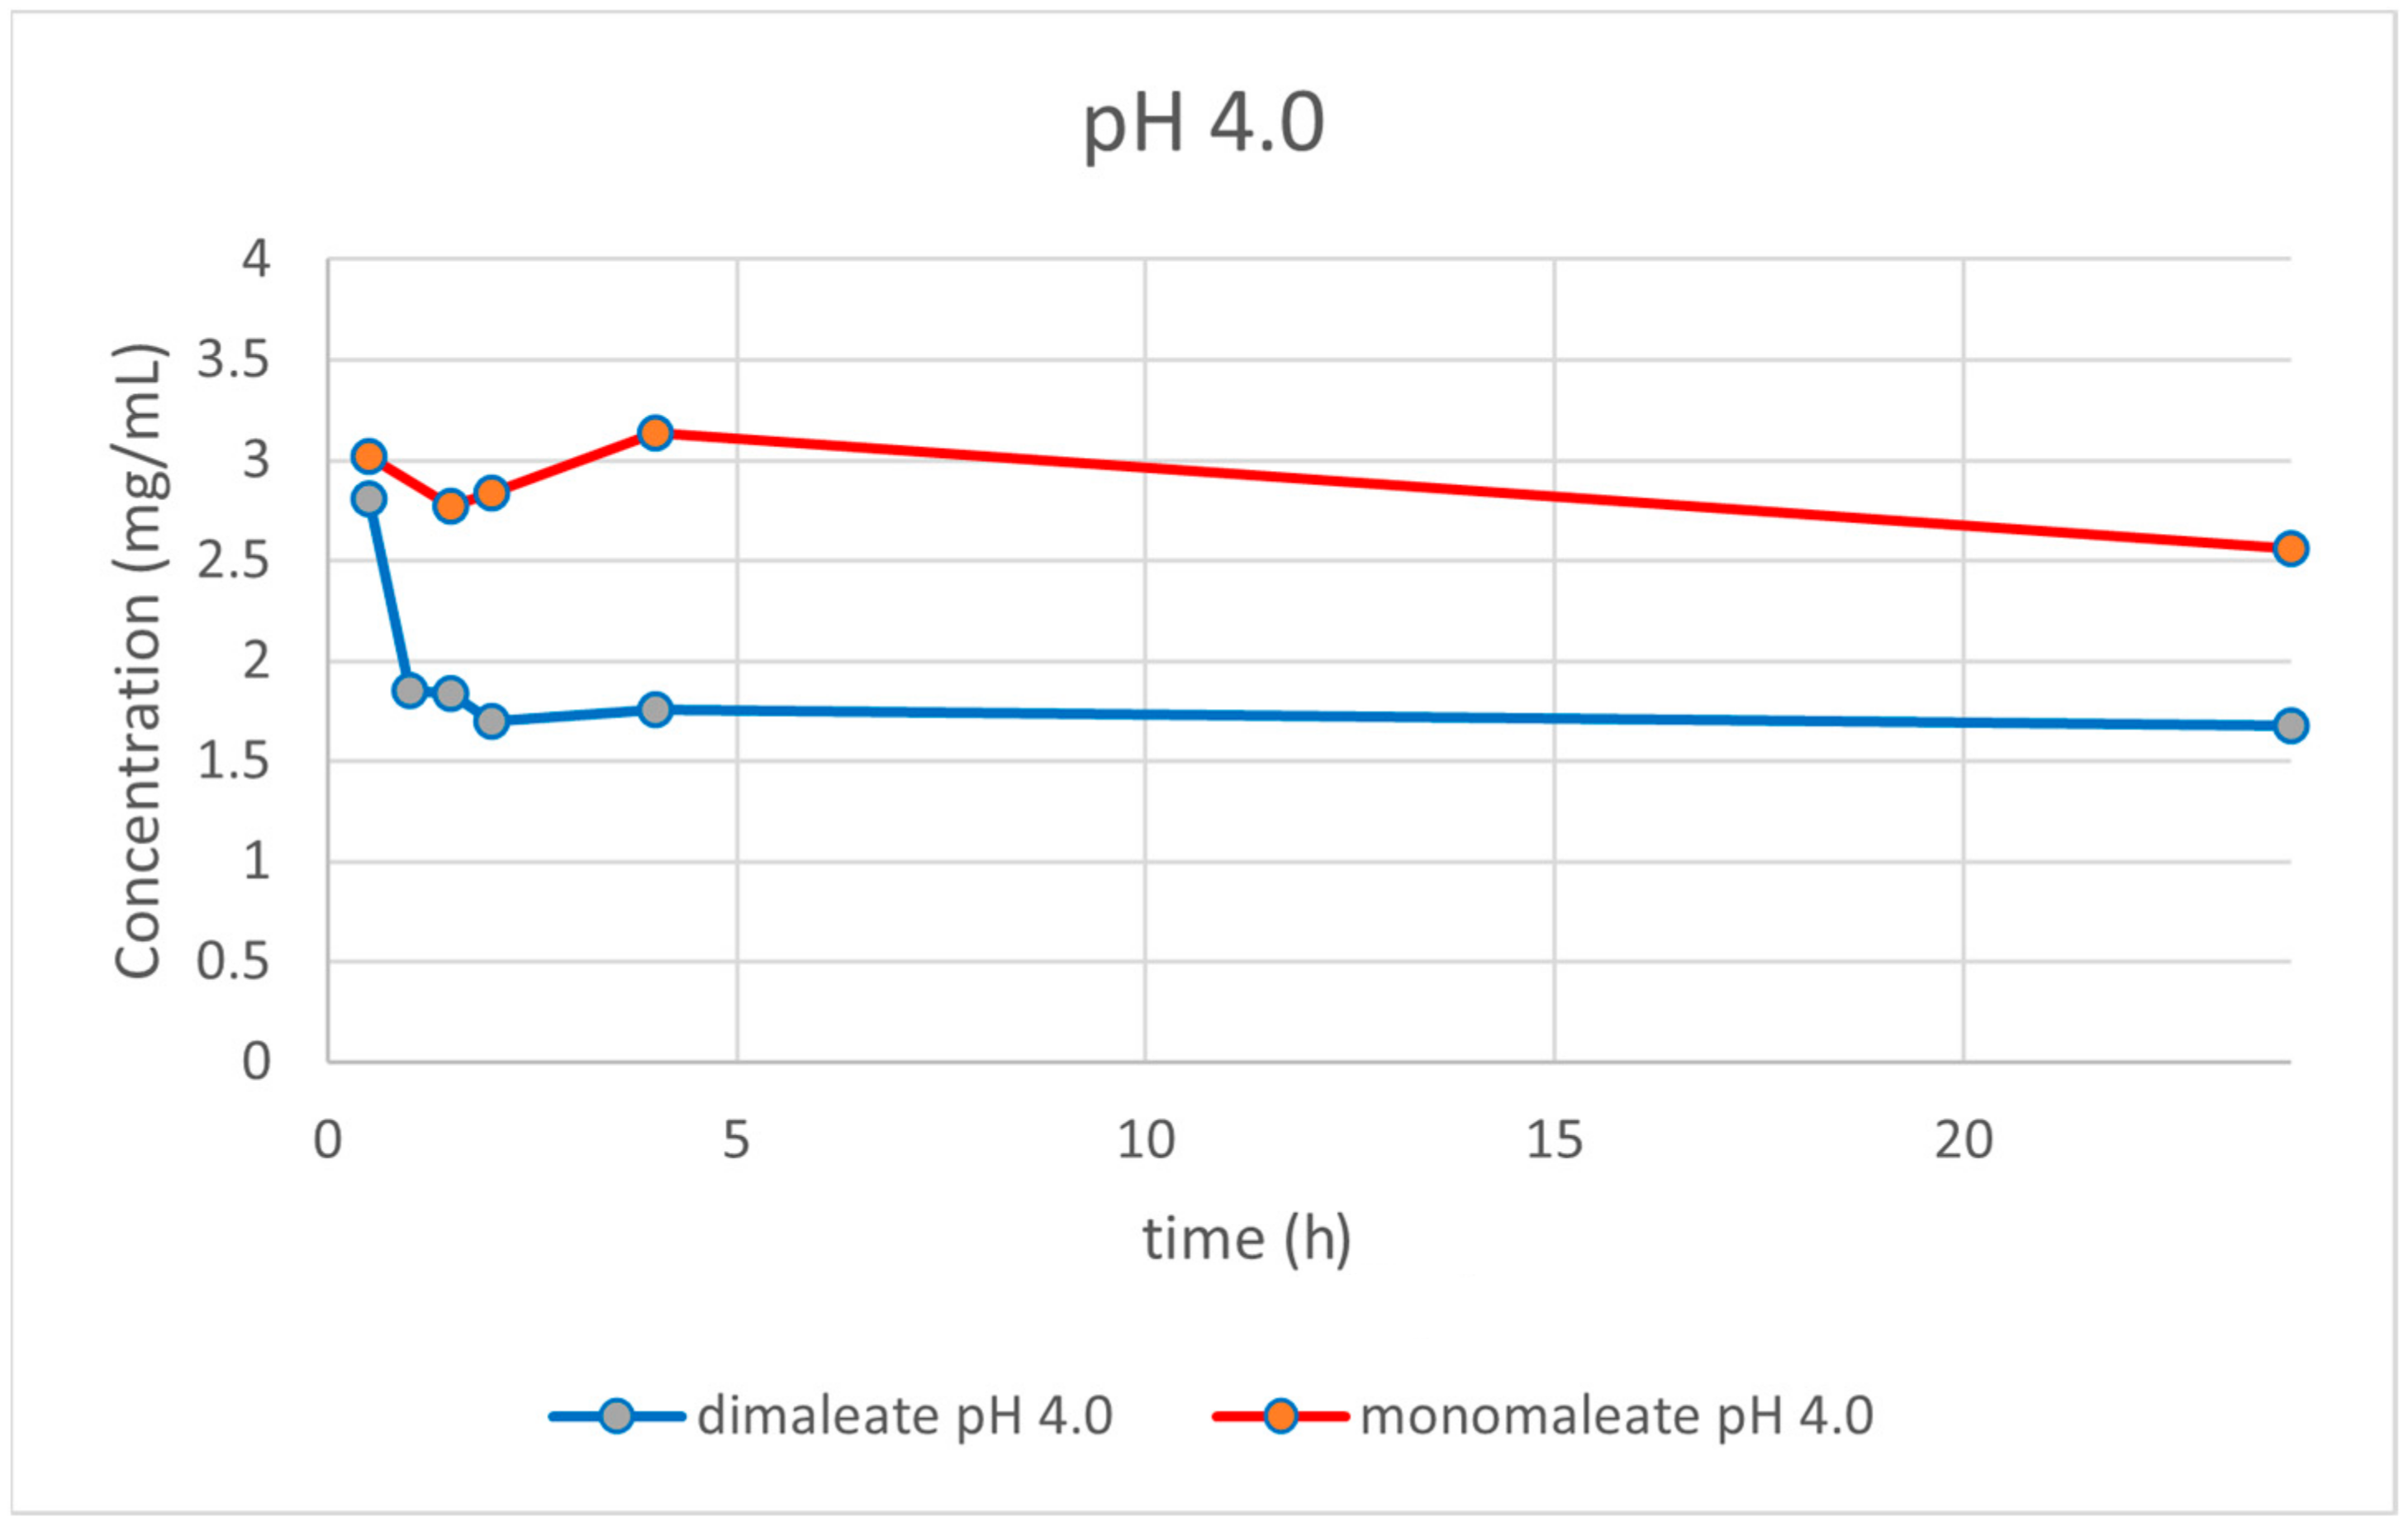
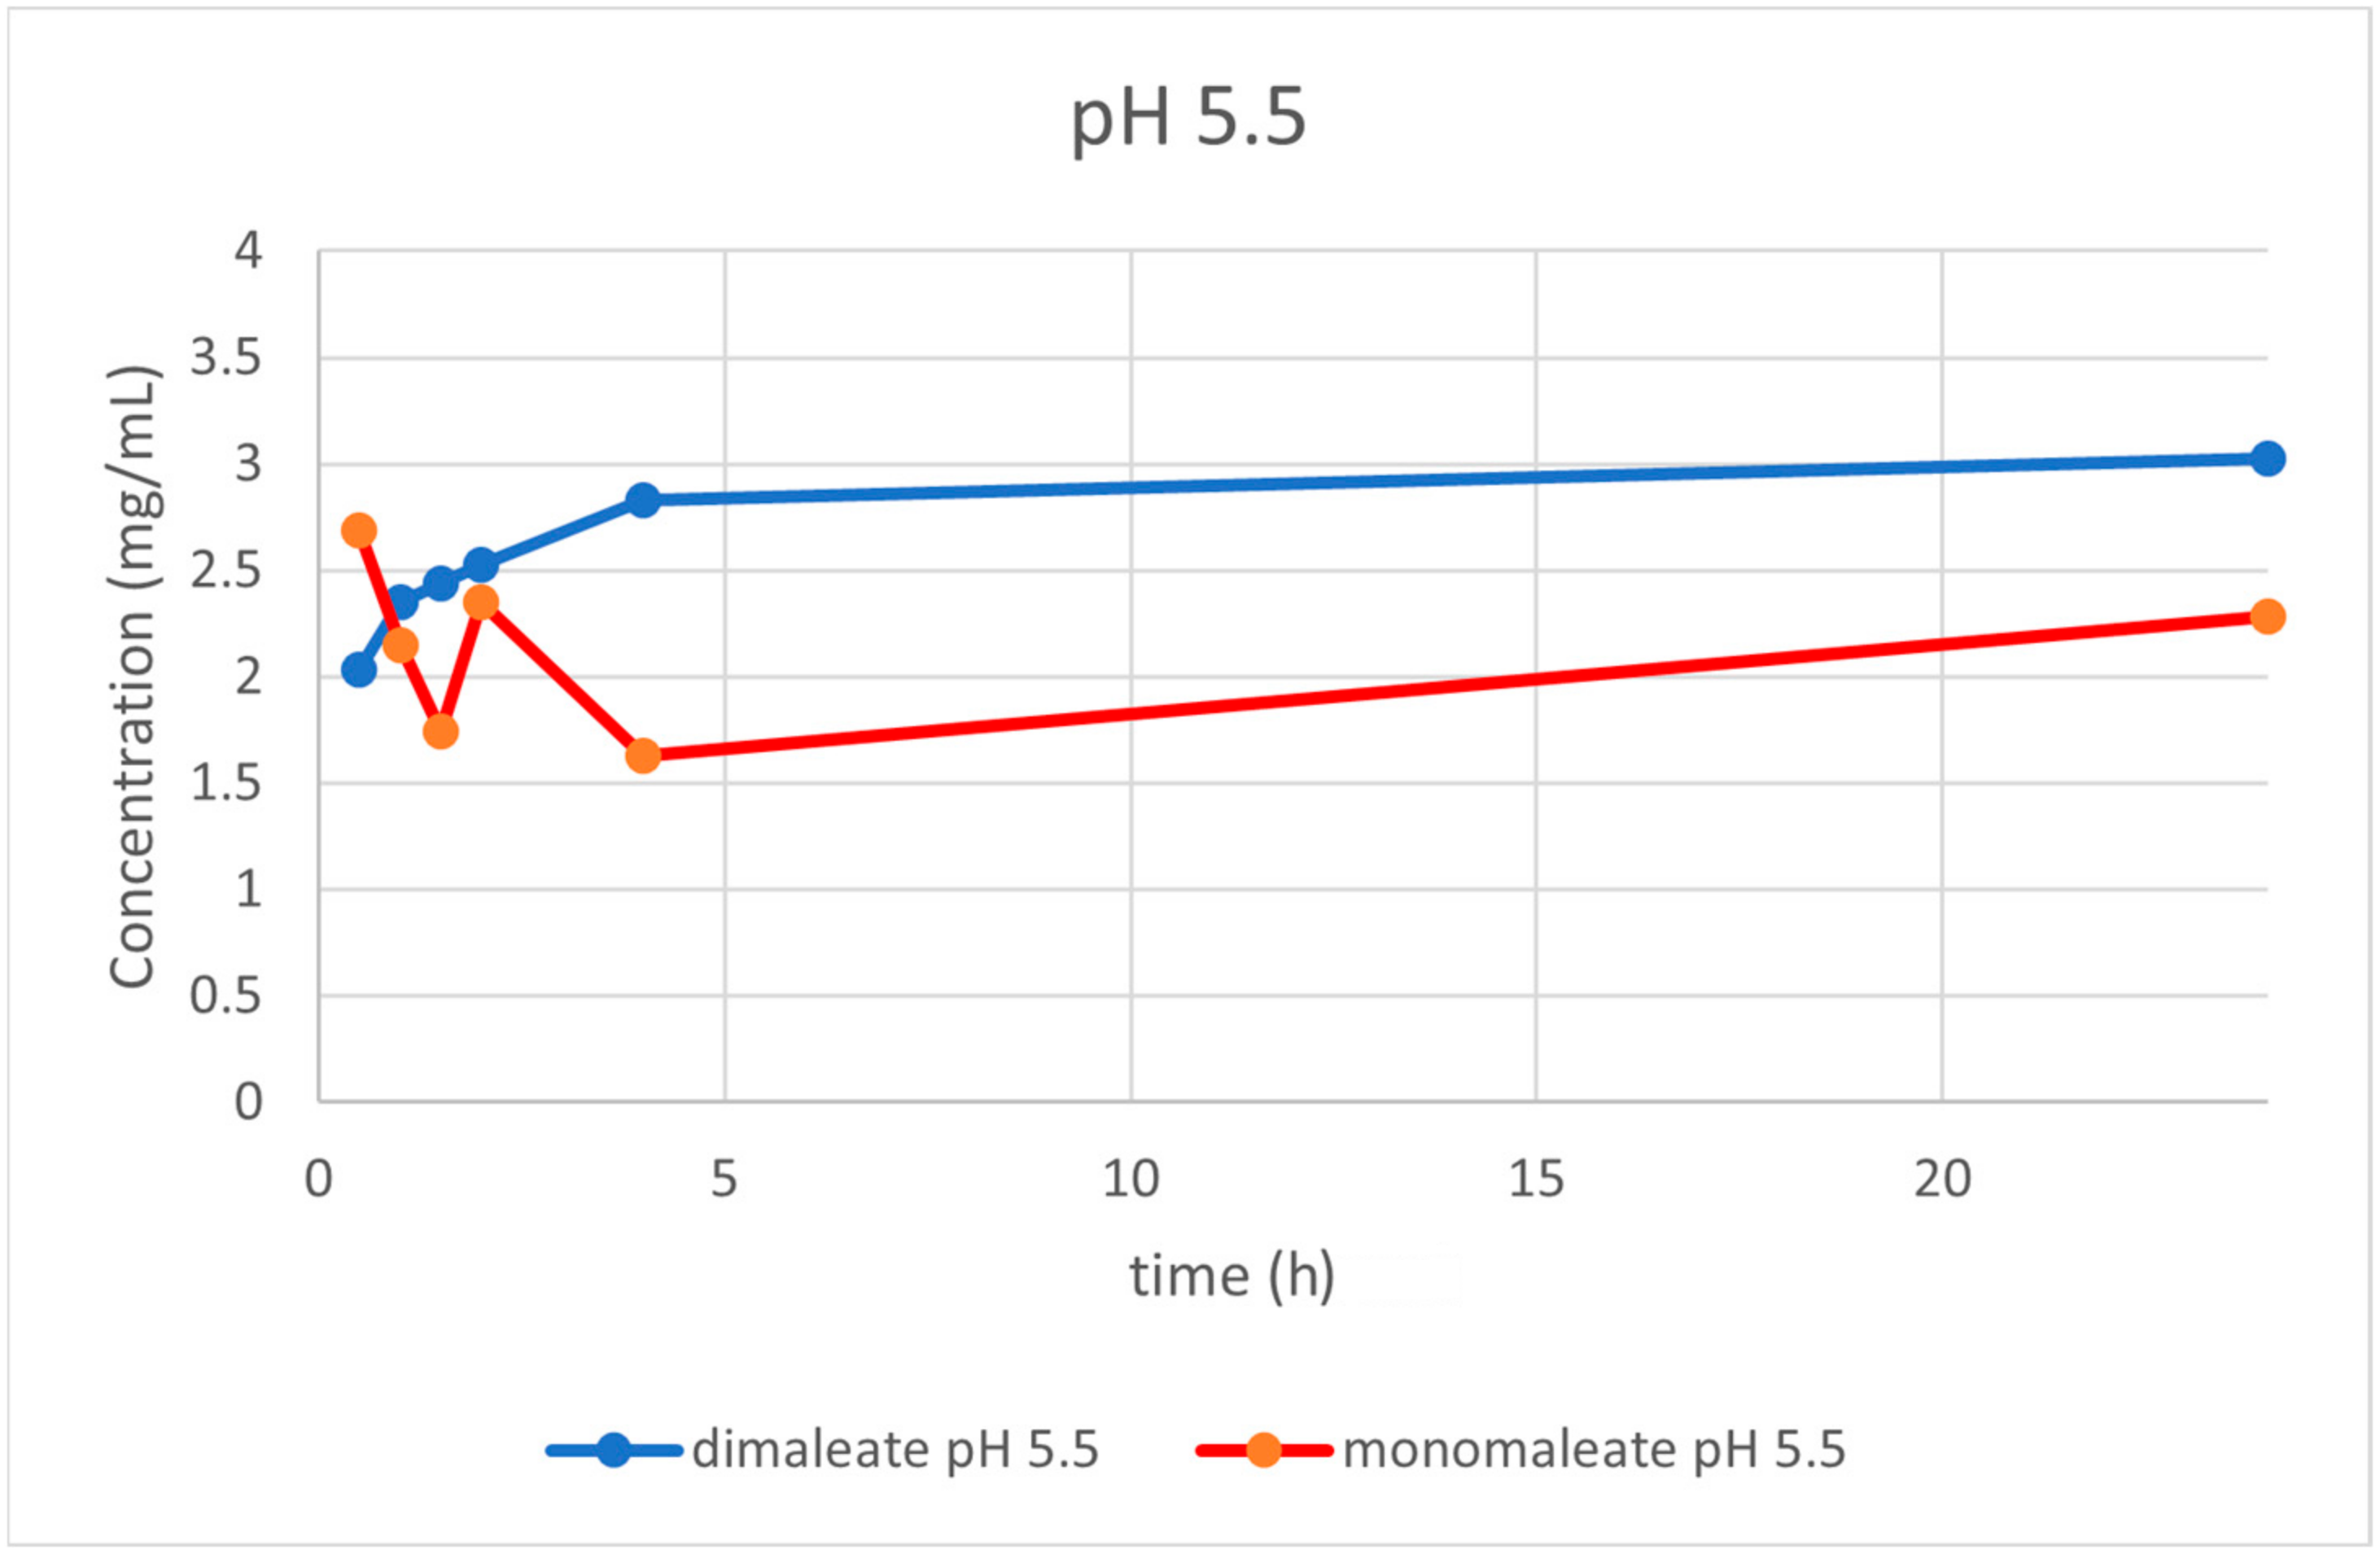
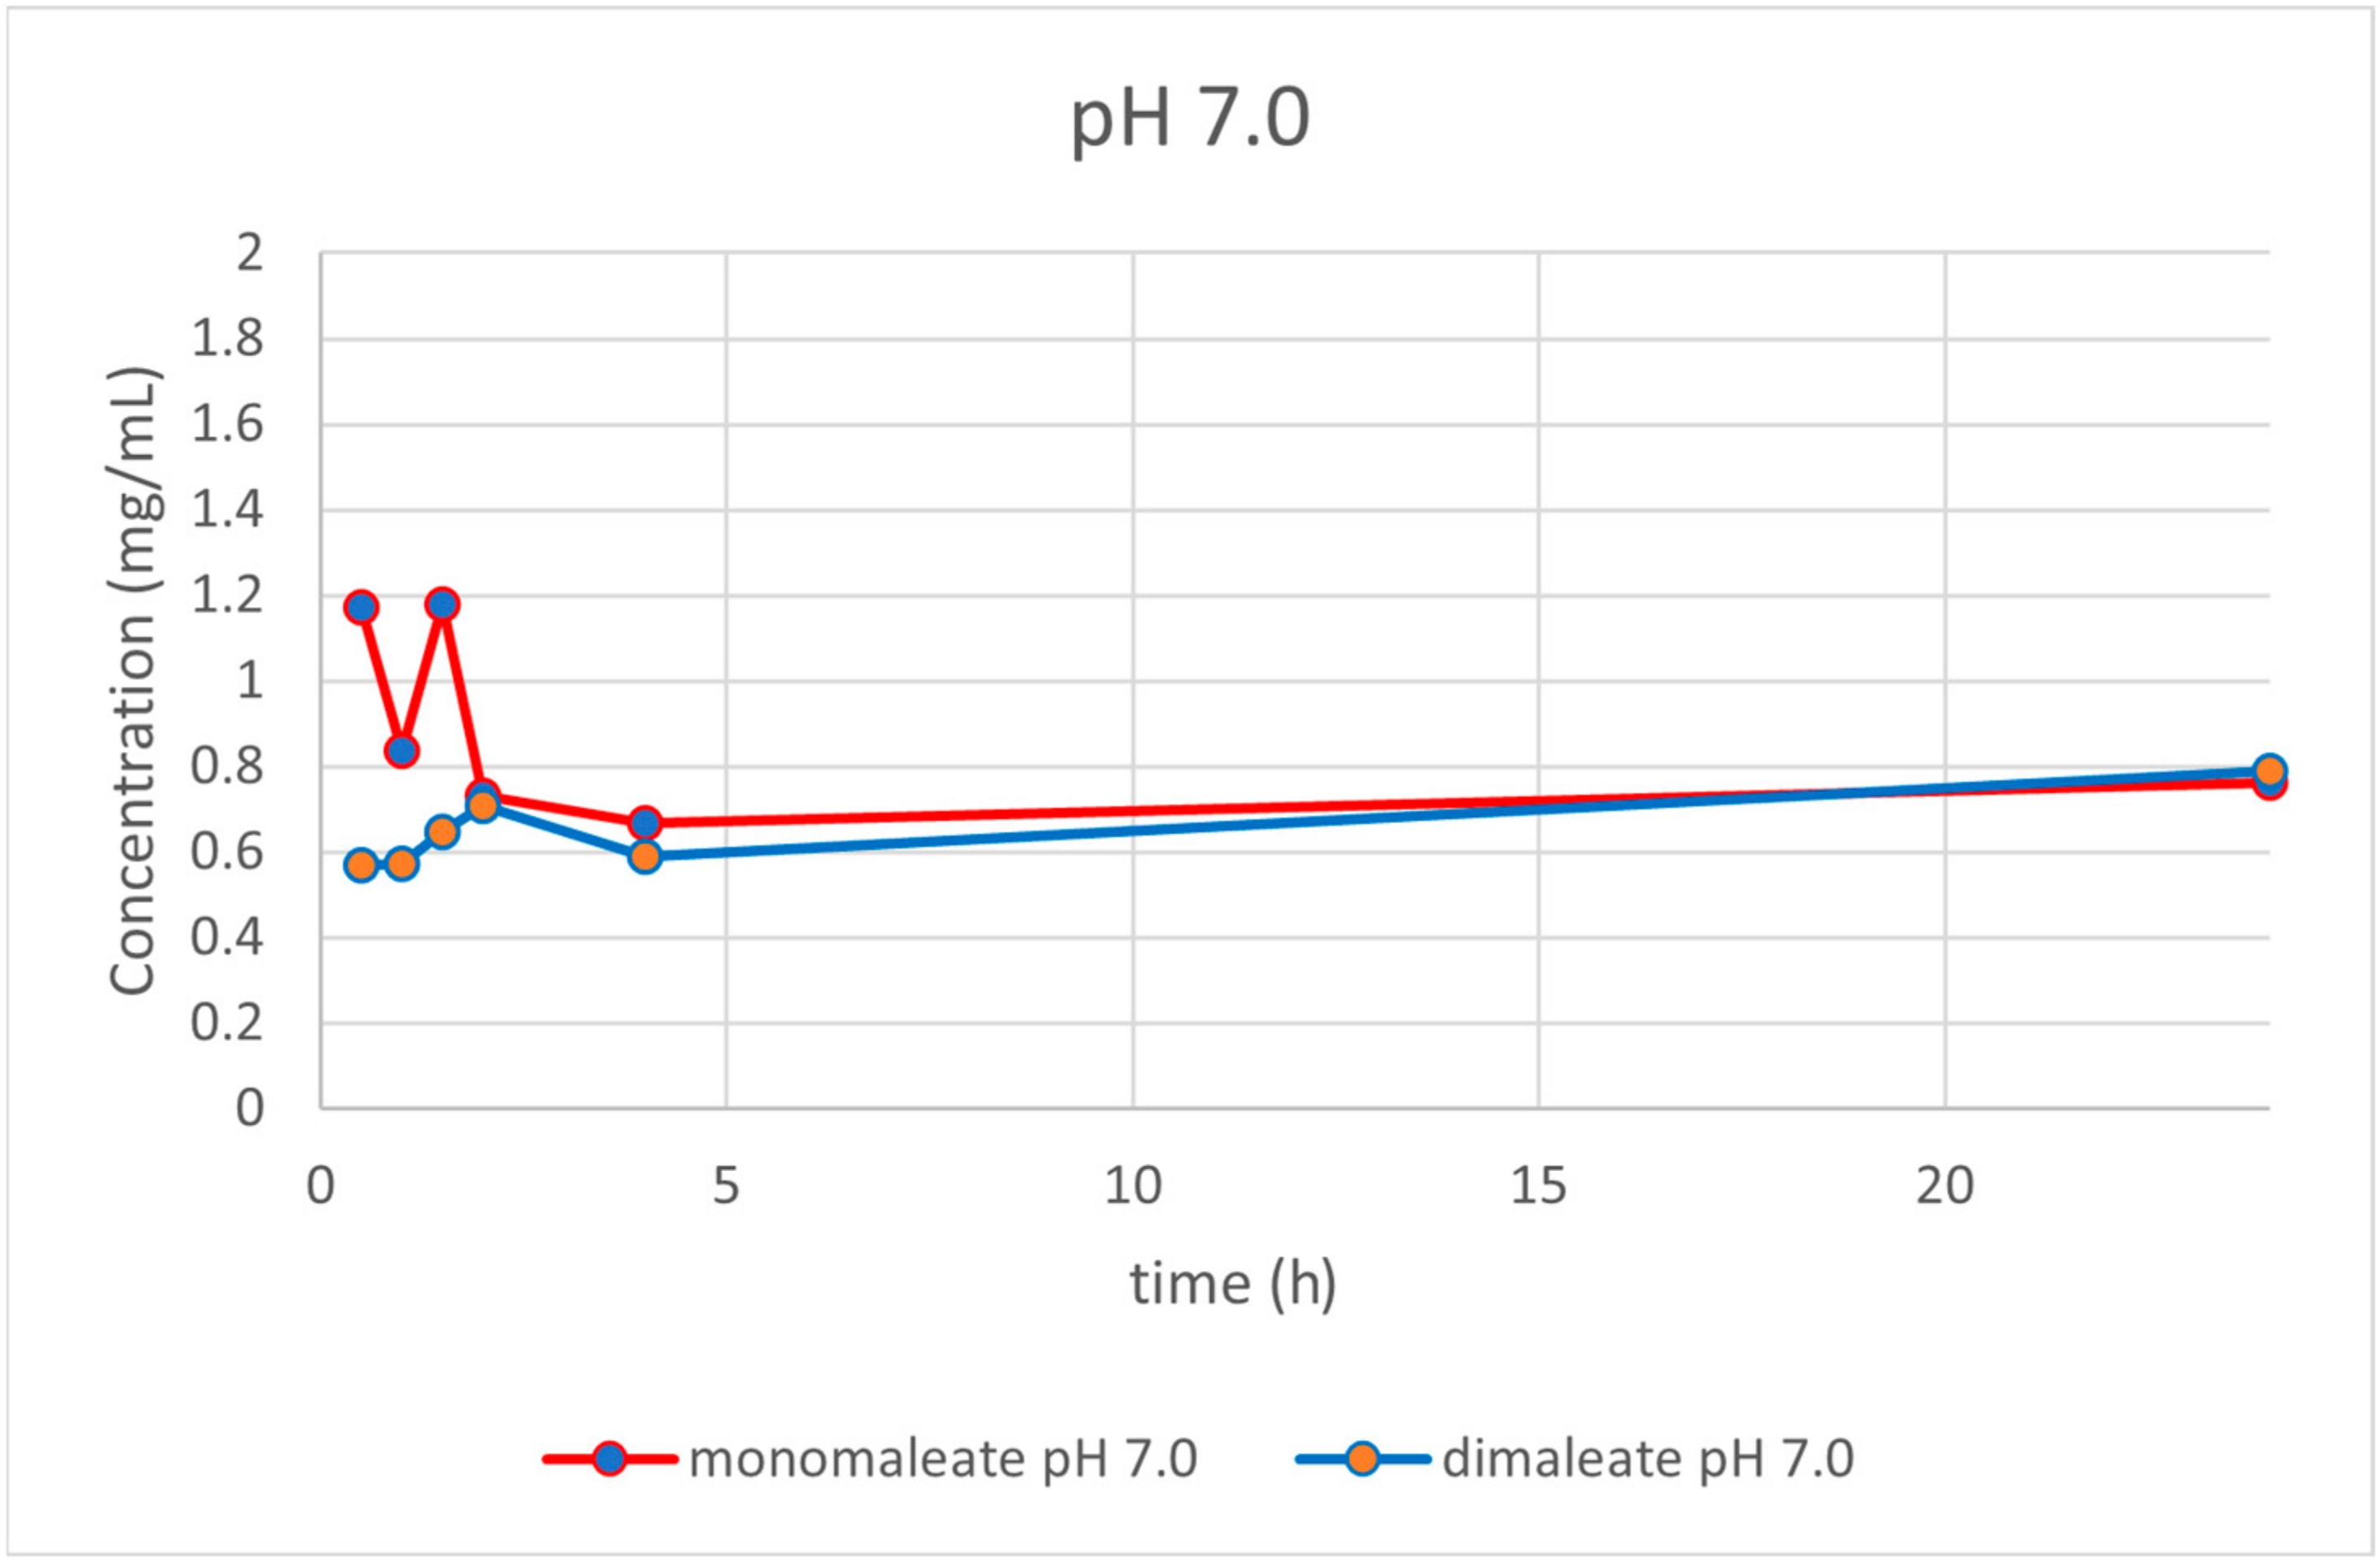
3.2.8. Solubility Testing
4. Discussion
5. Conclusions
6. Patents
Supplementary Materials
Author Contributions
Funding
Institutional Review Board Statement
Informed Consent Statement
Data Availability Statement
Acknowledgments
Conflicts of Interest
References
- U.S. Department of Health and Human Services, National Institutes of Health, National Cancer Institute. Acute Myeloid Leukemia Treatment (PDQ®)—Patient Version; National Cancer Institute, Rockville, MD, USA. 2022. Available online: https://www.cancer.gov/types/leukemia/patient/adult-aml-treatment-pdq (accessed on 29 July 2022).
- Ling, Y.; Zhang, Z.; Zhang, H.; Huang, Z. Protein Kinase Inhibitors as Therapeutic Drugs in AML: Advances and Challenges. Curr. Pharm. Des. 2017, 23, 4303–4310. [Google Scholar] [CrossRef] [PubMed]
- Ferguson, F.; Gray, N. Kinase inhibitors: The road ahead. Nat. Rev. Drug Discov. 2018, 17, 353–377. [Google Scholar] [CrossRef] [PubMed]
- Fiorentini, A.; Capelli, D.; Saraceni, F.; Menotti, D.; Poloni, A.; Olivieri, A. The time has come for targeted therapies for AML: Lights and shadows. Oncol. Ther. 2020, 8, 13–32. [Google Scholar] [CrossRef] [PubMed] [Green Version]
- Yu, J.; Jiang, P.Y.Z.; Sun, H.; Zhang, X.; Jiang, Z.; Li, Y.; Song, Y. Advances in targeted therapy for acute myeloid leukemia. Biomark. Res. 2020, 8, 17. [Google Scholar] [CrossRef] [PubMed]
- Carter, J.L.; Hege, K.; Yang, J.; Kalpage, H.A.; Su, Y.; Edwards, H.; Hüttemann, M.; Taub, J.W.; Ge, Y. Targeting multiple signaling pathways: The new approach to acute myeloid leukemia therapy. Signal Transduct. Target. Ther. 2020, 5, 288. [Google Scholar] [CrossRef] [PubMed]
- Griffiths, E.A.; Carraway, H.E.; Chandhok, N.S.; Prebet, T. Advances in non-intensive chemotherapy treatment options for adults diagnosed with acute myeloid leukemia. Leuk. Res. 2020, 91, 106339. [Google Scholar] [CrossRef] [PubMed]
- Megías-Vericat, J.E.; Martínez-Cuadrón, D.; Solana-Altabella, A.; Montesinos, P. Precision medicine in acute myeloid leukemia: Where are we now and what does the future hold? Expert Rev. Hematol. 2020, 13, 1057–1065. [Google Scholar] [CrossRef]
- Himmelstein, G.; Mascarenhas, J.; Marcellino, B.K. Alternatives to intensive treatment in patients with AML. Clin. Adv. Hematol. Oncol. 2021, 19, 526–535. Available online: https://www.hematologyandoncology.net/archives/august-2021/alternatives-to-intensive-treatment-in-patients-with-aml/ (accessed on 31 July 2022).
- Attwood, M.M.; Fabbro, D.; Sokolov, A.V.; Knapp, S.; Schiöth, H.B. Trends in kinase drug discovery: Targets, indications and inhibitor design. Nat. Rev. Drug Discov. 2021, 20, 839–861. [Google Scholar] [CrossRef]
- Yeoh, Z.H.; Bajel, A.; Wei, A.H. New drugs bringing new challenges to AML: A brief review. J. Pers. Med. 2021, 11, 1003. [Google Scholar] [CrossRef]
- Roskoski, R. Properties of FDA-approved small molecule protein kinase inhibitors: A 2021 update. Pharmacol. Res. 2021, 165, 105463. [Google Scholar] [CrossRef]
- Solana-Altabella, A.; Ballesta-López, O.; Megías-Vericat, J.E.; Martínez-Cuadrón, D.; Montesinos, P. Emerging FLT3 inhibitors for the treatment of acute myeloid leukemia. Expert Opin. Emerg. Drugs 2022, 27, 1–18. [Google Scholar] [CrossRef]
- Kayser, S.; Levis, M.J. Updates on targeted therapies for acute myeloid leukaemia. Br. J. Haematol. 2022, 196, 316–328. [Google Scholar] [CrossRef]
- Ayala-Aguilera, C.C.; Valero, T.; Lorente-Macias, A.; Baillache, D.J.; Croke, S.; Unciti-Broceta, A. Small molecule kinase inhibitor drugs (1995–2021): Medical indication, pharmacology, and synthesis. J. Med. Chem. 2022, 65, 1047–1131. [Google Scholar] [CrossRef]
- Jones, C.S.; La Greca, S.; Li, Q.; Munchhof, M.J.; Reiter, L.A. Benzimidazole Derivatives. International Patent Application WO 09004427 A2, 8 January 2009. [Google Scholar]
- Munchhof, M.J.; Li, Q.; Shavnya, A.; Borzillo, G.V.; Boyden, T.L.; Jones, C.S.; LaGreca, S.D.; Martinz-Alsina, L.; Patel, N.; Pelletier, K.; et al. Discovery of PF-04449913, a potent and orally bioavailable inhibitor of smoothened. ACS Med. Chem. Lett. 2012, 3, 106–111. [Google Scholar] [CrossRef] [Green Version]
- Peng, Z.; Wong, J.W.; Hansen, E.C.; Puchlopek-Dermenci, A.L.A.; Clarke, H.J. Development of a concise, asymmetric synthesis of a smoothened receptor (SMO) inhibitor: Enzymatic transamination of a 4-piperidinone with dynamic kinetic resolution. Org. Lett. 2014, 16, 860–863. [Google Scholar] [CrossRef]
- Gras, J.G. Hedgehog signaling inhibitor, treatment of myelodysplastic syndrome, treatment of chronic myelomonocytic leukemia, treatment of acute myeloid leukemia, treatment of myelofibrosis. Drugs Future 2017, 42, 265–274. [Google Scholar] [CrossRef]
- Hoy, S.M. Glasdegib: First Global Approval. Drugs 2019, 79, 207–213. [Google Scholar] [CrossRef]
- Goldsmith, S.R.; Lovell, A.R.; Schroeder, M.A. Glasdegib for the treatment of adult patients with newly diagnosed acute myeloid leukemia or high-grade myelodysplastic syndrome who are elderly or otherwise unfit for standard induction chemotherapy. Drugs Today 2019, 55, 545–562. [Google Scholar] [CrossRef]
- Wolska-Washer, A.; Robak, T. Glasdegib in the treatment of acute myeloid leukemia. Future Oncol. 2019, 15, 3219–3232. [Google Scholar] [CrossRef]
- Fersing, C.; Mathias, F. Update on glasdegib in acute myeloid leukemia—Broadening horizons of Hedgehog pathway inhibitors. Acta Pharm. 2022, 72, 9–34. [Google Scholar] [CrossRef]
- Highlights of Prescribing Information. DaurismoTM (Glasdegib) Tablets, for Oral Use. Available online: https://www.accessdata.fda.gov/drugsatfda_docs/label/2018/210656s000lbl.pdf (accessed on 12 May 2022).
- Product Monograph Including Patient Medication Information, Daurismo®, Glasdegib Tablets. Available online: https://www.pfizer.ca/sites/default/files/202202/Daurismo_PM_EN_250530_21Jan2022.pdf (accessed on 12 May 2022).
- Hansen, E.C.; Seadeek, C.S. Crystalline Forms of 1-((2R, 4R)-2-(1H-benzo[d]imidazol-2-yl)-1-methylpiperidin-4-yl)-3-(4-cyanophenyl)urea Maleate. International Patent Application WO 2016170451 A1, 27 October 2016. [Google Scholar]
- Moreton, C. Poor Solubility—Where do we stand 25 years after the ‘rule of five’? Am. Pharm. Rev.-Rev. Am. Pharm. Bus. Technol. 2021, 24, 16–22. [Google Scholar]
- Peklar, B. Dimaleate Form of 1-((2R,4R)-2-(1H-benzo[d]imidazol-2-yl)-1-methylpiperidin-4-yl)-3-(4-cyanophenyl)urea. International Patent Application WO 2021191278 A1, 30 September 2021. [Google Scholar]
- Hussain, S.; Pinitglang, S.; Bailey, T.S.; Reid, J.D.; Noble, M.A.; Resmini, M.; Thomas, E.W.; Greaves, R.B.; Verma, C.S.; Brocklehurst, K. Variation in the pH-dependent pre-steady state and steady-state kinetic characteristics of cysteine-proteinase mechanism: Evidence for electrostatic modulation of catalytic site function by the neighboring carboxylate anion. Biochem. J. 2003, 372, 735–746. [Google Scholar] [CrossRef] [PubMed] [Green Version]
- Agilent Technologies Ltd. CrysAlisPro, Version 1.171.36.28; Agilent Technologies: Yarnton, UK, 2013; Available online: https://www.agilent.com/cs/library/usermanuals/Public/CrysAlis_Pro_User_Manual.pdf (accessed on 8 May 2022).
- Sheldrick, G.M. SHELXT—Integrated space-group and crystal-structure determination. Acta Crystallogr. 2015, A71, 3–8. [Google Scholar] [CrossRef] [Green Version]
- Sheldrick, G.M. Crystal structure refinement with SHELXL. Acta Crystallogr. 2015, C71, 3–8. [Google Scholar] [CrossRef]
- Dolomanov, O.V.; Bourhis, L.J.; Gildea, R.J.; Howard, J.A.K.; Puschmann, H. OLEX2: A complete structure solution, refinement and analysis program. J. Appl. Crystallogr. 2009, 42, 339–341. [Google Scholar] [CrossRef]
- Spek, A.L.J. Single-crystal structure validation with the program PLATON. J. Appl. Crystallogr. 2003, 36, 7–13. [Google Scholar] [CrossRef] [Green Version]
- Lee, M.; Goldburg, W. Nuclear magnetic resonance line narrowing by a rotating RF field. Phys. Rev. 1965, 140, 1261–1271. [Google Scholar] [CrossRef]
- Ladizhansky, V.; Vega, S. Polarization transfer dynamics in Lee–Goldburg cross polarization under magnetic resonance experiments on rotating solids. J. Chem. Phys. 2000, 112, 7158–7168. [Google Scholar] [CrossRef]
- Van Rossum, B.-J.; de Groot, C.P.; Ladizhansky, V.; Vega, S.; de Groot, H.J.M. A method for measuring heteronuclear (1H–13C) distances in high speed MAS NMR. J. Am. Chem. Soc. 2000, 122, 3465–3472. [Google Scholar] [CrossRef]
- Bernstein, J.; Davis, R.E.; Shimoni, L.; Chang, N.L. Patterns in hydrogen bonding: Functionality and graph set analysis in crystals. Angew. Chem. Int. Ed. 1995, 34, 1555–1573. [Google Scholar] [CrossRef]
- Cruz-Cabeza, A.J. Acid–base crystalline complexes and the pKa rule. CrystEngComm 2012, 14, 6362–6365. [Google Scholar] [CrossRef]
- Childs, S.L.; Stahly, G.P.; Park, A. The salt-cocrystal continuum: The influence of crystal structure on ionization state. Mol. Pharm. 2007, 4, 323–338. [Google Scholar] [CrossRef] [Green Version]
- Lengauer, H.; Makuc, D.; Šterk, D.; Perdih, F.; Pichler, A.; Trdan Lušin, T.; Plavec, J.; Časar, Z. Co-crystals, salts or mixtures of both? The case of tenofovir alafenamide fumarates. Pharmaceutics 2020, 12, 342. [Google Scholar] [CrossRef]
- Wang, J.-W.; Liu, L.; Yu, K.-X.; Bai, H.-Z.; Zhou, J.; Zhang, W.-H.; Hu, X.; Tang, G. On the single-crystal structure of tenofovir alafenamide mono-fumarate: A metastable phase featuring a mixture of co-crystal and salt. Int. J. Mol. Sci. 2020, 21, 9213. [Google Scholar] [CrossRef]
- ChemAxon Marvin Suite 17.28.0, ChemAxon Home Page. Available online: http://www.chemaxon.com (accessed on 19 June 2022).
- Clark, J.H.; Jones, C.W. Solvent-dependent proton pransfer in a strongly hydrogen bonded fluoride complex. J. Chem. Soc. Chem. Commun. 1990, 24, 1786–1787. [Google Scholar] [CrossRef]
- Black, S.N.; Collier, E.A.; Davey, R.J.; Roberts, R.J. Structure, solubility, screening, and synthesis of molecular salts. J. Pharm. Sci. 2007, 96, 1053–1068. [Google Scholar] [CrossRef]
- Paulekuhn, G.S.; Dressman, J.B.; Saal, C. Trends in active pharmaceutical ingredient salt selection based on analysis of the orange book database. J. Med. Chem. 2007, 50, 6665–6672. [Google Scholar] [CrossRef]
- Ule, M.; Časar, Z. Analysis of the selection of active pharmaceutical ingredients’ salts in medicinal products registered in the USA between 2007 and 2016. Farm. Vestn. 2018, 69, 175–187. [Google Scholar]
- Bharate, S.S. Carboxylic acid counterions in FDA-approved pharmaceutical salts. Pharm. Res. 2021, 38, 1307–1326. [Google Scholar] [CrossRef]
- Australian Public Assessment Report for Afatinib (as Dimaleate). Available online: https://www.tga.gov.au/sites/default/files/auspar-afatinib-dimaleate-140414.pdf (accessed on 31 July 2022).
- Australian Product Information NERLYNX® (Neratinib) Tablets. Available online: https://www.tga.gov.au/sites/default/files/auspar-neratinib-as-maleate-020512-pi.pdf (accessed on 31 July 2022).
- Highlights of Prescribing Information. SUTENT® (Sunitinib Malate) Capsules, Oral. Available online: https://www.accessdata.fda.gov/drugsatfda_docs/label/2011/021938s13s17s18lbl.pdf (accessed on 31 July 2022).
- Loftsson, T.; Thorisdóttir, S.; Fridriksdóttir, H.; Stefánsson, E. Enalaprilat and enalapril maleate eyedrops lower intraocular pressure in rabbits. Acta Ophthalmol. 2010, 88, 337–341. [Google Scholar] [CrossRef] [PubMed]


| Glasdegib Monomaleate | Glasdegib Dimaleate | |
|---|---|---|
| CCDC number | 2,180,664 | 2,180,665 |
| Formula | C25H26N6O5 | C29H30N6O9 |
| Mr | 490.52 | 606.59 |
| T (K) | 150.00(10) | 150.00(10) |
| Crystal system | monoclinic | orthorhombic |
| Space group | P21 | P212121 |
| a (Å) | 9.7312(3) | 10.3645(2) |
| b (Å) | 12.3780(3) | 14.5078(3) |
| c (Å) | 10.5764(3) | 19.2377(3) |
| α (°) | 90 | 90 |
| β (°) | 113.776(3) | 90 |
| γ (°) | 90 | 90 |
| Volume (Å3) | 1165.83(6) | 2892.71(10) |
| Z | 2 | 4 |
| Dc (g/cm3) | 1.397 | 1.393 |
| μ (mm−1) | 0.827 | 0.885 |
| F (000) | 516.0 | 1272.0 |
| Reflections collected | 8533 | 10926 |
| Independent reflections (Rint) | 4415 (0.0196) | 5775 (0.0376) |
| Data/restraints/parameters | 4415/3/342 | 5775/4/419 |
| R, wR2 [I > 2σ(I)] a | 0.0284, 0.0718 | 0.0436, 0.1047 |
| R, wR2 (all data) a | 0.0304, 0.0737 | 0.0499, 0.1104 |
| GOF, S b | 1.039 | 1.052 |
| Largest diff. peak/hole/e Å−3 | 0.15/−0.16 | 0.27/−0.21 |
| Flack parameter | −0.10(8) | 0.23(13) |
| D–H⋯A | d(D–H) | d(H⋯A) | d(D⋯A) | <(DHA) |
|---|---|---|---|---|
| glasdegib monomaleate | ||||
| N1–H1⋯O3i | 0.885(13) | 2.033(15) | 2.892(2) | 164(2) |
| N4–H4⋯O2 | 0.98(2) | 1.78(3) | 2.687(2) | 151(2) |
| N6–H6⋯O5i | 0.90(3) | 1.87(3) | 2.762(2) | 171(3) |
| O3–H3A⋯O4 | 1.16(3) | 1.25(3) | 2.403(2) | 177(3) |
| C3–H3⋯O2i | 0.95 | 2.54 | 3.458(3) | 162.7 |
| C7–H7⋯O1 | 0.95 | 2.25 | 2.863(3) | 121.7 |
| C11–H11B⋯N3ii | 0.99 | 2.42 | 3.407(3) | 172.5 |
| C12–H12⋯O4i | 1.00 | 2.25 | 3.211(2) | 161.9 |
| C18–H18⋯O1iii | 0.95 | 2.56 | 3.302(3) | 135.2 |
| C23–H23⋯N5 | 0.95 | 2.54 | 3.274(3) | 134.3 |
| glasdegib dimaleate | ||||
| N1–H1⋯O4i | 0.891(13) | 1.929(14) | 2.820(3) | 177(4) |
| N2–H2⋯O5i | 0.886(13) | 2.122(15) | 2.999(3) | 170(3) |
| N4–H4⋯O2 | 0.99(4) | 1.76(4) | 2.703(3) | 158(3) |
| N5–H5⋯O6 | 0.871(13) | 1.872(15) | 2.736(4) | 171(4) |
| N5–H5⋯O7 | 0.871(13) | 2.56(3) | 3.192(4) | 130(3) |
| N6–H6⋯O8i | 0.877(13) | 2.36(2) | 3.153(4) | 150(3) |
| N6–H6⋯O9i | 0.877(13) | 2.05(3) | 2.772(4) | 140(3) |
| O4–H3A⋯O3 | 1.17(5) | 1.23(5) | 2.397(3) | 170(4) |
| O8–H7A⋯O7 | 1.15(5) | 1.24(6) | 2.386(4) | 177(5) |
| C7–H7⋯O1 | 0.95 | 2.22 | 2.842(4) | 122.4 |
| C9–H9⋯O5ii | 1.00 | 2.50 | 3.326(4) | 139.6 |
| C12–H12⋯O5i | 1.00 | 2.45 | 3.228(4) | 134.6 |
| C13–H13B⋯O6 | 0.99 | 2.42 | 3.364(4) | 159.0 |
| C21–H21⋯O7 | 0.95 | 2.50 | 3.244(4) | 134.8 |
| C28–H28⋯N3iii | 0.95 | 2.60 | 3.404(5) | 142.7 |
| Form Type and Testing Time Point | Chiral Purity 1 [Area%] | Purity 2 [Area%] |
|---|---|---|
| glasdegib monomaleate, t = 0 | 100.00 | 99.86 |
| glasdegib monomaleate, t = 1 month | 99.96 | 99.81 |
| glasdegib monomaleate, t = 2 months | 99.96 | 99.73 |
| glasdegib monomaleate, t = 3 months | 99.96 | 99.72 |
| glasdegib dimaleate, t = 0 | 100.00 | 99.98 |
| glasdegib dimaleate, t = 1 month | 100.00 | 99.97 |
| glasdegib dimaleate, t = 2 months | 100.00 | 99.93 |
| glasdegib dimaleate, t = 3 months | 100.00 | 99.90 |
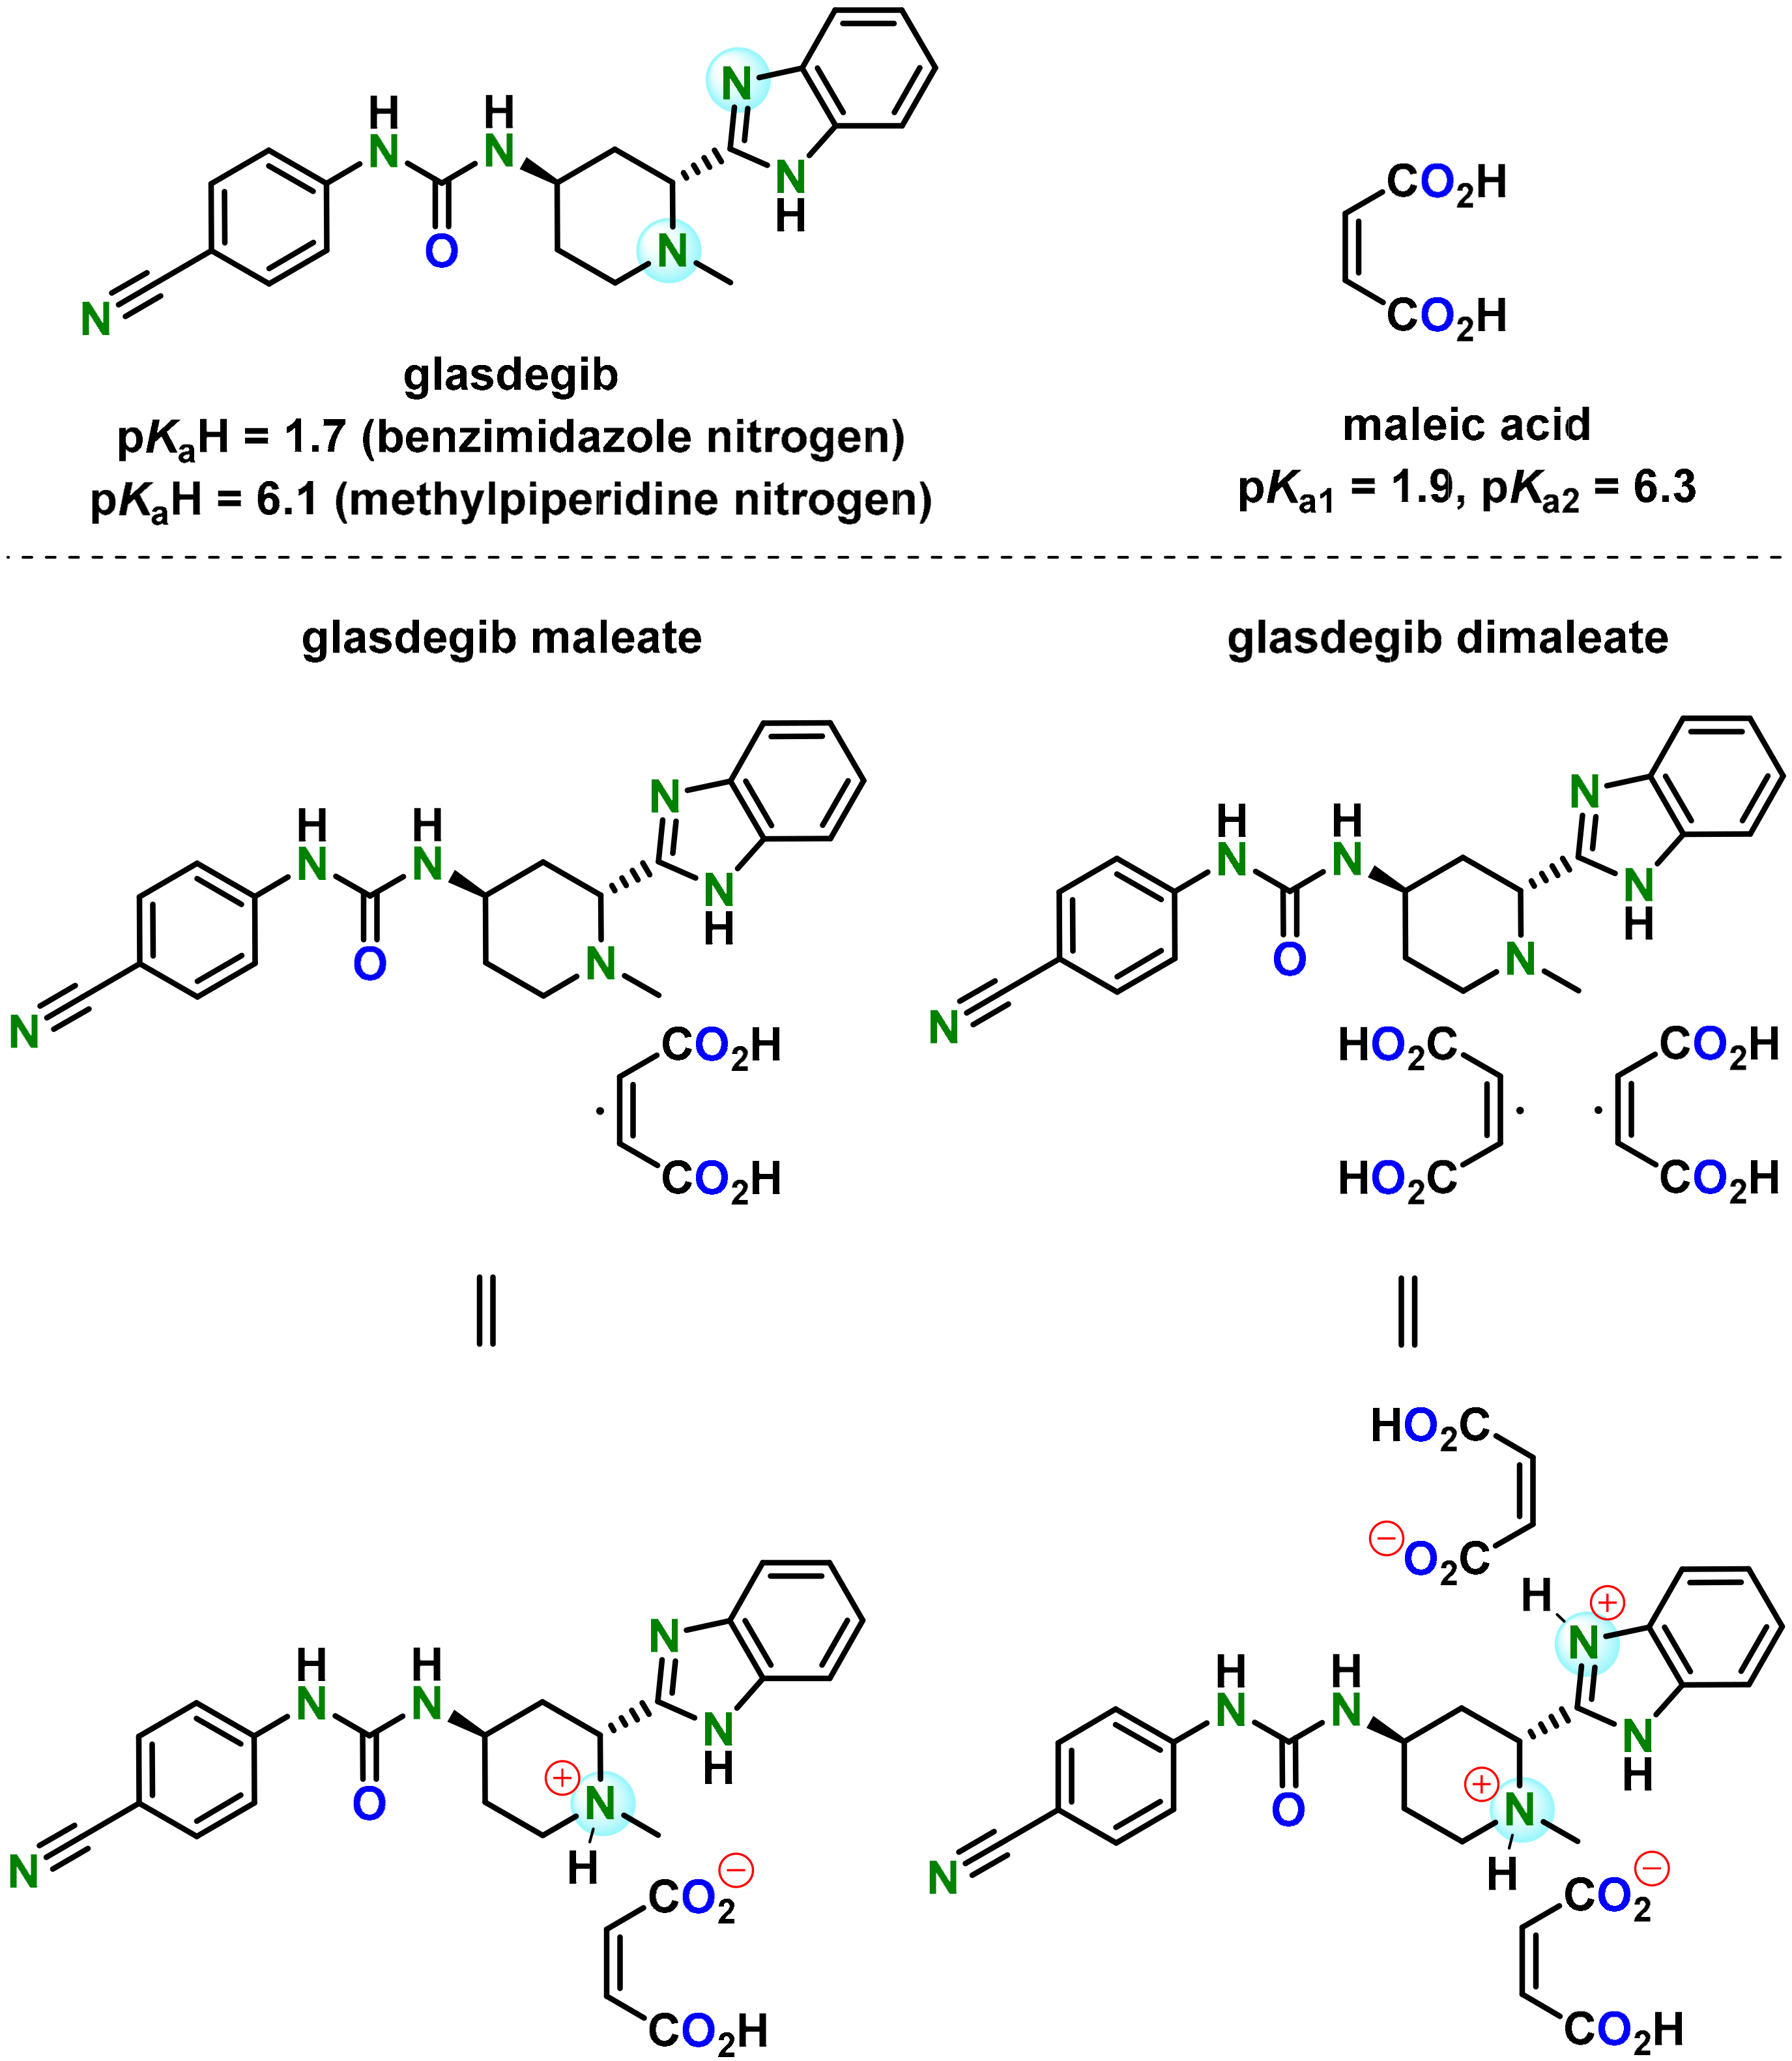
| pKa Protonated Base | pKa1 Acid [29] | ΔpKa = pKa (Protonated Base) − pKa1 (Acid) ** [39] |
|---|---|---|
| 6.1 (methylpiperidine nitrogen) [24,25] | 1.9 [29] | 4.2 |
| 1.7 (benzimidazole nitrogen) [24,25] | 1.9 [29] | −0.2 |
| 6.67 (methylpiperidine nitrogen) * [43] | 2.85 * [43] | 3.82 |
| 3.01 (benzimidazole nitrogen) * [43] | 2.85 * [43] | 0.16 |
| ΔpKa | P(A−B+) 1 (%) | P(AB) 1 (%) | |
|---|---|---|---|
| Reported pKa values. | −0.2 | 24.6 | 75.4 |
| Calculated pKa values | 0.16 | 30.7 | 69.3 |
Publisher’s Note: MDPI stays neutral with regard to jurisdictional claims in published maps and institutional affiliations. |
© 2022 by the authors. Licensee MDPI, Basel, Switzerland. This article is an open access article distributed under the terms and conditions of the Creative Commons Attribution (CC BY) license (https://creativecommons.org/licenses/by/4.0/).
Share and Cite
Peklar, B.; Perdih, F.; Makuc, D.; Plavec, J.; Cluzeau, J.; Kitanovski, Z.; Časar, Z. Glasdegib Dimaleate: Synthesis, Characterization and Comparison of Its Properties with Monomaleate Analogue. Pharmaceutics 2022, 14, 1641. https://0-doi-org.brum.beds.ac.uk/10.3390/pharmaceutics14081641
Peklar B, Perdih F, Makuc D, Plavec J, Cluzeau J, Kitanovski Z, Časar Z. Glasdegib Dimaleate: Synthesis, Characterization and Comparison of Its Properties with Monomaleate Analogue. Pharmaceutics. 2022; 14(8):1641. https://0-doi-org.brum.beds.ac.uk/10.3390/pharmaceutics14081641
Chicago/Turabian StylePeklar, Boris, Franc Perdih, Damjan Makuc, Janez Plavec, Jérôme Cluzeau, Zoran Kitanovski, and Zdenko Časar. 2022. "Glasdegib Dimaleate: Synthesis, Characterization and Comparison of Its Properties with Monomaleate Analogue" Pharmaceutics 14, no. 8: 1641. https://0-doi-org.brum.beds.ac.uk/10.3390/pharmaceutics14081641