
Metformin-NSAIDs Molecular Salts: A Path towards Enhanced Oral Bioavailability and Stability

 , , ,
, , ,  ,
,  and
and 
Abstract
:1. Introduction
2. Materials and Methods
2.1. Materials
2.2. Salt Syntheses
2.2.1. Metformin Hydrochloride Neutralization
2.2.2. Mechanochemical Synthesis
2.2.3. Preparation of Single Crystals
2.3. X-ray Diffraction Analysis
2.4. Differential Scanning Calorimetry
2.5. Stability Studies
2.6. Solubility Studies
3. Results and Discussion
3.1. Salt Synthesis
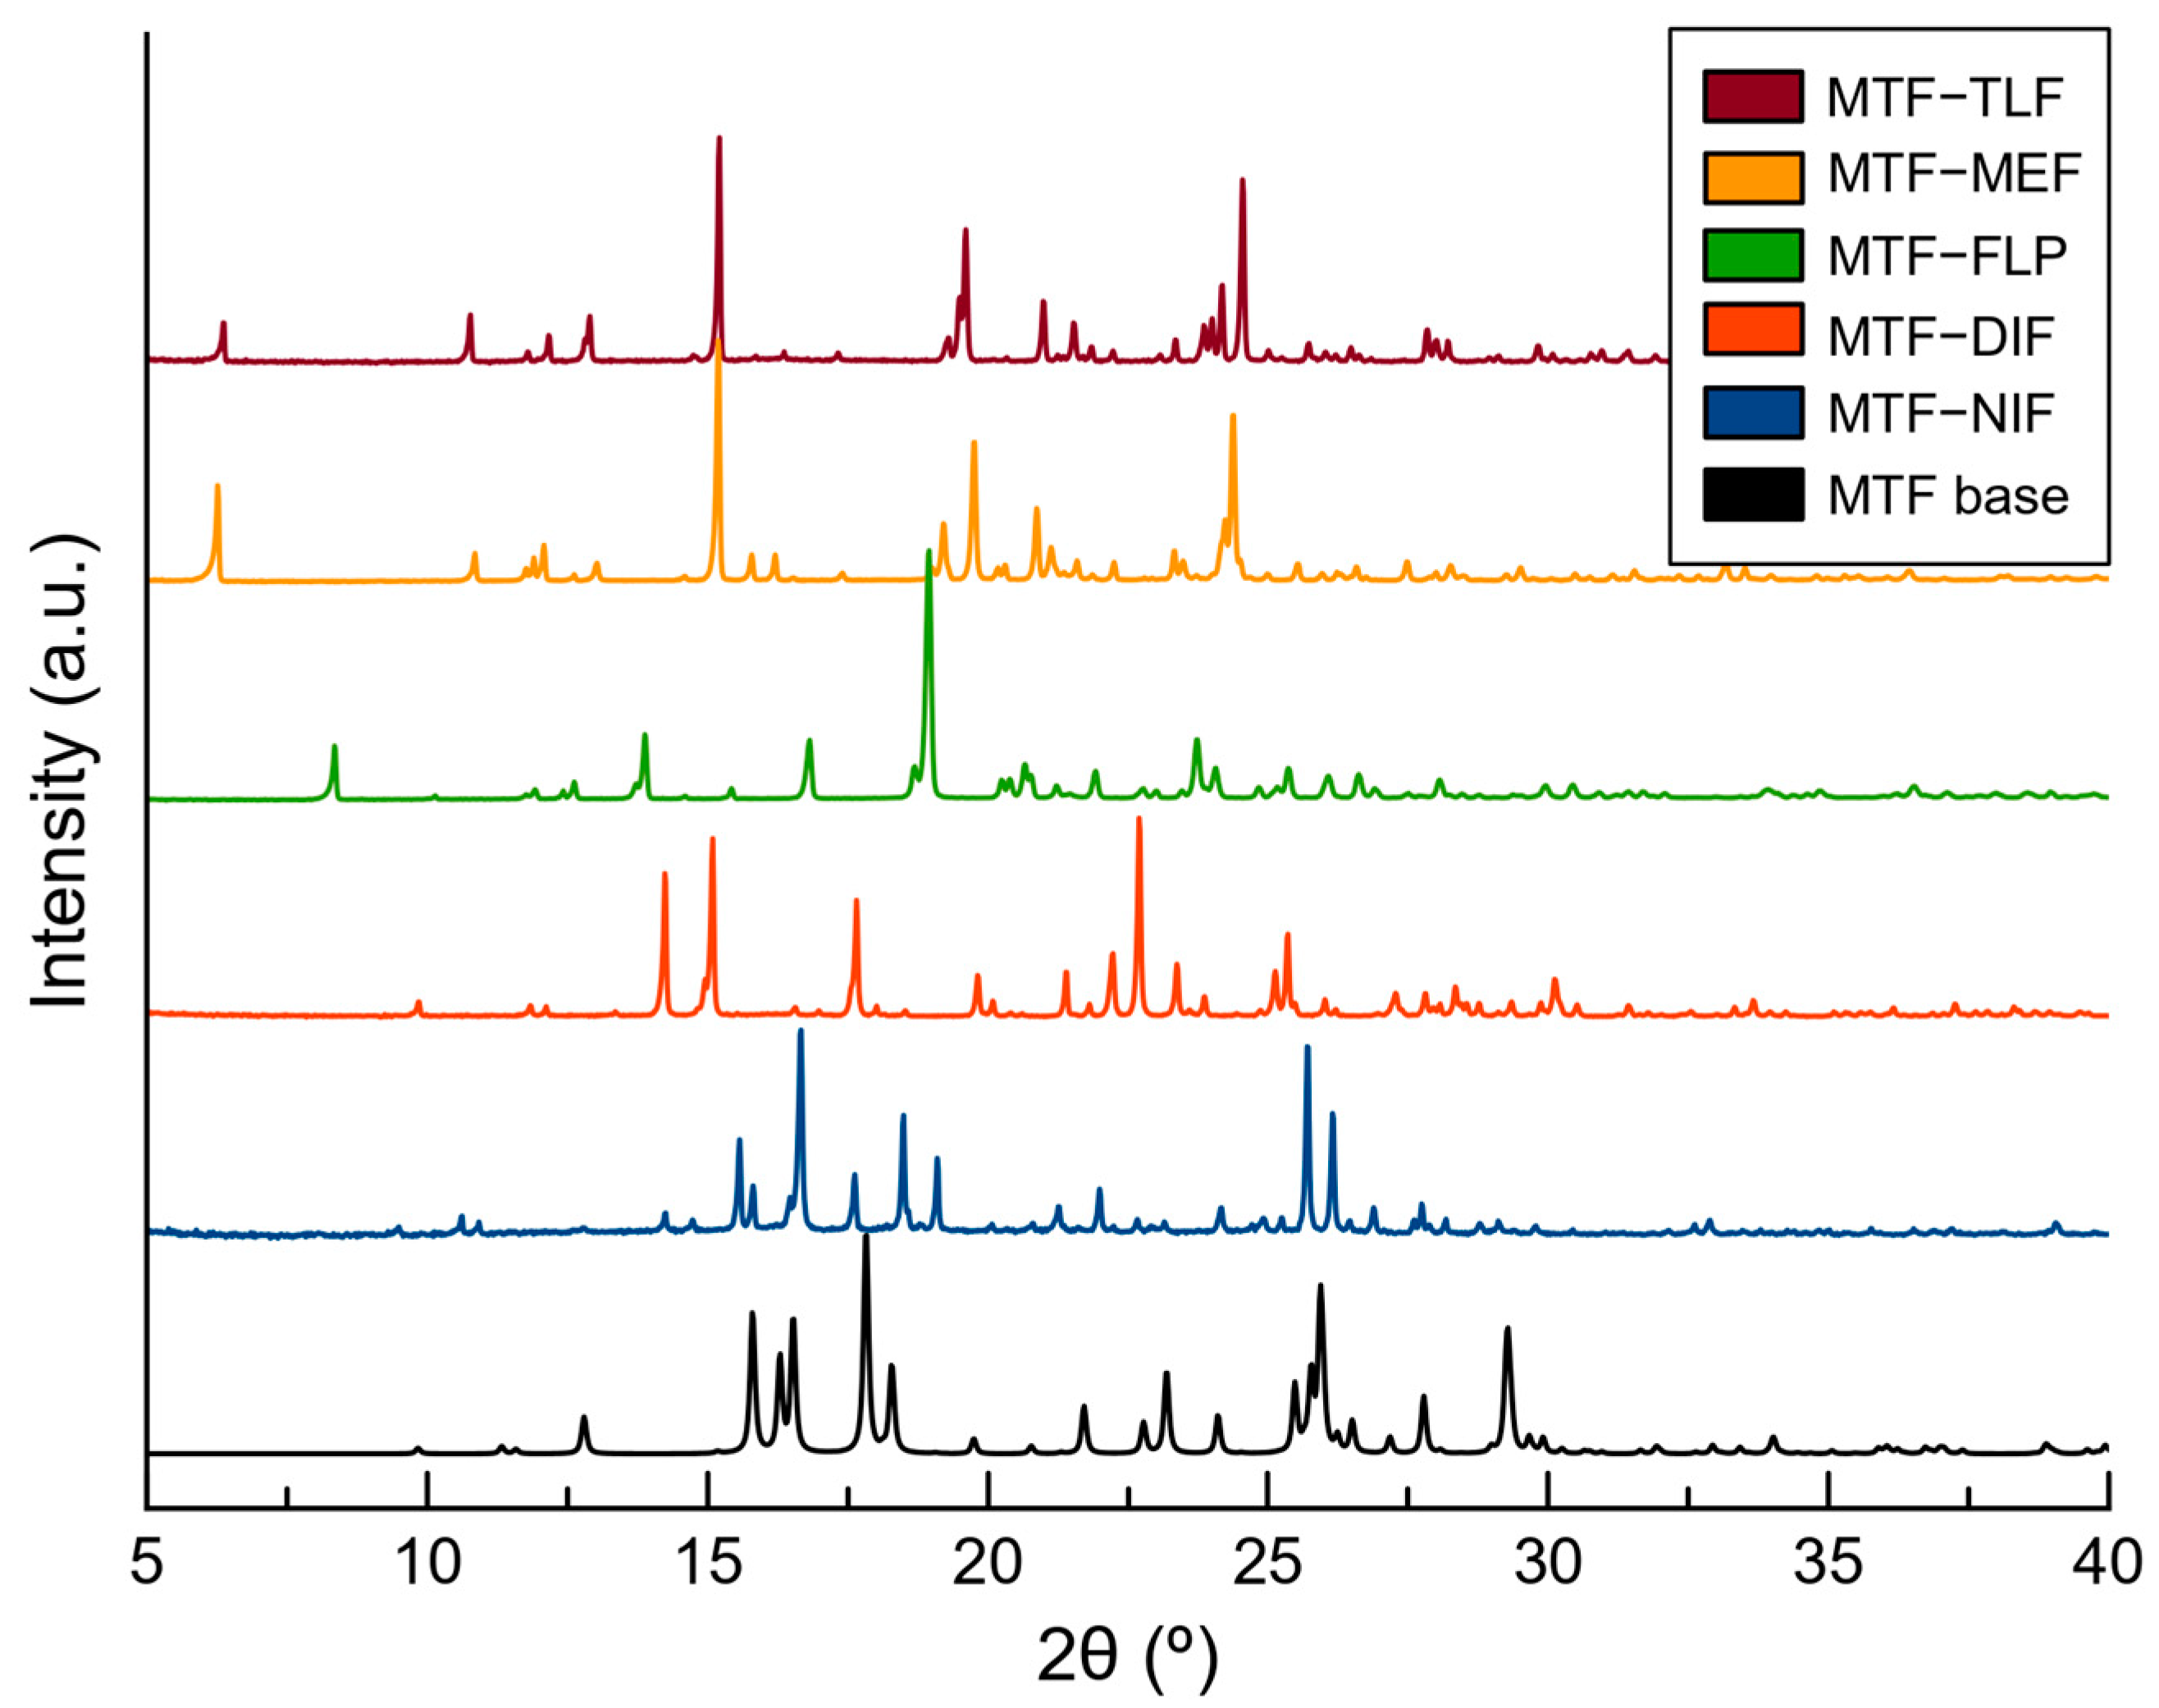
3.2. Salt Screening
3.3. Crystal Structure Analysis of Molecular Salts
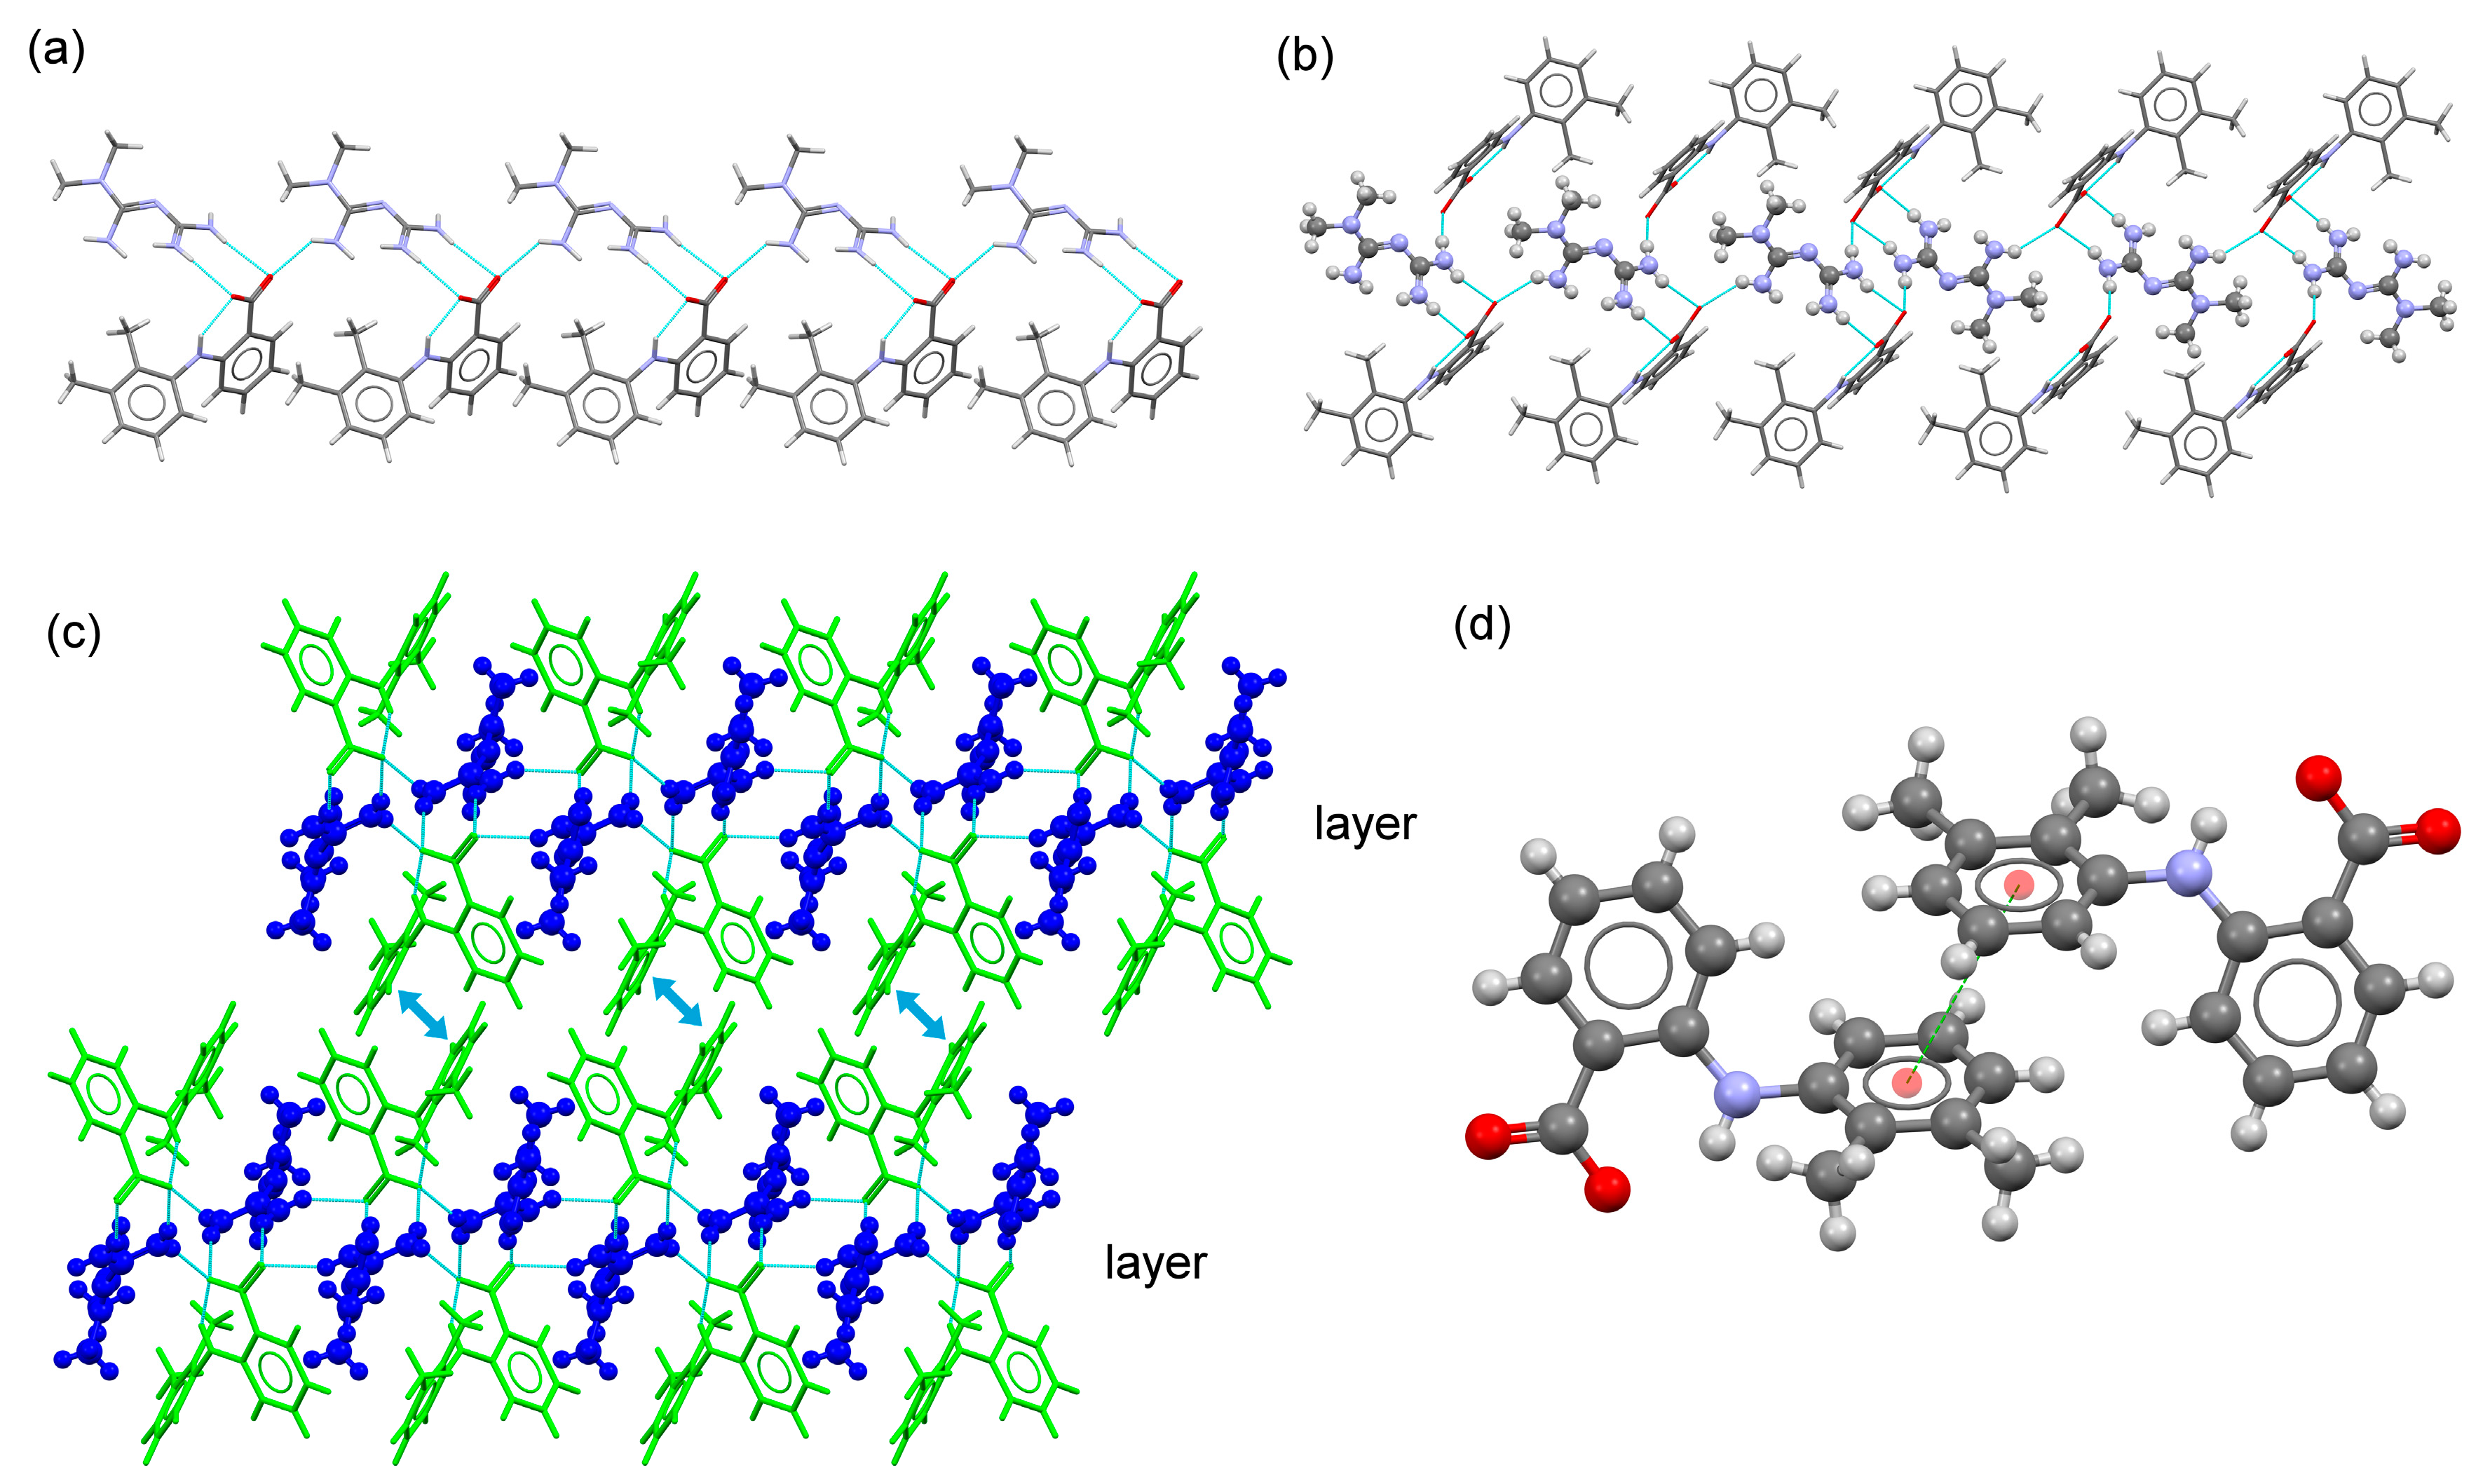
3.3.1. MTF–MEF and MTF–TLF Salts
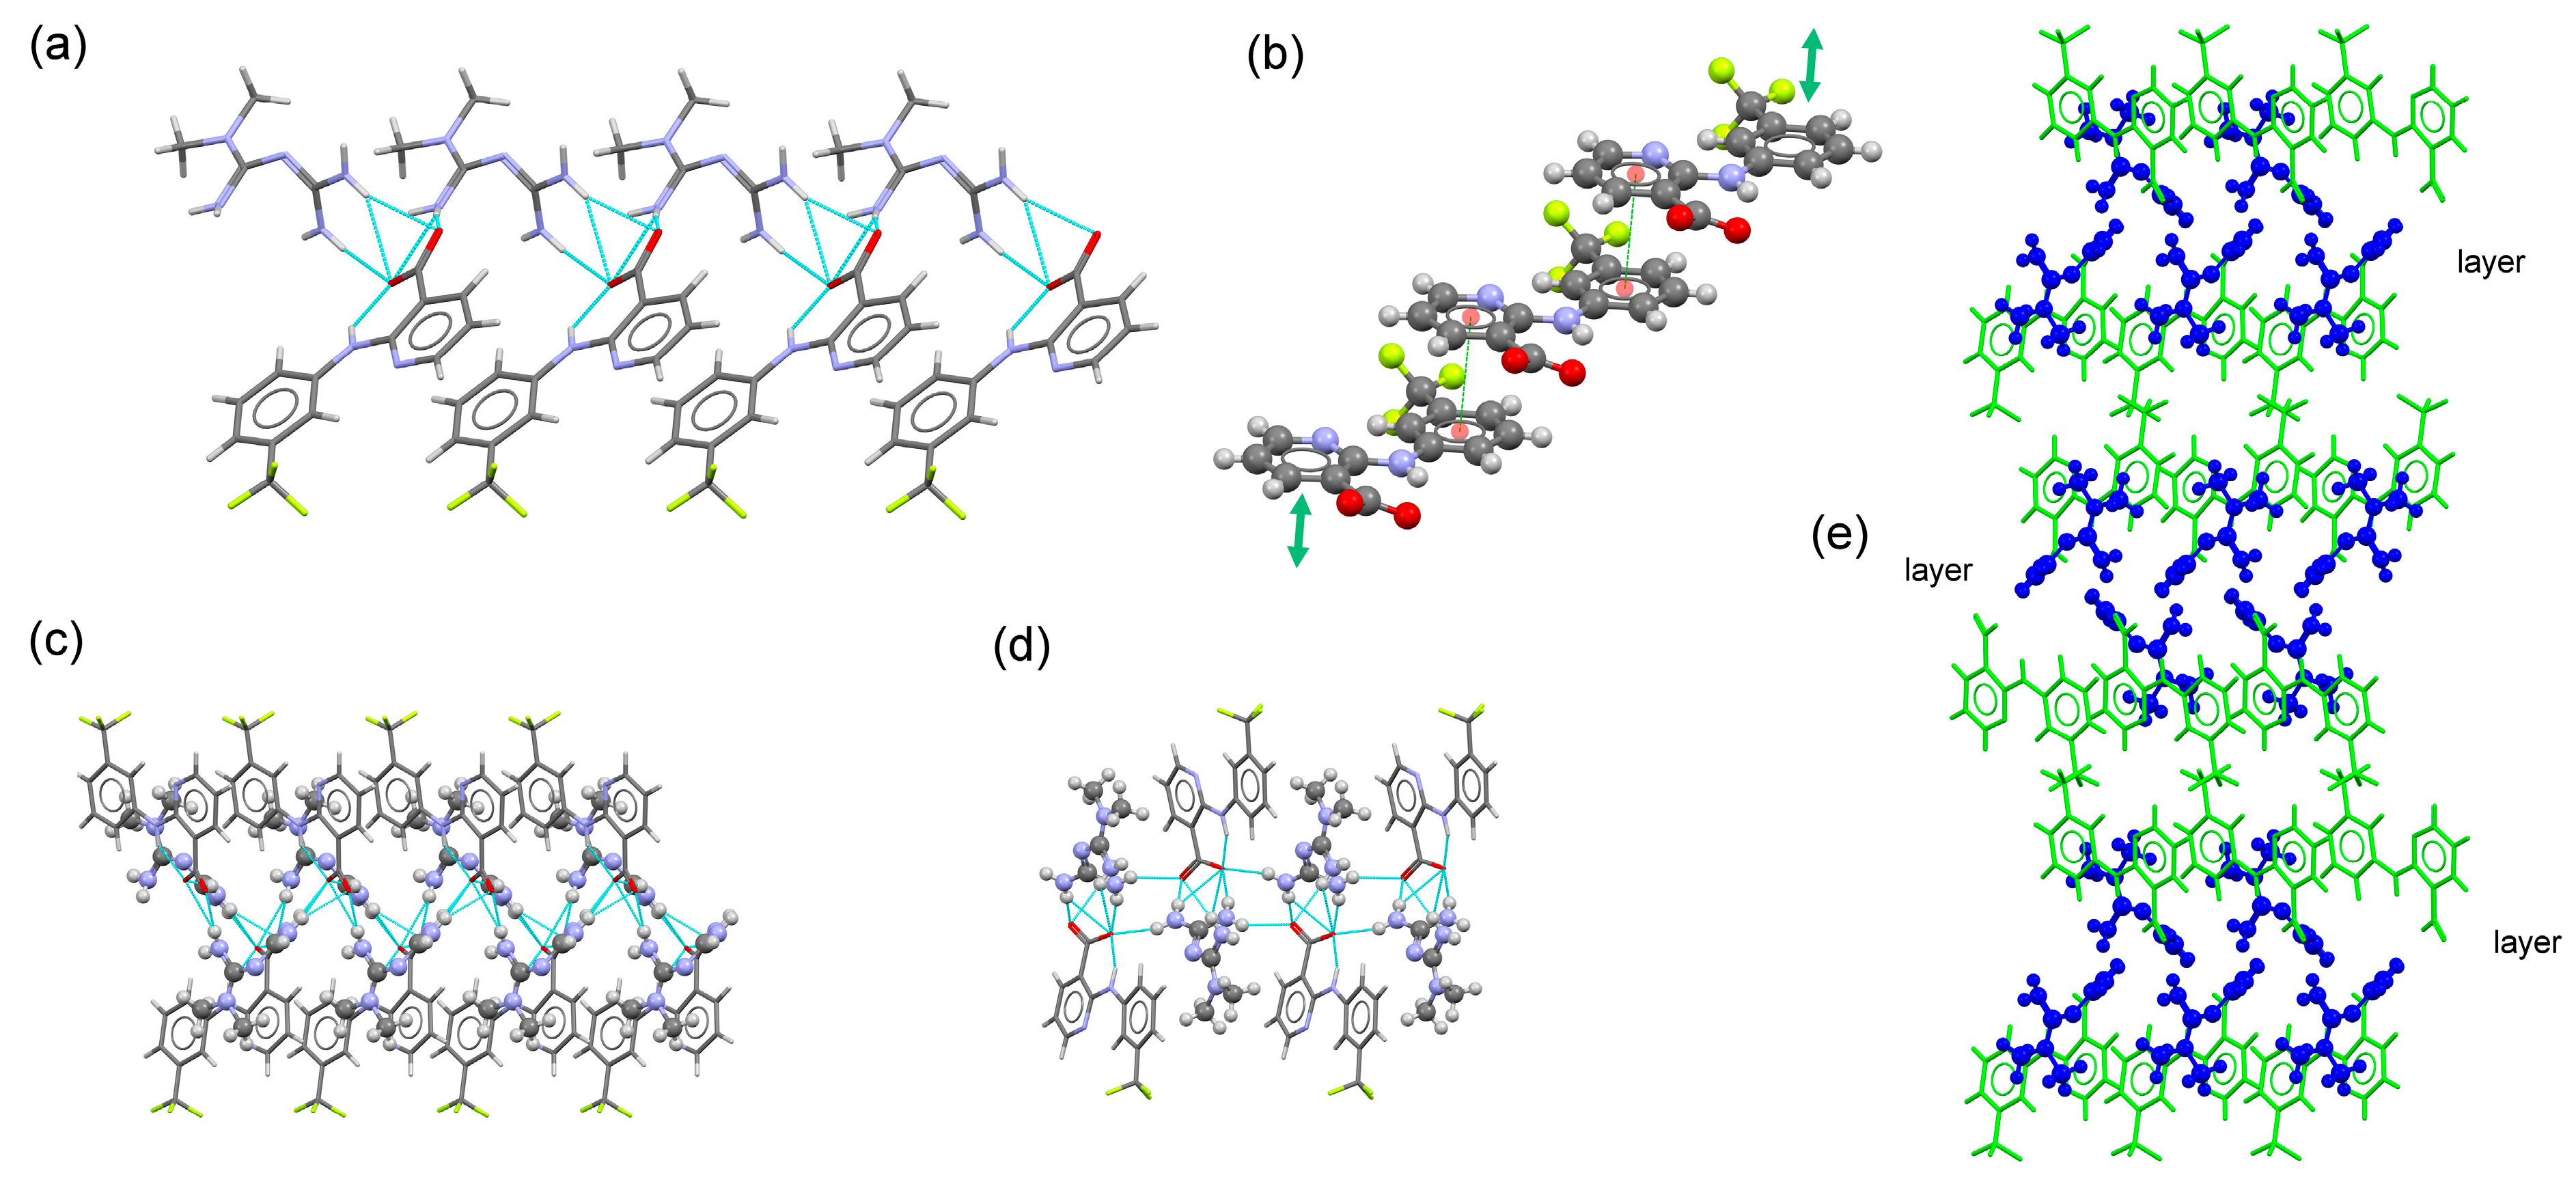
3.3.2. MTF–NIF Salts and MTF–NIF·2H2O Hydrate Salt
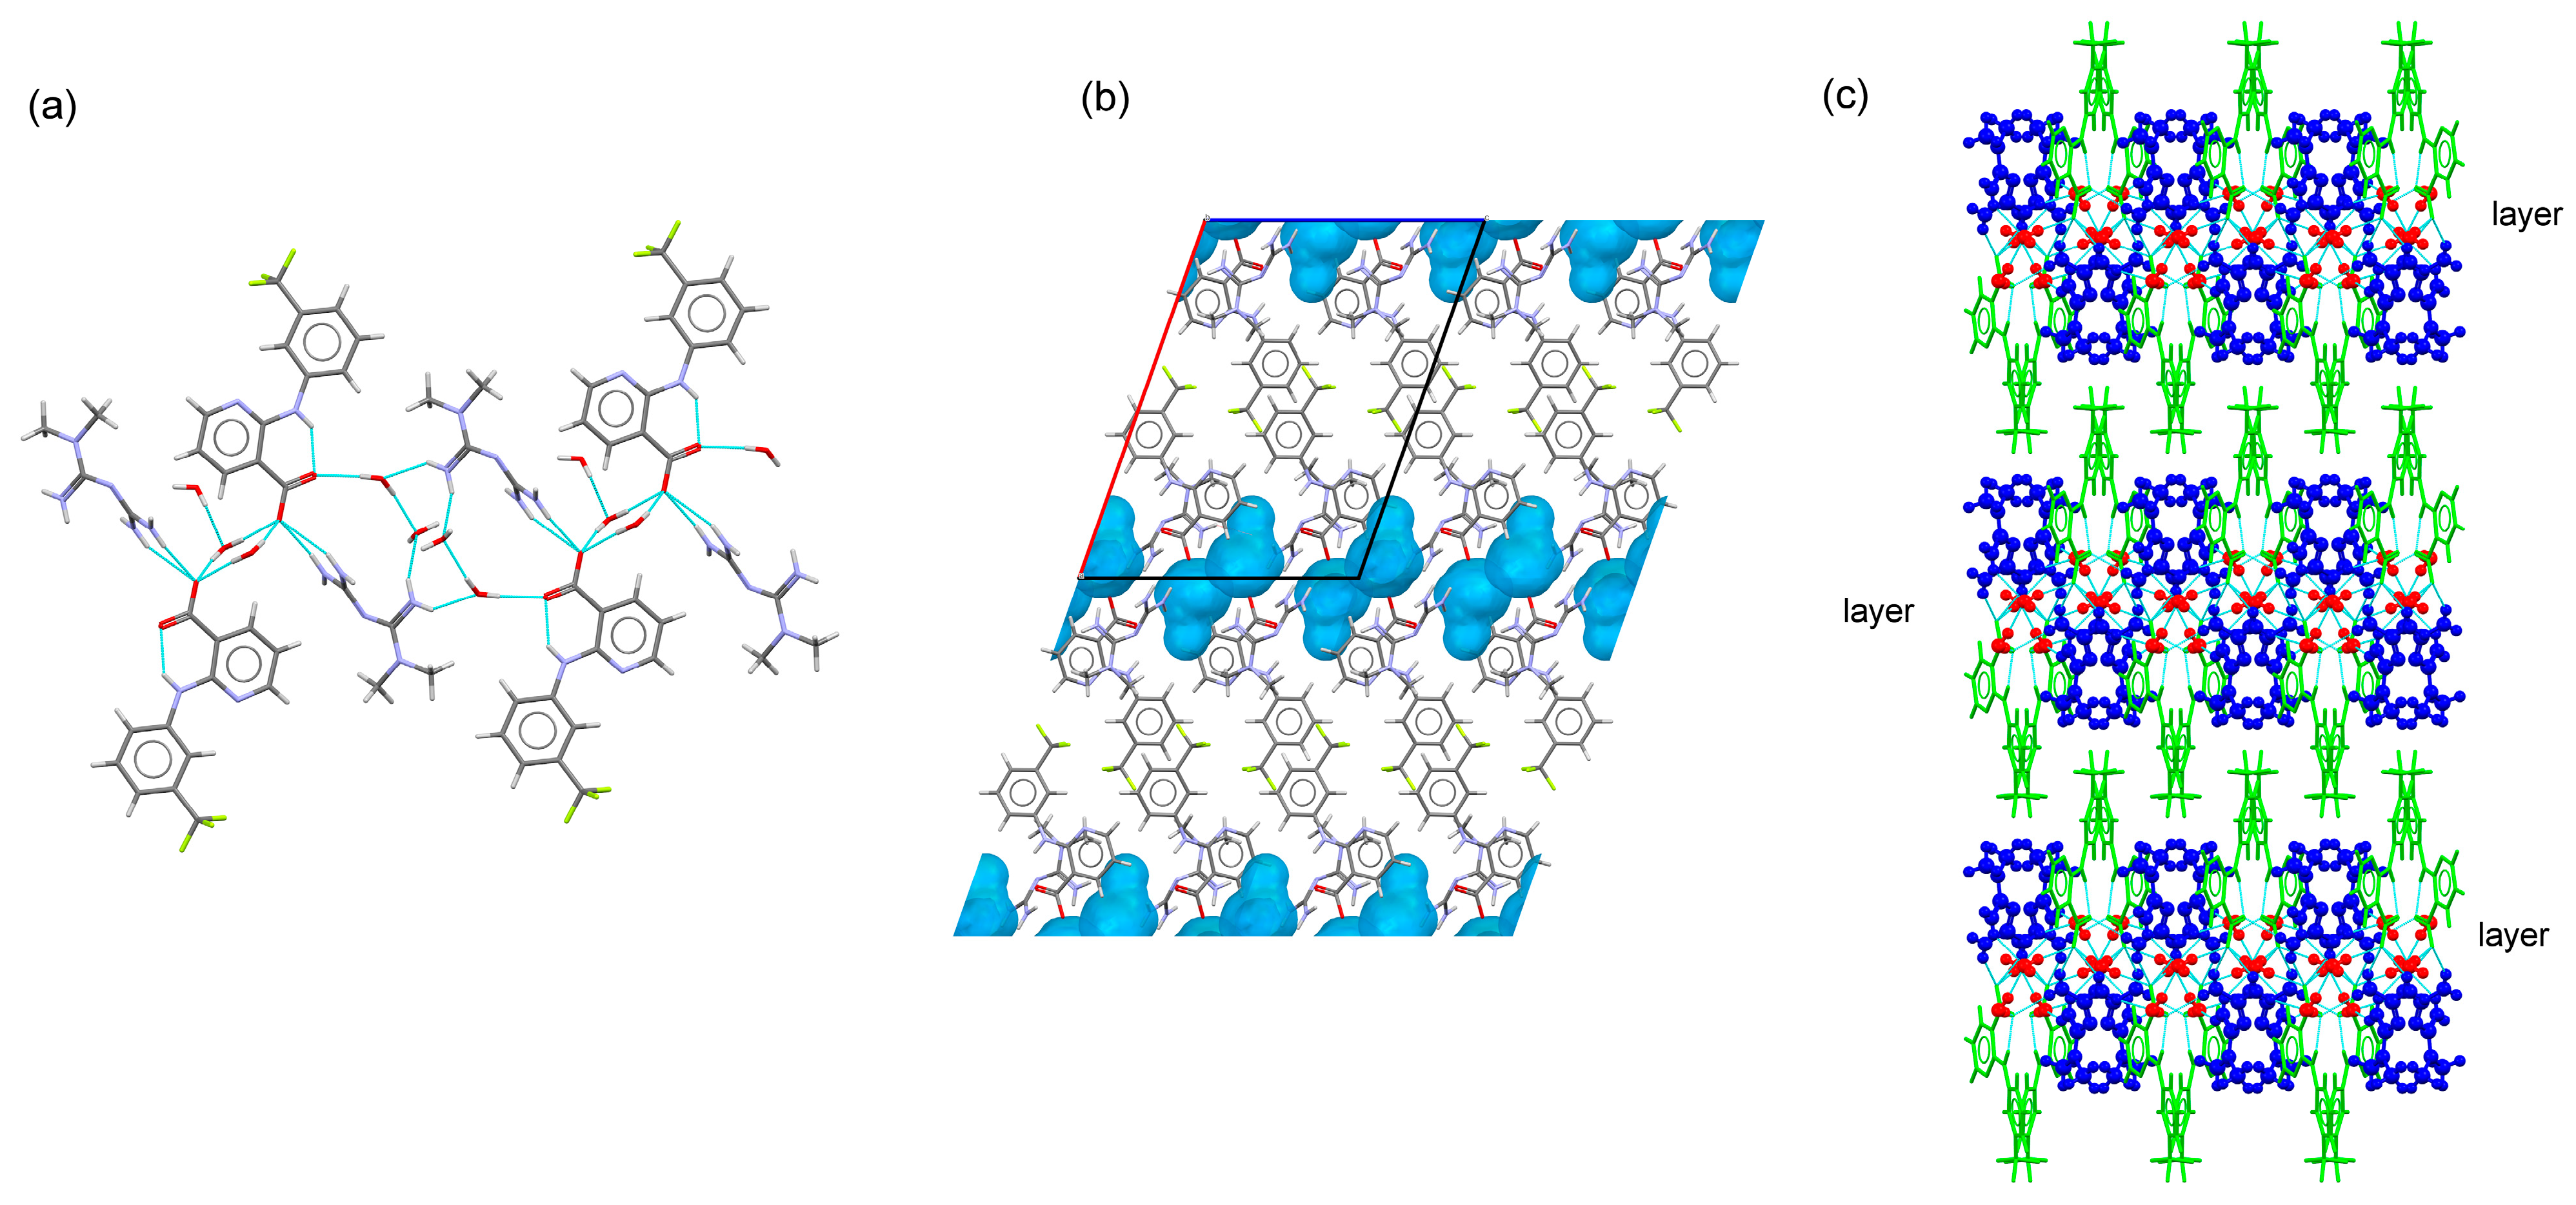
3.3.3. MTF–DIF Salt
3.3.4. MTF–FLP Salt
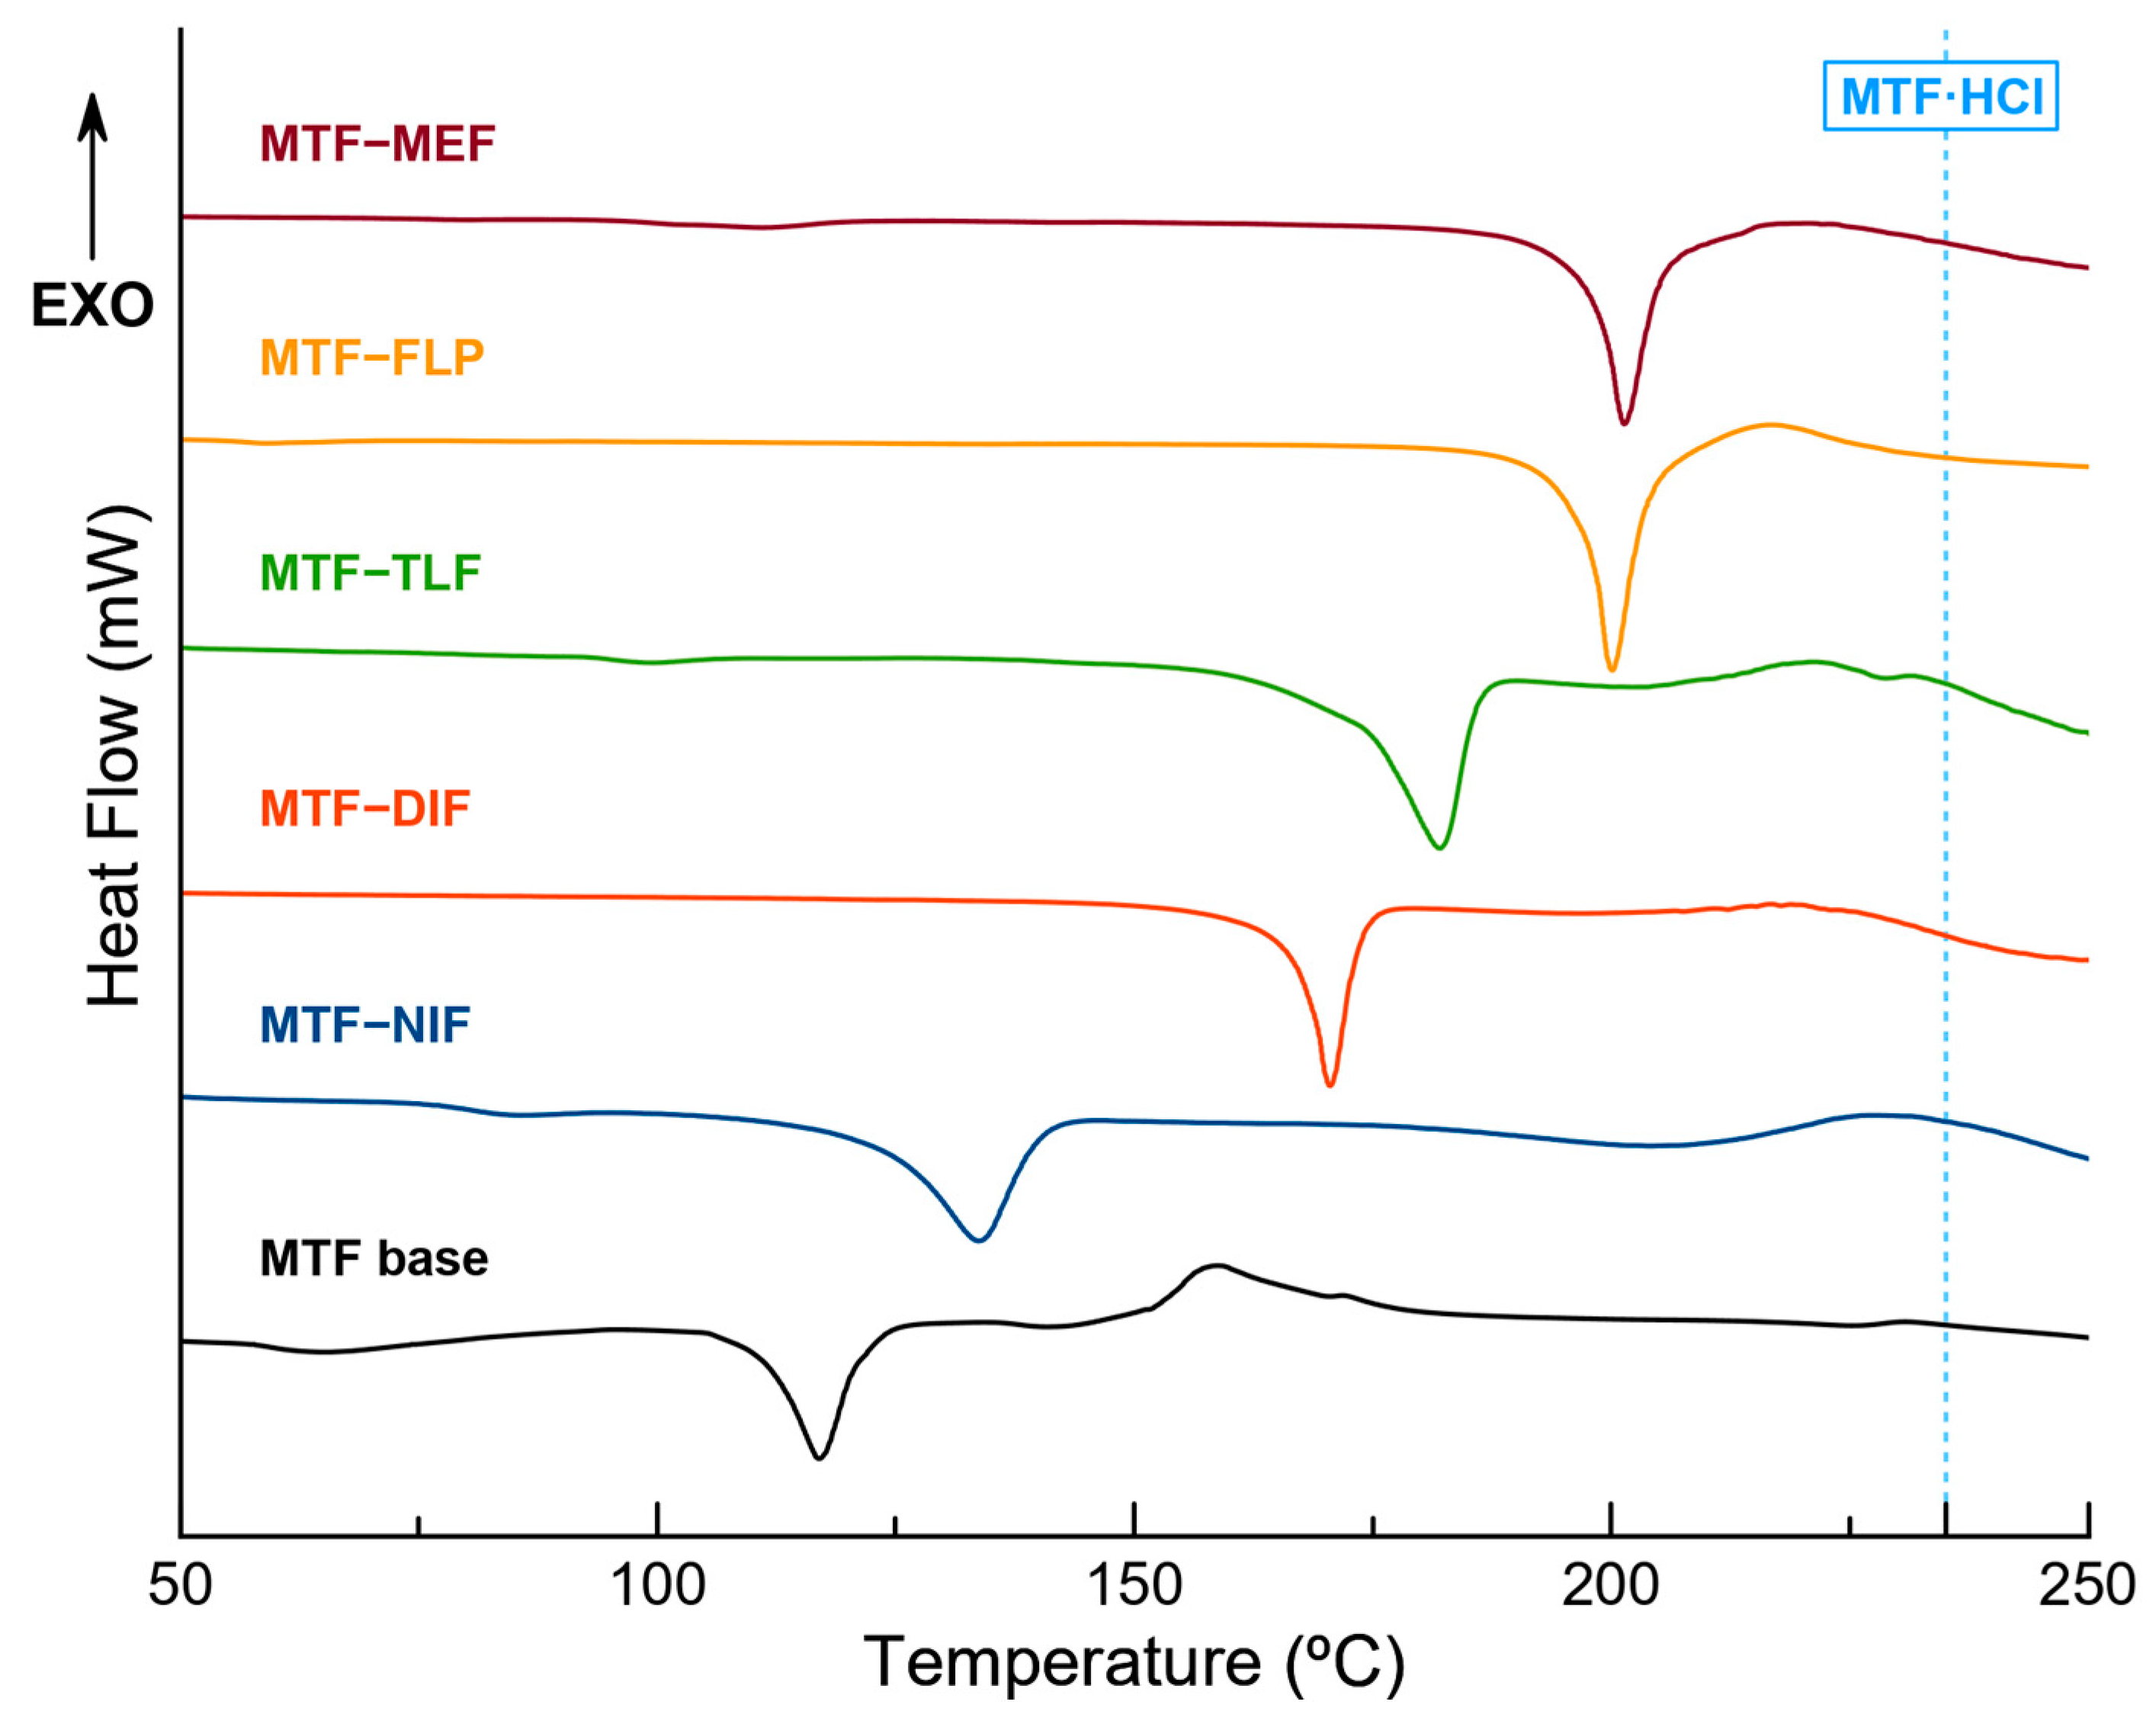
3.4. Thermal Analysis
3.5. Stability Studies
3.6. Solubility Studies

| Compound | MTF Solubility in the Salts [mg/mL] | NSAID Solubility in the Salts [mg/mL] | Solubility Enhancement over MTF·HCl/NSAID | NSAID Solubility [mg/mL] | Ref. |
|---|---|---|---|---|---|
| MTF–NIF·2H2O | 5.290 | 11.493 | 0.0212x/574x | <0.02 | [66] |
| MTF–FLP | 4.775 | 5.552 | 0.0191x/1110x | <0.005 | [67] |
| MTF–MEF | 3.185 | 5.950 | 0.0127x/119x | <0.05 | [68,69] |
| MTF–TLF | 2.740 | 10.397 | 0.0110x/208x | <0.05 | [68] |
4. Conclusions
Supplementary Materials
Author Contributions
Funding
Institutional Review Board Statement
Informed Consent Statement
Data Availability Statement
Acknowledgments
Conflicts of Interest
References
- World Health Organization (WHO) Diabetes. Available online: https://www.who.int/health-topics/diabetes#tab=tab_1 (accessed on 21 November 2022).
- International Diabetes Federation Diabetes. Available online: https://idf.org/ (accessed on 21 November 2022).
- Centers for Disease Control and Prevention. Type 2 Diabetes. Available online: https://www.cdc.gov/diabetes/basics/type2.html (accessed on 21 November 2022).
- U.S. Food and Drug Administration. (FDA) Approved Drug Products: Metformin; FDA: Silver Spring, MD, USA, 2018.
- Viollet, B.; Guigas, B.; Sanz Garcia, N.; Leclerc, J.; Foretz, M.; Andreelli, F. Cellular and Molecular Mechanisms of Metformin: An Overview. Clin. Sci. 2012, 122, 253. [Google Scholar] [CrossRef] [PubMed] [Green Version]
- Rena, G.; Hardie, D.G.; Pearson, E.R. The Mechanisms of Action of Metformin. Diabetologia 2017, 60, 1577. [Google Scholar] [CrossRef] [PubMed] [Green Version]
- Serajuddin, A.T.M. Salt Formation to Improve Drug Solubility. Adv. Drug Deliv. Rev. 2007, 59, 603–616. [Google Scholar] [CrossRef] [PubMed]
- Sun, X.; Du, S.; Sun, Y.; Li, H.; Yu, C.P.; Guo, J.; Wang, Y.; Yu, S.; Cheng, Y.; Xue, F. Solubility Measurement and Data Correlation of Metformin Hydrochloride in Four Aqueous Binary Solvents and Three Pure Solvents from 283.15 to 323.15 K. J. Chem. Eng. Data 2021, 66, 3282–3292. [Google Scholar] [CrossRef]
- Klepser, T.B.; Kelly, M.W. Metformin Hydrochloride: An Antihyperglycemic Agent. Am. J. Health Syst. Pharm. 1997, 54, 893–903. [Google Scholar] [CrossRef] [PubMed]
- Bretnall, A.A.; Clarke, G.S. Analytical Profiles of Drug Substances and Excipients; Brittain, H., Ed.; Academic Press: Millbrae, CA, USA, 1998; Volume 25. [Google Scholar]
- Nicklin, P.; Keates, A.C.; Page, T.; Bailey, C.J. Transfer of Metformin across Monolayers of Human Intestinal Caco-2 Cells and across Rat Intestine. Int. J. Pharm. 1996, 128, 155–162. [Google Scholar] [CrossRef]
- McCreight, L.J.; Bailey, C.J.; Pearson, E.R. Metformin and the Gastrointestinal Tract. Diabetologia 2016, 59, 426–435. [Google Scholar] [CrossRef] [PubMed] [Green Version]
- Wilcock, C.; Bailey, C.J. Accumulation of Metformin by Tissues of the Normal and Diabetic Mouse. Xenobiotica 1994, 24, 49–57. [Google Scholar] [CrossRef] [PubMed]
- Council of Europe (Ed.) European Pharmacopeia, 9th ed.; Council of Europe: Strasbourg, France, 2016. [Google Scholar]
- Hamdan, I.I.; Jaber, A.K.B.; Abushoffa, A.M. Development and Validation of a Stability Indicating Capillary Electrophoresis Method for the Determination of Metformin Hydrochloride in Tablets. J. Pharm. Biomed. Anal. 2010, 53, 1254–1257. [Google Scholar] [CrossRef] [PubMed]
- Gumieniczek, A.; Berecka-Rycerz, A.; Mroczek, T.; Wojtanowski, K. Determination of Chemical Stability of Two Oral Antidiabetics, Metformin and Repaglinide in the Solid State and Solutions Using LC-UV, LC-MS, and FT-IR Methods. Molecules 2019, 24, 4430. [Google Scholar] [CrossRef] [PubMed] [Green Version]
- Inzucchi, S.E.; Bergenstal, R.M.; Buse, J.B.; Diamant, M.; Ferrannini, E.; Nauck, M.; Peters, A.L.; Tsapas, A.; Wender, R.; Matthews, D.R. Management of Hyperglycaemia in Type 2 Diabetes: A Patient-Centered Approach. Position Statement of the American Diabetes Association (ADA) and the European Association for the Study of Diabetes (EASD). Diabetologia 2012, 55, 1577–1596. [Google Scholar] [CrossRef] [PubMed]
- NHS Non-Steroidal Anti-Inflammmatory Drugs. Available online: https://www.southtees.nhs.uk/resources/information-for-adult-patients-prescribed-non-steroidal-antiinflammatory-drugs-for-pain/ (accessed on 29 December 2022).
- Schreiber, A.K.; Nones, C.F.; Reis, R.C.; Chichorro, J.G.; Cunha, J.M. Diabetic Neuropathic Pain: Physiopathology and Treatment. World J. Diabetes 2015, 6, 432. [Google Scholar] [CrossRef] [PubMed]
- Moore, R.A.; Chi, C.C.; Wiffen, P.J.; Derry, S.; Rice, A.S.C. Oral Nonsteroidal Anti-Inflammatory Drugs for Neuropathic Pain. Cochrane Database Syst. Rev. 2015, 10, CD010902. [Google Scholar] [CrossRef] [PubMed]
- Assan, R.; Heuclin, C.; Ganeval, D.; Bismuth, C.; George, J.; Girard, J.R. Metformin-Induced Lactic Acidosis in the Presence of Acute Renal Failure. Diabetologia 1977, 13, 211–217. [Google Scholar] [CrossRef] [PubMed] [Green Version]
- Vecchio, S.; Giampreti, A.; Petrolini, V.M.; Lonati, D.; Protti, A.; Papa, P.; Rognoni, C.; Valli, A.; Rocchi, L.; Rolandi, L.; et al. Metformin Accumulation: Lactic Acidosis and High Plasmatic Metformin Levels in a Retrospective Case Series of 66 Patients on Chronic Therapy. Clin. Toxicol. 2014, 52, 129–135. [Google Scholar] [CrossRef] [PubMed]
- Whelton, A. Nephrotoxicity of Nonsteroidal Anti-Inflammatory Drugs: Physiologic Foundations and Clinical Implications. Am. J. Med. 1999, 106, 13S–24S. [Google Scholar] [CrossRef] [PubMed]
- Chan, N.N.; Fauvel, N.J.; Feher, M.D. Non-Steroidal Anti-Inflammatory Drugs and Metformin: A Cause for Concern? Lancet 1998, 352, 201. [Google Scholar] [CrossRef] [PubMed]
- Berry, D.J.; Steed, J.W. Pharmaceutical Cocrystals, Salts and Multicomponent Systems; Intermolecular Interactions and Property Based Design. Adv. Drug Deliv. Rev. 2017, 117, 3–24. [Google Scholar] [CrossRef] [PubMed] [Green Version]
- Bruker APEX4. In APEX4 V2022.1; Bruker-AXS: Madison, WI, USA, 2022.
- Sheldrick, G.M. SHELXT—Integrated Space-Group and Crystal-Structure Determination. Acta Cryst. A 2015, 71, 3–8. [Google Scholar] [CrossRef] [Green Version]
- Sheldrick, G.M. Crystal Structure Refinement with SHELXL. Acta Cryst. C Struct. Chem. 2015, 71, 3–8. [Google Scholar] [CrossRef] [PubMed] [Green Version]
- Dolomanov, O.V.; Bourhis, L.J.; Gildea, R.J.; Howard, J.A.K.; Puschmann, H. OLEX2: A Complete Structure Solution, Refinement and Analysis Program. J. Appl. Cryst. 2009, 42, 339–341. [Google Scholar] [CrossRef]
- MacRae, C.F.; Sovago, I.; Cottrell, S.J.; Galek, P.T.A.; McCabe, P.; Pidcock, E.; Platings, M.; Shields, G.P.; Stevens, J.S.; Towler, M.; et al. Mercury 4.0: From Visualization to Analysis, Design and Prediction. J. Appl. Cryst. 2020, 53, 226–235. [Google Scholar] [CrossRef] [PubMed] [Green Version]
- Spek, A.L. Structure Validation in Chemical Crystallography. Acta Cryst. D Biol. Cryst. 2009, 65, 148–155. [Google Scholar] [CrossRef] [PubMed] [Green Version]
- Glomme, A.; März, J.; Dressman, J.B. Comparison of a Miniaturized Shake-Flask Solubility Method with Automated Potentiometric Acid/Base Titrations and Calculated Solubilities. J. Pharm. Sci. 2005, 94, 1–16. [Google Scholar] [CrossRef] [PubMed]
- Braga, D.; Maini, L.; Grepioni, F. Mechanochemical Preparation of Co-Crystals. Chem. Soc. Rev. 2013, 42, 7638–7648. [Google Scholar] [CrossRef] [PubMed]
- Jia, L.; Wu, S.; Gong, J. A Tolbutamide Metformin Salt Based on Antidiabetic Drug Combinations: Synthesis, Crystal Structure Analysis and Pharmaceutical Properties. Acta Cryst. C Struct. Chem 2019, 75, 1250–1258. [Google Scholar] [CrossRef] [PubMed] [Green Version]
- Bian, X.; Jiang, L.; Gan, Z.; Guan, X.; Zhang, L.; Cai, L.; Hu, X. A Glimepiride-Metformin Multidrug Crystal: Synthesis, Crystal Structure Analysis, and Physicochemical Properties. Molecules 2019, 24, 3786. [Google Scholar] [CrossRef] [PubMed] [Green Version]
- Bian, X.; Jiang, L.; Zhou, J.; Guan, X.; Wang, J.; Xiang, P.; Pan, J.; Hu, X. Improving Dissolution and Cytotoxicity by Forming Multidrug Crystals. Molecules 2020, 25, 1343. [Google Scholar] [CrossRef] [PubMed] [Green Version]
- Putra, O.D.; Furuishi, T.; Yonemochi, E.; Terada, K.; Uekusa, H. Drug-Drug Multicomponent Crystals as an Effective Technique to Overcome Weaknesses in Parent Drugs. Cryst. Growth Des. 2016, 16, 3577–3581. [Google Scholar] [CrossRef]
- Sun, J.; Jia, L.; Wang, M.; Liu, Y.; Li, M.; Han, D.; Gong, J. Novel Drug-Drug Multicomponent Crystals of Epalrestat-Metformin: Improved Solubility and Photostability of Epalrestat and Reduced Hygroscopicity of Metformin. Cryst. Growth Des. 2022, 22, 1005–1016. [Google Scholar] [CrossRef]
- Feng, W.Q.; Wang, L.Y.; Gao, J.; Zhao, M.Y.; Li, Y.T.; Wu, Z.Y.; Yan, C.W. Solid State and Solubility Study of a Potential Anticancer Drug-Drug Molecular Salt of Diclofenac and Metformin. J. Mol. Struct. 2021, 1234, 130166. [Google Scholar] [CrossRef]
- Pérez-Fernández, R.; Fresno, N.; Goya, P.; Elguero, J.; Menéndez-Taboada, L.; García-Granda, S.; Marco, C. Structure and Thermodynamical Properties of Metformin Salicylate. Cryst. Growth Des. 2013, 13, 1780–1785. [Google Scholar] [CrossRef]
- Zhou, W.-X.; Zhao, H.-W.; Chen, H.-H.; Zhang, Z.-Y.; Chen, D.-Y. Characterization of Drug–Drug Salt Forms of Metformin and Aspirin with Improved Physicochemical Properties. CrystEngComm 2019, 21, 3770–3773. [Google Scholar] [CrossRef]
- Johnson, S.L.; Rumon, K.A. Infrared Spectra of Solid 1:1 Pyridine-Benzoic Acid Complexes; the Nature of the Hydrogen Bond as a Function of the Acid-Base Levels in the Complex. J. Phys. Chem. 1965, 69, 74–86. [Google Scholar] [CrossRef]
- Tong, W.Q.; Whitesell, G. In Situ Salt Screening-A Useful Technique for Discovery Support and Preformulation Studies. Pharm. Dev. Technol. 1998, 3, 215–223. [Google Scholar] [CrossRef] [PubMed]
- Cruz-Cabeza, A.J. Acid-Base Crystalline Complexes and the PKa Rule. CrystEngComm 2012, 14, 6362–6365. [Google Scholar] [CrossRef]
- Verdugo-Escamilla, C.; Alarcón-Payer, C.; Acebedo-Martínez, F.J.; Domínguez-Martín, A.; Choquesillo-Lazarte, D. New Metformin-Citric Acid Pharmaceutical Molecular Salt: Improving Metformin Physicochemical Properties. Crystals 2022, 12, 1748. [Google Scholar] [CrossRef]
- Diniz, L.F.; Carvalho, P.S.; Gonçalves, J.E.; Diniz, R.; Fernandes, C. Solid-State Landscape and Biopharmaceutical Implications of Novel Metformin-Based Salts. New J. Chem. 2022, 46, 13725–13737. [Google Scholar] [CrossRef]
- Jones, O.A.H.; Voulvoulis, N.; Lester, J.N. Aquatic Environmental Assessment of the Top 25 English Prescription Pharmaceuticals. Water Res. 2002, 36, 5013–5022. [Google Scholar] [CrossRef] [PubMed]
- Avdeef, A. Solubility of Sparingly-Soluble Ionizable Drugs. Adv. Drug Deliv. Rev. 2007, 59, 568–590. [Google Scholar] [CrossRef] [PubMed]
- Pentikäinen, P.J.; Tokola, O.; Alhava, E.; Penttilä, A. Pharmacokinetics of Tolfenamic Acid: Disposition in Bile, Blood and Urine after Intravenous Administration to Man. Eur. J. Clin. Pharmacol. 1984, 27, 349–354. [Google Scholar] [CrossRef] [PubMed]
- Wishart, D.S.; Feunang, Y.D.; Guo, A.C.; Lo, E.J.; Marcu, A.; Grant, J.R.; Sajed, T.; Johnson, D.; Li, C.; Sayeeda, Z.; et al. DrugBank 5.0: A Major Update to the DrugBank Database for 2018. Nucleic Acids Res. 2018, 46, D1074–D1082. [Google Scholar] [CrossRef] [PubMed]
- Somasundaram, S.; Rafi, S.; Hayllar, J.; Sigthorsson, G.; Jacob, M.; Price, A.B.; Macpherson, A.; Mahmod, T.; Scott, D.; Wrigglesworth, J.M.; et al. Mitochondrial Damage: A Possible Mechanism of the “topical” Phase of NSAID Induced Injury to the Rat Intestine. Gut 1997, 41, 344–353. [Google Scholar] [CrossRef] [PubMed]
- ChemAxon MarvinSketch 2020. Available online: https://chemaxon.com/marvin (accessed on 29 December 2022).
- Childs, S.L.; Stahly, G.P.; Park, A. The Salt-Cocrystal Continuum: The Influence of Crystal Structure on Ionization State. Mol. Pharm. 2007, 4, 323–338. [Google Scholar] [CrossRef] [Green Version]
- Etter, M.C.; MacDonald, J.C.; Bernstein, J. Graph-Set Analysis of Hydrogen-Bond Patterns in Organic Crystals. Acta Cryst. B 1990, 46, 256–262. [Google Scholar] [CrossRef]
- Etter, M.C. Encoding and Decoding Hydrogen-Bond Patterns of Organic Compounds. Acc. Chem. Res. 1990, 23, 120–126. [Google Scholar] [CrossRef]
- Kálmán, A.; Párkányi, L.; Argay, G. Classification of the Isostructurality of Organic Molecules in the Crystalline State. Acta Cryst. Sect. B 1993, 49, 1039–1049. [Google Scholar] [CrossRef]
- Oliveira, M.A.; Peterson, M.L.; Klein, D. Continuously Substituted Solid Solutions of Organic Co-Crystals. Cryst. Growth Des. 2008, 8, 4487–4493. [Google Scholar] [CrossRef]
- Perlovich, G. Melting Points of One- and Two-Component Molecular Crystals as Effective Characteristics for Rational Design of Pharmaceutical Systems. Acta Cryst. B Struct. Sci. Cryst. Eng. Mater. 2020, 76, 696–706. [Google Scholar] [CrossRef]
- Sathisaran, I.; Dalvi, S.V. Engineering Cocrystals of Poorlywater-Soluble Drugs to Enhance Dissolution in Aqueous Medium. Pharmaceutics 2018, 10, 108. [Google Scholar] [CrossRef] [Green Version]
- Varshosaz, J.; Ghassami, E.; Ahmadipour, S. Crystal Engineering for Enhanced Solubility and Bioavailability of Poorly Soluble Drugs. Curr. Pharm. Des. 2018, 24, 2473–2496. [Google Scholar] [CrossRef] [PubMed]
- Patel, J.N.; Rathod, D.M.; Patel, N.A.; Modasiya, M.K. Techniques to Improve the Solubility of Poorly Soluble Drugs. Int. J. Pharm. Life Sci. 2012, 3, 1459–1469. [Google Scholar]
- Cheng, C.L.; Yu, L.X.; Lee, H.L.; Yang, C.Y.; Lue, C.S.; Chou, C.H. Biowaiver Extension Potential to BCS Class III High Solubility-Low Permeability Drugs: Bridging Evidence for Metformin Immediate-Release Tablet. Eur. J. Pharm. Sci. 2004, 22, 297–304. [Google Scholar] [CrossRef] [PubMed]
- Kim, D.W.; Park, J.B. Development and Pharmaceutical Approach for Sustained-Released Metformin Succinate Tablets. J. Drug Deliv. Sci. Technol. 2015, 30, 90–99. [Google Scholar] [CrossRef]
- Gould, P.L. Salt Selection for Basic Drugs. Int. J. Pharm. 1986, 33, 201–217. [Google Scholar] [CrossRef]
- Putra, O.D.; Umeda, D.; Fujita, E.; Haraguchi, T.; Uchida, T.; Yonemochi, E.; Uekusa, H. Solubility Improvement of Benexate through Salt Formation Using Artificial Sweetener. Pharmaceutics 2018, 10, 64. [Google Scholar] [CrossRef] [Green Version]
- Kim, S.; Chen, J.; Cheng, T.; Gindulyte, A.; He, J.; He, S.; Li, Q.; Shoemaker, B.A.; Thiessen, P.A.; Yu, B.; et al. PubChem in 2021: New Data Content and Improved Web Interfaces. Nucleic Acids Res. 2021, 49, D1388–D1395. [Google Scholar] [CrossRef]
- Oh, D.H.; Park, Y.J.; Kang, J.H.; Yong, C.S.; Choi, H.G. Physicochemical Characterization and in Vivo Evaluation of Flurbiprofen-Loaded Solid Dispersion without Crystalline Change. Drug Deliv. 2011, 18, 46–53. [Google Scholar] [CrossRef]
- Avdeef, A.; Bendels, S.; Tsinman, O.; Tsinman, K.; Kansy, M. Solubility-Excipient Classification Gradient Maps. Pharm. Res. 2007, 24, 530–545. [Google Scholar] [CrossRef]
- Gao, L.; Zheng, W.Y.; Yang, W.L.; Zhang, X.R. Drug-Drug Salt Forms of Vortioxetine with Mefenamic Acid and Tolfenamic Acid. J. Mol. Struct. 2022, 1268, 133725. [Google Scholar] [CrossRef]


| APIs | Reported pKa Values | References | Calculated pKa Values * | Calculated MTF-NSAID ΔpKa |
|---|---|---|---|---|
| Metformin | 12.4 | [47] | 12.30 | - |
| Mefenamic Acid | 3.93 | [48] | 3.89 | 8.41 |
| Tolfenamic Acid | 4.3 | [49] | 3.88 | 8.42 |
| Niflumic acid | 1.88 | [50] | 1.88 | 10.42 |
| Diflunisal | 2.69 | [50] | 2.69 | 9.61 |
| Flurbiprofen | 4.2 | [51] | 4.42 | 7.88 |
| Compound Name | MFT–MEF | MFT–TLF | MFT–NIF | MFT–NIF·2H2O | MTF–DIF | MFT–FLP |
|---|---|---|---|---|---|---|
| Formula | C19H26N6O2 | C18H23ClN6O2 | C17H20F3N7O2 | C17H24F3N7O4 | C17H19F2N5O3 | C19H24FN5O2 |
| Formula weight | 370.46 | 390.87 | 411.40 | 447.43 | 379.37 | 373.43 |
| Crystal system | Monoclinic | Monoclinic | Monoclinic | Monoclinic | Monoclinic | Triclinic |
| Space group | P21/c | P21/c | P21/n | P21/c | C2/c | P-1 |
| a/Å | 15.5701(19) | 15.5584(15) | 6.2011(16) | 19.9296(15) | 36.998(2) | 8.7587(5) |
| b/Å | 8.7141(11) | 8.7072(8) | 32.216(8) | 7.9245(6) | 6.7220(5) | 10.5391(7) |
| c/Å | 16.239(2) | 16.3668(16) | 9.846(3) | 14.6836(11) | 15.0427(9) | 10.5990(6) |
| α/° | 90 | 90 | 90 | 90 | 90 | 90.265(2) |
| β/° | 116.408(4) | 117.919(4) | 101.051(13) | 109.362(4) | 104.981(3) | 96.217(2) |
| γ/° | 90 | 90 | 90 | 90 | 90 | 94.624(2) |
| V/Å3 | 1973.4(4) | 1959.2(3) | 1930.6(8) | 2187.9(3) | 3614.0(4) | 969.37(10) |
| Z | 4 | 4 | 4 | 4 | 8 | 2 |
| Dc/g cm−3 | 1.247 | 1.325 | 1.415 | 1.358 | 1.394 | 1.279 |
| F(000) | 792 | 824 | 856 | 936 | 1584 | 398 |
| Reflections collected | 20,802 | 19,113 | 19,888 | 17,437 | 18,152 | 14,188 |
| Unique reflections | 3509 | 3452 | 3396 | 3853 | 3155 | 3366 |
| Data/ restraints/parameters | 3509/0/251 | 3452/0/248 | 3396/0/264 | 3853/0/288 | 3155/5/258 | 3366/0/248 |
| Goodness-of-fit on F2 | 1.053 | 1.048 | 1.036 | 1.026 | 1.037 | 1.068 |
| R1 (I > 2σ(I)) | 0.0398 | 0.0477 | 0.0640 | 0.0633 | 0.0380 | 0.0551 |
| wR2 (I > 2σ(I)) | 0.1153 | 0.1315 | 0.1758 | 0.1673 | 0.1044 | 0.1622 |
Disclaimer/Publisher’s Note: The statements, opinions and data contained in all publications are solely those of the individual author(s) and contributor(s) and not of MDPI and/or the editor(s). MDPI and/or the editor(s) disclaim responsibility for any injury to people or property resulting from any ideas, methods, instructions or products referred to in the content. |
© 2023 by the authors. Licensee MDPI, Basel, Switzerland. This article is an open access article distributed under the terms and conditions of the Creative Commons Attribution (CC BY) license (https://creativecommons.org/licenses/by/4.0/).
Share and Cite
Acebedo-Martínez, F.J.; Domínguez-Martín, A.; Alarcón-Payer, C.; Garcés-Bastida, C.; Verdugo-Escamilla, C.; Gómez-Morales, J.; Choquesillo-Lazarte, D. Metformin-NSAIDs Molecular Salts: A Path towards Enhanced Oral Bioavailability and Stability. Pharmaceutics 2023, 15, 449. https://0-doi-org.brum.beds.ac.uk/10.3390/pharmaceutics15020449
Acebedo-Martínez FJ, Domínguez-Martín A, Alarcón-Payer C, Garcés-Bastida C, Verdugo-Escamilla C, Gómez-Morales J, Choquesillo-Lazarte D. Metformin-NSAIDs Molecular Salts: A Path towards Enhanced Oral Bioavailability and Stability. Pharmaceutics. 2023; 15(2):449. https://0-doi-org.brum.beds.ac.uk/10.3390/pharmaceutics15020449
Chicago/Turabian StyleAcebedo-Martínez, Francisco Javier, Alicia Domínguez-Martín, Carolina Alarcón-Payer, Carolina Garcés-Bastida, Cristóbal Verdugo-Escamilla, Jaime Gómez-Morales, and Duane Choquesillo-Lazarte. 2023. "Metformin-NSAIDs Molecular Salts: A Path towards Enhanced Oral Bioavailability and Stability" Pharmaceutics 15, no. 2: 449. https://0-doi-org.brum.beds.ac.uk/10.3390/pharmaceutics15020449