
Design Space and Control Strategy for the Manufacturing of Wet Media Milled Drug Nanocrystal Suspensions by Adopting Mechanistic Process Modeling

Abstract
:
1. Introduction
- Low impact: Models used to support product and/or process development.
- Medium impact: Models used for product quality assurance, but in combination with other indicators of quality.
- High impact: Models whose predictions are the main indicators of product quality.
- Material attributes of input components, e.g., drug particle size, stabilizer quality.
- Equipment parameters, e.g., agitator material, mesh size of sieve cartridge.
- Set process parameters, e.g., agitator shaft speed, pump speed, cooling-liquid temperature into grinding chamber jacket.
- Resulting actual process parameters, e.g., nanocrystal suspension temperature.
- Resulting cumulative process parameters, e.g., milling time.
- In-process quality control measurements, e.g., nanocrystal particle size.
2. Materials and Methods
2.1. Materials
2.2. Experimental Methods
2.3. Analytical Methods
2.4. Process Models
2.4.1. Mechanistic Process Model
2.4.2. Energy Balance
3. Results and Discussion
3.1. Experimental Design
- Material attributes, including input drug substance; the stabilizer and water of the suspension and their formulation composition; and the liquid for the mechanical seal.
- Equipment parameters, including the agitator shaft material, grinding chamber liner material, and sieve cartridge mesh size.
- Process parameters, including grinding media material, diameter and fill level in the grinding chamber, agitator shaft speed, suspension volume flow, grinding chamber cooling-liquid volume flow and temperature, suspension inlet temperature into the grinding chamber, and suspension outlet temperature from the grinding chamber.
- Potential critical quality attributes of the nanocrystal suspensions relevant for down-streaming and the final drug product, e.g., assay, solid form, impurities, particle size distribution, pH, density, zeta-potential, viscosity, wear from grinding media, lining and agitator shaft in chemical composition and quantity.
- Experimental results from formulation and process development at the laboratory/pilot scale.
- Mechanistic process models for the wet media milling process and the energy balance of the suspension in the grinding chamber (see Section 2.4.1 and Section 2.4.2).
- Established risk assessment for the experimental setup at a commercial scale.
- Process efficiency, flexibility, simplicity, robustness, and integration within the drug-product commercial manufacturing process.
- Demands and constraints of the entire process of drug-substance and drug-product development and clinical supplies.
3.2. Experimental Results
3.3. Design Space
- Experimental results at commercial manufacturing setup—see Section 3.2.
- Mechanistic process models for the wet media milling process and the energy balance of the suspension in the grinding chamber—see Section 2.4.1 and Section 2.4.2.
- Established CQAs for the nanocrystal suspension and the final drug product.
- Updated risk assessment for the commercial manufacturing process.
3.4. Control Strategy
4. Conclusions
Author Contributions
Funding
Institutional Review Board Statement
Informed Consent Statement
Data Availability Statement
Acknowledgments
Conflicts of Interest
References
- Kesisoglou, F.; Panmai, S.; Wu, Y. Nanosizing—Oral formulation development and biopharmaceutical evaluation. Adv. Drug Delivery Rev. 2007, 59, 631–644. [Google Scholar] [CrossRef]
- Liversidge, E.M.; Liversidge, G.G.; Cooper, E.R. Nanosizing: A formulation approach for poorly-water-soluble compounds. Eur. J. Pharm. Sci. 2003, 18, 113–120. [Google Scholar] [CrossRef]
- Merisko-Liversidge, E.; Liversidge, G.G. Nanosizing for oral and parenteral drug delivery: A perspective on formulating poorly-water soluble compounds using wet media milling technology. Adv. Drug Delivery Rev. 2011, 63, 427–440. [Google Scholar] [CrossRef]
- Pinar, S.G.; Oktay, A.N.; Karakücük, A.E.; Celebi, N. Formulation strategies of nanosuspensions for various administration routes. Pharmaceutics 2023, 15, 1520. [Google Scholar] [CrossRef]
- Rabinow, B.R. Nanosuspensions in drug delivery. Nat. Rev. Drug Discovery 2004, 3, 785–795. [Google Scholar] [CrossRef]
- Shah, D.A.; Murdande, S.B.; Dave, R.H. A review: Pharmaceutical and pharmacokinetic aspect of nanocrystalline suspensions. J. Pharm. Sci. 2016, 105, 10–24. [Google Scholar] [CrossRef]
- Wong, J.; Brugger, A.; Khare, A.; Chaubal, M.; Papadopoulos, P.; Rabinow, B.; Kipp, J.; Ning, J. Suspensions for intravenous (IV) injection: A review of development, preclinical and clinical aspects. Adv. Drug Delivery Rev. 2008, 60, 939–954. [Google Scholar] [CrossRef]
- Chen, M.L.; John, M.; Lee, S.L.; Tyner, K.M. Development considerations for nanocrystal drug products. AAPS J. 2017, 19, 642–651. [Google Scholar] [CrossRef]
- Dhaval, M.; Makwana, J.; Sakariya, E.; Dudhat, K. Drug nanocrystals: A comprehensive review with current regulatory guidelines. Curr. Drug Deliv. 2020, 17, 470–482. [Google Scholar] [CrossRef]
- Hagedorn, M.; Liebich, L.; Bögershausen, A.; Massing, U.; Hoffmann, S.; Mende, S.; Rischer, M. Rapid development of API nano-formulations from screening to production combining dual centrifugation and wet agitator bead milling. Int. J. Pharm. 2019, 565, 187–198. [Google Scholar] [CrossRef]
- Li, M.; Azad, M.; Dave, R.; Bilgili, E. Nanomilling of drugs for bioavailability enhancement: A holistic formulation-process perspective. Pharmaceutics 2016, 8, 17. [Google Scholar] [CrossRef]
- Malamatari, M.; Taylor, K.M.G.; Malamataris, S.; Douroumis, D.; Kachrimanis, K. Pharmaceutical nanocrystals: Production by wet milling and applications. Drug Discov. Today 2018, 23, 534–547. [Google Scholar] [CrossRef]
- Möschwitzer, J.P. Drug nanocrystals in the commercial pharmaceutical development process. Int. J. Pharm. 2013, 453, 142–156. [Google Scholar] [CrossRef]
- Peltonen, L.; Hirvonen, J. Drug nanocrystals—Versatile option for formulation of poorly soluble materials. Int. J. Pharm. 2018, 537, 73–83. [Google Scholar] [CrossRef]
- Tian, Y.; Wang, S.; Yu, Y.; Sun, W.; Fan, R.; Shi, J.; Gu, W.; Wang, Z.; Zhang, H.; Zheng, A. Review of nanosuspension formulation and process analysis in wet media milling using microhydrodynamic model and emerging characterization methods. Int. J. Pharm. 2022, 623, 121862. [Google Scholar] [CrossRef]
- International Conference on Harmonization of Technical Requirements for Registration of Pharmaceuticals for Human Use, ICH Harmonised Tripartite Guideline—Pharmaceutical Quality System Q10. 2008. Available online: https://database.ich.org/sites/default/files/Q10%20Guideline.pdf (accessed on 26 January 2024).
- International Conference on Harmonization of Technical Requirements for Registration of Pharmaceuticals for Human Use, ICH Harmonised Tripartite Guideline—Pharmaceutical Development Q8(R2). 2009. Available online: https://database.ich.org/sites/default/files/Q8%28R2%29%20Guideline.pdf (accessed on 26 January 2024).
- International Conference on Harmonization of Technical Requirements for Registration of Pharmaceuticals for Human Use, ICH Harmonised Guideline—Quality Risk Management Q9(R2). 2023. Available online: https://database.ich.org/sites/default/files/ICH_Q9%28R1%29_Guideline_Step4_2023_0126_0.pdf (accessed on 26 January 2024).
- International Conference on Harmonization of Technical Requirements for Registration of Pharmaceuticals for Human Use, ICH Endorsed Guide for ICH Q8/Q9/Q10 Implementation—Points to Consider (R2). 2011. Available online: https://database.ich.org/sites/default/files/Q8_Q9_Q10_Q%26As_R4_Points_to_Consider_2.pdf (accessed on 26 January 2024).
- International Conference on Harmonization of Technical Requirements for Registration of Pharmaceuticals for Human Use, ICH Harmonised Tripartite Guideline—Development and Manufacture of Drug Substances (Chemical Entities and Biotechnological/Biological Entities) Q11. 2012. Available online: https://database.ich.org/sites/default/files/Q11%20Guideline.pdf (accessed on 26 January 2024).
- International Conference on Harmonization of Technical Requirements for Registration of Pharmaceuticals for Human Use, ICH Harmonised Guideline—Technical and Regulatory Considerations for Pharmaceutical Product Lifecycle Management Q12. 2019. Available online: https://database.ich.org/sites/default/files/Q12_Guideline_Step4_2019_1119.pdf (accessed on 26 January 2024).
- Grangeia, H.B.; Silva, C.; Simões, S.P.; Reis, M.S. Quality by design in pharmaceutical manufacturing: A systematic review of current status, challenges and future perspectives. Eur. J. Pharm. Biopharm. 2020, 147, 19–37. [Google Scholar] [CrossRef]
- Kovács, B.; Péterfi, O.; Kovács-Deák, B.; Székely-Szentmiklósi, I.; Fülöp, I.; Bába, L.I.; Boda, F. Quality-by-design in pharmaceutical development: From current perspectives to practical applications. Acta Pharm. 2021, 71, 497–526. [Google Scholar] [CrossRef]
- Zlota, A.A. Recommendations for effective and defendable implementation of quality by design. Org. Process Res. Dev. 2022, 26, 899–914. [Google Scholar] [CrossRef]
- Simões, A.; Veiga, F.; Vitorino, C. Question-based review for pharmaceutical development: An enhanced quality approach. Eur. J. Pharm. Biopharm. 2024, 195, 114174. [Google Scholar] [CrossRef]
- Yu, L.X.; Amidon, G.; Khan, M.A.; Hoag, S.W.; Polli, J.; Raju, G.K.; Woodcock, J. Understanding pharmaceutical quality by design. AAPS J. 2014, 16, 771–783. [Google Scholar] [CrossRef]
- Kourti, T. Pharmaceutical manufacturing: The role of multivariate analysis in design space, control strategy, process understanding, troubleshooting, and optimization. In Chemical Engineering in the Pharmaceutical Industry: Drug Product Design, Development, and Modeling, 2nd ed.; Am Ende, M.T., am Ende, D.J., Eds.; John Wiley & Sons: Hoboken, NJ, USA, 2019; pp. 601–629. [Google Scholar] [CrossRef]
- Destro, F.; Barolo, M. A review on the modernization of pharmaceutical development and manufacturing—Trends, perspectives, and the role of mathematical modeling. Int. J. Pharm. 2022, 620, 121715. [Google Scholar] [CrossRef]
- Hsiao, W.K.; Hörmann, T.R.; Toson, P.; Paudel, A.; Ghiotti, P.; Stauffer, F.; Bauer, F.; Lakio, S.; Behrend, O.; Maurer, R.; et al. Feeding of particle-based materials in continuous solid dosage manufacturing: A material science perspective. Drug Discov. Today 2020, 25, 800–806. [Google Scholar] [CrossRef]
- Liu, B.; Wang, J.; Zeng, J.; Zhao, L.; Wang, Y.; Feng, Y.; Du, R. A review of high shear wet granulation for better process understanding, control and product development. Powder Technol. 2021, 381, 204–223. [Google Scholar] [CrossRef]
- Nandi, U.; Trivedi, V.; Ross, S.A.; Douroumis, D. Advances in twin-screw granulation processing. Pharmaceutics 2021, 13, 624. [Google Scholar] [CrossRef]
- Russell, A.; Strong, J.; Garner, S.; Ketterhagen, W.; Long, M.; Capece, M. Direct compaction drug product process modeling. AAPS PharmSciTech 2022, 23, 67. [Google Scholar] [CrossRef]
- Jog, R.; Burgess, D.J. Comprehensive quality by design approach for stable nanocrystalline drug products. Int. J. Pharm. 2019, 564, 426–460. [Google Scholar] [CrossRef]
- Patel, P.J.; Gajera, B.Y.; Dave, R.H. A quality-by-design study to develop Nifedipine nanosuspension: Examining the relative impact of formulation variables, wet media milling process parameters and excipient variability on drug product quality attributes. Drug Dev. Ind. Pharm. 2018, 44, 1942–1952. [Google Scholar] [CrossRef]
- Peltonen, L. Design space and QbD approach for production of drug nanocrystals by wet media milling techniques. Pharmaceutics 2018, 10, 104. [Google Scholar] [CrossRef]
- Kwade, A. Determination of the most important grinding mechanism in stirred media mills by calculating stress intensity and stress number. Powder Technol. 1999, 105, 14–20. [Google Scholar] [CrossRef]
- Kwade, A. Wet comminution in stirred media mills—research and its practical application. Powder Technol. 1999, 105, 382–388. [Google Scholar] [CrossRef]
- Kwade, A. A stressing model for the description and optimization of grinding processes. Chem. Eng. Technol. 2003, 26, 199–205. [Google Scholar] [CrossRef]
- Kwade, A. Mill selection and process optimization using a physical grinding model. Int. J. Miner. Process. 2004, 74, S93–S101. [Google Scholar] [CrossRef]
- Kwade, A.; Schwedes, J. Wet grinding in stirred media mills. In Handbook of Powder Technology; Salman, A.D., Ghadiri, M., Hounslow, M.J., Eds.; Elsevier B.V.: Amsterdam, The Netherlands, 2007; Volume 12, pp. 251–382. [Google Scholar] [CrossRef]
- Taylor, L.; Skuse, D.; Blackburn, S.; Greenwood, R. Stirred media mills in the mining industry: Material grindability, energy-size relationships, and operating conditions. Powder Technol. 2020, 369, 1–16. [Google Scholar] [CrossRef]
- Batzer, M.; Heck, C.; Michalowski, P.; Kwade, A. Current status of formulations and scalable processes for producing sulfidic solid-state batteries. Batter. Supercaps 2020, 5, e202200328. [Google Scholar] [CrossRef]
- Kwade, A.; Möller, M.; Müller, J.; Hesselbach, J.; Zellmer, S.; Doose, S.; Mayer, J.; Michalowski, P.; Powell, M.; Breitung-Faes, S. Comminution and classification as important process steps for the circular production of lithium batteries. KONA 2023, 40, 50–73. [Google Scholar] [CrossRef]
- Schlem, R.; Burmeister, C.F.; Michalowski, P.; Ohno, S.; Dewald, G.F.; Kwade, A.; Zeier, W.G. Energy storage materials for solid-state batteries: Design by mechanochemistry. Adv. Energy Mater. 2021, 11, 2101022. [Google Scholar] [CrossRef]
- Ali, M.; Lin, L. Optimisation and analysis of bead milling process for preparation of highly viscous, binder-free dispersions of carbon black pigment. Prog. Org. Coat. 2018, 119, 1–7. [Google Scholar] [CrossRef]
- Ohenoja, K.; Illikainen, M.; Niinimäki, J. Effect of operational parameters and stress energies on the particle size distribution of TiO2 pigment in stirred media milling. Powder Technol. 2013, 234, 91–96. [Google Scholar] [CrossRef]
- Breitung-Faes, S.; Kwade, A. Production of transparent suspensions by real grinding of fused corundum. Powder Technol. 2011, 212, 383–389. [Google Scholar] [CrossRef]
- Flach, F.; Breitung-Faes, S.; Kwade, A. Model based process optimization of nanosuspension preparation via wet stirred media milling. Powder Technol. 2018, 331, 146–154. [Google Scholar] [CrossRef]
- Flach, F.; Breitung-Faes, S.; Kwade, A. Scaling wet fine grinding processes of organic particles using stirred media mills. Chem. Ing. Tech. 2017, 89, 1051–1059. [Google Scholar] [CrossRef]
- Bilgili, E.; Guner, G. Mechanistic modeling of wet stirred media milling for production of drug nanosuspensions. AAPS PharmSciTech 2021, 22, 2. [Google Scholar] [CrossRef]
- Ter Horst, J.P.; Turimella, S.L.; Metsers, F.; Zwiers, A. Implementation of Quality by Design (QbD) principles in regulatory dossiers of medicinal products in the European Union (EU) between 2014 and 2019. Ther. Innovation Regul. Sci. 2021, 55, 583–590. [Google Scholar] [CrossRef]
- Watson, T.J.N.; Nosal, R.; Lepore, J.; Montgomery, F. Misunderstanding design space: A robust drug product control strategy is the key to quality assurance. J. Pharm. Innov. 2018, 13, 283–285. [Google Scholar] [CrossRef]
- International Conference on Harmonization of Technical Requirements for Registration of Pharmaceuticals for Human Use, ICH Harmonised Tripartite Guideline—Specifications: Test Procedures and Acceptance Criteria for New Drug Substances and New Drug Products: Chemical Substances Q6A. 1999. Available online: https://database.ich.org/sites/default/files/Q6A%20Guideline.pdf (accessed on 26 January 2024).


| Category | Attribute/Parameter | Range Investigated |
|---|---|---|
| Material attributes of input components | Drug substance chemical attributes, solid form, residual solvents, water content, impurities, etc.; drug substance concentration; stabilizer type and concentration; water quality and concentration for suspension; water quality and quantity for mechanical seal | Constant |
| Drug substance particle size | 4.2 μm ≤ x90,3 ≤ 7.6 μm | |
| Equipment parameters | Agitator shaft material and geometry; grinding chamber liner material and geometry; sieve cartridge material, geometry and mesh size; pump type and size; pump-tube type and size; vessel stirrer type and size | Constant |
| Vessel size, geometry and suspension fill level | Vessel size adapted to batch size with geometrically similar vessel design | |
| Set process parameters | Vessel cooling-liquid volume flow and temperature; mechanical seal cooling-liquid volume flow and temperature; grinding chamber cooling-liquid volume flow; grinding media material (ρGM), diameter (dGM) and quantity | Constant |
| Vessel stirred speed | Stirrer speed adapted to vessel size and batch size | |
| Cooling-liquid inlet temperature into grinding chamber jacket () | 8–10 °C | |
| Agitator shaft speed (ni) | 875–1225 rpm | |
| Suspension volume flow () | 5–20 L/min | |
| Suspension batch size (M) | 62–175 kg | |
| Resulting actual process parameters | Agitator shaft tip speed (vt,i); suspension mass flow (); suspension inlet temperature into grinding chamber (TS,in,i); suspension outlet temperature from grinding chamber (TS,out,i) | Measured process parameters |
| Resulting cumulative process parameters | Average stress energy (); Mass specific energy (EM); number of turnover cycles (N) | Calculated parameters according to Equations (3), (4) and (6) |
| In-process quality control | Mean particle size (xPCS); polydispersity index (PdI) | Measured quality attributes during processing and/or end of manufactured batch |
| Experiment No. | Material Attribute | Set Process Parameters | Resulting Process Parameters | Potential Critical Quality Attribute | |||||||
|---|---|---|---|---|---|---|---|---|---|---|---|
| x90,3 /μm | M /kg | n /rpm | /L/min | /°C | /°C | EM/kJ/kg | /μNm | N /- | xPCS /nm | PdI /- | |
| 1 | 4.8 | 82 | 1050 | 20 | 9 | 20 | 2186 | 0.88 | 169 | 127 | 0.10 |
| 2 | 4.9 | 62 | 1050 | 20 | 9 | 22 | 2795 | 0.88 | 232 | 119 | 0.12 |
| 3 | 5.4 | 62 | 1225 | 17 | 10 | 27 | 4007 | 1.17 | 213 | 111 | 0.13 |
| 4 | 5.0 | 82 | 875 | 13 | 8 | 18 | 2134 | 0.61 | 195 | 123 | 0.11 |
| 5 | 5.1 | 82 | 1050 | 5 | 10 | 23 | 2134 | 0.88 | 57 | 124 | 0.11 |
| 6 | 5.1 | 72 | 1050 | 17 | 8 | 22 | 2134 | 0.88 | 179 | 121 | 0.12 |
| 7 | 5.1 | 72 | 1050 | 19 | 10 | 21 | 2134 | 0.88 | 156 | 128 | 0.12 |
| 8 | 4.8 | 155 | 1050 | 16 | 9 | 24 | 2134 | 0.88 | 79 | 125 | 0.12 |
| 9 | 4.4 | 165 | 1050 | 16 | 9 | 21 | 2150 | 0.88 | 135 | 127 | 0.11 |
| 10 | 4.8 | 165 | 1050 | 16 | 9 | 21 | 2150 | 0.88 | 133 | 132 | 0.12 |
| 11 | 5.9 | 165 | 1050 | 16 | 9 | 21 | 2140 | 0.88 | 136 | 127 | 0.11 |
| 12 | 5.7 | 165 | 1050 | 16 | 9 | 21 | 2150 | 0.87 | 137 | 132 | 0.12 |
| 13 | 6.2 | 175 | 1050 | 16 | 9 | 20 | 640 | 0.87 | 36 | 174 | 0.11 |
| 14 | 6.6 | 175 | 1050 | 16 | 9 | 20 | 2400 | 0.87 | 143 | 129 | 0.11 |
| 15 | 7.6 | 175 | 1050 | 16 | 9 | 20 | 1400 | 0.87 | 80 | 144 | 0.12 |
| 16 | 5.3 | 175 | 1050 | 16 | 9 | 21 | 600 | 0.88 | 35 | 173 | 0.10 |
| 17 | 4.5 | 175 | 1050 | 16 | 9 | 21 | 2400 | 0.87 | 152 | 129 | 0.13 |
| 18 | 4.2 | 175 | 1050 | 16 | 9 | 20 | 1400 | 0.88 | 87 | 137 | 0.12 |
| 19 | 7.6 | 175 | 1050 | 16 | 9 | 22 | 1400 | 0.87 | 89 | 142 | 0.11 |
| 20 | 5.9 | 175 | 1050 | 16 | 9 | 21 | 1400 | 0.87 | 89 | 138 | 0.12 |
| 21 | 4.5 | 175 | 1050 | 16 | 9 | 21 | 600 | 0.87 | 37 | 172 | 0.07 |
| 22 | 5.1 | 175 | 1050 | 16 | 9 | 21 | 2400 | 0.87 | 156 | 127 | 0.11 |
| Category | Attribute/Parameter | Criticality | Control Strategy/Measure |
|---|---|---|---|
| Material attributes of input components | Drug substance chemical attributes, solid form, residual solvents, water content, impurities, etc.; Stabilizer type | No-CMA | CoA |
| Drug substance particle size | No-CMA | CoA (x90,3 ≤ 7.6 μm) | |
| Water quality for suspension and mechanical seal | No-CMA | Control procedure in plant | |
| Drug substance concentration; stabilizer concentration; water concentration for suspension; water quantity for mechanical seal; water quantity for mechanical seal | No-CMA | MBR/MES | |
| Equipment parameters | Agitator shaft material and geometry; grinding chamber liner material and geometry; sieve cartridge material, geometry and mesh size; pump type and size; pump-tube type and size; vessel size and geometry; vessel stirrer type and size | No-CPP | MBR/MES |
| Set process parameters | Grinding media material (ρGM) and diameter (dGM) | No-CPP | CoA, MBR/MES |
| Grinding media quantity, respectively fill level in grinding chamber | No-CPP | MBR/MES | |
| Vessel stirred speed; vessel cooling-liquid volume flow and temperature; mechanical seal cooling-liquid volume flow and temperature; grinding chamber cooling-liquid volume flow | No-CPP | MBR/MES, IPCS | |
| Cooling-liquid inlet temperature into grinding chamber jacket () | No-CPP | MBR/MES, IPCS (8 °C ≤ TC,in ≤ 13 °C) | |
| Agitator shaft speed (ni) | No-CPP | MBR/MES IPCS (875 rpm ≤ n ≤ 1215 rpm) | |
| Suspension volume flow () | No-CPP | MBR/MES, IPCS (5 L/min ≤ ≤ 20 L/min) | |
| Suspension batch size (M) | No-CPP | MBR/MES (62 ≤ M ≤ 175 kg) | |
| Resulting actual process parameters | Agitator shaft tip speed (vt,i); suspension mass flow (); suspension inlet temperature into grinding chamber (TS,in,i) | No-CPP | IPCS |
| Suspension outlet temperature from grinding chamber (TS,out,i) | No-CPP | MBR/MES, IPCS (18 °C ≤ TS,out,i ≤ 27 °C) | |
| Resulting cumulative process parameters | Average stress energy () | No-CPP | MBR/MES, IPCS (0.61 μNm ≤ ≤ 1.17 μNm) |
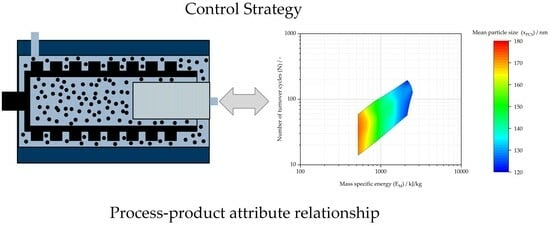
| Mass specific energy (EM) | CPP | MBR/MES, IPCS (see design space in Figure 7) | |
| Number of turnover cycles (N) | CPP | MBR/MES, IPCS (see design space in Figure 7) | |
| In-process quality control | Mean particle size (xPCS) | CQA | IPC (120 nm ≤ xPCS ≤ 180 nm) |
Disclaimer/Publisher’s Note: The statements, opinions and data contained in all publications are solely those of the individual author(s) and contributor(s) and not of MDPI and/or the editor(s). MDPI and/or the editor(s) disclaim responsibility for any injury to people or property resulting from any ideas, methods, instructions or products referred to in the content. |
© 2024 by the authors. Licensee MDPI, Basel, Switzerland. This article is an open access article distributed under the terms and conditions of the Creative Commons Attribution (CC BY) license (https://creativecommons.org/licenses/by/4.0/).
Share and Cite
Bitterlich, A.; Mihorko, A.; Juhnke, M. Design Space and Control Strategy for the Manufacturing of Wet Media Milled Drug Nanocrystal Suspensions by Adopting Mechanistic Process Modeling. Pharmaceutics 2024, 16, 328. https://0-doi-org.brum.beds.ac.uk/10.3390/pharmaceutics16030328
Bitterlich A, Mihorko A, Juhnke M. Design Space and Control Strategy for the Manufacturing of Wet Media Milled Drug Nanocrystal Suspensions by Adopting Mechanistic Process Modeling. Pharmaceutics. 2024; 16(3):328. https://0-doi-org.brum.beds.ac.uk/10.3390/pharmaceutics16030328
Chicago/Turabian StyleBitterlich, André, Andrej Mihorko, and Michael Juhnke. 2024. "Design Space and Control Strategy for the Manufacturing of Wet Media Milled Drug Nanocrystal Suspensions by Adopting Mechanistic Process Modeling" Pharmaceutics 16, no. 3: 328. https://0-doi-org.brum.beds.ac.uk/10.3390/pharmaceutics16030328