Article

A Scalable and Semantic Data as a Service Marketplace for Enhancing Cloud-Based Applications

by
Evangelos Psomakelis
1,2,*,
Anastasios Nikolakopoulos
1,
Achilleas Marinakis
1,
Alexandros Psychas
1,
Vrettos Moulos
1,
Theodora Varvarigou
1 and
Andreas Christou
1
1
School of Electrical and Computer Engineering, National Technical University of Athens, 15780 Athens, Greece
2
Department of Informatics and Telematics, Harokopio University of Athens, 17778 Athens, Greece
*
Author to whom correspondence should be addressed.
Future Internet 2020, 12(5), 77; https://0-doi-org.brum.beds.ac.uk/10.3390/fi12050077
Submission received: 31 March 2020 / Revised: 22 April 2020 / Accepted: 23 April 2020 / Published: 25 April 2020
(This article belongs to the Special Issue Network Cost Reduction in Cloud/Fog Computing Environments)

Abstract

:
Data handling and provisioning play a dominant role in the structure of modern cloud–fog-based architectures. Without a strict, fast, and deterministic method of exchanging data we cannot be sure about the performance and efficiency of transactions and applications. In the present work we propose an architecture for a Data as a Service (DaaS) Marketplace, hosted exclusively in a cloud environment. The architecture includes a storage management engine that ensures the Quality of Service (QoS) requirements, a monitoring component that enables real time decisions about the resources used, and a resolution engine that provides semantic data discovery and ranking based on user queries. We show that the proposed system outperforms the classic ElasticSearch queries in data discovery use cases, providing more accurate results. Furthermore, the semantic enhancement of the process adds extra results which extend the user query with a more abstract definition to each notion. Finally, we show that the real-time scaling, provided by the data storage manager component, limits QoS requirements by decreasing the latency of the read and write data requests.

1. Introduction

1.1. General Concepts

One of the most-used expressions regarding data-driven IT is “data are the new oil”. Given the gravity of this statement, many concepts and technologies have arisen in order to address the needs of this new era. More specifically, this paper revolves around two main concepts; Data as a Service (DaaS) and the Data Marketplace. In order to fully exploit the data produced by any given sector, there is a need to streamline the process of collection, storage, access, utilization and, finally, delivery to the end user. DaaS aims at creating a service-based model that will cover the complete lifecycle of the data through distributed interconnected services that address the requirements of each aforementioned step of the streamlined process. To better understand the involvement of DaaS in the lifecycle of data, it is important to mention the main characteristics of a DaaS solution. It is important that a DaaS solution can provide data and deliver them at different levels of granularity depending on the end users’ needs. Given the heterogeneity of the data delivered, even from a single data producer, it is necessary to be able to handle different data sources with different types of data in terms of content, schema, and type of delivery (e.g., streaming, batch). Network heterogeneity, as well as the addition and reduction of data sources, are strongly considered in this type of solution. Last but not least it is necessary to have a monitoring and evaluation mechanism in order to maintain the expected Quality of Service (QoS) and Quality of Data (QoD).
Despite the requirement coverage of the data lifecycle from the DaaS model, data still need to be discoverable and presented to the end user in a uniform way. The Data Marketplace concept aims at creating a marketplace in which users are able to discover data with the desired content and quality. In order to create a Data Marketplace, the most important step is to describe and deliver the data as a product. Converting data into a product is a procedure that is well defined by the DaaS model, as described in the previous paragraph. In order to sell data as product specific, metrics must derive from them. Potential buyers need to know the volume, cost, value, quality, and other important metrics that evaluate the data [1].
Although there is significant work on the conversion of data as a product in the context of Data Marketplaces (also described in Section 2), in many sectors (critical infrastructure, edge, cloud, and fog computing) the data are evolving in a direction where static data degenerate to hold no value. These types of sectors require a service-based model for data delivery in order to explore the huge amount of data that is created and processed in real time [2]. This new era of data has created the need for Data Marketplaces that not only deliver data as a product but most importantly create DaaS products [1].
DaaS product creation requires not only the definition of data as a product but also the definition of the service that delivers the data, as a product. The most important characteristic of the service that is needed to be identified and described in order to achieve this goal is the definition of the QoS of the service that delivers the data.
As far as the DaaS Marketplace is concerned the QoD metric production, as well as delivery, is firmly established. One of the less evolved procedures is the QoS part of the product creation. This paper aims at describing and establishing specific software components in order to enable the delivery of DaaS products.
The enhancements proposed in the context of the DaaS Marketplace are based on three main needs identified for these types of marketplace:
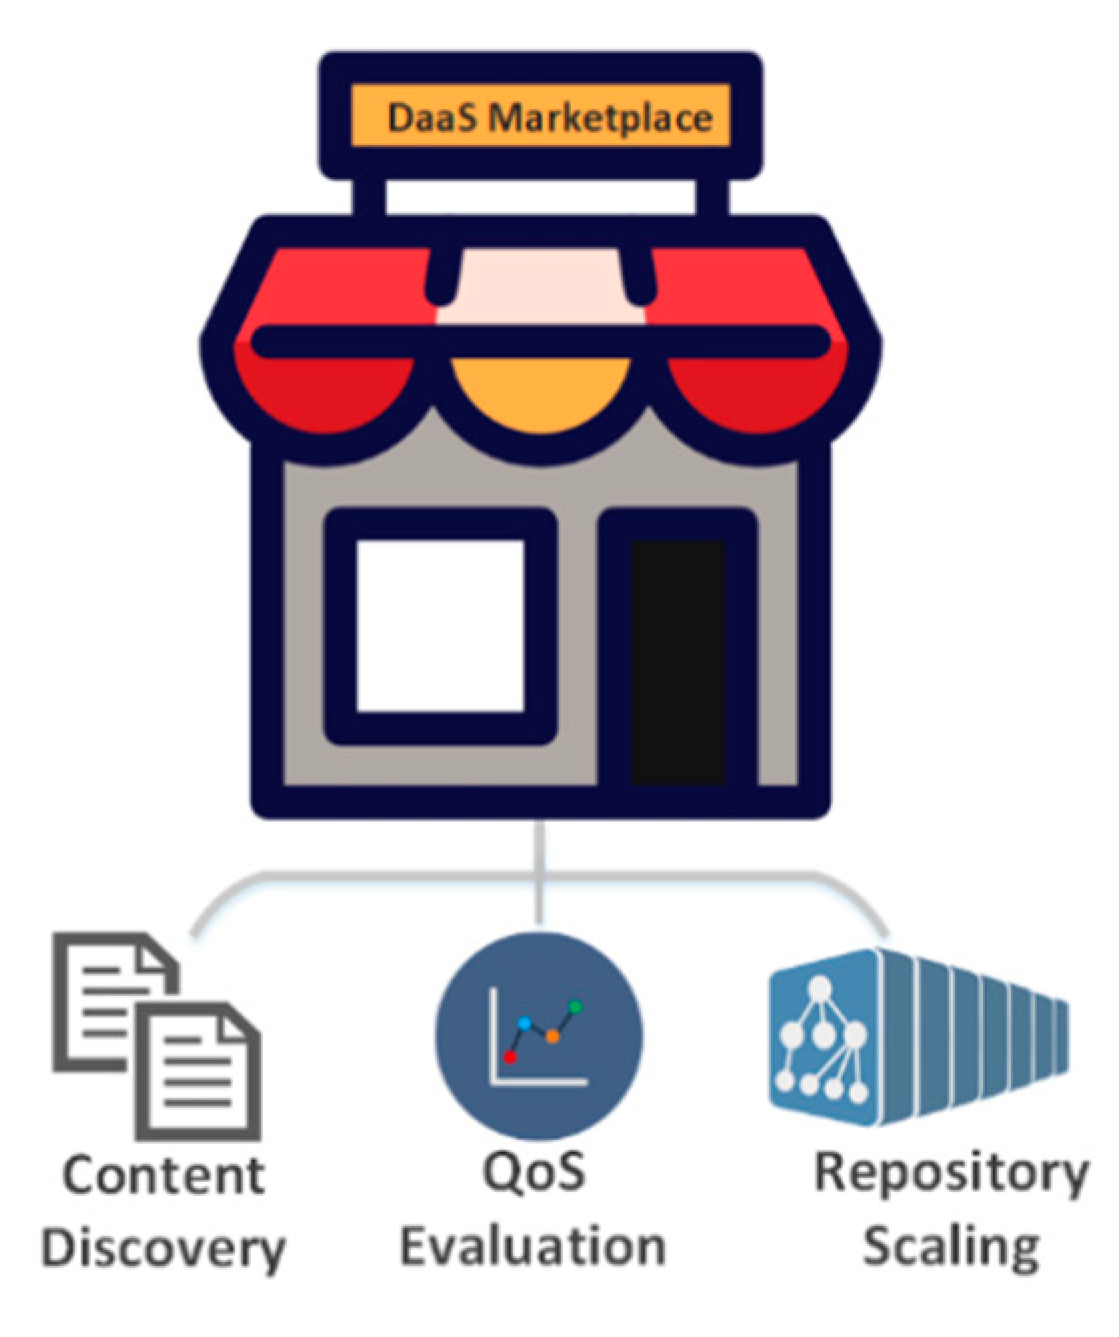
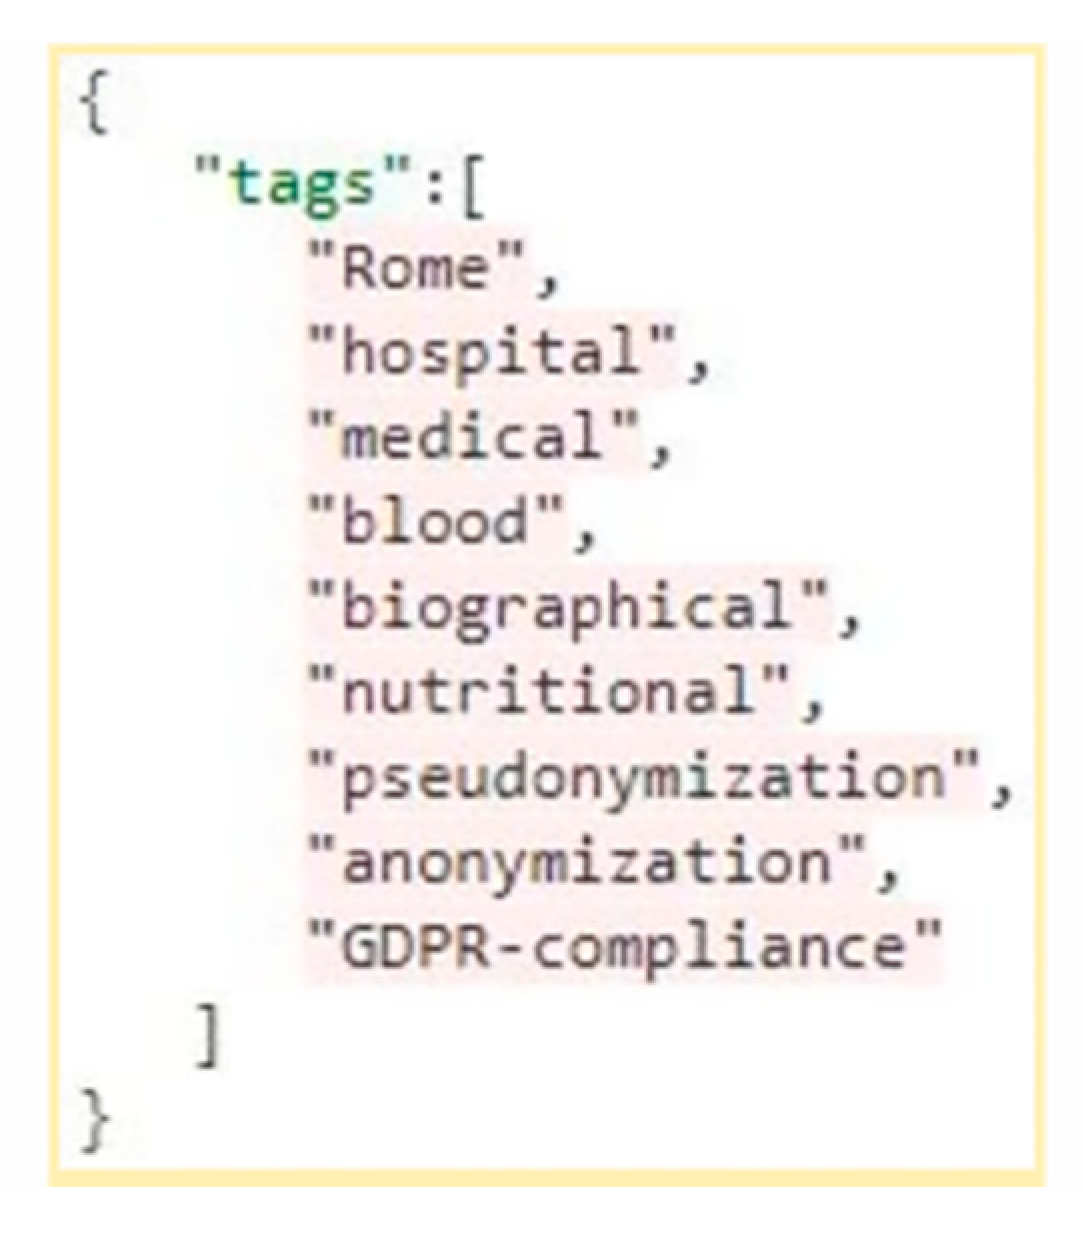
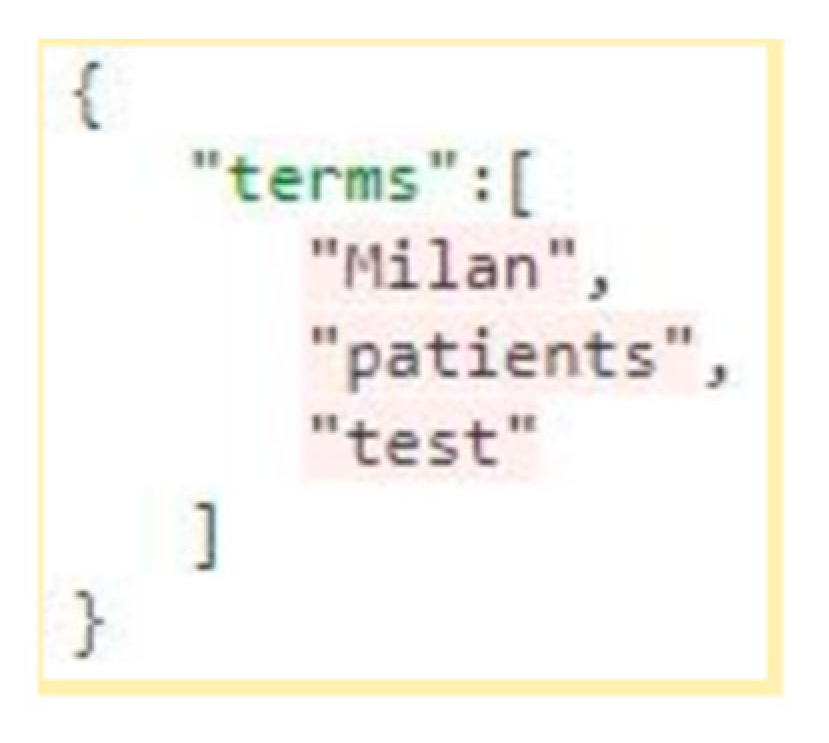
  • Content discovery: A semantically enhanced content discovery component that aids the data buyer to find the most suitable data as far as the content is concerned. Also, aids the data provider to better describe their data in order to make them more easily discoverable.
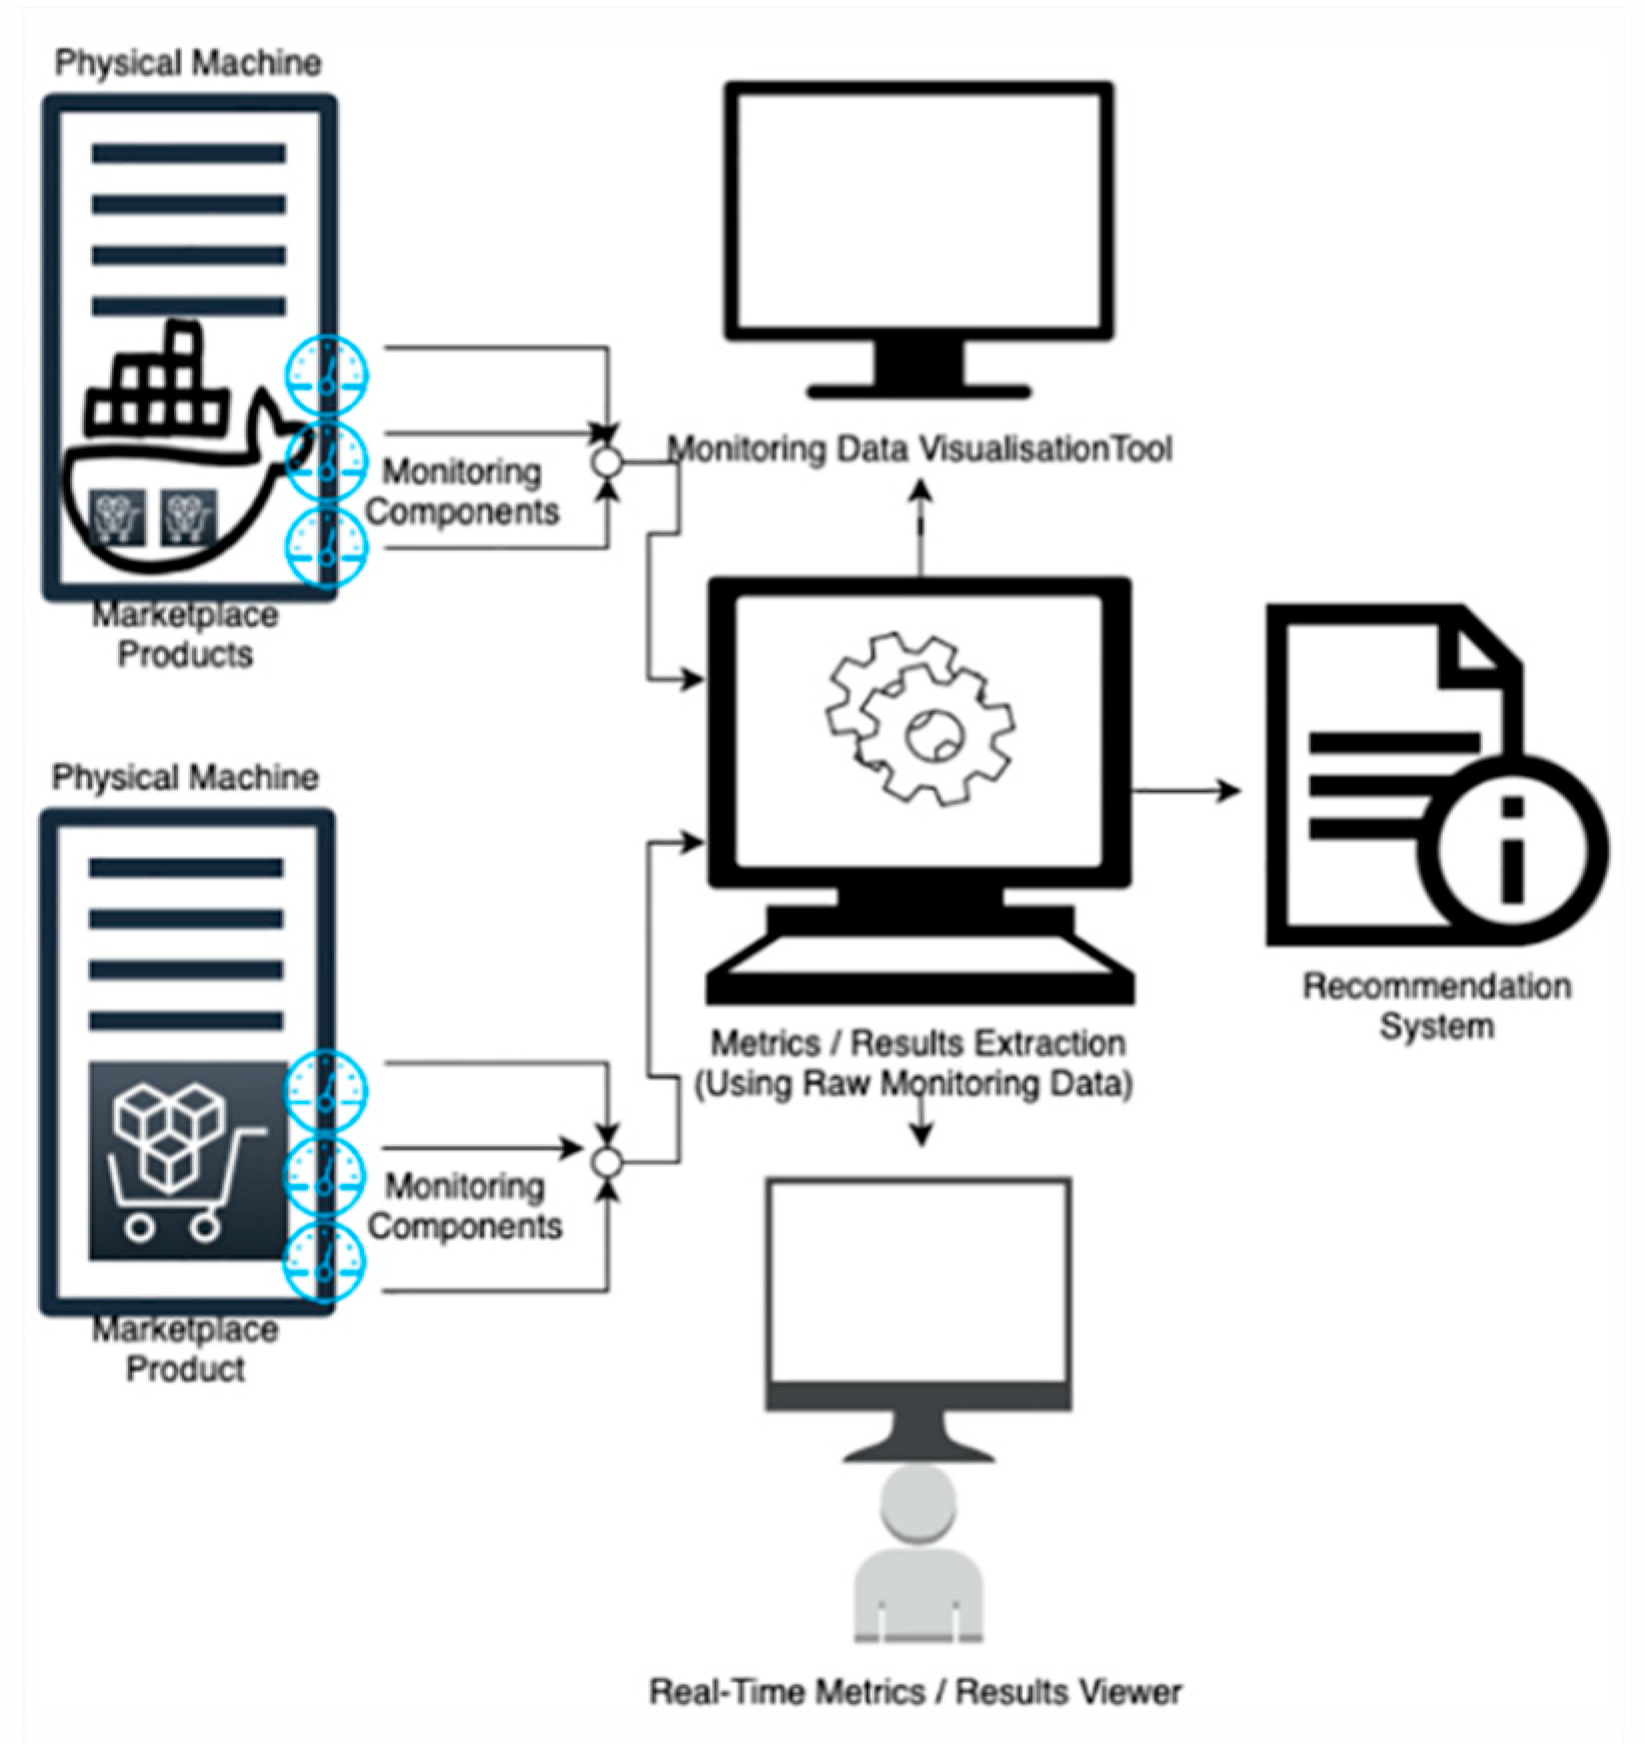
  • QoS evaluation: An assessment tool that produces analytics and QoS metrics for the services that provide the data, in order to aid the data buyer not only to assess the QoD but also the QoS in which the data are delivered.
  • DaaS repository scalability: A scalability component that enables the dynamic scaling of the DaaS Marketplace repository in order to ensure business continuity and fault tolerance.
The remainder of this document is organized as follows: the remainder of the present section presents the current literature and related work on the domains we are exploring. Section 2 offers the general architecture of the proposed system, as well as descriptions of the components included in it. In Section 3 we present the evaluation tests, the metrics used, and the results of our evaluation. Finally, in Section 4 we present a short discussion on the methodologies and technologies used, the evaluation results, and possible future work.

1.2. Related Work

Since the beginning of the development and establishment of digital marketplaces, significant research has been undertaken into incorporating recommendation systems in order to enhance them [3]. One of the most recent research works is related to how ElasticSearch [4] can be used to improve a recommendation system [5]. In fact, ElasticSearch is a very powerful cutting-edge search engine, developed for text analysis. Given its enormous capabilities, it has been included in many research publications that highlight the selection of ElasticSearch to evaluate and correlate semi-structured data with very rich text content, such as LinkedIn profiles [6], job market data [7], and healthcare data [8]. As far as numerical data is concerned, a very promising project has been developed, combining the usage of ElasticSearch with the well-known vector-based algorithm (K-NN), in order to produce image correlation software [9]. In addition, ElasticSearch has been used for large-scale image retrieval [10]. For these reasons we chose to implement the data discovery service of the DaaS Marketplace on top of an ElasticSearch installation.
The terms “Data Marketplace” and “Data as a Service (DaaS) Marketplace” have been around for quite some time. Only in recent years have companies and researchers focused on these terms and what could they possibly mean to today’s society. The idea of a marketplace that sells data to people who want to obtain them and use them to their preference is a concept that many scholars are studying today, and are even testing real-life scenarios. The same applies to Marketplaces that sell services (components that contain data) to potential buyers.
However, how will potential buyers know which Service from the DaaS Marketplace best fits their needs and suits their requirements? For example, a buyer might have physical machine limitations, meaning that the computer system might have moderate specifications and therefore might not be able to properly run every service of the Marketplace. In a few words, the QoS in each and every one of those services available in a Marketplace should be analyzed. This concern raises a need for Marketplace assessment. In the case of Data Marketplaces, QoD should be the main concern. In the case of DaaS Marketplaces, however, QoS should come first, followed by data monitoring and evaluation.
The majority of proposals and concept implementations for Data/DaaS Marketplaces found in the literature do not specify a monitoring system. For example, proposals for Decentralized Internet of Things (IoT) [11] and Scientific [12] Data Marketplaces analyze their implementation, but do not cover the assessment part at all. However, we have to acknowledge that other monitoring and evaluation attempts have been proposed by few other researchers/scholars. Some of those attempts are briefly presented below.
In a course called Advanced Services Engineering, held during summer of 2018, the Technical University of Wien (TUW) addressed some ways with which a data quality evaluation tool could be implemented for Data (and DaaS) Marketplaces [13]. More specifically, TU Wien proposed that an evaluation tool could be developed using cloud services, or by using human computation capabilities (which actually means that Professionals and Crowds can act as data concern evaluators). However, the aforementioned tool is more focused on the QoD spectrum, rather than the QoS, which means that a tool with QoS operations has yet to be found.
Another implementation is Trafiklab, an open data marketplace distributing open public transport data, linking together public transport authorities and open data users [14]. Trafiklab’s Technical Platform enables the usage of the API management system for monitoring and analyzing API performance and/or errors. However, unlike the ideal tool that we are searching for, Trafiklab cannot extract metrics and monitoring data from the physical machine itself. It still remains a suitable solution when it comes to API-only metrics, but not for a complete Data and DaaS Marketplace assessment scenario.
Moreover, according to a recent study which analyses the implementation of a Data Marketplace for the Internet of Things [15], the researchers proceeded to evaluate the Marketplace, but the metrics they excluded were from the physical machine itself. This means that if the machine is also running other processes, the data would not be representative and therefore the whole evaluation part would be false. This choice is suitable, if we decide that the physical machine on which the Marketplace is running will have all its resources “dedicated” to it.
In the field of service monitoring, there have been attempts to monitor individual services, for example, Docker Containers. After all, a Data/DaaS Marketplace would easily operate inside a Docker Container [16]. A group of researchers tried to measure the performance of Docker Containers by combining (at least) three monitoring tools. Their results were not promising. They concluded that there are no “dedicated tools that cover a wide range of performance metrics”. The tools used by the aforementioned researchers are inadequate in the case of a potential Data/DaaS Marketplace to a Docker Container.
An excellent monitoring system for docker containers is “CoMA” [17]. This monitoring agent aims to provide solid metrics from containers. It could be the perfect solution for most Docker clients who wish to retrieve the basic statistics from their containers. However, CoMA extracts data only for the monitoring of CPU, memory, and disk (block I/O). This means that it could not be used for a Data/DaaS Marketplace scenario, where more metrics (such as response time, jitter etc.) are needed. CoMA is indeed an excellent implementation of a Docker Container monitoring system, but is not a suitable solution to a containerized marketplace’s monitoring needs.
There is another Docker Container monitoring implementation [18], which also extracts metrics only for the CPU and the memory. Note that this is one of the oldest implementations. This module’s main aim is to be helpful for multiple Docker providers (Kubernetes, Dockersh, Docker Swarm API etc.). However, it is not suitable for the Data/DaaS Marketplace scenario that we are describing. In our case we need more metrics than this module is able to provide, such as response time, lag, latencies, network requests, and other server-side metrics, for possible server-side implementations.
Although ElasticSearch as a whole, or as a combination of its component tools, has not previously been used for DaaS monitoring, there has been an implementation in the fields of IaaS and scientific application monitoring [19]. Why is the “Elastic Stack” (as ElasticSearch and its extra tools are usually called) a good solution for monitoring? It is rather simple. ElasticSearch can run on remote physical machines and is easy to deploy, extremely lightweight, compatible with a variety of operating systems, and free, to name a few of its advantages. Therefore, using the Metricbeat module to constantly collect metrics and send them to a main ElasticSearch database (and perhaps filter them through Logstash or visualize them through Kibana) is one of the simplest and most efficient monitoring solutions. Nevertheless, we cannot just use the Elastic Stack because, as we mentioned, it does not cover all our needs. Thus, it is a good basis for our monitoring solution but it was necessary to build upon it.
In conclusion, there have been a plethora of attempts to implement a monitoring system for Data and DaaS Marketplaces, but none offers a complete solution. A number of researchers and scholars have mentioned the need for a powerful monitoring system, but there is none that can extract sufficient valuable metrics from both the Marketplace (the container on which it is operating) and its physical machine for the developers to produce analytics and correlation data. As a result, one of this paper’s proposed solutions is the answer to a complete monitoring scenario that covers the needs of a containerized Data/DaaS Marketplace.
Before the development of any software in the present era, the need to plan how the relevant data will be stored, retrieved, and protected arises. This need is fundamental in the design of the software itself because each software application is currently created in order to somehow use or produce data, which is also the core functionality of a DaaS Marketplace. As stated by Google’s Eric Schmidt, “Every two days now, we create as much information as we did from the dawn of civilization up until 2003” [20]; thus, it is only natural that an increasing number of software applications are being created in order to discover, use, and/or sell this data.
When talking about data storage systems we have two main families: the traditional, ACID databases like SQL, and the newer NoSQL datastores, which are more chaotic and mostly free of the strict ACID rules. Both of these families have their strengths and weaknesses that will not be presented here as this is outside of the scope of this work. Instead, we will mention that according to the literature, for applications using Big Data, SQL databases are usually inadequate because they cannot handle the volume of data being written and read at any given time. In these cases, NoSQL datastores are often the only viable solution [21,22].
NoSQL datastores in turn are separated into four categories based on the data representation they are using. These categories are described in the following table (Table 1).
There are some clear advantages to NoSQL datastores, such as their inherent elastic scaling capabilities and ease of handling big data, the economics of their scaling out feature, and their flexible data models that can evolve over time as the application itself evolves [21]. NoSQL datastores do not need a pre-defined data model or a serious demand study. Both the data structure and the cluster architecture can be changed in real time or in semi-real time. Thus, if the application suddenly needs a different JSON schema to cover the clients’ needs, new data can be inserted into the datastore and it completes the process, without concerns about downtime due to long-running alter table queries. In addition, if the volume of users suddenly increases, more, small, cheap machines can be added to the cluster to handle the extra volume. The traditional SQL datastores would require investment of a significant amount of money in order to buy stronger servers or scale up the existing data servers.
Our use case is a platform that provides Data as a Service, using Virtual Data Containers (VDCs). These containers are described in detail using a JSON document, called the Blueprint. More information about the VDC and the Blueprint can be found in Section 2.2.1. The fact that JSON is the dominant data format in the project and that the VDCs can be saved in binary format as part of BSON led us to choose the document datastore family, and specifically the MongoDB system. MongoDB has some clear advantages in data intensive applications that are clearly described by Jose and Abraham [21]. These advantages include the sharding functionality, which enables scaling out the database during runtime while retaining data availability and integrity, the high performance due to the embedded document structure, the high availability provided by the replica sets architecture of the cluster, and the flexibility of not having to pre-define a data schema, which is instead created dynamically following the needs of the application.
Docker is a tool providing virtualization technology that creates lightweight, programmable containers, based on pre-created images [24]. Combining the fast and efficient virtualization technology that Docker provides, we can exploit the sharding capabilities of MongoDB in order to automate the scale out and scale in functions of the MongoDB cluster during runtime, according to the real-time performance data of the cluster. Docker has been used in order to automate the setup of MongoDB and Cassandra clusters [25,26] and to provide a micro-service architecture [27], but to our knowledge it has not been used to combine these two together to provide real-time modifications to the MongoDB cluster (creation, destruction, scaling out, and scaling in).
The cluster management schema that MongoDB provides is one of the reasons that it is so popular; it is used by multinational companies, such as MTV Network, Craigslist, SourceForge, EBay, and Square Enix, amongst many others [22]. MongoDB provides scaling out in three layers: the cluster layer, the application layer, and the data layer. The cluster layer consists of the Configuration servers, which handle the indexing and sharding capabilities of the cluster, and identify where data are located and which node to contact for each request. The application layer consists of the Mongos servers. These servers provide the access points of the cluster, and ensure that the cluster is accessible from the outside world, receiving queries and serving responses. Finally, the data layer consists of shard servers, which hold the raw data. They are usually grouped in replica sets in order to ensure data integrity and availability, as each chunk of data is replicated once in each shard server in the same replica set. This means that if an application needs to serve a large number of clients, more Mongos servers can be added to handle the queries. Similarly, if penta-bytes of data need to be stored, more shard servers can be added to enlarge our data storage capacity.

2. Materials and Methods

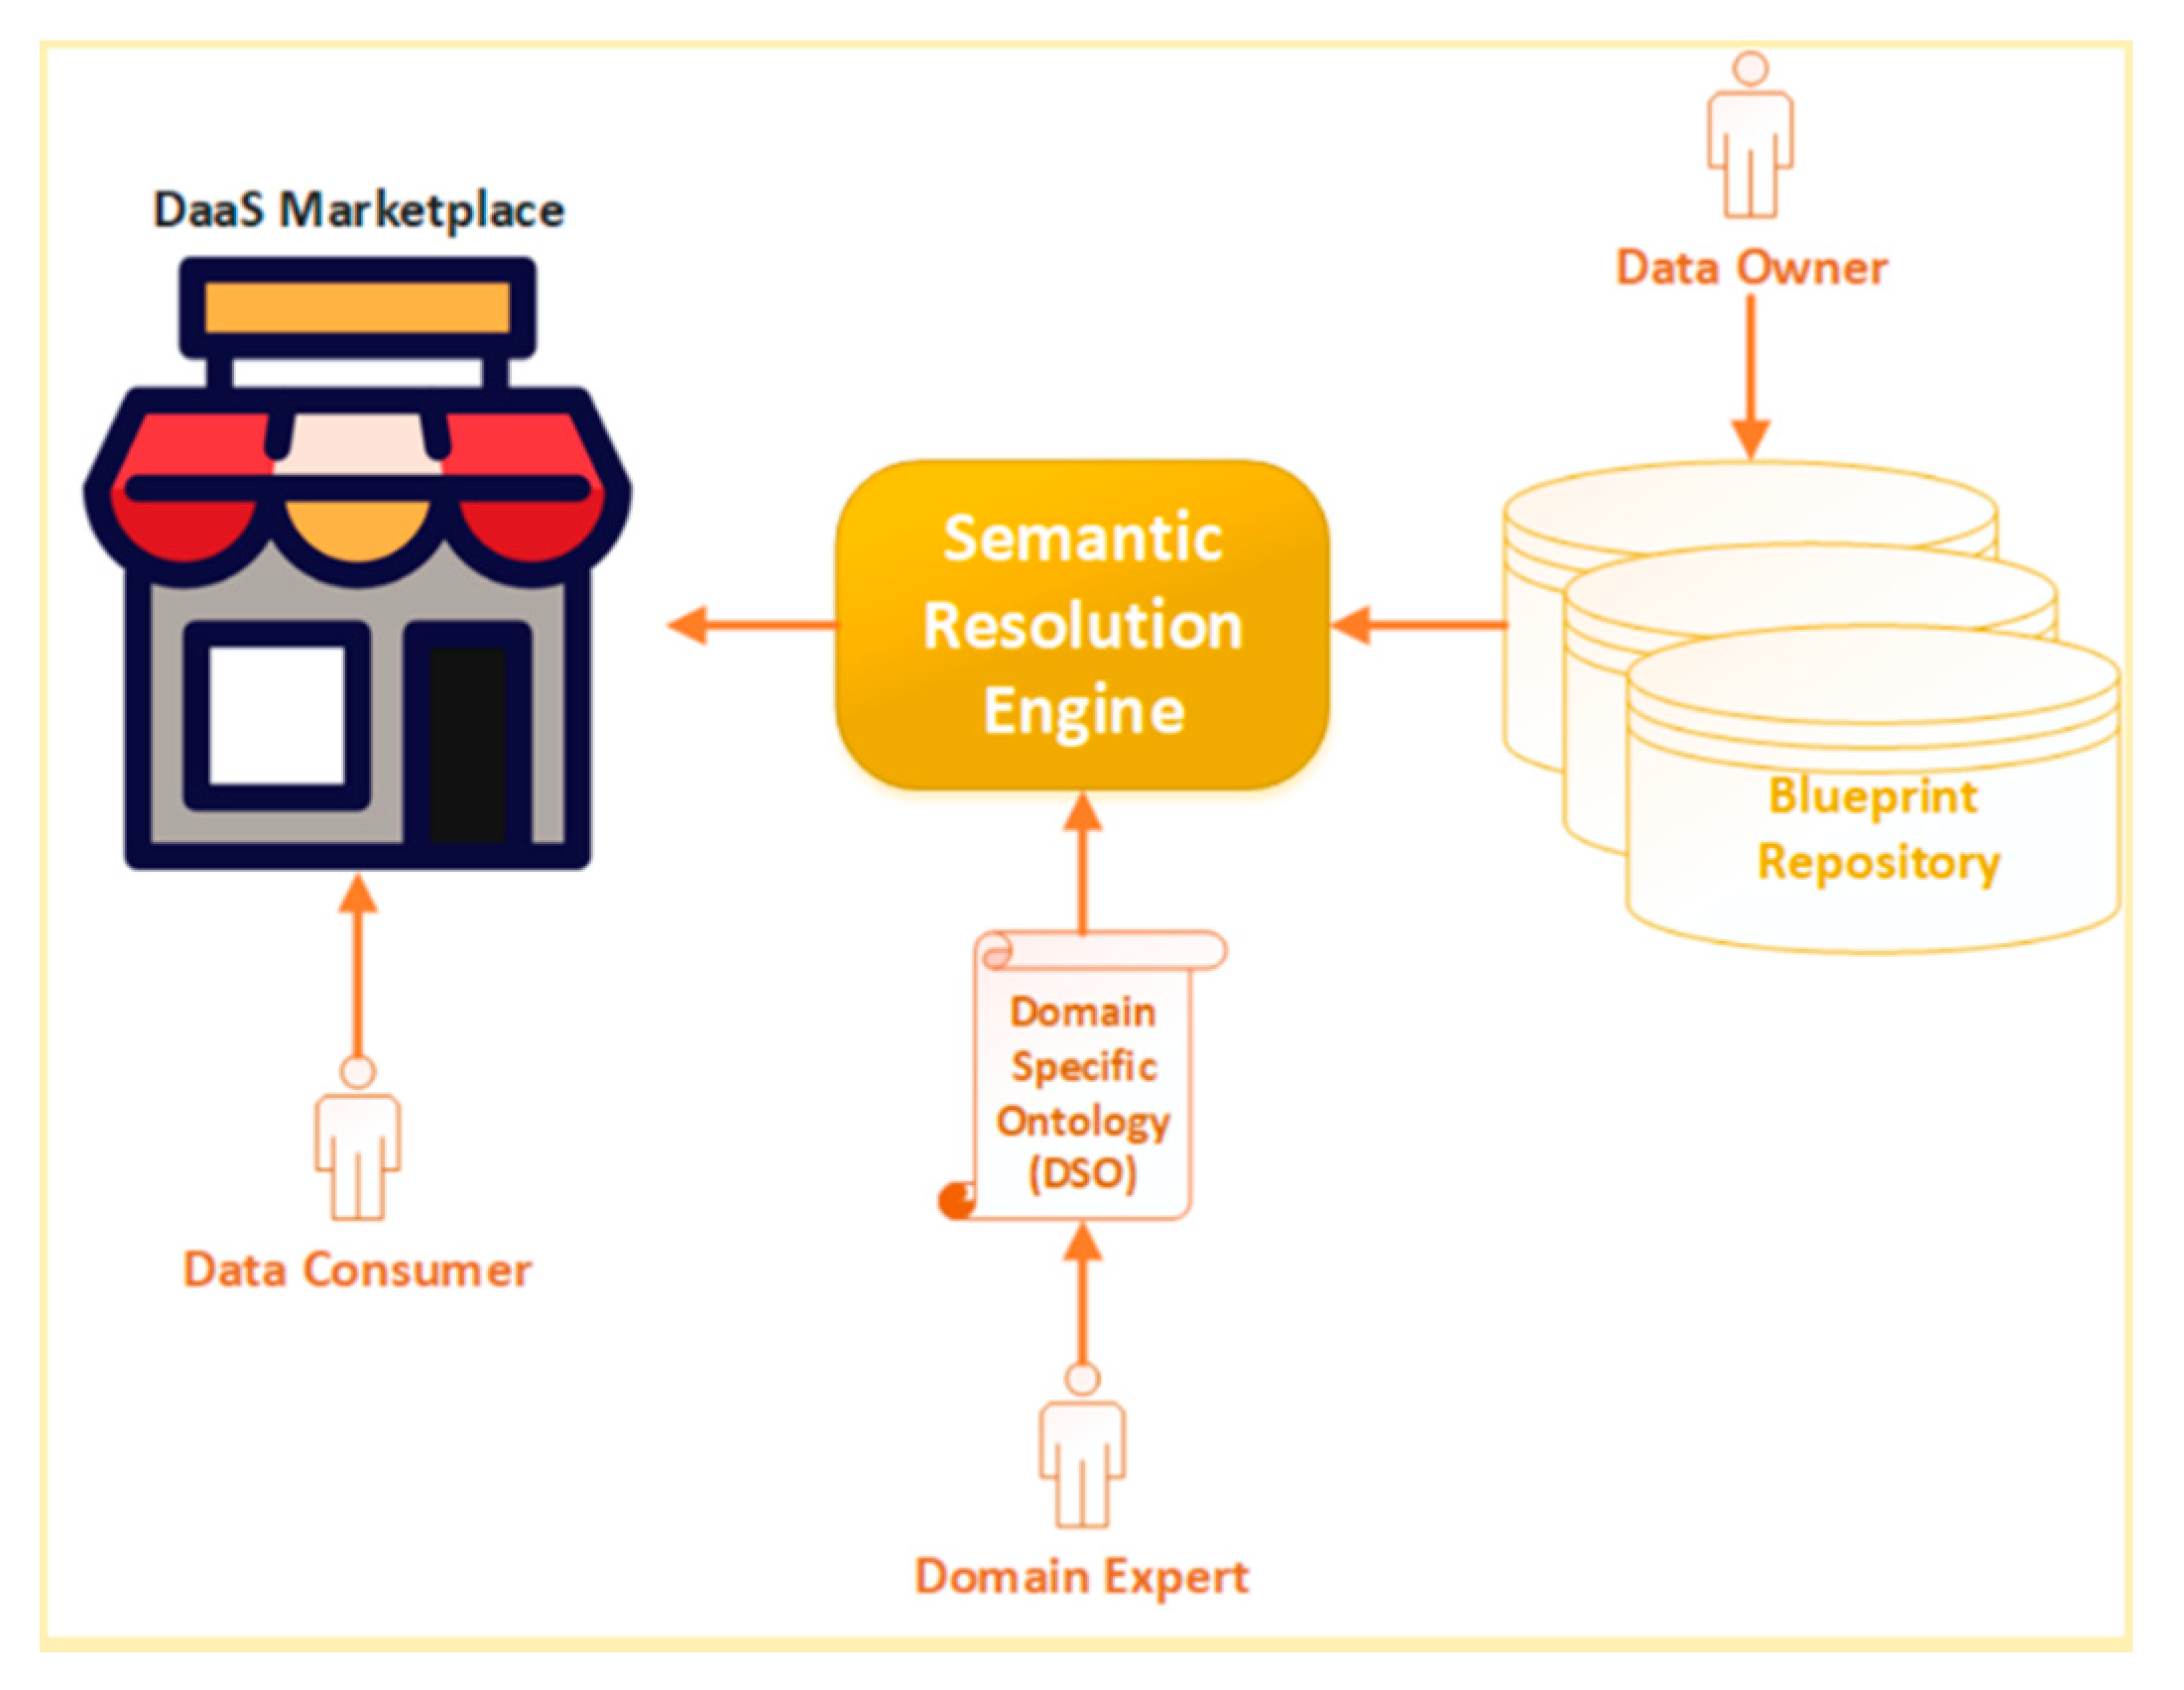
2.1. Architectural Conceptualization

The general concept under which the software components were developed was the advancement of DaaS Marketplaces in key processes of the complete lifecycle of the services it provides. As described in Section 1 and depicted in Figure 1, there are three main pillars in which the advancements took place. Firstly, in a DaaS Marketplace it is important that the services that provide the appropriate data in terms of content that the buyer needs can be found easily and intuitively. In order to achieve this goal, a semantically enhanced content discovery component was created. This component is able, through Domain-Specific Ontologies (DSO), to map simple tags to complex queries in order to retrieve the best candidate services from an ElasticSearch repository. Content discoverability is crucial for a Data Marketplace, but in a DaaS Marketplace it is also important to be able to find the most suitable service in terms of the quality it provides. For this reason, a QoS evaluation component was introduced in order to monitor and evaluate key metrics of running instances of the services. These metrics are then analyzed and a QoS assessment is delivered to the potential buyer. In this stage, it is important to mention that the computational load created due to the complexity of the queries for retrieving candidate services, as well as the network and database load created due to the files being sent to the user in order to deploy the service on a physical machine, create fluctuations in the resources needed to operate the backend of the DaaS Marketplace. To better handle the heterogeneity of the workload, a component responsible for scaling the repository in real time, during operation, was created.

2.2. Components Description

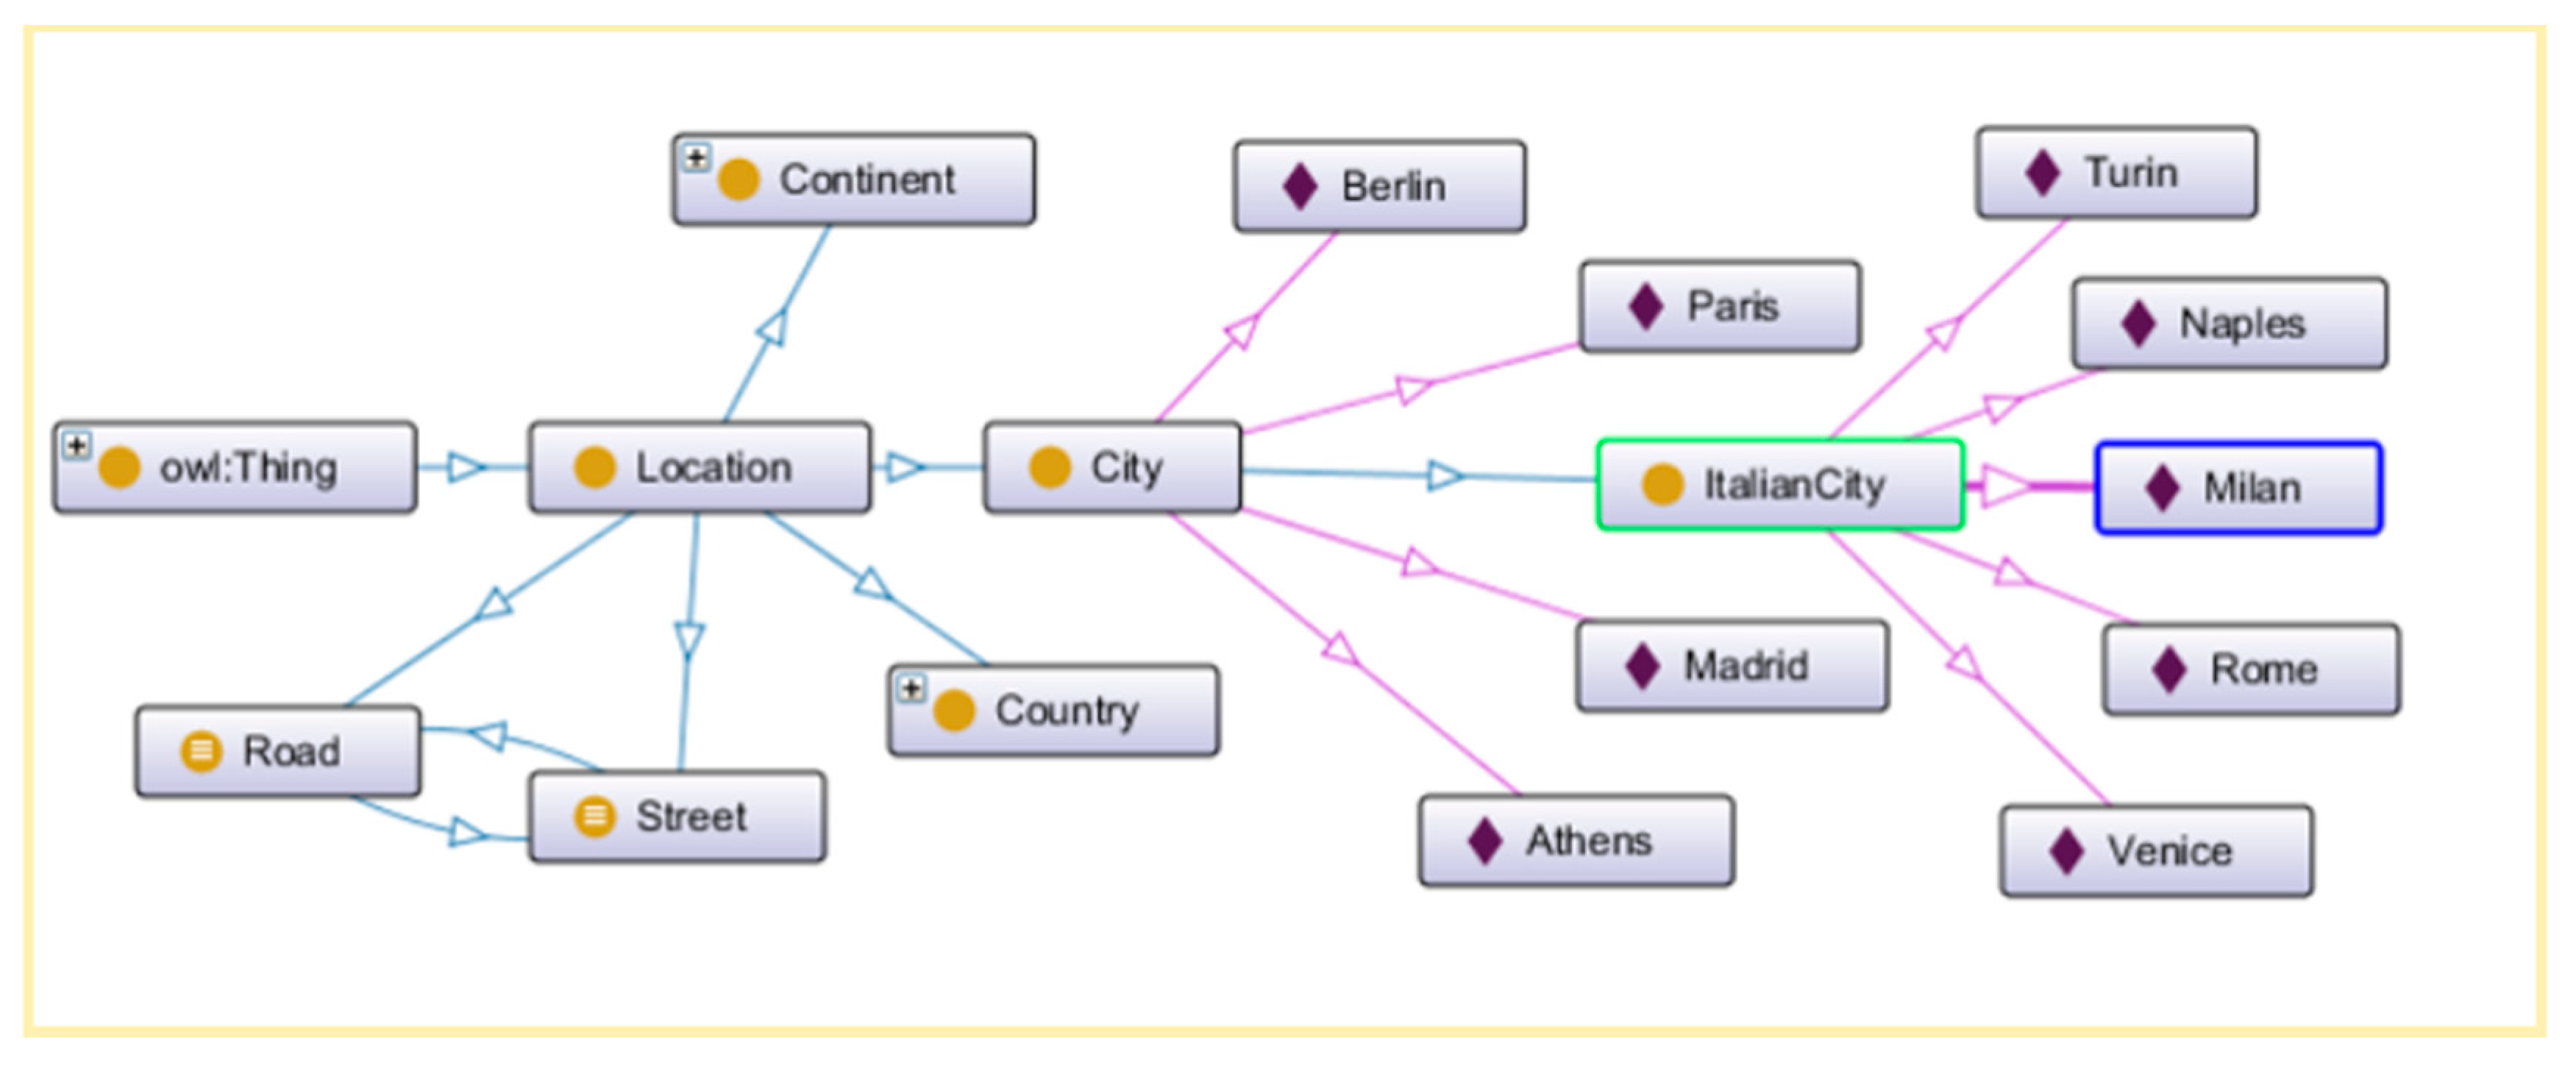
2.2.1. Semantic Resolution Engine

The use case DaaS platform adopts the Service-Oriented Computing principles [28], one of which is visibility. This requires the publication of the description of a service in order to make it available to all its potential buyers. In this case, this is fulfilled via the so-called VDC Blueprint that is created and published by the data owners. The Virtual Data Container (VDC) provides an abstraction layer that takes care of retrieving, processing, and delivering data with the proper quality level, while in parallel putting special emphasis on performance, security, privacy, and data protection issues. Acting as middleware, it lets the data consumers simply define their requirements of the needed data, expressed as data utility, and takes the responsibility for providing those data timely, securely, and accurately, while also hiding the complexity of the underlying infrastructure [29]. Following the general definition of the VDC, its corresponding Blueprint is a JSON file that describes, except for the implementation details and the API that the VDC exposes, all the attributes and properties of the VDC, such as availability, throughput, and price [30]. This part is critical for the VDC to be considered as a product with specific characteristics that could be used as information metadata by the data buyers. The Blueprint consists of five distinct sections, each one of which provides different kinds of information regarding the VDC. Although a thorough analysis of those sections is outside the scope of this paper, the separation is mentioned in order to highlight that the Semantic Resolution Engine parses only the specific section of the Blueprint that refers to the content of the data that the VDC provides, thus enhancing the scalability of the overall system. Inside this Blueprint section, the data owners use descriptive tags (keywords) in order to make their data more discoverable in terms of content. Given the Blueprint’s creation and storage in the repository, the engine is responsible for finding the most appropriate Blueprints based on the content of data that the VDC delivers. This resolution process takes as input some terms as free text from the data consumers and then provides a list of candidate Blueprints that match one or many of those terms. The returned Blueprints are ranked based on their scores that reflect the level of matching against the set of user terms. For the Blueprint retrieval, the engine relies on ElasticSearch [4], which is one of the leading solutions for content-based search. However, in order to enrich the resolution results, meaning more Blueprints that the data consumer might be interested in, the Semantic Resolution Engine exploits the class hierarchy that the ontologies provide. When the consumer provides the input terms, the engine forms the query for the ElasticSearch database, also taking into account semantic relations of those terms. Those relations are extracted from Domain-Specific Ontologies (DSO), which domain experts provide to the marketplace. For instance, in the case of the e-health domain, when a doctor is looking for data about patients’ tests, the engine also returns Blueprints that contain the Blood, Oral, Urine, Ocular, etc. tags, since those are subclasses of the superclass Test (Figure 2).
Although validated against medical ontologies, the engine can be used in any domain, since the corresponding DSO, which actually serves as a reference vocabulary, is the only dependence that it has. The high-level architecture of the Semantic Resolution Engine is presented in Figure 3:
The implementation of the engine aims at enhancing the core functionalities offered by ElasticSearch towards two directions: both the discovery and the ranking. It is developed on one hand to extend the search results, capturing semantic relations between different terms, and on the other to revise the ElasticSearch default scoring algorithm, used to rank those results. Regarding the discovery aspect, ElasticSearch is capable of handling synonyms during the analysis process. Furthermore, the engine takes full advantage of ontologies to also handle two more types of semantic relation. More precisely, in case the requested term is a class, then the following relation types are considered: Equivalent (for exact or synonym terms), SuperClass/SubClass, and Sibling. In case the requested term is an individual, then the corresponding types are: same (for exact or synonym terms), property (for individuals with property relation where the requested term is the subject), and siblings (for individuals that belong to the same classes). For example, if a doctor is searching for medical data about patients from Milan, the engine returns Blueprints that provide such data not only from Milan, but also from Italy, since Milan isPartOf Italy (property relation between individuals Milan and Italy), as well as from Rome, since both of the individuals Milan and Rome belong to the same class ItalianCity (Figure 4 and Figure 5, respectively).
However, the score of each Blueprint reflects the relevance of the data that it offers, according to the different semantic relation type that each one captures. Consequently, the first aforementioned Blueprint is ranked higher than the other two and the third is ranked lower, if all the other factors that affect the overall score remain the same. In particular, regarding the ranking aspect, the Semantic Resolution Engine implements an algorithm that calculates an objective score for each returned Blueprint, instead of the relevance score that ElasticSearch uses by default. The goal is to enable the development of a fair and unbiased search engine as a core part of a DaaS Marketplace. In detail, the algorithm ignores factors that are involved in the ElasticSearch relevance score calculation, such as the term frequency (TF) and the inverse document frequency (IDF), which make no sense in the context of the proposed marketplace. Regarding IDF, if many Blueprints in the repository contain a term, this does not imply that the term is less important than another term which few Blueprints include. Thus, ignoring IDF, the score of a matched Blueprint is independent of other Blueprints given a specific query. To conclude, based on the introduced scoring algorithm, the factors that affect the score of a returned Blueprint are: the number of terms (T) from the query that are captured by the Blueprint tags, a boost coefficient (C) that corresponds to the semantic relation type of each captured term (16, 4, and 2 for the three different types), and the total number of tags (N) included in the Blueprint. The last is a constant factor, independent of the query. The formula for the score calculation is given in Equation (1):
i = 1 T C i N ,
In the following running example, the DaaS Marketplace aims at delivering medical data to various users such as doctors, researchers, or any developers that intend to create cloud-based applications which would consume those data. The storyline begins with a domain expert (i.e., doctor, biomedical engineer, etc.) that provides the relevant DSO to the marketplace. Thereafter, data owners that are willing to sell medical data via the Marketplace, create and store their Blueprints in the repository. As mentioned before, a Blueprint contains, among other tags, those that describe the content of the data that the VDC provides. An example of those tags is depicted in Figure 6.
Finally, a user who is searching for medical test data about patients in Milan performs the query shown in Figure 7 to the Marketplace:
Then, the Semantic Resolution Engine is responsible for discovering those Blueprints from the repository that match the user’s preferences. It is worth noting that without the usage of the engine, but instead simply relying on ElasticSearch, the Blueprint depicted in Figure 6 would not be included in the result set, though it might be of some interest to the user. In fact, the engine returns that Blueprint, due to the semantic relation between the term test and the tag blood or the relation between Milan and Rome, according to the snippets of the DSO depicted in Figure 2 and Figure 5, respectively. Applying Equation (1) to this specific Blueprint, its overall score is derived from the equality in Equation (2):
4 9 + 2 9 = 2 .

2.2.2. SEMS

The Service’s Evaluation and Monitoring System (SEMS) aims to provide a complete solution to the Data as a Service Marketplace’s “complete assessment issue” (that is, the lack of a complete monitoring and evaluation system), and eventually further improve it as a component. The purpose of SEMS is to monitor both the service and the physical machine on which it operates, in order to provide real-time metrics and evaluation scores. Those metrics shall be obtainable from all the potential buyers, for them to decide whether the service is a good choice (according to their requirements) or not.
In a few words, SEMS monitors both the physical infrastructure and the DaaS Marketplace that runs on it. Its functionality is quite simple, but manages to achieve the desirable result. Briefly, SEMS consists of the following: (i) An ElasticSearch database storing the raw monitoring data. (ii) ElasticSearch’s MetricBeat module. MetricBeat is a monitoring tool installed on the physical machine and monitors both the system and the DaaS Marketplace running on it. MetricBeat forwards all the monitoring data to ElasticSearch every 10 seconds. (iii)ElasticSearch’s Kibana module. Kibana offers a user interface (UI) to ElasticSearch. It is useful in testing scenarios and for easily checking monitoring data. (iv) A Java Spring Boot Application. This tool obtains the monitoring data from ElasticSearch, calculates the necessary metrics and creates an HTTP GET Request for end users to have access to them. At the outset, the existence of a database for storage of raw monitoring data (before the final metrics calculation process) is essential. The selection of ElasticSearch would appear to best fit the needs of SEMS. ElasticSearch is a distributed, RESTful search and analytics engine capable of addressing a growing number of use cases. The database is the “depository” for all the raw monitoring data being sent from the MetricBeat modules. MetricBeat is the next basic SEMS component. Each physical machine containing a DaaS Marketplace will also have a MetricBeat module installed and running. The module will draw monitoring data from both the machine and the Marketplace every 10 seconds. Each MetricBeat dataset includes specific information (such as IDs) that are unique to every physical machine and Marketplace. In this manner, the correct data selection from the ElasticSearch database will be achieved. The Kibana UI, one of ElasticSearch’s prime tools, will serve as an easy method of testing and checking the data inserted into ElasticSearch. For example, in the case that an extra metric needs to be added, or an error appears in the data, browsing all the insertions through Kibana will help the process of adding or resolving. Regarding the final component, in order for SEMS to be implemented, a need arises for a main basic module that will orchestrate the raw monitoring data collected and undertake the necessary computation needed for the final metrics to be created. Furthermore, it should create an HTTP GET Request for the end user to type and retrieve the aforementioned metrics. This main module is, in practice, a Java Spring Boot Application. More specifically, its functionality can be split into two parts, as already mentioned. In the first part, the tool “listens” to an HTTP GET Request. The user only specifies the Marketplaces’ container ID, which runs on a physical machine. As soon as the application detects the incoming request, it initiates the searching process through all the data stored in ElasticSearch. It uses the current time and the Marketplaces’ ID as search variables. Note that the Marketplaces’ data are already in the ElasticSearch database, since MetricBeat sends them every 10 seconds (as analyzed before).
Then, we move to the second part where the tool proceeds to the necessary calculations for three main metrics to be generated: CPU percentage used, RAM memory percentage used, and response time. Each of these refer to both the Marketplace and its physical machine. Finally, the application returns to the user the aforementioned three metrics, in JSON format (as a response to the request). If any error occurs a message will be shown to the user. More metrics can be added to SEMS; we selected the three highlighted as initial examples.
SEMS also acts as the Recommendation System via the real-time metrics it extracts. In a few words, raw monitoring data are drawn from Data Marketplace Products (DaaS components) and are collected into a central physical machine, where the metrics/results extraction takes place (using the aforementioned raw monitoring data). One can see the raw data collected by the Visualization Tool, i.e., a User Interface (such as Kibana). After the metrics extraction is complete, the results are ready for the end user to view in real time. Moreover, these results serve as recommenders, meaning data that automatically fill the Recommendation System.
The Recommendation System is the final step of the process. It takes as an input the results of SEMS, which are the calculated DaaS metrics, in order to produce the complex queries that will generate the user-based score (recommendation) of the DaaS Products’ Blueprints. For every DaaS Product’s Blueprint that is in the list of candidates, the Recommendation System queries the purchase repository in order to find the purchase history of every Blueprint and also the application requirements of the buyers that acquired it. After correlating the stored application requirements with the current requirements, as well as with the real-time metrics provided by SEMS, it produces a score taking under strong consideration this correlation. Thus, it generates a recommendation that depends on what the users wanted from the Blueprint of the particular product and how well this Blueprint served the application’s needs. By correlating the different requirements, the system takes the scores of users that had similar application requirements into strong consideration. This helps the Recommendation System to generate more user-centric recommendations instead of the technical filtering and raking provided by the other components.
SEMS can also be used by the repository scaling service described in Section 2.2.3 for decision support. It is structured in a way that can be easily understood and used by both the developers (behind the tool) and the users. SEMS’s running sequence will not be disturbed if any changes should occur to the physical machine, the Data Marketplace, or the DaaS products. It can run on any system (both the Product and the physical machine), independent from its computational capabilities. Given a specific Marketplace’s DaaS product, SEMS draws monitoring data from two MetricBeat modules, one inside it and one in its physical machine. If any changes happen to the Marketplace and the MetricBeat inside it stops working, data from the physical machine’s MetricBeat will still be drawn. In both cases, SEMS will continue to function.
The technologies used are relatively simple. SEMS takes full advantage of ElasticSearch’s tools. It uses an ES Database, the Kibana User Interface for raw data (data in the database) visualization, and the MetricBeat monitoring tool. Finally, it uses the Spring Boot functionalities and capabilities, through a Java Spring Boot Application. A general architecture is shown in Figure 8.

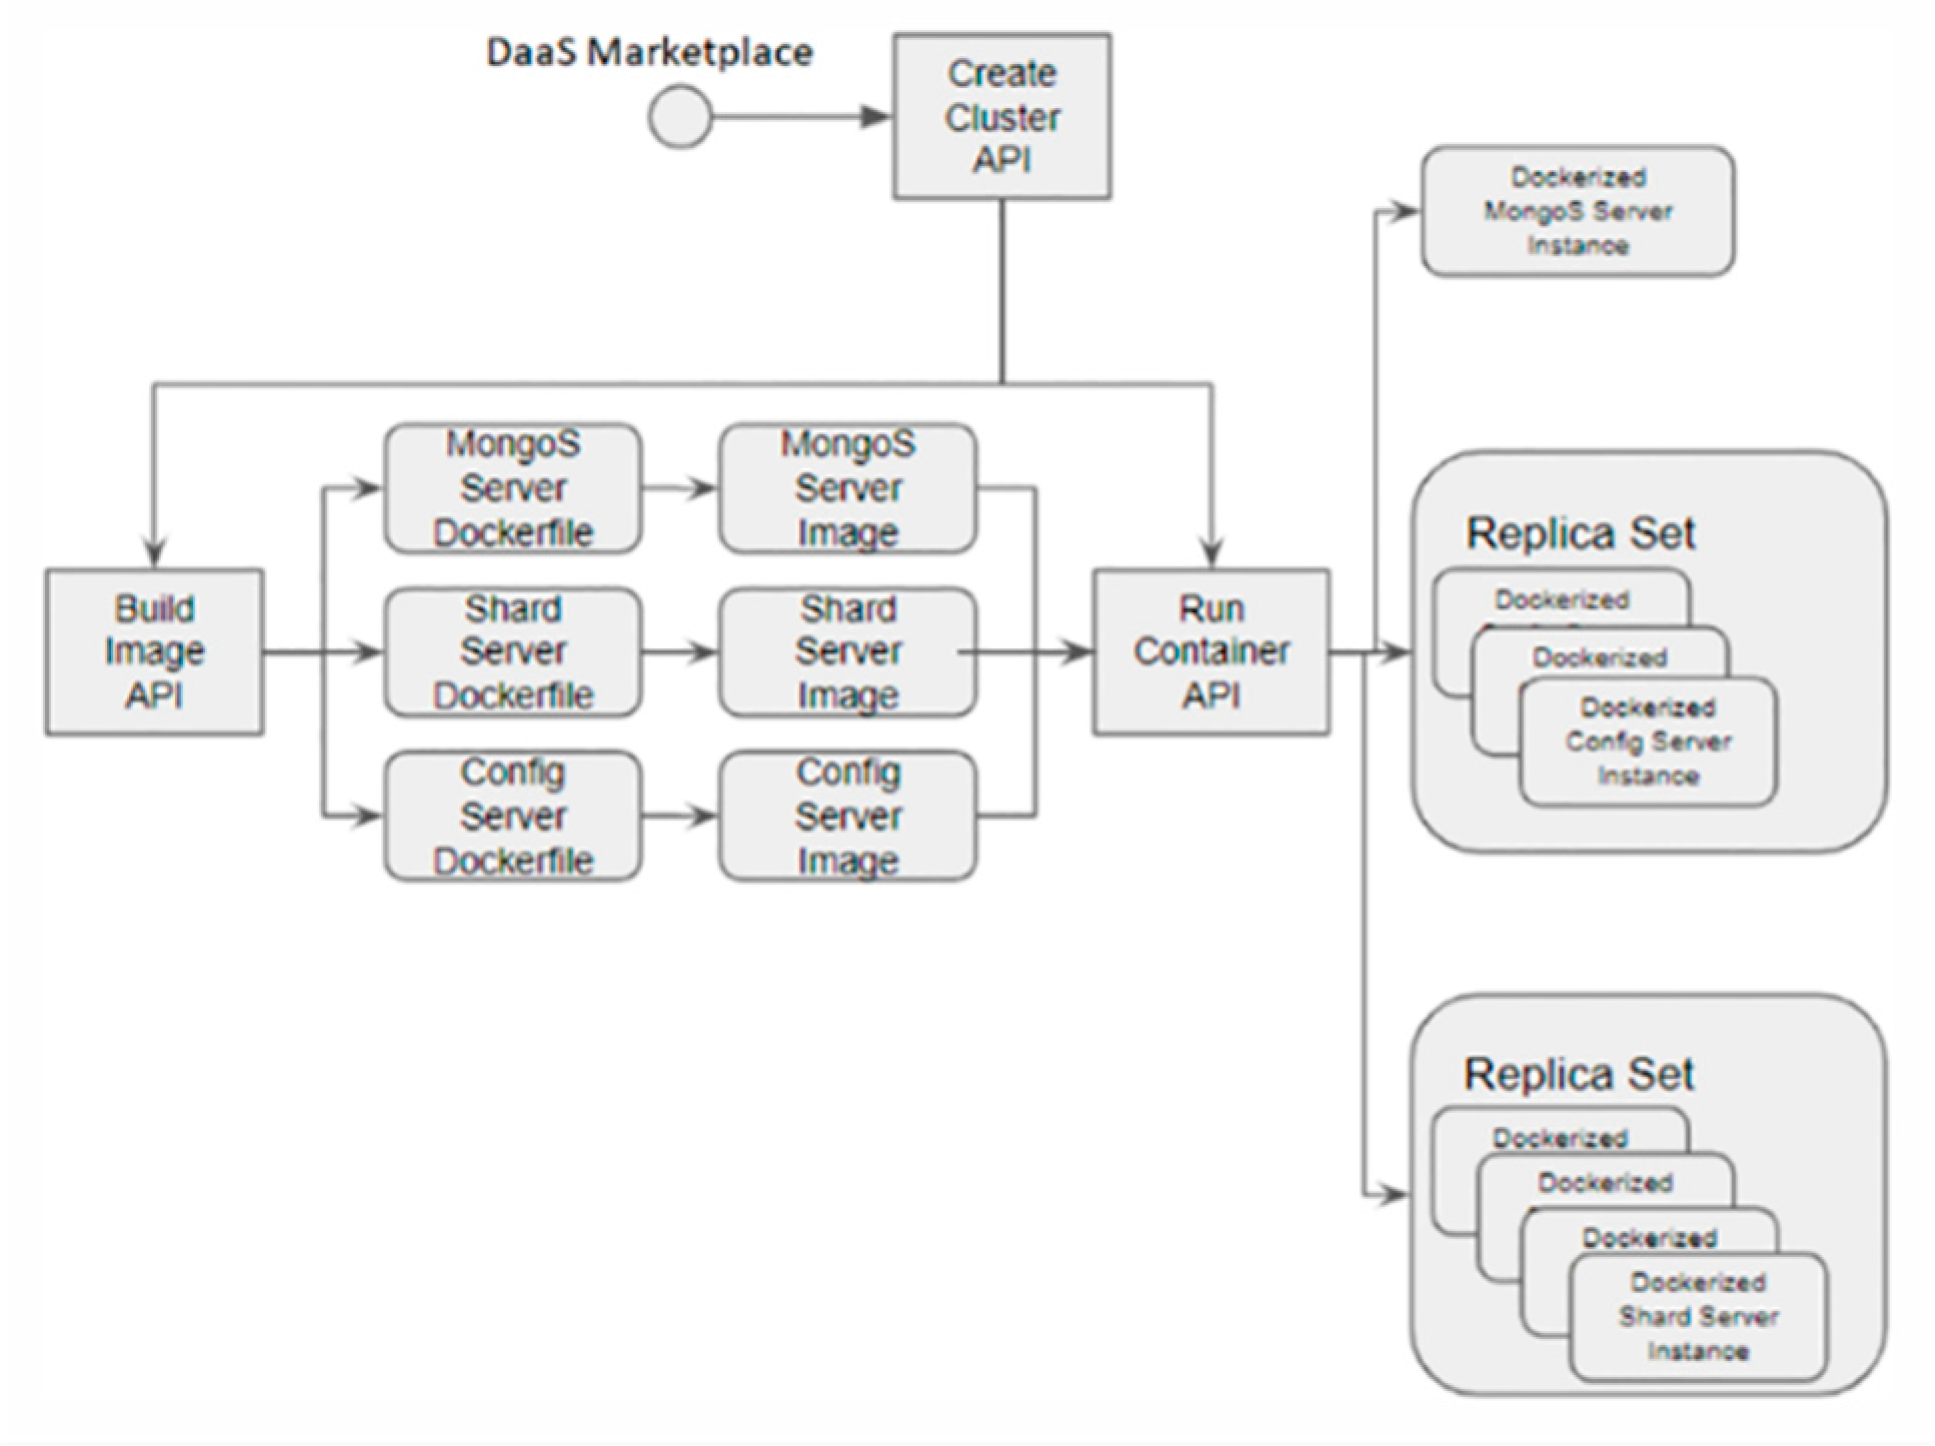
2.2.3. Repository Manager

The Marketplace Repository Scaling Framework (MaRScaF) was developed in order to aid the DaaS Marketplace functionality, providing support to business continuity, datastore elasticity, and QoS assurance domains. It is a toolkit that contains a plethora of APIs readily available to serve the needs of a growing and evolving marketplace for DaaS platforms. It is developed in Python and it can support raw Docker and Kubernetes infrastructure, providing great flexibility in the choice of database topologies and architectures. In essence, any machine, located either in the cloud, at the physical location of the marketplace, or even at the edge of the network, can be used to store data as part of the repository cluster. It also provides real time scaling capabilities, enabling the Marketplace to handle rapidly changing number of users.
As we mentioned, MaRScaF is developed in Python 3, providing numerous APIs that are separated into four main categories:
  • The MongoDB APIs, which handle the configuration of the MongoDB cluster, as well as the communication needed to ensure that the configurations are correctly applied and the status of all machines is within acceptable thresholds.
  • The Docker APIs, which handle the Docker hosts, the images hosted in them, and the containers that are or will be parts of the MongoDB cluster.
  • The Kubernetes APIs, which also handle the Docker hosts, images, and containers, but on a higher level using the Kubernetes orchestration APIs.
  • The Scaling APIs, which provide the coordination APIs that combine all others in order to provide the services promised by MaRScaF.
We will focus on the Docker and Scaling APIs as these are being used in the evaluation run in the present work. As shown in Figure 9, the three APIs that are being used during the deployment face of the MongoDB cluster are the Create Cluster API, the Build Image API and the Run Container API. The first receives a JSON file that contains the initial configuration of the cluster to be created. This includes the machines used, the ports, the IP addresses, their roles (Mongos server, Configuration server, or Shard server), and other relevant information. Then, this API uses the Build Image API in order to ensure that all necessary images are present in the Docker hosts and that they are ready to spawn new containers. If an image is not present it is automatically created using pre-created Dockerfiles that are populated by the configurations passed to the Create Cluster API. Then, the Run Container API is called, which starts the necessary containers and configures the MongoDB cluster, returning the final access point and a debug status message to the user who, in this case, is the DaaS Marketplace.
Figure 10 shows the real-time APIs, which provide scaling and cluster destruction capabilities. It can be seen that the monitoring module provided by SEMS monitors the MongoDB cluster and its Docker hosts in order to provide real-time information, identifying choke points and other critical situations. If such a situation arises, the Scale out API is called by providing a JSON file with configuration about the server to be added. This API then calls again the image creation API and the Run Container API in order to create the new server and then reconfigures the MongoDB cluster, adding the new server dynamically during operation. This process takes less than 10 seconds if the image is already in the Docker host and about 2 minutes if the image needs to be built.

3. Results

We evaluated the performance of our data recommendation services versus the usage of simple ElasticSearch queries. This recommendation service, as discussed earlier, is used in order to improve the data discovery process in the DaaS environment and the overall quality of experience (QoE) of the user. Both the ElasticSearch and the recommendation services are also scalable in order to ensure that they will follow the increasing needs of the DaaS Marketplace, performing always at the same QoS levels.
ElasticSearch provides two configuration options during data retrieval queries: (a) the algorithm used and (b) the learning weight. For the first option we tested three different algorithms, the Gaussian (GA), the linear (LIN), and the exponential (EXP). For the learning weight we again tested three different values—10, 25, and 50—which in essence configure how quickly the scoring in the algorithms changes between two similar values that are examined by the internal scoring function.
In Figure 11, we can see that the proposed recommendation system more accurately fulfilled the user’s search in most tests. In detail, we can see in blue the percentage of cases in which the proposed system returned a more fitting result than a simple ElasticSearch, and, in red, the percentage of cases in which the simple ElasticSearch query returned a more fitting result than the proposed system. The difference between the algorithms is small but the best, being closest to the 50% threshold of equal performance between the two systems, is the GA10 algorithm, with 62.30% for the proposed system and 37.70% for ElasticSearch. Thus, we continued our experiment with the GA10 algorithm in order to provide ElasticSearch with the most favorable conditions.
We also performed the same experiment using the 10-fold cross-validation methodology on the GA10 algorithm of ElasticSearch versus the proposed system, to evaluate the behavior on queries without an exact match in the ElasticSearch data indexes. The results are now more in favor of ElasticSearch, lessening the difference in percentages. Nonetheless, there is a clear superiority of the proposed system in all cases as shown in Figure 12.
The repository scaling component was developed in order to maintain high QoS standards by automatically evolving the storage capabilities and architecture of the DaaS marketplace. For the evaluation and tests, we ran an artificial load experiment on a sharded MongoDB cluster that was created using the scaling component. The load was produced using a jMeter script that created clients performing read, update, and write operations on our cluster. We used the monitoring component described earlier in order to take snapshots of various QoS-related metrics every 10 seconds of operation. The cluster was running on a single machine using Docker containers as its nodes. We used five different cluster architectures:
  • Single shard cluster: 1 Mongos, 1 configuration server and 1 shard server
  • Double shard cluster: 1 Mongos, 1 configuration server and 2 shard servers
  • Triple shard cluster: 1 Mongos, 1 configuration server and 3 shard servers
  • Single to Double: A single shard cluster that was scaled to a double shard cluster
  • Single to Double to Triple: A single shard cluster that was scaled to a double shard and then to a triple shard.
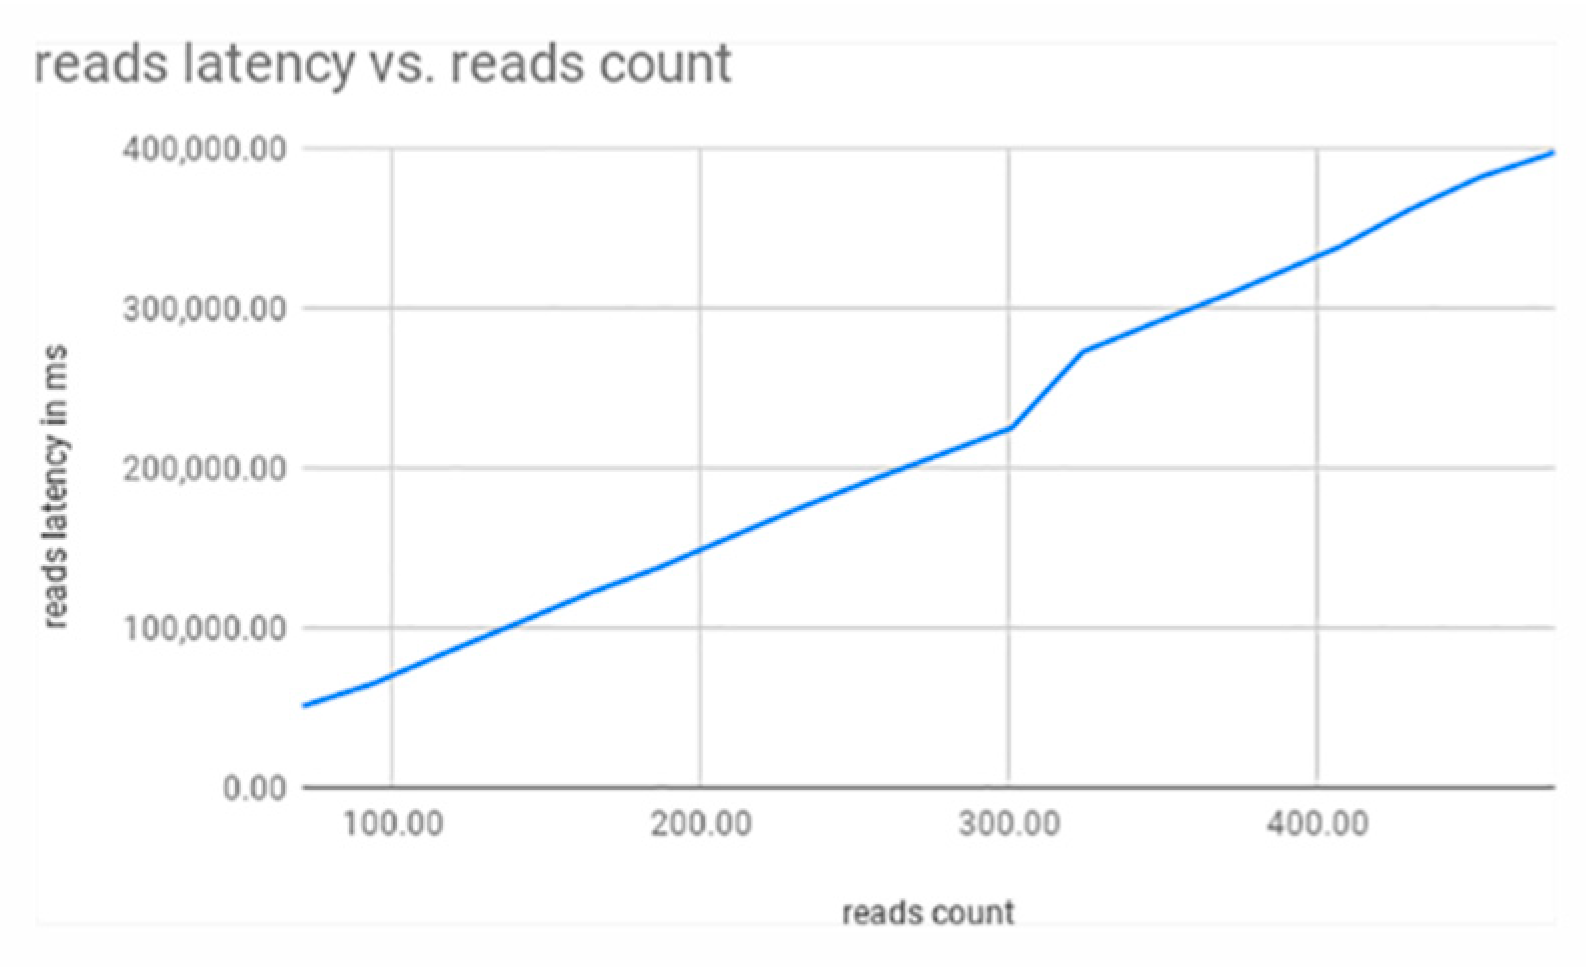
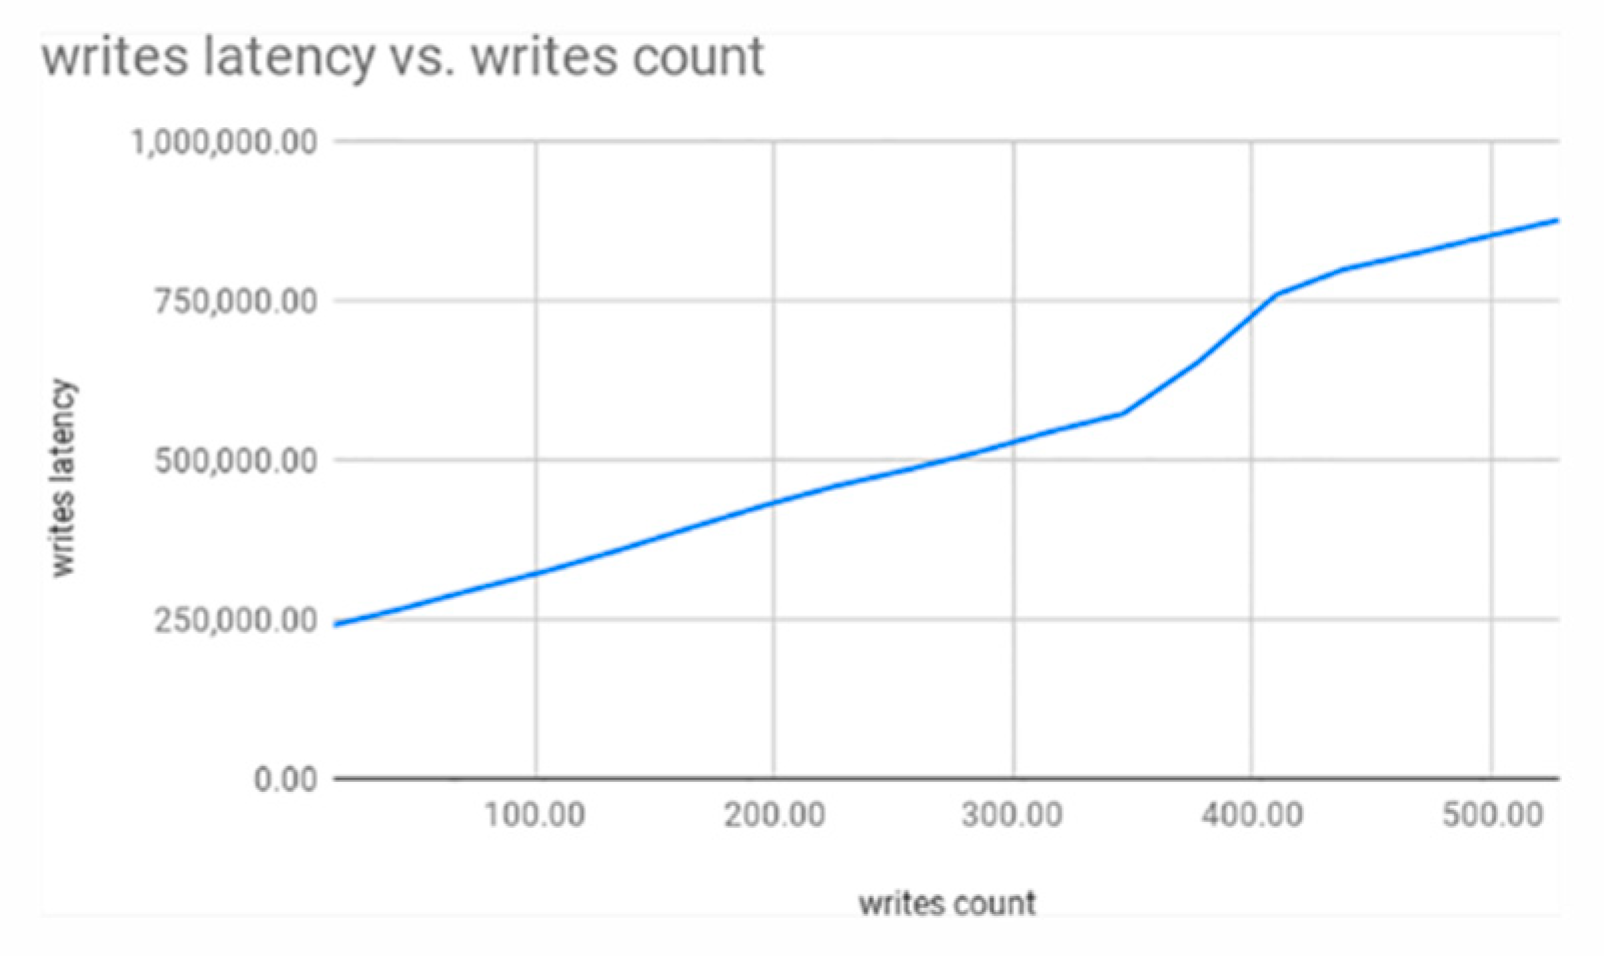
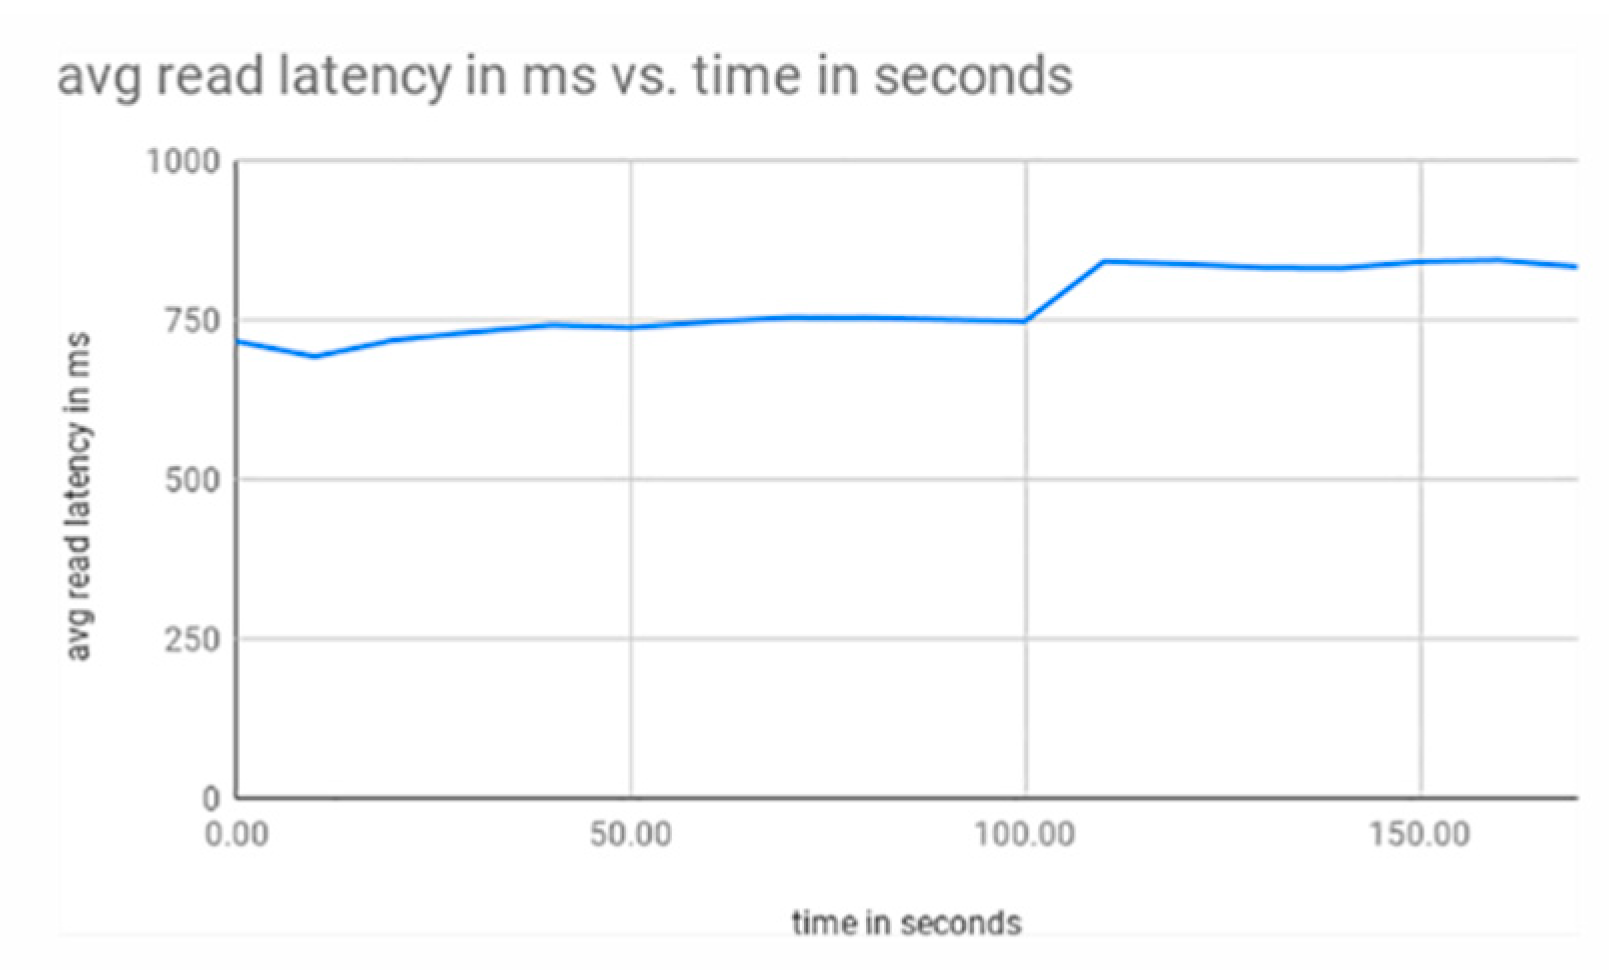
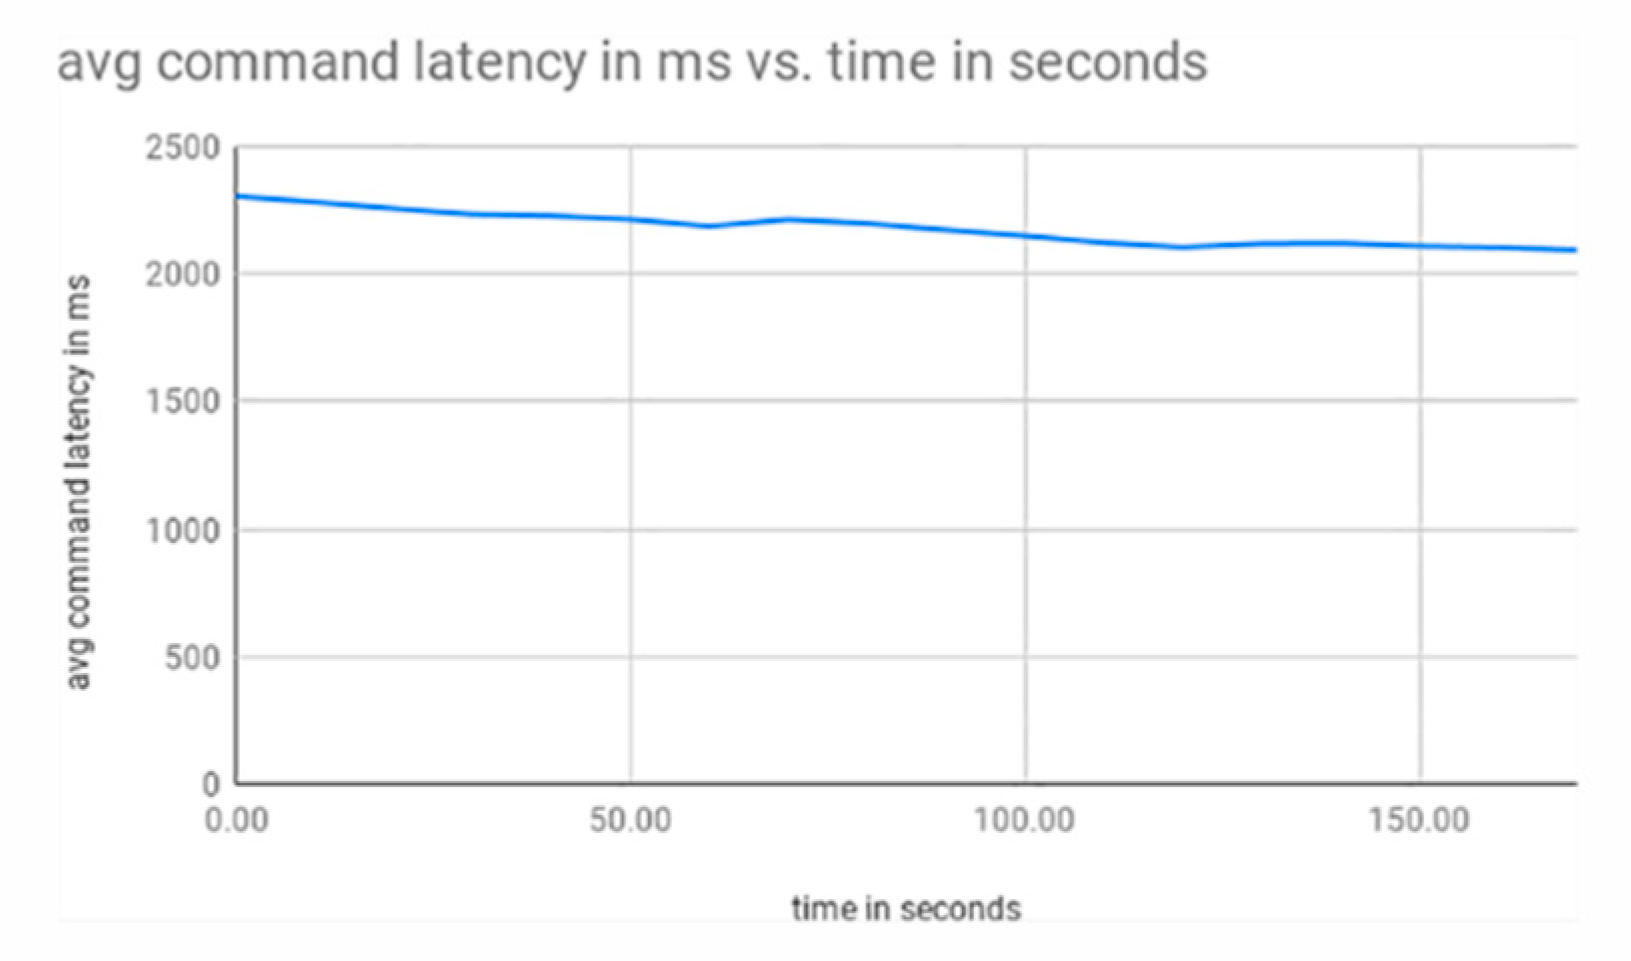
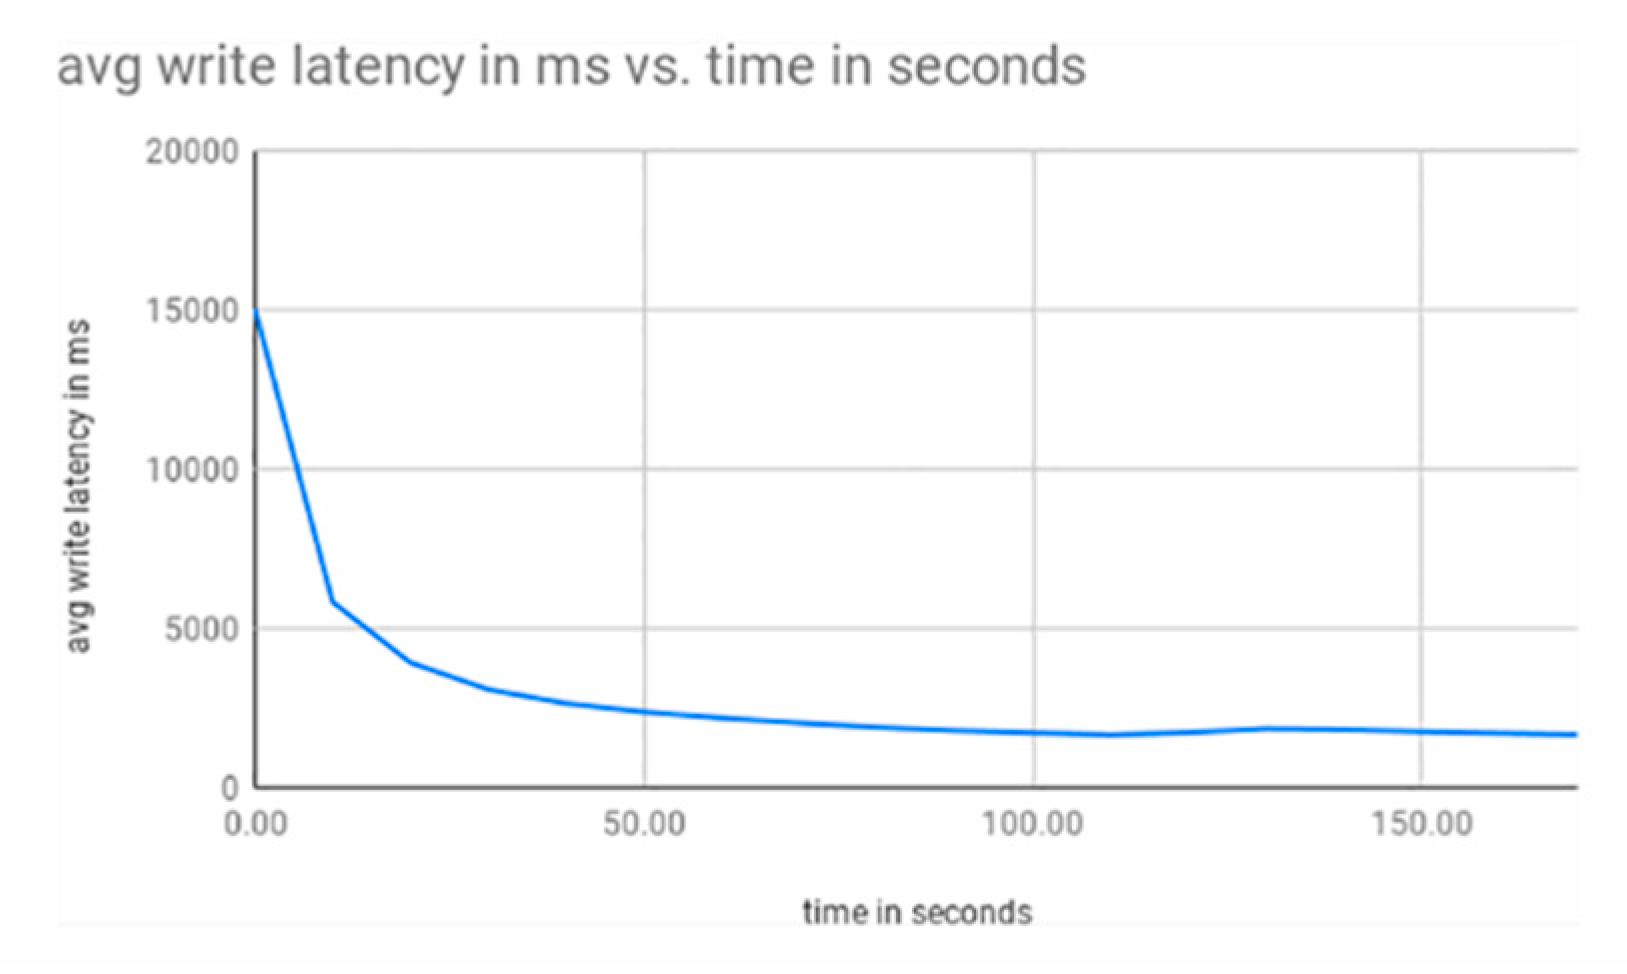
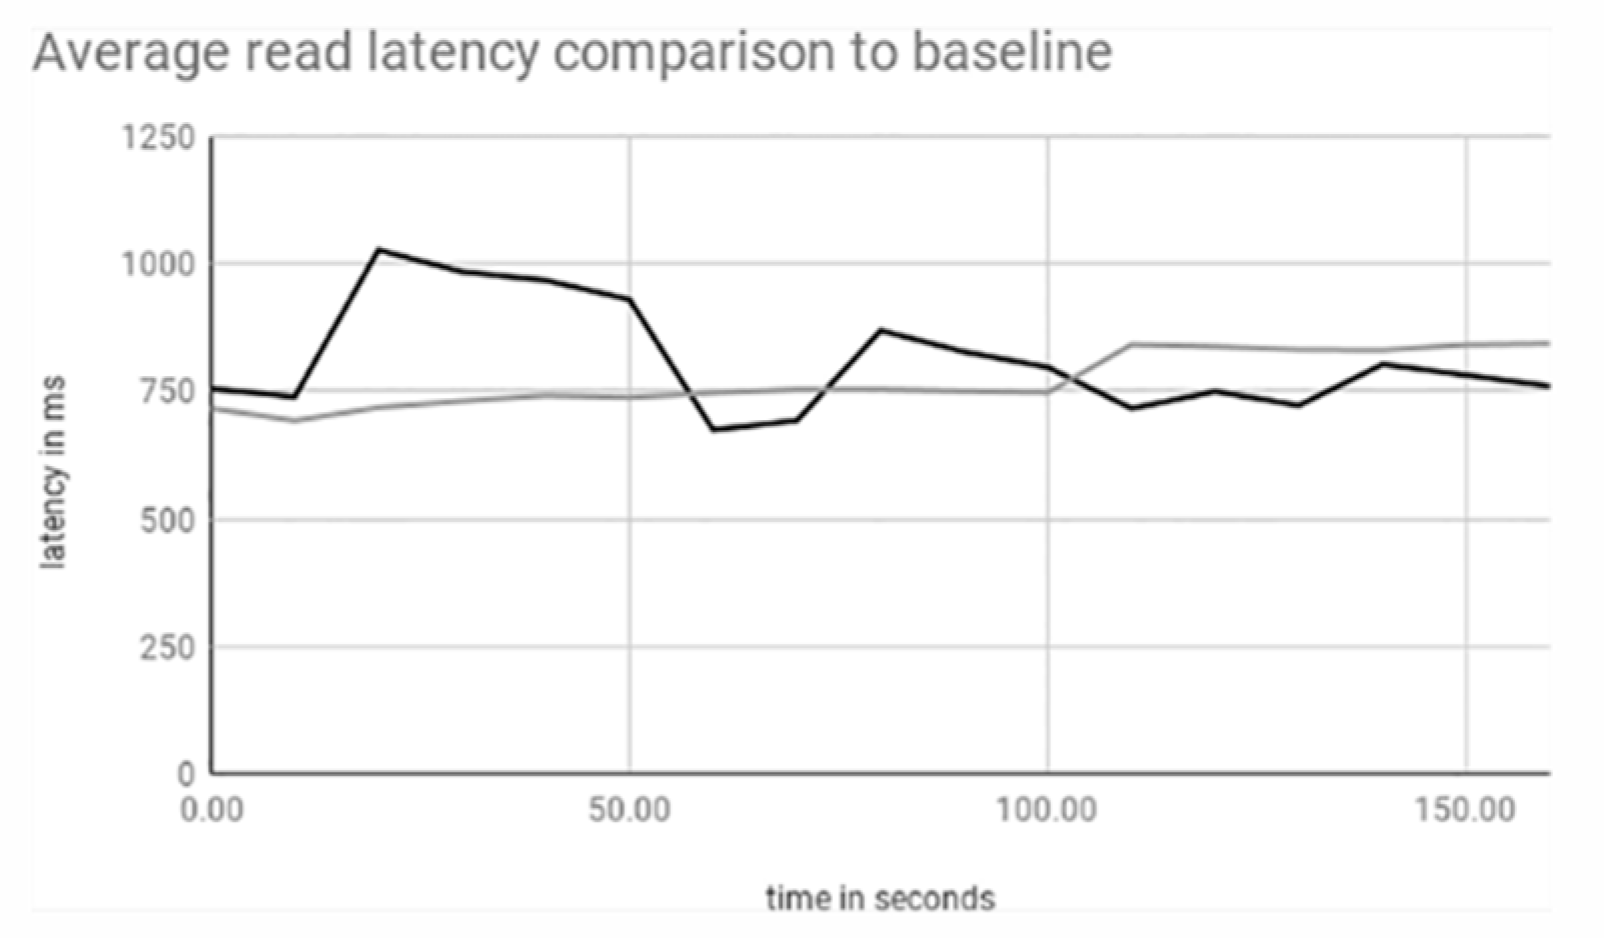
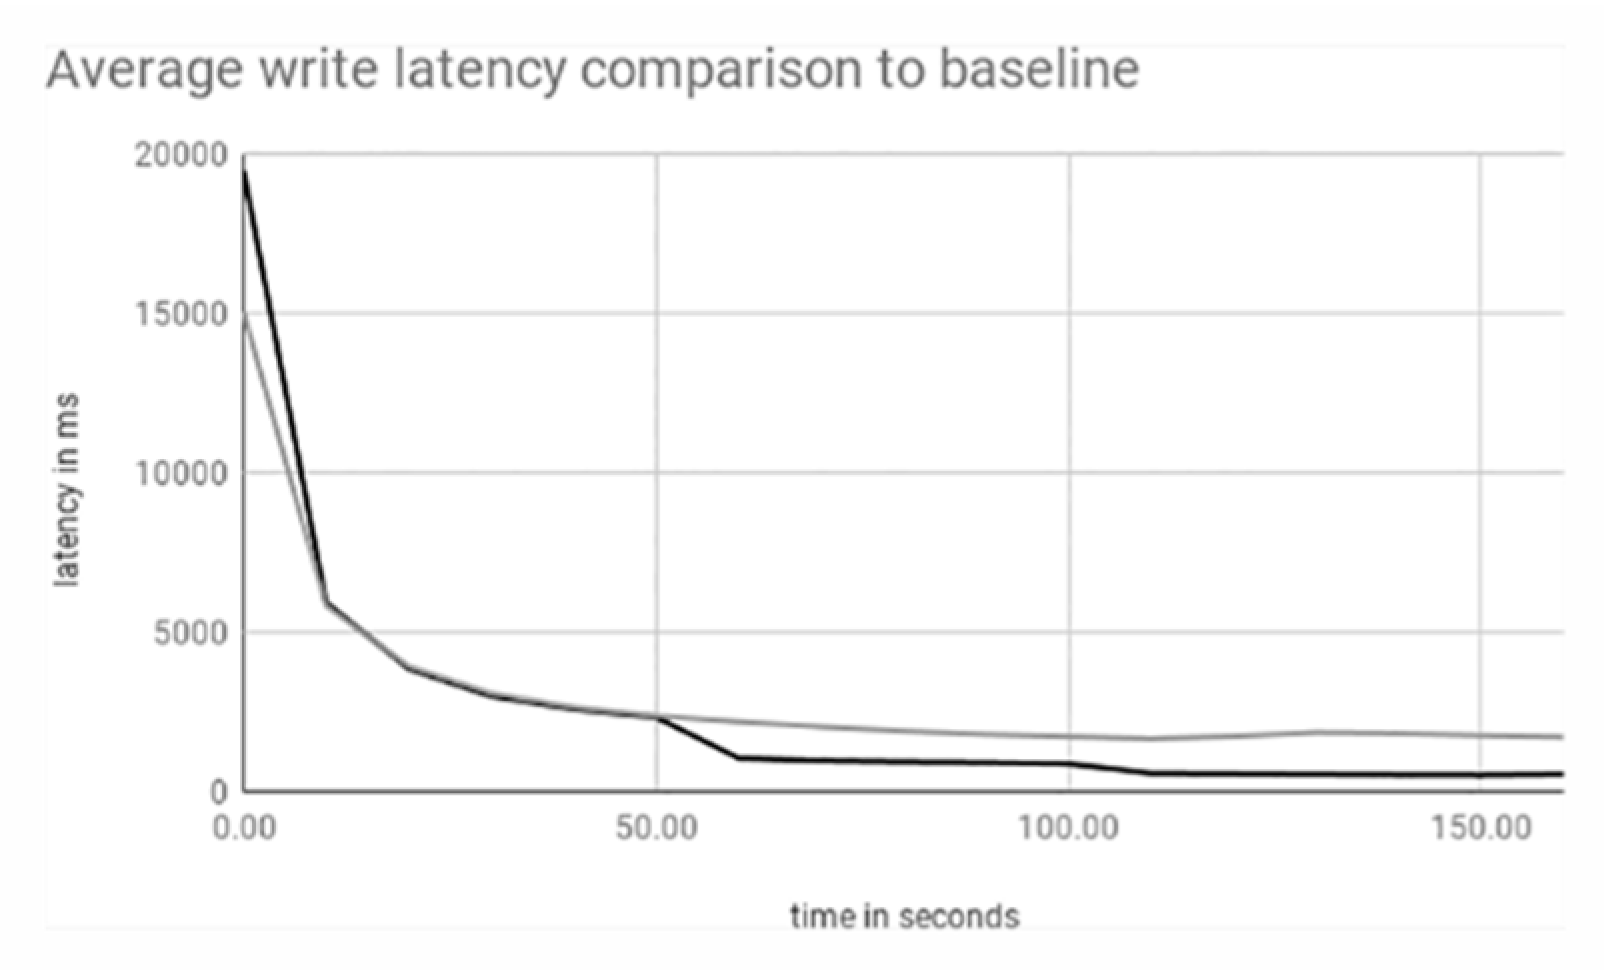
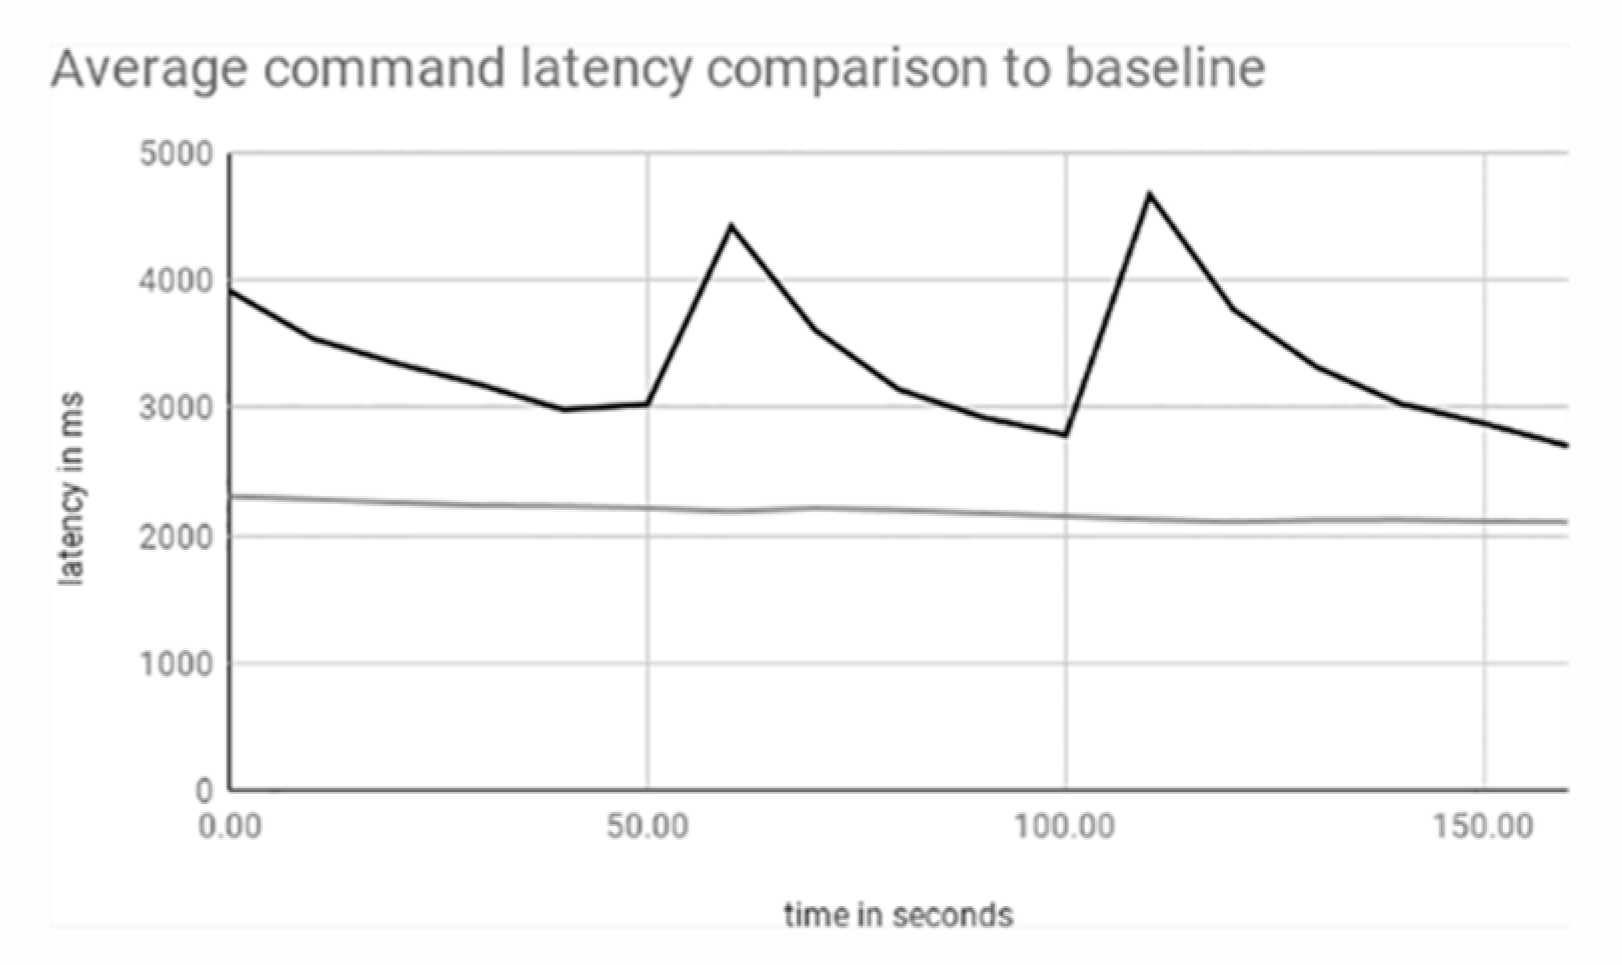
We measured the latency for three categories of operations: (a) command operations, which include configurations, balancing, and other internal operations, as well as administrative commands on the cluster; (b) reads, which include the read operations on data hosted in the cluster; and (c) writes, which include all write, replication, and update operations. The artificial load and monitoring were executed for 180 seconds per experiment, providing sufficient time to build up load and test the scaling with up to two extra servers. Here we discuss only the single shard and the two scaling experiments in order to have a more compact presentation of results.

3.1. Single Shard

The first experiment is used as a baseline, and shows how a single shard cluster can handle the artificial load we created. The results show that as the operations gather, the latency (in milliseconds) for all three types of operations increases (Figure 13, Figure 14 and Figure 15).
The same is not true for the average latency per operation. We notice that in read operations, the average latency increases as more requests come in (Figure 16), while in command operations it appears to be reducing (Figure 17). For write operations, we notice a logarithmic graph (Figure 18), possibly due to caching of the semi-randomized values created by the artificial load scripts.

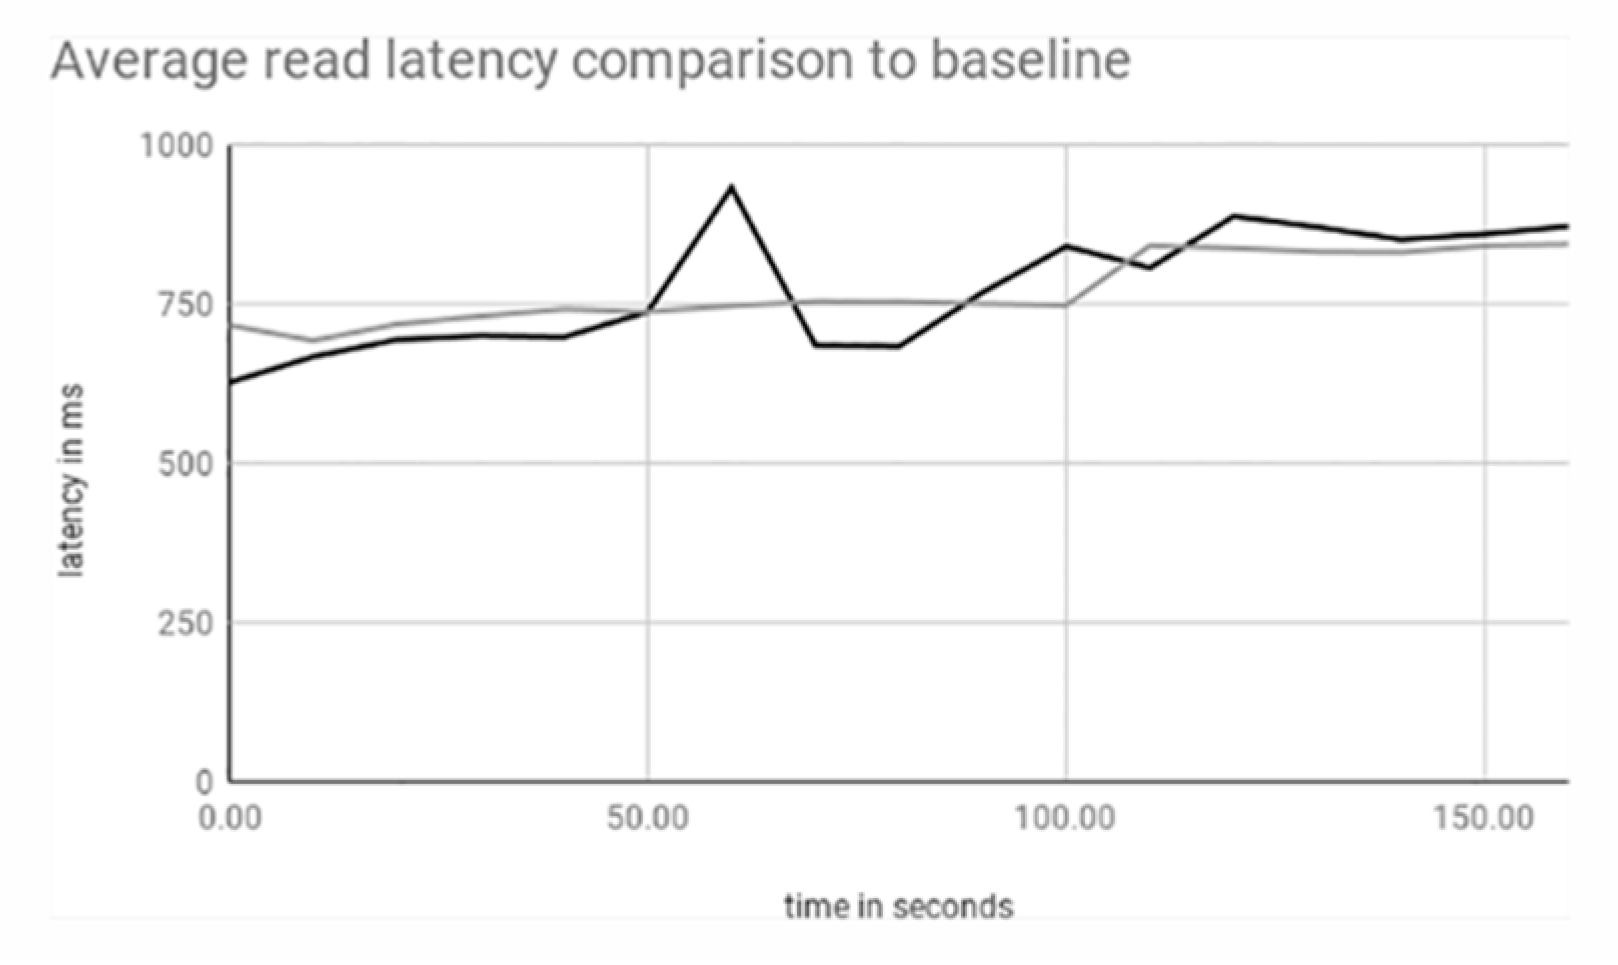
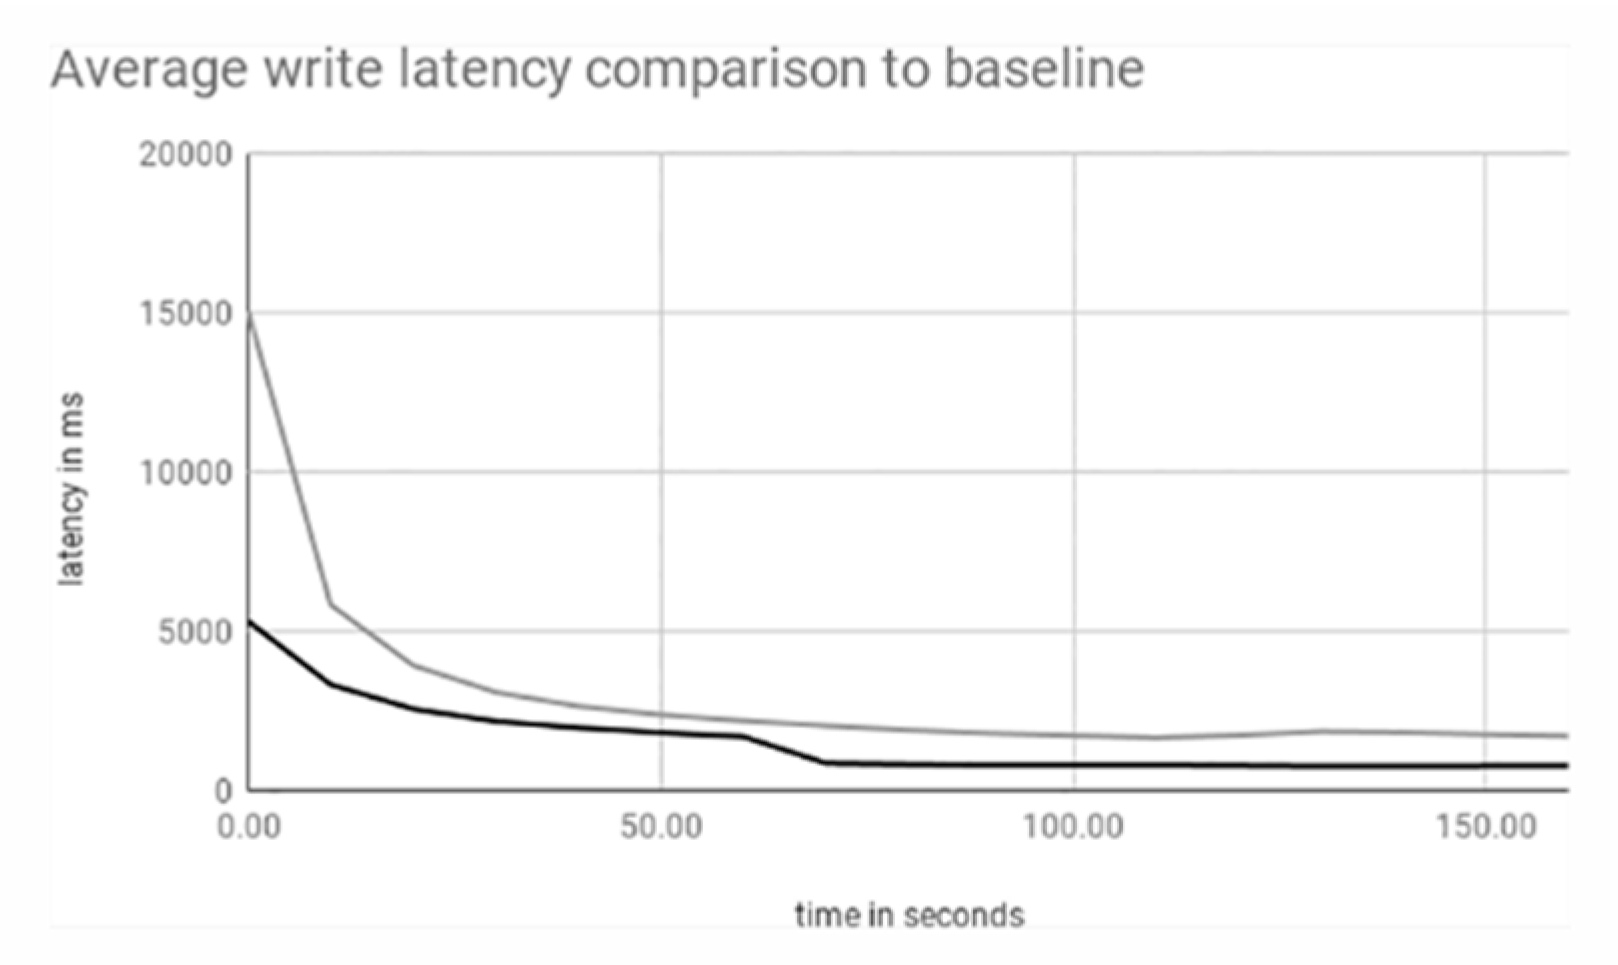
3.2. Single to Double Shard

This experiment shows the effects of scaling the cluster during operation. We notice a small spike in latencies during the addition and configuration of the new server, which is normal since many internal operations need to be executed in order to integrate the new server to the cluster. After the short spike, the curve returns to its normal behavior but at a lower level, achieving less peak latency, as shown in Figure 19 and Figure 20, which provide a comparison between the baseline single shard cluster (grey) and the scaled cluster (black).
For the command operations we can see the same spike in activity but, since all of the overhead of the scaling is translated in internal operations and the Mongos and configuration servers are not scaled, we can also see that the latency in these operations is increased by a certain amount, as shown in Figure 21.

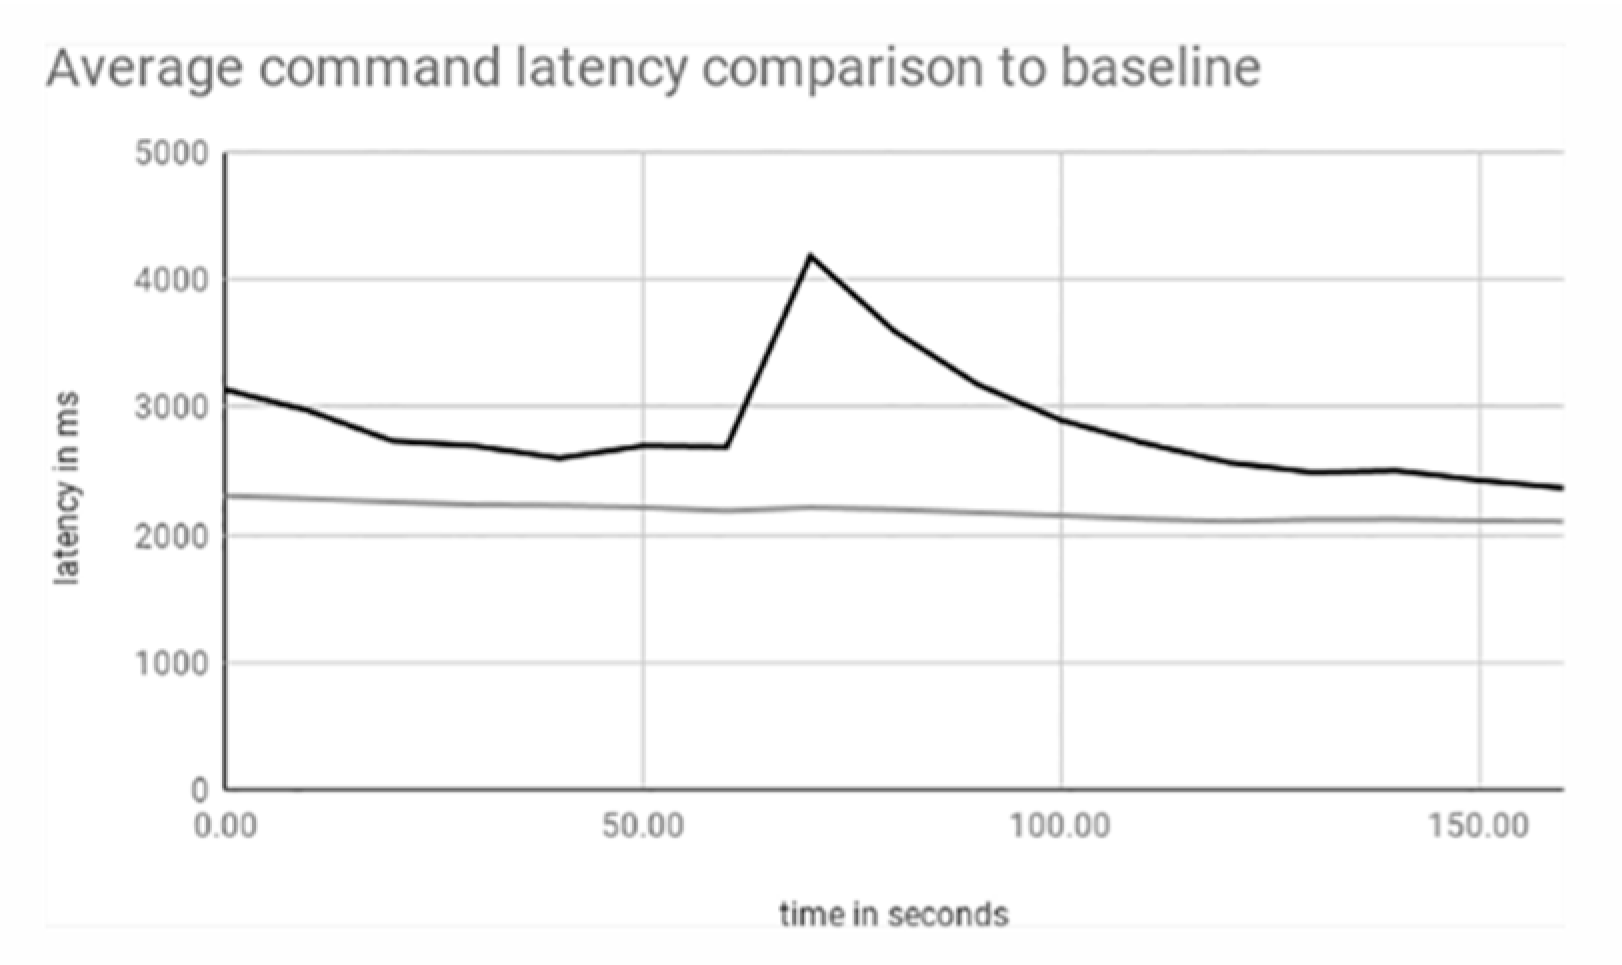
3.3. Single to Double to Triple Shard

This experiment shows more clearly the effects of scaling a MongoDB cluster in real time, during operation. We notice a spike in activity during the scaling process, which is possibly the result of a number of internal operations in order to integrate the new servers in the cluster and put them to use as discussed in the previous experiment. After the short spike, the latency drops below the level prior to the scaling and then starts to follow its normal curve for all three categories of operations, as shown in Figure 22 and Figure 23, which provide a comparison between the baseline single shard cluster (grey) and the scaled cluster (black).
This means that we are achieving lower peak latencies for the monitored duration and load. The exception here is the command operations, where the latencies are following the same trend as the others, but with increased average latency, as shown in Figure 24, possibly due to the plethora of internal operations needed for the scaling process; these operations have an overhead on the Mongos and configuration servers, which were not scaled like the shard servers.

4. Discussion

Our results show a clear superiority of the proposed recommendation system over the simple ElasticSearch queries, enhancing the QoE of the DaaS Marketplace user. This, combined with the semantic enhancements, is a valuable tool in knowledge discovery both in our use case and in any cloud- or fog-based environment. Moreover, the tests conducted with the repository scaling framework prove that we can ensure the QoS requirements of a cloud-based application by adding more data servers as the need arises. This process takes less than 10 seconds, and is thus a real-time solution, tackling demand spikes that are common in real world scenarios.
A further experiment of interest would be to examine the way the scaling of the Mongos and Configuration servers of the MongoDB cluster affects the increasing load on the cluster in practice, in order to explore if this has any value regarding the QoE of the DaaS Marketplace. Moreover, we could also examine other data stores, such as HDFS or MySQL, in order to examine their scalability and other relevant features in comparison to the MongoDB.

Author Contributions

Conceptualization, A.P. and V.M.; methodology, A.M. and A.P.; software, E.P., A.M, A.N. and A.C.; validation, E.P., A.P. and A.N.; formal analysis, A.M. and V.M.; investigation, E.P. and A.N.; resources, T.V. and V.M.; data curation, E.P., A.M. and A.N.; writing–original draft preparation, E.P., A.P., A.M., A.N and V.M.; writing–review and editing, E.P., V.M. and T.V.;visualization, E.P., A.N., A.P and A.C.; supervision, V.M. and T.V.; project administration, V.M. and T.V.; funding acquisition, V.M. and T.V. All authors have read and agreed to the published version of the manuscript.

Funding

The research leading to these results has received funding from the European Commission under the H2020 Programme’s project DataPorts (grant agreement No. 871493).

Conflicts of Interest

The authors declare no conflict of interest.

References

  1. The Rise of the Data Marketplace. March 2017. Available online: https://www.datawatch.com/wp-content/uploads/2017/03/The-Rise-of-the-Data-Marketplace.pdf (accessed on 23 March 2020).
  2. Reinsel, D.; Gantz, J.; Rydning, J. Data age 2025: The evolution of data to life-critical. In Don’t Focus on Big Data; IDC Corporate: Framingham, MA, USA, 2017; pp. 2–24. [Google Scholar]
  3. Häubl, G.; Murray, K.B. Preference Construction and Persistence in Digital Marketplaces: The Role of Electronic Recommendation Agents. J. Consum. Psychol. 2003, 13, 75–91, Social Science Research Network, Rochester, NY, SSRN Scholarly Paper ID 964192, Aug. 2001. [Google Scholar] [CrossRef]
  4. Elasticsearch, B.V. Open Source Search: The Creators of Elasticsearch, ELK Stack & Kibana | Elastic. 2020. Available online: https://www.elastic.co/ (accessed on 28 March 2020).
  5. Dang, T.K.; Vo, A.K.; Küng, J. A NoSQL Data-Based Personalized Recommendation System for C2C e-Commerce. In Database and Expert Systems Applications; Springer: Cham, Switzerland, 2017; pp. 313–324. [Google Scholar] [CrossRef] [Green Version]
  6. Lai, V.; Shim, K.J.; Oentaryo, R.J.; Prasetyo, P.K.; Vu, C.; Lim, E.P.; Lo, D. CareerMapper: An automated resume evaluation tool. In Proceedings of the 2016 IEEE International Conference on Big Data (Big Data), Washington, DC, USA, 5–8 December 2016; pp. 4005–4007. [Google Scholar] [CrossRef] [Green Version]
  7. Mbah, R.B.; Rege, M.; Misra, B. Discovering Job Market Trends with Text Analytics. In Proceedings of the 2017 International Conference on Information Technology (ICIT), Bhubaneswar, India, 21–23 December 2017; pp. 137–142. [Google Scholar] [CrossRef]
  8. Chen, D.; Chen, Y.; Brownlow, B.N.; Kanjamala, P.P.; Arredondo, C.A.G.; Radspinner, B.L.; Raveling, M.A. Real-Time or Near Real-Time Persisting Daily Healthcare Data Into HDFS and ElasticSearch Index Inside a Big Data Platform. IEEE Trans. Ind. Inform. 2017, 13, 595–606. [Google Scholar] [CrossRef]
  9. Klibisz, A. Elastik-Nearest-Neighbors. 2019. Available online: https://github.com/alexklibisz/elastik-nearest-neighbors (accessed on 28 March 2020).
  10. Amato, G.; Bolettieri, P.; Carrara, F.; Falchi, F.; Gennaro, C. Large-Scale Image Retrieval with Elasticsearch. In Proceedings of the 41st International ACM SIGIR Conference on Research & Development in Information Retrieval, Ann Arbor, MI, USA, 8–12 June 2018; pp. 925–928. [Google Scholar] [CrossRef] [Green Version]
  11. Gupta, P.; Kanhere, S.S.; Jurdak, R. A Decentralized IoT Data Marketplace. In Proceedings of the 3rd Symposium on Distributed Ledger Technology, Gold Coast, Australia, 12 November 2018. [Google Scholar]
  12. Ghosh, H. Data marketplace as a platform for sharing scientific data. In Data Science Landscape; Springer: Berlin/Heidelberg, Germany, 2018; pp. 99–105. [Google Scholar]
  13. Wien, T. Data as a Service, Data Marketplace and Data Lake–Models, Data Concerns and Engineering. Available online: https://linhsolar.github.io/ase/pdfs/truong-ase-2018-lecture4-daas_datalake_datamarket_dataconcerns.pdf (accessed on 28 March 2020).
  14. Smith, G.; Ofe, H.A.; Sandberg, J. Digital service innovation from open data: Exploring the value proposition of an open data marketplace. In Proceedings of the 2016 49th Hawaii International Conference on System Sciences (HICSS), Koloa, HI, USA, 5–8 January 2016; pp. 1277–1286. [Google Scholar]
  15. Mišura, K.; Žagar, M. Data marketplace for Internet of Things. In Proceedings of the 2016 International Conference on Smart Systems and Technologies (SST), Osijek, Croatia, 12–14 October 2016; pp. 255–260. [Google Scholar]
  16. Casalicchio, E.; Perciballi, V. Measuring docker performance: What a mess‼! In Proceedings of the 8th ACM/SPEC on International Conference on Performance Engineering Companion, L’Aquila, Italy, 22–26 April 2017; pp. 11–16. [Google Scholar]
  17. Jiménez, L.L.; Simón, M.G.; Schelén, O.; Kristiansson, J.; Synnes, K.; Åhlund, C. CoMA: Resource Monitoring of Docker Containers. In Proceedings of the 5th International Conference on Cloud Computing and Services Science, Lisbon, Portugal, 20–22 May 2015; pp. 145–154. [Google Scholar] [CrossRef] [Green Version]
  18. Soam, A.K.; Jha, A.K.; Kumar, A.; Thakur, V.K.; Hore, P. Resource Monitoring of Docker Containers. IJAERD 2016, 3. [Google Scholar] [CrossRef]
  19. Bagnasco, S.; Berzano, D.; Guarise, A.; Lusso, S.; Masera, M.; Vallero, S. Monitoring of IaaS and scientific applications on the Cloud using the Elasticsearch ecosystem. In Journal of physics: Conference Series; IOP Publishing: Bristol, UK, 2015; Volume 608. [Google Scholar]
  20. Abraham, S.M. Comparative Analysis of MongoDB Deployments in Diverse Application Areas. Int. J. Eng. Manag. Res. (IJEMR) 2016, 6, 21–24. [Google Scholar]
  21. Jose, B.; Abraham, S. Exploring the merits of nosql: A study based on mongodb. In Proceedings of the 2017 International Conference on Networks & Advances in Computational Technologies (NetACT), Trivandrum, Kerala, India, 20–22 July 2017; pp. 266–271. [Google Scholar]
  22. Aboutorabi, S.H.; Rezapour, M.; Moradi, M.; Ghadiri, N. Performance evaluation of SQL and MongoDB databases for big e-commerce data. In Proceedings of the 2015 International Symposium on Computer Science and Software Engineering (CSSE), Tabriz, Iran, 18–19 August 2015; pp. 1–7. [Google Scholar]
  23. Klein, J.; Gorton, I.; Ernst, N.; Donohoe, P.; Pham, K.; Matser, C. Performance evaluation of NoSQL databases: A case study. In Proceedings of the 1st Workshop on Performance Analysis of Big Data Systems, Austin, TX, USA, 1 February 2015; pp. 5–10. [Google Scholar]
  24. Docker-Build, Ship, and Run Any App, Anywhere. Available online: https://www.docker.com/ (accessed on 17 November 2017).
  25. Liu, Q.; Zheng, W.; Zhang, M.; Wang, Y.; Yu, K. Docker-based automatic deployment for nuclear fusion experimental data archive cluster. IEEE Trans. Plasma Sci. 2018, 46, 1281–1284. [Google Scholar] [CrossRef]
  26. Jovanov, G. Mongo + Docker Swarm (Fully Automated Cluster). In Medium; 2019; Available online: https://medium.com/@gjovanov/mongo-docker-swarm-fully-automated-cluster-9d42cddcaaf5 (accessed on 9 October 2019).
  27. Alam, M.; Rufino, J.; Ferreira, J.; Ahmed, S.H.; Shah, N.; Chen, Y. Orchestration of microservices for iot using docker and edge computing. IEEE Commun. Mag. 2018, 56, 118–123. [Google Scholar] [CrossRef]
  28. MacKenzie, C.M.; Laskey, K.; McCabe, F.; Brown, P.F.; Metz, R.; Hamilton, B.A. Reference Model for Service Oriented Architecture v1.0. In Reference Model for Service Oriented Architecture 1.0; OASIS: Burlington, MA, USA, 2006; Available online: https://docs.oasis-open.org/soa-rm/v1.0/soa-rm.html (accessed on 28 March 2020).
  29. Plebani, P.; Garcia-Perez, D.; Anderson, M.; Bermbach, D.; Cappiello, C.; Kat, R.I.; Marinakis, A.; Moulos, V.; Pallas, F.; Tai, S.; et al. Data and Computation Movement in Fog Environments: The DITAS Approach. In Fog Computing: Concepts, Frameworks and Technologies; Mahmood, Z., Ed.; Springer International Publishing: Cham, Switzerland, 2018; pp. 249–266. [Google Scholar]
  30. Plebani, P.; Garcia-Perez, D.; Anderson, M.; Bermbach, D.; Cappiello, C.; Kat, R.I.; Marinakis, A.; Moulos, V.; Pallas, F.; Pernici, B.; et al. DITAS: Unleashing the Potential of Fog Computing to Improve Data-Intensive Applications. In Advances in Service-Oriented and Cloud Computing; Springer: Cham, Switzerland, 2018; pp. 154–158. [Google Scholar]
Figure 1. DaaS Marketplace general architecture.
Futureinternet 12 00077 g001
Figure 2. Test class hierarchy.
Futureinternet 12 00077 g002
Figure 3. Semantic Resolution Engine architecture.
Futureinternet 12 00077 g003
Figure 4. Milan individual property relations.
Futureinternet 12 00077 g004
Figure 5. ItalianCity class hierarchy.
Futureinternet 12 00077 g005
Figure 6. Virtual Data Container (VDC) Blueprint tags.
Futureinternet 12 00077 g006
Figure 7. Data consumer query terms.
Futureinternet 12 00077 g007
Figure 8. Service’s Evaluation and Monitoring System (SEMS) general architecture.
Futureinternet 12 00077 g008
Figure 9. Data repository scaling deployment API architecture.
Futureinternet 12 00077 g009
Figure 10. Data repository scaling real-time API architecture.
Futureinternet 12 00077 g010
Figure 11. Test results of different ElasticSearch algorithms versus the proposed system in a pre-rated dataset.
Futureinternet 12 00077 g011
Figure 12. Test results of 10-fold cross validation between the GA10 algorithm of ElasticSearch and the proposed system.
Futureinternet 12 00077 g012
Figure 13. Commands latency curve versus the command operations count.
Futureinternet 12 00077 g013
Figure 14. Reads latency curve versus the command operations count.
Futureinternet 12 00077 g014
Figure 15. Writes latency curve versus the command operations count.
Futureinternet 12 00077 g015
Figure 16. Average reads latency (in ms) curve versus the time in seconds.
Futureinternet 12 00077 g016
Figure 17. Average commands latency (in ms) curve versus the time in seconds.
Futureinternet 12 00077 g017
Figure 18. Average writes latency (in ms) curve versus the time in seconds.
Futureinternet 12 00077 g018
Figure 19. Average read latency of scaled cluster versus the baseline, single shard cluster.
Futureinternet 12 00077 g019
Figure 20. Average write latency of scaled cluster versus the baseline, single shard cluster.
Futureinternet 12 00077 g020
Figure 21. Average command latency of scaled cluster versus the baseline, single shard cluster.
Futureinternet 12 00077 g021
Figure 22. Average read latency of twice scaled cluster versus the baseline, single shard cluster.
Futureinternet 12 00077 g022
Figure 23. Average write latency of twice scaled cluster versus the baseline, single shard cluster.
Futureinternet 12 00077 g023
Figure 24. Average command latency of twice scaled cluster versus the baseline, single shard cluster.
Futureinternet 12 00077 g024
Table 1. NoSQL datastore families, examples and short descriptions [21,23].
Data FormatExamplesDescription
Key-ValueRiak, Redis, CouchbaseThese databases use a key-value data format in order to create primary keys, which improve their performance when the single primary key architecture is possible.
DocumentMongoDB, CouchDB, TerrastoreThese databases provide the advantage of storing all information concerning an object in a single document, using nested documents and arrays. This improves the performance, minimizing the queries needed to retrieve all requested data and removing the need to join tables. It also provides the ability to create indexes based on any datafield in a document, not only primary keys.
Column familyHBase, Cassandra, Amazon DynamoDBThese systems initially resemble an SQL datastore, having columns and rows, but they provide the ability of inserting unstructured data. This is possible because instead of using regular columns, they use column families that are grouped together in order to form a traditional table.
GraphNeo4J, FlockDB, InfiniteGraphThese datastores are based on the relations between each datapoint, which is called a node. These nodes and the relations between them form clusters of data in the form of graphs. The datastores perform well when the relation between the data points is more important than or at least as important as that of the actual data contained in the nodes. Their intolerance to horizontal partitioning makes them hard to use in data intensive production environments.

