
A Study of Gender Bias in Face Presentation Attack and Its Mitigation


1
Department of Computer Science, North Carolina A & T State University, Greensboro, NC 27411, USA
2
Department of Computer Science, Winston-Salem State University, Winston-Salem, NC 27110, USA
*
Author to whom correspondence should be addressed.
Future Internet 2021, 13(9), 234; https://0-doi-org.brum.beds.ac.uk/10.3390/fi13090234
Submission received: 4 July 2021
/
Revised: 18 August 2021
/
Accepted: 25 August 2021
/
Published: 14 September 2021
(This article belongs to the Collection Machine Learning Approaches for User Identity)
Abstract
:In biometric systems, the process of identifying or verifying people using facial data must be highly accurate to ensure a high level of security and credibility. Many researchers investigated the fairness of face recognition systems and reported demographic bias. However, there was not much study on face presentation attack detection technology (PAD) in terms of bias. This research sheds light on bias in face spoofing detection by implementing two phases. First, two CNN (convolutional neural network)-based presentation attack detection models, ResNet50 and VGG16 were used to evaluate the fairness of detecting imposer attacks on the basis of gender. In addition, different sizes of Spoof in the Wild (SiW) testing and training data were used in the first phase to study the effect of gender distribution on the models’ performance. Second, the debiasing variational autoencoder (DB-VAE) (Amini, A., et al., Uncovering and Mitigating Algorithmic Bias through Learned Latent Structure) was applied in combination with VGG16 to assess its ability to mitigate bias in presentation attack detection. Our experiments exposed minor gender bias in CNN-based presentation attack detection methods. In addition, it was proven that imbalance in training and testing data does not necessarily lead to gender bias in the model’s performance. Results proved that the DB-VAE approach (Amini, A., et al., Uncovering and Mitigating Algorithmic Bias through Learned Latent Structure) succeeded in mitigating bias in detecting spoof faces.
1. Introduction
Facial data-based technologies are key applications of artificial intelligence that recently have become significantly more popular. They include face detection [1,2,3], facial recognition, gender prediction, age estimation, and emotion prediction. The most beneficial facial data-based technology is facial recognition. It is used in both private and governmental biometric systems due to its essential role in authentication and identification.
Most information systems today including economic, political, educational, nuclear, industrial, and security systems employ the face recognition feature to authenticate their users. Moreover, facial identification is globally used by governments and law enforcement agencies to track down criminals and terrorists. Ordinary people have also been affected by the spread of facial recognition technology; they have such features in their own generic devices. However, in spite of the widespread use of facial recognition systems, they can be targets for attackers. Their critical role as a biometric solution for authentication and identification systems increases their vulnerability to face presentation attacks. An attacker can carry out such attacks to perform dangerous actions such as accessing private information, gaining high clearance permissions, manipulating judgment systems, or accessing unauthorized facilities. As a result building strong presentation attack detection (PAD) systems has become a necessity.
Throughout the time, facial recognition and presentation attacks detection (PAD) systems have seen many improvements but their major breakthrough came after applying deep learning networks to their models [1,2,4]. Since then, facial recognition and presentation attack detection CNN (convolutional neural network)-based models have achieved a significantly higher degree of accuracy and performance compared to traditional models. Deep learning models such as CNN models are based on both machine learning ML and artificial neural networks ANN. They do not require any manual classification, feature extraction, or extensive preprocessing, and that has led to higher accuracy. Their performance and learning ability exceed human performance and increase as the size of data increases.
Despite the revolutionary advances that have been achieved in facial detection and recognition through employing deep learning techniques [5,6], the creditability of these systems is still widely debated by the public and the media. It is claimed that facial technology is biased and demonstrates different results for different demographic groups. Those claims have noticeably risen since the experiments which were conducted on Amazon’s facial technology (Rekognition software) resulted in misidentifying over thirty-five American and British parliament members [3]. Consequently, bias in facial recognition became an area of interest for researchers. Researchers such as Singh et al. studied the reliability of current face recognition models in [7]. They demonstrated how face recognition technology is in danger of presentation attacks and demographic bias. Most of the findings indicated biased behavior and showed unfairness in the performance of facial data-based systems toward people from different demographic populations. However, there have not been similar efforts in studying bias in the area of presentation attack detection (PAD) systems. One research was conducted to discover whether iris-based presentation attack detection models are biased or not. Its results showed unfairness in detecting attacks for subjects from different genders [8].
The revealed bias in facial recognition systems and iris-based PAD systems led us to infer the existence of similar demographics unfairness in face-based PAD systems. Therefore, our goal is to investigate bias in hardware independent face PAD systems using CNN models and then exploring the mitigation of potential bias using the debiasing variational autoencoder algorithm proposed by Amini et al., 2019 [9].
Presentation attacks involve the action of deceiving the biometric system with a spoof biometric characteristic or behavior. In general, presentation attacks are classified into two main categories: impersonation and obfuscation attacks. In impersonation attacks, the attacker attempts to deceive the system sensor to impersonate a legitimate user. While with obfuscation attack, the attacker attempts to fool the system sensor so the system does not recognize him/her.
ISO/IEC 30107 terms, definitions, and standards [10] are used in this research to describe presentation attack and PAD systems, and to evaluate PAD system performance. ISO/IEC 30107 defines presentation attack detection as discovering presentation attacks using an automated system. The subject of a presentation attack can be either impostor or identity concealer. The impostor attempts to impersonate a legitimate user of the system through being matched to his/her biometric records, whereas the identity concealer attempts to avoid matching his/her capture to his biometric records. The biometric feature used in the presentation attack is called the presentation attack instrument (PAI) and the object used as the fake biometric feature is called artefact.
PAD systems have gone through many stages of development since 2004. First PAD systems used basic methods that were based on extracting Liveness features to decide whether it is a bona-fide presentation or an attack presentation. Ultimately, PAD technology was applied with more effective methods with remote photoplethysmography (rPPG), domain adaption, and deep learning [4].
The contribution of this research includes the following:
- We evaluate the fairness of current CNN-based PAD methods.
- We study the effect of the size of the training and test data on bias in the performance of PAD systems.
- We explore the capability of the novel and most recent debiasing variational autoencoder [9] to mitigate bias in PAD.
2. Related Work
In this section, we review recent studies relevant to assessing and mitigating demographic bias in facial data-based technology in general. Much research has been conducted to assess bias in facial data-based technology and most of them noticed different results for different demographic groups.
2.1. Investigating Bias in Facial Data-Based Technology
Georgopoulos et al. [11] tested different deep learning based-face technology models such as facial recognition and gender prediction to find whether there is a bias in those systems or not. Moreover, the ten coding schemes method was used in [12] to analyze the diversity of subjects’ faces in their proposed KANface dataset. In term of gender, female images were better recognized than male ones. Whereas, videos samples for both genders were recognized with similar accuracy.
Klare et al. [13] also investigated bias in face recognition and the effect of demographic distributions of dataset on the performance of face recognition models. In this research, six open source trainable and non-trainable and commercial non-deep CNN-based models were examined on the Pinellas County Sheriff’s Office (PCSO) image dataset. The dataset was divided to eight groups for different genders, races, and age scales. The results demonstrated that youth, women, and dark skin groups were harder to recognize by all models. Receiver operating characteristic (ROC) curves and false match rate (FMR) were used to evaluate the matching accuracy.
The fairness of face verification of different groups with one or more demographic attributes was studied by researchers in [14]. They used equally diverse subset of MORPH dataset to recognize and verify subjects from different gender, age, and race cohorts. Two models were used in the study: One was commercial and the second was based on the Oxford Visual Geometry Group’s VGG network. They concluded that the women were harder to be verified than men, and demographic attributes have considerable effect on the verification accuracy.
Robinson et al. [15] conducted many experiment to closely observe the effect of gender and ethnicity on face verification models. They found that face verification was more accurate for males than females, which concur with the results in [14].
In addition, Cook et al. [16] studied different types of datasets, which are not publicly available. Cook et al. [16] used images of subjects from eleven different face acquisition systems to examine the effect of skin reflectance, age, eyewear, gender, and height on the performance of the acquisition systems. Findings showed that demographic attributes have an effect on the accuracy of the biometric system. Subjects with darker skin color, females, young people, and subjects without eyewear had less efficient and inaccurate image acquisition process.
The fairness of gender prediction tools was studied by researchers in [17]. They used three COTs software to predict the gender of northern European and African parliamentarians from online images. The dataset used was created from the web, and then gender and Fitzpatrick scale-based skin tone labels were added. This research concluded that despite the type of tool applied, prediction of the gender of females and subjects with dark skin were less accurate compared to males and people with light skin. As a result it was most challenging to predict the gender of black women.
When using mugshots [18], Caucasians and African American had lower rates of false negative than Asians and American Indians. With respect to age and gender, male and older subjects had lower false negative rates. However, researchers assume those differences are not caused by age or race. In case of comparing high-quality to low-quality images of the subjects, false negative rates in general were high, and bias is more difficult to measure with low-quality images. Females were noticed to have higher false negative rates. Finally, by comparing bad quality images, it was found that Africans and Caribbeans especially older people had higher false negative rates.
2.2. Mitigating Bias in Face Recognition Systems
To have more credible and accurate face recognition technology, many studies were conducted to mitigate bias. Some researchers proposed methods to improve the models and algorithms whereas, others tried to preprocess or balance the training data.
2.2.1. Reducing Bias by Improving Recognition Model
Das et al. [19] presented a solution to reduce bias that involves applying a multi-task convolution neural network (MTCNN). The MTCNN uses specific joint dynamic loss weight to enhance classification of some soft biometrics such as gender and age, and make it less bias. The MTCNN was applied on two large datasets: the UTKFace and the bias estimation in face analytics (BEFA) dataset, which was the dataset used in BEFA-challenge of the European Conference on Computer Vision (ECCV) 2018. The results showed a rise in the performance and the MTCNN algorithm won the first place in the BEFA-challenge.
In order to reduce such bias, Wang et al. [20] focused on using domain adaption and proposed a deep information maximization adaptation network to improve the generalization of the models. Moreover, researchers applied an innovative mutual information loss function to increase the model ability to discriminate different classes.
Two solutions were suggested by Klare et al. [13] to improve the accuracy of face recognition. The first one uses dynamic face matcher selection in which the algorithms trained with different demographical groups are combined. The second solution is to use more balanced training dataset in terms of demographic groups.
2.2.2. Mitigating Bias by Removing Demographic Features
A method based on separating non-discriminative demographic features from the network embedding was proposed in [11] to mitigate bias resulted from unbalanced training data. However, it was useful only with bias toward age when applying face and gender recognition and it failed to remove gender bias for the age estimation and face recognition tasks. For skin tone, increasing the variation of skin tone in the training data caused the baseline models to generally perform better.
Others like Yucer et al., 2020 [21] focused on creating an unbiased dataset by using unusual method through applying preprocessing tools to remove racial features of subjects using transformation. This technique transforms images to many racial domains without removing identity discriminative features. This method can mainly be used when the dataset is racially unbalanced. In the study, three CNN-based models were used and compared, and the results demonstrated improvements in the performance of the models with races being the minority in the dataset.
2.2.3. Reducing Bias by Resampling Data during Training
Amini et al. [9], proposed an algorithm called Debiasing Variational Autoencoder (DB-VAE) to mitigate possible biases in the training datasets. This algorithm was applied with CNN algorithm on the Pilot Parliaments Benchmark (PPB) dataset to mitigate the drop in performance toward specific gender or race. Its main idea is based on learning the latent structure within dataset by merging the original learning task with a variational autoencoder and then using this knowledge in the training stage to assess the importance of specific data features. The model was successful in increasing the accuracy and fairness of classification when compared to regular models. This method was chosen to be examined in our research.
2.3. Bias in Presentation Attack Detection Systems
Applying deep learning technology especially deep CNN has considerably improved accuracy in detecting presentation attacks ([2,22]). However, CNN-based PAD models need to be examined for any potential bias.
To our knowledge there is only one research conducted to study the fairness of presentation attack detection technology [8]. This paper is related to iris-based presentation attack detection.
In [8], three iris PAD algorithms were explored in order to observe their behavior toward different demographic groups. The NDCLD database proposed in [23] was used in this study but due to its limited diversity, only gender bias was measured. Using different dataset scenarios for training and testing, both the performance and results of iris PAD systems were monitored, analyzed, and compared for men and women. Researchers in [8] concluded that presentation attacks targeting women were noticeably harder to detect.
3. Methodology
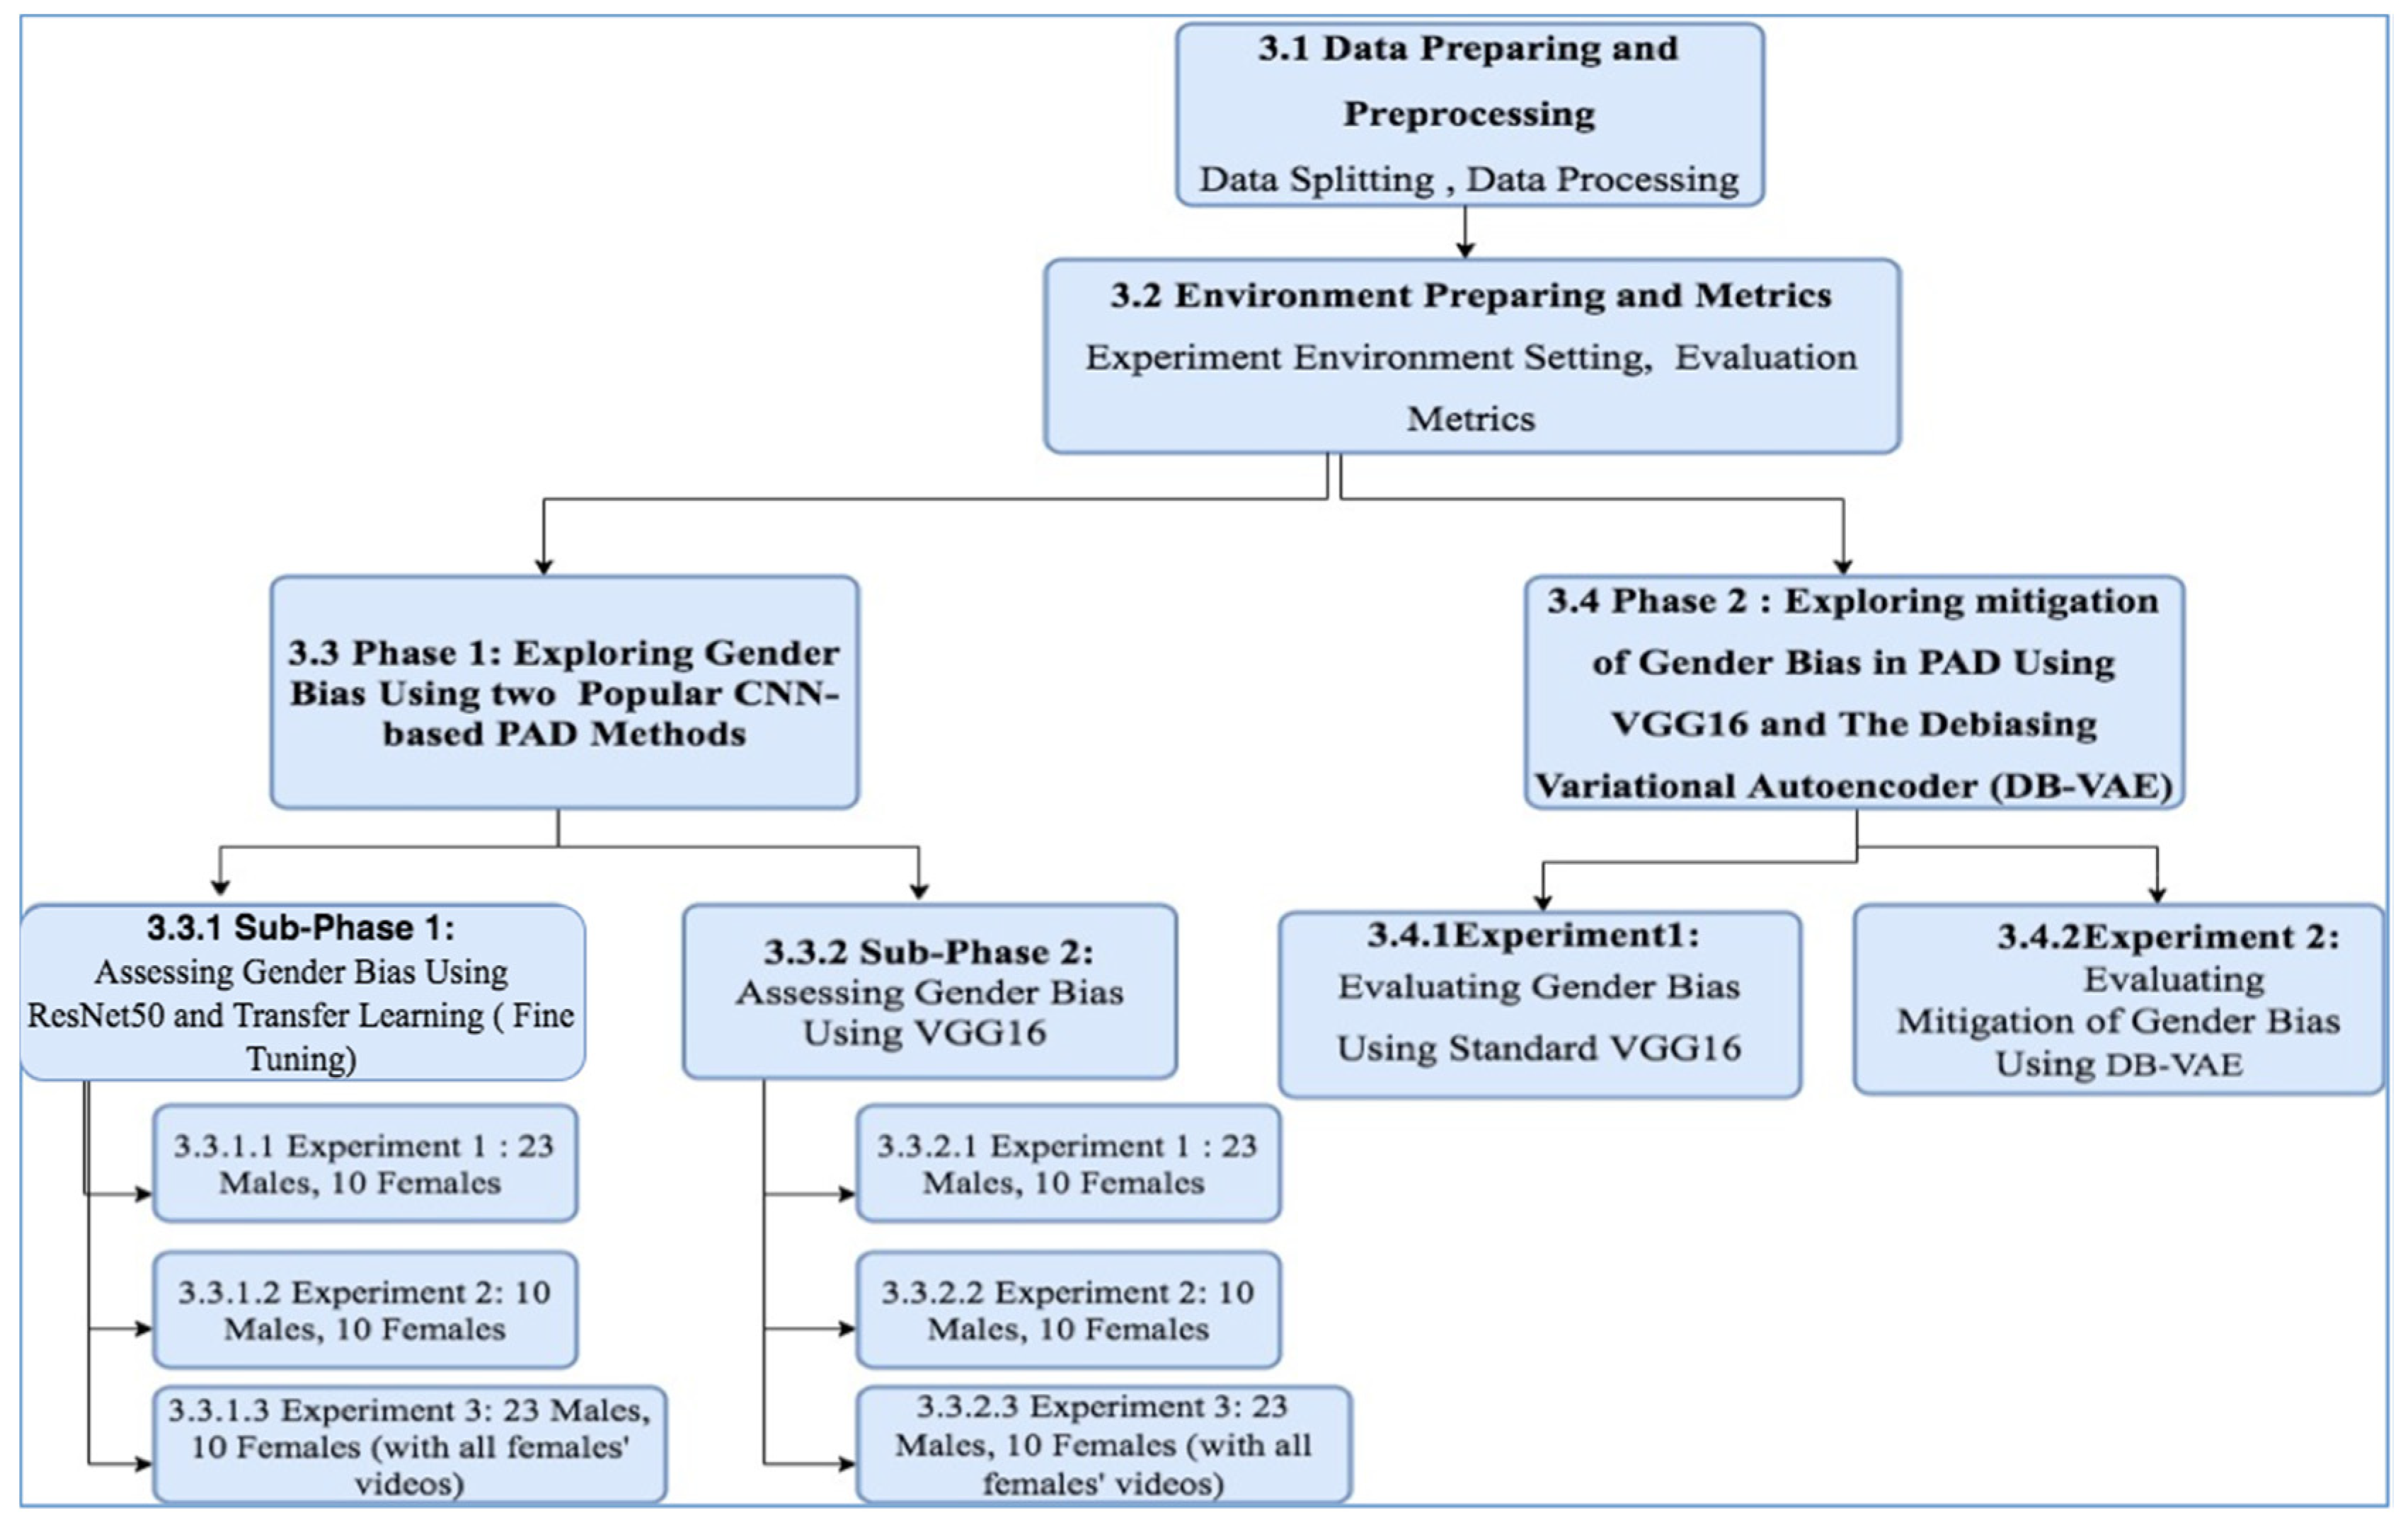
To investigate gender bias in CNN-based presentation attack detection methods, two key phases were implemented. In the first phase, gender bias in face presentation attack detection using the CNN models ResNet50 (Residential Network) with transfer learning and VGG16 (OxfordNet) was explored. The second phase focused on exploring the mitigation of gender bias in face presentation attack detection using the debiasing variational autoencoder (DB-VAE) approach [9]. See Figure 1 for the steps of methodology used.
3.1. Data Preparing and Preprocessing
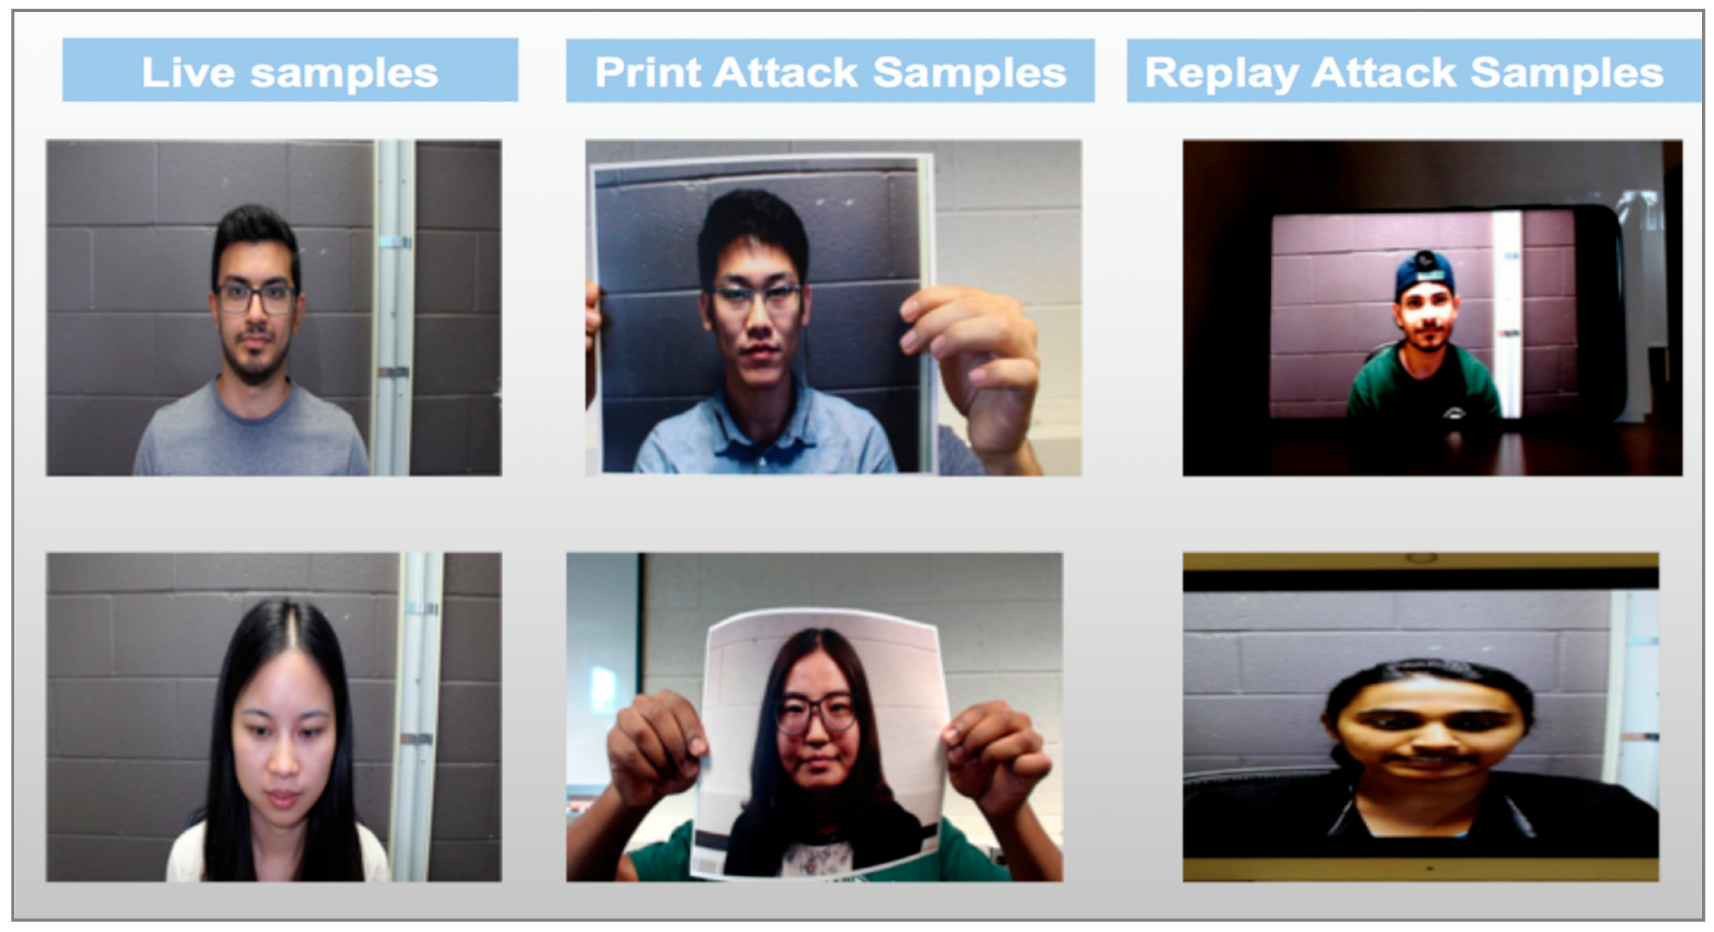
Spoof in the Wild (SiW) dataset [2] is the source of the data used in all experiments in this research. SiW has been used as a benchmark dataset, and it has a variety of presentation attacks and presentation attack instruments. It contains high and low quality printed images and videos made using four different presentation attack instruments. The images and videos are used for print attacks and replay attacks respectively. Another reason to choose SiW is the racial diversity of SiW compared to other public anti-spoofing datasets. SiW is the only dataset that contains Indian subjects and it has the highest rate of African Americans. It also includes images for both males and females, and its data samples are more realistic as they have expressions such as happiness and surprise and images of different qualities (pose, lighting, and resolution). The types of face spoofing attacks in SiW dataset varies between photo attacks and video replay attacks. Figure 2 shows the samples of attacks in SiW.
3.1.1. Data Splitting
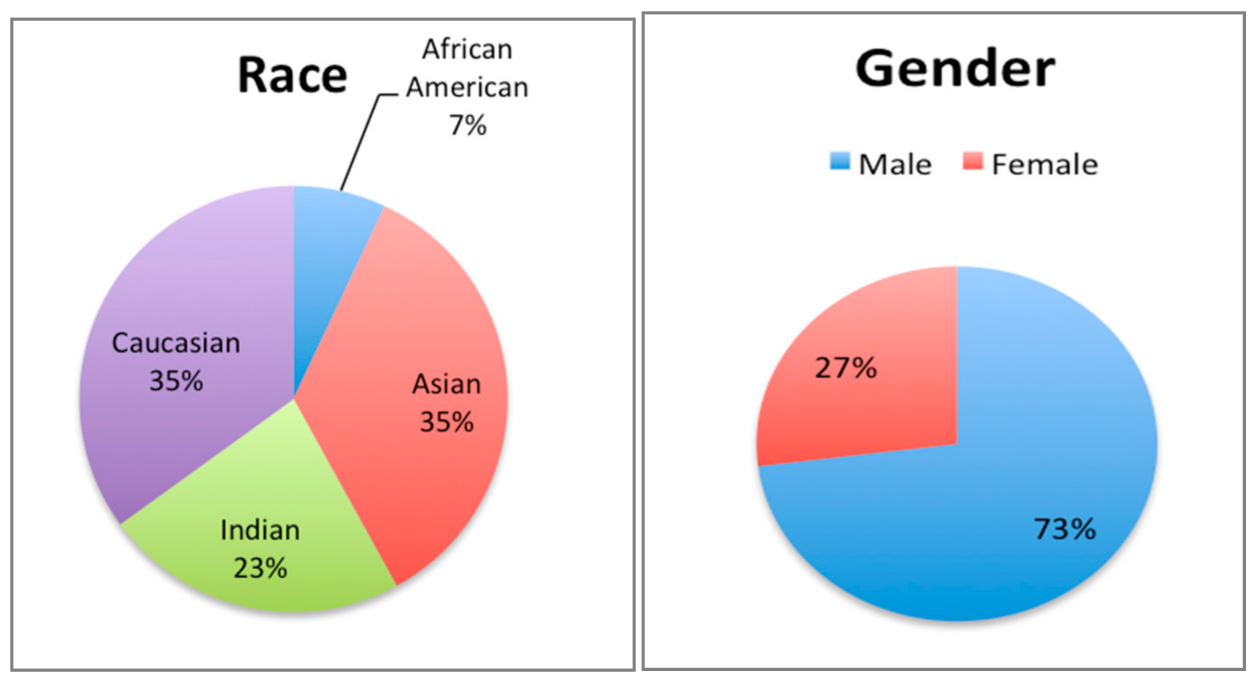
SiW has 160 subjects and 4478 videos and is demographically distributed as seen in Figure 3. The total number of SiW videos used in this research was 1144 videos. Each of the 160 subjects was included in the subset with 3 live and 4 spoof videos. Data were split to the following portions: 60% for training, 20% for validating, and 20% for testing. This division ratio was chosen to ensure that the models perform well on unseen data.
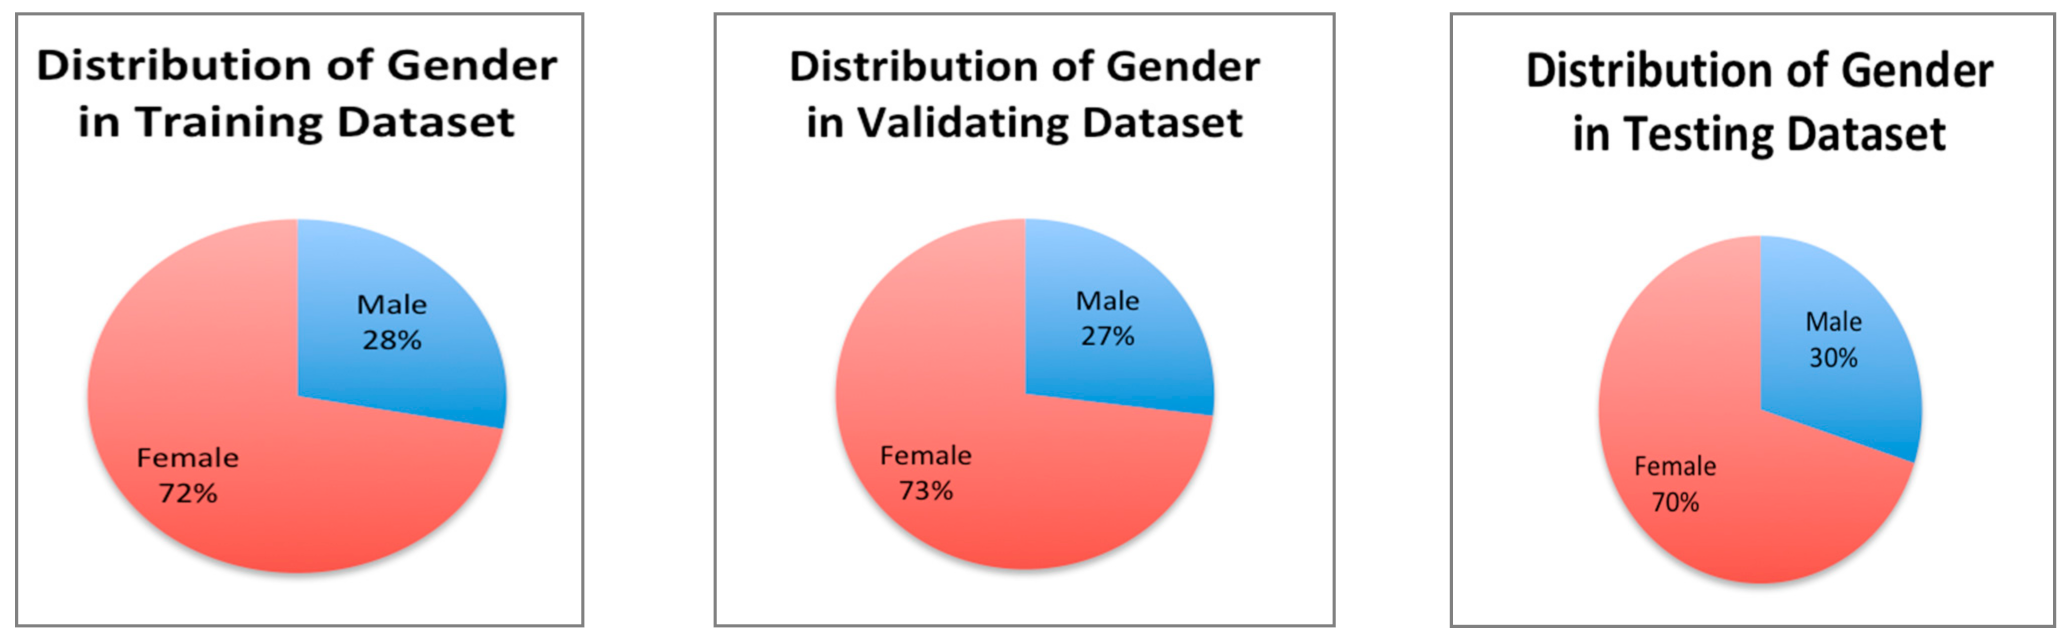
Data were split manually to guarantee that each portion of the data contains diverse images of males and females from all races. In addition, random samples of both replay and print attacks were included in each portion. See Figure 4 for distribution of gender in our SiW sub-dataset.
3.1.2. Data Preprocessing
Data underwent many preprocessing steps. Those steps include applying techniques such as framing, normalization, labeling, removing background, augmentation, and resizing.
Data Framing: Videos were framed using Open CV library in Python with method.VideoCapture(). For the first phase (exploring bias using ResNet50 and VGG16), all the frames in the videos were extracted (up to 2600 per video). Then the frames were manually examined to remove black or bad frames. However for the second phase only 15 frames per video were selected due to memory constraints.
Data Normalization: Pixel intensity of all images were normalized or rescaled to a range between 0 and 1 during preprocessing. To normalize data, the ImageDataGenerator class from the Neural Network library Keras was used.
Data Resizing and Augmentation: All images were resized to 224 × 224 and converted to the input shape 24 × 24 × 3 (height × width × channel). This input shape works for both VGG16 and ResNet50. To increase data volume and diversity and enhance training process, the data were augmented during preprocessing on-the-fly. Augmentation techniques include cropping, flipping, rotating, and changing contrast of the original images.
3.2. Environment Preparing and Metrics
In this step the processors, software, and libraries needed for deep learning were prepared. In addition, classification types, loss and activation functions, and evaluation metrics were specified.
3.2.1. Experiment Environment Setting
To conduct the deep learning experiments Anaconda, Google Colab editors were lunched and the necessary updates were completed. In addition, libraries such as Keras, Tensor flow, Sklearn, Numpy, Matplotlib, and Panda were installed and imported as needed.
Preprocessing, training, and predicting were implemented using both MacBook with i5 CPU and Google Colab GPU with 16 GB. The classification types used in the experiments include binary and categorical classification. Activation functions such as Sigmoid, Softmax, Linear, and ReLU functions were used. The loss functions used varied between categorical_crossentropy, binary_crossentropy, and binary_crossentropy_with logits. In terms of hyperparameter, each phase has its own hyper-parameters demonstrated in a separate table. They were set before starting the training process.
3.2.2. Evaluation Metrics
The metrics APCER, BPCER, and ACER which were proposed in ISO/IEC 30107-3 [10] were used to evaluate the performance of VGG16, ResNet50, and the DB-VAE model. In addition, AUC, EER, HTER, FAR, FRR, Recall, Precision, and overall Accuracy are compared in each experiment for both genders. See Table 1 for more details about the metrics used.
3.3. Phase 1: Exploring Gender Bias in Different CNN- Based Face Presentation Attacks Detection Methods
In this phase, two popular CNN architectures: ResNet50 and VGG16 were used to detect spoof faces in SiW’s test samples. Each model was implemented on three different sizes of test dataset. The first subset includes 23 males and 10 females and the second one includes 10 males and 10 females with 3 live and 4 spoof videos for each, while the third dataset contains 23 male subjects with 3 live and 4 spoof videos and 10 females subjects with 6 and 8 live and spoof videos. The reason behind creating the second and third subsets is to have a balanced testing data in term of gender and explore the effect of size on testing results.
3.3.1. Exploring Gender Bias in Detecting Face Presentation Attacks Using ResNet50 Architecture and Transfer Learning
The-state-of-art residual networks ResNet proposed in [25] are commonly used for face analysis tasks due to its outstanding performance and fast training time. ResNet consists of more conventional layers (18, 36, 50 up to 1202 layers) so it trains deeper than traditional CNN models. The ResNet50 with 50 conventional layers with transfer learning was chosen to conduct experiments of this phase. Transfer learning is known for improving model performance and reducing training time. ResNet50 was previously trained on the ImageNet dataset in [26] so this knowledge was used in this stage.
Model construction: A sequential CNN model that has a pre-trained ResNet50 model as the backbone and an additional dense layer was built to complete this sub-phase. The weights of the fully connected top layers of ResNet50 were not included. The ResNet50 model was used here as integrated feature extractor and weights initializer for the new model after removing top. Layers of the ResNet50 were frozen and weights were not updated when training the last layer of the new model on SiW.
Hyper-Parameters Setting: Choosing the optimal hyper-parameters is an essential factor that affects training and predicting process. Table 2 shows the values of hyper-parameters used with training ResNet50 for categorical classification. Hyper-parameter were tuned based on the data size and after showing high accuracy.
3.3.2. Exploring Gender Bias in Detecting Face Presentation Attacks Using VGG16 Architecture
VGG16 is another popular CNN model that is used in detecting spoof. In this step VGG16 was trained on SiW without using any previous weights, so VGG16 learned from scratch in this stage.
Model Construction: VGG16 model was built from scratch. It consists of a specific sequence of convolutional and MaxPool layers. The total numbers of the convolutional and the MaxPool layers used in the model are 16 and 5 respectively. After the model was constructed, it was only trained on the training dataset of SiW without using any previous weights.
Hyper-parameters Setting: Table 3 shows the values of hyper-parameters used in experiments with VGG16 for binary classification.
3.4. Phase 2: Exploring Mitigation of Gender Bias in Detecting Face Presentation Attacks Using VGG16 Architecture and the Debiasing Variational Autoencoder (DB-VAE)
In this phase, the VGG16 was used to evaluate bias in presentation attack detection. Then it was used as an encoder in the debiasing variational autoencoder (DB-VAE) proposed in [9] instead of the standard CNN model. The purpose of using the (DB-VAE) here is to investigate its ability to reduce bias in face presentation attack detection.
3.4.1. The Debiasing Variational Autoencoder (DB-VAE)
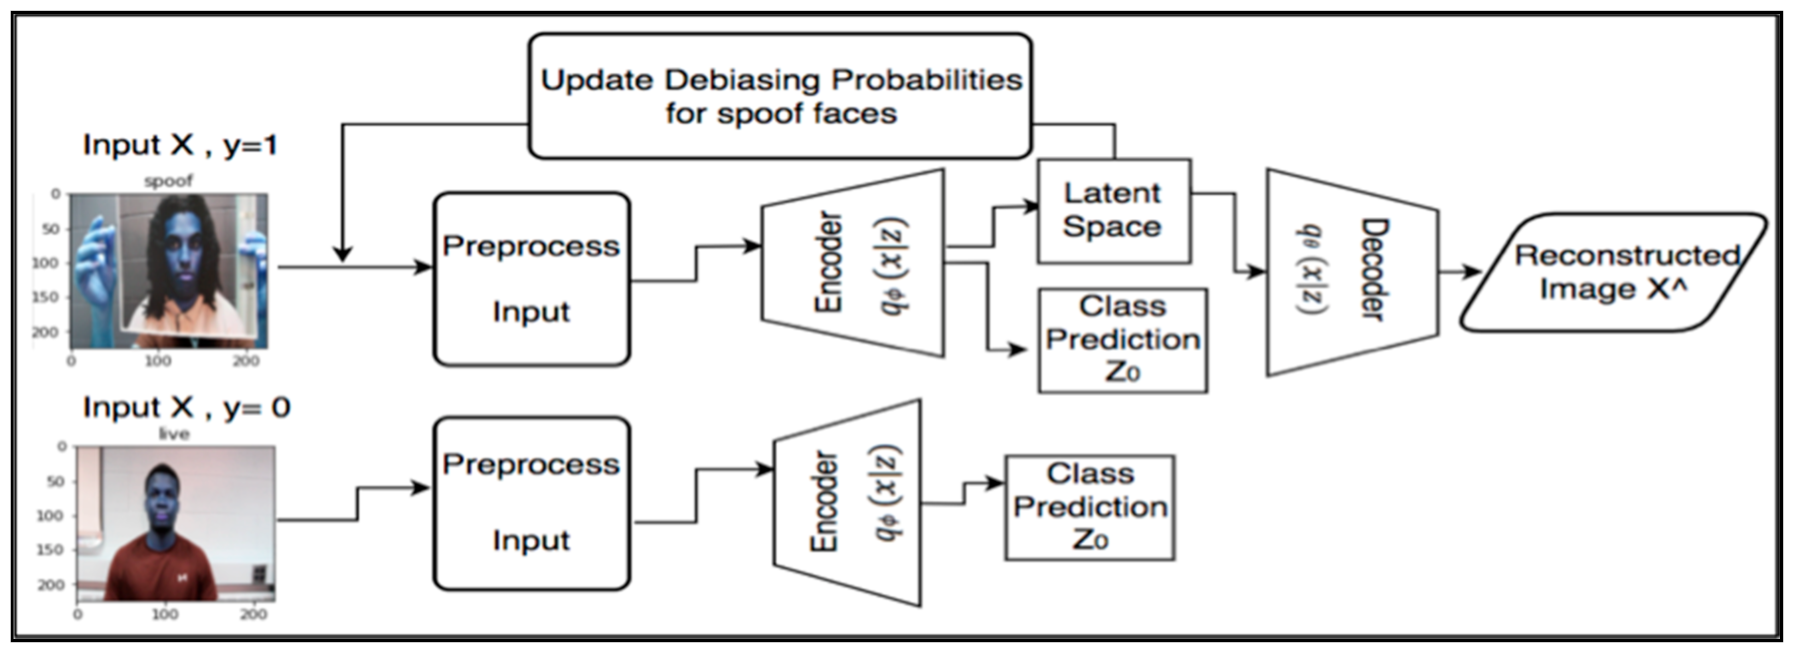
DB-VAE is an innovative addition to the variational autoencoder (VAE) network that was proposed in [9]. There are two fundamental properties of DB-VAE that make it more powerful than traditional VAE. The first is that during training, the DB-VAE works to create a balance in sample probabilities of images between faces with infrequent and frequent representation [9]. The second unique feature is that when the class label y is positive, the encoder will produce not only an unsupervised sampled latent variable but also a prediction class that is learned in a supervised method. This will lead to resampling data of positive class and eliminate bias during training. The new algorithm combines supervised learning with unsupervised learning to get a novel semi-supervised algorithm. See Figure 5 for the architecture of the DB-VAE.
3.4.2. Algorithm of the Debiasing Variational Autoencoder (DB-VAE) Used to Explore the Mitigating of Gender Bias in Face PAD
3.4.3. Dataset Adjustment
Implementing the DB-VAE requires equal number of subjects from each gender so the test data were adjusted to meet this requirement. In order to create a balance in gender distribution of subjects in the test dataset, three of male subjects were moved to the train folder and ten more female subject were added to the test data. See Figure 7 for the new distribution of gender in each portion of data. Each subject has three live and four spoof videos. However, the size of data was reduced, with only 15 frames per video due to memory constraints.
3.4.4. Hyper-Parameter Setting for DB-VAE and VGG16
Table 4 shows the hyper-parameter used in experiments in this phase. Number of epoch was reduced here because data size was reduced compared to phase 1.
4. Experimental Results
In this section, we report the results of eight experiments that were completed as parts of the two phases mentioned previously under Section 3.3 and Section 3.4. The first phase assessed gender bias in presentation attack systems using two CNN-based models. The second phase explored the mitigation of gender bias using the debiasing variational autoencoder (DB-VAE) [9] and VGG16. The results are displayed using tables, confusion matrixes, pie charts, ROC curves, and classification reports. While reporting our findings, the related explanations, comparisons, and analysis are presented. In the last section, discussions and summary are provided.
4.1. Phase 1: Evaluating Gender Bias in Different CNN-Based Face Presentation Attacks Detection Methods
In this subsection, results are organized under two sub-phases. The first sub-phase is related to assessing gender bias using ResNet50 and transfer learning. The second sub-phase is related to evaluating gender bias in PAD systems with VGG16.
As mentioned in Section 3.3, experiments with ResNet50 and VGG16 included implementing the model on three test datasets that vary in size. The first one is the original dataset in which the number of female samples are less than half of that for males. In the second and last datasets, the numbers of females and males’ samples are close.
4.1.1. Exploring Gender Bias Using ResNet50 and Transfer Learning
This subsection covers the results of three related experiments.
ResNet 50’s Experiment 1
It was conducted with the original test dataset that includes 23 males and 10 females with 3 live and 4 spoof videos per subject.
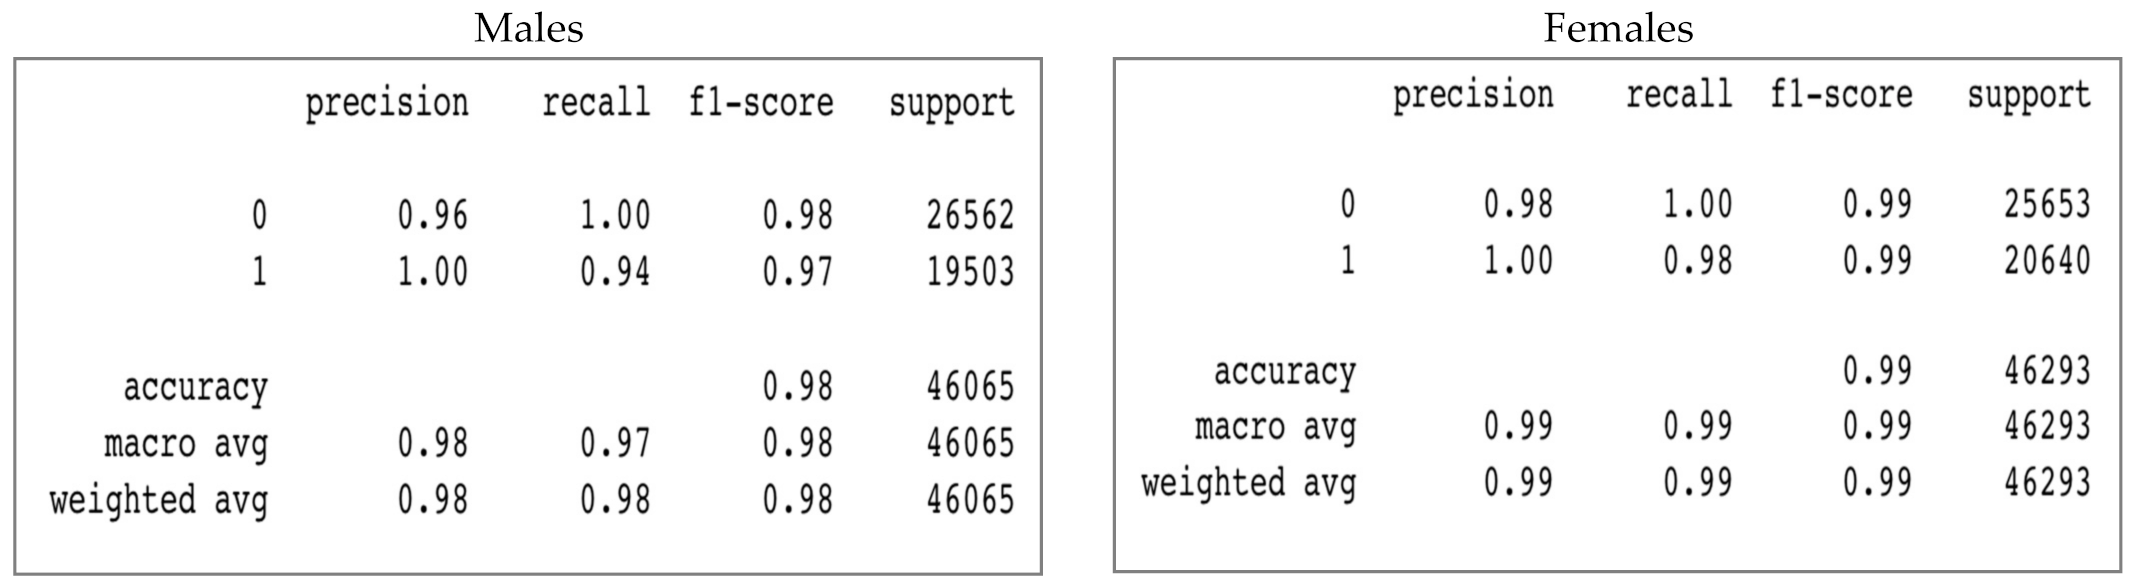
According to Table 5, ResNet50 achieved a slightly higher accuracy with women than with men. Females’ testing accuracy is 0.99 while males’ accuracy is 0.98. EER‘s value for women is moderately smaller than for men. To a slight extent, FAR, FRR, HTER, and ACER for female samples are also better than for male samples. Moreover, AUC value for females is higher than for males. In terms of FAR and FRR rates women have lower values than males.
Figure 8 demonstrates that the values for precision of Class 1 (spoof) and recall of Class 0 (real) are similar for both males and females. However, the values for precision of Class 0 and recall of Class 1 are better for females. Females’ f1 scores are also slightly better than males’ f1 scores.
ResNet 50’s Experiment 2
The second test dataset, which contains ten subjects for each gender with three live and four spoof videos per subject, was used in this experiment. The number of male subjects tested was reduced to 10 subjects from 23 subjects. The reason behind this modification is to create some balance in the test data, and observe if the differences in results between women and men in experiment1 is due to the unevenness of the number of test subjects from both gender. However, the males and females’ accuracies after the modification are similar to those in experiment 1. Table 5 shows that EER, HTER, ACER, and AUC values did not change, and women are still slightly surpassing men.
The classification report in Figure 9 shows that the results for precision and recall for both males and females are similar to the ones in experiment 1. For f1 scores, women are still better than men.
ResNet 50’s Experiment 3
It was implemented on the third test dataset that includes: 10 females subjects and 23 males subjects but with all videos related to females added. In this experiment, the number of males and females subjects was similar to the one in experiment 1. However, all live and spoof videos for the 10 female subjects in the test data were added to the dataset. This was done to keep test data large and at the same time reduce the difference in the size of samples between males and females. The total number of females’ test frames reached 94,770 frames.
As seen in Table 5, females’ results were still moderately more accurate than males. Moreover, females’ results for this experiment showed better improvement than for experiments one and two. In terms of ACER, EER, HTER, FAR, FRR, and AUC women showed slightly better results than males.
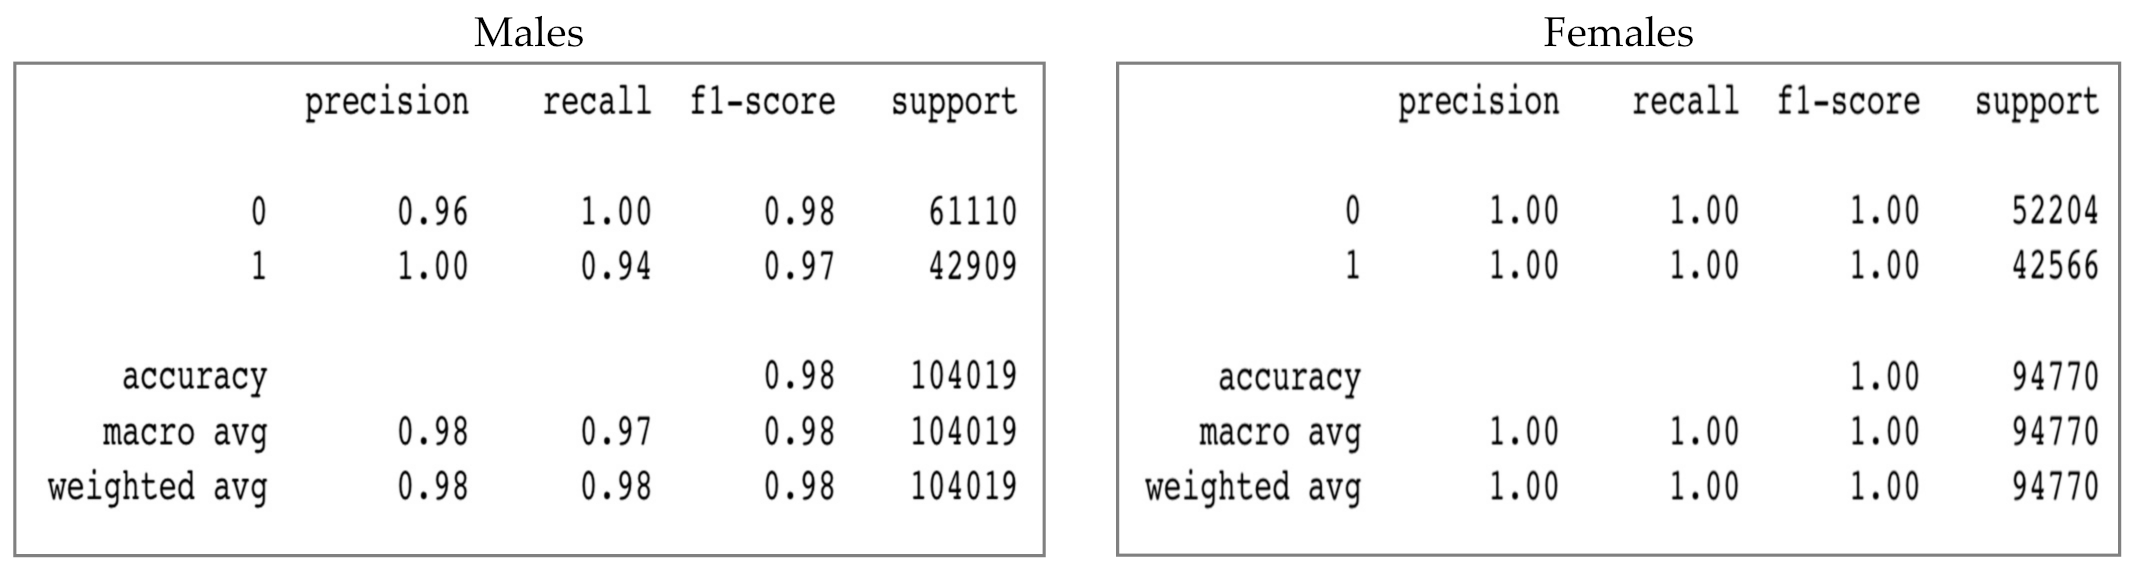
In terms of evaluating performance of the model using classification reports, Figure 10 shows that precision, recall, and f1scores are better for females than for males.
4.1.2. Exploring Gender Bias Using VGG16
Experiments to evaluate gender bias conducted using VGG16 included implementing VGG16 on the same three SiW test datasets used in the previous sub-phase with Resnet50. In the first dataset, male frames are 104,019 and female frames are 46,293. The second dataset contains 46,065 images for males and 46,293 images for females. In the last dataset, females have 99,770 frames and males have 104,019 samples. See Table 5.
VGG16’s Experiment 1
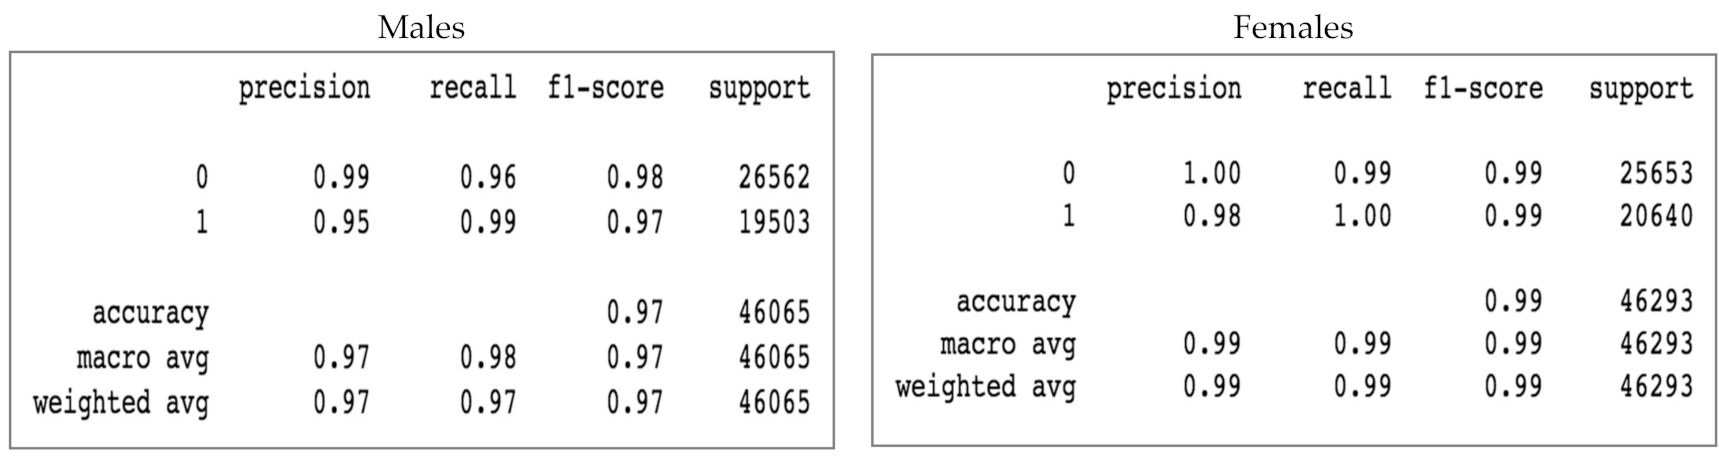
In this experiment, the number of men’s samples was more than twice that of women’s samples. The results show that the model’s accuracy is 99% for females and 97% for males. Table 5 demonstrates that EER and HTER are lower for female subjects than for male subjects. In addition, ACER, BPCER values for males are higher than for females. Moreover, The AUC value for females is slightly better than that for males
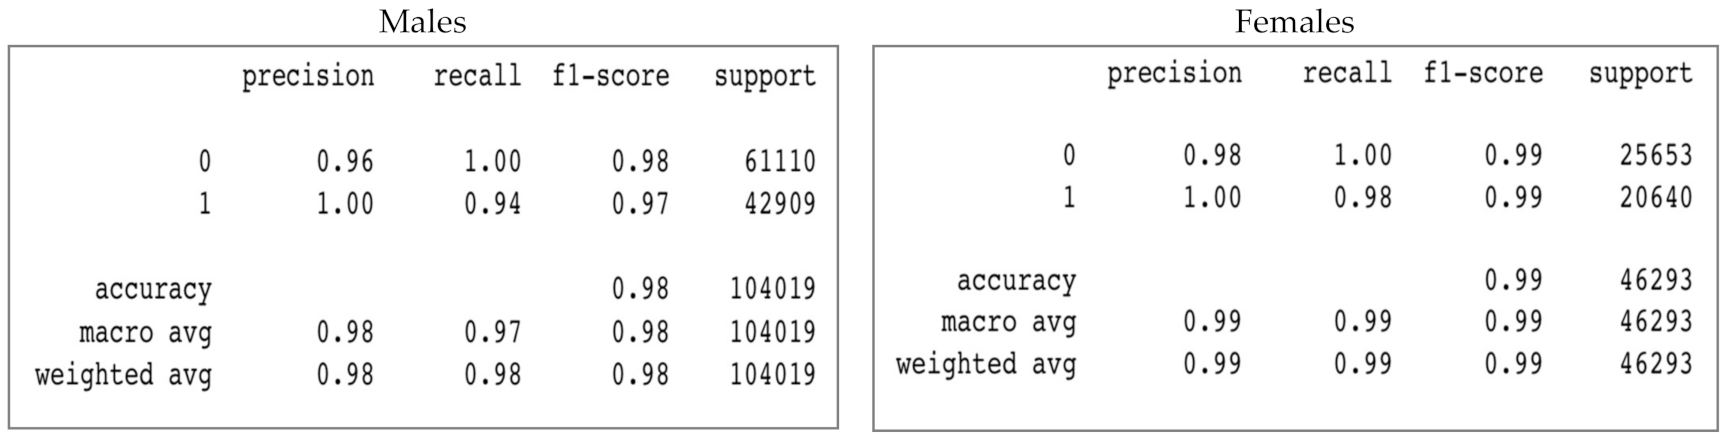
The classification reports shown in Figure 11 Indicates that the values of precision of 1, recall of 0 and 1 are better for females. In terms of f1 scores, males got lower scores than females.
VGG16’s Experiment 2
In this experiment, the sizes of test datasets for males and females are very close. Women got a slightly higher number of samples than men. However, testing accuracies for females and males are similar to that of VGG experiment 1. The model has 99% accuracy for females and 97% accuracy for males. The value of AUC is also better for females than for males. Other metrics such as EER and HTER are lower for females. In terms of FAR, FRR, and ACER, the model achieved slightly better results for females than for males. For more detail see Table 5.
In the classification reports in Figure 12, it is noticeable that females had higher values of precision and recall of 0 and 1 than males. In addition, women have better F1 scores compared to men.
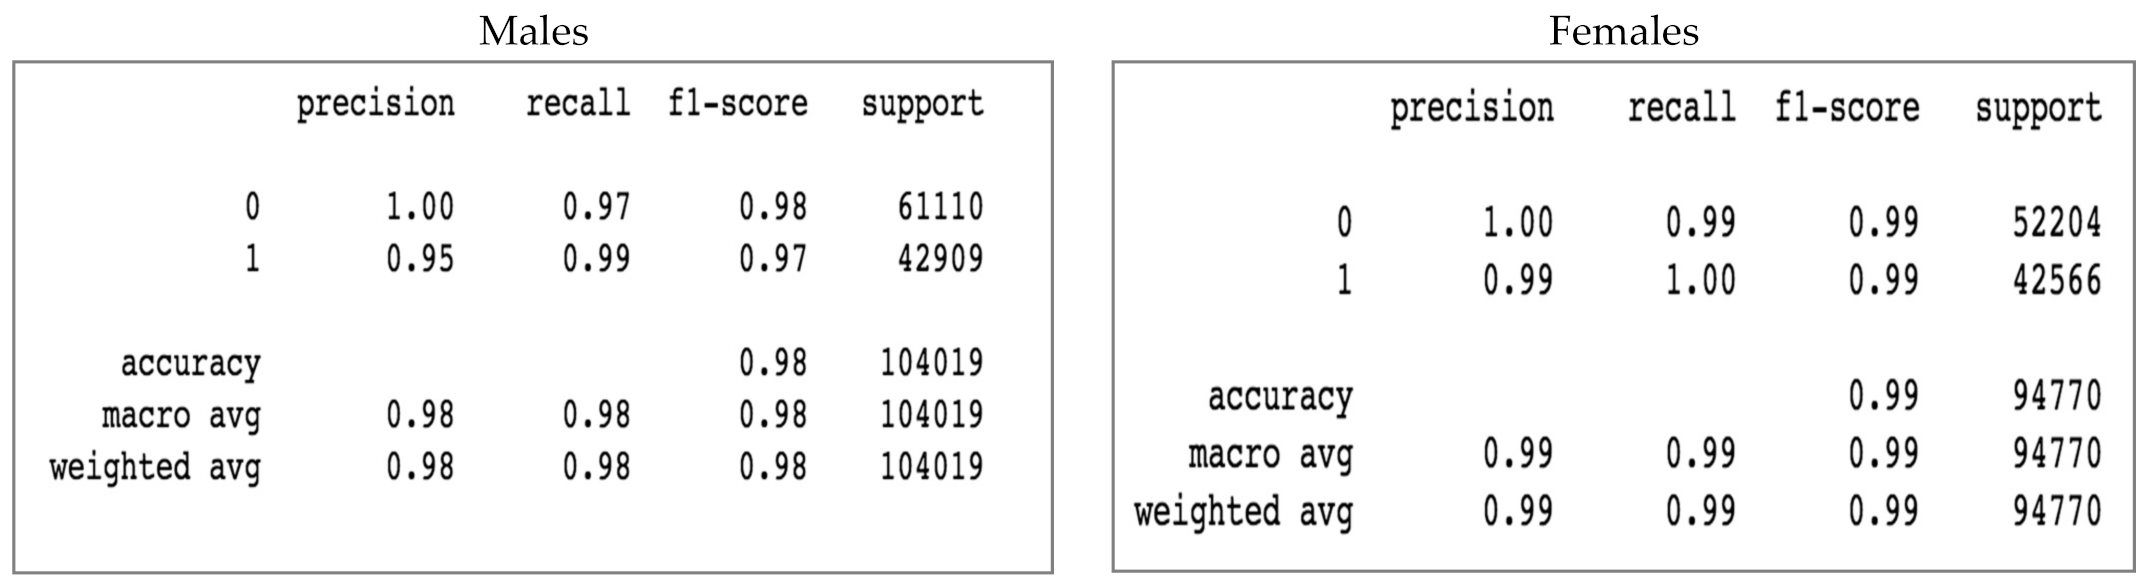
VGG16’s Experiment 3
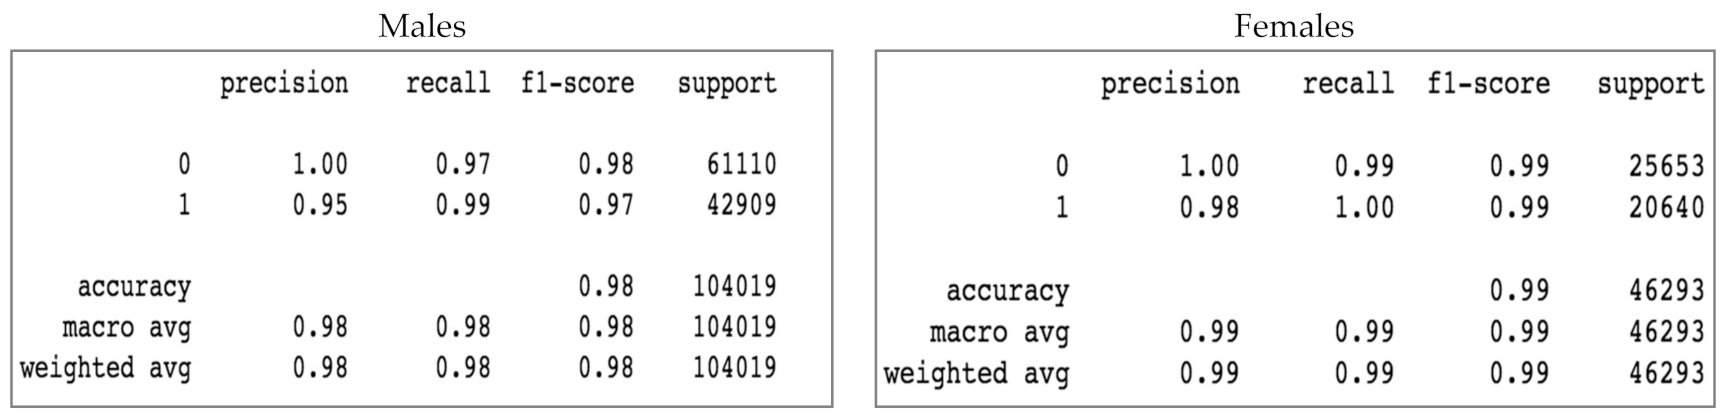
In this experiment, the third dataset was used. As noticed in Table 5, testing accuracies for females and males are still 99% and 97% respectively. Accuracy figures in this experiment are similar to that we got in the two previous experiments. Other metrics such as EER and HTER are slightly lower for male subjects than for female subjects. AUC value for females is greater than that for males. In addition, the model achieved moderately smaller ACER, FAR, FRR values for females than for males.
The classification reports in Figure 13 show that females surpassed males in terms of precision of 1 and recall of 0 and 1. In addition, reports illustrate that the f1 score for females is slightly better than the f1 score for males.
4.2. Phase 2: Exploring the Mitigation of Gender Bias in Detecting Face Presentation Attacks Using VGG16 Architecture and DB-VAE
In this phase two experiments were conducted with only one size of SiW’s test dataset. The test dataset included equal number of males and females. Each subject had 3 live and 4 spoof videos. The first experiment uses a standard VGG16 on test data and training it with a custom training function. The second experiment is about building a DB-VAE model with using the standard VGG16 used in experiment one. Both models were trained on the same SiW’s training data, see Figure 7. Table 6 shows the results of both experiments.
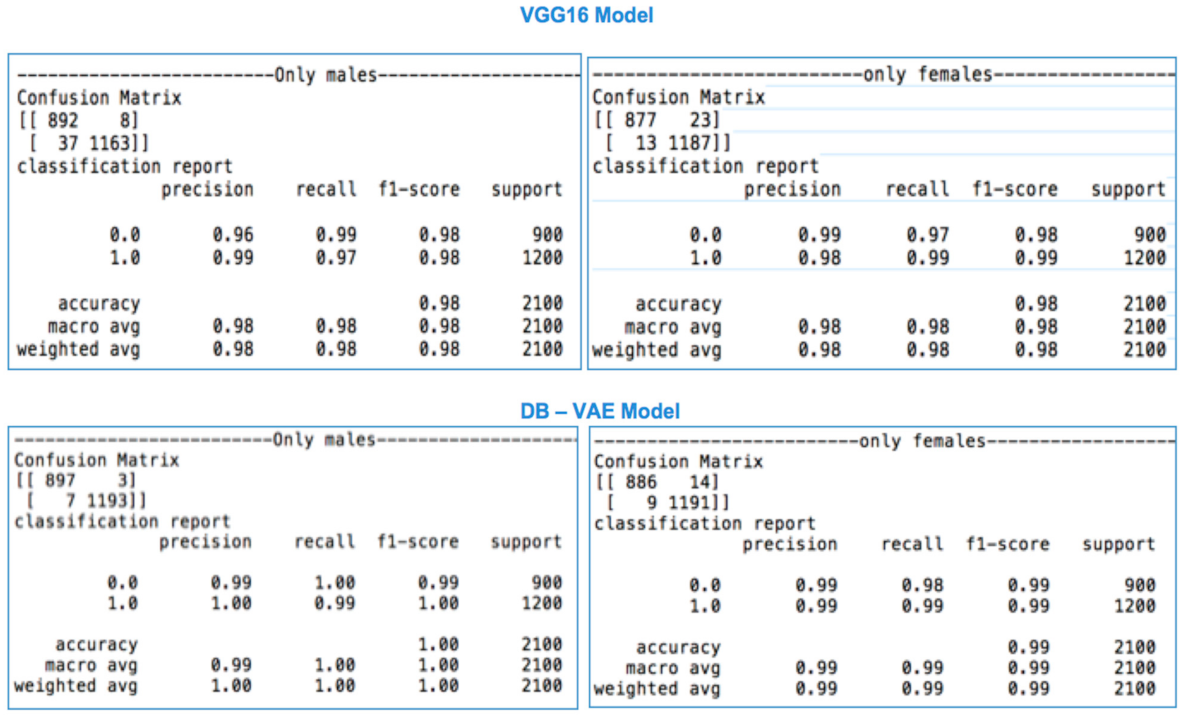
The results in Table 6 show that males and females have similar testing accuracy and AUC in experiment one using VGG16. The values of other metrics like HTER, EER, FRR, and ACER are almost similar for both genders. The noticeable differences between males and females are seen in Figure 14 and Figure 15.
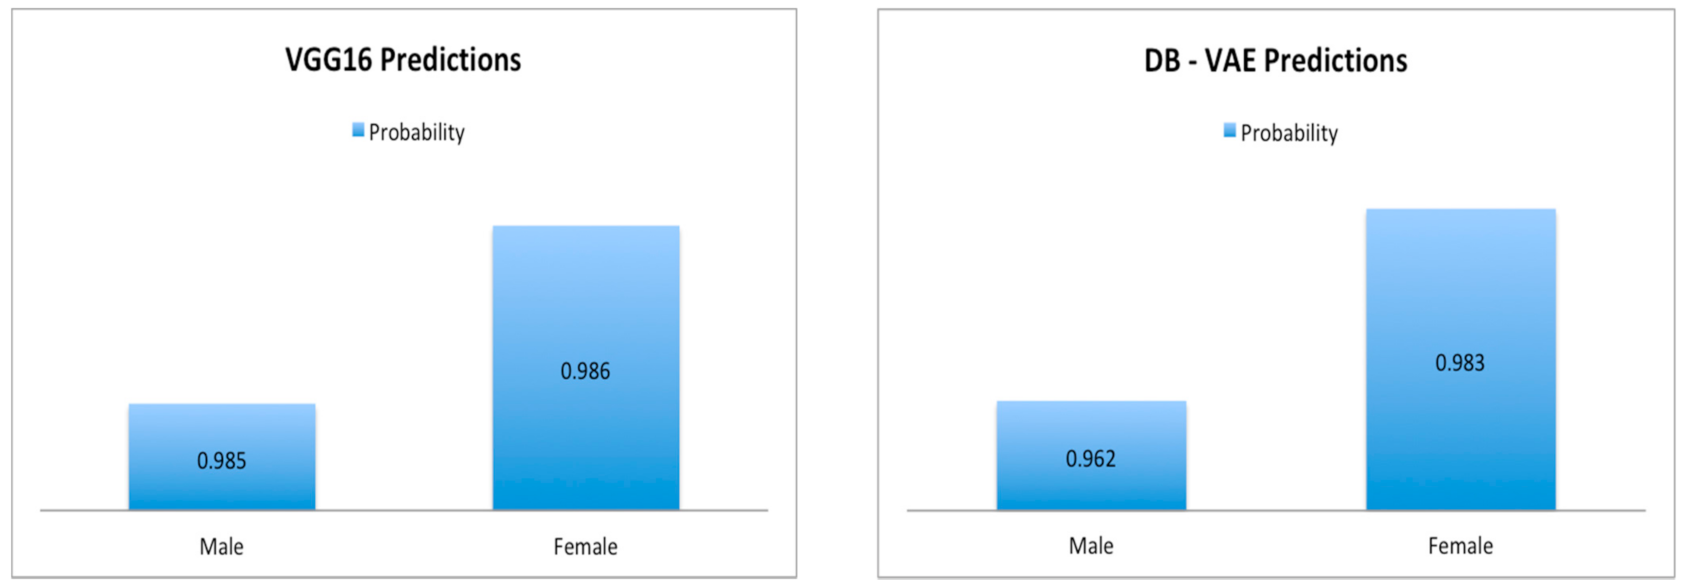
Figure 15 shows that males have images that are more than double the number of females’ FP images. It also shows that males have less FN samples than females. In addition, the bar chart seen in Figure 14 shows that the probabilities of detecting females’ spoof faces using VGG16 are higher than that of males.
In experiment two, the DB-VAE [9] was built, trained, and used to mitigate the bias in detecting spoof faces. As mentioned previously the probabilities of detecting spoof in females were higher than males. In experiment 1, the results of evaluation of probabilities of detecting spoof faces for males and females were 96.2 and 98.4 respectively. After applying the DB-VAE those probabilities were increased for both genders. The rate of probability distribution for males increased to 98.5 and for females to 98.6.
5. Discussion
During this research many experiments were completed in order to investigate the existence of bias in presentation attack detection methods and to explore the effect of the DB-VAE on mitigating bias in face spoofing detection. In this subsection, the results and findings obtained by those experiments are summarized and discussed.
In summary, we concentrate on the basic ideas and facts that were inferred from our experiments. First, the results of both phases indicate that the differences between females and males in detecting face presentation attacks using the two CNN-based models are minor. In addition, contradicting to some studies such as [8] that showed that iris presentation attack detection methods are biased toward females, our results shows that CNN-based models have better performance for females than males. In all the experiments done in this research, the ratios of females’ false positive predictions out of the total images were either 0% or higher than that of males. Moreover, the results in Sub Section 4.2 demonstrated that the probabilities of detecting spoof faces using VGG16 were slightly higher for females than males (See Figure 14).
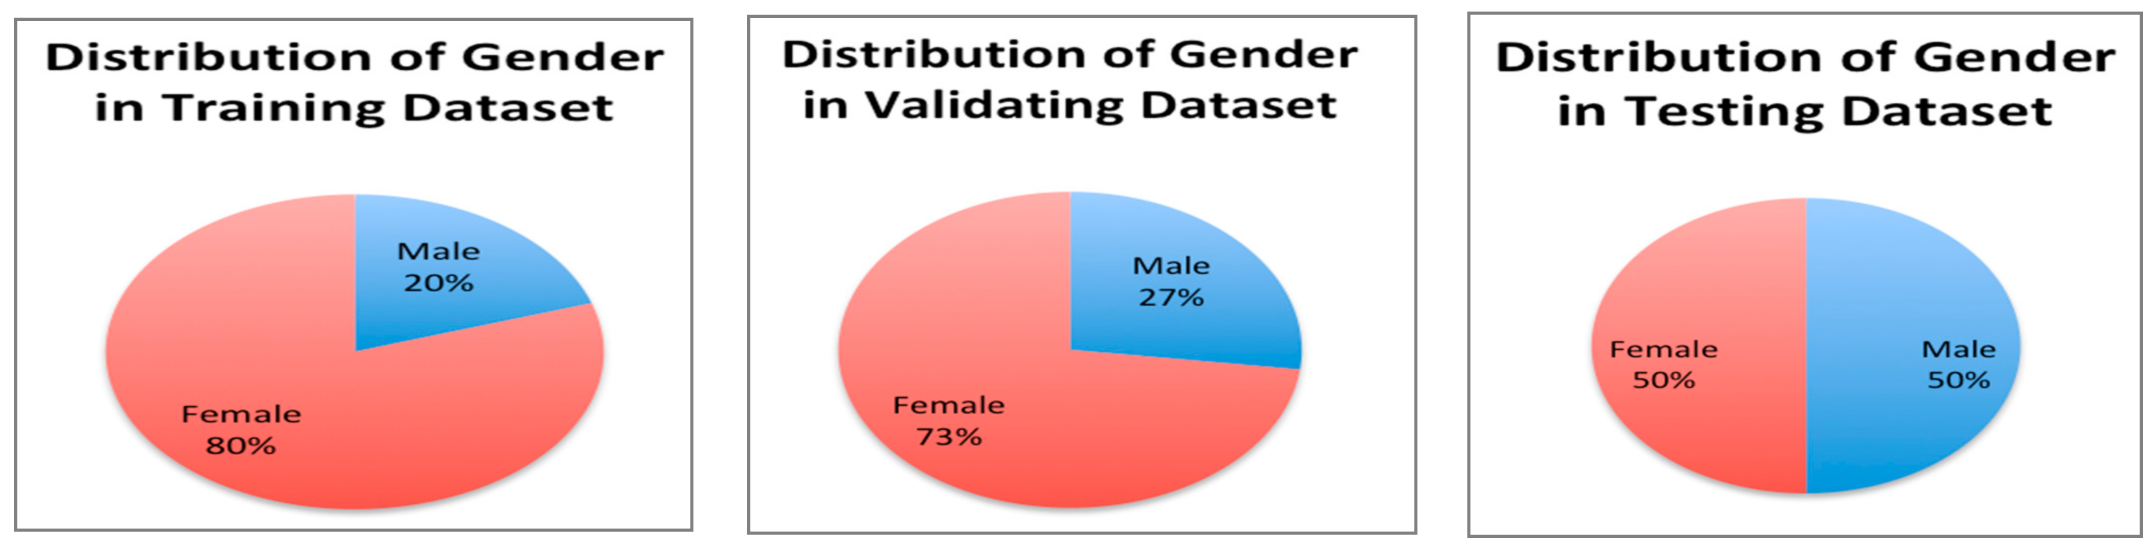
Second, some claims suggested that the unfairness of facial data-based technology is caused by the unbalanced data in the training dataset. However, the experiments in this research showed that even though our training data are unbalanced, and include only 20% to 28% of females, the models’ performance is better for females than for males. Therefore, our findings refute the claim that unbalanced data in trainings data can lead to a bias in performance. We think algorithms can be bias toward some demographic groups even if the distribution of these groups is high in the training data. See Figure 4 for gender distribution in the training data.
Third, ResNet50 experiments with transfer learning demonstrated that transfer learning has not reduced the reported gender bias. It only improved the overall performance of the model compared to VGG16.
Fourth, the results of experiment with the DB-VAE showed that the DB-VAE is effective in mitigating the minor bias by improving the average of the probabilities of detecting spoof faces and increasing the accuracy.
Finally, some researchers suggested that if one demographic group or gender was tested more than the other group or gender, this will normally lead to an increase in the number of false predictions of this group. After conducting many experiments using ResNet50 and VGG16 with different sizes of test datasets, we think that imbalance in test data has no strong link to bias in results.
6. Conclusions
To investigate gender unfairness in PAD method, we used two recent CNN models: Resnet50 with transfer learning and VGG16. In addition, the test data used varied in the number of samples for each group. The results obtained show that there are insignificant differences in performance of the models for females and males. Moreover, our findings proved that the gender distribution of training and testing data does not lead to gender bias in results. Bias can exist for other reasons and further studies are needed to prove it and investigate the causes of it.
In order to investigate the effectiveness of the DB-VAE approach [9] in mitigating bias in PAD, we did two experiments with and without the DB-VAE the model. The first was using Vgg16 and the second was with the DB-VAE and VGG16 as the encoder. After comparing the results, it was noticeable that the gender bias found in the probabilities of detecting spoof faces using only VGG16 was mitigated after applying the DB-VAE. Therefore, it is concluded that the DB-VAE is capable of mitigating gender bias in PAD.
The experiments in this research included exploring gender bias using two CNN-based models: ResNet50 and VGG16. In addition, the research was conducted with only one dataset. In the future, we consider making further research with more CNN models such as Le-NET-5, AlexNet-5, and Inception –v3. Moreover, including more than one dataset and expanding our studies to investigate other demographic unfairness are within our future plans. Another future research goal we have is to improve the DB-VAE architecture to mitigate bias in detecting both positive and negative classes. Moreover, more experiments will be completed to have a detailed ablation study about bias in presentation attack detection.
Author Contributions
Conceptualization: N.A., X.Y. and K.R.; methodology: N.A.; soft-ware, N.A.; validation: N.A., X.Y. and K.R; formal analysis: N.A. and X.Y.; investigation: N.A.; resources: N.A. and X.Y.; data curation: N.A.; writing—original draft preparation: N.A.; writing—review and editing: X.Y., N.A. and M.A.; visualization: X.Y. and N.A.; supervision: X.Y., K.R. and M.A.; Project administration: X.Y.; funding acquisition: K.R., X.Y. and M.A. All authors have read and agreed to the published version of the manuscript.
Funding
This research was partially supported by National Science Foundation (NSF) under the grant CNS-1900187. Any opinions, findings, and conclusions or recommendations expressed in this material are those of the author(s) and do not necessarily reflect the views of NSF.
Data Availability Statement
Not applicable.
Conflicts of Interest
The authors declare no conflict of interest.
References
- Li, L.; Feng, X.; Boulkenafet, Z.; Xia, Z.; Li, M.; Hadid, A. An original face anti-spoofing approach using partial convolutional neural network. In Proceedings of the 2016 Sixth International Conference on Image Processing Theory, Tools and Applications, Oulu, Finland, 12–15 December 2016; pp. 1–6. [Google Scholar]
- Liu, Y.; Jourabloo, A.; Liu, X. Learning deep models for face anti-spoofing: Binary or auxiliary supervision. In Proceedings of the 2018 IEEE/CVF Conference on Computer Vision and Pattern Recognition, Salt Lake City, UT, USA, 23 June 2018; pp. 389–398. [Google Scholar]
- Greig, J. Study finds Amazon’s Face Recognition Incorrectly Matches 105 US and UK Politicians. Techrepublic. 29 May 2020. Available online: https://www.techrepublic.com/article/study-finds-amazons-face-recognition-incorrectly-matches-105-us-and-uk-politicians/ (accessed on 5 September 2020).
- Ming, Z.; Visani, M.; Luqman, M.M.; Burie, J.-C. A Survey on Anti-Spoofing Methods for Face Recognition with RGB Cameras of Generic Consumer Devices. Cornell University. 8 October 2020. Available online: https://arxiv.org/abs/2010.04145 (accessed on 20 October 2020).
- Minaee, S.; Luo, P.; Lin, Z.; Bowyer, K. Going Deeper into Face Detection: A Survey. Available online: http://arxiv.org/abs/2103.14983 (accessed on 13 April 2021).
- Minaee, S.; Abdolrashidi, A.; Su, H.; Bennamoun, M.; Zhang, D. Biometrics Recognition Using Deep Learning: A Survey. Available online: http://arxiv.org/abs/1912.00271 (accessed on 31 August 2021).
- Singh, R.; Agarwal, A.; Singh, M.; Nagpal, S.; Vatsa, M. On the Robustness of Face Recognition Algorithms against Attacks and Bias. In Proceedings of the 34th AAAI Conference on Artificial Intelligence, Hilton New York Midtown, New York, NY, USA, 7–12 February 2020; pp. 13583–13589. [Google Scholar] [CrossRef]
- Fang, M.; Damer, N.; Kirchbuchner, F.; Kuijper, A. Demographic Bias in Presentation Attack Detection of Iris Recognition Systems. Cornell University. 6 March 2020. Available online: https://arxiv.org/abs/2003.03151 (accessed on 2 October 2020).
- Amini, A.; Soleimany, A.P.; Schwarting, W.; Bhatia, S.N.; Rus, D.L. Uncovering and Mitigating Algorithmic Bias through Learned Latent Structure. In Proceedings of the 2019 AAAI/ACM Conference on AI, Ethics, and Society, Honolulu, HI, USA, 27–28 January 2019; pp. 289–295. [Google Scholar]
- ISO/IEC JTC 1/SC 37 biometrics. In Information Technology—Biometric Presentation Attack Detection—Part 1: Frame-Work; International Organization for Standardization: Geneva, Switzerland, 2016.
- Georgopoulos, M.; Panagakisb, Y.; Pantica, M. Investigating bias in deep face analysis: The KANFace Dataset and Empirical Study. Cornell University. 15 May 2020. Available online: https://arxiv.org/abs/2005.07302 (accessed on 17 September 2020).
- Merler, M.; Ratha, N.; Feris, R.S.; Smith, J.R. Diversity in faces. arXiv 2019, arXiv:1901.10436. [Google Scholar]
- Klare, B.F.; Burge, M.J.; Klontz, J.C.; Bruegge, R.W.V.; Jain, A.K. Face recognition performance: Role of demographic information. IEEE Trans. Inf. Forensics Secur. 2012, 7, 1789–1801. [Google Scholar] [CrossRef] [Green Version]
- Khiyari, H.E.; Wechsler, H. Face Verification Subject to Varying (Age, Ethnicity, and Gender) Demographics Using Deep Learning. J. Biom. Biostat. 2016, 7, 1–5. [Google Scholar] [CrossRef]
- Robinson, J.P.; Livitz, G.; Henon, Y.; Qin, C.; Fu, Y.; Timoner, S. Face Recognition: Too Bias, or Not Too Bias? In Proceedings of the IEEE Computer Society Conference on Computer Vision and Pattern Recognition Workshops, Seattle, WA, USA, 14–19 June 2020; pp. 1–10. [Google Scholar] [CrossRef]
- Cook, C.M.; Howard, J.J.; Sirotin, Y.B.; Tipton, J.L.; Vemury, A.R. Demographic effects in facial recognition and their dependence on image acquisition: An evaluation of eleven commercial systems. IEEE Trans. Biometr. Behav. Identity Sci. 2019, 40, 32–41. [Google Scholar] [CrossRef]
- Buolamwini, J.; Gebru, T. Gender shades: Intersectional accuracy disparities in commercial gender classification. Proc. Mach. Learn. Conf. Fairness Account. Trans. 2018, 81, 1–15. [Google Scholar]
- Grother, P.; Ngan, M.; Hanaoka, K. NISTIR 8280: Face Recognition Vendor Test. (FRVT) Part. 3: Demographic Effects. Available online: https://0-doi-org.brum.beds.ac.uk/10.6028/NIST.IR.8280 (accessed on 25 February 2020).
- Das, A.; Dantcheva, A.; Bremond, F. Mitigating bias in gender, age and ethnicity classification: A multi-task convolution neural network approach. Proc. Eur. Conf. Comput. Vis. Workshops 2018, 573–585. Available online: https://hal.inria.fr/hal-01892103/document (accessed on 31 August 2021).
- Wang, M.; Deng, W.; Hu, J.; Tao, X.; Huang, Y. Racial faces in the wild: Reducing racial bias by information maximization adaptation network. arXiv 2019, arXiv:1812.00194. [Google Scholar]
- Yucer, S.; Akçay, S.; Al-Moubayed, N.; Breckon, T.P. Exploring Racial Bias within Face Recognition via Per-Subject Adversarially-Enabled Data Augmentation. Cornell University. 19 April 2020. Available online: https://arxiv.org/abs/2004.08945 (accessed on 30 September 2020).
- Atoum, Y.; Liu, Y.; Jourabloo, A.; Liu, X. Face anti-spoofing using patch and depth-based CNNs. In Proceedings of the 2017 IEEE International Joint Conference on Biometrics (IJCB), Denver, CO, USA, 1–4 October 2017; pp. 319–328. [Google Scholar]
- Doyle, J.S.; Bowyer, K.; Flynn, P.J. Variation in accuracy of textured contact lens detection based on sensor and lens pattern. In Proceedings of the IEEE BTAS, Arlington, VA, USA, 29 September–2 October 2013; pp. 1–7. [Google Scholar]
- SiW: Spoofing in the Wild Database. Available online: http://cvlab.cse.msu.edu/siw-spoof-in-the-wild-database.html (accessed on 14 September 2021).
- He, K.; Zhang, X.; Ren, S.; Sun, J. Deep Residual Learning for Image Recognition. arXiv 2015, arXiv:1512.03385. [Google Scholar]
- Deng, J.; Dong, W.; Socher, R.; Li, L.; Li, K.; Fei-Fei, L. ImageNet: A large-scale hierarchical image database. In Proceedings of the 2009 IEEE Conference on Computer Vision and Pattern Recognition, Miami, FL, USA, 20–25 June 2009; pp. 248–255. [Google Scholar] [CrossRef] [Green Version]
Figure 1.
Stages of the methodology.

Figure 2.
Samples of attacks in SiW [24].
Figure 2.
Samples of attacks in SiW [24].

Figure 3.
SiW demographic distribution [9].
Figure 3.
SiW demographic distribution [9].

Figure 4.
Distribution of gender in the SiW sub-dataset.

Figure 5.
The DE-VAE approach [9].
Figure 5.
The DE-VAE approach [9].

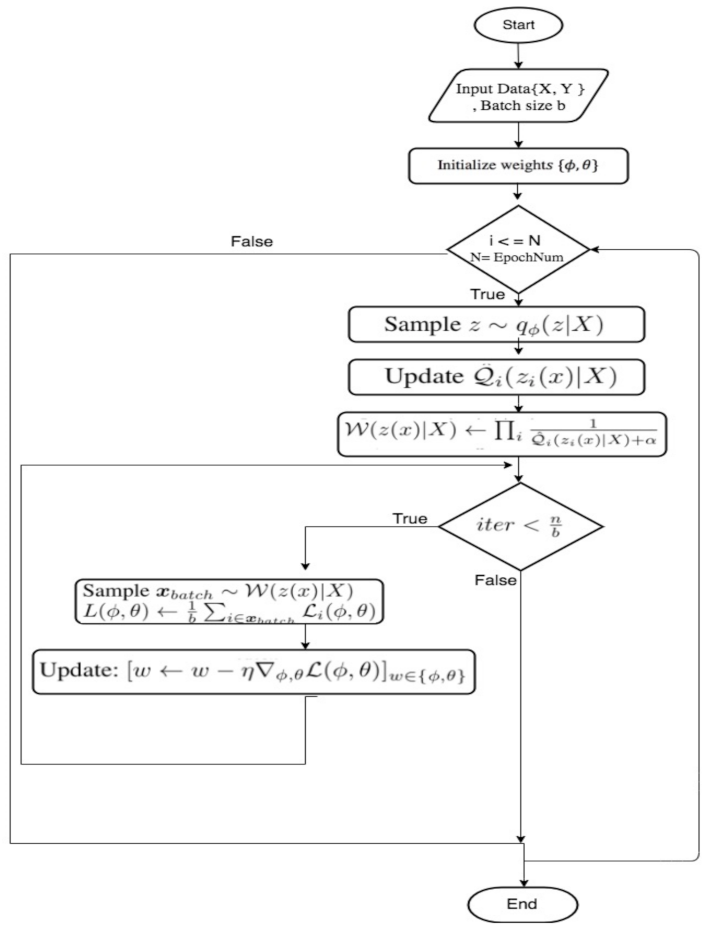
Figure 6.
The resampling algorithm for the DE-VAE model [9].
Figure 6.
The resampling algorithm for the DE-VAE model [9].

Figure 7.
Dataset adjustment for phase 2.

Figure 8.
Classification reports for ResNet50’s experiment 1.

Figure 9.
Classification Reports for ResNet50’s experiment 2.

Figure 10.
Classification reports for ResNet50’s experiment 3.

Figure 11.
Classification report for VGG16’s experiment 1.

Figure 12.
Classification report for VGG16’s experiment 2.

Figure 13.
Classification report for VGG16’s experiment 3.

Figure 14.
Evaluation of probabilities of spoof face detection per gender.

Figure 15.
Confusion matrix and classification reports for phase 2.


Table 1.
Evaluation metrics overview.
| Metric’s Name | Overview | |
|---|---|---|
| 1 | Attack Presentation Classification Error Rate (APCER) | Measures the rate of attacks accepted as Bona fide, APCER is calculated for each type of PAI and then the type with the highest APCER will be considered the overall APCER. |
| 2 | Bona Fide Classification Error Rate (BPCER) | Measures the rate of Bona Fide rejected as attacks. |
| 3 | The Average Classification Error Rate (ACER): | Measures the overall performance of PAD. It is equal to (APCER+ BPCER)/2 |
| 4 | Confusion matrix | A table that describes the performance of a classifier in terms of True Positive, True Negative, False Positive, and False Negative. |
| 5 | Area Under the ROC Curve (AUC) | Describes how a model is performing in recognizing classes |
| 6 | Equal Error Rate (EER) | The threshold value when FAR is equal to FRR |
| 7 | HTER | The average of FAR and FRR |
| 8 | False Acceptance rate (FAR) | Percentage of unauthorized users accepted as authorized ones |
| 9 | False Rejection Rate (FRR) | Percentage of authorized users rejected. |
| 10 | Recall (Sensitivity) | Percentage of True positive predictions out of all actual positives. |
| 11 | Precision | Percentage of True positive predictions out of all positives predictions. |
| 12 | Testing Accuracy | Measures how the performance of the model in predicting different classes correctly. |
Table 2.
Hyper-parameters for experiments with Resnet50.
| Hyper-Parameter | Value |
|---|---|
| Learning Rate | 0.01 |
| Activation function | Softmax |
| Optimizer | Adam |
| Epoch | 10 |
| Batch size | 100 |
| Loss function | Categorical_crossentropy |
Table 3.
Hyper-parameters for experiments with VGG16.
| Hyper-Parameter | Value |
|---|---|
| Learning Rate | 0.01 |
| Activation function | Sigmoid |
| Optimizer | Adam |
| Epoch | 16 |
| Batch size | 100 |
| Loss function | Binary_crossentropy |
Table 4.
Hyper-parameters for experiments with VGG16 and DB-VAE.
| Hyper-Parameter | VGG16 | DB-VAE |
|---|---|---|
| Learning Rate | 5 × 10⁻⁴ | 5 × 10⁻⁴ |
| Activation function | Linear | Linear |
| Optimizer | Adam | Adam |
| Epoch | 3 | 6 |
| Batch size | 32 | 32 |
| Loss function | binary_cross_entropy_with_logits | binary_cross_entropy_with_logits and DB-VAE custom loss function |
Table 5.
Results for experiments in phase 1.
| Experiment 1 | Experiment 2 | Experiment 3 | ||||
|---|---|---|---|---|---|---|
| Males | Females | Males | Females | Males | Females | |
| ResNet50′ Results | ||||||
| Number of Subjects | 23 | 10 | 10 | 10 | 23 | 10 |
| Videos per Subject | 3 live, 4 spoof | 3 live, 4 spoof | 3 live, 4 spoof | 3 live, 4 spoof | 3 live, 4 spoof | 6-7 live, 8-9 spoof |
| Number of Frames | 104,019 | 46,293 | 46,065 | 46,293 | 104,019 | 94,770 |
| Testing Accuracy | 0.975% | 0.989% | 0.975% | 0.989% | 0.975% | 0.997% |
| EER | 0.037 | 0.018 | 0.038 | 0.018 | 0.037 | 0.003 |
| FAR | 0.00091 | 0.0 | 0.0 | 0.0 | 0.00091 | 0.00009 |
| FRR | 0.056 | 0.024 | 0.056 | 0.024 | 0.056 | 0.004 |
| HTER | 0.028 | 0.012 | 0.028 | 0.012 | 0.028 | 0.002 |
| APCER | 0.0 | 0.0 | 0.0 | 0.0 | 0.0 | 0.0 |
| BPCER | 0.057 | 0.024 | 0.057 | 0.024 | 0.057 | 0.005 |
| ACER | 0.028 | 0.012 | 0.028 | 0.012 | 0.028 | 0.0025 |
| AUC | 0.98 | 0.99 | 0.979 | 0.99 | 0.98 | 0.997 |
| VGG16′ Results | ||||||
| Number of Subjects | 23 | 10 | 10 | 10 | 23 | 10 |
| Videos per Subject | 3 live, 4 spoof | 3 live, 4 spoof | 3 live, 4 spoof | 3 live, 4 spoof | 3 live, 4 spoof | 6-7 live 8-9 spoof |
| Number of Frames | 104,019 | 46,293 | 46,065 | 46,293 | 104,019 | 94,770 |
| Testing Accuracy | 0.97% | 0.99% | 0.97% | 0.99% | 0.975% | 0.997% |
| EER | 0.043 | 0.018 | 0.049 | 0.018 | 0.037 | 0.003 |
| FAR | 0.033 | 0.015 | 0.039 | 0.015 | 0.00091 | 0.00009 |
| FRR | 0.006 | 0.002 | 0.008 | 0.002 | 0.056 | 0.004 |
| HTER | 0.019 | 0.008 | 0.023 | 0.008 | 0.028 | 0.002 |
| APCER | 0.0 | 0.0 | 0.0 | 0.0 | 0.0 | 0.0 |
| BPCER | 0.006 | 0.002 | 0.008 | 0.002 | 0.057 | 0.005 |
| ACER | 0.003 | 0.001 | 0.004 | 0.001 | 0.028 | 0.0025 |
| AUC | 0.975 | 0.989 | 0.971 | 0.989 | 0.98 | 0.997 |
Table 6.
Results for VGG16’s experiment and DB-VAE experiment.
| VGG16 | DB-VAE | |||
|---|---|---|---|---|
| Males | Females | Males | Females | |
| Subject # | 20 | 20 | 20 | 20 |
| Videos/Subject | 3 live, 4 spoof | 3 live, 4 spoof | 3 live, 4 spoof | 3 live, 4 spoof |
| Testing Accuracy | 0.98 | 0.98 | 0.995 | 0.989 |
| EER | 0.024 | 0.022 | 0.003 | 0.011 |
| FAR | 0.009 | 0.026 | 0.003 | 0.016 |
| FRR | 0.031 | 0.011 | 0.006 | 0.010 |
| HTER | 0.019 | 0.018 | 0.005 | 0.012 |
| APCER | 0.041 | 0.013 | 0.007 | 0.008 |
| BPCER | 0.031 | 0.011 | 0.006 | 0.008 |
| ACER | 0.036 | 0.012 | 0.006 | 0.008 |
| AUC | 0.995 | 0.998 | 0.999 | 0.999 |
Publisher’s Note: MDPI stays neutral with regard to jurisdictional claims in published maps and institutional affiliations. |
© 2021 by the authors. Licensee MDPI, Basel, Switzerland. This article is an open access article distributed under the terms and conditions of the Creative Commons Attribution (CC BY) license (https://creativecommons.org/licenses/by/4.0/).
Share and Cite
MDPI and ACS Style
Alshareef, N.; Yuan, X.; Roy, K.; Atay, M. A Study of Gender Bias in Face Presentation Attack and Its Mitigation. Future Internet 2021, 13, 234. https://0-doi-org.brum.beds.ac.uk/10.3390/fi13090234
AMA Style
Alshareef N, Yuan X, Roy K, Atay M. A Study of Gender Bias in Face Presentation Attack and Its Mitigation. Future Internet. 2021; 13(9):234. https://0-doi-org.brum.beds.ac.uk/10.3390/fi13090234
Chicago/Turabian StyleAlshareef, Norah, Xiaohong Yuan, Kaushik Roy, and Mustafa Atay. 2021. "A Study of Gender Bias in Face Presentation Attack and Its Mitigation" Future Internet 13, no. 9: 234. https://0-doi-org.brum.beds.ac.uk/10.3390/fi13090234
Note that from the first issue of 2016, this journal uses article numbers instead of page numbers. See further details here.