Review

A Comprehensive Review of Machine Learning Approaches for Anomaly Detection in Smart Homes: Experimental Analysis and Future Directions

by
Md Motiur Rahman
1,
Deepti Gupta
2,
Smriti Bhatt
3,*,
Shiva Shokouhmand
1 and
Miad Faezipour
1,*
1
School of Engineering Technology, Electrical and Computer Engineering Technology, Purdue University, West Lafayette, IN 47907, USA
2
Subhani Department of Computer Information Systems, Texas A&M University-Central Texas, Killeen, TX 76549, USA
3
Department of Computer & Information Technology, Purdue University, West Lafayette, IN 47907, USA
*
Authors to whom correspondence should be addressed.
Future Internet 2024, 16(4), 139; https://0-doi-org.brum.beds.ac.uk/10.3390/fi16040139
Submission received: 21 March 2024 / Revised: 16 April 2024 / Accepted: 18 April 2024 / Published: 19 April 2024
(This article belongs to the Special Issue Machine Learning for Blockchain and IoT Systems in Smart City)

Abstract

:
Detecting anomalies in human activities is increasingly crucial today, particularly in nuclear family settings, where there may not be constant monitoring of individuals’ health, especially the elderly, during critical periods. Early anomaly detection can prevent from attack scenarios and life-threatening situations. This task becomes notably more complex when multiple ambient sensors are deployed in homes with multiple residents, as opposed to single-resident environments. Additionally, the availability of datasets containing anomalies representing the full spectrum of abnormalities is limited. In our experimental study, we employed eight widely used machine learning and two deep learning classifiers to identify anomalies in human activities. We meticulously generated anomalies, considering all conceivable scenarios. Our findings reveal that the Gated Recurrent Unit (GRU) excels in accurately classifying normal and anomalous activities, while the naïve Bayes classifier demonstrates relatively poor performance among the ten classifiers considered. We conducted various experiments to assess the impact of different training–test splitting ratios, along with a five-fold cross-validation technique, on the performance. Notably, the GRU model consistently outperformed all other classifiers under both conditions. Furthermore, we offer insights into the computational costs associated with these classifiers, encompassing training and prediction phases. Extensive ablation experiments conducted in this study underscore that all these classifiers can effectively be deployed for anomaly detection in two-resident homes.

Graphical Abstract

1. Introduction and Motivation

The growing number of Internet of Things (IoT) devices has transformed smart homes from a luxury into a necessity. These homes have an integrated ecosystem that enables users to efficiently monitor and control multiple gadgets and systems remotely. In addition to convenience, they also address critical concerns related to security and safety. Smart security systems provide real-time monitoring, alarms, and surveillance, increasing the safety of properties and their occupants. Furthermore, smart equipment can instantly identify anomalies and respond to crises, such as the health issues of the residents, reducing potential hazards. In today’s globalized society, smart homes are essential for streamlining daily living, enhancing security, and ensuring the safety and well-being of individuals. Currently, turning homes into smart homes provides such opportunities by utilizing the Internet of Things (IoT) and placing multiple sensors to monitor home activities. The data recorded from these sensors in a smart home assist in monitoring the pattern of human activities, as well as detecting any deviations from the regular pattern [1,2]. Anomalies in human activities refer to the unusual execution of activities, such as deviating from the regular pattern or taking an abnormal duration for each activity. These anomalies should be detected to monitor the health of residents, especially elderly people, who require more surveillance and prompt response during critical times [1,3].
The detection of anomalies in human activities from the recorded data can provide important indications regarding the health of residents and aid in the timely prevention of health complications. Detecting anomalies in human activities has various applications, such as guiding dementia patients if they miss essential activities like taking meals or medicines and monitoring the health of those staying alone, especially elderly people [4,5]. Many researchers have proposed various methodologies, including the identification of body positions and actions, as well as the recognition of visual activities, to be significant in the context of anomaly detection [6,7,8]. Nonetheless, these approaches exhibit certain limitations. For example, in visual activity recognition, the privacy of the resident is compromised, while in body position and action identification, some devices should be attached to the resident for recording his/her body position and actions, such as standing, sitting, and walking, which is not always convenient [9,10,11]. In addition, most research on detecting anomalies in human activity considers a single resident. However, this approach is impractical when multiple residents live together in a house, where the activities of one resident are directly influenced by the activities of others [12,13,14].
Artificial intelligence has opened the door to more efficient identification of unusual human activities within smart homes. Leveraging machine learning classifiers such as decision trees, naïve Bayes, gradient boosting, random forest, k-nearest neighbors, and Support Vector Machines simplifies the process of recognizing anomalies [7,15,16,17,18,19,20]. The classifiers work by analyzing sensor data, which enables accurate classification of a resident’s normal and abnormal activities. This approach has proven to be highly effective in ensuring the safety and security of smart home residents [21]. Later, while deep learning has been effective in classification tasks, researchers have applied neural network (NN)-based techniques such as Convolutional Neural Networks (CNNs) and recurrent neural networks (RNNs) for detecting anomalies in human activities [22,23,24,25]. However, multi-activity datasets are often converted into binary class datasets, which can result in imbalanced datasets as only a few abnormal behaviors are generated, and do not represent all possible anomaly situations [26,27,28]. In many studies, only normal activities are used for training and a threshold value is computed by estimating the loss to classify data as normal or anomaly [29,30]. An input is considered an anomaly when the summed loss is greater than the threshold value [22]. Although these techniques classify normal and abnormal activities well for single residents, they have not reported their performance on multi-resident datasets. Furthermore, we have encountered a challenge in our search to identify a comprehensive resource that can assist us in assessing the performance and computational complexity of various classifiers for the task of detecting anomalies related to multiple residents in a human-centric context.
In this review study, we conducted thorough experiments over all the popular machine learning classifiers such as decision tree (DT), naïve Bayes (NB), gradient boosting (GB), Light Gradient Boosting (LGB), random forest (RF), k-nearest neighbors (KNN), Support Vector Machine (SVM), Linear Regression (LR), and two RNN-based models utilizing Long Short-term Memory (LSTM), and the Gated Recurrent Unit (GRU) for detecting anomalies in two-resident human activities. The key contributions of this study are as follows:
  • We generated 50,000 abnormal activities by considering all potential anomalies that could occur in a two-resident home, significantly enhancing the reliability of our research findings.
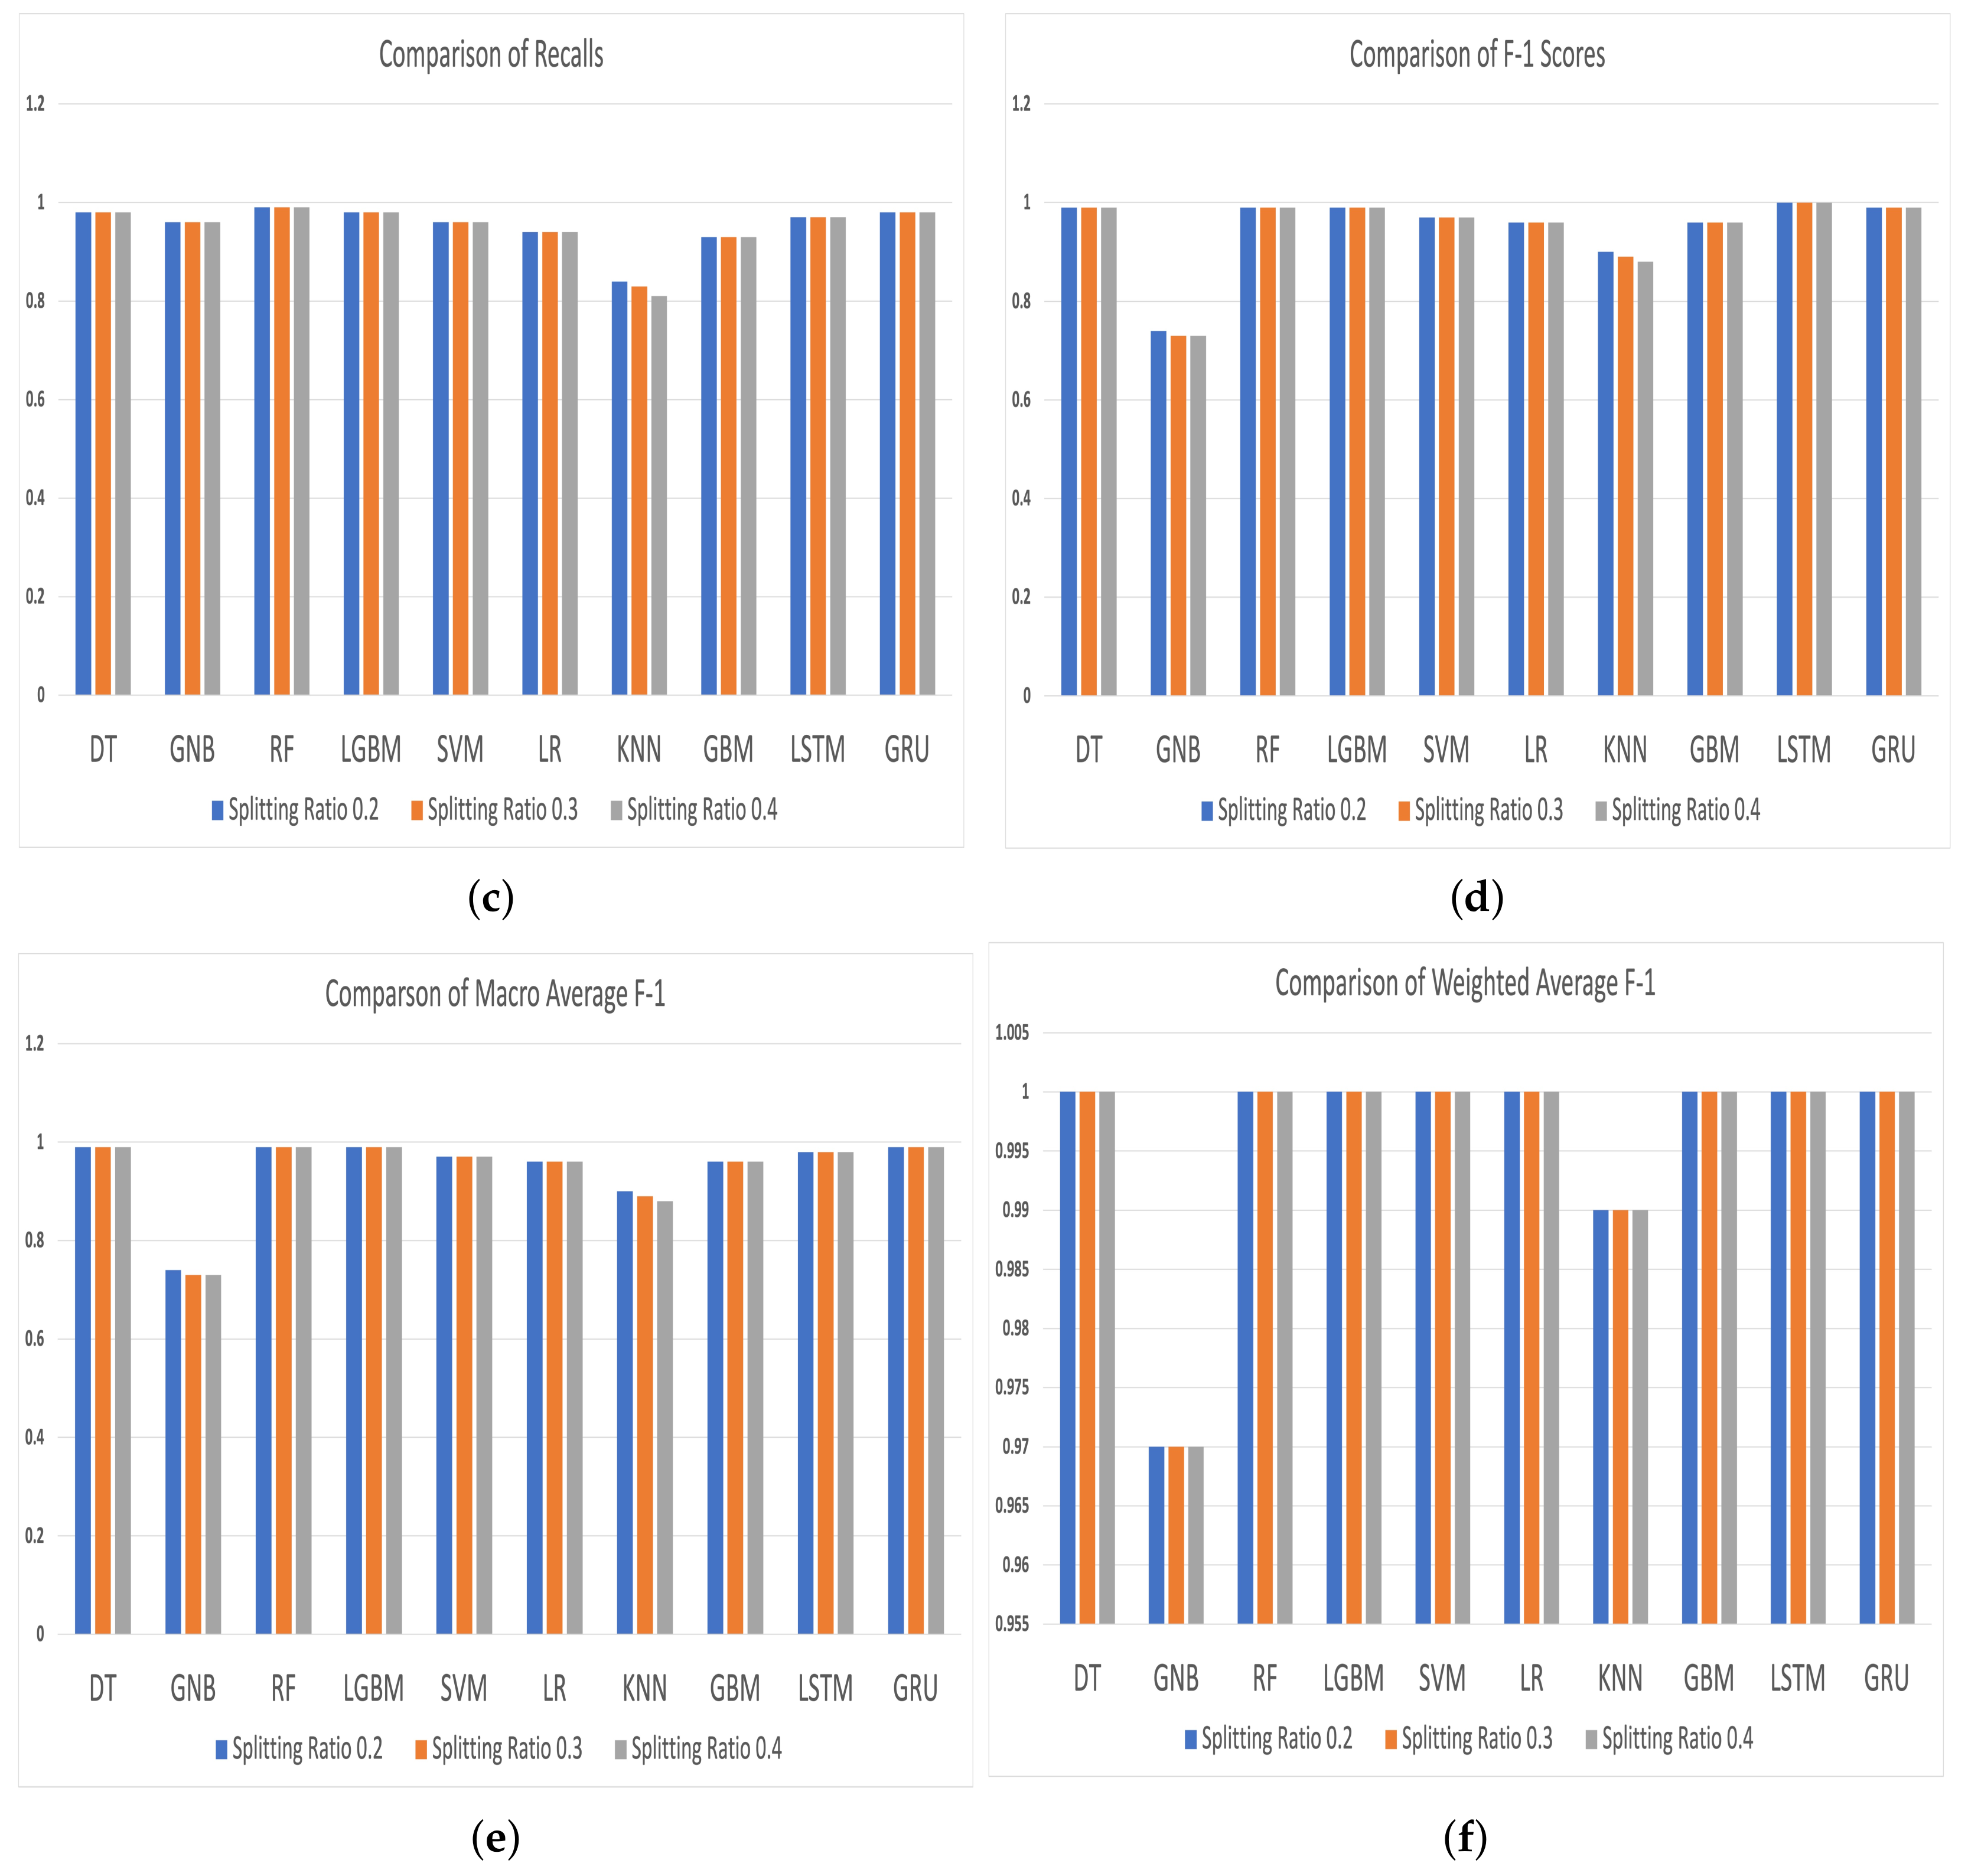
  • Our research includes a comprehensive guide that examines how varying the training–test splitting ratios and implementing k-fold cross-validation impact the performance of these classifiers.
  • In our study, we also present a detailed analysis of the computational complexity of these classifiers, spanning from the training phase to making predictions. This analysis effectively illustrates the trade-off between performance and computational costs associated with these algorithms.
  • Our research entails a rigorous comparative analysis of these classifiers using the activity recognition using ambient sensing (ARAS) multi-resident smart home dataset. Additionally, we offer valuable insights and recommendations for future researchers in this field, aiming to guide and inform their work on similar topics or within the same domain.
Our research offers valuable insights to fellow researchers by pinpointing the optimal machine learning algorithm within the smart home domain. Additionally, it contributes to the ongoing progress in crafting more efficient and effective anomaly detection methods for two-resident scenarios. These findings carry substantial potential for a wide range of applications across domains such as healthcare, security, and smart home technologies.
The rest of the paper is structured as follows: Section 2 covers the literature review. Section 3 explains different machine learning and deep learning classifiers used in this study and their detailed implementation. Section 4 presents the obtained results and comparative analysis among the classifiers, and Section 5 summarizes the proposed study along with future directions.

2. Background and Related Work

This study aims to detect anomalies in human behavior in two-resident homes using machine and deep learning techniques. Traditional vision-aided methods pose privacy concerns and require extensive computation due to processing large video data. Researchers have proposed methods utilizing sensor data to make anomaly detection more efficient while ensuring resident privacy.

2.1. Machine Learning-Based Human Activity Anomaly Detection

Identifying human activities is very important to automate the monitoring of the health of elderly people. A significant number of research works and studies have been conducted to identify and classify human activities by analyzing the motion from video captured through closed-circuit television (CCTV) or other types of camera systems. Machine learning and deep learning models were widely used in many works to identify anomalies in activities [31,32] along with classification [33,34,35]. Since placing surveillance cameras to observe the residents presents data privacy issues/concerns, sensor-based observation has become popular. Adrien et al. proposed a method for identifying human activities using the Hidden Markov Model (HMM) and a wearable motion suit with a sensor-attached glove [5]. Lawal, I. A. et al. conducted a similar study by placing sensors on seven body parts and using the Convolutional Neural Network (CNN) model over the collected frequency images [24]. While machine learning and deep learning classifiers work well over sensor data, placing sensors on residents for a long time is inconvenient. Researchers suggest deploying sensors throughout the home to detect human activity and anomalies in order to create a smart home. Fahad et al. utilized SVM, one-vs-one (OSVM), and K-means classifiers to identify human activities and anomalies in the ARAS and the Center for Advanced Studies in Adaptive Systems (CASAS) smart home datasets [36]. Similarly, Gupta et al. established a sensor-based test bed to collect data and used HMM to detect anomalies in user behavior [15]. All these discussed works assumed a single resident at home, but it is more realistic to consider multiple residents as the activities of one resident are directly affected by the others. Several studies were conducted later to detect anomalies in user behavior by considering multiple residents. In their research, Liang et al. employed the power of machine learning to identify and differentiate between multiple residents’ activities accurately while also flagging any unusual activities [9]. Howedi et al. utilized an innovative technique based on entropy to detect anomalies in the presence of visitors, ensuring maximum safety and security for residents [6]. Jakkula et al. introduced a novel algorithm that leverages temporal pattern discovery to identify any irregularities in user activities [37].

2.2. Machine Learning-Based Anomaly Detection in Other Domains

In addition to human activity anomaly detection, machine learning models have been applied for anomaly detection in other domains such as cyber security, the IoT, finance, manufacturing, and so on. Jadidi Z. et al. proposed an artificial neural network (ANN)-based model for identifying adversarial attacks in IoT and industrial IoT networks [38]. They reported the effectiveness of the CNN model in detecting adversarial attacks. Another study for detecting anomalies in cyber security was carried out by Vávra J. et al., where they applied four different machine learning (ML) and deep learning (DL) models for protecting industrial control systems [39]. They optimized the hyper-parameters to propose an adaptive anomaly detection system. To identify anomalies in an IoT network, a study was conducted using different machine learning models, and random forest was found to be more effective [40]. Several ML models have been applied to identify anomalies and fraud in finance. Alexander B. et al. conducted a studies in which they applied seven supervised and two unsupervised models over the general ledger data to identify transaction inconsistencies [41]. Along with the supervised ML models, the unsupervised models have also been used in several studies for anomaly detection. Schlegl T. et al. proposed an interpretable deep learning model for classifying anomalies and normal torque sequences in a manufacturing system [42].
As summarized in Table 1, most of the listed studies focused on using threshold-based anomaly-detection methods. This approach entails determining an appropriate threshold value, which is achieved through a trial-and-error process. The datasets utilized in these studies primarily exhibited normal activities, with the models trained on these data and tested with user-generated anomalies. However, the issue with this approach is that the created anomalies may only partially represent some possible anomalies. Additionally, the studies needed to comprehensively analyze the impact of different training–test splitting ratios and k-fold cross-validation on performance. To address these limitations, we conducted a study that utilized popular machine learning classifiers and two recurrent neural network (RNN) techniques on the ARAS dataset to identify anomalies in human activities. Furthermore, we conducted a comparative evaluation of these methods under different settings. To ensure the validity of our results, we generated 50,000 anomalies by considering all possible scenarios.

3. Analysis and Comparison of Machine Learning-Based Anomaly Detection

This section discusses the applied machine learning and deep learning models, the experiment in detail, and the dataset used. The entire workflow of this study is shown in Figure 1. This study starts with collecting the data and cleaning the data to remove null and inconsistent values. Then, we perform scaling over the inputs to remove the bias of a specific activity on the outcome. We further split the data into training and test sets randomly and, finally, trained and tested the machine learning (ML) and deep learning (DL) models. The details of each ML and DL model are described in the following subsection.

3.1. Machine Learning Models

Eight machine learning classifiers were applied to detect human activity anomalies in this study.

3.1.1. Decision Tree (DT)

Decision trees (DTs) are a popular machine learning tool that can be used for both classification and regression. When trained on a dataset, they will gain the ability of classifying new unseen data. A decision tree consists of three types of nodes, namely the root, inner, and leaf nodes. The tree is created using a number of edges that connect these nodes and helps to carry out classification and regression. Among the many DT algorithms, we used the classification and regression trees (CART) method to identify anomalies. This method recursively splits the dataset into subsets by making binary decisions based on the input features at each stage until it reaches a stopping point or a predetermined depth. The algorithm selects the feature at the tree’s root node that optimally divides the dataset into subsets while maximizing a certain criterion. The Gini index, a measure of inequality that may be used to measure any unbalanced distribution between 0 and 1, divides the nodes and creates a decision tree. We determined the feature’s Gini Gain by calculating the Gini index across all of the values of a feature within the data collection [43,44], as shown in Equation (1).
g i n i ( T ) = 1 j = 1 n p j 2
where p j indicates the likelihood that a dataset sample will belong to a certain class and n indicates the total number of classes in the dataset. The Gini Split Info calculates the Gini index across all feature values, and the Gini index of the ith feature is computed using the following equation (Equation (2)).
G I N I s p l i t ( T ) = N i N g i n i ( T i )

3.1.2. Support Vector Machine (SVM)

A Support Vector Machine (SVM) is a widely used machine learning classifier that divides various classes of data points by locating the best hyperplane in a feature space. The main goal of SVM is to locate the hyperplane that optimizes the distance between the classes while minimizing classification errors [45]. The margin, also known as the distance between the hyperplane and the closest data point of each class (support vector), is a crucial parameter in the SVM algorithm. The SVM algorithm looks for the hyperplane with the maximum margin (as illustrated in Equation (3)), as it effectively separates the data and increases the model’s ability to generalize to unseen data. In the SVM classifier, a specific weight or coefficient is given to each feature in the dataset, and it then learns to build a decision boundary by optimizing these weights. The best hyperplane is discovered by resolving a mathematical optimization problem that aims to minimize a cost function while ensuring that all data points are accurately classified, and the margin is maximized. Suppose the hyperplane is defined by w and b is a set of points in which H = { x | w T . x + b = 0 } ; the hyperplane is shown by γ . The maximum margin would be:
arg max w , b γ ( w , b ) such that i y i ( w T . x i + b ) 0
where y i is the class label associated with the i-th data point x i .
This method makes SVMs efficient for both linearly separable data, where a straight line serves as the hyperplane, and non-linearly separable data, where SVMs can translate the data into a higher-dimensional space using a kernel function, allowing them to identify a more complex decision boundary.

3.1.3. Naïve Bayes (NB) Classifier

The naïve Bayes classifier is a machine learning algorithm that uses probability to classify data. It is based on Bayes’ theorem and assumes that features are independent (naïve) [46]. The algorithm first estimates the prior probabilities of each class using training data and then calculates the conditional probabilities of each feature given to each class. To make predictions, it combines the prior probabilities with the likelihood of the observed features for each class and selects the class with the highest posterior probability. Naïve Bayes is efficient with high-dimensional data, but may not capture complex relationships between features. The NB classifier uses the following Bayes theorem presented in Equation (4):
P ( C | x ) = P ( x | C ) × P ( C ) P ( x )
where P ( C | x ) is the probability of a data point belonging to class C given its features x, P ( x | C ) is the probability of features x given class C, P ( C ) is the prior probability, and P ( x ) is the marginal probability.

3.1.4. Gradient Boosting (GB) Classifier

The gradient boosting (GB) classifier is an effective ensemble machine learning approach for classification applications. It works by gradually integrating numerous weak learners (usually decision trees) so that each new learner corrects the errors committed by the preceding ones. During training, GB makes an initial prediction (typically the target variable’s mean) and then fits a weak learner to the residuals of past predictions, changing the model’s weights to reduce residual errors [47]. This procedure is continued recursively, with each new learner focusing on the remaining faults as the model’s overall accuracy improves. The formula for GB, which incorporates a weak learner into the ensemble at each iteration, can be expressed as Equation (5):
y ^ i ( t ) = y ^ i ( t 1 ) + f t ( x i )
where t is the iteration number and y ^ i ( t ) is the predicted score for the i-th training example at iteration t. The weak learner, which was added at iteration t, is shown by f t .
This iterative process allows Extreme Gradient Boosting (XGBoost) to gradually improve its predictions by incorporating the knowledge of multiple weak learners, eventually leading to a strong ensemble model. Gradient boosting is a popular choice in many machine learning applications due to its high predicted accuracy, robustness against overfitting, and ability to capture complicated correlations in data.

3.1.5. Light Gradient Boosting Machine (LGBM) Classifier

The Light Gradient Boosting Machine (LGBM) classifier is a fast, efficient, and high-performing gradient boosting system for machine learning and statistical modeling. Because of its histogram-based learning method, the LGBM is well-suited for training on huge datasets because it can more quickly calculate gradients by grouping data points into histogram bins [48]. Using a structure very similar to classic gradient boosting, it gradually adds decision trees to enhance prediction precision. The LGBM is a popular option for many machine learning tasks, including classification, regression, and ranking, as it has many features including regularization, early stopping, and the handling of missing variables.

3.1.6. Random Forest (RF) Classifier

The random forest (RF) classifier is an ensemble machine learning technique that builds numerous decision trees during training and then pools their predictions to boost accuracy and mitigate overfitting. These decision trees are generated using a method called bagging (Bootstrap Aggregating). A bootstrap sample is generated by randomly drawing samples from the training data and replacing them with new ones for each tree in the forest. Random forest can be represented as the aggregation of the predicted output ( y ^ i ) from individual decision trees:
y ^ i = 1 N k = 1 N f k ( x i )
In Equation (6), f k ( x i ) is the prediction of the k-th decision tree for the i-th sample and N represents the number of decision trees in the forest.
To further increase the randomization and variety of the trees, we evaluated a random subset of features for splitting at each decision tree node. The risk of overfitting is mitigated, and tree decorrelation is improved by combining bootstrapped samples and feature randomization. Each tree in the forest makes its own classification or regression during prediction, and the final output is decided by majority vote (classification) or the average (regression) [49]. Due to its effectiveness in many machine learning applications, random forest is frequently employed as an ensemble technique to improve predicted accuracy, resilience, and generalization.

3.1.7. k-Nearest Neighbors (KNN) Classifier

The k-nearest neighbors (KNN) classifier is a non-parametric and instance-based machine learning technique used for classification and regression. It is based on the idea of similarities between features. In KNN, each data point is assigned a category based on the classification of its k-nearest neighbors, where the user selects k as a hyper-parameter. The predicted class for a new data point can be determined by the majority class among the k-nearest neighbors, as expressed in Equation (7):
y ^ = argmax c i = 1 k I ( y i = c )
where c shows each class label and the predicted class is represented by y ^ . Therefore, y i denotes the class label of the i-th nearest neighbor. In this formula, I ( · ) is the indicator function, which returns 1 if the condition inside is true and 0 otherwise.
In the study, we conducted a comparative analysis and determined that using five neighbors (the optimal value of k) is appropriate. The algorithm determines the distance of a new data point from the rest of the dataset, usually using the Euclidean distance metric, to decide its classification. It picks the most frequent label among the k-nearest data points for classification tasks, and for regression tasks, it takes the mean of the selected points. The algorithm’s performance is highly dependent on the value of k; smaller values make it vulnerable to local noise, while larger values can lead to over-smoothing of the decision border [50]. KNN is computationally efficient during training, but its prediction method can be time-consuming, particularly when working with large datasets, due to the need to calculate distances to all data points.

3.1.8. Logistic Regression (LR) Classifier

Logistic Regression (LR) is a popular technique in supervised machine learning, primarily used for binary classification tasks. It can be adapted to handle multi-class classification as well. Unlike a true regression technique, logistic regression employs the logistic (sigmoid) function to represent the likelihood of a binary outcome, such as 0 or 1, as a function of one or more predictor variables. The logistic function converts a linear combination of predictor variables into a probability score between 0 and 1, making it a useful tool for classification [51]. The logistic regression model estimates each predictor’s impact on the log odds of the binary outcome, and the coefficients are optimized during the training process to improve the model’s performance. Logistic regression employs a threshold, typically 0.5, to categorize data points. Values above the threshold are assigned to one class, while those below the threshold are assigned to the other class.

3.2. Deep Learning Techniques

Since we are working with the temporal (time-dependent) dataset for anomaly detection, we also looked into deep learning techniques (neural networks with deep structures) and applied two recurrent neural network (RNN) techniques named Long Short-term Memory (LSTM) and the Gated Recurrent Unit (GRU) model, which are described below.

3.2.1. Long Short-Term Memory (LSTM) Model

Long Short-term Memory (LSTM) is a type of recurrent neural network architecture that has been designed to solve the vanishing gradient problem. It can effectively capture long-range dependencies in sequential data. LSTMs are composed of memory cells and a network of gates that regulate the flow of information. Each LSTM cell maintains a hidden state, which can capture and store information over extended sequences. It also has a cell state, which selectively retains or forgets information. The gates in an LSTM, namely the forget gate, input gate, and output gate, control the flow of data through mathematical operations such as elementwise multiplication and addition [52]. Figure 2 presents the base structure of LSTM. The constituting gates enable LSTMs to learn and remember patterns in sequential data, making them particularly well suited for tasks such as natural language processing (NLP), speech recognition, and time series prediction.
LSTMs can capture complex temporal relationships and have been instrumental in achieving state-of-the-art results in a wide range of sequence modeling tasks. The architecture (and layers) of our used LSTM model is shown in Figure 3.

3.2.2. Gated Recurrent Unit (GRU) Model

The Gated Recurrent Unit (GRU) is another type of recurrent neural network (RNN) architecture designed to process sequential data. It addresses the issue of vanishing gradients commonly found in traditional RNNs. The GRU cell comprises several components, including a reset gate and an update gate. These components work together to regulate the flow of information within the cell. The reset gate determines which information from the prior hidden state should be reset or forgotten, while the update gate controls the extent the new input should impact the updating process of the hidden state. By combining these gates, GRU cells can selectively update their hidden states, allowing them to capture long-term dependencies in sequential data [48]. Figure 2 presents the base structure of the GRU. In comparison to other RNN versions like the LSTM, the GRU’s design is simpler due to its ability to update the hidden state quickly without the use of a dedicated memory unit (Long Short-term Memory). Since the GRU is so effective at modeling long-term dependencies, it is frequently used for tasks like NLP, speech recognition, and time series analysis. The architecture of our used GRU model is shown in Figure 3.
For anomaly detection, we employed models based on both the LSTM and GRU, which share the same underlying architecture. We employed a straightforward design consisting of two LSTM/GRU layers, each comprising a pair of LSTM/GRUs units.

3.3. Dataset

Within the scope of our research, we made use of a real-world dataset known as activity recognition using ambient sensing (ARAS https://www.cmpe.boun.edu.tr/aras/, accessed on 1 March 2024). The dataset consists of data recorded by twenty binary sensors strategically positioned in various locations across a two-resident residence. Each second, data were captured from two homes, called House A and House B, with two people each for thirty days. The creator labels the data that are recorded at each second based on the activity of both people in the house. On the basis of the readings obtained from the sensors, a total of 27 activities were assigned to both of the occupants. Because the activity of one resident is affected by the activity of the other resident and both cannot activate the same sensor at the same time, we took into account the sensor readings in addition to the activity of one resident to determine whether other resident’s activities were abnormal.
Abnormal activity is defined as any event that triggers an unrelated sensor. For instance, if someone is outside the home, but a sensor inside the home is activated, it is considered abnormal. The various types of activities and sensor placements are detailed in Table 2. In each house, a total of 2,592,000 normal activities for both residents were recorded. Since the dataset does not contain any anomalies, we created 50,000 anomalies https://github.com/Rahman-Motiur/Anomaly-Detection-in-Smart-Home, accessed on 1 March 2024, by considering all possible combinations of sensor values that may lead to anomalies.

3.4. Experiments

In our study, we conducted thorough experiments to report on the performance of machine learning and deep learning classifiers in anomaly detection under different circumstances. All the models’ hyper-parameters are presented in Table 3. For the experiments, we split the dataset into training and test sets using different ratios, such as 80:20, 70:30, and 60:40, and used 5-fold cross-validation to determine the comparative performance of the models. As the number of anomalies is smaller than the normal activities, we used stratified splitting to maintain the balance between the classes in both the training and testing sets. We also used stratified splitting in the k-fold cross-validation to ensure class balance in each fold. We implemented early stopping by monitoring the training loss in order to prevent overfitting of the models.

3.5. Computing Platform

Our experiments were conducted on a cluster server consisting of 4 nodes, each with an NVIDIA A30 Tensor Core GPU, 64 cores, 512 GB of memory, and one A30 GPU (24 GB) per node. We used PyTorch 1.13.1 and CUDA tools 11.2 to implement the models and conduct the experiments.

3.6. Evaluation

The performance of the applied classifiers over the ARAS dataset was measured by utilizing several metrics including the accuracy, precision, recall, F-1 score, macro average F-1, and weighted average F-1, presented in Equations (8)–(13). The value ranges of these metrics are between between 0 and 1, with 1 indicating the best performance. As the dataset is slightly imbalanced, we used the macro average F-1 and weighted average F-1 to ensure reliable performance comparison. The description of each metric and its formula is as follows:
  • Accuracy: For the accuracy, we measured the proportion of correctly classified predictions among the total number of predictions.
    A c c u r a c y = T P + T N T P + F N + T N + F P
    where TP refers to the number of true positives, TN refers to the number of true negatives, FP represents the number of false positives, and FN denotes the number of false negatives. These measures refer to the actual number of instances a classifier model has correctly (referring to true) or incorrectly (falsely) predicted in the positive or negative class (where positive and negative in this context refer to being or not being in a defined class, respectively).
  • Precision: Precision measures the proportion of instances that are correctly classified as positive (TP) among all positive predictions made.
    P r e c i s i o n = T P T P + F P
  • Recall: This score measures the proportion of true positive predictions among all actual positive instances, whether they are correctly classified as positive or incorrectly classified as negative (FN). Recall is, thus, calculated as the number of true positive predictions divided by the sum of true positive and false negative predictions.
    R e c a l l = T P T P + F N
    F-1 score: The F-1 score is the harmonic mean of the precision and recall.
    F - 1 = 2 × P r e c i s i o n × R e c a l l P r e c i s i o n + R e c a l l
  • Macro average F-1: This score calculates the F-1 score for each class independently and then takes the unweighted average of these scores. Unweighted average means that this score will treat all the classes equally regardless of the number of instances they have.
    M a c r o A v e r a g e F - 1 = i = 1 N F - 1 S c o r e i N
  • Weighted average F-1: This score calculates the F-1 score for each class independently and then takes the weighted average of these scores, weighted by the number of true instances for each class. In this score, the classes with more instances will receive a higher weight in the calculation.
    W e i g h t e d A v e r a g e F - 1 = i = 1 N w i × F - 1 S c o r e i
    In the above measures, TP, TN, FN, FP, N, and w denote the number of true positives, the number of true negatives, the number of false negatives, the number of false positives, the number of classes, and the weight assigned to each class, respectively.

4. Results and Discussion

Our study aims to perform in-depth experiments on ten machine learning and deep learning models to detect anomalies in two-resident home activity. We applied these models to data from two houses separately to see how different the training–test splitting ratios and k-fold cross-validations affected their performance. We also conducted comparative experiments to report the computational cost of these classifiers in processing time series anomaly detection.

4.1. Performance on House A

In House A, two residents live together, and the activities of one resident are classified based on the active presence of the other. Table 4 displays the performance of ten classifiers on the ARAS dataset using five-fold cross-validation. The results indicate that the Gated Recurrent Unit (GRU) model performed the best, followed by the random forest model, while the Gaussian naïve Bayes model delivered the lowest performance when evaluated using the metrics. The performance of other classifiers listed in Table 4 is also not poor, comparatively.
We evaluated the performance of various models using the House A data in different splitting ratios (80:20, 70:30, and 60:40) for training and testing. The results of the applied models are shown in Figure 4. The figure indicates that, for the most part, the performance of the same classifiers did not vary significantly across different splitting ratios. Figure 4c–e show that the Gaussian naïve Bayes (GNB) and KNN classifiers performed differently in terms of the recall, macro F-1, and weighted F-1 scores for different splitting ratios. The performance of the other classifiers remained consistent across different splitting ratios in regard to most of the metrics, suggesting that splitting ratios do not significantly impact performance. However, there was a significant difference in performance among the classifiers.

4.2. Performance on House B

In addition, we conducted comparative experiments on the House B data from the ARAS multi-resident activity dataset. The models were evaluated using five-fold cross-validation, and their performance is presented in Table 5. As shown in the table, the Gated Recurrent Unit (GRU) achieved the highest performance on House B, followed by the decision tree (DT), while the Gaussian naïve Bayes (GNB) had the lowest performance. These results are similar to those observed for House A.
To gather more empirical information, we analyzed the impacts of different training–test splitting ratios on the House B data from the ARAS dataset. Our experiments yielded comparative results, which we present in Figure 5. Similar to our findings for House A, we observed that the GNB and KNN classifiers exhibited varying levels of performance in terms of the recall, macro F-1, and weighted F-1 scores for different splitting ratios. On the other hand, the remaining classifiers displayed more consistent performance across different metrics.

4.3. Computational Cost Analysis

As part of our study, we examined the computational cost of each classifier on the ARAS multi-resident activity dataset. We conducted training and testing to determine the amount of time each classifier required to complete both tasks. Figure 6 displays the time taken by each classifier to finish training and testing. The chart indicates that the LSTM took the longest time, followed by the GRU, to accomplish the training and validation necessary to achieve the same level of performance as the other classifiers. In contrast, the GNB classifier required the least amount of time to complete the training and testing process.
The above discussion shows that the GRU-based model identified anomalies more precisely than the other classifiers, although it had the second-highest computational cost. The reason behind this is that the human activity data are temporal, and one activity is dependent on the other activities that happened in the past. So, the information from past activities is needed to decide the present activities. The working approach of the GRU model is consistent with the requirement of accessing the information from the past during training and testing. That is why the GRU-based model outperformed the other models in terms of the overall accuracy to identify anomalies in human activities.

5. Conclusions and Future Directions

In our study, we utilized various machine learning and deep learning models to identify anomalies in human activities. Since the ARAS multi-resident activity dataset only includes normal activities, we generated 50,000 anomalies by considering all possible unusual sensor combinations. We took into account that the activities of one resident directly influence the activities of the other resident and, therefore, used one resident’s activity as the input when identifying anomalies in the other resident’s activities. To evaluate the performance of the applied classifiers, we examined the effects of five-fold cross-validations and different splitting ratios. Our findings revealed that the Gated Recurrent Unit (GRU) provided the highest performance results, followed by the decision tree (DT), while Gaussian naïve Bayes (GNB) yielded the lowest performance results. We also discovered that the splitting ratios of 80:20, 70:30, and 60:40 did not significantly impact performance, except for the k-nearest neighbor (KNN) and GNB classifiers. Additionally, we investigated the computational costs of all applied classifiers from training to prediction. Our findings showed that the Long Short-term Memory (LSTM)-based model took the longest time, followed by the GRU, while the GNB classifier took the least. The study provides a comprehensive guide for researchers, including performance and computational costs, to compare machine learning and deep learning classifiers for anomaly detection in human activities.
Our findings can provide valuable insights for future researchers in anomaly detection of human activities. Our analysis revealed performance differences among classifiers, indicating that future studies should focus on optimizing models or exploring alternative architectures to address our limitations. For certain uses, the decision tree (DT) and Gaussian naïve Bayes (GNB) classifiers can be made better, or new models can be devised that perform better than the Gated Recurrent Unit (GRU). Our paper also investigates how data splitting ratios affect classifiers such as k-nearest neighbor (KNN) and GNB, which could lead to optimal data-partitioning algorithms. Researchers can optimize model training and prediction based on the computational costs of classifiers. Additionally, exploring ways to reduce the time complexity of the LSTM and GRU models could be beneficial. Further studies can examine the trade-offs between model performance and computational efficiency to help practitioners select the most suitable model for their requirements. Our future objectives include improving anomaly-generation methods, refining existing classifiers, exploring alternative architectures, and optimizing computational costs. These efforts will contribute to developing robust and efficient anomaly-detection systems for human activities.

Author Contributions

Conceptualization, M.M.R., D.G. and S.B.; methodology, M.M.R., D.G. and S.B.; software, M.M.R., D.G. and S.S.; validation, S.B. and M.F.; formal analysis, S.B. and M.F.; investigation, M.M.R., D.G. and S.B.; resources, D.G., S.B. and M.F.; data curation, M.M.R. and S.S.; writing—original draft preparation, M.M.R. and D.G.; writing—review and editing, S.B. and M.F.; visualization, D.G., S.B., S.S. and M.F.; supervision, S.B. and M.F.; project administration, S.B. and M.F. All authors have read and agreed to the final version of the manuscript.

Funding

This research received no external funding.

Data Availability Statement

This research investigated activity recognition using the ambient sensing (ARAS) dataset, which is available at: https://www.cmpe.boun.edu.tr/aras/, accessed on 1 March 2024. Moreover, the anomalies we created are available at: https://github.com/Rahman-Motiur/Anomaly-Detection-in-Smart-Home, accessed on 1 March 2024.

Conflicts of Interest

The authors declare no conflicts of interest.

References

  1. Bakar, U.A.B.U.A.; Ghayvat, H.; Hasanm, S.F.; Mukhopadhyay, S.C. Activity and Anomaly Detection in Smart Home: A Survey; Springer International Publishing: Cham, Switzerland, 2016; Volume 16, pp. 191–220. [Google Scholar] [CrossRef]
  2. Ramapatruni, S.; Narayanan, S.N.; Mittal, S.; Joshi, A.; Joshi, K. Anomaly Detection Models for Smart Home Security. In Proceedings of the 2019 IEEE 5th Intl Conference on Big Data Security on Cloud (BigDataSecurity), IEEE International Conference on High Performance and Smart Computing, (HPSC) and IEEE International Conference on Intelligent Data and Security (IDS), Washington, DC, USA, 27–29 May 2019; pp. 19–24. [Google Scholar] [CrossRef]
  3. Rahim, A.; Zhong, Y.; Ahmad, T.; Ahmad, S.; Pławiak, P.; Hammad, M. Enhancing Smart Home Security: Anomaly Detection and Face Recognition in Smart Home IoT Devices Using Logit-Boosted CNN Models. Sensors 2023, 23, 6979. [Google Scholar] [CrossRef] [PubMed]
  4. Alghayadh, F.; Debnath, D. A Hybrid Intrusion Detection System for Smart Home Security Based on Machine Learning and User Behavior. Adv. Internet Things 2021, 11, 10–25. [Google Scholar] [CrossRef]
  5. Malaisé, A.; Maurice, P.; Colas, F.; Charpillet, F.; Ivaldi, S. Activity Recognition with Multiple Wearable Sensors for Industrial Applications. In Proceedings of the ACHI 2018—Eleventh International Conference on Advances in Computer-Human Interactions, Rome, Italy, 25–29 March 2018. [Google Scholar]
  6. Howedi, A.; Lotfi, A.; Pourabdollah, A. An Entropy-Based Approach for Anomaly Detection in Activities of Daily Living in the Presence of a Visitor. Entropy 2020, 22, 845. [Google Scholar] [CrossRef] [PubMed]
  7. Alemdar, H.; Ertan, H.; Incel, O.D.; Ersoy, C. ARAS human activity datasets in multiple homes with multiple residents. In Proceedings of the 2013 7th International Conference on Pervasive Computing Technologies for Healthcare and Workshops, Venice, Italy, 5–8 May 2013; pp. 232–235. [Google Scholar]
  8. Han, S.; Wu, Q.; Yang, Y. Machine learning for Internet of things anomaly detection under low-quality data. Int. J. Distrib. Sens. Netw. 2022, 18, 15501329221133765. [Google Scholar] [CrossRef]
  9. Liang, J.M.; Chung, P.L.; Ye, Y.J.; Mishra, S. Applying Machine Learning Technologies Based on Historical Activity Features for Multi-Resident Activity Recognition. Sensors 2021, 21, 2520. [Google Scholar] [CrossRef]
  10. Jakkula, V.; Cook, D.J. Anomaly detection using temporal data mining in a smart home environment. Methods Inf. Med. 2008, 47, 70–75. [Google Scholar] [CrossRef]
  11. Zamani, S.; Talebi, H.; Stevens, G. Time Series Anomaly Detection in Smart Homes: A Deep Learning Approach. arXiv 2023, arXiv:2302.14781. [Google Scholar] [CrossRef]
  12. Priyadarshini, I.; Alkhayyat, A.; Gehlot, A.; Kumar, R. Time series analysis and anomaly detection for trustworthy smart homes. Comput. Electr. Eng. 2022, 102, 108193. [Google Scholar] [CrossRef]
  13. Hsu, K.C.; Chiang, Y.T.; Lin, G.Y.; Lu, C.H.; Hsu, J.Y.J.; Fu, L.C. Strategies for Inference Mechanism of Conditional Random Fields for Multiple-Resident Activity Recognition in a Smart Home. In Trends in Applied Intelligent Systems; García-Pedrajas, N., Herrera, F., Fyfe, C., Benítez, J.M., Ali, M., Eds.; Lecture Notes in Computer Science; Springer: Berlin/Heidelberg, Germany, 2010; pp. 417–426. [Google Scholar] [CrossRef]
  14. Tran, S.N.; Ngo, T.S.; Zhang, Q.; Karunanithi, M. Mixed-dependency models for multi-resident activity recognition in smart homes. Multimed. Tools Appl. 2020, 79, 23445–23460. [Google Scholar] [CrossRef]
  15. Gupta, D.; Gupta, M.; Bhatt, S.; Tosun, A.S. Detecting Anomalous User Behavior in Remote Patient Monitoring. In Proceedings of the 2021 IEEE 22nd International Conference on Information Reuse and Integration for Data Science (IRI), Las Vegas, NV, USA, 10–12 August 2021; pp. 33–40. [Google Scholar] [CrossRef]
  16. Jiang, C.; Fu, C.; Zhao, Z.; Du, X. Effective Anomaly Detection in Smart Home by Integrating Event Time Intervals. Procedia Comput. Sci. 2022, 210, 53–60. [Google Scholar] [CrossRef]
  17. Hao, J.; Bouzouane, A.; Gaboury, S. Recognizing multi-resident activities in non-intrusive sensor-based smart homes by formal concept analysis. Neurocomputing 2018, 318, 75–89. [Google Scholar] [CrossRef]
  18. Panja, S.; Yadav, K.; Nag, A. Anomaly Detection at the IoT Edge in IoT-Based Smart Home Environment Using Deep Learning. In Proceedings of the International Conference on Advanced Computing Applications, Singapore, 4–5 March 2022; Mandal, J.K., Buyya, R., De, D., Eds.; Advances in Intelligent Systems and Computing; Springer: Singapore, 2022; pp. 119–125. [Google Scholar] [CrossRef]
  19. Gupta, D.; Kayode, O.; Bhatt, S.; Gupta, M.; Tosun, A.S. Hierarchical Federated Learning based Anomaly Detection using Digital Twins for Smart Healthcare. In Proceedings of the 2021 IEEE 7th International Conference on Collaboration and Internet Computing (CIC), Atlanta, GA, USA, 13–15 December 2021; IEEE: Piscataway, NJ, USA, 2021; pp. 16–25. [Google Scholar] [CrossRef]
  20. Gupta, D.; Moni, S.S.; Tosun, A.S. Integration of Digital Twin and Federated Learning for Securing Vehicular Internet of Things. In Proceedings of the 2023 International Conference on Research in Adaptive and Convergent Systems, Gdansk, Poland, 6–10 August 2023; pp. 1–8. [Google Scholar]
  21. Aversano, L.; Bernardi, M.L.; Cimitile, M.; Pecori, R.; Veltri, L. Effective Anomaly Detection Using Deep Learning in IoT Systems. Wirel. Commun. Mob. Comput. 2021, 2021, e9054336. [Google Scholar] [CrossRef]
  22. Abusitta, A.; de Carvalho, G.H.S.; Wahab, O.A.; Halabi, T.; Fung, B.C.M.; Mamoori, S.A. Deep learning-enabled anomaly detection for IoT systems. Internet Things 2023, 21, 100656. [Google Scholar] [CrossRef]
  23. Li, G.; Jung, J.J. Deep learning for anomaly detection in multivariate time series: Approaches, applications, and challenges. Inf. Fusion 2023, 91, 93–102. [Google Scholar] [CrossRef]
  24. Lawal, I.A.; Bano, S. Deep Human Activity Recognition With Localisation of Wearable Sensors. IEEE Access 2020, 8, 155060–155070. [Google Scholar] [CrossRef]
  25. Ahmad, Z.; Shahid Khan, A.; Nisar, K.; Haider, I.; Hassan, R.; Haque, M.R.; Tarmizi, S.; Rodrigues, J.J.P.C. Anomaly Detection Using Deep Neural Network for IoT Architecture. Appl. Sci. 2021, 11, 7050. [Google Scholar] [CrossRef]
  26. Lara, A.; Mayor, V.; Estepa, R.; Estepa, A.; Díaz-Verdejo, J.E. Smart home anomaly-based IDS: Architecture proposal and case study. Internet Things 2023, 22, 100773. [Google Scholar] [CrossRef]
  27. S, M.; M, R. MUD enabled deep learning framework for anomaly detection in IoT integrated smart building. e-Prime—Adv. Electr. Eng. Electron. Energy 2023, 5, 100186. [Google Scholar] [CrossRef]
  28. Sohail, S.; Fan, Z.; Gu, X.; Sabrina, F. Multi-tiered Artificial Neural Networks model for intrusion detection in smart homes. Intell. Syst. Appl. 2022, 16, 200152. [Google Scholar] [CrossRef]
  29. Araya, J.I.I.; Rifà-Pous, H. Anomaly-based cyberattacks detection for smart homes: A systematic literature review. Internet Things 2023, 22, 100792. [Google Scholar] [CrossRef]
  30. Du, W.; Li, A.; Zhou, P.; Niu, B.; Wu, D. PrivacyEye: A Privacy-Preserving and Computationally Efficient Deep Learning-Based Mobile Video Analytics System. IEEE Trans. Mob. Comput. 2022, 21, 3263–3279. [Google Scholar] [CrossRef]
  31. Wang, L.; Huynh, D.Q.; Mansour, M.R. Loss switching fusion with similarity search for video classification. In Proceedings of the 2019 IEEE International Conference on Image Processing (ICIP), Taipei, Taiwan, 22–25 September 2019; IEEE: Piscataway, NJ, USA, 2019; pp. 974–978. [Google Scholar]
  32. Zhang, X.; Yang, S.; Zhang, J.; Zhang, W. Video anomaly detection and localization using motion-field shape description and homogeneity testing. Pattern Recognit. 2020, 105, 107394. [Google Scholar] [CrossRef]
  33. Yang, Y.; Angelini, F.; Naqvi, S.M. Pose-driven human activity anomaly detection in a CCTV-like environment. IET Image Process. 2023, 17, 674–686. [Google Scholar] [CrossRef]
  34. Ali, A.; Samara, W.; Alhaddad, D.; Ware, A.; Saraereh, O.A. Human activity and motion pattern recognition within indoor environment using convolutional neural networks clustering and naive bayes classification algorithms. Sensors 2022, 22, 1016. [Google Scholar] [CrossRef] [PubMed]
  35. Kumar, M.; Patel, A.K.; Biswas, M.; Shitharth, S. Attention-based bidirectional-long short-term memory for abnormal human activity detection. Sci. Rep. 2023, 13, 14442. [Google Scholar] [CrossRef] [PubMed]
  36. Fahad, L.G.; Tahir, S.F. Activity recognition and anomaly detection in smart homes. Neurocomputing 2021, 423, 362–372. [Google Scholar] [CrossRef]
  37. Jakkula, V.R.; Crandall, A.S.; Cook, D.J. Enhancing Anomaly Detection Using Temporal Pattern Discovery. In Advanced Intelligent Environments; Kameas, A.D., Callagan, V., Hagras, H., Weber, M., Minker, W., Eds.; Springer: Boston, MA, USA, 2009; pp. 175–194. [Google Scholar] [CrossRef]
  38. Jadidi, Z.; Pal, S.; K, N.N.; Selvakkumar, A.; Chang, C.C.; Beheshti, M.; Jolfaei, A. Security of Machine Learning-Based Anomaly Detection in Cyber Physical Systems. arXiv 2022, arXiv:2206.05678. [Google Scholar] [CrossRef]
  39. Vávra, J.; Hromada, M.; Lukáš, L.; Dworzecki, J. Adaptive anomaly detection system based on machine learning algorithms in an industrial control environment. Int. J. Crit. Infrastruct. Prot. 2021, 34, 100446. [Google Scholar] [CrossRef]
  40. Stoian, N. Machine Learning for Anomaly Detection in IoT Networks: Malware Analysis on the IoT-23 Data Set. Bachelor’s Thesis, University of Twente, Enschede, The Netherlands, 2020. [Google Scholar]
  41. Bakumenko, A.; Elragal, A. Detecting Anomalies in Financial Data Using Machine Learning Algorithms. Systems 2022, 10, 130. [Google Scholar] [CrossRef]
  42. Schlegl, T.; Schlegl, S.; West, N.; Deuse, J. Scalable anomaly detection in manufacturing systems using an interpretable deep learning approach. Procedia CIRP 2021, 104, 1547–1552. [Google Scholar] [CrossRef]
  43. Dash, S.; Decision Trees Explained—Entropy, Information Gain, Gini Index, CCP Pruning. Towards Data Sci. 2022. Available online: https://towardsdatascience.com/decision-trees-explained-entropy-information-gain-gini-index-ccp-pruning-4d78070db36c (accessed on 1 March 2024).
  44. Li, M. Application of CART decision tree combined with PCA algorithm in intrusion detection. In Proceedings of the 2017 8th IEEE International Conference on Software Engineering and Service Science (ICSESS), Beijing, China, 24–26 November 2017; pp. 38–41. [Google Scholar] [CrossRef]
  45. Lawrence Berkeley National Laboratory; United States Department of Energy Office of Science; United States Department of Energy Office of Scientific and Technical Information. A One-Class Support Vector Machine Calibration Method for Time Series Change Point Detection; United States Department of Energy Office of Science: Washington, DC, USA, 2019. [Google Scholar]
  46. Pramila, P.V.; Gayathri, M. Analysis of Accuracy in Anomaly Detection of Intrusion Detection System Using Naïve Bayes Algorithm Compared Over Gaussian Model. ECS Trans. 2022, 107, 13977–13991. [Google Scholar] [CrossRef]
  47. Anjum, A.; Agbaje, P.; Hounsinou, S.; Olufowobi, H. In-Vehicle Network Anomaly Detection Using Extreme Gradient Boosting Machine. In Proceedings of the 2022 11th Mediterranean Conference on Embedded Computing (MECO), Budva, Montenegro, 7–10 June 2022; IEEE: Piscataway, NJ, USA, 2022. [Google Scholar] [CrossRef]
  48. Sarıkaya, A.; Günel Kılıç, B.; Demirci, M. GRU-GBM: A combined intrusion detection model using LightGBM and gated recurrent unit. Expert Syst. 2022, 39, e13067. [Google Scholar] [CrossRef]
  49. Marteau, P.F. Random Partitioning Forest for Point-Wise and Collective Anomaly Detection-Application to Network Intrusion Detection. IEEE Trans. Inf. Forensics Secur. 2021, 16, 2157–2172. [Google Scholar] [CrossRef]
  50. Saleh, A.I.; Talaat, F.M.; Labib, L.M. A hybrid intrusion detection system (HIDS) based on prioritized k-nearest neighbors and optimized SVM classifiers. Artif. Intell. Rev. 2019, 51, 403–443. [Google Scholar] [CrossRef]
  51. Palmieri, F. Network anomaly detection based on logistic regression of nonlinear chaotic invariants. J. Netw. Comput. Appl. 2019, 148, 102460. [Google Scholar] [CrossRef]
  52. Poh, S.C.; Tan, Y.F.; Guo, X.; Cheong, S.N.; Ooi, C.P.; Tan, W.H. LSTM and HMM Comparison for Home Activity Anomaly Detection. In Proceedings of the 2019 IEEE 3rd Information Technology, Networking, Electronic and Automation Control Conference (ITNEC), Chengdu, China, 15–17 March 2019; IEEE: Piscataway, NJ, USA, 2019; pp. 1564–1568. [Google Scholar] [CrossRef]
Figure 1. Workflow of our experiments.
Futureinternet 16 00139 g001
Figure 2. The base architecture of the GRU is shown on the left side of the figure, and the LSTM is shown on the right side of the figure. In this figure, the input data at time step t are denoted as x t , the hidden states are shown with h, and the cell states are indicated by C.
Futureinternet 16 00139 g002
Figure 3. Architecture of LSTM and GRU models.
Futureinternet 16 00139 g003
Figure 4. The figures presented here demonstrate the relative performance of various models on the House A data from the ARAS dataset. The sub-figures (af) display the accuracy, precision, recall, F-1, macro F-1, and weighted F-1 scores, respectively, obtained by applying ten machine learning and deep learning models at different splitting ratios for the training and testing sets. These ratios include 80:20, 70:30, and 60:40 for training and testing.
Futureinternet 16 00139 g004aFutureinternet 16 00139 g004b
Figure 5. The figures presented here demonstrate the relative performance of various models on the House B data from the ARAS dataset. The sub-figures (af) display the accuracy, precision, recall, F-1, macro F-1, and weighted F-1 scores, respectively, obtained by applying ten machine learning and deep learning models at different splitting ratios for training and testing sets. These ratios include 80:20, 70:30, and 60:40 for training and testing.
Futureinternet 16 00139 g005aFutureinternet 16 00139 g005b
Figure 6. Comparative analysis of the run time of different classifiers from training to testing. The run time is computed in seconds.
Futureinternet 16 00139 g006
Table 1. List of related works with their objectives, contributions, and limitations in human activity anomaly detections.
PaperObjectivesContributionsLimitations
Adrien et al. [5]Recognizing the activity based on the wearable sensors’ data.Proposed probabilistic model based on HMM for single activity detection.The dataset contains one activity and the manual extraction and selection of features.
Lawal, I. A. et al. [24]Activity recognition based on the motion signals (accelerometer and gyroscope).Converted the signals into frequency images and applied CNN models for recognizing activities.The model cannot differentiate closely related activities.
Fahad et al. [36]Identifying anomalies based on the number of activities performed each day.Identified anomalies by considering missing or excess subevents and an unusual duration of an activity using the H20 autoencoder.Works well for single residents while not tested for multiple residents; ground truths were generated, but not validated.
Gupta et al. [15]Classifying human behavior anomalies by utilizing the Internet of Medical Things and smart homes.Applied the HMM model for identifying anomalies where data were collected from the authors’ set test bed.HMM works well when the hidden states are few and requires effective feature engineering for better performance.
Liang et al. [9]Activity recognition of multiple residents using historical activity features.Different machine learning models like random forest (RF), decision tree (DT), Support Vector Machine (SVM), and k-nearest neighbor (KNN) and neural network models such as Multilayer Perceptron (MLP) and Long Short-term Memory (LSTM) were used to classify human activities.The considered features are not enough to classify all activities, including anomalies, accurately.
Howedi et al. [6]Detecting anomalies in human activity in the presence of visitors.Applied entropy-based models to classify the samples and identify anomalies.Finding the optimal threshold for classification is difficult and significantly impacts the performance.
Jakkula et al. [37]Enhancing the human activities’ anomaly detection accuracy.Used temporal features in conjunction with the machine learning model to detect the anomalies in human activities. Generated synthetic data to increase the size of the dataset.The quality of the synthetic data was not validated, and finding the temporal pattern, including the interval, is challenging.
Table 2. Dataset description. This table includes the placement of sensors (20 different locations in the home) and the list of activities that were evaluated.
ActivitySensor Placements
OtherWardrobe
Going OutConvertible Couch (Used as Bed for Resident 2)
Preparing BreakfastTV Receiver
Having BreakfastCouch
Preparing LunchCouch
Having LunchChair
Preparing DinnerChair
Having DinnerFridge
Washing DishesKitchen Drawer
Having SnackWardrobe
SleepingBathroom Cabinet
Watching TVHouse Door
StudyingBathroom Door
Having ShowerShower Cabinet Door
ToiletingHall
NappingKitchen
Using InternetTap
Reading BookWater Closet
LaundryKitchen
ShavingBed
Brushing Teeth
Talking on the Phone
Listening to Music
Cleaning
Having Conversation
Having Guest
Changing Clothes
Table 3. Model hyper-parameters.
ModelsHyper-Parameters
Decision TreeCriterion: Gini
Random ForestDefault Parameters
Gaussian Naïve BayesNo Hyper-parameters
LGBM ClassifierDefault Parameters
Support Vector MachineKernel: RBF, γ = 0.001 , C = 100
Logistic RegressionDefault Parameters
k-Nearest NeighborsNumber of Neighbors: 5
Gradient Boosting ClassifierDefault Parameters
LSTMSequence Length: 1,
Hidden Dimension: 64,
Number of Layers: 2,
Optimizer: Adam,
Loss Function: Cross-Entropy Loss,
Batch Size: 32,
Epoch: 100
GRUInput Size: 22,
Hidden Size: 64,
Number of Layers: 2,
Optimizer: Adam,
Loss Function: Cross-Entropy Loss,
Batch Size: 32,
Epoch: 100
Table 4. Comparative performance of the ten applied machine learning and deep learning classifiers on the House A data from the ARAS multi-resident dataset with 5-fold cross-validation. In the table, an asterisk (*) indicates the overall best performance, (**) indicates the second-best performance, and (+) indicates the worst performance.
ModelsAccuracyPrecisionRecallF-1 ScoreMacro Average F-1Weighted Average F-1
Decision Tree1.00.990.970.980.991.0
Gaussian Naïve Bayes +0.960.330.960.490.730.97
Random Forest **1.00.990.980.990.991.0
LGBM1.00.990.960.980.991.0
Support Vector Machine1.00.990.960.980.970.99
Logistic Regression1.00.940.900.920.961.0
k-Nearest Neighbors0.990.980.840.900.890.98
Gradient Boosting Machine1.00.980.870.920.961.0
LSTM Technique1.00.990.970.980.981.0
GRU Technique *1.00.990.990.990.991.0
Table 5. This report presents a comparison of the performance of ten machine learning and deep learning classifiers applied to the House B data from the ARAS multi-resident dataset. The performance evaluation was conducted using 5-fold cross-validation. In the table, an asterisk (*) indicates the overall best performance, (**) indicates the second-best performance, and (+) indicates the worst performance.
ModelsAccuracyPrecisionRecallF-1 ScoreMacro Average F-1Weighted Average F-1
Decision Tree **1.00.980.980.980.991.0
Gaussian Naïve Bayes +0.950.350.940.490.740.96
Random Forest0.990.990.960.980.981.0
LGBM1.00.970.960.980.981.0
Support Vector Machine1.00.990.950.970.950.99
Logistic Regression1.00.930.920.910.971.0
k-Nearest Neighbors0.990.970.850.900.890.98
Gradient Boosting Machine1.00.970.860.930.951.0
LSTM1.00.980.970.980.981.0
GRU Technique *1.00.990.990.990.991.0
Disclaimer/Publisher’s Note: The statements, opinions and data contained in all publications are solely those of the individual author(s) and contributor(s) and not of MDPI and/or the editor(s). MDPI and/or the editor(s) disclaim responsibility for any injury to people or property resulting from any ideas, methods, instructions or products referred to in the content.

