Performance Analysis of a Novel High Frequency Self-Reconfigurable Battery


CEA, Minatec Campus, Université Grenoble Alpes, F-38000 Grenoble, France
*
Author to whom correspondence should be addressed.
World Electr. Veh. J. 2021, 12(1), 10; https://0-doi-org.brum.beds.ac.uk/10.3390/wevj12010010
Submission received: 30 November 2020
/
Revised: 24 December 2020
/
Accepted: 31 December 2020
/
Published: 11 January 2021
(This article belongs to the Special Issue Selected Papers from The 33rd International Electric Vehicles Symposium and Exhibition (Portland, Oregon, USA))
Abstract
:Self-reconfigurable battery architectures have gained a lot of interest recently in the literature, with more and more advanced functionalities. This paper describes the performance analysis of our proposed High Frequency Self-Reconfigurable Battery (HF SRB). To evaluate specific features with long-term dependencies of our system, a full functional behavioral simulator was developed. A comparison with a real 128-level HF SRB validated the simulator operation. The balancing performances obtained on vehicle test cycles showed the cell capacity discrepancy that the HF SRB is capable of handling in a single complete charge or discharge cycle. The magnitude of this gap demonstrated the extent to which the HF SRB is capable of operating with second life cells or even different chemistry mixes.
1. Introduction
In most of classical Li-Ion electrical storage systems, the battery pack is composed of a certain number of unitary battery cells arranged in series and/or parallel, according to a fixed arrangement. A traditional li-ion battery system is limited by the weakest cell of the battery pack whatever is the charge balancing mechanism [1]. Consequently, battery manufacturers must use cells having perfectly homogeneous characteristics and must implement advanced thermal management to maintain this homogeneity as long as possible. This kind of limitation makes it difficult to build a battery mixing different cells characteristics as with reusing second life battery cells because the system will be always limited by the cell having the smallest capacity and/or the highest impedance.
Not being able to use the full energy contained in all cells of the battery is one of the aspects that led to the development of Self-Reconfigurable Batteries (SRB) [2]. The key idea of those batteries is to introduce individual control of each cell in the battery pack thanks to dedicated half-bridge chopper switches. With such a management, it becomes possible to disconnect only the weakest or damaged cells and supply the required power with the remaining ones. Moreover, bypassing switches offer the capability to adjust the number N of cells placed in serial and thus to adjust the output voltage of the battery.
Optimal cell connection strategies were widely studied for well-determined power profiles ([3,4]). Those algorithms generally consist in exploring all the combinations of cells through the power profile and choosing the one that minimizes a certain criterion such as the total capacity loss. However, those methods were not applicable when the SRB is also used to provide an AC output voltage, to directly drive a motor [5] or to recharge the battery directly on the electric grid ([6,7]).
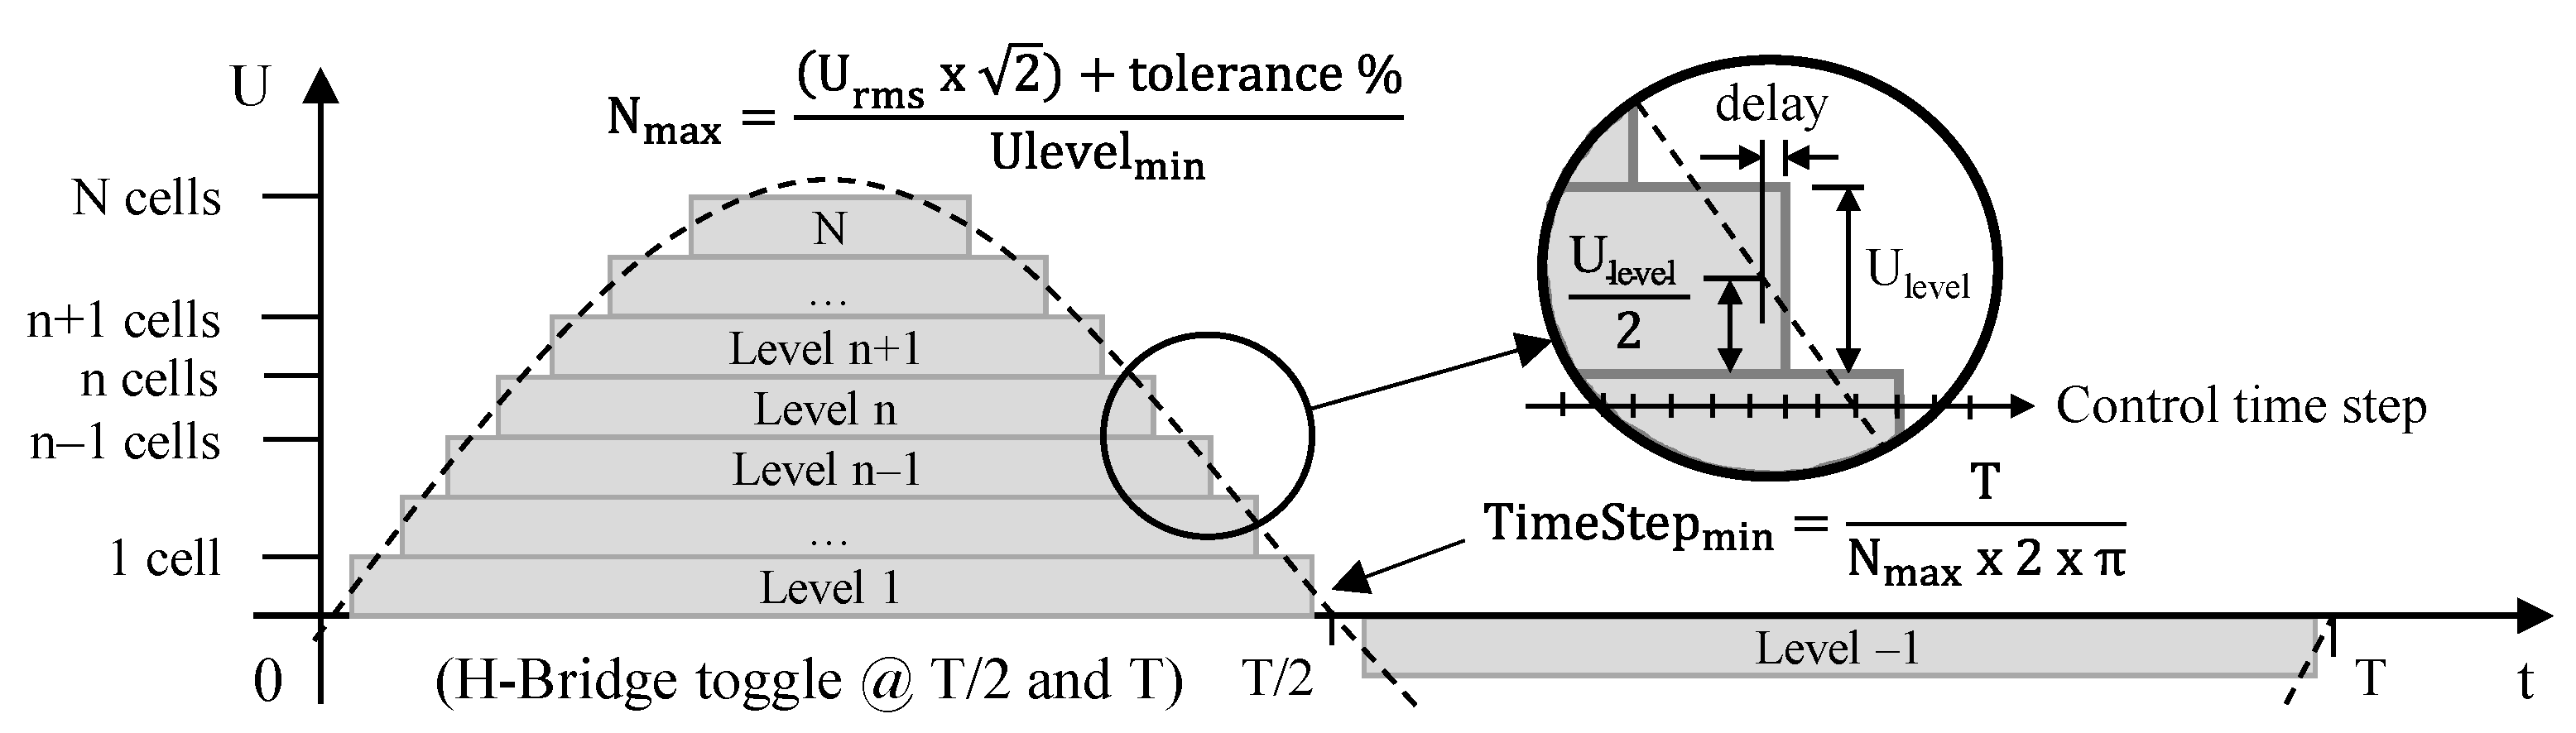
The generation of an AC waveform voltage from an SRB rely on the sequential superimposition of each cell voltages Ulevel resulting in a staircase shape signal of period T and nominal root mean square voltage Urms, as shown in Figure 1. A cell insertion increases the output voltage of one cell voltage, we name that voltage increment a “Level”, Level 1 being the first step, and Level n, the nth step. A level is not attached to a particular cell, any cell of the battery pack can ensure that level. As shown on Figure 1, each level performs four switching operations within a sinusoidal period, while a H-bridge allows the voltage to be reversed by switching two times less. Therefore, in order to generate a 50-Hz sinusoidal waveform, the switching frequency of a level is 200 Hz when those of the H-bridge is 100 Hz. However, in order to generate an accurate waveform in its steepest part, it is necessary to respect a minimum time TimeStepmin between two level changes. In the case of a sine wave, the minimum time step must be less than or equal to the period of the fundamental harmonic of the voltage over more than six times the number of levels Nmax. When taking EU electrical network voltage as an example, which is 230 VRMS +/− 10% with a frequency of 50 Hz, and using cells which the specified end of discharge threshold is 2800 mV, Nmax reaches 128 and the related minimum time step is then about 25 µs, which corresponds to an equivalent switching frequency of 40 kHz. This frequency can be reduced if more than one level can be switched at each control time step. Note that the battery pack could include additional cells that could be used to provide the maximum voltage output in case of cell failures; therefore, the number of cells could be greater than Nmax without affecting TimeStepmin. Staircase shape waveform are usually generated from multilevel converters using carrier phase shift Pulse Width Modulation (PWM) or carrier cascaded PWM implemented on Field Programmable Gate Arrays (FPGA) and Digital Signal Processor (DSP) targets [8].
A High Frequency Self-Reconfigurable Battery (HF SRB) was recently proposed in [9]. This SRB relies on a Nearest Level Control (NLC) to allow the integration of the switches control in low cost microcontrollers. This study demonstrated the operation of a prototype of 128 cells recharging directly on the electrical grid without charger, while perfectly balancing the cells in real-time. Its operating principle is detailed in Section 2.
Cell balancing in this SRB relies on individual control of the utilization rate of each cell in the overall power generation and/or absorption. This variation in the utilization rate is achieved by modifying the order of use of the cells to generate the staircase shape sinusoidal waveform. The average current supplied or absorbed by a cell decreases with the number of the level at which the cell is introduced. The balancing is then performed in real time with a large dynamic thanks to the use of the nominal power usage. Moreover, the balancing criteria are not limited to the voltage balancing of the cells or their state of charge. Indeed, by adjusting the utilization rate of each cell, it is also possible to balance cell temperature, State of Charge (SoC), State of Health (SoH), or any other characteristic that may be observed or estimated as the remaining capacity; or a weighted combination of them. The assessment of balancing algorithms and their validation requires the use of a large number of cells and multiple charge or discharge cycles. In addition, the variation of several criteria, such as the power profile or the temperature profile, increases the number of tests tenfold. This can be time consuming and even introduce safety constraints. In addition, initial cells states must be well known. All this makes it preferable to carry on this study in simulation. Thus, in order to evaluate correctly the trends of some balancing features, many trials can be performed concurrently without requiring the supply of many expensive batteries. However, the simulation results have first to be compared with those produced by a real system in order to validate the reliability of the simulator results.
The first aim of this study is to evaluate the balancing capability of the HF SRB. For this purpose, a simulator is created and used aside a real demonstrator to validate its operation. Once validated, the simulator is used to study the running time gain achieved by the HF SRB over different standardized driving cycles from heterogeneous distributions of the SoC and total capacities of the cells.
This document is composed as follows: the Section 2 describes the main operating principles of the HF SRB. Then the Section 3 details the simulator with the description of its constitutive blocks. The Section 4 details the validation of the simulator, with respect to the demonstrator of a real system, as well as its operation with test driving cycles. Then a following section presents the results obtained from the simulator. The balancing performance of the State of Charge (SoC) is evaluated on the New European Driving Cycle (NEDC) with an initial SoC imbalance of 56%. The impact of the balancing criteria used, such as cells’ voltage or SoC, is then evaluated on a profile consisting of repeated alternating NEDC cycles and recharging phases. Subsequently, the improvement in battery life is evaluated with a Worldwide harmonized Light Vehicles Test Procedure (WLTP) driving cycle based on an initial cells’ capacity dispersion of +/− 10%. Finally, the Section 5 concludes on the performances demonstrated by the results obtained and develops the perspectives that follow.
2. HF SRB Operating Principle
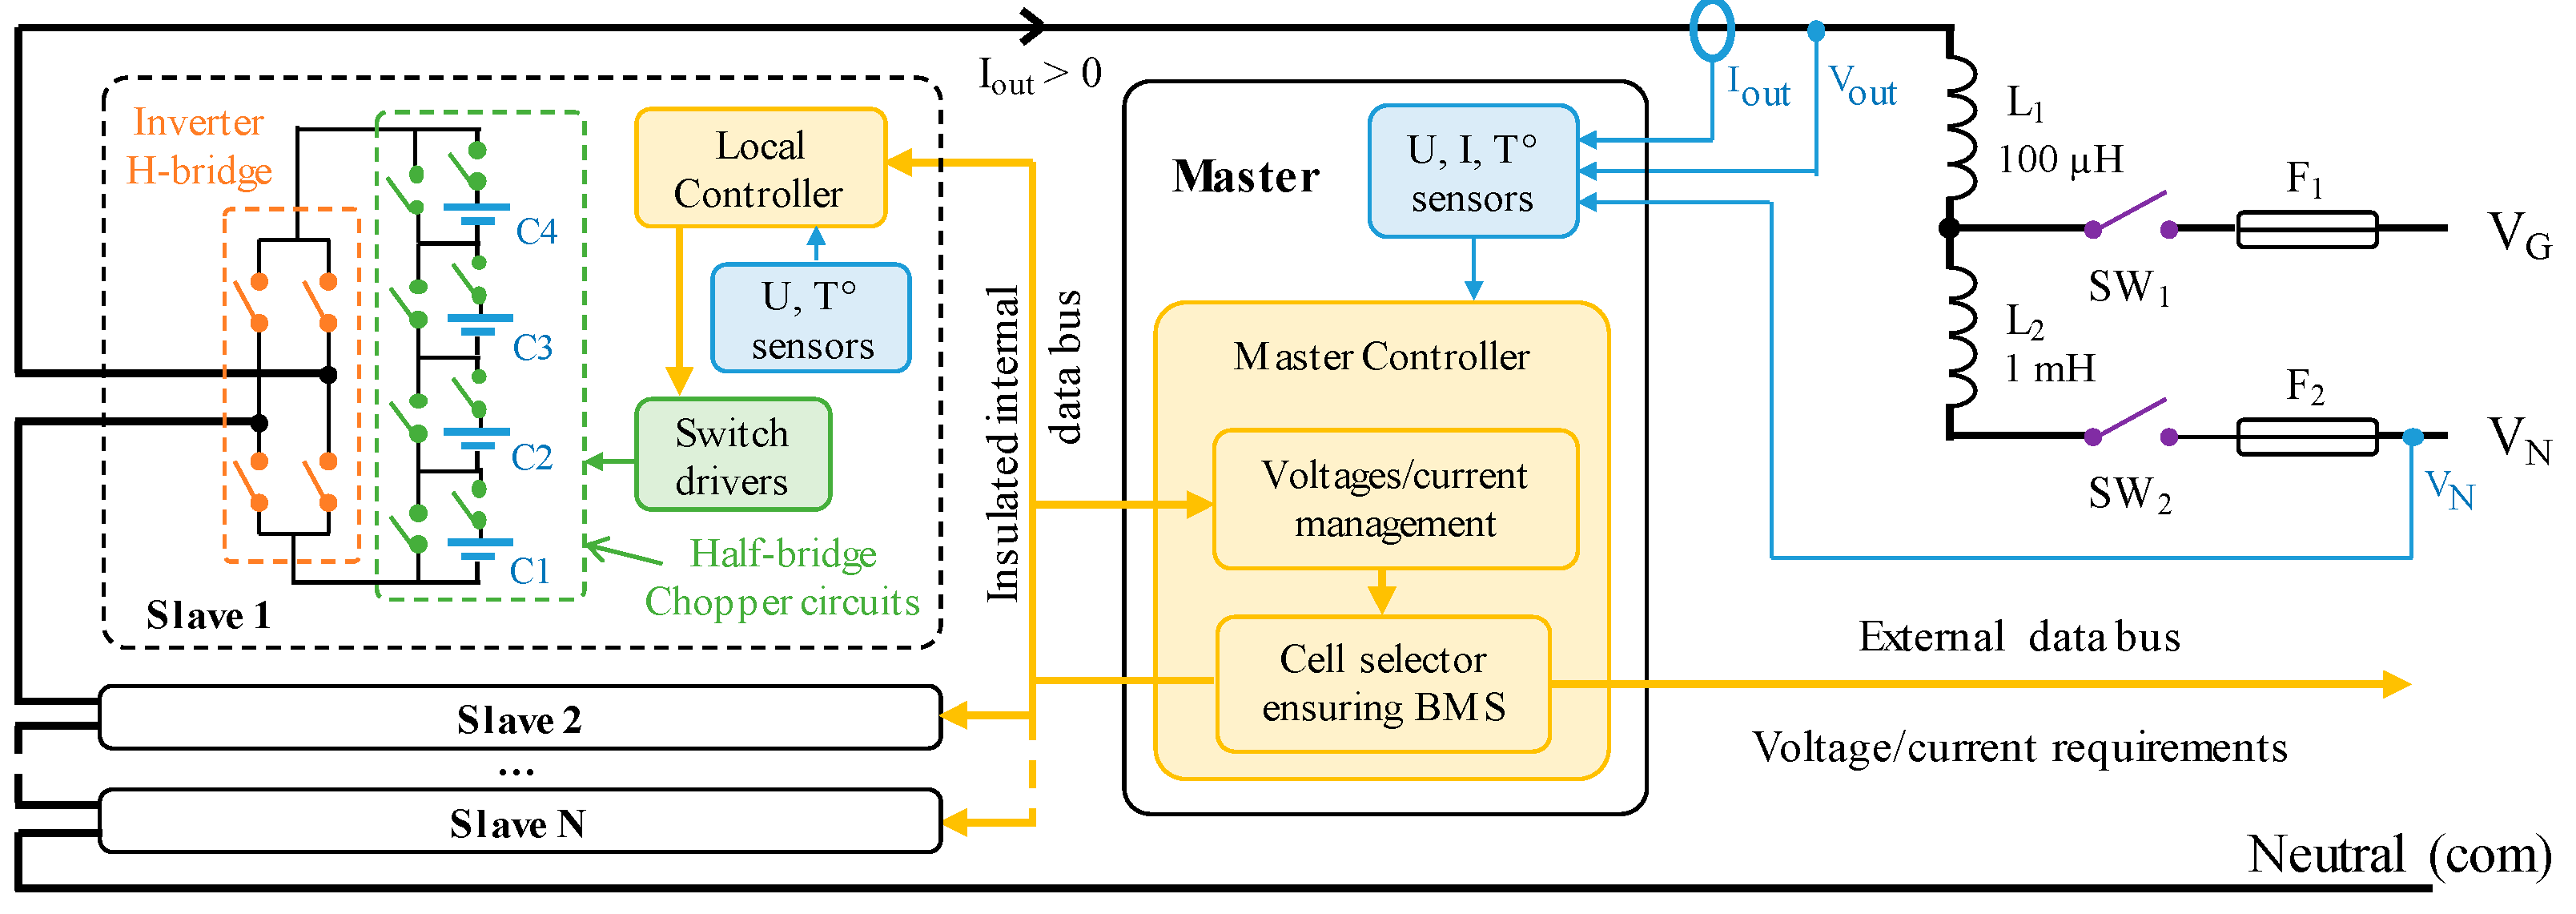
The HF SRB consists of a distributed system divided into remote modules named “Slave” and a central module named “Master”. An overview of the overall hardware architecture is given in Figure 2.
Each Slave is composed of four serial cells connected through half-bridge chopper circuits, an H-Bridge to invert the module polarity, and a local controller. The number of serial stages associated to each local controller is limited to reduce the electrical constraints of the implemented switches (low voltage MOSFET) as well as the complexity of the number of switches and cells to manage (low cost CPU). Then Slaves are chained to reach the required output voltage.
The Master module is in charge of managing all slave modules thanks to a master controller. It estimates the state of each cell and manages the safety according to data collected through the remote modules (mainly voltage and temperature of the cells). Then, it performs a centralized calculation to define which cell need to be activated/deactivated and send orders to the slaves to apply the new states. The change of a serial level state is then translated at the slave node level by the driving of the related local switches as well as its inverting H-bridge if necessary. The slave controller is supplied by the local cells sharing a same local ground potential reference, simplifying the transistors driving and voltages measurements. Indeed, the latter have to withstand a common-mode voltage limited to only four levels of cell voltages, which let using classical methods of differential measurement. Concerning the Mosfet driving, we use the principle described in [10], which operates properly up to 4 cells in series without need of galvanic insulation.
Cells balancing is achieved by activating the cells according to an order of priority based on their state. A first part of those state parameters is directly measured and transmitted by the local controllers, such as voltages and temperatures. The rest of the cells state indicators, such as SoC, SoH, or SoE, are estimated at master controller level.
The AC waveform generated by the HF SRB is obtained by a Near Level Control (NLC) method. The number of serial levels to activate at each time instant is determined in real-time by rounding up to the nearest integer the real value given by a closed-loop control. The voltage waveforms generated with this system are similar to those from carrier-cascaded PWM. The control loop updates a reference voltage in real time, which allows a forthwith management of the electrical network voltage perturbations while regulating the exchanged current at a set value [9].
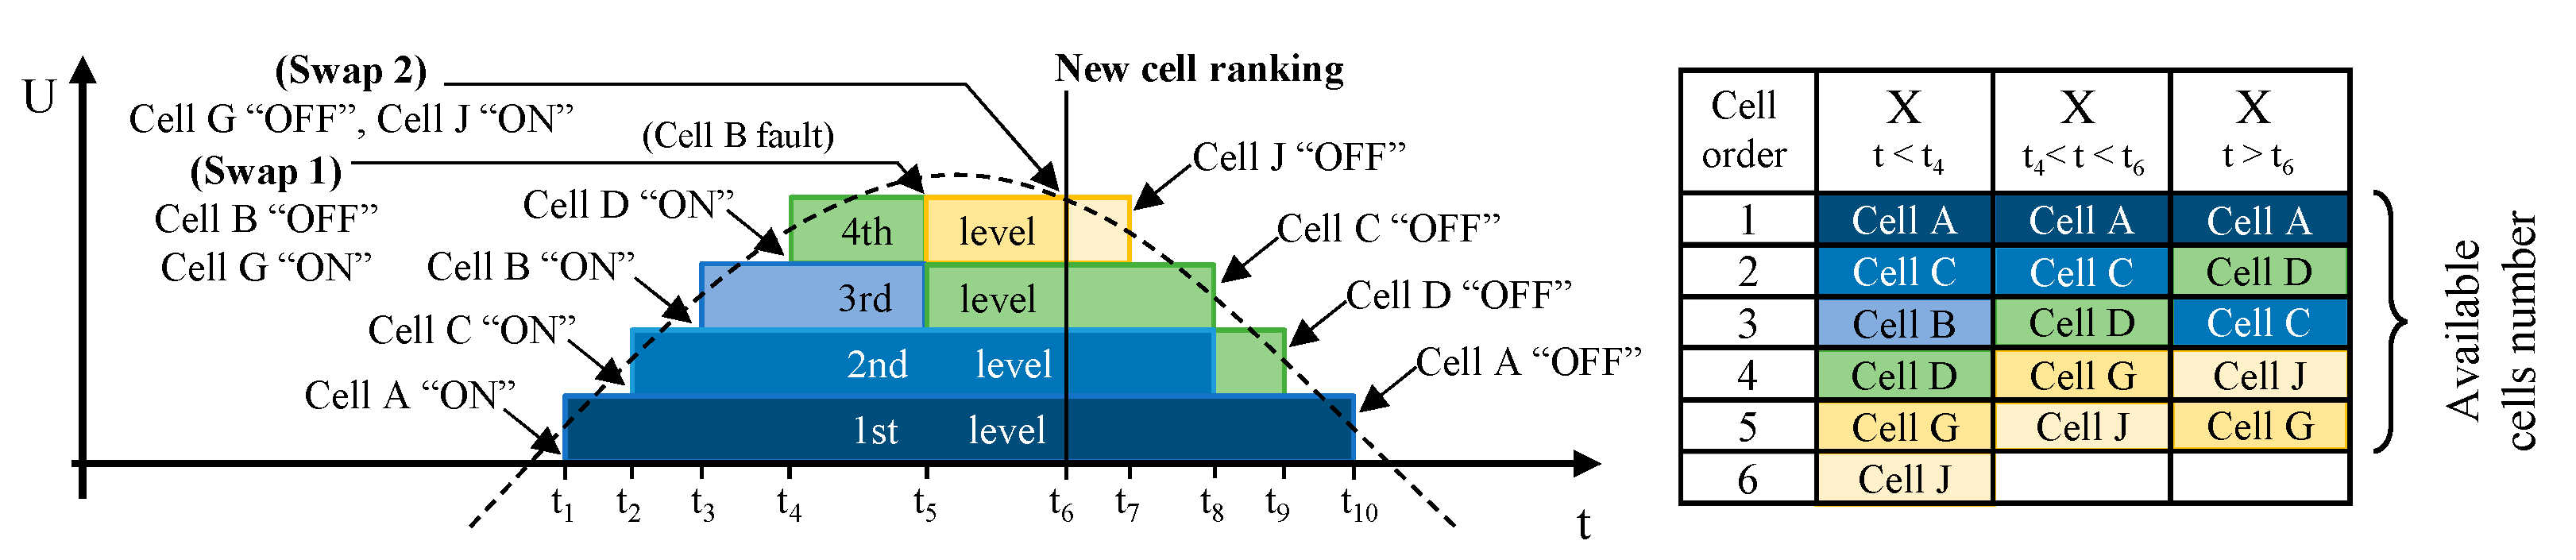
As shown on Figure 3, the First In First Out (FIFO) principle is applied to connect and disconnect the cells. The selection of the cell to be connected or disconnected is performed on the fly in a priority order X(t) provided by a balancing algorithm. The failing cells are handled forthwith without disturbing the generated waveform thanks to a cell swap operation. A larger number of cells than those required to provide the AC waveform can be integrated in order to maintain the continuity of service capabilities offered by the bypass circuits as operated in DC SRBs. The additional cells are then used as hot redundancy so that their capacity contributes to the total capacity of the HF SRB [11].
3. HF SRB Simulator
This section focuses on the simulator of the HF SRB developed in order to study thoroughly its various performance, and particularly its capability in terms of voltage, temperature, SoC, or remaining capacity balancing. These balancing capabilities are measurable over operating periods that can be limited to a few complete battery cycles.
The study of HF SRB capability in terms of SoH estimation improvement and SoH cells balancing is beyond the scope of this paper. It would require the simulation of a very large number of cycles, which would imply the use of another version of this simulator with a very simplified operation. Moreover, this simulator would have to integrate generalizations on the balancing capability over operating periods of a few cycles such as those obtained in this study.
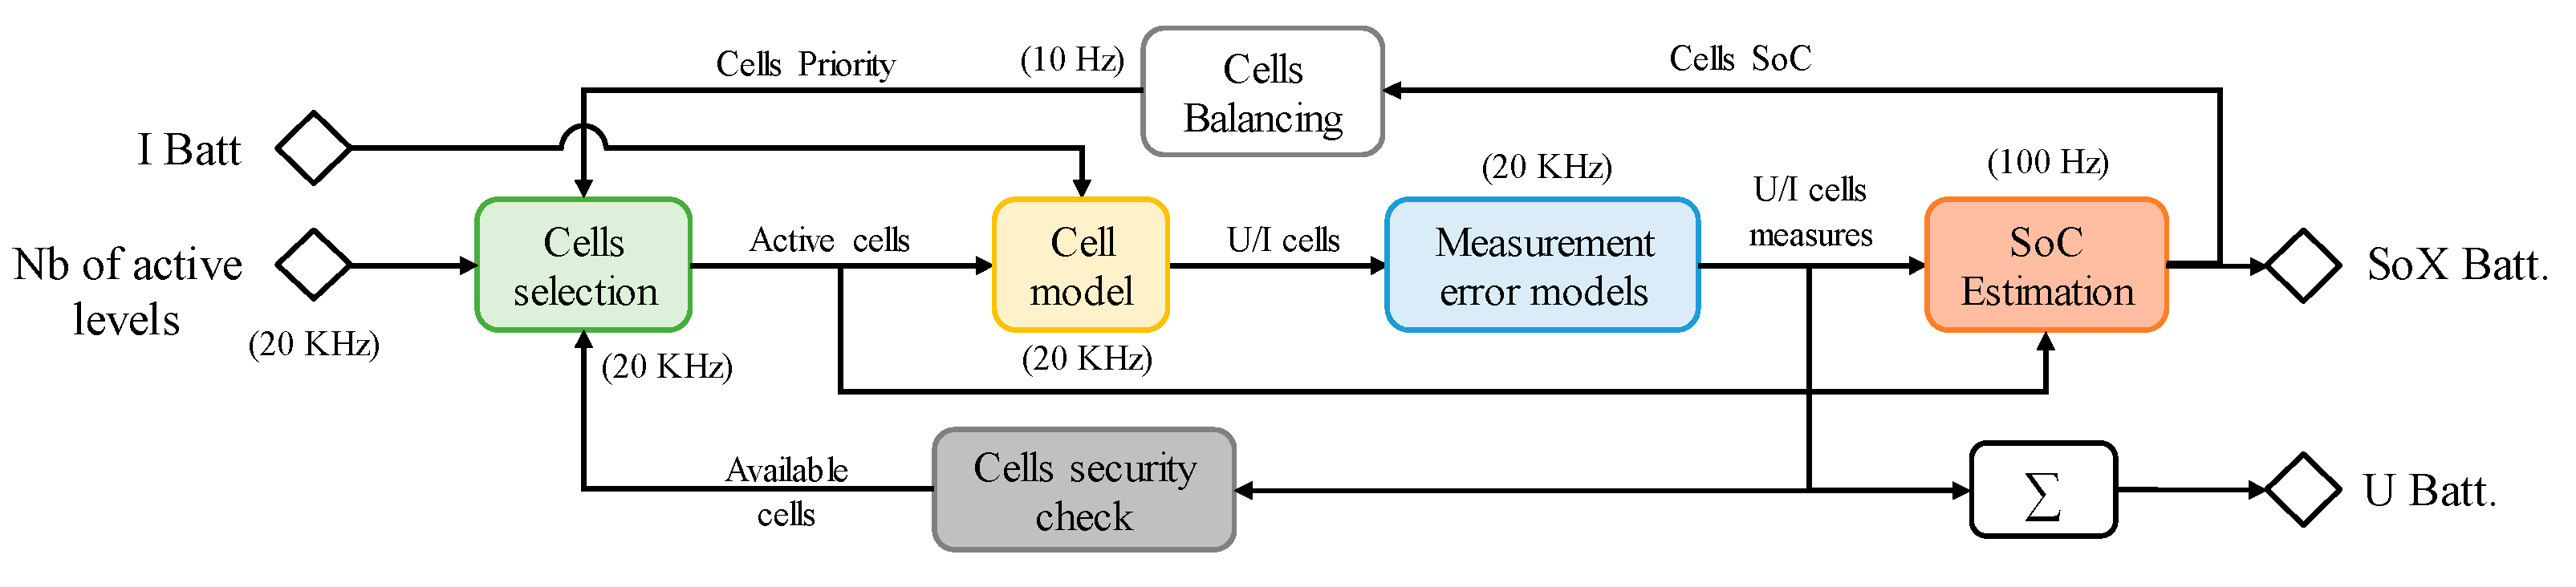
The HF SRB simulator was developed in MATLAB. Its structure is illustrated in Figure 4. The lowest simulation time step is based on the control time step of the serial levels used in the real system (50 µs) in order to be able to compare the results obtained with the latter. The equivalent frequency of execution for each block of the simulator are reported in Figure 4. The simulator is detailed hereafter through the description of its building blocks.
3.1. Cell Selection
The role of this block is to simulate the cell selection from the set point of the number of active serial levels required and the cell usage order of priority. Then, the activation state of the cells is directly updated according to this selection. The order in which the cells are used is generated by the balancing function. For example, when discharging, the balancing function sorts the cells according to their SoC so that the most charged cells are discharged first. In this study, the balancing criteria are limited to either the cell voltage, the SoC, or the remaining capacity.
The selection function also needs to take care about unavailable cells. Those cells are the ones exhibiting a temperature or a voltage exceeding the security thresholds. Thus, knowing the required number of active serial levels determined by the regulation function, the selection function connects the cells satisfying the availability and priority criteria. If there are not enough cells to meet the demand, all cells are disconnected and the system stops working. In real use case, a monitoring of the total number of cells available could be sufficient to anticipate this situation in order to warn the driver that the remaining energy is limited. As a matter of principle, all cells must reach their end of discharge/operability at the same time thanks to the fine management of cells during the operation, and finally the battery pack is not any more stopped by the poorest cell (by the first fully discharged/unavailable cell). The selection function is used at the operation frequency, which can be up to 20 kHz in the case of a 50 Hz 230 VRMS sinusoidal waveform from a HF SRB of 128 serial levels as shown in [9].
Two other functions need to be executed at this high frequency as they are closely linked to the selection function: the “cell model” function that simulates the cells evolution and the “control loop” function, non-represented on Figure 4, adjusting the number of cells to connect.
3.2. Cell Model
A cell model reproduces the behavior of the cells (voltage, temperature, instantaneous capacity, total capacity, internal impedance) with respect to external solicitations such as exchanged currents, and external temperatures. As usually done to limit the computational cost, each cell of the battery is modelled by an equivalent-circuit model [12]. Depending on the complexity we are looking for, the cell electrical equivalent circuit used can be parameterized in the simulator. This cell model goes from the simplest model of a voltage source and an internal resistance to more complex models including four series-connected resistor-capacitor parallel circuits. For example, in the case of using the internal resistance R0 and a single resistor-capacitor pair R1C1, the evolution equations are:
where z denotes the SoC, i the current in the cell, η the coulombic efficiency, Q the cell nominal capacity, v the cell voltage, OCV the Open Circuit Voltage, R0 the cell internal resistance, R1 and C1 the resistor and capacitor values of the parallel circuit, iR1 the current through the resistor R1. Cell parameters are identified on an Arbin test bench at some discrete breakpoints. Then it is necessary to interpolate each parameter at the SoC points of interest. To avoid interpolation computations at each time step, interpolated parameters are stored along a discretized SoC grid. The validity of this approach is confirmed in Section 4.1.
3.3. Control Loop Function
A control loop function is used to determine the instantaneous number of required active serial levels from a Root Mean Square (RMS) set point of a sinusoidal voltage, current, or output power (see Section 3.7). First, a temporal reference signal of the set value is generated from its RMS set point. Then, a control loop compares the actual output value with the required one and deduces the number of cells to be connected.
3.4. Measurement Error Models
The value of each parameter is perfectly known in a battery simulator. This block is used to reproduce the biases from the real measuring circuits used to observe parameters such as voltage, current, and temperature.
3.5. SoC Estimator
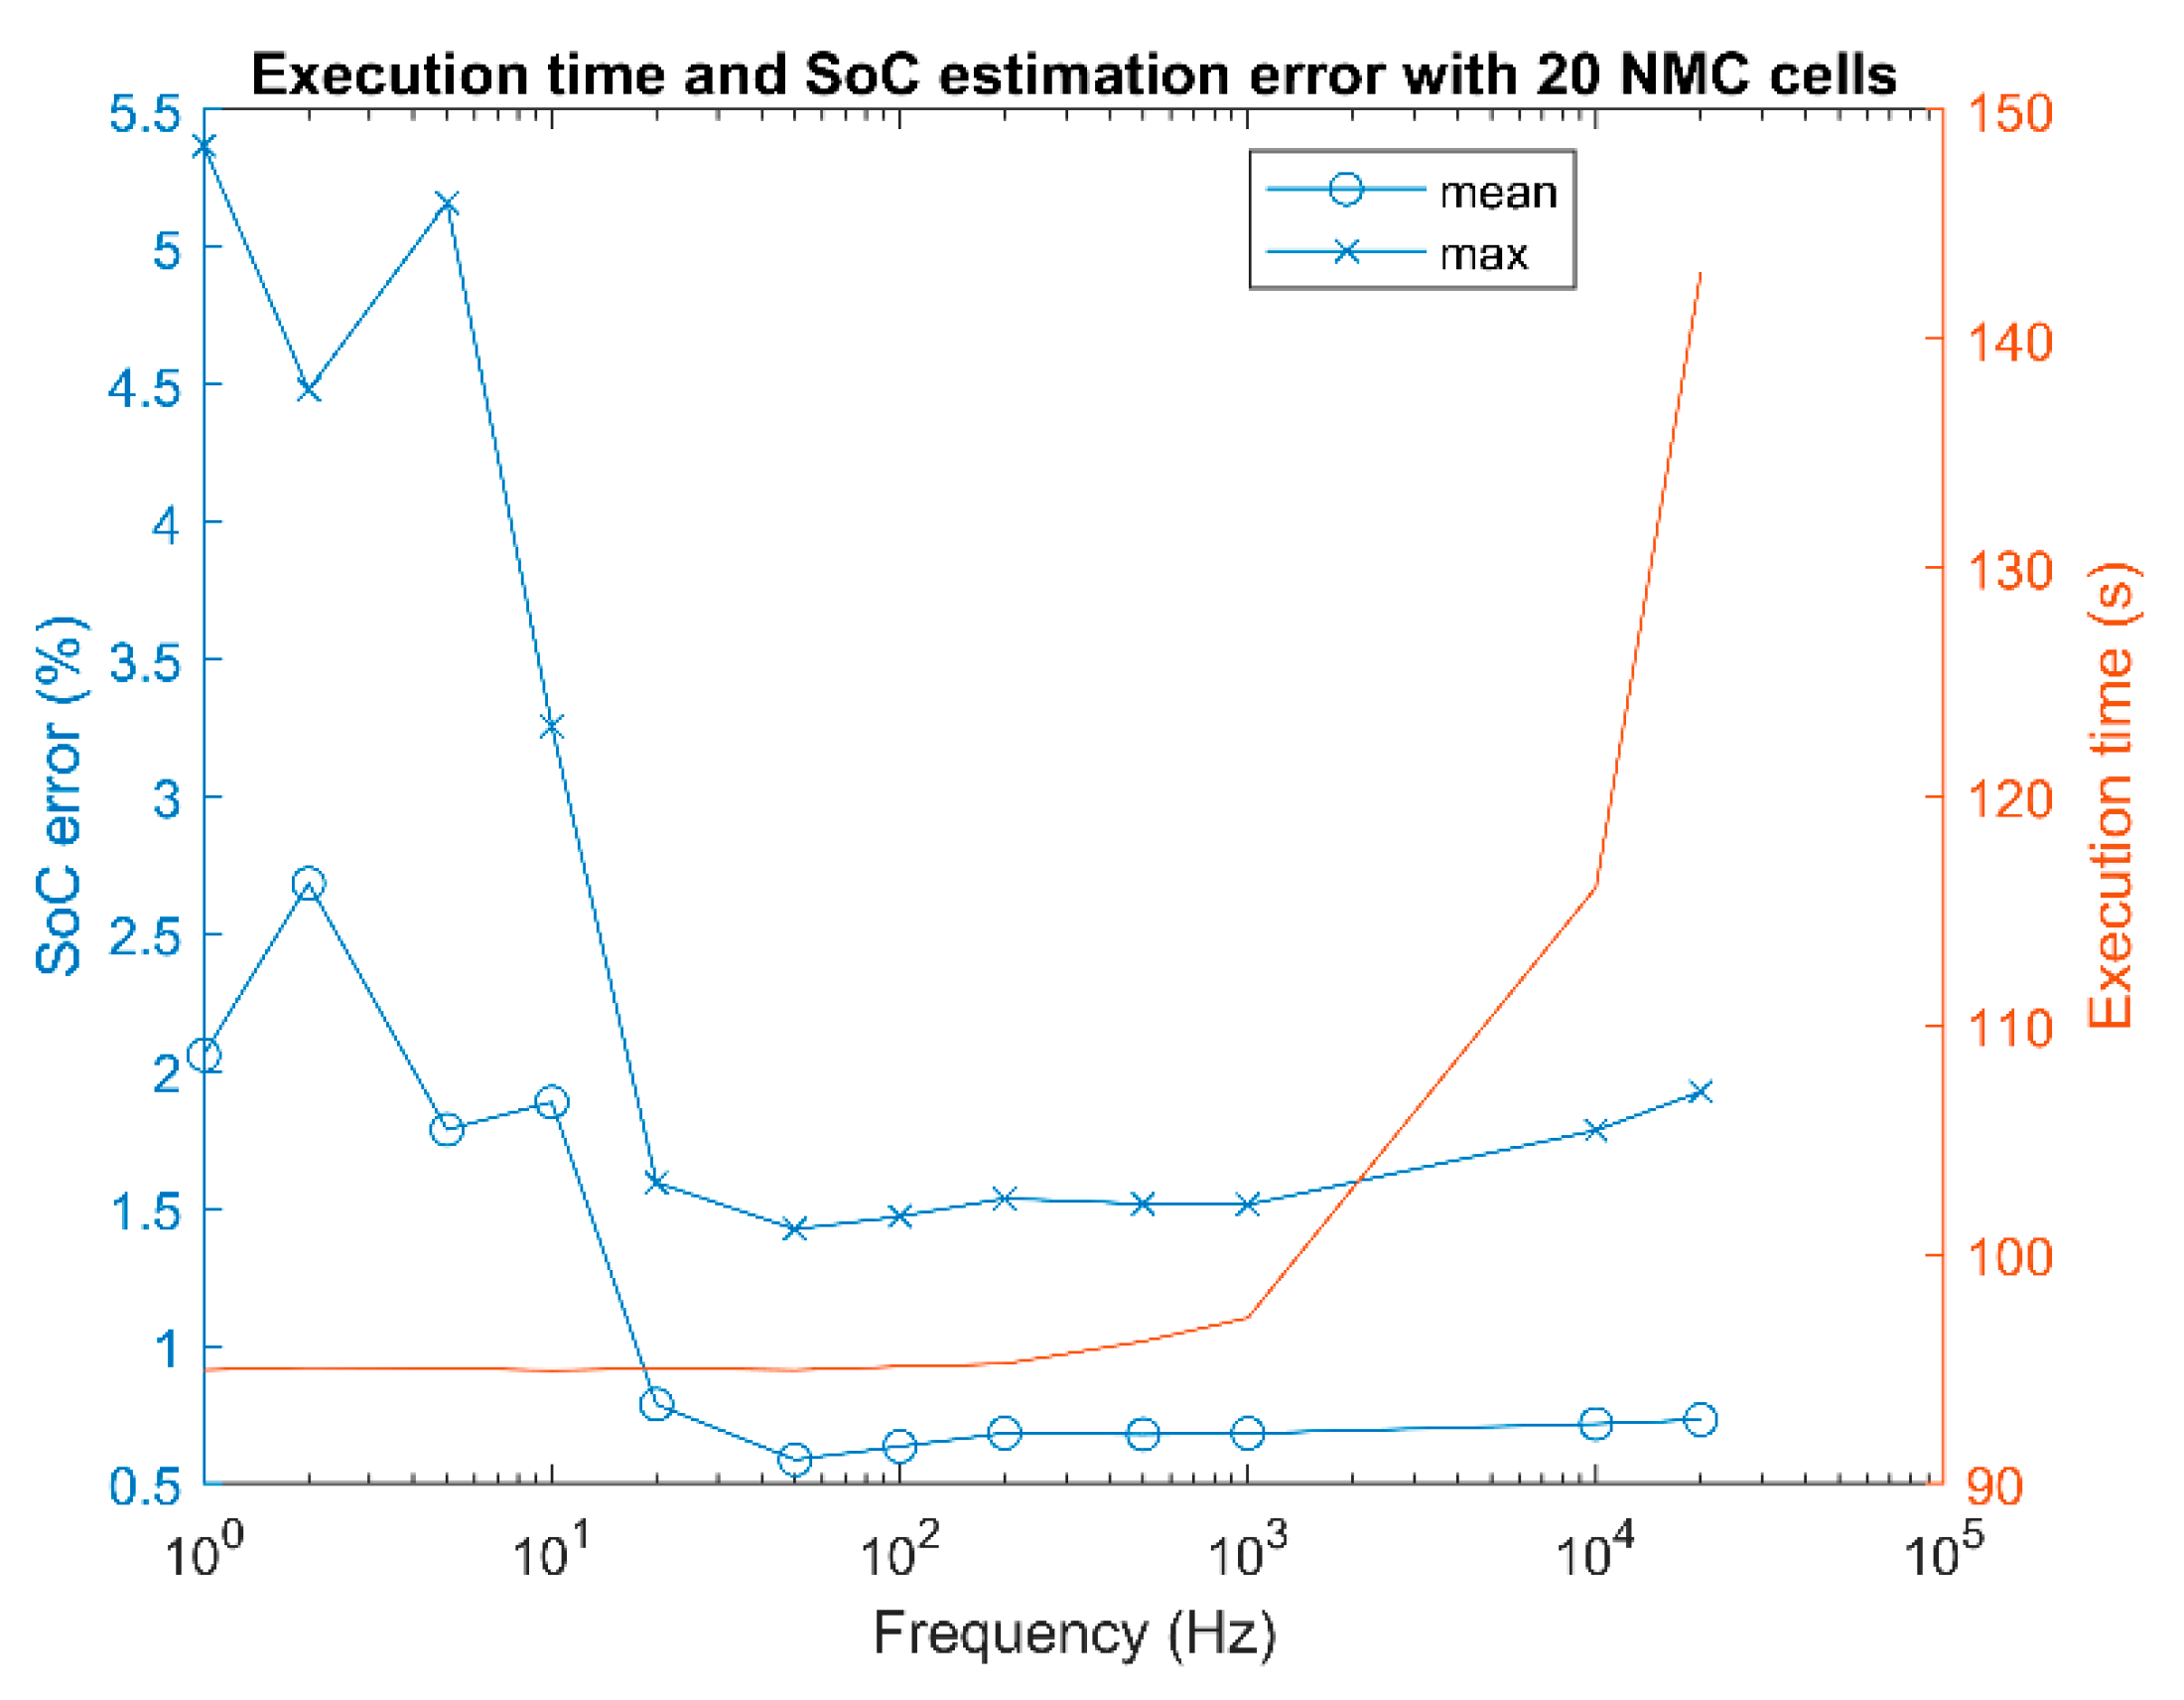
As the simulator is designed to faithfully reproduce the behavior of a real battery, the SoC has to be estimated from the electrical data measured on the battery, as it would be done on a real system. The SoC is one of the state indicators commonly monitored by a BMS, leading us to implement a well-documented Extended Kalman Filter to this purpose. Indeed, Kalman Filters are widely used for SoC estimation [13] due to an efficient compromise between model complexity and accuracy. The SoC error has been assessed by comparing the estimated SoC value with the real SoC used in the cell model for different estimator frequency during a discharge under 100 s of a normalized NEDC profile (Figure 5). In our situation, a frequency comprised between 20 Hz and 200 Hz allows reducing the calculation time while providing a very reasonable SoC error lower than 1.6% for the worst case. The frequency used to perform the SoC estimator is then fixed to 100 Hz.
3.6. Cell Balancing
The cell balancing function is in charge of providing the cells usage order from a parameter to balance. This order has to be refreshed with a time dynamic correlated to the parameter evolution. A 10-Hz frequency is used for the cells’ voltage balancing as well as for their SoC balancing.
3.7. Implementation
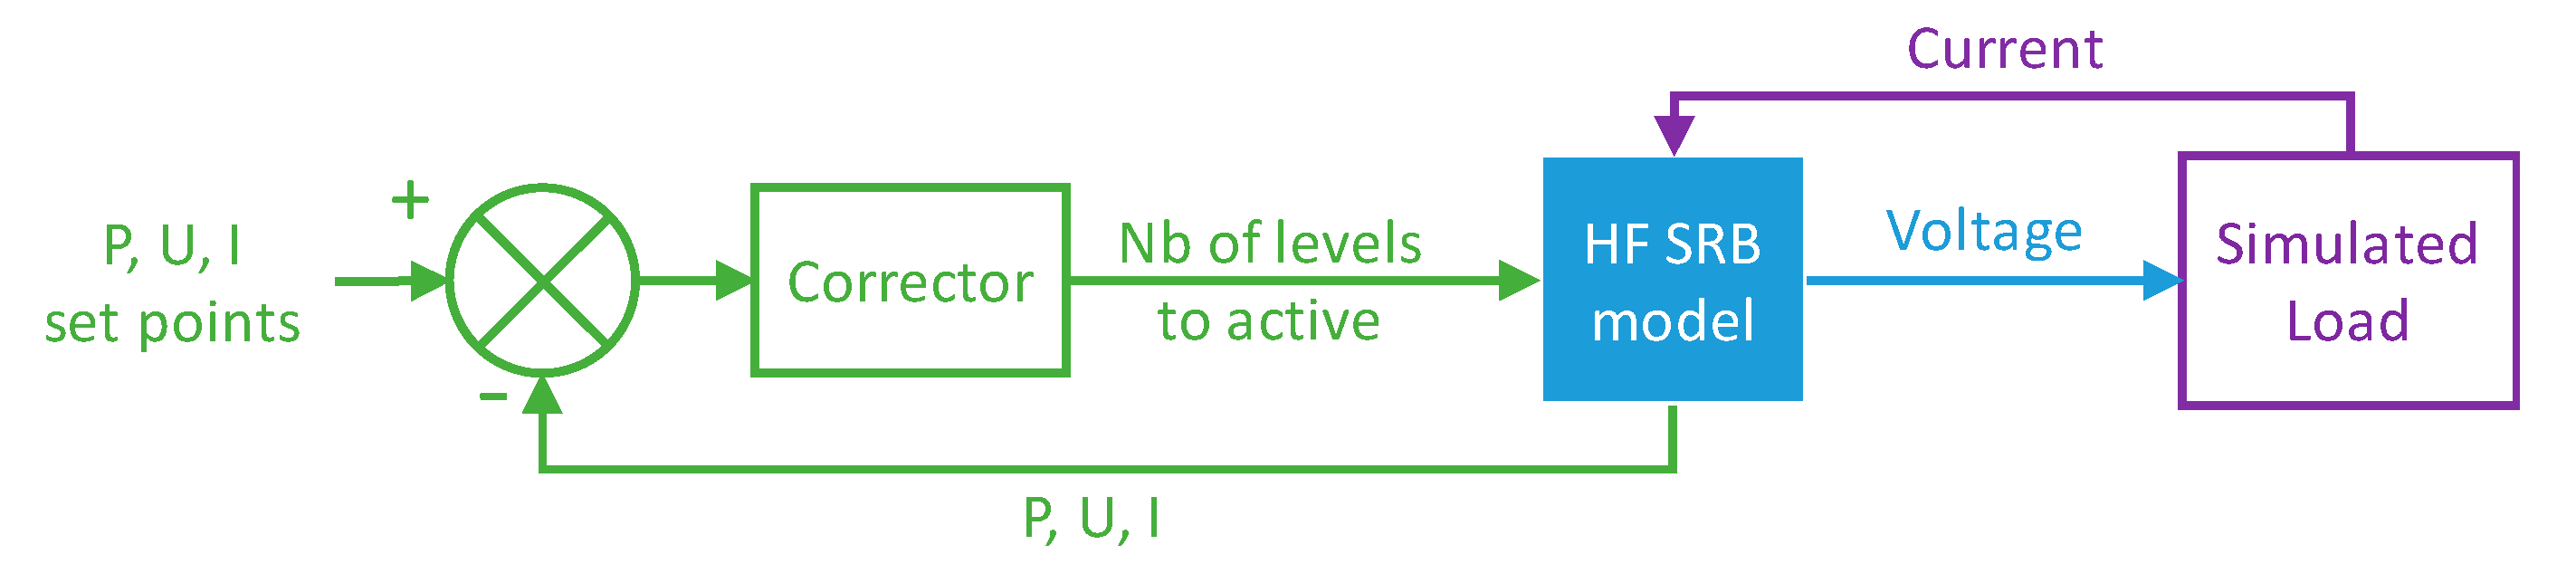
The simulator implements the model of SRB described previously with either a model of load or a load profile such as vehicle test profiles. The model of HF SRB computes its overall voltage from incoming current and the number of activated levels. In turn, the simulator computes the next number of levels to activate as well as the coming current in the HF SRB from the voltage applied on the load or ordered by a temporal current/voltage load profile like the normalized vehicle test profile, as illustrated in Figure 6.
For a vehicle test profile as the Worldwide harmonized Light vehicles Test Cycle (WLTC), the vehicle speed is translated into power consumption according to the relations (4) and (5) and using the dataset shown in Table 1 [12]. Then the instant power is used to determine the corresponding current consumption according to the battery output voltage.
4. Simulator Validation
4.1. Arbitrary Waveform Generation Validation
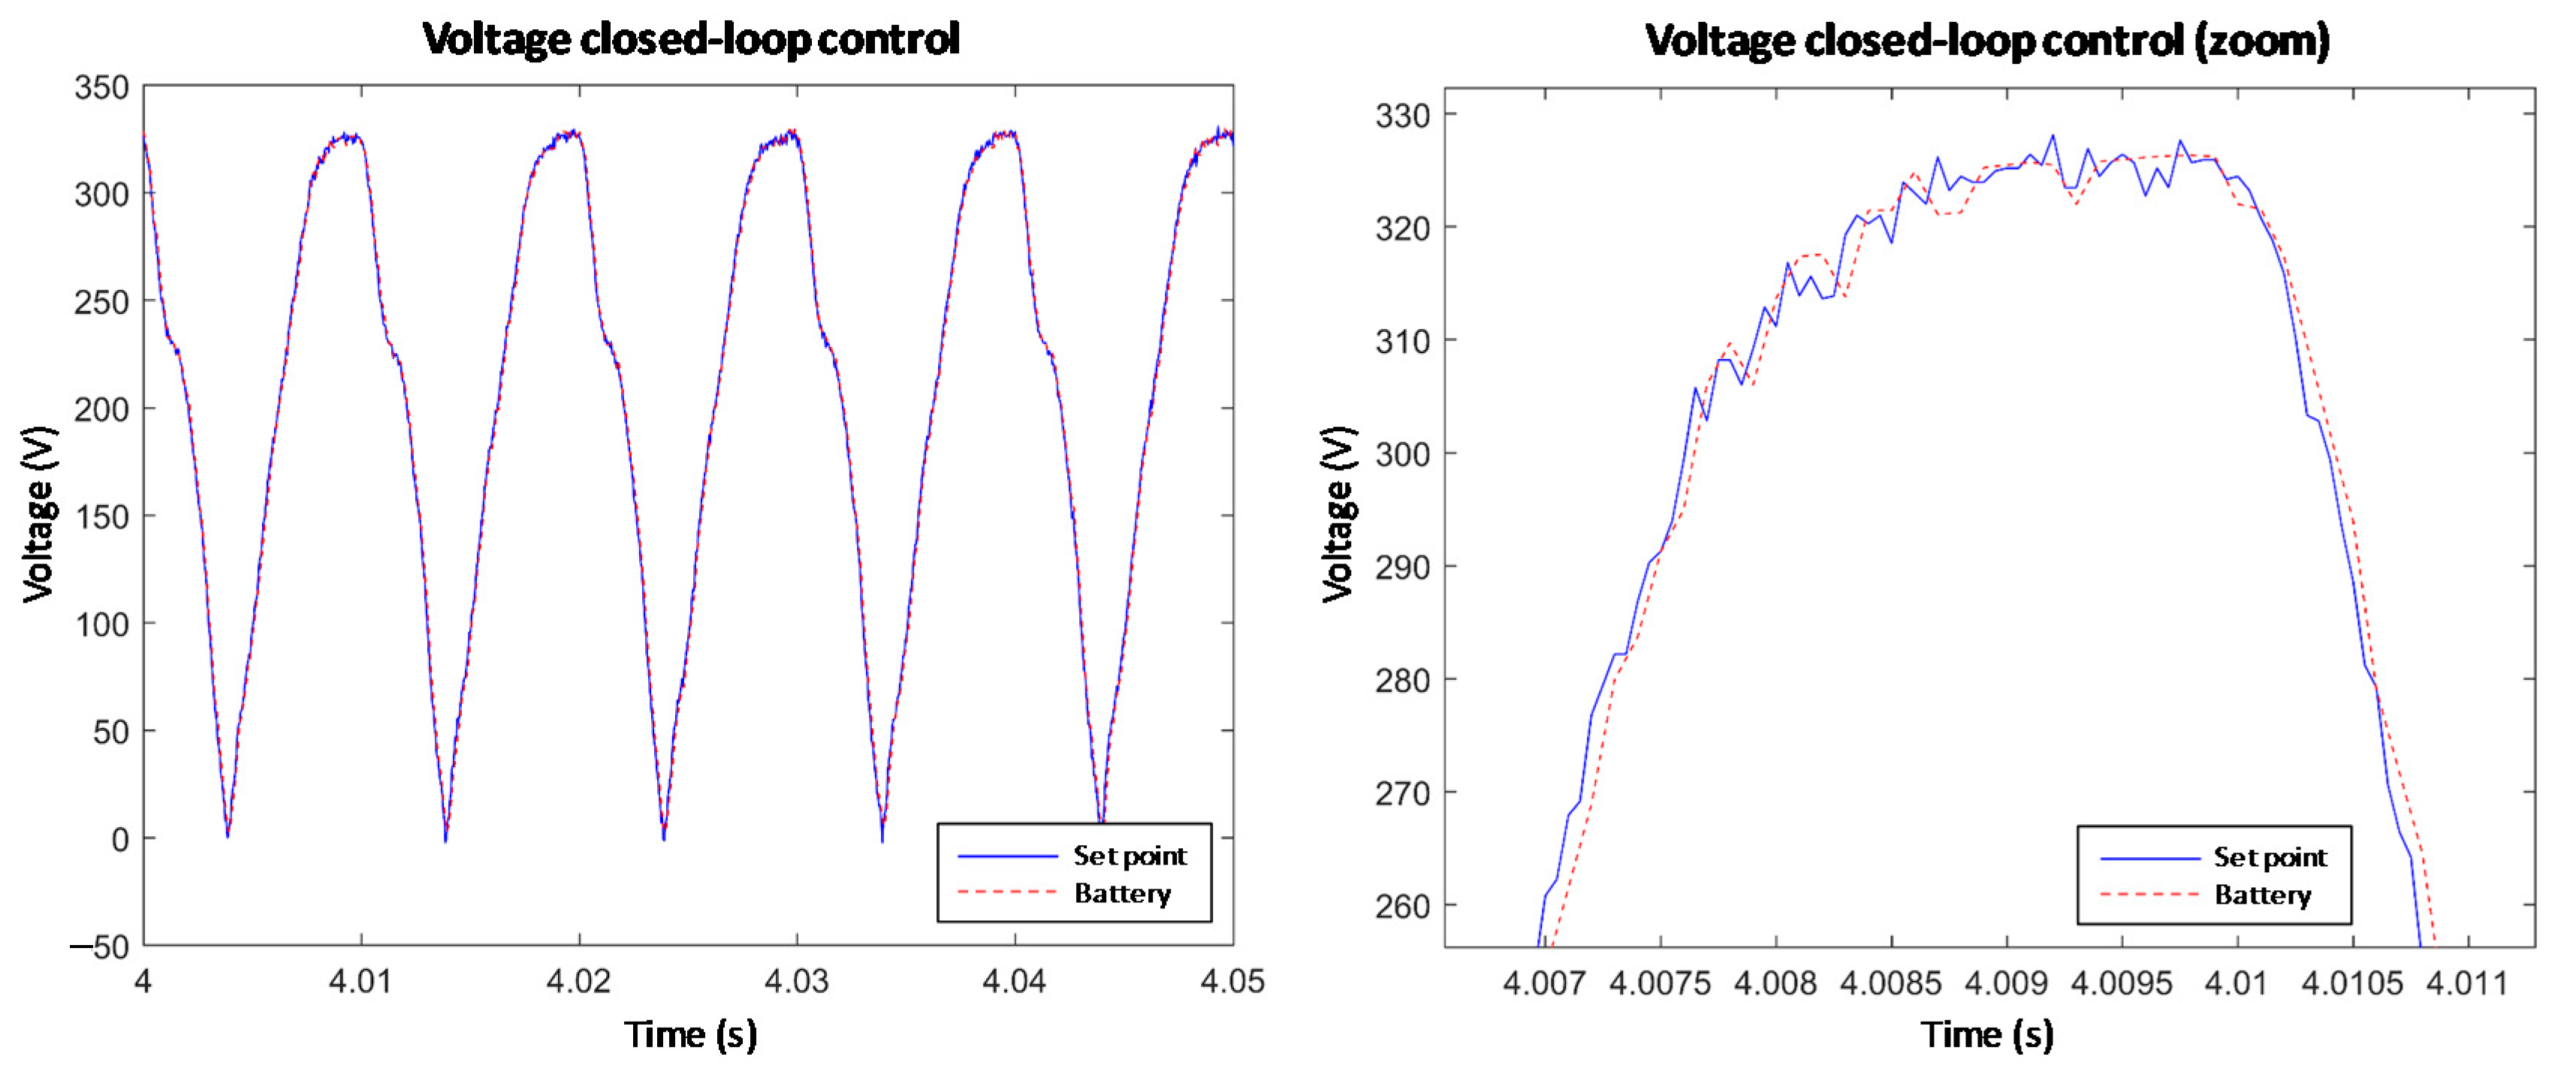
First, the ability of the HF SRB model to follow an arbitrary waveform signal is assessed. To do so, a recorded signal of a real electrical grid voltage is directly injected as a set voltage in the control loop performed at 20 kHz with no output current. This signal is rectified to match the real prototype behavior. Indeed, this prototype integrates a rectifier diode stage at its charging input to prevent outputting current on its connector.
The results are shown on Figure 7. The small differences between the battery voltage and the electrical grid voltage show the proper operation of the closed-loop control. One can also see that the 20-kHz control frequency is well adapted to follow the electrical network voltage.
In order to pursue the simulator validation, it is now necessary to check the fidelity of the model with respect to the behavior of the cells it simulates.
4.2. Comparison to a Real Battery
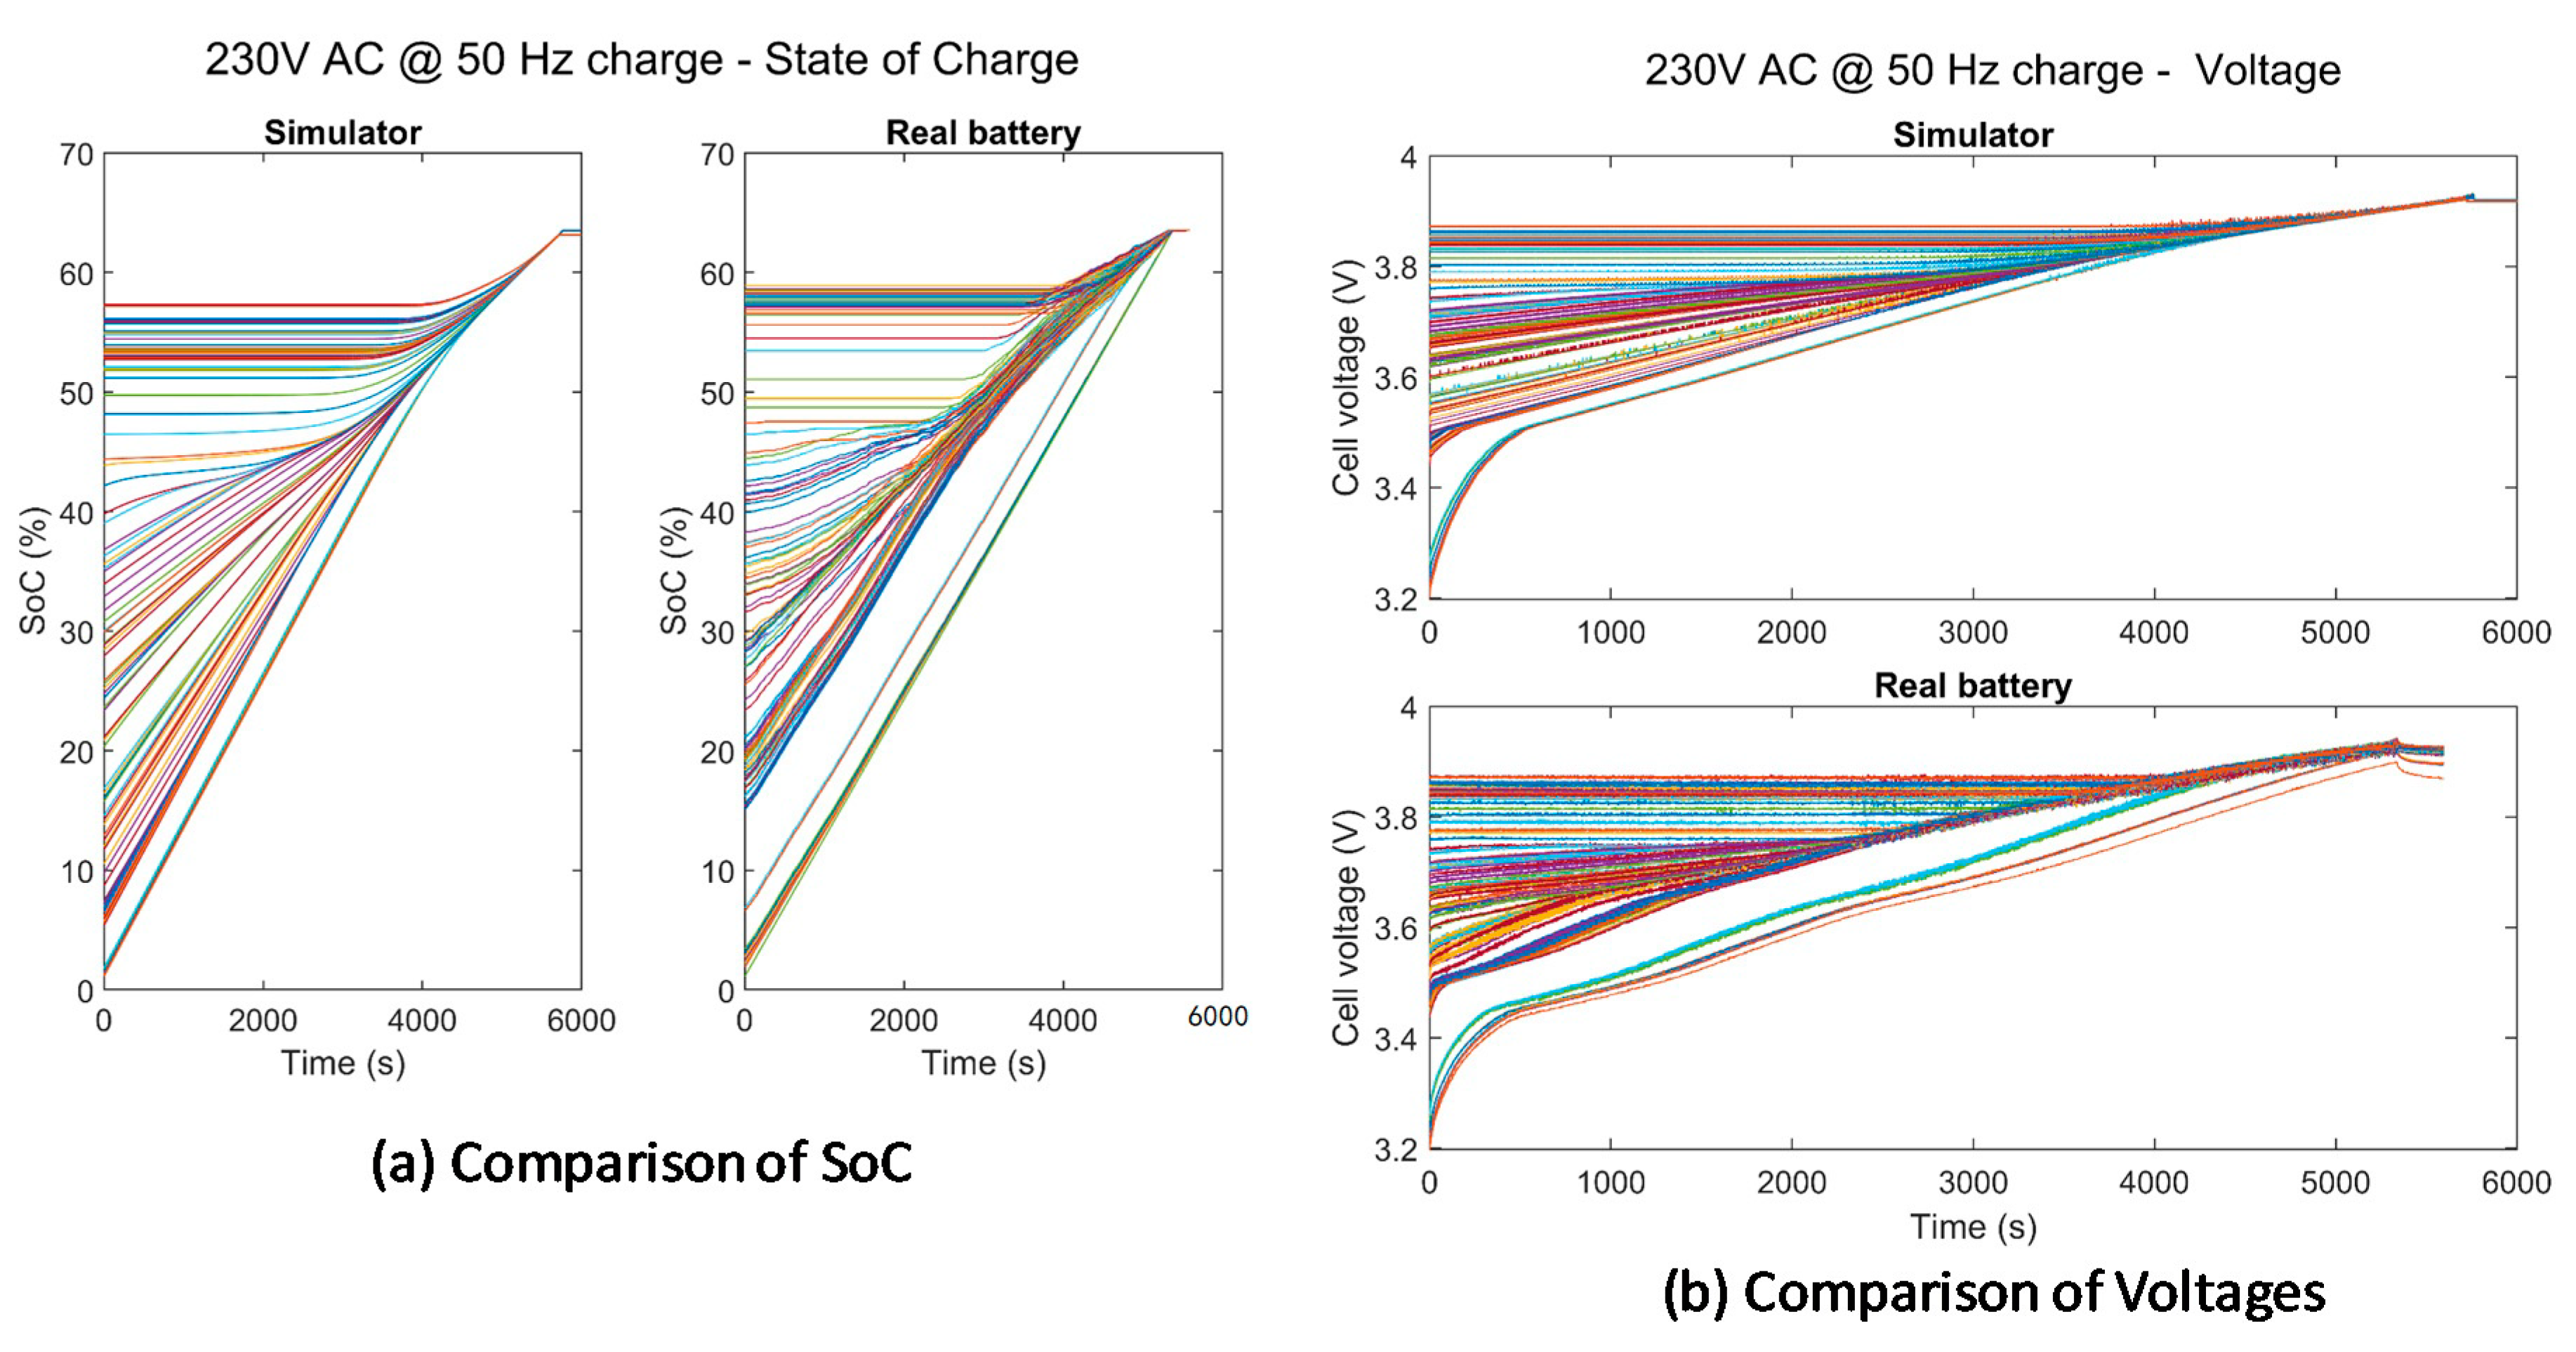
A comparison of the simulator output with a real prototype of the HF SRB is required to validate its proper operation. The real battery demonstrator we designed is made of 128 SONY VTC6 18,650 cells (Lithium-ion NMC cells, 3.6-V nominal voltage and 3-Ah capacity). As explained before, one of the aims of self-reconfigurable batteries is to balance cells’ State of Charge. To validate the ability of our system to perform an efficient balancing, cells have been heavily unbalanced prior to the recording. After a one-hour rest, we started to monitor the cells’ voltage while the battery is charging under a 230 VRMS 50 Hz voltage. The initial voltages were used as a good approximation of the Open Circuit Voltage to initialize the simulator. Then, the initial SoC are deduced from the relationship between OCV and SoC. This leads to a strong 56% discrepancy between the SoC of the cells, in both real and simulated battery. The theoretical end of charge voltage is 4.2 V but it has been reduced to 4 V for safety reasons.
It has to be noticed from Figure 8 that the real battery stopped charging after 1 h and 29 min, although the voltage is still below 4 V. This comes from the fact that the voltages represented are filtered over 20-ms periods to avoid seeing irrelevant voltage increases when a cell is connected (because of the resistive term R0 × I added to the OCV when a cell is connected). Thus, the unfiltered voltages reached 4 V, causing the BMS to stop charging the battery.
To be as realistic as possible, each modelled cell is parameterized with slightly different capacity and impedance parameters. According to [14], the disparity among the capacities of cells coming from a same manufacturer is usually around 2.5%. As the exact capacities of the cells used in the real battery are unknown, simulated cells have their capacities distributed according to a normal distribution with a 0.025C variance (with C denoting the nominal capacity). Moreover, the work of [15] states that a 20% mismatch in internal impedance is a reasonable maximum for cells from the same batch, and leads us to add a normal random variable of variance 0.1 × Zi to each impedance value Zi (where Zi is the mean of the impedance Zi over the SoC grid). As a compromise between model accuracy and computation time, a R − 2RC model is chosen for each cell, leading to five Zi parameters: R0, R1, C1, R2, C2. This cell description allows us to compare the balancing dynamics of the simulated battery and the real one.
As there exists no exact model of the cell, we cannot expect the simulator to reproduce the exact behavior of the battery. Keeping this consideration in mind explains why it is acceptable that the simulated battery works 8% longer than the real one. The main result to observe in Figure 8 is that the simulator behaves in the same way as the real battery with similar tendencies. Both systems present a 56% SoC mismatch at the beginning of the charging process and become completely balanced at the end of charge. For the sake of simplicity, a voltage balancing is performed in both cases and produces a perfect balancing in less than 1 h and 40 min for an average charging current of C/2.
5. Simulations Results
Now we have validated the simulator, and assessed its fidelity to the real system, we can use it to simulate some use cases.
5.1. Application to the New European Driving Cycle (NEDC)
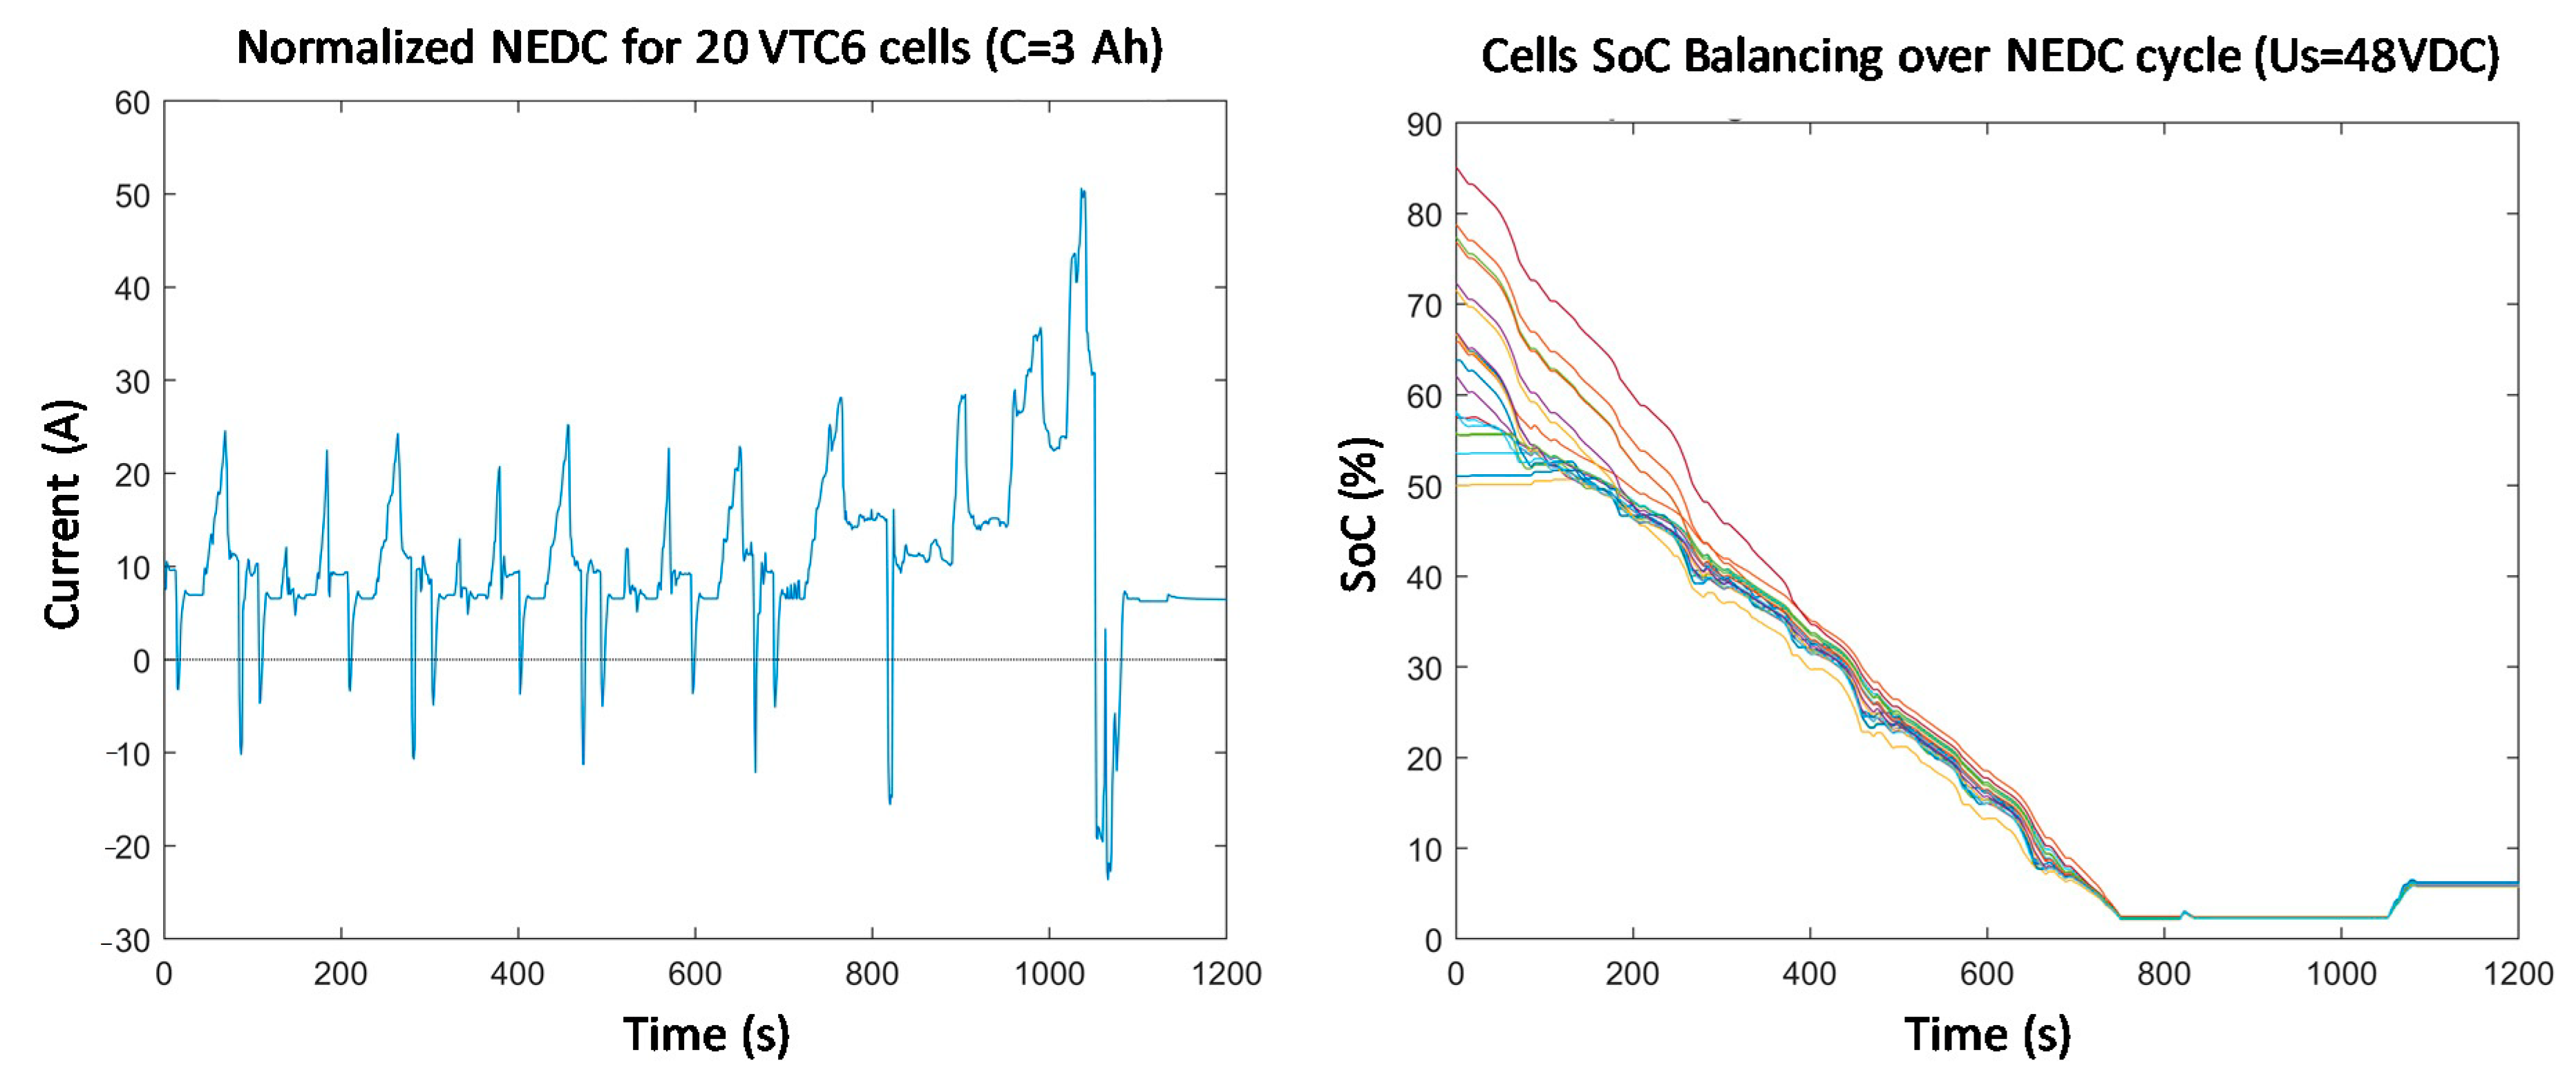
To begin with, the New European Driving Cycle (NEDC) was used as a reference current and voltage signal to assess the balancing capability over a vehicle test cycle. To do this, the same cells SoC imbalance of 56% from Section 4.2 is used as initial SoC distribution. The simulator is set to use 20 NMC cells of 3 Ah in series in order to provide a rated voltage of 48 V. The current provided by the NEDC is then normalized to take this into account. The vehicle driving cycle is used until a first cell reaches the end of discharge. A SoC balancing is performed during all the operation.
Figure 9 shows at left the normalized NEDC cycle used by the simulator and at right the SoC of each cell during a discharge following the NEDC cycle. The figure shows that the complete energy contained in the cells can be exploited in spite of an initial SoC imbalance of 56%.
5.2. Effect of the Balancing Criterion
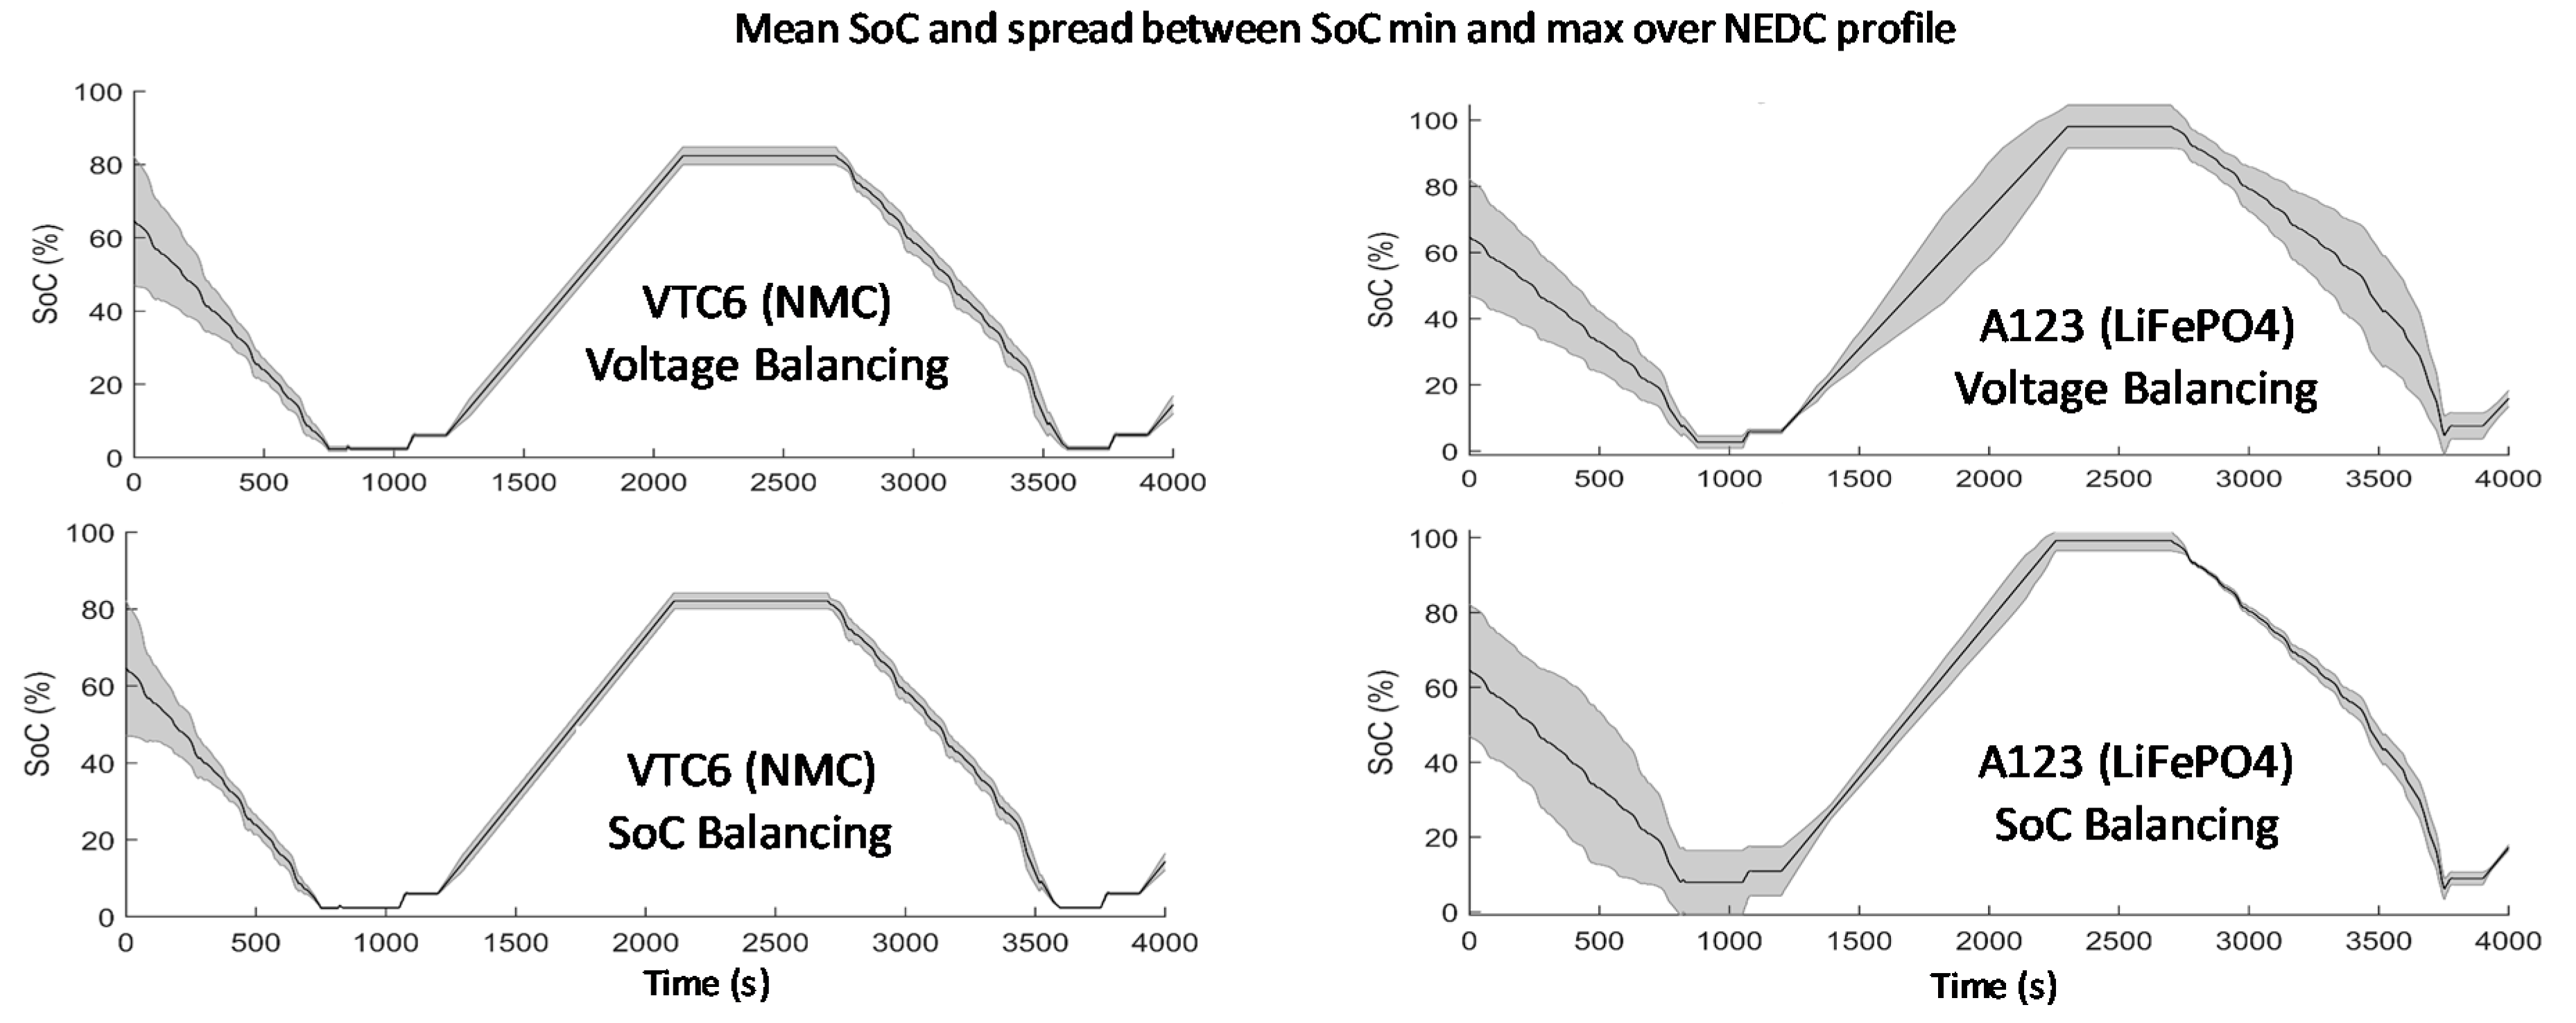
The impact of the balancing criterion was assessed through the comparison between the use of cell voltage and the use of its estimated SoC during several alternances of driving NEDC cycles and charging periods. The effect of the chemistry of the cell was also assessed by comparing the behavior of NMC cells and LiFePO4 cells. The mean SoC and spread between the minimal SoC and the maximum SoC is shown for each case in Figure 10.
It appears that the balancing criterion have no effect on the battery autonomy for both chemistries. In other word, the cell voltage balancing is as efficient as the SoC balancing, even for LiFePO4 cells, which have a lower correlation between their output voltage and their state of charge. In fact, LiFePO4 cells shows a large SoC imbalance between 20% and 80% of their capacity in the case of voltage balancing. But the balancing capability is so high that, as soon as the cell voltage correlation becomes stronger outside of constant voltage window, the SoC imbalance was forthwith compensated.
5.3. Cells Capacity Dispersion and Battery Lifetime Improvement over WLTC
Since we know that the simulator efficiently reproduces the behavior of a real battery, the point of interest is now to use it to evaluate the performance of the self-reconfigurable battery compared to a classical static battery. To this purpose, the HF SRB and a classical static battery are compared using a WLTC driving cycle.
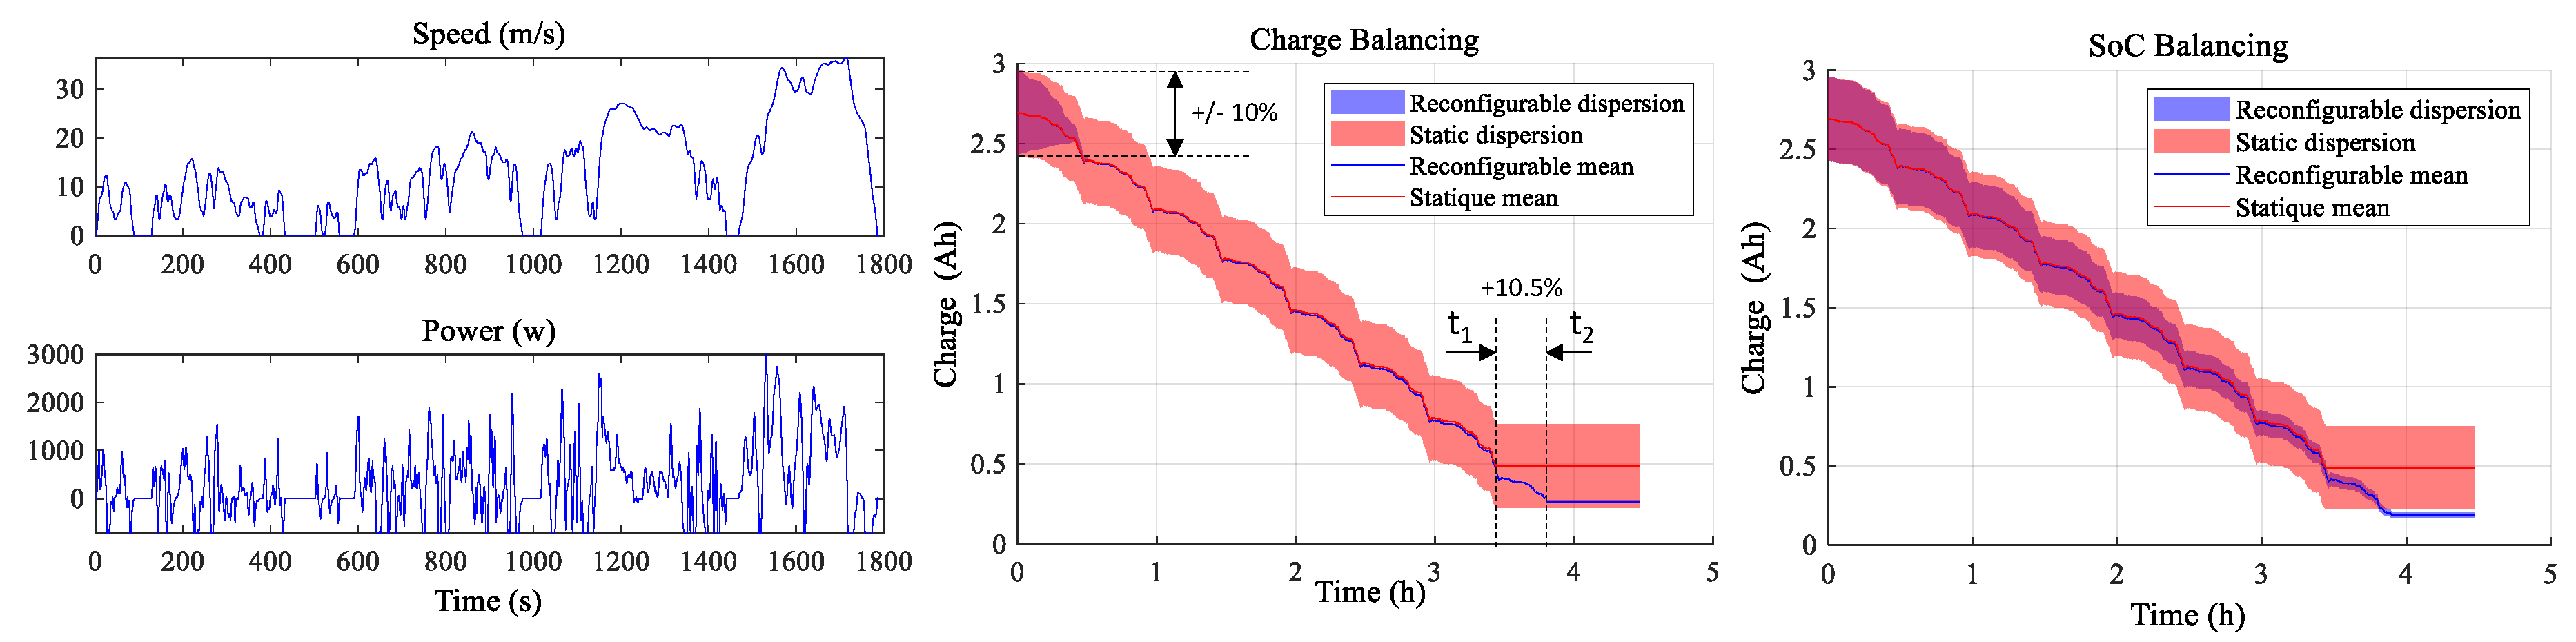
Both simulated batteries are parameterized to use 128 NMC cells of 3 Ah in series with a cell voltage end of discharge threshold of 2.9 V. The WLTC driving cycle is translated into a power profile normalized for a 360-V battery and applied to discharge both simulated batteries through a control-loop (see Section 3.7). A cell total capacity dispersion of +/− 10% around 2.696 Ah is created as initial cell conditions for both batteries while all are initialized to 100% of their SoC. Thus, each battery starts with an overall capacity of 345 Ah taking into account the applied dispersion. The simulation is performed with SoC balancing as well as remaining capacity balancing to compare their effect on the behavior of the HF SRB.
Before analyzing the results of the simulation shown on Figure 11, the energy delivered by each battery is compared to ensure a similar use. The difference between the cumulated energy of both batteries have to be compared when the first battery is fully discharged. For both balancing strategies, the static battery stops its discharge at time t1 where 2.208 Ah have been used when 2.22 Ah have been used for the HF SRB, which shows the similar use of both batteries with a difference of less than 0.5%.
Thus, 18.1% of the total capacity is unavailable in the static battery while the HF SRB stops its discharge at t2 with a total of 2.43 Ah provided with the charge balancing strategy and 2.505 Ah for the SoC balancing, which respectively represent 9.87 and 7.1% of unavailable capacity.
In terms of battery lifetime improvement from a WLTC profile, this leads to increase the running time by 10.5%, which is around half the capacity dispersion applied on the initial state of charge of the cells. This demonstrated the ability of the HF SRB to use the energy available in each cell through a standard driving cycle as the WLTC.
One can note that the strategy of balancing the remaining charge of the cells allows to converge much more quickly towards a homogeneous distribution of those charges. This shows that a much greater dispersion of cell capacity could be envisaged without impacting the power delivered, which paves the way to the use of second life cells or even of different chemistries mixes.
6. Conclusions
In this paper, we evaluated the HF SRB capability to maximize the use of all cells when cells are significantly dispersed in terms of state of charge (up to 56%). That was both validated by simulation and experimentally.
A comparison of cell balancing performance between SoC and cell voltage criteria were carried out on the basis of this dispersion. It was shown that it is possible to exploit the cell voltage to perform SoC balancing even for flat voltage profile chemistries such as LiFePO4. Indeed, the fast balancing speed offered by the SRB HF makes it possible to use cell voltage information as the cell voltage becomes more accurate as it approaches end-of-charge or end-of-discharge conditions.
Furthermore, our simulator allowed to evaluate the HF SRB operation for various voltage/current profiles without running a real engine, or other use case, and to confirm its capability to extend at some time the battery autonomy. The ability of the HF SRB to use the energy available in each cell when cells are significantly dispersed in terms of capacity (up to 20%) was demonstrated with a gain of ten percent in terms of running time on a standard driving cycle as the WLTC.
Finally, the behavior of the simulated HF SRB with a balancing of the remaining charge of the cells demonstrated the extent to which the HF SRB is to handle large disparities in battery cells utilization rates without the user having to make compromises. This provides new opportunities for optimal control algorithms in the management of unsorted batteries, while optimizing their ageing, and demonstrating the extent to which the HF SRB is capable of operating with second life cells or even different chemistries mixes.
Author Contributions
Conceptualization, R.T., F.L., J.B., G.D. and V.H.; methodology, R.T., F.L., J.B. and V.H.; software, R.T., F.L. and J.B.; validation, R.T., F.L., J.B. and V.H.; writing—original draft preparation, R.T., F.L. and J.B.; writing—review and editing, R.T., F.L., J.B., G.D. and V.H.; supervision, G.D.; project administration, R.T., G.D. and V.H.; All authors have read and agreed to the published version of the manuscript.
Funding
This research received no external funding.
Conflicts of Interest
The authors declare no conflict of interest.
References
- Lu, L.; Han, X.; Li, J.; Hua, J.; Ouyang, M. A review on the key issues for lithium-ion battery management in electric vehicles. J. Power Sources 2013, 226, 272–288. [Google Scholar] [CrossRef]
- Ci, S.; Kin, N.; Wu, D. Reconfigurable battery techniques and systems: A survey. IEEE Access 2016, 4, 1175–1189. [Google Scholar] [CrossRef]
- Bouchhima, N.; Schnierle, M.; Schulte, S.; Birke, K.P. Active model-based balancing strategy for self-reconfigurable batteries. J. Power Sources 2016, 322, 129–137. [Google Scholar] [CrossRef]
- Bouchhima, N.; Schnierle, M.; Schulte, S.; Birke, K.P. Optimal energy management strategy for self-reconfigurable batteries. Energy 2017, 122, 560–569. [Google Scholar]
- D’Arco, S.; Quraan, M.; Tricoli, P.; Piegari, L. Low frequency operation of Modular Multilevel Converters with embedded battery cells for traction drives. In Proceedings of the 2016 International Symposium on Power Electronics, Electrical Drives, Automation and Motion (SPEEDAM), Anacapri, Italy, 22–24 June 2016; pp. 1375–1382. [Google Scholar]
- Simone, D.D.; Piegari, L. Integration of stationary batteries for fast charge EV charging stations. Energies 2019, 12, 4638. [Google Scholar] [CrossRef] [Green Version]
- Akagi, H.; Maharjan, L. A battery energy storage system based on a multilevel cascade PWM converter. In Proceedings of the 2009 Brazilian Power Electronics Conference, Bonito-Mato Grosso do Sul, Brazil, 27 September–1 October 2009; pp. 9–18. [Google Scholar]
- Zheng, Z.; Wand, K.; Xu, L.; Li, Y. A hybrid cascaded multilevel converter for battery energy management applied in electric vehicles. IEEE Trans. Power Electron. 2014, 29, 3537–3546. [Google Scholar] [CrossRef]
- Thomas, R.; Despesse, G.; Bacquet, S.; Fernandez, E.; Lopez, Y.; Ramahefa-andry, P.; Cassarino, L. A High Frequency Self-Reconfigurable Battery for Arbitrary Waveform Generation. World Electr. Veh. J. 2020, 12, 8. [Google Scholar] [CrossRef]
- Despesse, G.; Sanjuan, S.; Gery, S. Battery Monitoring System using switching battery cells. In Proceedings of the RITF Research & Innovation for Transport Systems of the Future, Paris, France, 23 August 2012. [Google Scholar]
- Gao, F.; Gu, X.; Ma, Z.; Zhang, C. Redistributed Pulsewidth Modulation of MMC Battery Energy Storage System under Submodule Fault Condition. IEEE Trans. Power Electron. 2020, 35, 2284–2294. [Google Scholar] [CrossRef]
- Plett, G.L. Battery Management Systems; Artech House: Norwood, MA, USA, 2015. [Google Scholar]
- Andrea, D. Battery Management Systems for Large Lithium-Ion Battery Packs; Artech House: Norwood, MA, USA, 2010. [Google Scholar]
- Buchmann, I. Battery University 803a: Cell Matching and Balancing. Available online: https://batteryuniversity.com/learn/article/bu_803a_cell_mismatch_balancing (accessed on 14 August 2019).
- Bentley, W.F. Cell balancing considerations for lithium-ion battery systems. In Proceedings of the Annual Battery Conference on Applications and Advances, Long Beach, CA, USA, 14–17 January 1997; pp. 223–226. [Google Scholar]
Figure 1.
Staircase shape sine waveform generated by N-level Self-Reconfigurable Batteries (SRB).

Figure 2.
High Frequency Self-Reconfigurable Battery (HF SRB) hardware architecture.

Figure 3.
HF SRB cells switch control principle.

Figure 4.
High Frequency Self-Reconfigurable Battery model synoptic.

Figure 5.
Mean error and maximal error between real and estimated SoC over 100 s of a normalized New European Driving Cycle (NEDC) profile with 20 NMC cells.
Figure 5.
Mean error and maximal error between real and estimated SoC over 100 s of a normalized New European Driving Cycle (NEDC) profile with 20 NMC cells.

Figure 6.
HF SRB model implementation in the simulator.

Figure 7.
Output voltage control loop tracking the electrical grid.

Figure 8.
Simulated and experimental results of the HF SRB charging over the national power grid with a 56% initial State of Charge (SoC) unbalancing.
Figure 8.
Simulated and experimental results of the HF SRB charging over the national power grid with a 56% initial State of Charge (SoC) unbalancing.

Figure 9.
SoC dispersion balancing with New European Driving Cycle (NEDC) profile.

Figure 10.
State of Charge dispersion over NEDC profile.

Figure 11.
Comparison of charge dispersions between a static battery and a self-reconfiguring battery discharging with Worldwide harmonized Light vehicles Test Cycle (WLTC) vehicle cycles.
Figure 11.
Comparison of charge dispersions between a static battery and a self-reconfiguring battery discharging with Worldwide harmonized Light vehicles Test Cycle (WLTC) vehicle cycles.


Table 1.
Dataset used to translate the vehicle speed into power consumption.
| Values | Description | |
|---|---|---|
| 0.0111 | Rolling friction coefficient | |
| 9.81 N/kg | Acceleration of gravity | |
| 1.225 kg/m3 | Air density | |
| 1.84 m2 | Aerodynamic frontal area | |
| 0.22 | Drag coefficient | |
| 1425 kg | Vehicle masse | |
| 0.35 m | Wheel radius | |
| 0.2 kg m2 | Motor inertia | |
| 0.05 kg m2 | Gear inertia | |
| 4 | Gear ratio | |
| 4 | Number of wheels | |
| 8 kg m2 | Wheel inertia |
Publisher’s Note: MDPI stays neutral with regard to jurisdictional claims in published maps and institutional affiliations. |
© 2021 by the authors. Licensee MDPI, Basel, Switzerland. This article is an open access article distributed under the terms and conditions of the Creative Commons Attribution (CC BY) license (http://creativecommons.org/licenses/by/4.0/).
Share and Cite
MDPI and ACS Style
Thomas, R.; Lehmann, F.; Blatter, J.; Despesse, G.; Heiries, V. Performance Analysis of a Novel High Frequency Self-Reconfigurable Battery. World Electr. Veh. J. 2021, 12, 10. https://0-doi-org.brum.beds.ac.uk/10.3390/wevj12010010
AMA Style
Thomas R, Lehmann F, Blatter J, Despesse G, Heiries V. Performance Analysis of a Novel High Frequency Self-Reconfigurable Battery. World Electric Vehicle Journal. 2021; 12(1):10. https://0-doi-org.brum.beds.ac.uk/10.3390/wevj12010010
Chicago/Turabian StyleThomas, Rémy, Fanny Lehmann, Jérôme Blatter, Ghislain Despesse, and Vincent Heiries. 2021. "Performance Analysis of a Novel High Frequency Self-Reconfigurable Battery" World Electric Vehicle Journal 12, no. 1: 10. https://0-doi-org.brum.beds.ac.uk/10.3390/wevj12010010