Article

Analysis and Prediction of Electromobility and Energy Supply by the Example of Stuttgart

1
Institute of Sustainable Energy Engineering and Mobility, University of Applied Sciences Esslingen, Kanalstraße 33, 73728 Esslingen am Neckar, Germany
2
Stuttgart Netze GmbH, Stöckachstraße 48, 70190 Stuttgart, Germany
3
Institute for Transport Studies (IfV), Karlsruhe Institute of Technology (KIT), Otto-Ammann-Platz 9, 76131 Karlsruhe, Germany
4
Institute for Energy Economics and Rational Use of Energy (IER), University of Stuttgart, Heßbruehlstr. 49a, 70565 Stuttgart, Germany
5
Institute of Industrial Production (IIP), Karlsruhe Institute of Technology (KIT), Hertzstr. 16, 76187 Karlsruhe, Germany
*
Author to whom correspondence should be addressed.
World Electr. Veh. J. 2021, 12(2), 78; https://0-doi-org.brum.beds.ac.uk/10.3390/wevj12020078
Submission received: 22 March 2021 / Revised: 12 May 2021 / Accepted: 19 May 2021 / Published: 21 May 2021

Abstract

:
This paper seeks to identify bottlenecks in the energy grid supply regarding different market penetration of battery electric vehicles in Stuttgart, Germany. First, medium-term forecasts of electric and hybrid vehicles and the corresponding charging infrastructure are issued from 2017 to 2030, resulting in a share of 27% electric vehicles by 2030 in the Stuttgart region. Next, interactions between electric vehicles and the local energy system in Stuttgart were examined, comparing different development scenarios in the mobility sector. Further, a travel demand model was used to generate charging profiles of electric vehicles under consideration of mobility patterns. The charging demand was combined with standard household load profiles and a load flow analysis of the peak hour was carried out for a quarter comprising 349 households. The simulation shows that a higher charging capacity can lead to a lower transformer utilization, as charging and household peak load may fall temporally apart. Finally, it was examined whether the existing infrastructure is suitable to meet future demand focusing on the transformer reserve capacity. Overall, the need for action is limited; only 10% of the approximately 560 sub-grids were identified as potential weak points.

1. Introduction

To achieve the emerging climate change targets and manage traffic volumes, alternative vehicle concepts such as battery-electric vehicles (BEV) are offered by the automobile industry and require new infrastructure for electrical energy supply related to customer demands. Due to the increasing market penetration of electromobility and the resulting charging infrastructure, electricity grid use, in particular on the low-voltage level, is becoming more and more decentralized. It is expected that these decentralized charging processes will first affect the distribution grids in dense cities and urban areas due to the limited range of batteries in electric vehicles. However, these local grids are not designed for this high power, and electric vehicles can bring local grids to their technical limits of power systems [1]. An uncontrolled increase in electric vehicle charging will likely cause a bottleneck in the energy supply, and significant variations in the total required load capacity [2,3]. Therefore, the early detection of problematic areas is essential to detect possible week points and to prevent a grid overload in the future.
At present, there is much literature concerning this research issue; many countries are concerned about energy supply due to the rapidly growing number of electric vehicles. For example, Slovakia is the smallest country in terms of electricity consumption. According to a forecast of Slovakia’s Ministry of the Environment, only about 35.000 BEV are expected on the roads until 2030, accounting for 1.3% of total vehicles number in 2019 [4]. According to [5], future additional energy demand caused by BEV is only 0.4%. Compared to Slovakia, the expected new registrations of cars in the USA in 2030 are up to 6.8 million, accounting for 40% of new vehicle sales. It can be converted into over 25 TWh of total energy consumption for the 2030 to 2034 period. However, over the past 20 years, the US power system has added an average growth in power generating capacity of 30 TWh per year [6].
Furthermore, the study in [7] suggested that due to rail electrification and the penetration of alternative electric powertrains in road transport, the electricity consumption of electrically chargeable vehicles has shown a steady increase. Wu et al. [8] utilized a location planning model of electric bus fast-charging stations, which are key technologies along with electric vehicles. Compared to the effects on energy demand, the additional charging demand represents a significantly greater challenge for the electrical network. In [9], the authors proposed simulations of the load profiles of uncontrolled charging with different charging capacities, market penetrations, and daily driving distances. The additional charging demand generated by electric vehicles during evening peak load times can be particularly problematic. In addition, based on actual electric vehicle charging behavior in intelligent grid regional demonstration project in Los Angeles, the effects of electric carloads on the California distribution network are evaluated at different electric vehicle penetration levels [10]. In [11], Wussow et al. presented a methodology for modeling and analyzing the load in a distribution system considering grid-oriented charging of electric vehicles and adopted simulations in an extreme scenario.
However, these references generally only provide one or two aspects of the impact of electric vehicle penetration, and most of them regard electric vehicles as a challenge. We argue for the need to adopt novel approaches for forecasting and analyzing the future impact of electric vehicles in urban areas and the related consequences for energy demand and grid stability. The main contributions of this paper include the following:
(1).
We investigate the effect of electric vehicle charging in terms of four key categories: market share forecasting, energy demand, charging profiles, and electrical distribution network.
(2).
The paper used a comprehensive perspective, consisting of three modeling tools (energy system model, travel demand model and distribution network model) to assess the evolution of the future impact of electric vehicles in urban areas. By standardizing the modeling process, these models with different input parameters work separately but contribute to precisely predefined scenarios.
The remaining part of this paper is organized as follows: The second section presents an investigation on the expanding market for electric mobility up to 2030. The third section describes the method to analyze the interactions between electric vehicles and the local energy system. The following section presents network effects in the city of Stuttgart based on the travel demand model, including electric cars. The experimental results of the low-voltage grid including the additional demand from electromobility, are shown in the fifth section. Finally, the last section concludes the paper.

2. Prediction of Vehicle Number and Charging Points for an Exemplary Local Area until 2030

First, the total vehicle fleet in Germany was analyzed, and the potential market diffusion of battery-electric and plug-in hybrid vehicles (xEV) in the region Stuttgart in the year 2017 was estimated in our previous papers [12,13]. This forecast is based on different current studies considering the European CO2 fleet emission targets (up to 59 g CO2/km until 2030) [13]. It was also described that the current xEV share in Greater Stuttgart is twice as much as xEV share in Germany (0.56%). Based on the higher share in Greater Stuttgart, it is suggested that at key industrial locations, disproportionately high penetration of xEV can be expected in the future.
The vehicle fleet is subject to a continuous replacement by new vehicles. At the same time, the automobile manufacturers are under pressure to comply with the average CO2 fleet emission of the vehicles sold annually [14]. The development of the limit values for the different segments is shown in Table 1.
The legal regulations will be disrupted by an EU directive that will come into force in 2021. In this directive, buses in particular are subject to a stricter requirement (see Table 1). Therefore, already by 2025, 22.5% of the total vehicle fleet should be as so-called emission-free concepts [15]. However, mainly passenger cars will be considered in the following.
First of all, a forecast of the medium-term penetration of electric vehicles for the passenger car fleet should be derived. The limit values of CO2 fleet emission in 2020, 2025 and 2030 are prescribed by the regulation of the European Parliament [16,17]. The limit value for cars will be sufficiently reduced from 2020 (as shown in Table 1). As a result, the efficiency enhancements concerning conventional drive technologies achieved to date will no longer be sufficient to meet the requirements. Switching to emission-free electric drives is a necessary consequence.
More than 58 million vehicles are registered in Germany, of which 46 million are passenger cars (2017) [18]. Comparing the importance of vehicles according to their mileage, the share of passenger cars with 630,481 million km covers almost 90% of the total annual mileage on German roads [19], as shown in Figure 1.
To determine the future market penetration of the xEV up to 2030, forecast calculations from current studies by the Boston Consulting Group (BCG, Boston, MA, USA) [20], the Shell(London, UK) study [21], and the eMobil research [22] were used. In addition, extrapolations based on the CO2 fleet emission limits of the European Union were made. Based on the analysis of the total vehicle fleet in Greater Stuttgart and the legal framework conditions, two electrification scenarios for road traffic in Greater Stuttgart in 2030 were created. The focus lies on passenger cars, as they have the largest share of total mileage and can be electrified more easily than duty vehicles due to their lower weight [13]. Hence, an xEV share of around 27% and internal combustion engine vehicle (ICE) share of the vehicle fleet of about 73% in 2030 can be assumed in the Stuttgart region (see Figure 2). This corresponds to approximately 480,000 xEV, assuming a sufficient market acceptance of the newly created offer of alternative drive concepts.
According to the National Platform for Electric Mobility (NPE), 77,100 charging points have to be set up for one million xEVs, corresponding to around 13 xEV per charging point [23]. Extrapolating this recommendation into 2030, around 37,000 public charging points should be built by 2030 in Greater Stuttgart. The costs for procurement and installation of these charging points were determined according to NPE roadmap charging infrastructure. This roadmap provides a forecast of the charging infrastructure costs in the categories “Smart charging box”, “AC charging station” and “DC charging station” for 2020, as shown in Table 2.
To determine the average costs, the specific costs per kilowatt of installed capacity of the charging stations and their electrical distribution, grid connections were determined as well as the specific investment cost for the charging stations.
An interview was conducted as part of the expert workshop in the strategy dialogue dedicated to the automotive industry in Baden-Wuerttemberg on the 4 December 2018 to investigate the distribution of public charging points’ charging power. The investment for the target number of charging points was calculated based on the cost structure in Table 3.
The requirements for infrastructure, automobile manufacturers and electrification of road traffic are driven by the current legal framework of the European Union. In urban centers, such as the Stuttgart region, a substantial increase in xEV is expected (around 480,000 xEV in 2030, corresponding to a share of approximately 30%). In the following chapter, the energy system of Stuttgart will be analyzed, and the future impact of electrified road traffic on the energy grid energy network will be determined.

3. Energy Demand in the Stuttgart Region

In order to analyze the interactions between electric vehicles and the local energy system in the Stuttgart Region, an energy system analysis has been carried out with the TIMES Local Stuttgart Model [27,28,29]. According to [12], this energy system model represents all processes for energy conversion being used in the area of Stuttgart with covering the whole energy chain, e.g., energy supply (e.g., power plants, electricity imports), transmission and distribution, as well as energy consumption by end-users.
From a mid- and long-term perspective, electromobility will play a key role in an urban energy and transport system. Consequently, concerning the future development of electromobility, comparisons have been made on the scenarios with different market penetration. Because switching to public transportation is also an effective instruments for emissions reductions, a scenario with light commercial vehicles (high: 11.6% or low: 4%) and buses (high: 21% or low: 7%) is to be taken into account. According to the master plan for the City of Stuttgart [30], the analysis might be conducted based on three hypothetical scenarios:
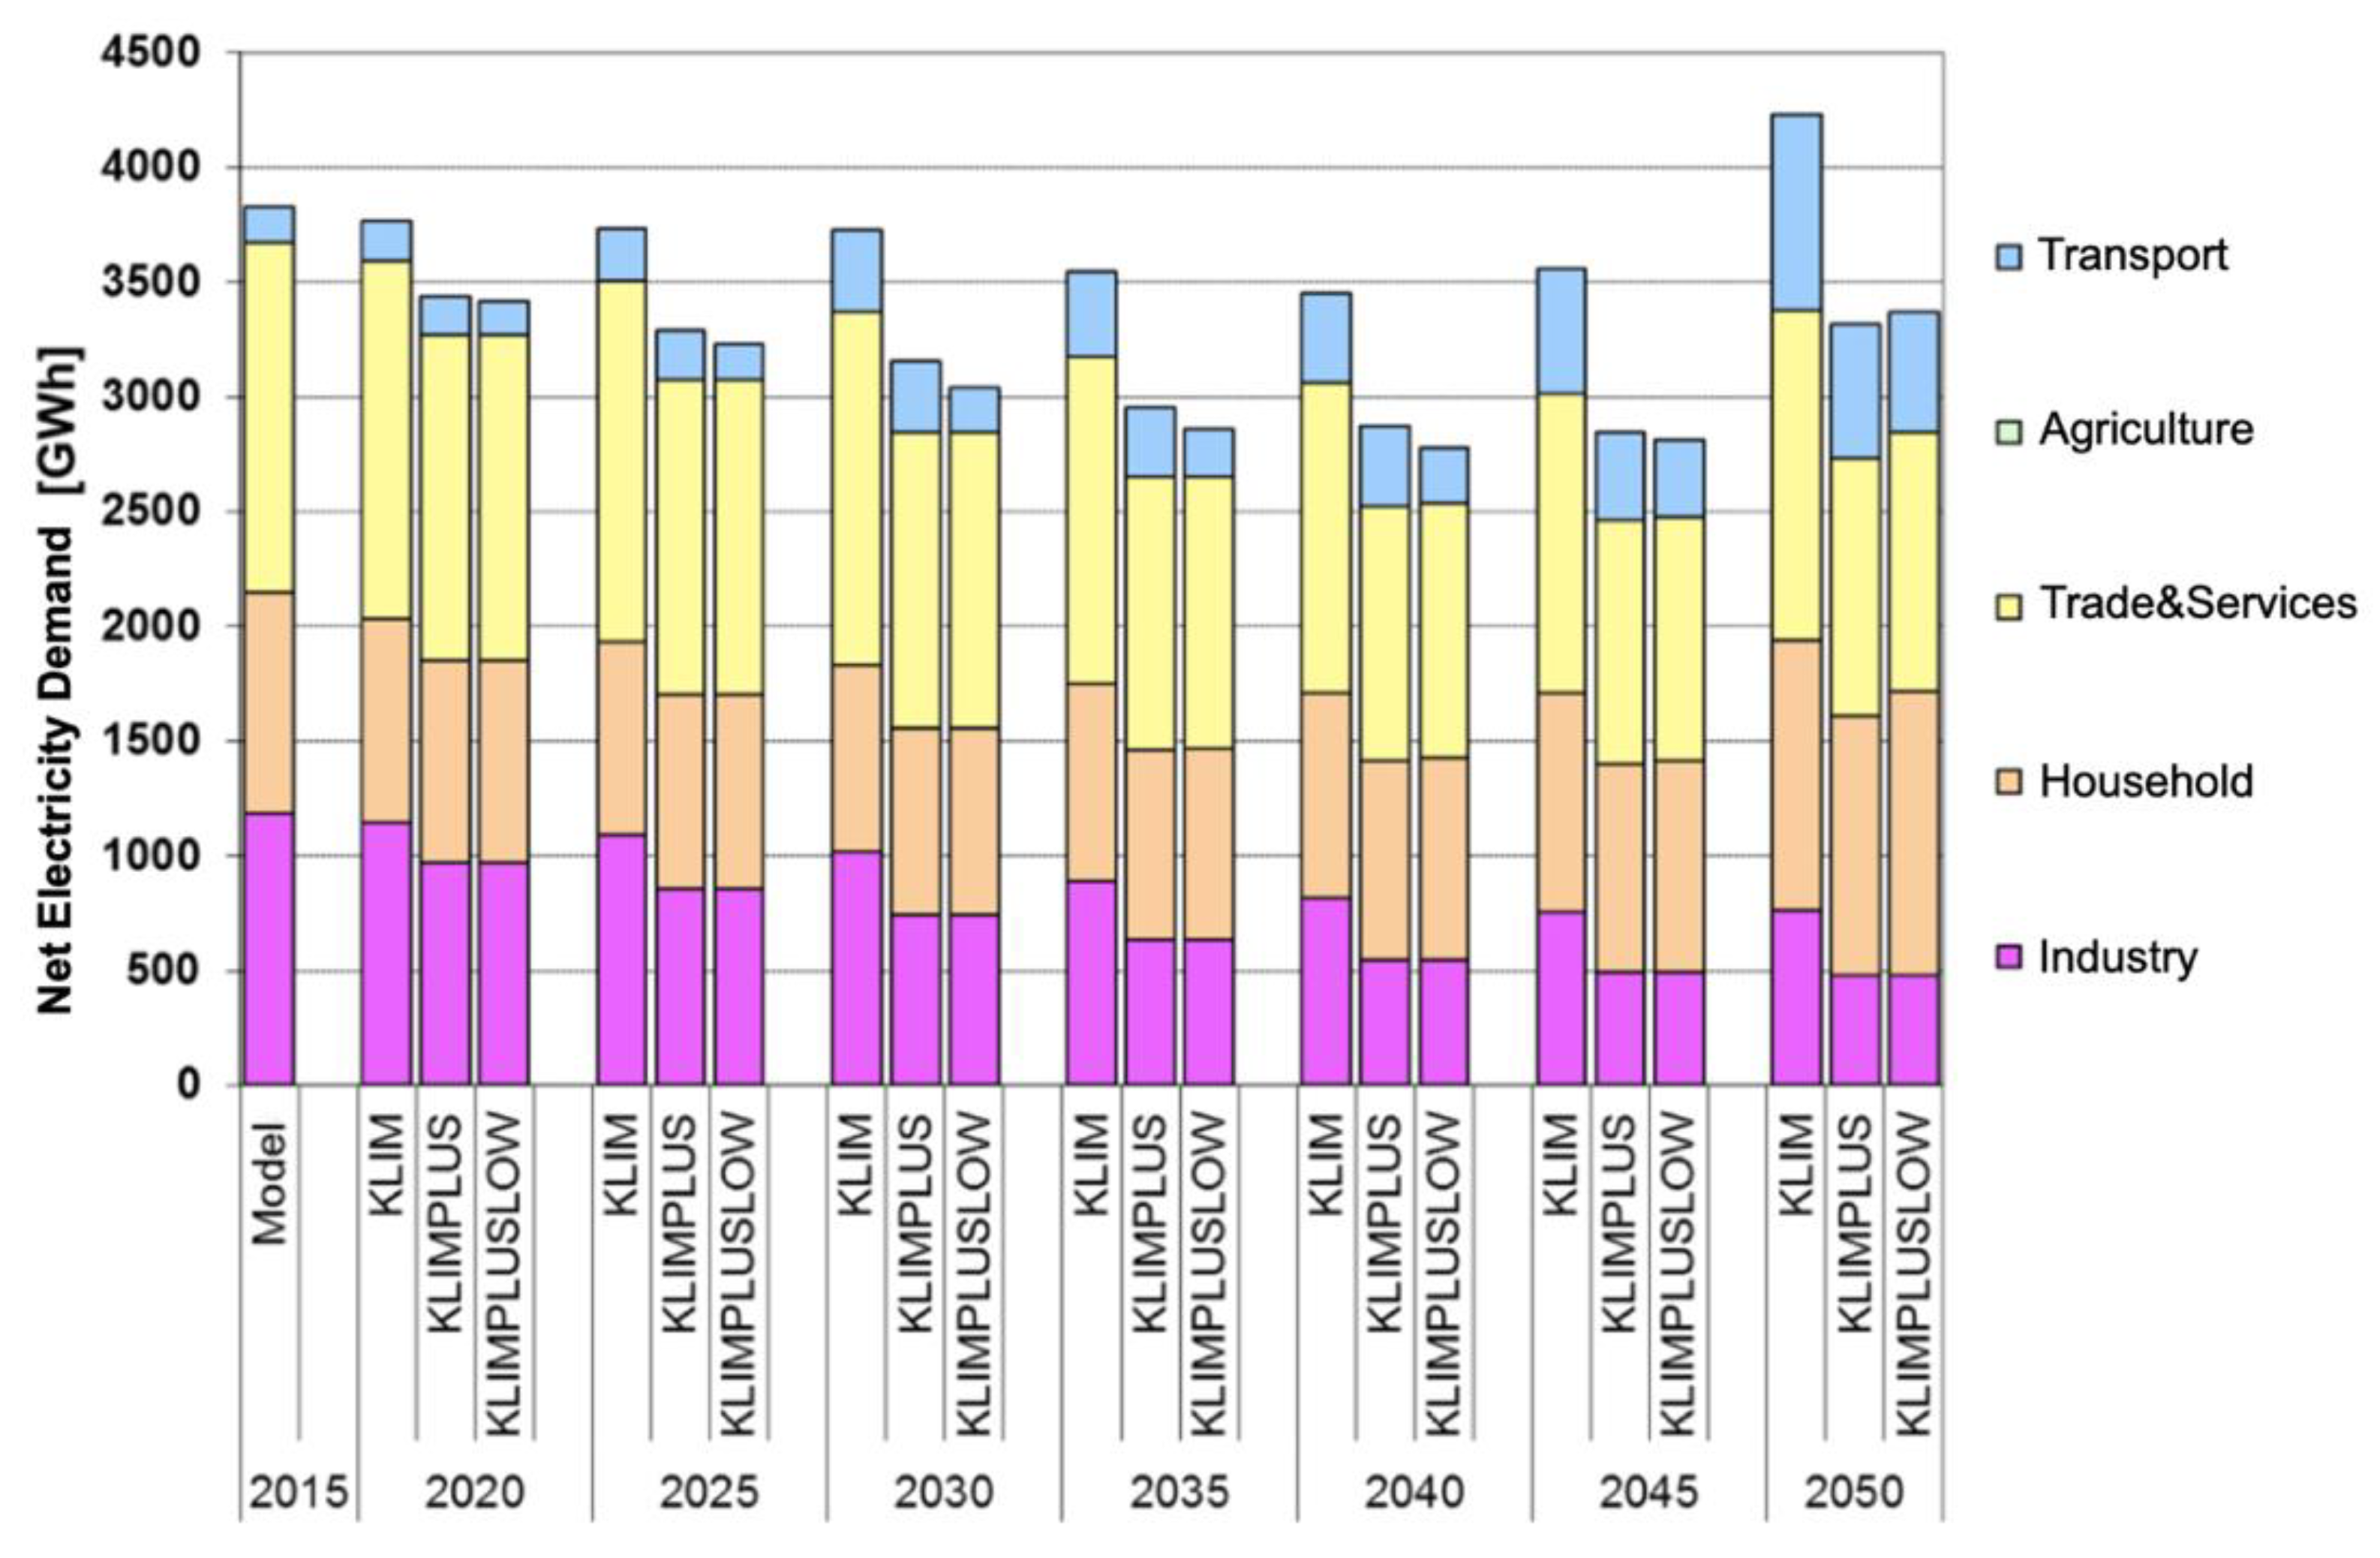
  • “KLIM”: reduction of 95% global greenhouse gas (GHG) emissions until 2050 (compared with 1990) and rapid implementation of electromobility (27% xEV in 2030);
  • “KLIMPLUS”: a falling demand for mobility in individual motorized transport due to increasing demand in public transport and rail traffic;
  • “KLIMPLUS-LOW”: identical general conditions with “KLIMPLUS”, but a significantly delayed expansion of electromobility (10% xEV in 2030).
Electricity demand distribution by sectors is shown in Figure 3, indicating that electricity demand in the sectors of industry, trade and services as well as households will drop by nearly 30% until 2050 in the KLIMPLUS scenario. The total electricity demand will stay almost stable from 2035 to 2045, while that for electric cars, trucks and buses will keep growing continuously, which means the electrification of road transport playing an important role in electricity demand such as electric buses and fast-charging stations [8]. Apart from the transportation sector, electrification can also have a considerable impact on the other sectors such as households in 2050. Further comparison between the KLIMPLUS and KLIMPLUSLOW scenarios with total comparable consumptions indicates a shift from transport to the other sectors (KLIMPLUSLOW) to achieve a long-term goal of carbon neutrality.
Energy efficiency in industry and electromobility are vital factors for electricity demand. In order to fulfill ambitious climate goals, electrification is considered as an obvious solution to decarbonize energy consumption.
The application of electromobility has multiple cost implications in comparison with that of conventional vehicles. Firstly, the cost results primarily from the specific battery price and battery size. In addition, further cost effects will emerge due to the necessary expansion of the charging infrastructure and the regional energy system. Figure 4 shows the differential costs owing to increased electromobility (KLIMPLUS) compared with those in the other scenario (KLIMPLUSLOW). In general, the additional costs will sum up to 600 million euros by 2050. Taking a closer look at the majority of these costs, around 480 million euros will be incurred in the period 2023–2037, while the costs will remain steady in the years shown below.
With regard to the cost components, it is not significant differences in terms of the investment and operating costs between the conventional vehicles and the xEV, as well as the additional costs which forecast up to 35 million euros until 2027, highlighting the additional costs in the balance sheet mainly due to the installation and operating costs of the charging infrastructure. Around 880 million euros will aggregate over the considered certain period of time.
The remaining differential costs in both parts of “Imports/Exports” (e.g., fuel and electricity imports) and “Other system” (e.g., energy system of industry and households) will stay relatively low until 2042. However, the “Other system” subsequently reduces significant cost compared with that in the KLIMPLUSLOW scenario which requires greater efforts to achieve the greenhouse gas reduction targets in the remaining energy system with facts, especially when the electromobility is rarely considered in the master plan of Stuttgart.

4. Examination of Network Effects in the City Stuttgart Based on the Travel Demand Model MobiTopp including Electric Vehicles

To examine the temporal and spatial distribution of additional energy demand caused by electromobility, we used the agent-based travel demand model mobiTopp. mobiTopp is a microscopic multi-agent traffic demand model developed at the Karlsruhe Institute of Technology, Institute for Transport Studies, which simulates the movement of all people using all modes of transport exact to the minute over a period of one week within the Stuttgart Region [31].
Every agent represents an individual decision-making entity with characteristics such as household members, occupation status or mobility tool ownership. Travel demand is caused by activities, that are scheduled for each agent individually. Destinations and travel mode are chosen by applying multinomial logit models considering spatial, temporal or availability restrictions. Further, all cars are also modeled as entities with characteristics such as segment (i.e., small, medium, large) or drive technology (i.e., electric or conventional drive). Hence, car use and charging patterns can be analyzed for different vehicle types including electric vehicles. In total, five scenarios with different market shares for BEV (10% and 30% for the whole planning area of the Stuttgart Region) and different charging capacities (3.7 and 11 kW) were simulated. The assignment of cars happens based on a car ownership model [32]. Future car characteristics were defined during a specialist workshop with experts from the automotive as well as the energy industry; see Table 4. In order to perform a worst-case analysis for the whole region, we firstly allowed all agents to charge their electric car anywhere, as soon as their state of charge fell below 50% (for the duration of the activity carried out at that destination), assuming, that the infrastructure needed will be established in the future. For the detailed analysis of the quarter, that was used for the load flow simulation, however, we subsequently assumed that the agents charge their car every time they return home to create a substantial additional demand. These results were used for further analysis within this project (see [13] for further details).
In a first step, the grid utilization of a residential area with 349 households and 779 inhabitants in Stuttgart was investigated using load flow calculations. Therefore, the MATLAB-based open-source package MATPOWER [33] was applied. By linking MATPOWER and mobiTopp, the simulated mobility behavior was explicitly taken into account in the load flow analysis. For this purpose, we first analyzed the peak load of BEV charging and average household energy demand, assuming that agents recharge their BEV once they return home without any charging management in the simulation. With regard to the household load, a load profile was generated on a stochastic basis for the defined number of households, including seasonal lightning and heating [34,35]. Based on the peak load, an equal share was allocated to each household located in the residential area. The 349 households were allocated to 53 bus nodes with a varying number of residential units. Considering the grid data and the related technical restrictions (voltage limits, maximum power limits), the load flow analysis was carried out with the aim to identify the utilization of the grid components for the different scenarios.
Figure 5 shows the transformer utilization for different scenarios. We observed that a higher charging capacity could lead to a lower transformer utilization. This could be explained by a temporal fall apart of charging and household peak load. Due to the shorter charging time, a higher charging capacity can lead to a reduction in simultaneous charging processes. In summary, no thermal or voltage-related overloads could be identified independent of the scenario [13].

5. Analysis and Prognosis on Network Load in the City of Stuttgart

Second, an analysis on the low-voltage grid, including the additional demand from electromobility (resulting from the mobiTopp simulation), should be conducted for the entire city of Stuttgart. As a local distribution system operator, Stuttgart Netze GmbH (SN, Stuttgart, Baden-Württemberg, Germany) is responsible for the secure and safe operation of the electrical distribution network in Stuttgart. The distribution network includes around 1500 km of medium-voltage lines and 3900 km of low-voltage ones. In addition, the structure of the distribution network is schematically presented in Figure 6.
The transfer points between the high-voltage and the medium-voltage network have built total of 24 transformer stations in Stuttgart. On the one hand, the medium-voltage network is basically operated in open ring configurations. Medium- voltage lines supply electricity to big customers directly through the customer substations. On the other hand, there are around 1000 substations being feed points for the low-voltage network. The low-voltage distribution network consists of about 560 subgrids, which are supplied by one or more local stations depending on the required demand. The subgrids are the smallest network structure by means of galvanic connections at low-voltage level. As being shown in Figure 6, it is the cables and cable distribution cabinets that are interconnected to form a mesh network.
Figure 7 illustrates the distribution of the energy in megawatt-hours for different days of a week. The results are simulated by using mobiTopp with a xEV market penetration of 30% and compared with the grid data in the supply area of SN. The chart facilitates to identify the variation of demand across the different hours of a day. There are two peaks across the day. First, the larger peak (yellow circle) occurs in morning between 08:00 and 10:00, reaching approx. 60 MWh, which correlates with the time vehicles arrive at work locations in the morning. Second, a smaller peak (green circle) is noted in the late evening, which is highly likely due to the period of which drivers plugging in their vehicles as soon as they arrive home at the end of the working day. Furthermore, the energy requirement in this model for each charging process is covered in a relatively short time period due to a high charging capacity of 50 kW, which also leads to a significant decrease in the midday from 11 a.m. representing major potential to reduce simultaneous charging and peak loads with some appropriate measures, including delayed charging at home and workplace (until after the peak). Furthermore, in the simulated week, the energy consumption by charging is approx. 2350 GWh, which accounts extrapolated for 4% of the total energy consumption in the medium and low-voltage grid of SN in 2018. The peak power is at least 60 MW attributed to charging processes, which corresponds about 11% to the peak load in the supply area of SN in 2018 [12] meaning electromobility being less an energy-quantity problem rather than a challenge to supply load peaks in areas with high densities.
To identify such a hotspot like the peak load of each low-voltage grid network should be compared with their transformer reserve capacity. In view of around three quarters of networks, the currently available transformer reserves are sufficient. For the other 13%, more observations must be taken with suitable measuring technology since utilization is expected to be just above or below 100%. Only 10% of around 560 subgrids require action, and more than 60% of these overloaded grids are characterized by industrial use (see Figure 8). In this field, high concentrated loads, such as car parks, are generally connected to the medium-voltage grid where load peaks are easier to handle. Furthermore, 30% of the overloaded grids are dominated by residential use coupled with dense housing construction. Additional charging demand enlarges the typical load profile of households in the evening hours. Therefore, it is necessary to optimize the utilization of grid networks with an intelligent charging management.

6. Conclusions

Respectively to these investigations, already in 2030, every fourth car in Greater Stuttgart will be equipped as an electrified vehicle (xEV). Therefore, vehicle charging infrastructure needs to be expanded. Currently, about 400 charging points are set up in the city of Stuttgart (2019). The demand for the upcoming charging point needs will increase by a factor of 100, respective to the given simulation results. This increased demand for electrical energy might affect the electrical distribution grid; therefore, a network analysis was carried out, taking into account the “worst case” of xEV market penetration of 30% for a residential area of the city Stuttgart with 433 households and 779 inhabitants. By this investigation, the maximum voltage converter load capacity did not exceed 61%.
Further, results of net grid simulation were compared with network data in the supply area of the local distribution system operator SN. Only 10% of the approximately 560 subgrids were identified as weak points in the investigated power grid, of which 60% can be identified by industrial use and 30% of the residential areas with dense residential construction.
Hence, it can be concluded that even assuming a market penetration of electromobility of 30%, there is still no critical shortage of energy supply expected.
Many countries are concerned about the increasing energy demand from electric vehicles, but as this study has shown, the BEV market penetration at least up to 30% poses no threat. For example, in the USA, there was an annual increase in electricity consumption of up to 100 TWh in the period from 1970–1975 caused by the electrification of residential buildings and additional consumers, such as air conditioners and refrigerators. This did not result in catastrophic bottlenecks in the energy supply [6]. Therefore, the forecast increase in energy demand of 25 TWh from 2030 is no reason for panic. The bottlenecks can arise in the evening due to the high simultaneity factor since most of the BEV owners charge their electric cars after returning home. Therefore, an intelligent charging management is required to reduce the load peaks. A reduction in the maximum charging power would also have a significant impact on the distribution of the energy requirement over the course of the day.

Author Contributions

Conceptualization, I.M., D.S., D.M., C.K., M.K., N.K., M.B., M.N., A.M., P.J. and R.W.; methodology, I.M., D.S., D.M., C.K., M.K., N.K., M.B., M.N., A.M., P.J. and R.W.; software, I.M., D.S., D.M., C.K., M.K., N.K., M.B., A.M. and P.J.; validation, I.M., D.S., D.M., C.K., M.K., N.K., M.B., M.N., A.M., P.J. and R.W.; writing—original draft preparation, I.M., D.S., D.M., C.K., M.K., N.K., M.B., M.N., A.M., P.J. and R.W.; writing—review and editing, I.M., D.C., D.S., D.M., C.K., M.K., N.K., M.B., M.N., A.M. and R.W.; supervision, R.W.; project administration, R.W. All authors have read and agreed to the published version of the manuscript.

Funding

This research was funded by the Ministry of the Environment, Climate Protection and the Energy Sector Baden-Württemberg, grant number” under the grant “Umweltforschung, Umweltforschung—Energie, Umweltforschung—Verkehr” (128586).

Acknowledgments

This work was supported from the Ministry of the Environment, Climate Protection and the Energy Sector Baden-Württemberg.

Conflicts of Interest

The authors declare no conflict of interest.

References

  1. Kasten, P.; Bracker, J.; Haller, M. Assessing the Status of Electrification of Road Transport Passenger Vehicles and Potential Future Implications for the Environment and European Energy System; Institute for Applied Ecology: Berlin, Germany, 2016; Available online: https://www.oeko.de/fileadmin/oekodoc/Assessing-the-status-of-electrification-of-the-road-transport-passenger-vehicles.pdf (accessed on 9 May 2021).
  2. Clement-Nyns, K.; Haesen, E.; Driesen, J. The Impact of Charging Plug-In Hybrid Electric Vehicles on a Residential Distribution Grid. IEEE Trans. Power Syst. 2010, 25, 371–380. [Google Scholar] [CrossRef] [Green Version]
  3. Shafiee, S.; Fotuhi-Firuzabad, M.; Rastegar, M. Investigating the Impacts of Plug-in Hybrid Electric Vehicles on Power Distribution Systems. IEEE Trans. Smart Grid 2013, 4, 1351–1360. [Google Scholar] [CrossRef]
  4. European Automobile Manufacturers’ Association (ACEA)“Passenger Car Registrations: +0.1% in 2018; −8.4% in December”. Available online: https://www.acea.be/press-releases/article/passenger-car-registrations-0.1-in-2018-8.4-in-december (accessed on 28 January 2019).
  5. Živčák, J.; Kádárová, J.; Puškár, M.; Kočišová, M.; Lachvajderová, L. Expected Impacts of the Massive Increase in Electric Vehicles in Slovakia. Appl. Sci. 2020, 10, 8945. [Google Scholar] [CrossRef]
  6. Energy.gov. Summary Report on EVs at Scale and the U.S. Electric Power System. Available online: https://www.energy.gov/eere/vehicles/downloads/summary-report-evs-scale-and-us-electric-power-system-2019 (accessed on 11 May 2021).
  7. Capros, P.; De Vita, A.; Tasios, N. EU Energy, Transport and GHG Emissions Trends to 2050: Reference Scenario 2013; National Technical University of Athens: Luxembourg, 2013. [Google Scholar]
  8. Wu, X.; Feng, Q.; Bai, C. A novel fast-charging stations locational planning model for electric bus transit system. Energy 2021, 224, 120106. [Google Scholar] [CrossRef]
  9. Göhler, G.; Schmaus, C.; Klingler, A. Netzbelastungen und Netzdienstleistungen durch Elektrofahrzeuge, Institut für Arbeitswissenschaft und Technologiemanagement IAT 2019. Available online: https://elib.uni-stuttgart.de/bitstream/11682/10624/3/2019_G%c3%b6hler_Netzbelastungen_und_Netzdienstleistungen_durch%20Elektrofahrzeuge.pdf (accessed on 22 April 2021).
  10. Jiang, Z.; Tian, H.; Beshir, M.J.; Vohra, S.; Mazloomzadeh, A. Analysis of electric vehicle charging impact on the electric power grid: Based on smart grid regional demonstration project-Los Angeles. In Proceedings of the 2016 IEEE PES Transmission & Distribution Conference and Exposition-Latin America (PES T&D-LA), Morelia, Mexico, 20–24 September 2016; Institute of Electrical and Electronics Engineers (IEEE): New York, NY, USA, 2016; pp. 1–5. [Google Scholar]
  11. Wussow, J.; Modica, G.; Engel, B. Grid-Oriented Charging of Electric Vehicles as Approach for Increasing Penetration in Residential Areas. In Proceedings of the International ETG-Congress 2019, Esslingen, Germany, 8–9 May 2019. [Google Scholar]
  12. Wörner, R.; Blesl, M.; Jochem, P. Prognosen einer elektromobilen Offensive im urbanen Raum am Beispiel des Großraums Stuttgart-Konsequenzen und Handlungsoptionen. In Proceedings of the 11 Internationale Energiewirtschaftstagung (IEWT 2019), Wien, Austria, 13–15 February 2019. [Google Scholar]
  13. Wörner, R.; Blesl, M.; Jochem, P. Prediction on future electric vehicle market shares in urban areas and related consequences for energy delivery & grid stability-investigation of Stuttgart. In Proceedings of the 32nd International Electric Vehicle Symposium, Lyon, Frankreich, 19–22 May 2019. [Google Scholar]
  14. Wörner, R.; Blesl, M.; Jochem, P. Elektromobilität im urbanen Raum-Analysen und Prognosen im Spannungsfeld von Elektromobilität und Energieversorgung am Fallbeispiel Stuttgart, Stuttgart 2019. Available online: https://pudi.lubw.de/detailseite/-/publication/10118-Elektromobilit%C3%A4t_im_urbanen_Raum_-_Analysen_und_Prognosen_im_Spannungsfeld_von_Elektromobilit%C3%A4t_und_.pdf (accessed on 9 April 2021).
  15. Schmitz, M. Aktuelle Entwicklungen im ÖPNV: Vor Welchen Herausforderungen Stellt Die Elektromobilität Verkehrsunternehmen? Welche Maßnahmen Müssen Ergriffen werden? 2019. Available online: https://www.vbg.de/SharedDocs/Medien-Center/DE/Faltblatt/Branchen/OePNV_und_Bahnen/branchenforum_2019_Vortrag_MSchmitz.pdf?__blob=publicationFile&v=4 (accessed on 1 April 2021).
  16. Regulation (EU) 2019/631 of the European Parlament and of the Councill of 17 April 2019 setting CO2 Emission Performance Standards for New Passenger Cars and for New Light Commercial Vehicles, and Repealing Regulations (EC) No 443/2009 and (EU) No 510/2011. 2019. Available online: https://eur-lex.europa.eu/legal-content/EN/TXT/PDF/?uri=CELEX:32019R0631&from=EN (accessed on 4 April 2021).
  17. Regulation (EU) 2017/0293 of the European Parliament and of the Council of Setting Emission Performance Standards for new Passenger Cars and for New Light Commercial Vehicles as part of the Union’s Integrated Approach to Reduce CO2 Emissions from Light-Duty Vehicles; Council of the European Union: Brussels, Belgium, 2019; Available online: https://eur-lex.europa.eu/legal-content/EN/TXT/PDF/?uri=CONSIL:ST_5091_2019_EXT_1&from=EN (accessed on 5 April 2021).
  18. Kraftfahrt-Bundesamt (KBA)Fahrzeugzulassungen (FZ): Bestand an Kraftfahrzeugen nach Umwelt-Merkmalen; Kraftfahrt-Bundesamt: Flensburg, Germany, 2018.
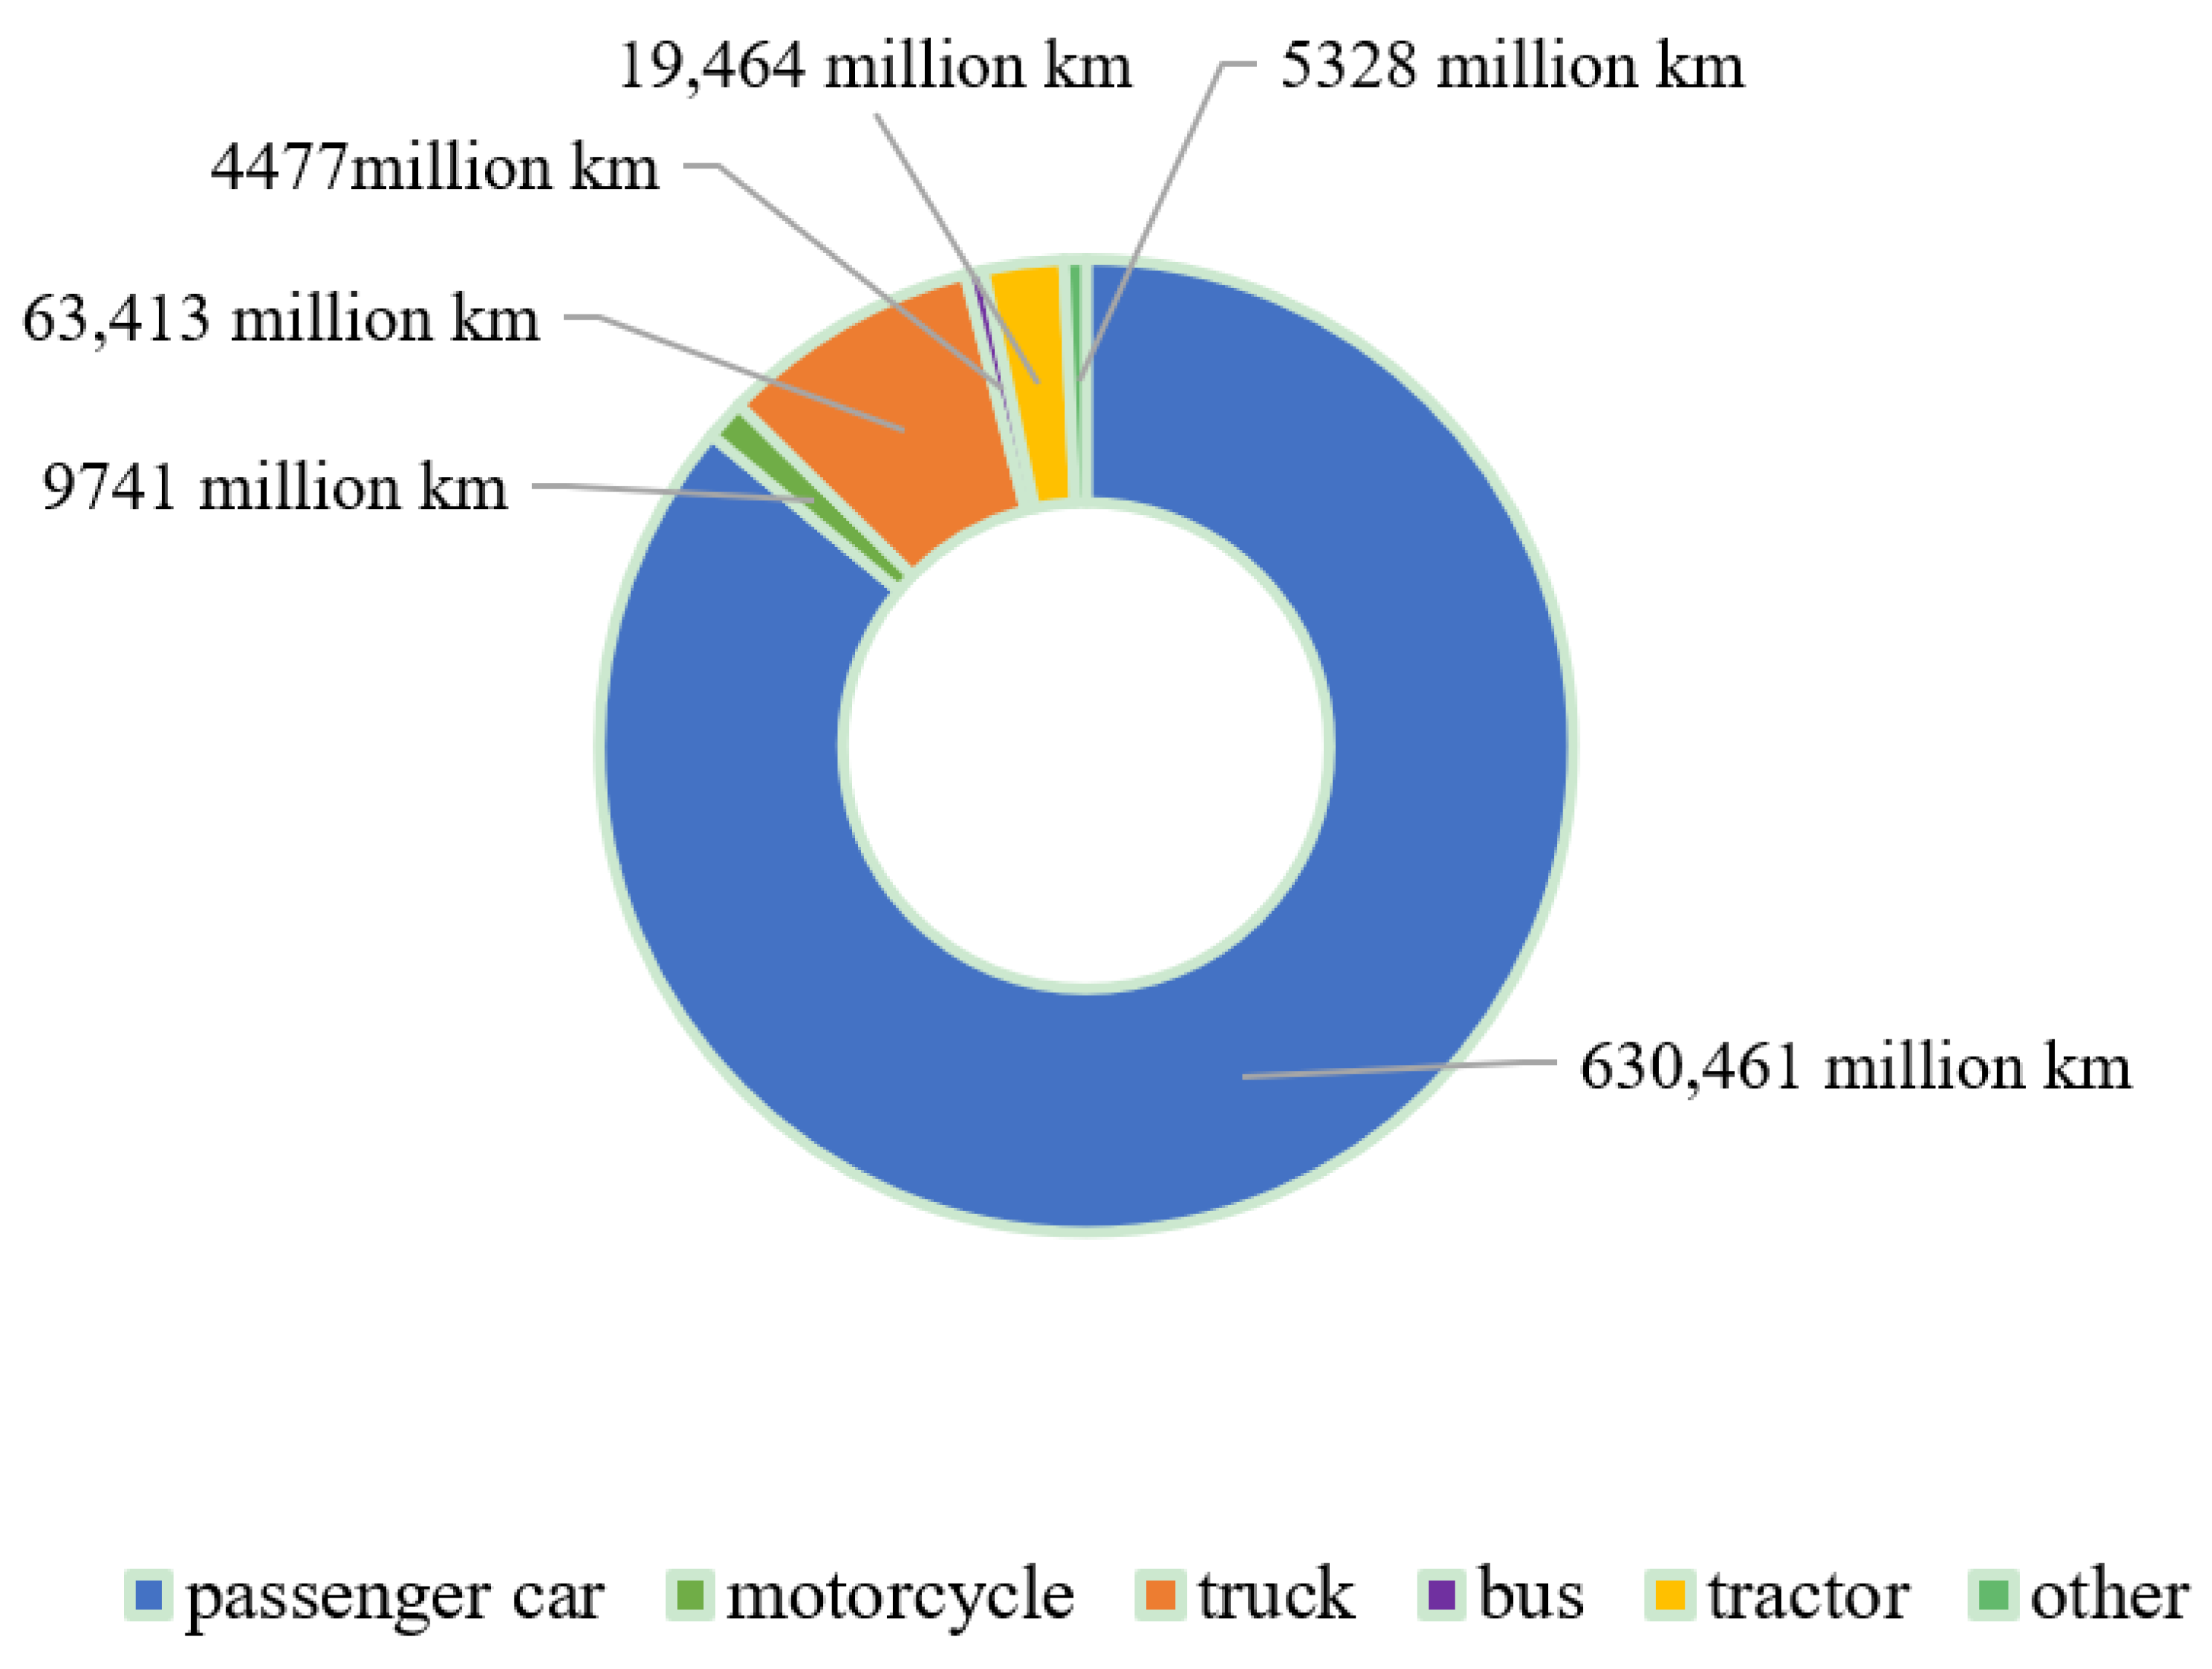
  19. Verkehr in Kilometern der Deutschen Kraftfahrzeuge: Gesamtfahrleistung und Durchschnittliche Fahrleistung Nach Fahrzeugarten in 2018. Available online: https://www.kba.de/DE/Statistik/Kraftverkehr/VerkehrKilometer/verkehr_in_kilometern_node.html (accessed on 28 January 2019).
  20. BCG The Boston Consulting Group the Electric Car Tipping Point. 2018. Available online: https://www.bcg.com/de-de/publications/2018/electric-car-tipping-point.aspx (accessed on 1 April 2021).
  21. Jörg, A.; Balzer, C.; Joe dicke, A.; Schbla, U.; Willbrand, K.; Rommerskirchen, S.; Anders, G.N.; Verkehrsökonom, A.A.M.M.S.; Ehrenteaut, O.; Lisa Krämer, V. PKW-Szenarien bis 2040: Fakten, Trends und Perspektiven für Auto-Mobilität; Pringer Gabler Springer Fachmedien: Hamburg, Germany, 2014. [Google Scholar]
  22. Hacker, F.; Blank, R. eMobil 2050: Szenarien Zum Möglichen Beitrag Des Elektrischen Verkehrs Zum Langfristigen Klimaschutz. 2014. Available online: https://www.oeko.de/publikationen/p-details/emobil-2050-szenarien-zum-moeglichen-beitrag-des-elektrischen-verkehrs-zum-langfristigen-klimaschut (accessed on 17 April 2021).
  23. Nationale Plattform Elektromobilität (NPE)Fortschrittsbericht 2018-Markthochlaufphase. 2018. Available online: https://www.acatech.de/publikation/fortschrittsbericht-2018-markthochlaufphase/#:~:text=Mit%20dem%20vorliegenden%20Bericht%20zieht,Entwicklung%20bis%20zum%20Jahr%202025. (accessed on 22 April 2021).
  24. FGH e.V.Metastudie Forschungsüberblick Netzintegration Elektromobilität. 2018. Available online: https://www.vde.com/resource/blob/1790048/d86a2bb62b27caa2345ff810c4d9c816/e-mobilitaet-downloadstudie-data.pdf (accessed on 3 April 2021).
  25. Nationale Plattform ElektromobilitätLadeinfrastruktur für Elektrofahrzeuge in Deutschland: Statusbericht und Handlungsempfehlungen 2015. AG 3-Ladeinfrastruktur und Netzintegration. 2015. Available online: https://www.bdew.de/media/documents/20151127_Statusbericht-LIS.pdf (accessed on 1 May 2021).
  26. Bundesministerium für Verkehr und Digitale InfrastrukturVierter Aufruf zur Antragseinreichung vom 19.08.2019 gemäß der Förderrichtlinie Ladeinfrastruktur für Elektrofahrzeuge in Deutschland des Bundesministeriums für Verkehr und Digitale Infrastruktur vom 13.02.2017. 2019. Available online: https://www.bmvi.de/SharedDocs/DE/Anlage/G/vierter-aufruf-antragseinreichung-foerderrichtlinie-ladeinfrastruktur-e-fahrzeuge.html (accessed on 21 April 2021).
  27. ETSAP und IEA, Energy Technology Systems Analysis Programme (ETSAP)Contributing to the Kyoto Protocol: Summary of Annex VII (1999–2002). 2002. Available online: https://iea-etsap.org/reports/annex7.html (accessed on 2 April 2021).
  28. Loulou, R.; Lehtilä, A.; Kanudia, A.; Remme, U.; Goldstein, G. Documentation for the TIMES Model Part II. Energy Technol. Syst. Anal. Programme (ETSAP). 2016. Available online: https://iea-etsap.org/docs/Documentation_for_the_TIMES_Model-Part-II_July-2016.pdf (accessed on 5 April 2021).
  29. Remme, U. Zukünftige Rolle Erneuerbarer Energien in Deutschland: Sensitivitätsanalysen Mit Einem Linearen Optimierungsmodell. Ph.D. Thesis, University of Stuttgart, Stuttgart, Germany, 2006. [Google Scholar] [CrossRef]
  30. Fraunhofer-Institut für Bauphysik Entwurf Masterplan 100% Klimaschutz der Landeshauptstadt Stuttgart. 2017. Available online: https://www.stuttgart.de/medien/ibs/Entwurf-Masterplan-100-Klimaschutz.pdf (accessed on 5 April 2021).
  31. Mallig, N.; Kagerbauer, M.; Vortisch, P. mobiTopp-A Modular Agent-based Travel Demand Modelling Framework. Procedia Comput. Sci. 2013, 19, 854–859. [Google Scholar] [CrossRef] [Green Version]
  32. Weiss, C.; Heilig, M.; Mallig, N. Assessing the effects of a growing electric vehicle fleet using a microscopic travel demand model. Eur. J. Transp. Infrastruct. Res. EJTIR 2017, 17, 3. [Google Scholar]
  33. Zimmerman, R.; Murillo-Sánchez, C.; Thomas, R. MATPOWER: Steady-State Operations, Planning and Analysis Tools for Power Systems Research and Education. IEEE Trans. Power Syst. 2011, 26, 12–19. [Google Scholar] [CrossRef] [Green Version]
  34. Infas Institut für Angewandte Sozialwissenschaft GmbH, Deutsches Zentrum für Luft-Und Raumfahrt e.V. Mobilität in Deutschland 2008: Ergebnisbericht. Struktur-Aufkommen-Emissionen-Trends, Bonn und Berlin. 2010. Available online: http://www.mobilitaet-in-deutschland.de/mid2008-publikationen.html (accessed on 4 February 2019).
  35. Liebhart, J. Simulation Akteursspezifischer, Zeitlich Hochaufgelöster Mobilitätsganglinien zur Analyse des Einflusses von Elektromobilität auf Energiesystemmodelle; Institut für Energiewirtschaft und Rationelle Energieanwendung Universität Stuttgart: Stuttgart, Germany, 2017. [Google Scholar]
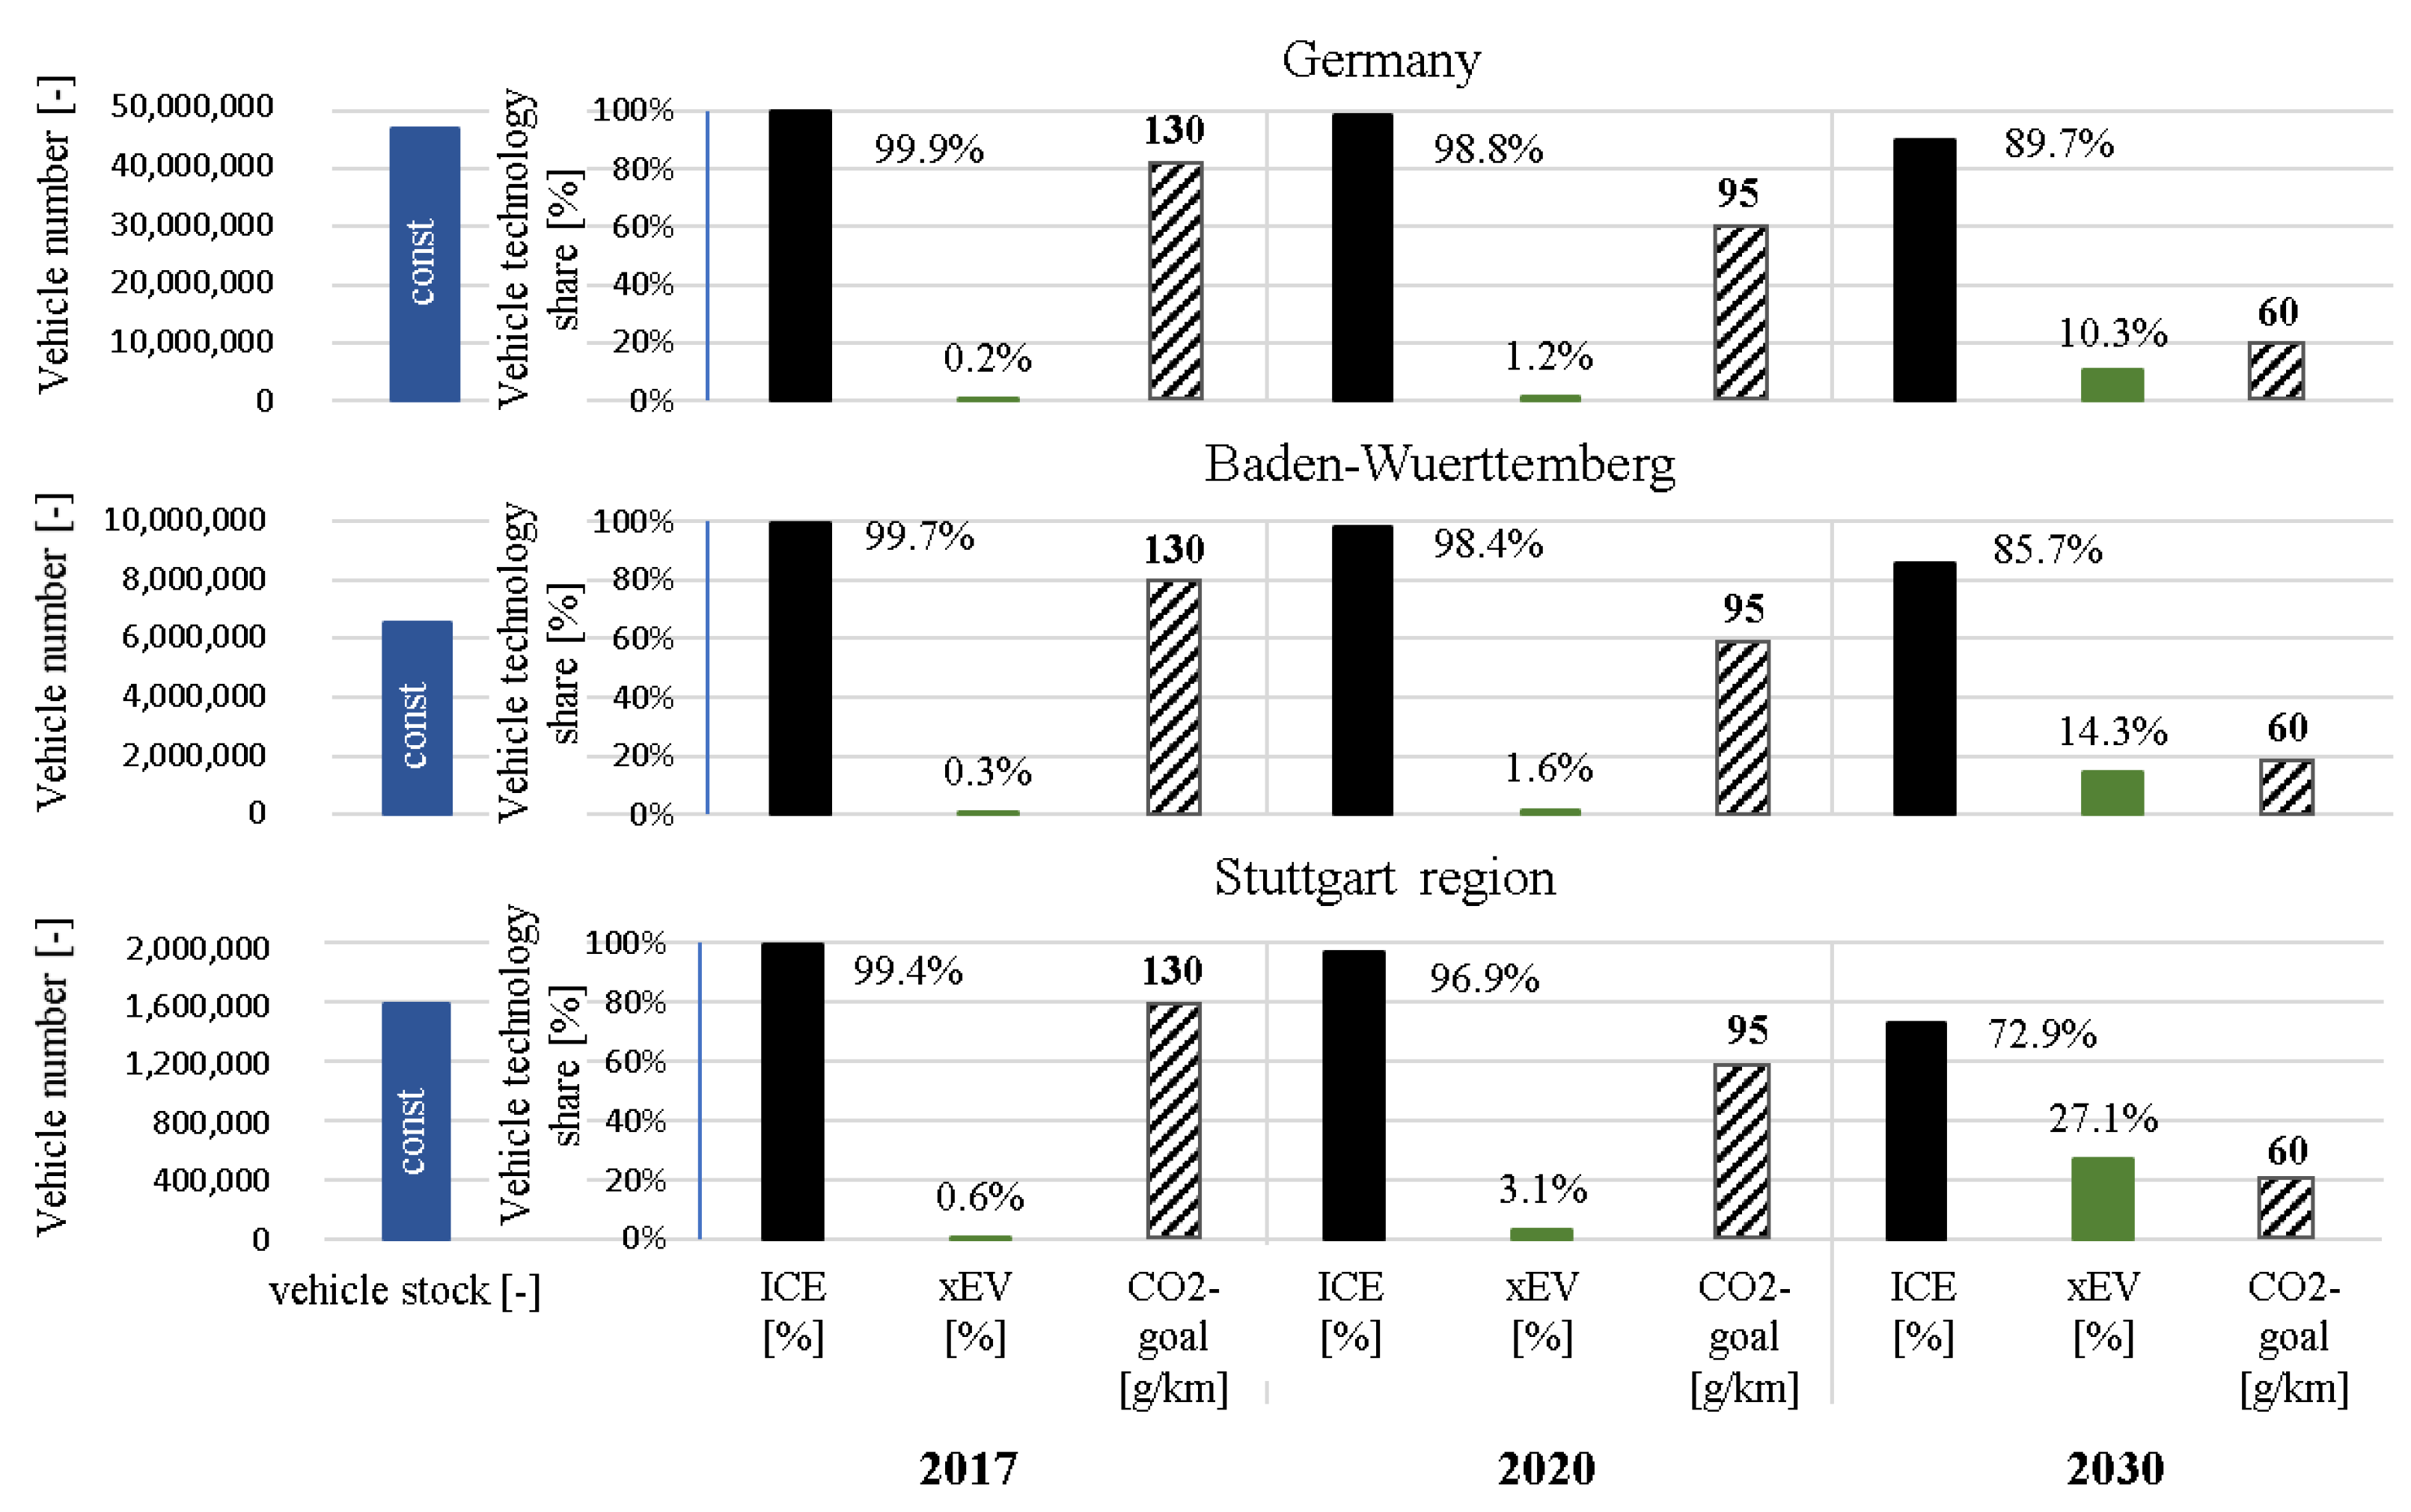
Figure 1. Total annual mileage in Germany [19].
Wevj 12 00078 g001
Figure 2. Forecast scenarios for the vehicle fleet electrification in Germany.
Wevj 12 00078 g002
Figure 3. Electricity demand shares by sector in different scenarios.
Wevj 12 00078 g003
Figure 4. Discounted system cost difference due to increased electromobility (cumulated over 5-year periods), KLIMPLUS and KLIMPLUSLOW scenarios in comparison.
Wevj 12 00078 g004
Figure 5. Transformer utilization for the different scenarios.
Wevj 12 00078 g005
Figure 6. Schematic structure of electrical distribution network.
Wevj 12 00078 g006
Figure 7. Temporal distribution of the energy charged during the modelled week (30% BEV, new charging points = 50 kW, public charging is possible everywhere).
Wevj 12 00078 g007
Figure 8. Analysis of the low-voltage grid including the additional demand from the 30% scenario.
Wevj 12 00078 g008
Table 1. Development of European fleet emission limit values in road traffic [14].
Vehicle Categories202020252030
passenger car100% (95 g/km)−15% (81 g/km)−37.5% (59 g/km)
light-duty vehicles100% (147 g/km)−15% (125 g/km)−31% (101 g/km)
heavy-duty vehicles-−15%−30%
Table 2. Charging station infrastructure costs for electric vehicles based on [24,25].
Cost ItemsSmart Charging BoxAC Charging StationDC Charging Station
charging station121
typical charging power [kW]3.715.750
assumption service life of charging station [a]101010
assumption service life grid connection [a]404040
investment costs station [€]1700550020,000
investment costs [€/kW]459350400
grid connection costs [€]020005000
grid connection costs [€/kW]0127100
current costs [€/a] 5007501500
current costs [€/(a·kW)]1354830
lifetime weighted investment costs total [€/kW]459381425
Table 3. Total investment of public charging points in the Stuttgart area [26].
PowerDistributionNumber of Charging StationsInvestment, €
3.7 kW2%7381.3 million
11–22 kW72%26,58579.8 million
≥50 kW26%9600204.0 million
total--285.0 million
Table 4. Vehicle characteristics used in all simulation runs.
Technical Characteristics Small
(A/B Segment)
Medium
(C/D Segment)
Large Cars
(E Segment)
Distribution of BEV to segments20%55%25%
Range [km]250350550
Consumption [kWh/100 km]121723
Publisher’s Note: MDPI stays neutral with regard to jurisdictional claims in published maps and institutional affiliations.

