Review

The Healthy Gluten-Free Diet: Practical Tips to Prevent Metabolic Disorders and Nutritional Deficiencies in Celiac Patients

by
Emanuele Rinninella
1,*,
Marco Cintoni
2,
Pauline Raoul
3,
Silvia Triarico
4,
Tommaso Dionisi
5,
Giovanni Battista Gasbarrini
3,
Antonio Gasbarrini
3,6 and
Maria Cristina Mele
3,7
1
UOC di Nutrizione Clinica, Dipartimento di Scienze Mediche e Chirurgiche, Fondazione Policlinico Universitario A. Gemelli IRCCS, Largo A. Gemelli 8, 00168 Rome, Italy
2
Scuola di Specializzazione in Scienza dell’Alimentazione, Università di Roma Tor Vergata, Via Montpellier 1, 00133 Rome, Italy
3
Dipartimento di Medicina e Chirurgia Traslazionale, Università Cattolica Del Sacro Cuore, Largo F. Vito 1, 00168 Rome, Italy
4
UOSD di Oncologia Pediatrica, Dipartimento di Scienze della Salute della Donna, del Bambino e di Sanità Pubblica, Fondazione Policlinico Universitario A. Gemelli IRCCS, Largo A. Gemelli 8, 00168 Rome, Italy
5
Scuola di Specializzazione in Medicina Interna, Università Cattolica Del Sacro Cuore, Largo F. Vito 1, 00168 Rome, Italy
6
UOC di Medicina Interna e Gastroenterologia, Dipartimento di Scienze Mediche e Chirurgiche, Fondazione Policlinico Universitario A. Gemelli IRCCS, Largo A. Gemelli 8, 00168 Rome, Italy
7
UOSD di Nutrizione Avanzata in Oncologia, Dipartimento di Scienze Mediche e Chirurgiche, Fondazione Policlinico Universitario A. Gemelli IRCCS, Largo A. Gemelli 8, 00168 Rome, Italy
*
Author to whom correspondence should be addressed.
Gastroenterol. Insights 2021, 12(2), 166-182; https://0-doi-org.brum.beds.ac.uk/10.3390/gastroent12020015
Submission received: 3 March 2021 / Revised: 22 March 2021 / Accepted: 26 March 2021 / Published: 1 April 2021
(This article belongs to the Special Issue Nutrition and Gastrointestinal Diseases)

Abstract

:
The gluten-free diet (GFD) is the cornerstone treatment for coeliac disease (CD). However, a healthy GFD is more complex than the only exclusion of gluten-containing foods. Most celiac patients do not receive nutritional advice and tend to consume industrial gluten-free products (GFPs), which often lack fiber, vitamins, and other micronutrients while being rich in saturated fats and refined sugars. This review focuses on the main potential metabolic disorders and nutritional deficiencies in CD patients at diagnosis and dissects the main nutritional and metabolic issues due to a non-balanced GFD. Nutritional tips to achieve an adequate dietary approach in CD are provided. We also compared the main nutritional components of naturally gluten-free cereals (including pseudocereals) to give an exhaustive overview of the possible healthy alternatives to processed GFPs. Clinicians and dietitians should be systematically involved in the diagnosis of CD to monitor the appropriateness of GFD and the patient’s nutritional status over time.

1. Introduction

Celiac disease (CD) is a chronic autoimmune disorder leading to nutrients’ malabsorption due to villous abnormalities in the small intestine caused by the ingestion of gluten-containing foods in genetically predisposed individuals [1]. Gluten is a complex protein made of glutenin and prolamin, found in wheat, oat, and barley. In the 1960s, the gluten-free diet (GFD) was recognized as a potential treatment, restoring the normal intestinal mucosa in coeliac patients [2]. To date, the only treatment for diagnosed CD is a strict adherence to GFD to manage symptoms and to promote intestinal healing. GFD consists of the elimination of the storage proteins found in wheat, rye, and barley, and some related grains, such as kamut and triticale.
Although CD may lead to various nutritional deficiencies in macro-and micronutrients, it is today diagnosed both in underweight and overweight patients [2]. At diagnosis, celiac patients often present an imbalance of micronutrient uptake and micronutrient deficiencies [3]. Moreover, the consumption of ultra-processed gluten-free products (GFPs) and a low fiber intake often characterizing GFD can exacerbate these nutritional imbalances, potentially raising the risk of metabolic diseases and chronic micronutrient deficiencies. Indeed, GFPs are often low in B vitamins, vitamin D, iron, zinc, magnesium, and fiber. Furthermore, paradoxically, although poor nutritional values of some GFPs, in many countries, the cost of such products is largely borne by the state promoting the daily GFPs’ consumption by CD patients. Gluten-containing foods are mainly substituted by naturally alternative cereals, such as rice, corn, and potatoes, presenting a higher glycemic index, which may lead to glucose intolerance increasing the risk of the development of metabolic disorders [4].
In this context, correct nutritional monitoring of the celiac patients in GFD and a new food approach are required. This review focuses on the main possible metabolic disorders and nutritional deficiencies in CD patients at diagnosis and after initiating GFD. We also propose nutritional tips for a balanced and healthy diet for CD patients to prevent metabolic disorders and micronutrient deficiencies, focusing on a Mediterranean diet based on GFD and pseudocereals consumption.

2. Impact of GFD on Nutritional Status in CD Patients

Several studies [5,6,7] analyzing large populations of Irish, North American, and Italian CD patients highlighted the risk of overweight and obesity among CD patients following GFD. Barone et al. showed that, at diagnosis, 82% of celiac Italian adult patients had a normal or body mass index (BMI) > 25 kg/m2, and only 10% were underweight [7]. After initiating GFD, BMI increased [7]. A recent meta-analysis confirmed these results assessing a statistically significant increase in BMI of celiac patients before and after initiating GFD (standard mean difference (SMD) 0.26; 95% confidence interval (CI) 0.17, 0.35 p < 0.001) [8]. Tortora et al. [9] went further, focusing on the prevalence of metabolic syndrome–defined as a combination of diabetes, high blood pressure, and obesity-in CD patients on a free diet and after GFD. Moreover, newly diagnosed patients with CD and normal BMI or overweight are likely to increase BMI one year after starting GFD. A recent study found that in 44 Asian patients with CD, metabolic syndrome was present in 11.4% of patients at diagnosis and more than 18% after one year of GFD [10]. After a median duration of 4 years of GFD, 26.3% of 130 CD patients developed a metabolic syndrome [10]. Conversely, few studies showed beneficial effects of GFD on BMI in celiac patients. A North American study demonstrated, after 2.8 years of GFD, a reduction in BMI in 16.7% of overweight CD patients and in 5.9% of obese CD patients, and an increase in BMI in 47.5% of underweight CD patients [11]. Bardella et al. demonstrated that the body weight and BMI of CD women were significantly lower than healthy controls [12]. This could be explained by the lower total energy intake found in the CD patients than healthy subjects [12].
In children, a recent study showed that CD patients following GFD presented a significantly higher increase in weight and BMI compared to controls. Więch et al. showed that after a minimum of one year of a GFD, CD children showed significantly higher values of fat-free mass and muscle mass [13]. The prevalence of obese CD patients at diagnosis ranges from 0% to 6%, whereas, after initiating GFD, it varies from 0% to 8.8%. On the other hand, Lionetti et al. enrolling 120 children with CD and 100 healthy children both on a GFD for ≥2 years, showed that the nutritional status of CD children did not differ from healthy children [14]. However, a higher intake of fat and a lower intake of fiber was reported in the diet of CD children compared with controls [13]. Consequently, an in-depth nutritional status assessment seems to be necessary for children with CD. As regards celiac adolescents, after one year of GFD, body weight, BMI, fat-free mass, bone mineral density significantly decreased compared with controls [15].
To sum up, the impact of GFD on body weight and body composition in adult CD patients remains debated, and further studies are needed. However, in children and adolescents, we understand that a suitable nutritional education program is useful to help them to accept this diet. Indeed, children and adolescents may feel deprived of appetizing products and be tempted by high consumption of commercial gluten-free, highly processed products [16]. GFPs are generally high in fat to improve their presentation and palatability and often have a greater glycemic index and a lower content of folates, iron, and B vitamins than their gluten-containing equivalents [17]. Consequently, their frequent intake may lead to an increased risk of dyslipidemia, overweight, or obesity. In the next paragraph, we sought to highlight possible associations of GFD with potential metabolic disorders and nutritional deficiencies in celiac patients.

3. CD, GFD and Metabolic Disorders

3.1. CD, GFD and Lipid Profile

Newly diagnosed CD children showed elevated levels of total cholesterol and low-density lipoprotein cholesterol (LDL-C) and reduced high-density lipoprotein cholesterol (HDL-C) levels [18]. A recent study compared the lipid profile of 12 untreated CD children with that of 10 control patients showing a decreased level of serum triglycerides levels and very-low-density lipoprotein (VLDL) and an increased level of LDL-C in CD children compared with controls [19]. These results could be explained by fat malabsorption characterizing untreated CD patients. Recently, in an observational study of 30 CD children and adolescents having available lipid profiles before and after initiation of GFD, total cholesterol levels remained unchanged, while triglycerides decreased, and HDL-C increased [20].
In adults, a recent systematic review [21] found three studies assessing lipid levels before and after the initiation of a GFD [9,22,23] and one study reporting the prevalence of dyslipidemia in celiac patients following a GFD [24]. In the first one (a prospective study), no significant changes were found in terms of levels of triglycerides in patients following one-year GFD [9]. On the other hand, the second study found increased serum triglyceride levels, a higher total cholesterol level, and a decrease in the HDL level in CD patients following a GFD for 4.7 years [22]. Finally, a cohort study of 185 patients with CD retrospectively showed a significantly increased cholesterol level and a significantly decreased HDL level after the initiation of GFD after more than one year of GFD; however, triglycerides levels did not statistically differ [23]. These findings demonstrated a worsening of lipid profile in CD patients following GFD. However, a cross-sectional study showed that a lower prevalence of dyslipidemia in CD patients compared with the control group [24].

3.2. CD, GFD, Glucose Intolerance and Type 2 Diabetes (T2D)

To our knowledge, the prevalence of T2D in CD patients on a GFD [24,25] and the glycemic level before and after the start of a GFD [9,22] were reported, respectively, in two studies.
A study comparing 840 CD patients following GFD for approximately 84 months and 840 healthy controls found a lower prevalence of T2D and a lower BMI in the celiac group compared with controls [24]. These findings could be attributable to the alteration of pancreatic function, a lower nutrient absorption, and impairment of gastrointestinal, endocrine functions. Indeed, tissue transglutaminase drives inflammation in CD, impairing the expression of peroxisome proliferator-activated receptor γ, which could, in turn, be implicated in a decreased risk of T2D [24]. In another large observational cohort study of CD patients and controls, the prevalence of T2D did not significantly differ [25].
On the other hand, regarding glycemic levels, in a cohort observational study, including 98 CD patients, higher blood glucose levels were reported after initiating GFD compared with diagnosis [9]. Another study confirmed these results showing a significantly increased fasting blood glucose level in CD patients after the initiation of GFD compared with those at CD diagnosis [22].
Thus, although the results of currently available studies remain controversial, overweight, obesity, dyslipidemia, and increase in glycemic levels intolerance could be possible consequences of GFD in CD patients, leading to potential risks of metabolic disease development.

4. CD, GFD, and Nutritional Deficiencies

4.1. At Diagnosis

The most common nutritional inadequacies in diagnosed CD patients are deficiencies in iron, calcium, zinc, vitamin B12, vitamin D, and folate. Indeed, the proximal small bowel is an important site for absorption of nutrients; in untreated CD, there is a loss of brush border proteins and enzymes needed in the absorption of micronutrients [26].
Various studies showed a prevalence of folate deficiency in newly diagnosed CD patients ranging from 18% to 90%, depending on the methods of measurement of folates [27,28]. In particular, a negative association was found between erythrocyte folate concentrations and the grade of villous atrophy in adults with symptomatic CD [29]. Low folate concentrations may be attributable to vitamin B12-deficiency since folate requires vitamin B12 for its activation. Additionally, iron deficiencies are also found in one-third of the CD patients at diagnosis [30]. Calcium deficiency is one of the common nutritional deficiencies in newly diagnosed CD patients leading to potential subsequent metabolic bone diseases. A study enrolling 86 consecutive newly diagnosed CD patients found that 34% of patients had a normal bone mineral density, 40% osteopenia, and 26% osteoporosis [31]. Several studies showed that zinc deficiency might also occur in patients with CD because of the damaged intestinal epithelial cell membrane, such as a cumulative loss of insoluble zinc complexes with fat and phosphate, exudation of zinc protein complexes into the intestinal lumen, and massive loss of intestinal secretions or impaired zinc absorption [32]. In children newly CD-diagnosed, vitamin D, zinc, and iron deficiencies are frequently observed at the time of diagnosis [33]. The reduced growth rate in CD children may be related, in part, to zinc deficiency [34]. In CD adults, Jameson and colleagues also reported an association between zinc, iron, copper, folate, and vitamin B-12 deficiencies and the severity of villous atrophy: the more pronounced is the lesion, the lower are the plasmatic levels [35]. Although B-vitamins are absorbed in the proximal small bowel, which is the most prominent site affected in CD patients [36], recent studies did not report vitamin B2 and B6 deficiencies in untreated CD-patients [27,37]. On the other hand, vitamin B12 deficiency is found in 8–41% of CD patients at diagnosis [36,38], as well as vitamins A, D, E, and K [36]. These deficiencies may be related to small intestinal bacterial overgrowth, which often occurs due to the small intestinal injury [39].
Thus, newly diagnosed celiac patients often present several micronutrient deficiencies, suggesting that specific nutritional recommendations should be provided to these patients in terms of the quality of the nutrients.

4.2. In Patients Following GFD

Many pediatric studies have demonstrated that intakes of folate, magnesium, zinc, and selenium may be lower on a GFD than healthy controls [40,41,42]. A recent study, including 101 children, demonstrated that celiac children had lower iron intake than controls, especially at the initiation of GFD [43]. Healthy controls showed a higher intake of folate, iron, magnesium, and selenium than that of children CD-GFD >6 months and a higher intake of folate and iron than that of children initiating GFD <6 months. In contrast, another study found that iron and calcium intakes were higher in CD children than controls [44]. Other evidence highlights that celiac children and adolescents tend to follow a high-lipid, high-protein, low fiber diet compared with healthy subjects [45]. These findings suggest that the diet of celiac children may be potentially less balanced than that of the controls, thus deserving nutritional advice.
In CD adults, various studies highlighted that the GFD treatment does not fill up mineral and vitamin deficiencies reported at diagnosis, especially iron deficiencies [46,47,48,49]. Calcium deficiencies were also reported [31,46,48,49,50] in CD patients adhering to a GFD. The intakes of selenium, zinc, and magnesium were found to be lower in CD subjects than in controls [44,49]. A prospective Australian study showed that more than one in 10 of both newly diagnosed and experienced CD women (adherent to a GFD ≥ 2 years) had inadequate thiamin, folate, vitamin A, magnesium, calcium, and iron intakes [49]. Inadequate intake did not relate to the nutrient density of the GFD. The frequency of inadequacies was similar pre-and post-diagnosis, except for thiamin and vitamin A, where inadequacies were more common after GFD implementation.
Micronutrient deficiencies in celiac patients following GFD are common and may be associated with habitual poor food choices in addition to inherent deficiencies in the GFD. Dietary education by dietitians is necessary for the management of CD patients, and an adequate micronutrient intake could be achieved through adequate micronutrient supplementation.

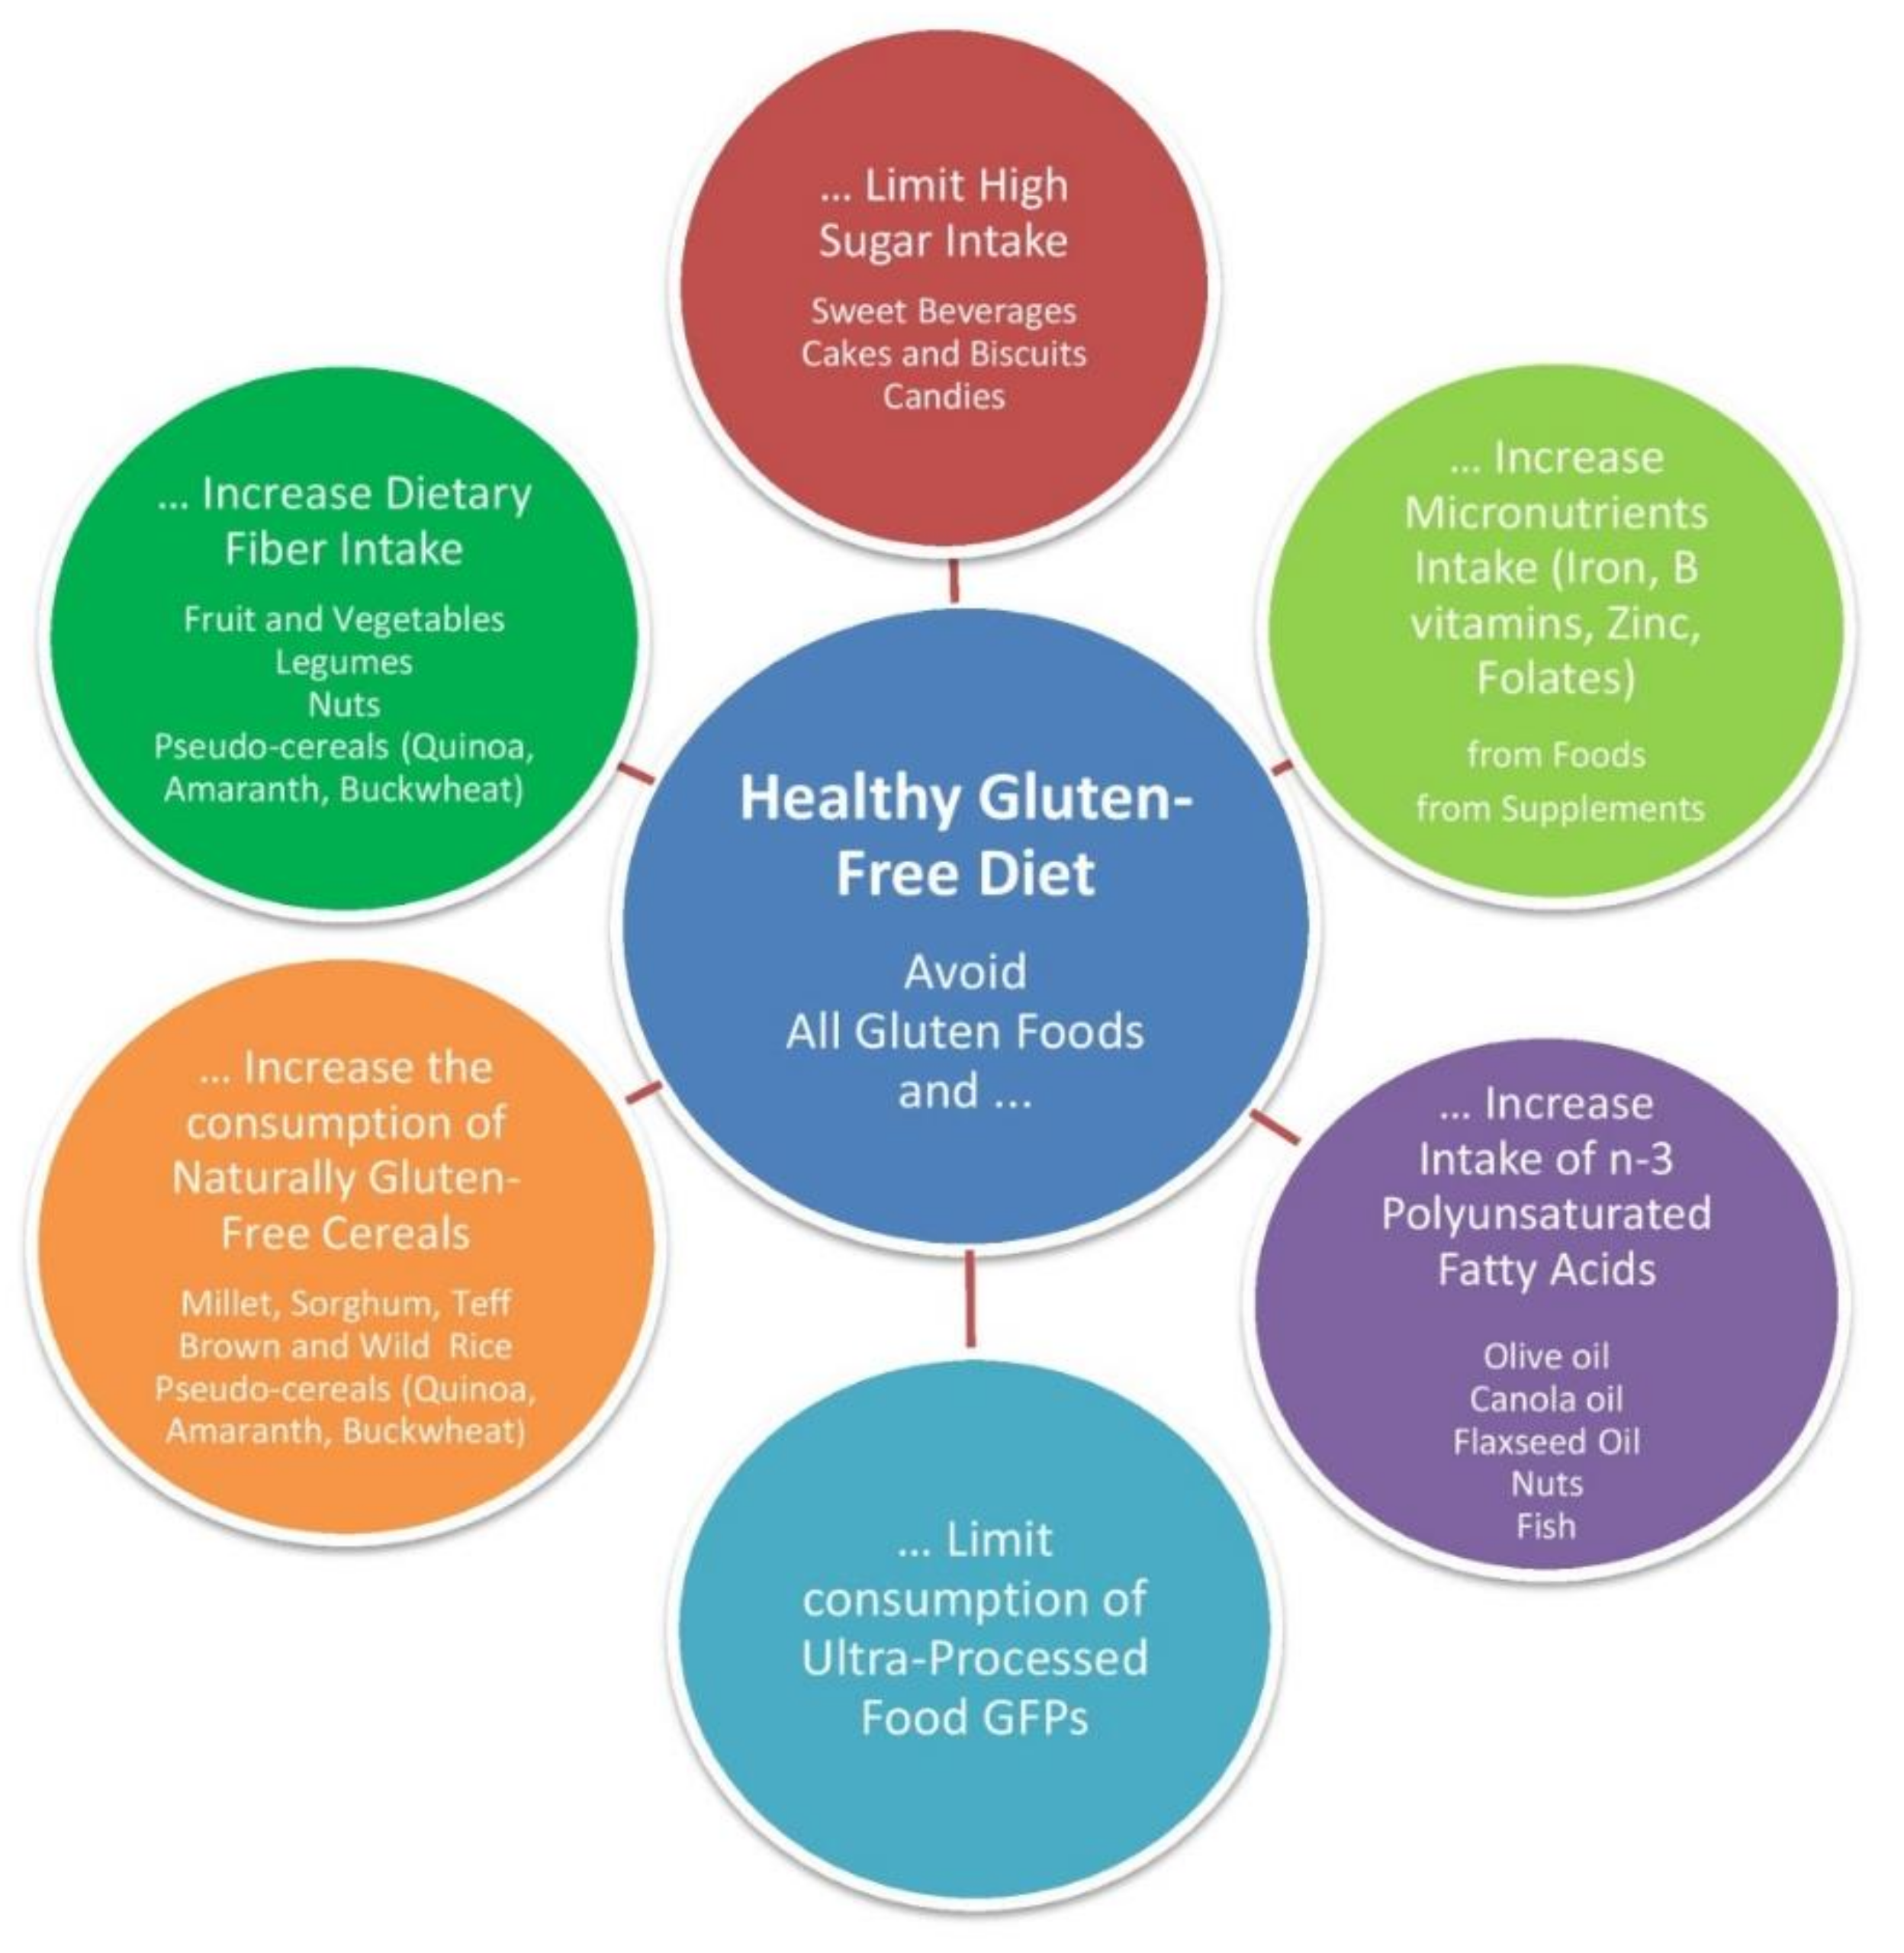
5. Nutritional Tips for an Adequate and Balanced Diet

All evidence suggests that avoidance of gluten cannot be the unique focus of a GFD, and an adequate and balanced diet should be considered by physicians and provided by experienced dietitians after a nutritional assessment. We highlighted in this part several nutritional tips for CD patients (Figure 1).

5.1. Limit Sugar Consumption

Several studies have reported metabolic alterations induced by the consumption of sugar [51,52], and numerous studies have concluded that it is positively associated with many components of metabolic syndrome [53,54]. Consumption of sugar promotes body weight and fat gain, which leads to dysregulation of lipid and carbohydrate metabolism, which increases in risk for metabolic disease [55].
Various cohort studies reported a higher intake of sugars in CD than in healthy controls [7,56]. This could be explained that commonly, processed GFPs contain more added sugar than wheat-based foods as GFPs ‘manufacturers try to obtain the same texture and “mouth feel” as gluten-contained products. In 2018, a United Kingdom (UK) study compared the nutritional composition of GF foods available in the UK (n = 679) with regular foods (n = 1045) [57]. GF foods contain more sugar (and high and medium-fat, saturated fat, and salt) than regular foods, although this was not universally consistent. In addition, GF bread and flour products contained high sugar, and GF crackers contained high-fat and sugar compared to regular foods [57]. A significantly higher total sugar level (8.1 g/100 g) was also found in GF cake mixes and cakes rather than wheat-contained cakes, while pasta has similar sugar content [58]. Although manufacturers have considerably improved the nutritional profiles of GFPs, CD patients and parents of CD children need nutritional education to limit sugar consumption contained in industrial products, such as GFPs.

5.2. Increase Dietary Fiber Intake

Dietary fibers are the edible parts of plants or analogous carbohydrates that are resistant to digestion and absorption in the small intestine with complete or partial fermentation in the large intestine [59]. Dietary fiber, including polysaccharides, oligosaccharides, lignin, and associated plant substances, is mainly found in whole grains, fruits, vegetables, nuts, seeds, and legumes. Increasing total dietary fiber reduces body fat [60], improves glycemic response [61], as well as triglycerides and LDL profiles [62,63]. Furthermore, a recent meta-analysis suggested an inverse association between dietary fiber intake and risk of metabolic syndrome [64].
GFD could reduce the intake of complex carbohydrates and fibers [9,46]. A study evaluating American adult celiac patients following GFD found that less than half of women consumed the recommended amount of dietary fiber. In addition, a German study on adult celiac patients assessed that only a fraction of the overall patients consumes the recommended reference values for fiber [47]. This inadequate fiber intake could be explained by a decreased intake of grain products with the consumption of many GFPs containing refined floors with low fiber content [65,66]. While common GFPs have low fiber content, recently, food industries developed GFPs from alternative gluten-free grains and pseudo-grains like quinoa, sorghum, buckwheat, and amaranth, having a fiber content equivalent to wheat products. At the same time, CD patients could benefit from the consumption of fiber contained in legumes, fruits, vegetables, and gluten-free cereals with a high content of soluble fiber, such as millet, wild and brown rice, as well as pseudocereals.

5.3. Increase Polyunsaturated Fatty Acid Intake

The associations between metabolic diseases and dietary fat quality and quantity are well-known. Several studies assessed positive associations between saturated fatty acids (SFAs) intake and increased body weight [67,68]. On the other hand, both positive [68,69] and negative [70] relationships between monounsaturated fatty acids (MUFAs) intake and risk of obesity have been assessed. As regards polyunsaturated fatty acids (PUFAs), inverse [71,72], null [68,73], and positive [68,74] associations have been reported between their consumption and risk of obesity. PUFAs are classified in n-3 fatty acids and n-6 fatty acids. Omega-3 fatty acids hold great promise in the prevention and management of obesity [75]. Furthermore, a randomized controlled trial showed that, unlike the SFA-rich diet, an n-6 PUFA-rich diet was associated with improvements in blood lipids and fasting insulin [76]. More specifically, a low ratio of n-6/omega-3 fatty acids intake may reduce the risk of many of various chronic diseases [77]. Thus, regular consumption of flaxseed, nuts, fish and vegetable oils, such as olive and canola oil, may be useful to deal with obesity and to improve the lipid profile. The study by Ohlund et al., enrolling Swedish celiac children, observed a relatively high mean intake of SFAs and a low intake PUFAs (respectively 14% and less than 4% of the total calorie intake) [44]. Bardella et al. [12] studied the nutritional intake of 71 patients following a strict GFD and 142 healthy control subjects matched by sex and age. The diet of the CD patients was unbalanced, with a higher percentage of energy as fat and a lower percentage of energy as carbohydrates than healthy controls [12]. Another study [46] examined the dietary intake of 47 adolescents with CD compared with 47 healthy age-matched control subjects. Patients with CD and control subjects both consumed a normocaloric diet; however, lipid and protein consumption was higher and that of carbohydrates lower in CD patients compared with controls [46].
As regards fatty lipid profiles of GFPs, a recent study evaluated the composition of 35 bakery GFPs [78]. In such products, the main lipid constituents were MUFAs (57%), followed by SFAs (30%) and PUFAs (13%) [78]. Less than half of the 35 GFPs provided adequate energy intake, while in 11 samples, SFAs were found to supply more energy than that recommended by the European Food Safety Authority (EFSA). Moreover, high-value GFPs manufacturers also use palm oils, whereas the local producers generally contain the finest raw materials, such as olive oil [78]. Another study evaluated the quality of the lipid fraction of gluten-free biscuits [79]. The fatty fraction of gluten-free biscuits, present as mean amounts of 15% of total energy, indicated a high content of triacylglycerol oligopolymers (0.46%) and oxidized triacylglycerols (0.80%), as well as, in some cases, high levels of oleic acid trans isomers (reaching of 9.39%). All these substances have been shown to negatively impact health [80]. Since the diet of celiac patients often contains a high consumption of packaged GFPs (such as snacks, bakery products, and biscuits), this should be seriously considered.
All these findings raise the question of an appropriate quantity and quality intake of lipids in celiac patients following GFD to maintain a healthy blood lipid profile and prevent metabolic diseases.

5.4. Limit Consumption of Ultra-Processed Food GFPs

Ultra-processed GFPs are commonly used among celiac patients as tasty alternatives to gluten-containing bakery products. Even if recommended as safe for CD, processed GFPs are of lower quality and poorer nutritional value compared with the gluten-containing counterparts.
GFPs are often based on corn starch–representing the main ingredient-, potato starch or rice flour, either enriched with milk solids, soy protein, eggs, or lupine proteins. Although the soluble fiber content is considered high, the estimated glycemic index of the gluten-free bread varied between 83.3 and 96, highlighting that these products have a high glycemic index [81]. The nutritional composition of the 206 GFPs most consumed in Spain was compared with that of 289 equivalent gluten-containing foods. The same study also compared the diet GFPs-based with the same diet, including equivalent gluten-based products in 58 adult CD patients [82]. Significant higher calorie, salt, and cholesterol contents and lower fiber content have been found in GFPs compared with gluten-containing foodstuffs. This evidence was recently confirmed by Melini et al., who recently reviewed the nutritional profile of GFPs currently available on the market [83]. Compared with gluten-containing products, GFPs have low protein content and higher fat and salt content even if more adequate levels of dietary fiber and sugar than in the past have been reported. However, GFPs are generally non-fortified and do not contain the same level of micronutrients as gluten-containing bread.
Nestares et al. studied the impact of the substitution of ultra-processed GFPs with naturally gluten-containing products in children with CD [84]. CD children with the lowest consumption of ultra-processed food (below the 50% of daily energy intake) had healthier redox and inflammatory profiles (lower macrophage inflammatory protein-1α) compared to the group with the highest consumption of ultra-processed food regardless of the time on a GFD.
An interesting study evaluated the starch digestibility of several products in vitro, postprandial glucose levels, and insulin response in healthy subjects after administration of three GFPs and traditional bread [85]. The area under the curve (AUC) of digested starch of gluten-free bread was significantly higher than that of the traditional counterpart. Moreover, the glycemic index for gluten-free pasta was similar to the glycemic index for gluten-free bread, while the glycemic index for quinoa was significantly lower than that of gluten-free pasta and bread. These results indicate that the different formulations and the food processing procedures used by manufacturers may affect the rate of starch digestion both in vitro and in vivo.
Hence, all these findings showed that the consumption of GFPs must be nutritionally monitored. Celiac patients, especially children, and adolescents should be educated to choose products with a good nutritional profile. This is noteworthy also for non-celiac people, who often follow a diet, including GFPs, for the popular belief that those are healthier than gluten-based products.
Although the formulations of industrial products are improving, it remains advisable to limit the consumption of GFPs in favor of naturally gluten-free foods.

5.5. Increase the Consumption of Naturally Gluten-Free Cereals, Including Pseudocereals

In the last years, much attention in gluten-free cereals is increasing. We evaluated the gluten-free cereals and pseudocereal grains in terms of their protein, fat, total starch, dietary fiber, ash, and mineral content, as well as their fatty acid composition (Table 1). Data were retrieved from the National Nutrient Database for Standard Reference Legacy Release (SR legacy) data (https://fdc.nal.usda.gov/download-datasets.html; accessed on 21 February 2021). SR legacy provides nutrient and food component values that are derived from analyses, calculations, and the published literature. In the next paragraphs, we will review the main characteristics of the most available naturally gluten-free cereals.

5.5.1. Rice

There are different types of rice grains that vary considerably from each other, such as milled rice, brown and wild rice. Milled rice (or white rice) is one of the principal cereals of the gluten-free diet, as a component of cakes, biscuits, and bread. Milled rice has its husk, bran, and germ removed, while brown rice consists of endosperm, the embryo, and the bran layers. Compared with milled rice, brown rice contains relatively higher amounts of dietary fiber, unsaturated lipids, micronutrients (calcium, phosphorus, magnesium, potassium). This is because the embryo and the bran layers present in brown rice are rich in lipids, proteins, dietary fiber, and other components [86,87]. Several cohort studies have shown that brown rice consumption reduces the risk of developing metabolic diseases, such as obesity and T2D [88,89]. On the other hand, milled rice has higher glycemic index values than whole grains, such as brown rice [90]. A recent meta-analysis [91] found that high white rice consumption could be associated with an increased risk of metabolic syndrome development, particularly in Eastern Asia.
Wild rice also contains more proteins, dietary fiber, starch, vitamins (thiamine, vitamin B3), and minerals (phosphorous, magnesium, potassium, zinc, iron, calcium) than milled rice. Moreover, wild rice is a rich source of phenolic compounds, flavonoids, and phytosterols [92]. Milled rice is composed of very low amounts of dietary fiber, while wild rice is a rich source of resistant starch and dietary fiber [92]. Resistant starch is considered to provide health benefits as it cannot be digested and absorbed in the small intestine reaching the colon, where it is slowly fermented by microorganisms to produce short-chain fatty acids [93]. Compared with milled rice, the nutritional profile of wild rice is associated with improved lipid effects [94,95] and higher antioxidant effects [96].

5.5.2. Maize

Similar to milled rice, maize (or corn) is one of the main refined cereals consumed in gluten-free diets. The endosperm, the embryo, and the pericarp constitute the caryopses, the nutritive part of the plant.
Maize is mainly composed of carbohydrates representing 75% of its content. The protein content of maize is lower than other gluten-free cereals (6.9 g/100 g). In particular, like milled rice, maize is poor in some essential amino acids, such as lysine and tryptophan [97]. The fiber content is 7%, and the lipid content is almost twice the amount of the fat that milled rice. Maize germ contains a major part of minerals (potassium, magnesium, calcium, iron). However, the concentrated phytate levels in germ delay the bioavailability of calcium and iron [98]. Maize is also rich in vitamins E, thiamin, and niacin, and phytochemicals, such as flavonoids and carotenoids.
Maize is used in a wide range of gluten-free foods, such as breakfast cereals, sweet corn, corn pasta, corn syrup, corn chips. Starch, the predominant component of maize, is digestible after it is cooked or thermally processed using different means to prepare foods and food products [99]. The glycemic index value of maize-based GFPs varies according to the industrial food processes. The glycemic index value of cooked normal and sweet corn kernels could be higher than those of barley and wheat kernels but lower than those of rice kernels. Processed food products made from corn and wheat have comparable glycemic index values, which are lower than those of rice-based products. The differences can be attributed to faster starch digestive rates and larger contents of available starch of rice-based products [99].

5.5.3. Sorghum, Millet and, Teff

Sorghum has relevant nutritional properties, such as a considerable content of dietary fiber (6.6 g/100 g). Moreover, sorghum grain is rich in antioxidants and a good source of vitamins (B vitamins) and minerals (324 mg/100 g potassium, 12 mg/100 g magnesium, 12 g/100 g calcium, 1.6 g/100 g zinc). In addition, most sorghum genotypes are rich in bioactive compounds like phenolic compounds ferulic acid, p-coumaric acid, vanillic acid condensed tannins, and others [100]. Sorghum is a functional food having anticarcinogenic properties and reducing cardiovascular disease, T2D, and obesity [101,102,103]
Millet also represents a good source of protein (10 g/100 g), insoluble dietary fiber, lipids (especially PUFAs, 2.6 g/100 g)) and minerals, such as magnesium, potassium, selenium, folates. Millets were also found to be rich in free and bound phenolic acids. The glycemic index of millets ranged between 42.7 and 58.3, hence making them some valuable low GI food sources for diabetics [104]. The excellent nutritional profile and hypoglycemic properties of millet make it a promising ingredient for the functional gluten-free food industry.
Teff is another interesting gluten-free Ethiopian whole grain with a remarkable nutritional profile with a high content in proteins (13.3 g/100 g), dietary fiber (8 g/100 g), iron (7.63 mg/100 g), potassium (427 mg), zinc (3.63 mg/100 g) and calcium (180 mg/100 g). This cereal should be considered as an excellent alternative to refined gluten-free grains, even if scientific literature on this grain still lacks.
Table 1. Nutrient composition of gluten-free cereals.
Pseudocereals
Milled rice (2)Brown rice (2)Wild rice (2)Maize *Sorghum *Millet *TeffQuinoa (1)Amaranth (1)Buckwheat
Energy (kcal)360362357361359382367368371343
Protein (g)6.617.514.736.938.4310.7513.314.1213.5613.25
Total lipid (fat) (g)0.582.681.083.863.344.252.386.077.023.4
Fatty acids, total saturated (g)0.1580.5360.1560.5430.5280.5360.4490.7061.4590.741
Fatty acids, total monounsaturated (g)0.1810.9710.1591.0180.9430.9240.5891.6131.6851.04
Fatty acids, total polyunsaturated (g)0.1550.9590.6761.7591.4032.6181.0713.2922.7781.039
Fatty acids, total trans (g)NRNRNRNR0.0040.002NRNRNRNR
Carbohydrate (g)79.3476.1774.976.8576.6475.1273.1364.1665.2571.5
Total dietary fiber (g)NR3.46.27.36.63.5876.710
Starch (g)NR8069.3NR6869.8836.5652.2257.2755
Vitamin A (μg)NR010000100
Vitamin B1 (thiamine, mg) 0.070.4130.1150.2466.60.4130.390.360.1160.101
Vitamin B2 (riboflavin, mg)0.0480.0430.2620.08680.0730.270.3180.20.425
Vitamin B3 (niacin, mg)1.64.3086.7331.94.4966.023.3631.520.9237.02
Vitamin B5 (pantothenic acid, mg)1.3421.4931.0740.6580.5391.2670.9420.7721.4571.233
Vitamin B6 (mg)0.1450.5090.3910.370.3250.3720.4820.4870.5910.21
Folates (μg)9095252542NR1848230
Vitamin B12 (mg)00000000 00
Choline (mg)NRNR3521.6NRNR13.170.269.8NR
Vitamin C (mg)00000.80004.20
Vitamin D (μg)0000000000
Vitamin E (alpha-tocopherol, mg)NRNR0.820.420.50.110.082.441.19NR
Sodium (mg)14753412541
Calcium (mg)93321712141804715918
Phosphorus (mg)108264433272278285429457557347
Iron (mg)0.81.81.962.383.143.947.634.577.612.2
Magnesium (mg)3514317793123119184197248231
Potassium (mg)86268427315324224427563508460
Zinc (mg)1.162.025.961.731.632.633.633.12.872.4
Copper (mg)0.110.2770.5240.230.2530.5350.810.590.5251.1
Selenium (μg)NRNR2.815.412.232.74.48.518.78.3
Tryptophan (g)0.0770.0960.1790.0490.1060.170.1390.1670.1810.192
Threonine (g)0.2360.2750.4690.2610.3120.3540.510.4210.5580.506
Isoleucine (g)0.2850.3180.6180.2480.3090.4730.5010.5040.5820.498
Leucine (g)0.5460.621.0180.851.0851.5371.0680.840.8790.832
Lysine (g)0.2390.2860.6290.1950.1740.1440.3760.7660.7470.672
Methionine (g)0.1550.1690.4380.1450.1450.3190.4280.3090.2260.172
Cystine (g)0.1350.0910.1740.1250.1650.1780.2360.2030.1910.229
Phenylalanine (g)0.3530.3870.7210.340.4410.6750.6980.5930.5420.52
Tyrosine (g)0.2210.2810.6220.2820.2250.3260.4580.2670.3290.241
Valine (g)0.4030.440.8580.3510.3870.5840.6860.5940.6790.678
Arginine (g)0.5510.5691.1360.3450.330.370.5171.0911.060.982
Histidine (g)0.1550.190.3840.2110.1670.2570.3010.4070.3890.309
Alanine (g)0.3830.4370.8250.5180.7581.2820.7470.5880.7990.748
Aspartic acid (g)0.6210.7021.4190.4820.5560.710.821.1341.2611.133
Glutamic acid (g)1.2881.5282.5651.31.7412.5993.3491.8652.2592.046
Glycine (g)0.3010.3690.6720.2840.3130.2710.4770.6941.6361.031
Proline (g)0.3110.3520.5190.6050.6510.9110.6640.7730.6980.507
Serine (g)0.3470.3880.7780.3290.4110.7820.6220.5671.1480.685
* whole grains; (1) uncooked; (2) medium-grain and raw. Data based on SR legacy data (https://fdc.nal.usda.gov/download-datasets.html (accessed on 21 February 2021)). SR legacy is the National Nutrient Database for Standard Reference Legacy Release (SR legacy). SR legacy provides nutrient and food component values that are derived from analyses, calculations, and the published literature. SR legacy, released in April 2018, is the final release of these data types.

5.5.4. Pseudocereals

Pseudocereals are rich in starch, fiber, proteins, minerals, vitamins, and phytochemicals, such as polyphenols and phytosterols [105]. The main pseudocereals grains are amaranth, quinoa, and buckwheat. The major components of these grains are carbohydrates, with the content of starch ranging from 52 to 57 g/100 g. Compared with other pseudocereals, buckwheat has a higher content of resistant starch with a higher amylose content [106]. The high levels of resistant starch in buckwheat have been shown to contribute to the modulation of blood glucose and lipid levels, the regulation of gut microbiota, and the reduction of obesity [107]. Pseudocereals are also an excellent source of dietary fiber (10 g/100 g for buckwheat, 6.7 g/100 g for amaranth, and 7 g/100 g for quinoa). Moreover, compared with maize and milled rice, pseudocereals have superior nutritional value mainly related to their higher protein levels (14 g/100 g for quinoa, 13.5 g/100 g for amaranth, and 13.2 g/100 g for buckwheat), making them potential contributors to the protein intake of CD patients. Pseudocereals have an excellent balanced composition of amino acids, with a higher content of lysine, methionine, and cysteine than common cereals, such as sorghum, maize, white rice [108]. Furthermore, quinoa and amaranth have a higher content of lipid than other gluten-free cereals, especially a higher content of PUFAs. As regards minerals, amaranth contains the highest amount of minerals (iron, magnesium, potassium, calcium, phosphorus), followed by quinoa and buckwheat. Minerals’ contents are much higher in pseudocereals than other gluten-free cereals. Remarkable calcium content in amaranth (159 mg/100 g) could help celiac patients to counteract osteopenia and osteoporosis [109], while quinoa seeds contain high levels of folates (184 μg/100 g, often related to malabsorption in CD. Additionally, pseudocereals grains have a high content of bioactive compounds, such as saponins, phenolic compounds, phytosterols, and phytoecdysteroids, whose health benefits are recently becoming recognized [105]. All these results suggest that the pseudocereals, such as amaranth, quinoa, and buckwheat, can represent a healthy alternative to frequently used ingredients in GFPs and cooked preparations of CD patients.

5.6. Increase Micronutrients Intake from Food and Supplements if Necessary

Newly diagnosed CD patients should be systematically tested for micronutrient deficiencies [110]. If CD patients experience deficiencies of minerals (calcium, phosphorus, sodium, potassium, and magnesium) and other micronutrients, such as iron, zinc, and selenium, a nutritional education should be proposed: first, introducing into the eating habits of CD patients pseudocereals, in which the content of these elements can be twice as high as in other cereals. Second, the consumption of dairy products should be recommended since they are nutrient-dense foods containing high-quality protein and a wide range of essential micronutrients, including calcium, zinc and magnesium [111]. However, for patients, who experience lactose intolerance as a symptom of celiac disease, lactose-free dairy products should be more adequate. A regards iron; meat is known to be rich in heme iron, which is better absorbed than non-heme iron found in plant sources [112]. Thus, a regular intake of meat should be recommended for GFD patients. Moreover, in some GFD patients, a healthy GFD with good compliance could be insufficient to fill these deficiencies. Indeed, recent studies evaluating micronutrient circulating levels in long-term GFD patients (over two years) with good compliance demonstrated a deficiency in more than 30% of CD subjects for vitamin B12, 40% for iron, 20% for folic acid, 25% for vitamin D, 40% for zinc, 3.6% and 20% of children for calcium and magnesium [113]. Consequently, as micronutrient intakes in GFD could not be enough, monitoring the blood level of micronutrients to determine the right dosage of supplementation could be a good alternative to start an adequate and personalized supplementation of micronutrients.

6. Conclusions

GFD, the unique treatment for CD, consists of the exclusion of all processed and natural foods containing gluten. This review highlighted that most CD patients have or are at risk of developing metabolic diseases and nutritional deficiencies. Thus, a healthy GFD is more complex than a purely and simply exclusion of gluten-containing foods, and the adherence to a balanced GFD is challenging for CD patients, especially children and adolescents. GFD should be mainly composed of naturally gluten-free foods balanced with macro-and micronutrients. The consumption of olive oil, legumes, unrefined cereals, fruits, and vegetable appears to be essential to prevent metabolic diseases in CD patients, representing the principal aspects of the Mediterranean diet, the recognized healthy dietary pattern. In addition, CD patients should introduce pseudocereals representing a good source of complex carbohydrates, protein, fiber, fatty acids, vitamins, and minerals. Clinicians and dietitians should be systematically involved in the diagnosis of CD to monitor the patient’s nutritional status over time and compliance with GFD.

Author Contributions

Conceptualization, E.R. and G.B.G.; methodology, P.R.; software, M.C.; validation, A.G., G.B.G. and M.C.M.; writing—original draft preparation, P.R.; writing—review and editing, E.R.; visualization, S.T.; supervision, T.D. All authors have read and agreed to the published version of the manuscript.

Funding

This research received no external funding.

Institutional Review Board Statement

Not applicable.

Informed Consent Statement

Not applicable.

Data Availability Statement

Not applicable.

Conflicts of Interest

The authors declare no conflict of interest.

References

  1. Ludvigsson, J.F.; Leffler, D.A.; Bai, J.C.; Biagi, F.; Fasano, A.; Green, P.H.; Hadjivassiliou, M.; Kaukinen, K.; Kelly, C.P.; Leonard, J.N.; et al. The Oslo definitions for coeliac disease and related terms. Gut 2013, 14, 43–52. [Google Scholar] [CrossRef] [PubMed]
  2. Newnham, E.D. Coeliac disease in the 21st century: Paradigm shifts in the modern age. J. Gastroenterol. Hepatol. 2017, 32, 82–85. [Google Scholar] [CrossRef] [PubMed] [Green Version]
  3. Kupper, C. Dietary guidelines and implementation for celiac disease. Gastroenterology 2005, 128, S121–S127. [Google Scholar] [CrossRef] [PubMed]
  4. Aston, L.M. Glycaemic index and metabolic disease risk. Proc. Nutr. Soc. 2006, 65, 125–134. [Google Scholar] [CrossRef] [Green Version]
  5. Kabbani, T.A.; Goldberg, A.; Kelly, C.P.; Pallav, K.; Tariq, S.; Peer, A.; Hansen, J.; Dennis, M.; Leffler, D.A. Body mass index and the risk of obesity in coeliac disease treated with the gluten-free diet. Aliment. Pharmacol. Ther. 2012, 35, 723–729. [Google Scholar] [CrossRef]
  6. Dickey, W.; Kearney, N. Overweight in celiac disease: Prevalence, clinical characteristics, and effect of a gluten-free diet. Am. J. Gastroenterol. 2006, 101, 2356–2359. [Google Scholar] [CrossRef]
  7. Barone, M.; Della Valle, N.; Rosania, R.; Facciorusso, A.; Trotta, A.; Cantatore, F.P.; Falco, S.; Pignatiello, S.; Viggiani, M.T.; Amoruso, A.; et al. A comparison of the nutritional status between adult celiac patients on a long-term, strictly gluten-free diet and healthy subjects. Eur. J. Clin. Nutr. 2016, 70, 23–27. [Google Scholar] [CrossRef]
  8. Nikniaz, Z.; Farhangi, M.A.; Hosseinifard, H.; Nikniaz, L. Does a Gluten-free Diet Increase Body Mass Index and Lipid Profile in Celiac Patients? A Systematic Review and Meta-analysis. Mediterr. J. Nutr. Metab. 2019, 12, 341–352. [Google Scholar] [CrossRef]
  9. Tortora, R.; Capone, P.; De Stefano, G.; Imperatore, N.; Gerbino, N.; Donetto, S.; Monaco, V.; Caporaso, N.; Rispo, A. Metabolic syndrome in patients with coeliac disease on a gluten-free diet. Aliment. Pharmacol. Ther. 2015, 41, 352–359. [Google Scholar] [CrossRef] [Green Version]
  10. Agarwal, A.; Singh, A.; Mehtab, W.; Gupta, V.; Chauhan, A.; Rajput, M.S.; Singh, N.; Ahuja, V.; Makharia, G.K. Patients with celiac disease are at high risk of developing metabolic syndrome and fatty liver. Intest. Res. 2021, 19, 106–114. [Google Scholar] [CrossRef] [Green Version]
  11. Cheng, J.; Brar, P.S.; Lee, A.R.; Green, P.H. Body mass index in celiac disease: Beneficial effect of a gluten-free diet. J. Clin. Gastroenterol. 2010, 44, 267–271. [Google Scholar] [CrossRef]
  12. Bardella, M.T.; Fredella, C.; Prampolini, L.; Molteni, N.; Giunta, A.M.; Bianchi, P.A. Body composition and dietary intakes in adult celiac disease patients consuming strict gluten-free diet. Am. J. Clin. Nutr. 2000, 72, 937–939. [Google Scholar] [CrossRef] [Green Version]
  13. Więch, P.; Chmiel, Z.; Bazaliński, D.; Sałacińska, I.; Bartosiewicz, A.; Mazur, A.; Korczowski, B.; Binkowska-Bury, M.; Dąbrowski, M. The Relationship between Body Composition and a Gluten Free Diet in Children with Celiac Disease. Nutrients 2018, 10, 1817. [Google Scholar] [CrossRef] [Green Version]
  14. Lionetti, E.; Antonucci, N.; Marinelli, M.; Bartolomei, B.; Franceschini, E.; Gatti, S.; Catassi, G.N.; Verma, A.K.; Monachesi, C.; Catassi, C. Nutritional Status, Dietary Intake, and Adherence to the Mediterranean Diet of Children with Celiac Disease on a Gluten-Free Diet: A Case-Control Prospective Study. Nutrients 2020, 12, 143. [Google Scholar] [CrossRef] [Green Version]
  15. De Lorenzo, A.; Di Campli, C.; Andreoli, A.; Sasso, G.F.; Bonamico, M.; Gasbarrini, A. Assessment of body composition by bioelectrical impedance in adolescent patients with celiac disease. Am. J. Gastroenterol. 1999, 94, 2951–2955. [Google Scholar] [CrossRef] [PubMed]
  16. Rashid, M.; Cranney, A.; Zarkadas, M.; Graham, I.D.; Switzer, C.; Case, S.; Molloy, M.; Warren, R.E.; Burrows, V.; Butzner, J.D. Celiac Disease: Evaluation of the Diagnosis and Dietary Compliance in Canadian Children. Pediatrics 2005, 116, e754–e759. [Google Scholar] [CrossRef] [PubMed] [Green Version]
  17. Zuccotti, G.; Fabiano, V.; Dilillo, D.; Picca, M.; Cravidi, C.; Brambilla, P. Intakes of nutrients in Italian children with celiac disease and the role of commercially available gluten-free products. J. Hum. Nutr. Diet 2013, 26, 436–444. [Google Scholar] [CrossRef]
  18. Anania, C.; Pacifico, L.; Olivero, F.; Perla, F.M.; Chiesa, C. Cardiometabolic risk factors in children with celiac disease on a gluten-free diet. World J. Clin. Pediatr. 2017, 6, 143–148. [Google Scholar] [CrossRef]
  19. Rosenthal, E.; Hoffman, R.; Aviram, M.; Benderly, A.; Erde, P.; Brook, J.G. Serum lipoprotein profile in children with celiac disease. J. Pediatr. Gastroenterol. Nutr. 1990, 11, 58–62. [Google Scholar] [CrossRef]
  20. Forchielli, M.L.; Diani, L.; Labriola, F.; Bolasco, G.; Rocca, A.; Salfi, N.C.; Leone, A.; Miserocchi, C.; Andreozzi, L.; Levi Della Vida, F.; et al. Gluten Deprivation: What Nutritional Changes Are Found During the First Year in Newly Diagnosed Coeliac Children? Nutrients 2019, 12, 60. [Google Scholar] [CrossRef] [Green Version]
  21. Valvano, M.; Longo, S.; Stefanelli, G.; Frieri, G.; Viscido, A.; Latella, G. Celiac Disease, Gluten-Free Diet, and Metabolic and Liver Disorders. Nutrients 2020, 12, 940. [Google Scholar] [CrossRef] [PubMed] [Green Version]
  22. Tortora, R.; Rispo, A.; Alisi, A.; Imperatore, N.; Crudele, A.; Ferretti, F.; Nobili, V.; Miele, L.; Gerbino, N.; Caporaso, N.; et al. PNPLA3 rs738409 Polymorphism Predicts Development and Severity of Hepatic Steatosis but Not Metabolic Syndrome in Celiac Disease. Nutrients 2018, 10, 1239. [Google Scholar] [CrossRef] [PubMed] [Green Version]
  23. Ciccone, A.; Gabrieli, D.; Cardinale, R.; Di Ruscio, M.; Vernia, F.; Stefanelli, G.; Necozione, S.; Melideo, D.; Viscido, A.; Frieri, G.; et al. Metabolic Alterations in Celiac Disease Occurring after Following a Gluten-Free Diet. Digestion 2019, 100, 262–268. [Google Scholar] [CrossRef] [PubMed]
  24. Kabbani, T.A.; Kelly, C.P.; Betensky, R.A.; Hansen, J.; Pallav, K.; Villafuerte-Gálvez, J.A.; Vanga, R.; Mukherjee, R.; Novero, A.; Dennis, M.; et al. Patients with celiac disease have a lower prevalence of non-insulin-dependent diabetes mellitus and metabolic syndrome. Gastroenterology 2013, 144, 912–917. [Google Scholar] [CrossRef] [Green Version]
  25. Reilly, N.R.; Lebwohl, B.; Hultcrantz, R.; Green, P.H.R.; Ludvigsson, J.F. Increased risk of non-alcoholic fatty liver disease after diagnosis of celiac disease. J. Hepatol. 2015, 62, 1405–1411. [Google Scholar] [CrossRef] [Green Version]
  26. Caruso, R.; Pallone, F.; Stasi, E.; Romeo, S.; Monteleone, G. Appropriate nutrient supplementation in celiac disease. Ann. Med. 2013, 45, 522–531. [Google Scholar] [CrossRef]
  27. Dickey, W.; Ward, M.; Whittle, C.R.; Kelly, M.T.; Pentieva, K.; Horigan, G.; Patton, S.; McNulty, H. Homocysteine and related B-vitamin status in coeliac disease: Effects of gluten exclusion and histological recovery. Scand. J. Gastroenterol. 2008, 43, 682–688. [Google Scholar] [CrossRef]
  28. Valente, F.X.; do Nascimento Campos, T.; de Sousa Moraes, L.F.; Hermsdorff, H.H.M.; de Morais Cardoso, L.; Pinheiro-Sant’Ana, H.M.; Gilberti, F.A.B.; Peluzio, M.D.C.G. B vitamins related to homocysteine metabolism in adults celiac disease patients: A cross-sectional study. Nutr. J. 2015, 14, 110. [Google Scholar] [CrossRef] [Green Version]
  29. Kemppainen, T.A.; Kosma, V.M.; Janatuinen, E.K.; Julkunen, R.J.; Pikkarainen, P.H.; Uusitupa, M.I. Nutritional status of newly diagnosed celiac disease patients before and after the institution of a celiac disease diet--association with the grade of mucosal villous atrophy. Am. J. Clin. Nutr. 1998, 67, 482–487. [Google Scholar] [CrossRef] [PubMed] [Green Version]
  30. Haapalahti, M.; Kulmala, P.; Karttunen, T.J.; Paajanen, L.; Laurila, K.; Mäki, M.; Mykkänen, H.; Kokkonen, J. Nutritional status in adolescents and young adults with screen-detected celiac disease. J. Pediatr. Gastroenterol. Nutr. 2005, 40, 566–570. [Google Scholar] [CrossRef] [Green Version]
  31. Grace-Farfaglia, P. Bones of Contention: Bone Mineral Density Recovery in Celiac Disease—A Systematic Review. Nutrients 2015, 7, 3347–3369. [Google Scholar] [CrossRef] [Green Version]
  32. Fathi, F.; Ektefa, F.; Tafazzoli, M.; Rostami, K.; Rostami Nejad, M.; Fathi, M.; Rezaei-Tavirani, M.; Oskouie, A.A.; Zali, M.R. The concentration of serum zinc in celiac patients compared to healthy subjects in Tehran. Gastroenterol. Hepatol. Bed Bench. 2013, 6, 92–95. [Google Scholar]
  33. Erdem, T.; Ferat, Ç.; Nurdan, Y.A.; Halime, E.; Muhammed Selçuk, S.; Hamza, K.; Mukadder Ayşe, S. Vitamin and mineral deficiency in children newly diagnosed with celiac disease. Turk. J. Med. Sci. 2015, 45, 833–836. [Google Scholar]
  34. Black, M.M. Zinc deficiency and child development. Am. J. Clin. Nutr. 1998, 68, 464S–469S. [Google Scholar] [CrossRef] [Green Version]
  35. Jameson, S. Coeliac disease, insulin-like growth factor, bone mineral density, and zinc. Scand. J. Gastroenterol. 2000, 35, 894–896. [Google Scholar] [CrossRef]
  36. Wierdsma, N.J.; van Bokhorst-de van der Schueren, M.A.; Berkenpas, M.; Mulder, C.J.; van Bodegraven, A.A. Vitamin and mineral deficiencies are highly prevalent in newly diagnosed celiac disease patients. Nutrients 2013, 5, 3975–3992. [Google Scholar] [CrossRef]
  37. Alwitry, A. Vitamin A deficiency in coeliac disease. Br. J. Ophthalmol. 2000, 84, 1079–1080. [Google Scholar] [CrossRef] [Green Version]
  38. Welstead, L. The Gluten-Free Diet in the 3rd Millennium: Rules, Risks and Opportunities. Diseases 2015, 3, 136–149. [Google Scholar] [CrossRef]
  39. Theethira, T.G.; Dennis, M.; Leffler, D.A. Nutritional consequences of celiac disease and the gluten-free diet. Expert Rev. Gastroenterol. Hepatol. 2014, 8, 123–129. [Google Scholar] [CrossRef]
  40. Quero, J.S.; Jaime, B.E.; Martínez, A.R.; Martín, F.A.; Jiménez, R.G.; Murillo, M.R.; Martín, A.P. Nutritional assessment of gluten-free diet. Is gluten-free diet deficient in some nutrient? Anales de Pediatría 2015, 83, 33–39. [Google Scholar]
  41. Gelfond, D.; Fasano, A. Celiac disease in the pediatric population. Pediatr. Ann. 2006, 35, 275–279. [Google Scholar] [CrossRef] [PubMed]
  42. Hill, I.D.; Bhatnagar, S.; Cameron, D.J.; De Rosa, S.; Maki, M.; Russell, G.J.; Troncone, R. Celiac disease: Working group report of the First World Congress of Pediatric Gastroenterology, Hepatology, and Nutrition. J. Pediatr. Gastroenterol. Nutr. 2002, 35, S78–S88. [Google Scholar] [CrossRef] [PubMed]
  43. Nestares, T.; Martín-Masot, R.; Labella, A.; Aparicio, V.A.; Flor-Alemany, M.; López-Frías, M.; Maldonado, J. Is a Gluten-Free Diet Enough to Maintain Correct Micronutrients Status in Young Patients with Celiac Disease? Nutrients 2020, 12, 844. [Google Scholar] [CrossRef] [PubMed] [Green Version]
  44. Öhlund, K.; Olsson, C.; Hernell, O.; Öhlund, I. Dietary shortcomings in children on a gluten-free diet. J. Hum. Nutr. Diet. 2010, 23, 294–300. [Google Scholar] [CrossRef]
  45. Ballestero Fernández, C.; Varela-Moreiras, G.; Úbeda, N.; Alonso-Aperte, E. Nutritional Status in Spanish Children and Adolescents with Celiac Disease on a Gluten Free Diet Compared to Non-Celiac Disease Controls. Nutrients 2019, 11, 2329. [Google Scholar] [CrossRef] [Green Version]
  46. Mariani, P.; Viti, M.G.; Montuori, M.; La Vecchia, A.; Cipolletta, E.; Calvani, L.; Bonamico, M. The gluten-free diet: A nutritional risk factor for adolescents with celiac disease? J. Pediatr. Gastroenterol. Nutr. 1998, 27, 519–523. [Google Scholar] [CrossRef]
  47. Martin, J.; Geisel, T.; Maresch, C.; Krieger, K.; Stein, J. Inadequate nutrient intake in patients with celiac disease: Results from a German dietary survey. Digestion 2013, 87, 240–246. [Google Scholar] [CrossRef]
  48. Sue, A.; Dehlsen, K.; Ooi, C.Y. Paediatric Patients with Coeliac Disease on a Gluten-Free Diet: Nutritional Adequacy and Macro- and Micronutrient Imbalances. Curr. Gastroenterol. Rep. 2018, 20, 2. [Google Scholar] [CrossRef]
  49. Shepherd, S.J.; Gibson, P.R. Nutritional inadequacies of the gluten-free diet in both recently diagnosed and long-term patients with coeliac disease. J. Hum. Nutr. Diet 2013, 26, 349–358. [Google Scholar] [CrossRef]
  50. Penagini, F.; Dilillo, D.; Meneghin, F.; Mameli, C.; Fabiano, V.; Zuccotti, G.V. Gluten-free diet in children: An approach to a nutritionally adequate and balanced diet. Nutrients 2013, 5, 4553–4565. [Google Scholar] [CrossRef] [Green Version]
  51. Malik, V.S.; Hu, F.B. Sweeteners and Risk of Obesity and Type 2 Diabetes: The Role of Sugar-Sweetened Beverages. Curr. Diab. Rep. 2012, 12, 195–203. [Google Scholar] [CrossRef]
  52. De Queiroz, K.B.; Coimbra, R.S.; Ferreira, A.R.; Carneiro, C.M.; Paiva, N.C.; Costa, D.C.; Evangelista, E.A.; Guerra-Sá, R. Molecular mechanism driving retroperitoneal adipocyte hypertrophy and hyperplasia in response to a high-sugar diet. Mol. Nutr. Food Res. 2014, 58, 2331–2341. [Google Scholar] [CrossRef]
  53. Malik, V.S.; Schulze, M.B.; Hu, F.B. Intake of sugar-sweetened beverages and weight gain: A systematic review. Am. J. Clin. Nutr. 2006, 84, 274–288. [Google Scholar] [CrossRef]
  54. Kelishadi, R.; Mansourian, M.; Heidari-Beni, M. Association of fructose consumption and components of metabolic syndrome in human studies: A systematic review and meta-analysis. Nutrition 2014, 30, 503–510. [Google Scholar] [CrossRef]
  55. Stanhope, K.L. Sugar consumption, metabolic disease and obesity: The state of the controversy. Crit. Rev. Clin. Lab. Sci. 2016, 53, 52–67. [Google Scholar] [CrossRef]
  56. Babio, N.; Alcázar, M.; Castillejo, G.; Recasens, M.; Martínez-Cerezo, F.; Gutiérrez-Pensado, V.; Masip, G.; Vaqué, C.; Vila-Martí, A.; Torres-Moreno, M.; et al. Patients With Celiac Disease Reported Higher Consumption of Added Sugar and Total Fat Than Healthy Individuals. J. Pediatr. Gastroenterol. Nutr. 2017, 64, 63–69. [Google Scholar] [CrossRef]
  57. Fry, L.; Madden, A.M.; Fallaize, R. An investigation into the nutritional composition and cost of gluten-free versus regular food products in the UK. J. Hum. Nutr. Diet 2018, 31, 108–120. [Google Scholar] [CrossRef] [Green Version]
  58. Wu, J.H.Y.; Neal, B.; Trevena, H.; Crino, M.; Stuart-Smith, W.; Faulkner-Hogg, K.; Louie, J.C.Y.; Dunford, E. Are gluten-free foods healthier than non-gluten-free foods? An evaluation of supermarket products in Australia. Br. J. Nut. 2015, 114, 448–454. [Google Scholar] [CrossRef] [Green Version]
  59. DeVries, J.W. The definition of dietary fibre. Cereal Foods World 2001, 46, 112–129. [Google Scholar]
  60. Tucker, L.A.; Thomas, K.S. Increasing total fiber intake reduces risk of weight and fat gains in women. J. Nutr. 2009, 139, 576–581. [Google Scholar] [CrossRef] [Green Version]
  61. Chandalia, M.; Garg, A.; Lutjohann, D.; von Bergmann, K.; Grundy, S.M.; Brinkley, L.J. Beneficial effects of high dietary fiber intake in patients with type 2 diabetes mellitus. N. Engl. J. Med. 2000, 342, 1392–1398. [Google Scholar] [CrossRef] [PubMed]
  62. Jenkins, D.J.A.; Kendall, C.W.C.; Vuksan, V.; Vidgen, E.; Parker, T.; Faulkner, D.; Mehling, C.C.; Garsetti, M.; Testolin, G.; Cunnane, S.C.; et al. Soluble fiber intake at a dose approved by the US Food and Drug Administration for a claim of health benefits: Serum lipid risk factors for cardiovascular disease assessed in a randomized controlled crossover trial. Am. J. Clin. Nutr. 2002, 75, 834–839. [Google Scholar] [CrossRef] [PubMed]
  63. Brown, L.; Rosner, B.; Willett, W.W.; Sacks, F.M. Cholesterol-lowering effects of dietary fiber: A meta-analysis. Am. J. Clin. Nutr. 1999, 69, 30–42. [Google Scholar] [CrossRef] [PubMed]
  64. Chen, J.P.; Chen, G.C.; Wang, X.P.; Qin, L.; Bai, Y. Dietary Fiber and Metabolic Syndrome: A Meta-Analysis and Review of Related Mechanisms. Nutrients 2017, 10, 24. [Google Scholar] [CrossRef] [Green Version]
  65. Thompson, T.; Dennis, M.; Higgins, L.A.; Lee, A.R.; Sharrett, M.K. Gluten-free diet survey: Are Americans with coeliac disease consuming recommended amounts of fibre, iron, calcium and grain foods? J. Hum. Nutr. Diet 2005, 18, 163–169. [Google Scholar] [CrossRef]
  66. Saturni, L.; Ferretti, G.; Bacchetti, T. The gluten-free diet: Safety and nutritional quality. Nutrients 2010, 2, 16–34. [Google Scholar] [CrossRef] [Green Version]
  67. Phillips, C.M.; Kesse-Guyot, E.; McManus, R.; Hercberg, S.; Lairon, D.; Planells, R.; Roche, H.M. High dietary saturated fat intake accentuates obesity risk associated with the fat mass and obesity–associated gene in adults. J. Nutr. 2012, 142, 824–831. [Google Scholar] [CrossRef]
  68. Raatz, S.; Conrad, Z.; Johnson, L.; Picklo, M.; Jahns, L. Relationship of the Reported Intakes of Fat and Fatty Acids to Body Weight in US Adults. Nutrients 2017, 9, 438. [Google Scholar] [CrossRef] [Green Version]
  69. Moleres, A.; Ochoa, M.C.; Rendo-Urteaga, T.; Martínez-González, M.A.; Azcona San Julián, M.C.; Martínez, J.A.; Marti, A. Dietary fatty acid distribution modifies obesity risk linked to the rs9939609 polymorphism of the fat mass and obesity-associated gene in a Spanish case–control study of children. Br. J. Nutr. 2012, 107, 533–538. [Google Scholar] [CrossRef] [Green Version]
  70. Diaf, M.; Khaled, M.B.; Sellam, F. Correlation between dietary fat intake and atherogenic indices in normal, overweight and obese adults with or without type 2 diabetes. Rom. J. Diabetes Nutr. Metab. Dis. 2015, 22, 347–360. [Google Scholar] [CrossRef] [Green Version]
  71. Lund, A.S.Q.; Hasselbalch, A.L.; Gamborg, M.; Skogstrand, K.; Hougaard, D.M.; Heitmann, B.L. N-3 polyunsaturated fatty acids, body fat and inflammation. Obes. Facts 2013, 6, 369–379. [Google Scholar] [CrossRef]
  72. Cardel, M.; Lemas, D.J.; Jackson, K.H.; Friedman, J.E.; Fernández, J.R. Higher intake of PUFAs is associated with lower total and visceral adiposity and higher lean mass in a racially diverse sample of children. J. Nutr. 2015, 145, 2146–2152. [Google Scholar] [CrossRef]
  73. Suara, S.B.; Siassi, F.; Saaka, M.; Foroshani, A.R.; Asadi, S.; Sotoudeh, G. Dietary fat quantity and quality in relation to general and abdominal obesity in women: A cross-sectional study from Ghana. Lipids Health Dis. 2020, 19, 67. [Google Scholar] [CrossRef] [Green Version]
  74. Nimptsch, K.; Berg-Beckhoff, G.; Linseisen, J. Effect of dietary fatty acid intake on prospective weight change in the Heidelberg cohort of the European prospective investigation into Cancer Micallef M, Munro I, Phang M, Garg, M. Plasma n-3 Polyunsaturated Fatty Acids are negatively associated with obesity. Br. J. Nutr. 2009, 102, 1370–1374. [Google Scholar]
  75. Klein-Platat, C.; Drai, J.; Oujaa, M.; Schlienger, J.L.; Simon, C. Plasma fatty acid composition is associated with the metabolic syndrome and low-grade inflammation in overweight adolescents. Am. J. Clin. Nutr. 2005, 82, 1178–1184. [Google Scholar] [CrossRef] [Green Version]
  76. Bjermo, H.; Iggman, D.; Kullberg, J.; Dahlman, I.; Johansson, L.; Persson, L.; Berglund, J.; Pulkki, K.; Basu, S.; Uusitupa, M.; et al. Effects of n-6 PUFAs compared with SFAs on liver fat, lipoproteins, and inflammation in abdominal obesity: A randomized controlled trial. Am. J. Clin. Nutr. 2012, 95, 1003–1012. [Google Scholar] [CrossRef] [Green Version]
  77. Simopoulos, A.P. The importance of the ratio of omega-6/omega-3 essential fatty acids. Biomed. Pharmacother. 2002, 56, 365–579. [Google Scholar] [CrossRef]
  78. Maggio, A.; Orecchio, S. Fatty Acid Composition of Gluten-Free Food (Bakery Products) for Celiac People. Foods 2018, 7, 95. [Google Scholar] [CrossRef] [Green Version]
  79. Caponio, F.; Summo, C.; Clodoveo, M.; Pasqualone, A. Evaluation of the nutritional quality of the lipid fraction of gluten-free biscuits. Euro Food Res. Technol. 2008, 227, 135–139. [Google Scholar] [CrossRef]
  80. Hadj Ahmed, S.; Kharroubi, W.; Kaoubaa, N.; Zarrouk, A.; Batbout, F.; Gamra, H.; Najjar, M.F.; Lizard, G.; Hininger-Favier, I.; Hammami, M. Correlation of trans fatty acids with the severity of coronary artery disease lesions. Lipids Health Dis. 2018, 17, 52. [Google Scholar] [CrossRef] [Green Version]
  81. Segura, M.E.; Rosell, C.M. Chemical composition and starch digestibility of different gluten-free breads. Plant. Foods Hum. Nutr. 2011, 3, 224–230. [Google Scholar] [CrossRef] [Green Version]
  82. Miranda, J.; Lasa, A.; Bustamante, M.A.; Churruca, I.; Simon, E. Nutritional differences between a gluten-free diet and a diet containing equivalent products with gluten. Plant. Foods Hum. Nutr. 2014, 69, 182–187, Erratum in: 2014, 69, 290. [Google Scholar] [CrossRef]
  83. Melini, V.; Melini, F. Gluten-Free Diet: Gaps and Needs for a Healthier Diet. Nutrients 2019, 11, 170. [Google Scholar] [CrossRef] [Green Version]
  84. Nestares, T.; Martín-Masot, R.; Flor-Alemany, M.; Bonavita, A.; Maldonado, J.; Aparicio, V.A. Influence of Ultra-Processed Foods Consumption on Redox Status and Inflammatory Signaling in Young Celiac Patients. Nutrients 2021, 13, 156. [Google Scholar] [CrossRef]
  85. Berti, C.; Riso, P.; Monti, L.D.; Porrini, M. In vitro starch digestibility and in vivo glucose response of gluten-free foods and their gluten counterparts. Eur. J. Nutr. 2004, 43, 198–204. [Google Scholar] [CrossRef]
  86. Cicero, A.F.; Gaddi, A. Rice bran oil and gamma-oryzanol in the treatment of hyperlipoproteinaemias and oTher. conditions. PhytoTher. Res. 2001, 15, 277–289. [Google Scholar] [CrossRef]
  87. Wu, F.; Yang, N.; Toure, A.; Jin, Z.; Xu, X. Germinated brown rice and its role in human health. Crit. Rev. Food Sci. 2013, 53, 451–463. [Google Scholar] [CrossRef]
  88. Mattei, J.; Malik, V.; Wedick, N.M.; Hu, F.B.; Spiegelman, D.; Willett, W.C.; Campos, H. Global Nutrition Epidemiologic Transition Initiative. Reducing the global burden of type 2 diabetes by improving the quality of staple foods: The global nutrition and epidemiologic transition initiative. Glob. Health 2015, 11, 23. [Google Scholar] [CrossRef] [Green Version]
  89. Shao, Y.F.; Bao, J.S. Polyphenols in whole rice grain: Genetic diversity and health benefits. Food Chem. 2015, 180, 86–97. [Google Scholar] [CrossRef]
  90. Shobana, S.; Lakshmipriya, N.; Bai, M.R.; Rajagopal, G.; Vaidya, R.; Malleshi, N.; Mohan, V. Even minimal polishing of an Indian parboiled brown rice variety leads to increased glycemic responses. Asia Pac. J. Clin. Nutr. 2017, 26, 829–836. [Google Scholar]
  91. Krittanawong, C.; Tunhasiriwet, A.; Zhang, H.; Prokop, L.J.; Chirapongsathorn, S.; Sun, T.; Wang, Z. Is white rice consumption a risk for metabolic and cardiovascular outcomes? A systematic review and meta-analysis. Heart Asia 2017, 9, e010909. [Google Scholar] [CrossRef] [PubMed] [Green Version]
  92. Surendiran, G.; Alsaif, M.; Kapourchali, F.R.; Moghadasian, M.H. Nutritional constituents and health benefits of wild rice (Zizania spp.). Nutr. Rev. 2014, 72, 227–236. [Google Scholar] [CrossRef] [PubMed]
  93. Lehmann, U.; Robin, F. Slowly digestible starch-its structure and health implications: A review. Trends Food Sci. Technol. 2007, 18, 346–355. [Google Scholar] [CrossRef]
  94. Zhang, H.; Cao, P.; Agellon, L.B.; Zhai, C.K. Wild rice (Zizania latifolia (Griseb) Turcz) improves the serum lipid profile and antioxidant status of rats fed with a high fat/cholesterol diet. Br. J. Nutr. 2009, 102, 1723–1727. [Google Scholar] [CrossRef] [PubMed] [Green Version]
  95. Han, S.; Zhang, H.; Qin, L.; Zhai, C. Effects of dietary carbohydrate replaced with wild rice (Zizania latifolia (Griseb) Turcz) on insulin resistance in rats fed with highfat/cholesterol diet. Nutrients 2013, 5, 552–564. [Google Scholar] [CrossRef] [Green Version]
  96. Qiu, Y.; Liu, Q.; Beta, T. Antioxidant properties of commercial wild rice and analysis of soluble and insoluble phenolic acids. Food Chem. 2010, 121, 140–147. [Google Scholar] [CrossRef]
  97. Prasanna, B.M.; Vasal, S.K.; Kassahun, B.; Singh, N.N. Quality protein maize. Curr. Sci. 2001, 81, 1308–1318. [Google Scholar]
  98. Nuss, E.T.; Tanumihardjo, S.A. Maize: A paramount staple crop in the context of global nutrition. Compr. Rev. Food Sci. Food Saf. 2010, 9, 417–436. [Google Scholar] [CrossRef]
  99. Ai, Y.; Jane, J.L. Macronutrients in Corn and Human Nutrition. Compr. Rev. Food Sci. Food Saf. 2016, 15, 581–598. [Google Scholar] [CrossRef] [Green Version]
  100. Afify, A.E.-M.M.R.; El-Beltagi, H.S.; El-Salam, S.M.A.; Omran, A.A. Biochemical changes in phenols, flavonoids, tannins, vitamin E, β–carotene and antioxidant activity during soaking of three white sorghum varieties. Asian Pac. J. Trop Biomed. 2012, 2, 203–209. [Google Scholar] [CrossRef] [Green Version]
  101. Vázquez-Araújo, L.; Chambers Iv, E.; Cherdchu, P. Consumer Input for Developing Human Food Products Made with Sorghum Grain. J. Food Sci. 2012, 77, 384–389. [Google Scholar] [CrossRef]
  102. Awika, J.M.; Rooney, L.W. Sorghum phytochemicals and their potential impact on human health. Phytochemistry 2004, 65, 1199–1221. [Google Scholar] [CrossRef]
  103. Anunciação, P.C.; Cardoso, L.d.M.; Gomes, J.V.P.; Della Lucia, C.M.; Carvalho, C.W.P.; Galdeano, M.C.; Queiroz, V.A.V.; Alfenas, R.C.G.; Martino, H.S.D.; Pinheiro-Sant’Ana, H.M. Comparing sorghum and wheat whole grain breakfast cereals: Sensorial acceptance and bioactive compound content. Food Chem. 2017, 221, 984–989. [Google Scholar] [CrossRef]
  104. Bora, P.; Ragaee, S.; Marcone, M. Characterisation of several types of millets as functional food ingredients. Int. J. Food Sci. Nutr. 2019, 70, 714–724. [Google Scholar] [CrossRef]
  105. Martínez-Villaluenga, C.; Peñas, E.; Hernández-Ledesma, B. Pseudocereal grains: Nutritional value, health benefits and current applications for the development of gluten-free foods. Food Chem. Toxicol. 2020, 137, 111178. [Google Scholar] [CrossRef]
  106. Repo-Carrasco-Valencia, R.; Hellström, J.K.; Pihlava, J.M.; Mattila, P.H. Flavonoids and oTher. phenolic compounds in Andean indigenous grains: Quinoa (Chenopodium quinoa), kañiwa (Chenopodium pallidicaule) and kiwicha (Amaranthus caudatus). Food Chem. 2010, 120, 128–133. [Google Scholar] [CrossRef]
  107. Zhou, Y.; Zhao, S.; Jiang, Y.; Wei, Y.; Zhou, X. Regulatory function of buckwheat-resistant starch supplementation on lipid profile and gut microbiota in mice fed with a high-fat diet. J. Food Sci. 2019, 84, 2674–2681. [Google Scholar] [CrossRef]
  108. Motta, C.; Castanheira, I.; Gonzales, G.B.; Delgado, I.; Torres, D.; Santos, M.; Matos, A.S. Impact of cooking methods and malting on amino acids content in amaranth, buckwheat and quinoa. J. Food Compos. Anal. 2019, 76, 58–65. [Google Scholar] [CrossRef]
  109. Rodrigo, L. Celiac disease. World J. Gastroenterol. 2006, 12, 6585–6593. [Google Scholar] [CrossRef]
  110. Rizzoli, R. Dairy products, yogurts, and bone health. Am. J. Clin. Nutr. 2014, 99 (Suppl. 5), 1256S–1262S. [Google Scholar] [CrossRef] [Green Version]
  111. Geissler, C.; Singh, M. Iron, Meat and Health. Nutrients 2011, 3, 283–316. [Google Scholar] [CrossRef] [PubMed] [Green Version]
  112. Rubio-Tapia, A.; Hill, I.D.; Kelly, C.P.; Calderwood, A.H.; Murray, J.A. ACG Clinical Guidelines: Diagnosis and Management of Celiac Disease. Am. J. Gastroenterol. 2013, 108, 656–676. [Google Scholar] [CrossRef] [PubMed] [Green Version]
  113. Rondanelli, M.; Faliva, M.A.; Gasparri, C.; Peroni, G.; Naso, M.; Picciotto, G.; Riva, A.; Nichetti, M.; Infantino, V.; Alalwan, T.A.; et al. Micronutrients Dietary Supplementation Advices for Celiac Patients on Long-Term Gluten-Free Diet with Good Compliance: A Review. Medicina 2019, 55, 337. [Google Scholar] [CrossRef] [PubMed] [Green Version]
Figure 1. The healthy gluten-free diet: practical tips to prevent metabolic disorders and nutritional deficiencies in celiac patients.
Gastroent 12 00015 g001
Publisher’s Note: MDPI stays neutral with regard to jurisdictional claims in published maps and institutional affiliations.

