
Lysinibacillus sphaericus III(3)7 and Plasmid Vector pMK4: New Challenges in Cloning Platforms


Centro de Investigaciones Microbiológicas (CIMIC), Department of Biological Sciences, Universidad de Los Andes, Bogotá 111711, Colombia
*
Author to whom correspondence should be addressed.
Microbiol. Res. 2021, 12(2), 455-479; https://0-doi-org.brum.beds.ac.uk/10.3390/microbiolres12020031
Submission received: 4 March 2021
/
Revised: 13 April 2021
/
Accepted: 23 April 2021
/
Published: 4 May 2021
Abstract
:The acquisition and especially the maintenance of a plasmid usually brings a fitness cost that reduces the reproductive rate of the bacterial host; for strains like Lysinibacillus sphaericus III(3)7, which possesses important environmental properties, this alteration along with morphological changes and reduced sporulation rates may exert a negative effect on metabolic studies using plasmids as cloning platforms. The aim of this study is to approach the metabolic behavior of pMK4-bearing cells of L. sphaericus III(3)7 through the use of bioinformatic and in vitro analyses. An incompatibility model between the pMK4 vector and a predicted megaplasmid, pBsph, inside III(3)7 cells was constructed based on an incA region. Additionally, in vitro long-term plasmid stability was not found in plasmid-bearing cells. Alignments between replicons, mobile genetic elements and RNA-RNA interactions were assessed, pairwise alignment visualization, graphic models and morphological changes were evaluated by SEM. Metabolite analysis was done through HPLC coupled to a Q-TOF 6545, and electrospray ionization was used, finally, Aedes aegypti and Culex quinquefasciatus larvae were used for larvicidal activity assessment. Results found, a decreased growth rate, spore formation reduction and morphological changes, which supported the idea of metabolic cost exerted by pMK4. An incompatibility between pMK4 and pBsph appears to take place inside L. sphaericus III(3)7 cells, however, further in vitro studies are needed to confirm it.
1. Introduction
Lysinibacillus sphaericus is a free-living aerobic, sporulated, Gram-positive bacillus with entomopathogenic and other environmental applications that have been extensively studied in recent years. A modification in the phylogenetic classification of L. sphaericus was suggested in 2016, when Gómez et al. reported important genomic differences and described two distinct lineages that divide the group. The toxic lineage is composed of strains that produce entomopathogenic toxins against a variety of mosquito species, while strains that do not produce these compounds belong to the non-toxic lineage [1]. Furthermore, L. sphaericus is considered an ideal study model for bacterial evolution and genetics, however, only recently has the genetic transformation of the C3-41 strain been reported along with a characterization of a restriction-methylation system (R-M) coded in the bacterial chromosome [2].
The Colombian L. sphaericus III(3)7 toxic strain was successfully transformed for the first time in our laboratory following the protocol proposed by Pan Fu et al. for strain C3-41; using the homologous R-M system present in both strains as an advantage, transformation was performed by methylation of the shuttle vector pMK4 with M.CviPI, an isoschizomer of the methyltransferase present in strain C3-41. Interestingly, reports on the genomic separation between L. sphaericus lineages point at the toxic lineage as a novel species into the Bacillaceae family since this group presents marked differences with the non-toxic lineage, while preserving little functional diversity inside the toxic lineage given the high amount of cluster of orthologous genes (COGs) shared between the group members [1].
L. sphaericus strains have shown environmentally relevant features and biotechnological applications [3], in particular, the III(3)7 strain has been widely used in biological control of mosquito species like Culex sp. and Aedes sp., thus being an effective controller of vector-borne diseases especially in tropical countries like Colombia where endemic diseases such as Zika, Chikungunya, and Dengue are a threat to public health [4,5]. Additionally, the III(3)7 strain possesses potential in toxic metal bioremediation, since it has been described as either tolerant or resistant to Arsenic, Cobalt, Zinc, and Nickel. This is relevant to oil-producing countries such as Colombia, since these metals have been associated with oily sludge, a petrochemical contaminant that highly pollutes water sources [6]. The above traits and uses have resulted in a growing interest into assessing the strain’s full potential, to this end, and in order to ease visualization of both bacterial action and genetic traits, the use of plasmids containing fluorescent or otherwise visible reporters has been proposed [7]. However, before this approach can be applied in full, it is necessary to evaluate the metabolic networks and interactions between the plasmid and the host cell so that there is no bias over the assessed characteristics [8]. Extrachromosomal elements like plasmids provide a wide array of phenotypic traits in bacteria of environmental, clinical, and commercial importance, and the number of plasmid copies inside a cell may vary dramatically, depending on plasmid properties. This can help divide plasmids into categories, ranging from very low-copy plasmids (5 > copies), low-copy plasmids (10–20 copies), and high-copy plasmids (50–500 copies) [9]. Understanding the type and function of a plasmid include assessment of mechanisms for its maintenance inside the cell, cost-benefit behavior, and segregation strategies.
Examination of similarities and differences between plasmids from Gram-positive and Gram- negative bacteria is the first division for these genetic elements [10]. Early studies on plasmids were carried out mainly in Gram-negative bacteria, reason why information available and derived models are less abundant for Gram-positive bacteria [8]. In recent decades, studies have been conducted to evaluate plasmid replication, DNA uptake and natural competence in Gram-positive bacteria such as Bacillus subtilis and Streptococcus pneumoniae [11]. Nevertheless, even the B. subtilis model cannot be extrapolated in full to Lysinibacillus strains since the genera are different enough to have been divided a few years ago [12]. Likewise, investigation in competence for B. subtilis and S. pneumoniae have been made but, to our knowledge, there have not been studies on metabolic burden and plasmid incompatibility models in any Colombian Lysinibacillus strains.
The construction of compatible replicons to plasmids already inside host cells has been driven by incompatibility typing and gene cloning techniques to functionally dissect and isolate replicons, which turned out to be the defining component of incompatibility mechanisms. The main incompatibility is caused by competition, be it for substrate for segregation or replication machinery [13]. Plasmids are usually classified in Inc groups just because one of their replicon features, while there are many other trans-acting elements that exert a regulation in replication genes and are not considered in replicon incompatibility.
The aim of this study is to approach, through the use of bioinformatic and in vitro analysis, to the metabolic behavior of plasmid-bearing and plasmid-free L. sphaericus III(3)7 cells, as well as to evaluate possible metabolic burdens derived from plasmid maintenance. Furthermore, in order for the approach taken in this study to yield fruitful results, it is necessary for the strain-designed constructs to be used in studies assessing host features, due to interaction of maintenance machinery and metabolic networks between host and plasmid, which may exert relevant changes in phenotype.
2. Materials and Methods
2.1. Bioinformatic Analysis
To determine the incompatibility group of the pMK4 plasmid inside L. sphaericus III(3)7 cells, its mother plasmid, pC194, which possesses a Gram-positive origin, was evaluated [14]. First, the previously reported sequence of repH within plasmid pC194 was aligned with pMK4 to assess if the same regulation protein sequence was present in both plasmids. Likewise, the seg sequence, also previously reported [15], was located in pC194 and then in pMK4 by pairwise local sequence alignment in Clustal Water 2019 version (EMBOSS). Since some pC194-derived plasmids have reported a seg- mutation [16], this was also assessed in pMK4. Later, an incA region reported near repH and a described copT region inside the repH gene in pC194-like plasmids were aligned with both pC194 and pMK4 plasmids to define and organize that part of the replicon in pMK4 [17]. Later, the rep and seg sequences from pMK4 were aligned with the megaplasmid pBsph reported in silico for the III(3)7 strain to evaluate possible points of incompatibility between pMK4 and pBsph using BLASTn and EMBOSS Water.
Once the portion of the replicon containing the rep, copT, incA, and seg sequences was organized, and to assess possible homologies within the replicons, the complete region was aligned with the predicted repX gene in pBsph, including a buffer sequence between 100 to 200 bp upstream of the sequence. Region incA and seg were separately aligned with the repX sequence to find points of countertranscript regulation. Presence of mobile genetic elements (MGEs) such as insertion sequences (ISs) and transposons (Tn) were assessed using ISfinder developed by the Laboratoire de Microbiologie et Génétique Moléculaires (LMGM). Each MGE found in pMK4 was analyzed and contrasted with the pBsph replicon, minding a buffer of about ~1000 bp up and downstream using EMBOSS. Homologies of regions of MGEs previously found between pMK4 and pBsph replicons were paired using EMBOSS and Benchling software to observe possible recombination points affecting replication and its regulation. In order to construct an accurate incompatibility model between pMK4 and pBsph, the incompatibility by partition systems par was assessed. This, combined with previously obtained results from the alignments described above, and interactions with a toxin/antitoxin system recently reported within pBsph, gave sufficient background for the construction of the model. Maps and alignments of plasmids pMK4, pC194 and pBsph were obtained from Benchling and Jalview. Parallelly, to assess the union between incA ncRNA and pBsph replicon mRNA sequences were analyzed through the use of IntaRNA 2.0, an efficient prediction tool for bacterial sRNA targets, enhanced for RNA–RNA interactions.
Access to the genomic information used in this study is as follows: pMK4, pC194, and pBsph sequences used are available in GeneBank EU549778, NC_002013 and CP014857, respectively. pC194- like plasmid sequence within Staphylococcus sciuri can be found in DoriC database under the code NC_010626.
2.2. Cell-Free Extract (CFE) Preparation
The Colombian L. sphaericus III(3)7 strain was grown in Luria-Bertani (LB) broth at 30 °C and under constant stirring (200 rpm) until the mid-exponential phase was reached. Cells were then centrifuged at 13,500 rpm, washed twice with deionized water, and then resuspended in one-half of volume of TNM buffer [Tris-HCl (pH 7.5), 100 Mm, NaCl 50 mM y MgCl2 5 Mm]. Bacterial suspensions were then sonicated with an ultrasonicator (24 pulses, 50 s ON/10 s OFF with an amplitude of 40%), then centrifuged at 12,000 rpm for 5 min at 4 °C. Supernatant samples were collected as CFE and stored at −80 °C. For the restriction assays, CFE was diluted 1:100 and 1:20 in TNM buffer, and a 20 µl aliquot of CFE was mixed with 500 ng of purified pMK4 plasmid, then incubated for two hours at 37 °C. Reaction was then analyzed by agarose gel electrophoresis [2].
After the transformation of III(3)7 cells with the methylated pMK4 plasmid, a miniprep and a restriction assay were carried out to confirm pMK4 maintenance. For this, a 10 µL aliquot of a III(3)7 plasmid-bearing culture with an optical density (OD) of 0.6 at 600 nm was transferred to a 25 mL Erlenmeyer flask with 10 mL of LB broth supplemented with 30 µg/mL of chloramphenicol and incubated at 30 °C under constant stirring of 200 rpm, until an OD of 0.6 at 600 nm was reached. Another transfer of culture with the same parameters as described was made before centrifugation for plasmid extraction. Plasmid extraction was carried out using a ZymoPURE Plasmid Miniprep Kit®® under manufacturer specifications, followed by treatment with CFE for restriction assays and an analysis by agarose gel electrophoresis to check plasmid methylation.
2.3. Stability Assay of Vector pMK4 within L. sphaericus III(3)7 Cells
In order to assess the stability of the pMK4 plasmid within L. sphaericus III(3)7 cells, a 100 µL aliquot of a III(3)7 plasmid-bearing culture with an OD of 0.6 at 600 nm was transferred into a 25 mL Erlenmeyer flask with 10 mL of Luria-Bertani (LB) broth supplemented with 30 μg/mL of chloramphenicol and incubated for 12 h at 30 °C and a constant stirring of 200 rpm. After incubation, this culture was centrifuged at 9500 rpm for 10 min and washed twice to remove the antibiotic. Then, the harvested cells were resuspended in 10 mL of LB broth and a 1:100 dilution was made using LB broth without antibiotic. This process was repeated every 12 h for 5 days and 3 samples were taken every 12 h and stored in glycerol at −80 °C to determine antibiotic resistance conservation at each point. Subsequently, the samples were platted in LB agar with and without antibiotic by single plate-serial dilution spotting (SP-SDS), to observe the phenotype. Colonies were counted and compared to report plasmid stability. Stability assay is resumed in Figure 1.
2.4. Growth Rate of Plasmid-Bearing and Plasmid-Free Cells
To assess possible metabolic burdens caused by the pMK4 plasmid in transformed III(3)7 cells, we first measured the OD600 of plasmid-free and plasmid-bearing III(3)7 cultures grown for 12 h in LB broth, as well as that of plasmid-bearing III(3)7 grown in medium containing antibiotic concentrations of 20, 30 and 40 µg of chloramphenicol. All cultures of plasmid-bearing cells were previously grown in a 10 mL ON culture with 12.5 µg/mL of chloramphenicol. After the growth period, a 100 µL aliquot was transferred into 10 mL of LB or LB with chloramphenicol for OD600 measurement. 5 replicas were made for each growth curve.
2.5. Morphological Changes
Plasmid-bearing cells were grown in LB broth and LB supplemented with 35 μg/mL of chloramphenicol for 12 and 24 h, III(3)7 plasmid-free cells were used as control. Cells were then harvested and washed 8 times with deionized water. Pellets were fixated with 2.5% formaldehyde for 12 h and then washed with ethanol at 70%, 90% and 100%. An aluminum support was used for metallization and sample analysis by Scanning Electron Microscopy (SEM). Images were compared with those obtained from light microscopy.
2.6. Metabolite Characterization—Total Compound Chromatogram (TCC)
Plasmid-free and plasmid-bearing cells were grown in LB and LB broth supplemented with 35 μg/mL of chloramphenicol, respectively. After 12 h cells were harvested and washed four times with type I water. Cell extracts were drawn out by sonication (50 s ON/10 s OFF, 60% amplitude for 3 h) and centrifugation at 7500 rpm for 10 min, then supernatant was collected and analyzed for metabolite characterization. Samples were concentrated using SpeedVac at 35 °C for 2 h. Then, they were reconstituted into a solution using type I water and acetonitrile (1:1), after resuspension, samples were centrifuged at 20,000× g for 10 min at 4 °C.
Samples were analyzed using a liquid chromatography system, namely the Angilent Technologies 1260 coupled to a quadrupole mass spectrometer with a time-of-flight Q-TOF 6545 and electrospray ionization, allowing analysis in positive and negative mode. Later, a 5 μL aliquot was injected into a C8 InfinityLab Poroshell 120 EC-C18 (100 × 3 mm, 2.7 μm) column at 30 °C with a constant flux of 0.4 mL/min, and a gradient elution composed of: 1% (v/v) of formic acid in Mili-Q water (phase A) and 1% (v/v) of formic acid in acetonitrile (phase B). For negative mode analysis, two reference masses were used for the mass correction: m/z 112.9856 (C2O2F3(NH4)) and m/z 1033.9881 (C18H18O6N3P3F24). While masses m/z 121.0509 (C5H4N4) and m/z 922.0098 (C18H18O6N3P3F24) were used for positive mode. For each sample, two injections were made with AutoMS/MS iterative detection in a range of 100 to 1500 m/z for MS1 and of 50 to 1500 m/z for MS2 at both ionization modes. Collision energy (CE) was assigned using this formula CE = .
Profiles obtained were processed using Agilent MassHunter Qualitative 10.0 software and Molecular feature extraction algorithm. The program gave a deconvolution of chromatograms and integration of molecular characteristics present in the sample and blank according with mass and retention time, not all adducts were deduced by the software. Data obtained here were filtrated by area. TCCs of both samples in positive and negative polarity were overlapped to identify distinctive peaks that were analyzed as previously described.
2.7. Larvicidal Activity
Third instar larvae of Cx. quinquefasciatus were collected from Bogotá, Cundinamarca (4°35′56″N, 74°04′51″W), while third instar temephos-resistant Ae. aegypti larvae were collected from La Mesa, Cundinamarca (4°38′05.9″N, 74°27′45.4″W). Larvae were kept at 28 ± 0.03 °C and 70% of relative humidity under 12:12 h light/dark photoperiod. Based on the LC50 found by Santana and coworkers [18] for vegetative L. sphaericus III(3)7 cells against Ae. aegypti and Cx. quinquefasciatus, bioassays were performed by growing III(3)7 plasmid-bearing and plasmid-free cells in Luria-Bertani agar at 30 °C and resuspending them in 1 mL of sterile distilled water after 12 h. Following this, an inoculum of 300 μL of III(3)7 transformed vegetative cells was added to 30 mL of chlorine-free tap water, achieving a final concentration of 107 CFU/mL. 20 larvae individuals of Ae. aegypti or Cx. quinquefasciatus were then added to each of the glass flasks (7.1 × 7.1 × 7.8 cm). All trials were made in triplicate and a negative control of larvae in 30 mL of chlorine-free tap water without bacteria was included. Mortality was reported past 24 h and 48 h of exposure.
2.8. Statistical Analyses
To assess normality a Shapiro–Wilk test was performed. As data were not normally distributed, for bioassay assessment, a Kruskal–Wallis test was performed to compare the results regarding larvicidal activity of plasmid-bearing and plasmid-free cells. Plasmid stability was treated under a significance level of p < 0.05. All treatments were graphed using ggplot2 package for R i386 version 3.6.1.
3. Results
3.1. Bioinformatical Approach to Incompatibility
The alignments between repH from pC194 and pMK4 showed 99.5% of homology at 2575 to 3507 in pMK4 (data not shown), this sequence in pMK4 was designated as repC. Region copT from the pC194-like plasmid of S. sciuri found in DoriC database also showed a 99.75% of homology with a sequence located in pMK4 and pC194. However, unlike the S. sciuri plasmid, copT in pMK4 is located in such a way that 75 bp of copT overlap with the predicted ORF of repC. Additionally, it possesses an ORF in the opposite direction to that of repC (Figure 2b). copT extended for another 324 bp upstream from the repC gene. Region copT was localized in plasmid pC194 of S. aureus from 729 to 1126 bp, this alignment fit with a previously predicted protein (pc194_p2) at this position in pC194 (Figure 2c). Also, the incA region from pC194 was found to be in the region between 3369–3507 bp in pMK4; this region overlapped completely with copT and with 139 bp on repC’s 5′ end. Moreover, the seg sequence was located at the replicon of pMK4 and pC194 as well, occupying positions 2512 to 2601 at the 3′ end of repC gene in pMK4. Replicon organization was confirmed to be the same in pMK4 and pC194 (Figure 2b,c).
A rep-like region was annotated previously for the pBsph megaplasmid in the L. sphaericus III(3)7 strain and named repX (accession number: CP014857). Analysis through BLASTn showed homologies between 13 and 29 bp, these regions are near to each other, separated by non-homologue sequences of 4 to 10 bp in length. In addition, they were found at the ends of the pBsph repX replicon. Analysis produced by the IntaRNA tool were consistent with the DNA alignments, showing homologies at the 5′ and 3′ ends of the pBsph replicon. One of the structures reported between incA and the repX replicon is located at the 3′ end of the pBsph replicon with a minimum free energy (mfe) of −14.54 kcal/mol between bases 1137 through 1185 (Table 1).
Comparably, at the 5′ end, there were two predicted unions as well, with one of them having a minimum mfe of −13.06 kcal/mol in bases 466 to 486. There were other unions shown at the 3′ and 5′ ends, however, these structures had greater mfes than those visualized in Figure 3.
Formation features for all structures can be seen in Figure 4 at the minimal energy index-pair graph and position-wise minimal energy profile. Although there are some possible structures at the middle of pBsph repX replicon, their mfes are lower than −9 kcal/mol.
In contrast, no significant homology was found when the seg sequence of pMK4 was aligned with the pBsph replicon, nor when it was aligned with the entire megaplasmid. The MGEs analysis in pMK4 showed 2 regions derived from Tns, as well as direct repeats and flanking sequences which were analyzed and compared with ~ 1000 bp up and downstream region designated to contain the pBsph repX replicon. The two Tns with regions showing relevant identity percentages are shown in Table 2.
Similarly, the direct inverted repeat 5′-GAAAA-3′ of Tn3 were found at 27 sites in MGEs analysis region (Figure 5) and at 41 in pMK4 sequence. Direct repeats associated to ISLar2 were also found within pMK4 and MGEs region.
3.2. Plasmid Stability
The shuttle vector pMK4 was stable inside the L. sphaericus III(3)7 cells for over 30 generations (12 h approximately), showing a conservation of around 74% inside daughter cells. At this point, there was less than 30% of spontaneous plasmid loss in transformed cells, and colony morphology remained unaffected before or after selective pressure. However, as the days passed, we noted a bacterial titer increase in LB agar but not in LB supplemented with chloramphenicol. Past 72 h, the resistant phenotype was almost completely lost and by day five there were almost no colonies growing on LB agar under antibiotic selection (Figure 6a). Complementarily, miniprep assays carried out at 24, 48, 72, 96 and 120 h of growth showed plasmid recovery until day 3. At the 96 h mark, only a slight band was visible in the gel. No band was observed in the electrophoresis protocol past 120 h (Figure 6b).
3.3. Growth Rate
Growth curves in Figure 7provide evidence of the growth alteration in plasmid-bearing cells compared with plasmid-free cells of the III(3)7 strain. In particular, plasmid-free cells were able to achieve an OD600 of almost 1.0 after 17 h, while plasmid-bearing III(3)7 cells reached a maximum OD600 of 0.3622 in the same timeframe. Growth curves were not expanded to the 24 h mark since the III(3)7 plasmid-bearing cells under selective pressure formed aggregates after 17 h, giving fluctuating and erroneous measures when measured through NanoDrop. Differences between cell growth are evident in Figure 7, showing how the OD600 diminished in an inversely-proportionally fashion with increasing chloramphenicol concentrations. In addition, at the 13 h mark, a steady decrease in the OD600 occurred in treatments under selective pressure. No aggregates had yet formed in the culture at this point.
3.4. Morphological Changes
Plasmid-bearing cells showed an alteration in their longitude with increasing chloramphenicol concentration. As shown in Figure 8a, plasmid-free cells possess a longitude in the range of 2 to 5 μm, and sporulated cells were seen at 12 and 24 h (Figure 8b,c, respectively). In contrast, plasmid-bearing cells under non-selective pressure showed a longitude of 6 to 20 µm (Figure 8d,e). When subjected to 35 µg/mL of chloramphenicol, length ranges of more than 30 µm could be observed (Figure 9a). No sporulation was observed at 12 nor 24 h in plasmid-bearing cells.
Alternatively, light microscopy imaging appeared to show accumulations suspected to be genetic material. Besides this, an apparent semi-septum formation was seen forming through SEM imaging of plasmid-bearing cells under 35 µg/mL of chloramphenicol. This can be seen in Figure 9a–c for SEM images.
3.5. Metabolite Characterization
Chromatograms obtained in positive and negative polarity assays are presented in Figure 10. Mainly, a similar peak profile was found for both samples and in most cases, III(3)7 plasmid-free cells presented a larger area on common peaks, some of these showed adducts with interesting properties in sporulation processes. Few non-common peaks were analyzed since some could not be identified by Agilent MassHunter Qualitative 10.0 software.
3.6. Larvicidal Activity against Cx. quinquefasciatus and Ae. aegypti Larvae
Bioassays performed with field-collected Cx. quinquefasciatus larvae showed an average mortality rate between 40% and 50% at the 24 h mark in both plasmid-free and plasmid-bearing bioassays, showing no significative difference between the two. However, mortality rate at 48 h for Cx. quinquefasciatus larvae remained between 75% and 85% for plasmid-bearing cells bioassays and rose to 100% in treatments with plasmid-free III(3)7 cells. Hence, we conclude that the mortality for Cx. quinquefasciatus larvae at 48 h showed a significative difference (Kruskal–Wallis: H = 4.5, p = 0.03) between the treatments. Assays with field-collected Ae. aegypti larvae presented an average mortality between 25–40% and 75–100% after 24 h of exposure to III(3)7 plasmid-bearing and plasmid-free cells, respectively. A significative difference was found for Ae. aegypti larvae mortality at 24 h between the two treatments (Kruskal-Wallis: H = 3.85, p = 0.04). No significant differences were found at 48 h of Ae. aegypti larvae treatments (Kruskal–Wallis: H = 3.13, p = 0.07). Negative control containing Cx. quinquefasciatus and Ae. aegypti larvae in chlorine-free tap water without bacteria did not present mortality rates superior to 5% of the population, as shown in Figure 11. There was a significant difference between every treatment and its corresponding control with no bacteria.
4. Discussion
4.1. Bioinformatical Approach to Incompatibility
The use of designed plasmids for genetic studies and feature analysis is widely spread, however, behavior and relationships between these genetic elements and metabolic pathways of their host should be considered before any trial is carried out [16]. This is especially relevant when there is a metabolic burden, replication machinery antagonism and/or downregulation of host genes, which could difficult assessing the host’s biological traits such as reproduction, secondary metabolite production and energy consumption, among others [19]. Furthermore, if the objective is to obtain a time-stable transformant, one should consider plasmid maintenance traits and ensure that the host does not already possess any plasmid or, if it does, that it be compatible with the new one. It is worth of mention that recently, about 28 incompatibility groups have been described, but these belong mainly to Enterobacteriaceae family [20], reason why plasmid design and genetic transformation in Gram-positive bacteria and in the Lysinibacillus genus is still in process of being understood in full.
In this study, it was found that the Colombian L. sphaericus III(3)7 strain presumably contains the megaplasmid pBsph (173.794 Kbp) previously reported for the toxic C3-41 strain and for the reference III(3)7 strain [5,21], which is consistent since there is a high genetic homology between Lysinibacillus toxic strains [1]. After the successful transformation of III(3)7 cells with the shuttle vector pMK4, we expected to find interaction points between these two genetic elements. Plasmid pMK4 was constructed from the Gram-negative plasmid pUC9 and the S. aureus pC194 plasmid [14]. Despite having two replication origins, Gram-positive ribosomes have no problem recognizing Gram-positive S-D sequences, doing so with great affinity [22], reason why when we performed transformants selection in a previous study, the selection antibiotic was chloramphenicol which is derived from the ‘mother’ Gram-positive plasmid, pC194. Likewise, regulation of replication and segregation control of pMK4 inside Gram-positive cells should be exerted by replicon and par operon derived from pC194 [23].
pC194 belongs to the RCR plasmid family, and so, it possesses a double strand origin (dso) positively regulated by a replication initiator or Rep protein encoded downstream of the dso [10]. Availability of the Rep proteins define the rate of the initiation and therefore the rep gene is under strict control. In the case of pC194, regulation of the repH gene is exerted at the transcriptional and translational level by antisense RNAs combined with a transcriptional repressor protein. As seen in Figure 12, the pC194 repH gene overlaps with copT gene which, when translated, binds to the repH promoter. The accoupled control mechanism of repH transcription is termed incA, a sequence whose target is the copT gene. Since it has not shown a promoter region, it is referred to as a non-coding RNA (ncRNA). This region overlaps with the 5′ end of the repH gene, so it can downregulate its transcription, in a way that not only inhibits RNA polymerase (RNAP) binding, but can also displace the already bound polymerase from the promoter [10,17]. incA is transcribed in the opposite direction to that of repH (the same as copT) and so, this single stranded sequence of anti-sense RNA of 521 bp is complementary to the repH mRNA target region containing the essential translation initiation signals for the repH gene [10].
For pC194-like plasmids, the RNA-RNA duplex formation between incA and copT-repH mRNA is characterized by a “kissing” intermediate that includes reversible base-pairing between hairpin loops [10]. In addition, incA has shown the ability to inhibit replication in trans and it is been reported that antisense RNAs of RCR plasmids with this model of regulation maintain the capacity to inhibit replication in RCR plasmids lacking the complementary hairpin to that in anti-sense RNA, incA in this case [24,25]. This means that the kissing complex it is not strictly necessary for the RNA-RNA inhibition system in replication control [25]. This kind of replication regulation is seen in pMV158 and R1 replication control, being rate-limiting and associated to a regulatory protein which acts as transcriptional repressor (CopT) [10], however, in pC194′s case, there is no intergenic region between cop-like sequence and repC gene since they are overlapped. This replication control replicon, including repH, copT, incA and dso was found in the pC194-derived plasmid, pMK4, as shown in Figure 2. With this in mind, we aimed to check if there were any homologies between incA and/or copT with pBsph and if these would be present within a replication control region in the latter.
The finding of a repX predicted gene in pBsph allowed for us to designate it as a control region for replication. Homologies with incA can be found near the extremes of the repX sequence, indicating that if a trans downregulation by incA RNA were to occur, it would do so at the 3′ and 5′ extremes of the gene, and even at some bases up and downstream of the repX sequence. Regulation at 5′ end would occur in a pMK4-like manner, with incA binding to 5′UTR where the S-D sequence is located and consequently inhibiting ribosome binding and translation initiation. On the other hand, regulation at 3′UTR could affect mRNA stability since formation of duplex RNA structures in mRNA 3′UTR lead to degradation by RNAse III, an essential ribonuclease in Gram-positive bacilli with toxin systems [26,27] such as the III(3)7 strain.
RNA-RNA interaction predicted structures formed towards 5′ and 3′ ends of repX mRNA could exert a downregulation since they exhibit a considerable mfe. Secondary structures for primers in a PCR rection are considered stable if they possess a mfe lower than −9 kcal/mol, so, since the structures predicted for both 3′ and 5′ extremes had a minimum mfe of −14.54 and −13.06 kcal/mol, respectively, we assume these structures are stable enough to maintain a downregulation to manage repX expression.
Structure of incA ncRNA is shown in Figure 13, a hairpin loop where reported interactions with 5′ and 3′ repX replicon occurs (Figure 13a), is highlighted. We assumed that because a “kissing” complex is responsible for pMK4 replication control at 5′UTR, regulation at this end in pBsph would appear in a similar manner.
Since antisense RNAs are metabolically unstable and constitutively synthesized [28], any change in plasmid concentration will be reflected in altered replication frequencies of pMK4 and pBsph. In this case, higher downregulation will be seen when pMK4 copy number rises and incA concentration will start to control repC and repX genes. By having a cop-like regulation, plasmids pC194 and pMK4 present a high rep transcription rate [29]. In addition, the reported sequence of the transcription regulator TubX (activator of the par operon in pBsph), was found downstream of the repX gene, in particular, putative hexamer boxes recognized by RNAP [30] were found next to direct inverted repeats homologous to pMK4.
Along with the described possible interactions between pMK4 and pBsph replication features, another point of negative regulation between these two plasmids relies on recombination during replication. pC194 and thus pMK4 replicate through the rolling circle mechanism, however, even with the presence of the repX gene, there is no evidence on how pBsph replicates, whether it is through the rolling circle mechanism or the tetha pathway. When replicating, RCR plasmids generate a single-stranded DNA intermediate [31], which is a highly recombinogenic molecule [10], especially if there are MGEs like direct inverted repeats within. So, these kinds of plasmids can be easily excised by a RecA-dependent and independent recombination systems according to homology pairing and proximity of the sequences [32,33,34]. Accordingly, as seen in Table 1 and Figure 6, two Tns regions and many direct inverted repeats share a significant percentage of homology between pMK4 and pBsph replicons and/or near the replicon. Were a recombination event to occur at these points, the structure and replication of both plasmids could be compromised, in pBsph, for example, TubX transcription would be affected.
Conversely, the seg sequence found within pC194 and pMK4 has been predicted to positively regulate segregation, keeping stability during the process [15]. Despite this, it is not yet clear under which mechanism this region operates, as it is been reported that seg sequence may be a ssRNA transcript that can act in cis and trans within the repC gene [35]; the predicted structure of the seg sequence is presented in Figure 14. Likewise, the seg sequence in pC194 derivatives showed deletions at or near the seg location, most likely derived from an addition of two T’s that stabilize the stem loop of the sequence and create a cleavage site [35]. It is been described that deletions are RecE4 independent and that they occur with a 1000-fold higher frequency in Bacillus subtilis than in Escherichia coli [15]. However, since there was no homology found within pBsph, we discard the option of a second point of incompatibility between pMK4 and pBsph.
Although the addition of Ts was checked in the pMK4 sequence trough benchling and BLASTn, we cannot be sure that in vitro pMK4 does not contain these bases nor that these could be generated after some replication cycles. So, if the mutation appears, this could eventually lead to pMK4 loss in daughter cells.
In comparison, and in order to prevent loss under non-selective conditions, low copy plasmids use a partition system. The genes associated physically distribute plasmids to ensure that each daughter cell receives at least one plasmid upon cell division [36]. Besides rep regulation, there exists another relevant feature that plays a role into segregation: the toxin-antitoxin (T/A) system. In general, this system is comprised of a stable toxin and unstable antitoxin. After plasmid segregation and cell division, the antitoxin will degrade inside daughter cells without plasmid while plasmid-bearing cells will overcome this by the production of new antitoxin molecules, this post-segregation killing ensures the faithful transmission and stable maintenance in a population of a genetic element [37]. Such system has been reported in pBsph transmission, employing a type II group, where toxins have a nuclease activity affecting DNA replication, mRNA stability, translation, and cell-wall synthesis [38]. Being that there is a predicted negative regulation on pBsph replication, the T/A system represents a “counterattack” of sorts from pBsph to pMK4 antisense RNA. Since pBsph is a one-copy megaplasmid, downregulation of replication would lead to plasmid-free daughter cells, which would be eliminated along with pMK4 through the T/A system.
A model of incompatibility is presented in Figure 15, gathering the results of incA and CopT downregulation of replication within pBsph, as well as the recombination during RCR replication and posterior post-segregation killing by T/A system encoded by pBsph.
Correspondingly, pC194 has a par system, consisting of a type I T/A system (genetically termed ParABS) because it encodes a Walker-box ATPase, ParA, a DNA binding protein, parB, and a centromeric sequence, parS [39]. In particular, the properties of the conserved NTPase are the ones that define the mechanism of action of each group. On the other side, plasmid pBsph present a par system type III, with a GTPase named TubZ [30,40]. In plain sight, these features would indicate there is no incompatibility between pMK4 and pBsph, however, as described previously it is necessary to assess other regulation traits to check complete compatibility between plasmids.
4.2. Shuttle Vector pMK4 Stability Inside L. sphaericus III(3)7 Cells
Previous studies reported that pMK4 could be maintained at a rate of 70 to 90% in Bacillus subtilis after 10 generations without selective antibiotic pressure [14]. Figure 7 shows the stability of pMK4 over 120 h (300 generations approximately). Despite pMK4 retention lasting for over 72 h, bacterial titer would not increase under non-selective conditions, perhaps indicating that there is a limit antibiotic concentration tolerable so that plasmids can endure and guarantee cell survival. Furthermore, at day four, when only a slight band was found after the miniprep, titer had decreased an entire order of magnitude, and by day five no colonies or band were observed, indicating phenotype and plasmid loss. Results then indicate that pMK4 possesses a limited stability inside L. sphaericus III(3)7 cells. We believe this behavior derives from incompatibility between the pBsph predicted plasmid inside III(3)7 cells and pMK4, since the miniprep assay showed a conserved methylation pattern of pMK4 when extracted, suggesting maintenance features are conserved and that plasmid loss does not rely on restriction by the R-M system inside III(3)7 cells. However, further investigation is needed to check if is there exists a seg mutation like the one described above that could lead to pMK4 loss in daughter cells.
4.3. Metabolic Burden in L. sphaericus III(3)7
An imposed metabolic burden can be confirmed in Figure 8 where growth in enriched medium of plasmid-bearing cells is lower than that of plasmid-free cells, indicating a possible cost derived from pMK4 supercoiling during the exponential phase by ATP-dependent gyrases [41]. Comparably, Rep-like gene expression has shown to be highly dependent of host helicases, which may lead to altered replication networks and activation of stress responses [19]. Also, the growth of plasmid-bearing cells under different antibiotic concentrations showed an OD600 reduction directly proportional to chloramphenicol concentration, suggesting there is a fitness cost in population after the perturbation of cellular metabolism caused by increased plasmid replication and transcription of plasmid features. Indeed, the chloramphenicol acetyltransferase (CAT) gene in pMK4 represents 69.5% of the AT content which may contribute to alterations of host fitness by sequestration of RNA polymerase [10]. On the other hand, interactions between pMK4-encoded proteins and cellular networks, such as the pBsph A/T system, have the potential to produce a variety of deleterious effects that can influence plasmid transferability. Plasmid replication and maintenance processes related to metabolic cost in the host, such as RNA polymerase sequestration, reduction in translation efficiency of the host, interactions with cellular networks, among others are specified in [10].
Furthermore, we observed morphological changes in transformed III(3)7 cells, as shown in Figure 8. Cells became larger with every increase in chloramphenicol concentration, and only in the lowest concentration used (20 µg/mL) did they seem to have a comparable shape with that of plasmid-free cells. However, no sporulation was observed at any chloramphenicol concentration or under non-selective conditions in plasmid-bearing cells. At the same time, dark accumulations were found through light microscopy inside plasmid-bearing cells, presumably corresponding to semi-septum formations reported in host cells when the plasmid partition system affects cell division machinery, like the FtsZ protein [8,42]. Moreover, since pMK4 and pBsph appear to develop MGEs interactions, an increase in ssDNA concentrations during RCR may lead to activation SOS system in III(3)7 cells. Activation of the SOS regulon also results in inhibition of cell division by activation of the yneA gene [43,44,45], which generates a DNA damage- inducible cell filamentation, represented here as longer cells as chloramphenicol concentration raises; this translates into a decrease in bacterial fitness in the short term. Further investigation through TEM microscopy and dsDNA staining would be necessary to confirm presence of this structures and replicated chromosomal DNA accumulation inside cells.
Since no spores were found in plasmid-bearing cells, we wanted to look for genetic features associated with the perturbation of sporulation processes caused by pMK4. The sporulation process in Bacillus sp. initiates by a complex signaling pathway, mainly controlled by a two-component system termed phosphorelay, which culminates in the phosphorylation of the master control element of sporulation, Spo0A [46]. Therefore, sporulation regulation could be strongly associated with downregulation of phosphorelay functioning.
In B. subtilis, many sRNAs have been described to be transcribed particularly during the sporulation process, these genetic regions may perform a cis- or trans-acting manner and have demonstrated to be necessary for sporulation onset, forespore formation, and asymmetric division [47]. Table 4 shows the identity percentages between pMK4 and sRNAs reported to play an important role during sporulation. S424, S1024 and S1058 have been reported to be negative regulators of genes for spore coat assembly and resistance, genes involved in sporulation onset and on the sporulation initiation gene spo0A, respectively [48]. This could indicate some negative regulation points exerted by pMK4 on III(3)7 cells during sporulation stages due to regulatory sRNAs. Sporulation initiation is an irreversible process once the kinase cascade is activated, reason why Spo0A-like protein concentrations are under tight control before the spore-formation “decision” is made [43]. We presume that these mechanisms, and more importantly, the presence of the pMK4 vector, may interfere or delay sporulation and even perturb the metabolic state of III(3)7 cells.
4.4. Metabolite Production
As shown in Table 3, six relevant compounds were found to be present predominantly within III(3)7 cells growing in LB broth when compared with plasmid-bearing cells under chloramphenicol selective pressure. The compounds found are described as being part of different stages in the sporulation process and/or the dipiconilic acid pathway (DPA). The DPA is a major constituent of the spore core in Bacillus species and is involved in the germination and heat resistance of spores [49]. As shown in Figure 16, DPA is synthesized via the lysine biosynthetic pathway, using pyruvate and from oxaloacetate in the TCA cycle as precursors [50]. This shows the importance of metabolic pathway interaction during late growth and early sporulation.
The first compound found in III(3)7 plasmid-bearing cells is L-malate, which has been reported to delay sporulation onset at least until it is converted to oxalacetate during tricarboxylic acid (TCA) pathway [52,53]. Rather strangely, the latter has shown a rather positive effect in spore formation. Various peaks were found between 0.9 and 1.2 min of retention time (RT), one of them corresponds to L-malate as shown in Figure 10b, and it is evident that its concentration is higher in plasmid-bearing cells than it is in plasmid-free cells. Once sporulation starts, glycolysis enzymes are no longer needed [54], reason why this pathway is most likely not directly related to spore-forming stages. As mentioned before, it has been reported that there exists a link between the TCA cycle and sporulation [55]. This was confirmed since enzymes of this pathway are strongly induced and created just before the onset of sporulation, and their depletion results in decreased sporulation rates [56,57]. A lower concentration of L-malate in plasmid-free cells could indicate that it is being metabolized by TCA enzymes more than in plasmid-bearing samples, where it is probably being accumulated [58].
Moreover, glycerol-1-phosphate has been reported to be a substrate for glycerol phosphate dehydrogenase during some sporulation stages [59], and as a precursor of 3-phosphoglyceric acid (3-PGA), an energy reserve source found in high concentrations in the spore core [52]. Equivalently, succinyl glutamate, which was also found in higher concentrations within plasmid-free samples, is thought to be a precursor in the synthesis pathway of Ƴ-aminobutyric acid (GABA) by glutamate decarboxylase [49,60]. GABA is an additional supplement to the TCA cycle and was confirmed to be necessary for spore germination in Bacillus megaterium [61]. On the other hand, and considering cells were collected at late exponential-phase state, the pyruvate dehydrogenase (PHP) complex is composed of three different enzymes: pyruvate decarboxylase (E1), dihydrolipoamide dehydrogenase (E2), and lipoamide dehydrogenase (E3), this complex acts on the metabolism of pyruvate to DPA, with acetyl dihydrolipoamide as substrate of E2 enzyme of PHP [62,63]. This compound was also found in to be in higher concentration in plasmid-free samples. Indeed, this compound may also be involved in protoxin regulation in Bacillus sp. since it is been reported that E2 also bounds to δ-endotoxin in B. thuringiensis [64].
Lysinibacillus was separated from the Bacillus genus owing to a particular peptidoglycan composition comprising high content of lysine and aspartate [12]. Lysine was found to be present in higher concentration within plasmid-free than plasmid-bearing cells, this could be related to the morphological perturbations pMK4 appears to exert on III(3)7 cells. Having an elongated shape and being unable to divide, avoids peptidoglycan synthesis for daughter cell wall.
In addition, butylhydroquinone and methylquinone found in the positive polarity chromatogram (Figure 10a), have been described as having an important role in sporulation through electron chain regulation [61,65,66]. Methylquinone increases have been reported during the late exponential growth phase and early sporulation; this is perhaps why it is not found within plasmid-bearing cells, where no sporulation was observed either through SEM or light microscopy assays. Similarly, quinone-like molecules have been functionally related to cytochrome C, since both showed an increased concentration at early sporulation stages [66,67]. Cytochrome C550 (CC550) appears to be indispensable during the early stages of sporulation in B. subtilis. In spite of this, its mode of action is still elusive and not well understood. Studies have shown that overexpression of cccA (the CC550 encoding gene) dramatically increased spo0A transcripts [61,66]. Sporulation is a process that strongly depends on Spo0A levels to initiate, and so, alteration in Spo0A concentration perturbs sporulation onset. Monoethanolamide, which was found to be present mainly in plasmid-free cells, is related to phosphatidyl ethanolamine, a phospholipid found to comprise nearly a 90% of lipid extract at sporulation onset stages in B. subtilis along with phosphatidyl glycerol, and diphosphatidyl glycerol. In contrast, non-common peaks found through negative polarity (Figure 10b) for plasmid-bearing cells showed a steroid-like molecule, which has been noted as an electron transport chain and cytochrome C inhibitor [68,69,70]. We assume this is another downregulation point controlling sporulation due to the presence of the pMK4 plasmid within III(3)7 cell.
4.5. Changes in Larvicidal Activity against Cx. quinquefasciatus and Ae. aegypti Larvae
The larvicidal effect of L. sphaericus III(3)7 vegetative cells is attributed to a synergistic activity between Mtx toxins, chitinases, hemolysins and the S-layer protein co-expressed during exponential phase [18,71]. We speculate that pMK4 carriage may interfere with other metabolic networks besides wall formation and sporulation onset which demand high energy input, such as toxin production within the host. The significant differences between the mortality rate of plasmid-free and plasmid bearing III(3)7 cells for both Cx. quinquefasciatus and Ae. aegypti larvae found in this study could indicate an interference by energy cost means or molecular gene regulation in host chromosome expression of secondary metabolites. Since Mtx toxins, chitinases, hemolysins and S-layer protein act in a synergistic way, any alteration on their synthesis or function could lead to the decrease in larvicidal activity reported in this study. Although there was no significative difference in the mortality rate of treatments for Ae. aegypti larvae at 48 h, we can at least see a delayed toxic effect since no replicas of the plasmid-bearing cells treatment achieved a 100% mortality rate, contrasting sharply with plasmid-free cell treatments. We suggest further investigation on regulation marks at secondary metabolites production routes to confirm a possible interfering mechanism of pMK4 within entomopathogenic toxins metabolism.
5. Conclusions
There is a possible incompatibility between the shuttle vector pMK4 and the toxin encoding plasmid pBsph. This is supported by the finding of an incA region within pMK4 and its predicted union to the repX replicon, as well as DNA recombination hotspots found within or near the repX replicon and the loss of function and phenotype after approximately 72 h of non-selective growth conditions. It is important to consider the variability of the bacterial and plasmid characteristics presented in this study, especially since metabolic studies with MGEs like plasmids require non-perturbating conditions inside cell for reliable analysis. It is of special importance to review incompatibility networks in L. sphaericus III(3)7 since only recently was its transformation achieved. Further experimental studies such as the assessment of seg− mutations and plasmid curation with pBsph are needed to confirm the model presented in this study.
In addition, we conclude that the pMK4 plasmid is exerting a notable metabolic burden within L. sphaericus III(3)7 cells, this can be supported by the reduced growth rate observed in selective and non-selective conditions. Likewise, normal division, spore formation and shape appear to be affected by pMK4 maintenance and replication. Similarly, a reduced larvicidal activity on Ae. aegypti an Cx. quinquefasciatus larvae was found when comparing plasmid-bearing to plasmid-free cells, further supporting the hypothesis regarding metabolic burden on L. sphaericus III(3)7 cells by pMK4. Further studies on sporulation negative regulation such as assessment of metabolite production in late stages and semi-septum formation are required.
Author Contributions
Conceptualization, D.C.L. and J.D.; formal analysis, D.C.L.; funding acquisition, J.D.; investigation, D.C.L. and J.D.; methodology, D.C.L. and J.D.; project administration, J.D.; resources, J.D.; supervision, J.D.; validation, D.C.L.; visualization, D.C.L.; writing—original draft, D.C.L.; writing—review and editing, D.C.L. and J.D. All authors have read and agreed to the published version of the manuscript.
Funding
This research was funded by the Research Fund at the School of Science at Universidad de los Andes call 2019-2 for the Financing of Projects of Investigation and Participation in Academic Events Category Master Students, project codes INV-2019-68-1740 and INV-2019-84-1827 and the Microbiological Research Center (CIMIC). APC was funded by School of Science at Universidad de los Andes and the Microbiological Research Center (CIMIC).
Institutional Review Board Statement
Not applicable.
Informed Consent Statement
Not applicable.
Acknowledgments
We are grateful to Rosa Tulia Pulido for her help in the recollection of Ae. aegypti larvae in La Mesa, Cundinamarca, we want to thank Julián Santamaría as well for his help in the recollection of Cx quinquefasciatus larvae in Bogotá, Cundinamarca. We are also grateful to the other members of the Centro de Investigaciones Microbiológcas (CIMIC), in particular to Mario Felipe Dániel, professional in scientific writing, for the English grammar corrections provided. Finally, we would like to thank Julián Santamaría and Alejandro Camacho for their help by elucidating some of the mass spectra.
Conflicts of Interest
The authors declare no conflict of interest. The funders had no role in the design of the study; in the collection, analyses, or interpretation of data; in the writing of the manuscript, or in the decision to publish the results.
References
- Gómez-Garzón, C.; Hernández-Santana, A.; Dussán, J. Comparative Genomics Reveals Lysinibacillus sphaericus Group Comprises a Novel Species. BMC Genom. 2016, 17, 709. [Google Scholar] [CrossRef] [PubMed] [Green Version]
- Fu, P.; Ge, Y.; Wu, Y.; Zhao, N.; Yuan, Z.; Hu, X. The LspC3–41I Restriction-Modification System Is the Major Determinant for Genetic Manipulations of Lysinibacillus sphaericus C3–41. BMC Microbiol. 2017, 17, 116. [Google Scholar] [CrossRef] [PubMed]
- Edo, J.; Dussán, V.; Dussán, J. Adsorption of Toxic Metals and Control of Mosquitos-Borne Disease by Lysinibacillus sphaericus: Dual Benefits for Health and Environment. Biomed. Environ. Sci. 2016, 29, 187–196. [Google Scholar] [CrossRef]
- Lozano, L.C.; Dussán, J. Synergistic Activity Between S-Layer Protein and Spore-Crystal Preparations from Lysinibacillus sphaericus Against Culex Quinquefasciatus Larvae. Curr. Microbiol. 2017, 74, 371–376. [Google Scholar] [CrossRef] [PubMed]
- Rey, A.; Silva-Quintero, L.; Dussán, J. Complete Genome Sequencing and Comparative Genomic Analysis of Functionally Diverse Lysinibacillus sphaericus III(3)7. Genom. Data 2016, 9, 78–86. [Google Scholar] [CrossRef] [Green Version]
- Lozano, L.C.; Dussán, J. Metal Tolerance and Larvicidal Activity of Lysinibacillus sphaericus. World J. Microbiol. Biotechnol. 2013, 29, 1383–1389. [Google Scholar] [CrossRef]
- Radeck, J.; Kraft, K.; Bartels, J.; Cikovic, T.; Dürr, F.; Emenegger, J.; Kelterborn, S.; Sauer, C.; Fritz, G.; Gebhard, S.; et al. The Bacillus BioBrick Box: Generation and Evaluation of Essential Genetic Building Blocks for Standardized Work with Bacillus Subtilis. J. Biol. Eng. 2013, 7, 29. [Google Scholar] [CrossRef] [Green Version]
- Silva, F.; Queiroz, J.A.; Domingues, F.C. Evaluating Metabolic Stress and Plasmid Stability in Plasmid DNA Production by Escherichia coli. Biotechnol. Adv. 2012, 30, 691–708. [Google Scholar] [CrossRef]
- Friehs, K. Plasmid Copy Number and Plasmid Stability. Adv. Biochem. Eng. Biotechnol. 2004, 86, 47–82. [Google Scholar] [CrossRef]
- Juan, C.A.; Tolmasky, M.E. Plasmids: Biology and Impact in Biotechnology and Discovery; American Society of Microbiology: Washington, DC, USA, 2015; ISBN 978-1-55581-897-5. [Google Scholar]
- Muschiol, S.; Balaban, M.; Normark, S.; Henriques-Normark, B. Uptake of Extracellular DNA: Competence Induced Pili in Natural Transformation of Streptococcus Pneumoniae. Bioessays 2015, 37, 426–435. [Google Scholar] [CrossRef] [Green Version]
- Ahmed, I.; Yokota, A.; Yamazoe, A.; Fujiwara, T. Proposal of Lysinibacillus boronitolerans Gen. Nov. Sp. Nov., and Transfer of Bacillus fusiformis to Lysinibacillus fusiformis Comb. Nov. and Bacillus sphaericus to Lysinibacillus sphaericus Comb. Nov. Int. J. Syst. Evol. Microbiol. 2007, 57, 1117–1125. [Google Scholar] [CrossRef] [PubMed] [Green Version]
- Velappan, N.; Sblattero, D.; Chasteen, L.; Pavlik, P.; Bradbury, A.R.M. Plasmid Incompatibility: More Compatible than Previously Thought? Protein Eng. Des. Sel. 2007, 20, 309–313. [Google Scholar] [CrossRef] [PubMed]
- Sullivan, M.A.; Yasbin, R.E.; Young, F.E. New Shuttle Vectors for Bacillus subtilis and Escherichia coli Which Allow Rapid Detection of Inserted Fragments. Gene 1984, 29, 21–26. [Google Scholar] [CrossRef]
- Alonso, J.C.; Trautner, T.A. A Gene Controlling Segregation of the Bacillus subtilis Plasmid PC194. Mol. Gen. Genet. 1985, 198, 427–431. [Google Scholar] [CrossRef] [PubMed]
- Garcillán-Barcia, M.P.; Alvarado, A.; de la Cruz, F. Identification of Bacterial Plasmids Based on Mobility and Plasmid Population Biology. FEMS Microbiol. Rev. 2011, 35, 936–956. [Google Scholar] [CrossRef] [Green Version]
- Alonso, J.C.; Tailor, R.H. Initiation of Plasmid PC194 Replication and Its Control in Bacillus Subtilis. Mol. Gen. Genet. 1987, 210, 476–484. [Google Scholar] [CrossRef]
- Santana-Martinez, J.C.; Silva, J.J.; Dussan, J. Efficacy of Lysinibacillus sphaericus against Mixed-Cultures of Field-Collected and Laboratory Larvae of Aedes aegypti and Culex quinquefasciatus. Bull. Entomol. Res. 2019, 109, 111–118. [Google Scholar] [CrossRef]
- San Millan, A.; MacLean, R.C. Fitness Costs of Plasmids: A Limit to Plasmid Transmission. Microbiol. Spectr. 2017, 5. [Google Scholar] [CrossRef] [Green Version]
- Carloni, E.; Andreoni, F.; Omiccioli, E.; Villa, L.; Magnani, M.; Carattoli, A. Comparative Analysis of the Standard PCR-Based Replicon Typing (PBRT) with the Commercial PBRT-KIT. Plasmid 2017, 90, 10–14. [Google Scholar] [CrossRef]
- Hu, X.; Fan, W.; Han, B.; Liu, H.; Zheng, D.; Li, Q.; Dong, W.; Yan, J.; Gao, M.; Berry, C.; et al. Complete Genome Sequence of the Mosquitocidal Bacterium Bacillus sphaericus C3-41 and Comparison with Those of Closely Related Bacillus Species. J. Bacteriol. 2008, 190, 2892–2902. [Google Scholar] [CrossRef] [Green Version]
- Zheng, X.; Hu, G.-Q.; She, Z.-S.; Zhu, H. Leaderless Genes in Bacteria: Clue to the Evolution of Translation Initiation Mechanisms in Prokaryotes. BMC Genom. 2011, 12, 361. [Google Scholar] [CrossRef] [PubMed] [Green Version]
- Horinouchi, S.; Weisblum, B. Nucleotide Sequence and Functional Map of PC194, a Plasmid That Specifies Inducible Chloramphenicol Resistance. J. Bacteriol. 1982, 150, 815–825. [Google Scholar] [CrossRef] [PubMed] [Green Version]
- Persson, C.; Wagner, E.G.; Nordström, K. Control of Replication of Plasmid R1: Structures and Sequences of the Antisense RNA, CopA, Required for Its Binding to the Target RNA, CopT. EMBO J. 1990, 9, 3767–3775. [Google Scholar] [CrossRef]
- Slagter-Jäger, J.G. CopA and CopT: The Perfect RNA Couple. Ph.D. Thesis, Uppsala University, Uppsala, Sweden, 2003. [Google Scholar]
- Herskovitz, M.A.; Bechhofer, D.H. Endoribonuclease RNase III Is Essential in Bacillus subtilis. Mol. Microbiol. 2000, 38, 1027–1033. [Google Scholar] [CrossRef] [Green Version]
- Commichau, F.M.; Stülke, J. A Mystery Unraveled: Essentiality of RNase III in Bacillus subtilis Is Caused by Resident Prophages. PLoS Genet. 2012, 8. [Google Scholar] [CrossRef]
- Brantl, S. Plasmid Replication Control by Antisense RNAs. Microbiol. Spectr. 2014, 2. [Google Scholar] [CrossRef] [Green Version]
- Del Solar, G.; Espinosa, M. Plasmid Copy Number Control: An Ever-Growing Story. Mol. Microbiol. 2000, 37, 492–500. [Google Scholar] [CrossRef] [PubMed] [Green Version]
- Ge, Y.; Zhao, N.; Hu, X.; Shi, T.; Cai, Q.; Yuan, Z. A Novel Transcriptional Activator, TubX, Is Required for the Stability of Bacillus sphaericus Mosquitocidal Plasmid PBsph. J. Bacteriol. 2014, 196, 4304–4314. [Google Scholar] [CrossRef] [Green Version]
- Meijer, W.J.J.; Wisman, G.B.A.; Terpstra, P.; Thorsted, P.B.; Thomas, C.M.; Holsappel, S.; Venema, G.; Bron, S. Rolling-Circle Plasmids from Bacillus subtilis: Complete Nucleotide Sequences and Analyses of Genes of PTA1015, PTA1040, PTA1050 and PTA1060, and Comparisons with Related Plasmids from Gram-Positive Bacteria. FEMS Microbiol. Rev. 1998, 21, 337–368. [Google Scholar] [CrossRef] [PubMed]
- Azpiroz, M.F.; Laviña, M. Analysis of RecA-Independent Recombination Events between Short Direct Repeats Related to a Genomic Island and to a Plasmid in Escherichia coli K12. PeerJ 2017, 5. [Google Scholar] [CrossRef]
- Bzymek, M.; Lovett, S.T. Instability of Repetitive DNA Sequences: The Role of Replication in Multiple Mechanisms. Proc. Natl. Acad. Sci. USA 2001, 98, 8319–8325. [Google Scholar] [CrossRef] [PubMed] [Green Version]
- Michel, B.; Ehrlich, S.D. Illegitimate Recombination Occurs between the Replication Origin of the Plasmid PC194 and a Progressing Replication Fork. EMBO J. 1986, 5, 3691–3696. [Google Scholar] [CrossRef] [PubMed]
- Ballester, S.; Lopez, P.; Espinosa, M.; Alonso, J.C.; Lacks, S.A. Plasmid Structural Instability Associated with PC194 Replication Functions. J. Bacteriol. 1989, 171, 2271–2277. [Google Scholar] [CrossRef] [Green Version]
- Alonso, J.C.; Trautner, T.A. Generation of Deletions through a Cis-Acting Mutation in Plasmid PC194. Mol. Gen. Genet. 1985, 198, 432–436. [Google Scholar] [CrossRef]
- Baxter, J.; Funnell, B. Plasmid Partition Mechanisms. Microbiol. Spectr. 2014, 2. [Google Scholar] [CrossRef] [PubMed] [Green Version]
- Guglielmini, J.; Van Melderen, L. Bacterial Toxin-Antitoxin Systems. Mob. Genet. Elem. 2011, 1, 283–290. [Google Scholar] [CrossRef] [Green Version]
- Fu, P.; Ge, Y.; Hu, Y.; Yuan, Z.; Hu, X. A Toxin-Antitoxin System Is Essential for the Stability of Mosquitocidal Plasmid PBsph of Lysinibacillus Sphaericus. Microbiol. Res. 2018, 214, 114–122. [Google Scholar] [CrossRef]
- Chang, S.; Chang, S.Y.; Gray, O. Structural and Genetic Analyses of a Par Locus That Regulates Plasmid Partition in Bacillus subtilis. J. Bacteriol. 1987, 169, 3952–3962. [Google Scholar] [CrossRef] [Green Version]
- Ge, Y.; Hu, X.; Zhao, N.; Shi, T.; Cai, Q.; Yuan, Z. A New TubRZ Operon Involved in the Maintenance of the Bacillus sphaericus Mosquitocidal Plasmid PBsph. Microbiology 2014, 160, 1112–1124. [Google Scholar] [CrossRef] [PubMed]
- Reyes-Domínguez, Y.; Contreras-Ferrat, G.; Ramírez-Santos, J.; Membrillo-Hernández, J.; Gómez-Eichelmann, M.C. Plasmid DNA Supercoiling and Gyrase Activity in Escherichia coli Wild-Type and RpoS Stationary-Phase Cells. J. Bacteriol. 2003, 185, 1097–1100. [Google Scholar] [CrossRef] [Green Version]
- Butler, Y.X.; Abhayawardhane, Y.; Stewart, G.C. Amplification of the Bacillus subtilis Maf Gene Results in Arrested Septum Formation. J. Bacteriol. 1993, 175, 3139–3145. [Google Scholar] [CrossRef] [Green Version]
- Lenhart, J.S.; Schroeder, J.W.; Walsh, B.W.; Simmons, L.A. DNA Repair and Genome Maintenance in Bacillus Subtilis. Microbiol. Mol. Biol. Rev. 2012, 76, 530–564. [Google Scholar] [CrossRef] [Green Version]
- Jameson, K.H.; Wilkinson, A.J. Control of Initiation of DNA Replication in Bacillus subtilis and Escherichia coli. Genes 2017, 8, 22. [Google Scholar] [CrossRef]
- Jameson, K.H.; Rostami, N.; Fogg, M.J.; Turkenburg, J.P.; Grahl, A.; Murray, H.; Wilkinson, A.J. Structure and Interactions of the Bacillus subtilis Sporulation Inhibitor of DNA Replication, SirA, with Domain I of DnaA. Mol. Microbiol. 2014, 93, 975–991. [Google Scholar] [CrossRef] [PubMed] [Green Version]
- Banse, A.V.; Hobbs, E.C.; Losick, R. Phosphorylation of Spo0A by the Histidine Kinase KinD Requires the Lipoprotein Med in Bacillus subtilis. J. Bacteriol. 2011, 193, 3949–3955. [Google Scholar] [CrossRef] [PubMed] [Green Version]
- Mars, R.A.T.; Nicolas, P.; Denham, E.L.; van Dijl, J.M. Regulatory RNAs in Bacillus subtilis: A Gram-Positive Perspective on Bacterial RNA-Mediated Regulation of Gene Expression. Microbiol. Mol. Biol. Rev. 2016, 80, 1029–1057. [Google Scholar] [CrossRef] [Green Version]
- Kimura, T.; Kobayashi, K. Role of Glutamate Synthase in Biofilm Formation by Bacillus subtilis. J. Bacteriol. 2020, 202. [Google Scholar] [CrossRef] [PubMed]
- Mars, R. The Regulatory RNAs of Bacillus subtilis. Available online: https://research.rug.nl/en/publications/the-regulatory-rnas-of-bacillus-subtilis (accessed on 12 November 2020).
- McClintock, M.K.; Fahnhorst, G.W.; Hoye, T.R.; Zhang, K. Engineering the Production of Dipicolinic Acid in E. coli. Metab. Eng. 2018, 48, 208–217. [Google Scholar] [CrossRef]
- Toya, Y.; Hirasawa, T.; Ishikawa, S.; Chumsakul, O.; Morimoto, T.; Liu, S.; Masuda, K.; Kageyama, Y.; Ozaki, K.; Ogasawara, N.; et al. Enhanced Dipicolinic Acid Production during the Stationary Phase in Bacillus subtilis by Blocking Acetoin Synthesis. Biosci. Biotechnol. Biochem. 2015. [Google Scholar] [CrossRef] [Green Version]
- Korza, G.; Abini-Agbomson, S.; Setlow, B.; Shen, A.; Setlow, P. Levels of L-Malate and Other Low Molecular Weight Metabolites in Spores of Bacillus Species and Clostridium difficile. PLoS ONE 2017, 12, e0182656. [Google Scholar] [CrossRef] [Green Version]
- Ohné, M.; Rutberg, B. Repression of Sporulation in Bacillus subtilis by L-Malate. J. Bacteriol. 1976, 125, 453–460. [Google Scholar] [CrossRef] [Green Version]
- Boguslawski, K.M.; Hill, P.A.; Griffith, K.L. Novel Mechanisms of Controlling the Activities of the Transcription Factors Spo0A and ComA by the Plasmid-Encoded Quorum Sensing Regulators Rap60-Phr60 in Bacillus subtilis. Mol. Microbiol. 2015, 96, 325–348. [Google Scholar] [CrossRef] [Green Version]
- Doi, R.H. Sporulation and Germination. In Bacillus; Harwood, C.R., Ed.; Biotechnology Handbooks; Springer US: Boston, MA, USA, 1989; pp. 169–215. ISBN 978-1-4899-3502-1. [Google Scholar]
- Wang, J.; Mei, H.; Zheng, C.; Qian, H.; Cui, C.; Fu, Y.; Su, J.; Liu, Z.; Yu, Z.; He, J. The Metabolic Regulation of Sporulation and Parasporal Crystal Formation in Bacillus thuringiensis Revealed by Transcriptomics and Proteomics. Mol. Cell. Proteom. 2013, 12, 1363–1376. [Google Scholar] [CrossRef] [Green Version]
- Aronson, J.N.; Borris, D.P.; Doerner, J.F.; Akers, E. Gamma-Aminobutyric Acid Pathway and Modified Tricarboxylic Acid Cycle Activity during Growth and Sporulation of Bacillus thuringiensis. Appl. Microbiol. 1975, 30, 489–492. [Google Scholar] [CrossRef]
- Meyer, F.M.; Stülke, J. Malate Metabolism in Bacillus Subtilis: Distinct Roles for Three Classes of Malate-Oxidizing Enzymes. FEMS Microbiol. Lett. 2013, 339, 17–22. [Google Scholar] [CrossRef] [Green Version]
- Freese, E.B.; Vasantha, N.; Freese, E. Induction of Sporulation in Developmental Mutants of Bacillus Subtilis. Molec. Gen. Genet. 1979, 170, 67–74. [Google Scholar] [CrossRef] [PubMed]
- Shin, I.; Ryu, H.-B.; Yim, H.-S.; Kang, S.-O. Cytochrome C550 Is Related to Initiation of Sporulation in Bacillus Subtilis. J. Microbiol. 2005, 43, 244–250. [Google Scholar] [PubMed]
- Aubert, J.P.; Millet, J.; Pineau, E.; Milhaud, G. N-Succinyl-L-glutamic acid in Bacillus megaterium during sporulation. Biochimica et Biophysica Acta 1961, 51, 529–537. [Google Scholar] [CrossRef]
- Gao, H.; Jiang, X.; Pogliano, K.; Aronson, A.I. The E1β and E2 Subunits of the Bacillus subtilis Pyruvate Dehydrogenase Complex Are Involved in Regulation of Sporulation. J. Bacteriol. 2002, 184, 2780–2788. [Google Scholar] [CrossRef] [PubMed] [Green Version]
- Ogura, M.; Sato, T.; Abe, K. Bacillus subtilis YlxR, Which Is Involved in Glucose-Responsive Metabolic Changes, Regulates Expression of TsaD for Protein Quality Control of Pyruvate Dehydrogenase. Front. Microbiol. 2019, 10. [Google Scholar] [CrossRef] [Green Version]
- Walter, T.; Aronson, A. Specific Binding of the E2 Subunit of Pyruvate Dehydrogenase to the Upstream Region of Bacillus thuringiensis Protoxin Genes. J. Biol. Chem. 1999, 274, 7901–7906. [Google Scholar] [CrossRef] [PubMed] [Green Version]
- Farrand, S.K.; Taber, H.W. Changes in Menaquinone Concentration during Growth and Early Sporulation in Bacillus subtilis. J. Bacteriol. 1974, 117, 324–326. [Google Scholar] [CrossRef] [Green Version]
- Winstedt, L.; von Wachenfeldt, C. Terminal Oxidases of Bacillus subtilis Strain 168: One Quinol Oxidase, Cytochrome Aa3 or Cytochrome Bd, Is Required for Aerobic Growth. J. Bacteriol. 2001, 182, 6557–6564. [Google Scholar] [CrossRef] [PubMed] [Green Version]
- Huyen, N.T.T.; Eiamphungporn, W.; Mäder, U.; Liebeke, M.; Lalk, M.; Hecker, M.; Helmann, J.D.; Antelmann, H. Genome-Wide Responses to Carbonyl Electrophiles in Bacillus subtilis: Control of the Thiol-Dependent Formaldehyde Dehydrogenase AdhA and Cysteine Proteinase YraA by the MerR-Family Regulator YraB (AdhR). Mol. Microbiol. 2009, 71, 876–894. [Google Scholar] [CrossRef] [PubMed]
- Berry, E.A.; Huang, L.; Lee, D.-W.; Daldal, F.; Nagai, K.; Minagawa, N. Ascochlorin Is a Novel, Specific Inhibitor of the Mitochondrial Cytochrome Bc1 Complex. Biochim. et Biophys. Acta 2010, 1797, 360. [Google Scholar] [CrossRef] [Green Version]
- Fisher, N.; Meunier, B. Molecular Basis of Resistance to Cytochrome Bc1 Inhibitors. FEMS Yeast Res. 2008, 8, 183–192. [Google Scholar] [CrossRef] [PubMed] [Green Version]
- Rojas-Pinzón, P.A.; Dussán, J. Efficacy of the Vegetative Cells of Lysinibacillus sphaericus for Biological Control of Insecticide-Resistant Aedes aegypti. Parasites Vectors 2017, 10, 231. [Google Scholar] [CrossRef] [Green Version]
Figure 1.
Stability assay assembly. Plasmid-bearing (PB) cells were grown in LB broth without selective pressure, aliquots were taken every 12 h and put in fresh medium. Titer by SP-SDS were made every 12 h in LB agar and LB agar (LB) supplemented with 35 μg/mL of chloramphenicol (LB+). Plasmid miniprep was also made every 12 h, samples were run in an agarose gel to check pMK4 presence.

Figure 2.
Alignments and replicon organizations of pC194 and pMK4. (a) Disposition of cop and cop-like sequences in pC194 from S. sciuri, seg sequence is in green; (b) pMK4 replicon; (c) position and organization of repH, incA and copT sequences in pC194.
Figure 2.
Alignments and replicon organizations of pC194 and pMK4. (a) Disposition of cop and cop-like sequences in pC194 from S. sciuri, seg sequence is in green; (b) pMK4 replicon; (c) position and organization of repH, incA and copT sequences in pC194.

Figure 3.
Structures reported for repX replicon and incA at 3′ extreme (a) and 5′ end (b) in repX replicon. Red arrow shows an AUG codon of repX gene.
Figure 3.
Structures reported for repX replicon and incA at 3′ extreme (a) and 5′ end (b) in repX replicon. Red arrow shows an AUG codon of repX gene.

Figure 4.
Minimal energy index (a) and mfe profile per position (b) of incA-repX replicon predicted interaction are showed.
Figure 4.
Minimal energy index (a) and mfe profile per position (b) of incA-repX replicon predicted interaction are showed.

Figure 5.
MGEs region (orange) and direct inverted repeats of Tn3 found within. Black lines represent the position of direct inverted repeats.
Figure 5.
MGEs region (orange) and direct inverted repeats of Tn3 found within. Black lines represent the position of direct inverted repeats.

Figure 6.
Stability assay. (a) Colonies counted on LB agar (LB) and LB agar supplemented with 35 μg/mL of chloramphenicol (LB+); (b) agarose gel of plasmid minipreps performed every 24 h on aliquots from the assay; weight marker (WM), lane 1: pMK4 control; lane 2: plasmid miniprep at 24 h; lane 3: plasmid miniprep at 48 h; lane 4: plasmid miniprep at 72 h; lane 5: plasmid miniprep at 96 h; lane 6: plasmid miniprep at 120 h; lane 7: plasmid miniprep of plasmid-free cells.

Figure 7.
Growth rate of plasmid-bearing and plasmid-free cells of L. sphaericus III(3)7 in 17 h, 10 mL batch cultures. Growth curve in LB broth of L. sphaericus III(3)7 plasmid-free cells [III(3)7 (LB)], III(3)7 plasmid-bearing cells grown in LB [K4 (LB)] and plasmid-bearing cells grown in LB supplemented with 20, 30 and 40 µg/mL of chloramphenicol.

Figure 8.
SEM micrographs of L. sphaericus III(3) 7 plasmid-free and plasmid-bearing cells. III(3)7 plasmid-free cells after 12 h (a) and 24 h (b,c) of growth in LB broth, red arrows point to different spore stages. Plasmid-bearing III(3)7 cells after 12 h (d) and 24 h (e) of growth in LB broth without selective pressure.

Figure 9.
Possible semi-septum formation in III(3)7 plasmid-bearing cells under 35 µg/mL of chloramphenicol. (a) III(3) plasmid-bearing cells after 12 h of growth under selective pressure; (b) zoom of cell deformation seen in micrograph (a) related to semi-septum formation; (c) light microscopy of plasmid-bearing cells under 20 µg/mL of chloramphenicol, red arrows point to dark accumulations within cell.

Figure 10.
Chromatograms in positive (a) and negative (b) polarity of plasmid-bearing (red profile) and plasmid-free (blue profile); green peaks correspond to blank. Conditions are detailed in text; red arrows point to analyzed peaks, in (a): (1) → monoethanolamine, (2) → butyl ethylmalonate, (3) → butylhydroquinone; in (b): (1) → L-malate, (2) → Succinyl glutamate—glycerol phosphate—dihydrolipoamide—d-lysine, (3) → steroid derivatives, (4) → benzenesulfonic acid, (5) → Igirenin glucoside. Blue arrows in (a,b) correspond to long lipids with phosphate groups.

Figure 11.
Mortality of field-collected Ae. aegypti and Cx quinquefasciatus larvae exposed to plasmid-bearing (PB) and plasmid-free (PF) L. sphaericus III(3)7 vegetative cells (107 CFU ml−1) after 24 h and 48 h of exposure; *: negative controls.
Figure 11.
Mortality of field-collected Ae. aegypti and Cx quinquefasciatus larvae exposed to plasmid-bearing (PB) and plasmid-free (PF) L. sphaericus III(3)7 vegetative cells (107 CFU ml−1) after 24 h and 48 h of exposure; *: negative controls.

Figure 12.
pC194 replicon organization, detailed in text.

Figure 13.
Secondary structure composed by hairpin loops of incA (a,b) and repX replicon RNA (c,d). Red square in (a) is being zoomed in (b) and red arrows indicate the start and end of sequence reported to interact with each other; (c) corresponds to interaction regions of repX 5′ end with incA and (d) shows interactions regions at repX 3′ end.

Figure 14.
seg hairpin structure, addition of Ts are marked by arrows and the new cleavage site is underlined. Taken from [36].
Figure 14.
seg hairpin structure, addition of Ts are marked by arrows and the new cleavage site is underlined. Taken from [36].

Figure 15.
Model of incompatibility between pBsph and pMK4 inside L. sphaericus III(3)7 cells. (A) Incompatibility with incA region; (B) recombination at hotspots by RecA-dependant and independent pathways.
Figure 15.
Model of incompatibility between pBsph and pMK4 inside L. sphaericus III(3)7 cells. (A) Incompatibility with incA region; (B) recombination at hotspots by RecA-dependant and independent pathways.

Figure 16.
Dipiconilic acid metabolic route. (a) DPA synthesis related to glycolysis and TCA pathways; (b) enzymatic reactions and chemical rearrangements performed within DPA metabolic pathway; red arrows show the route points were analyzed metabolites would exert a perturbation, red square point to the suggested pathway of action of cytochrome C550. Images adapted from [50,51].


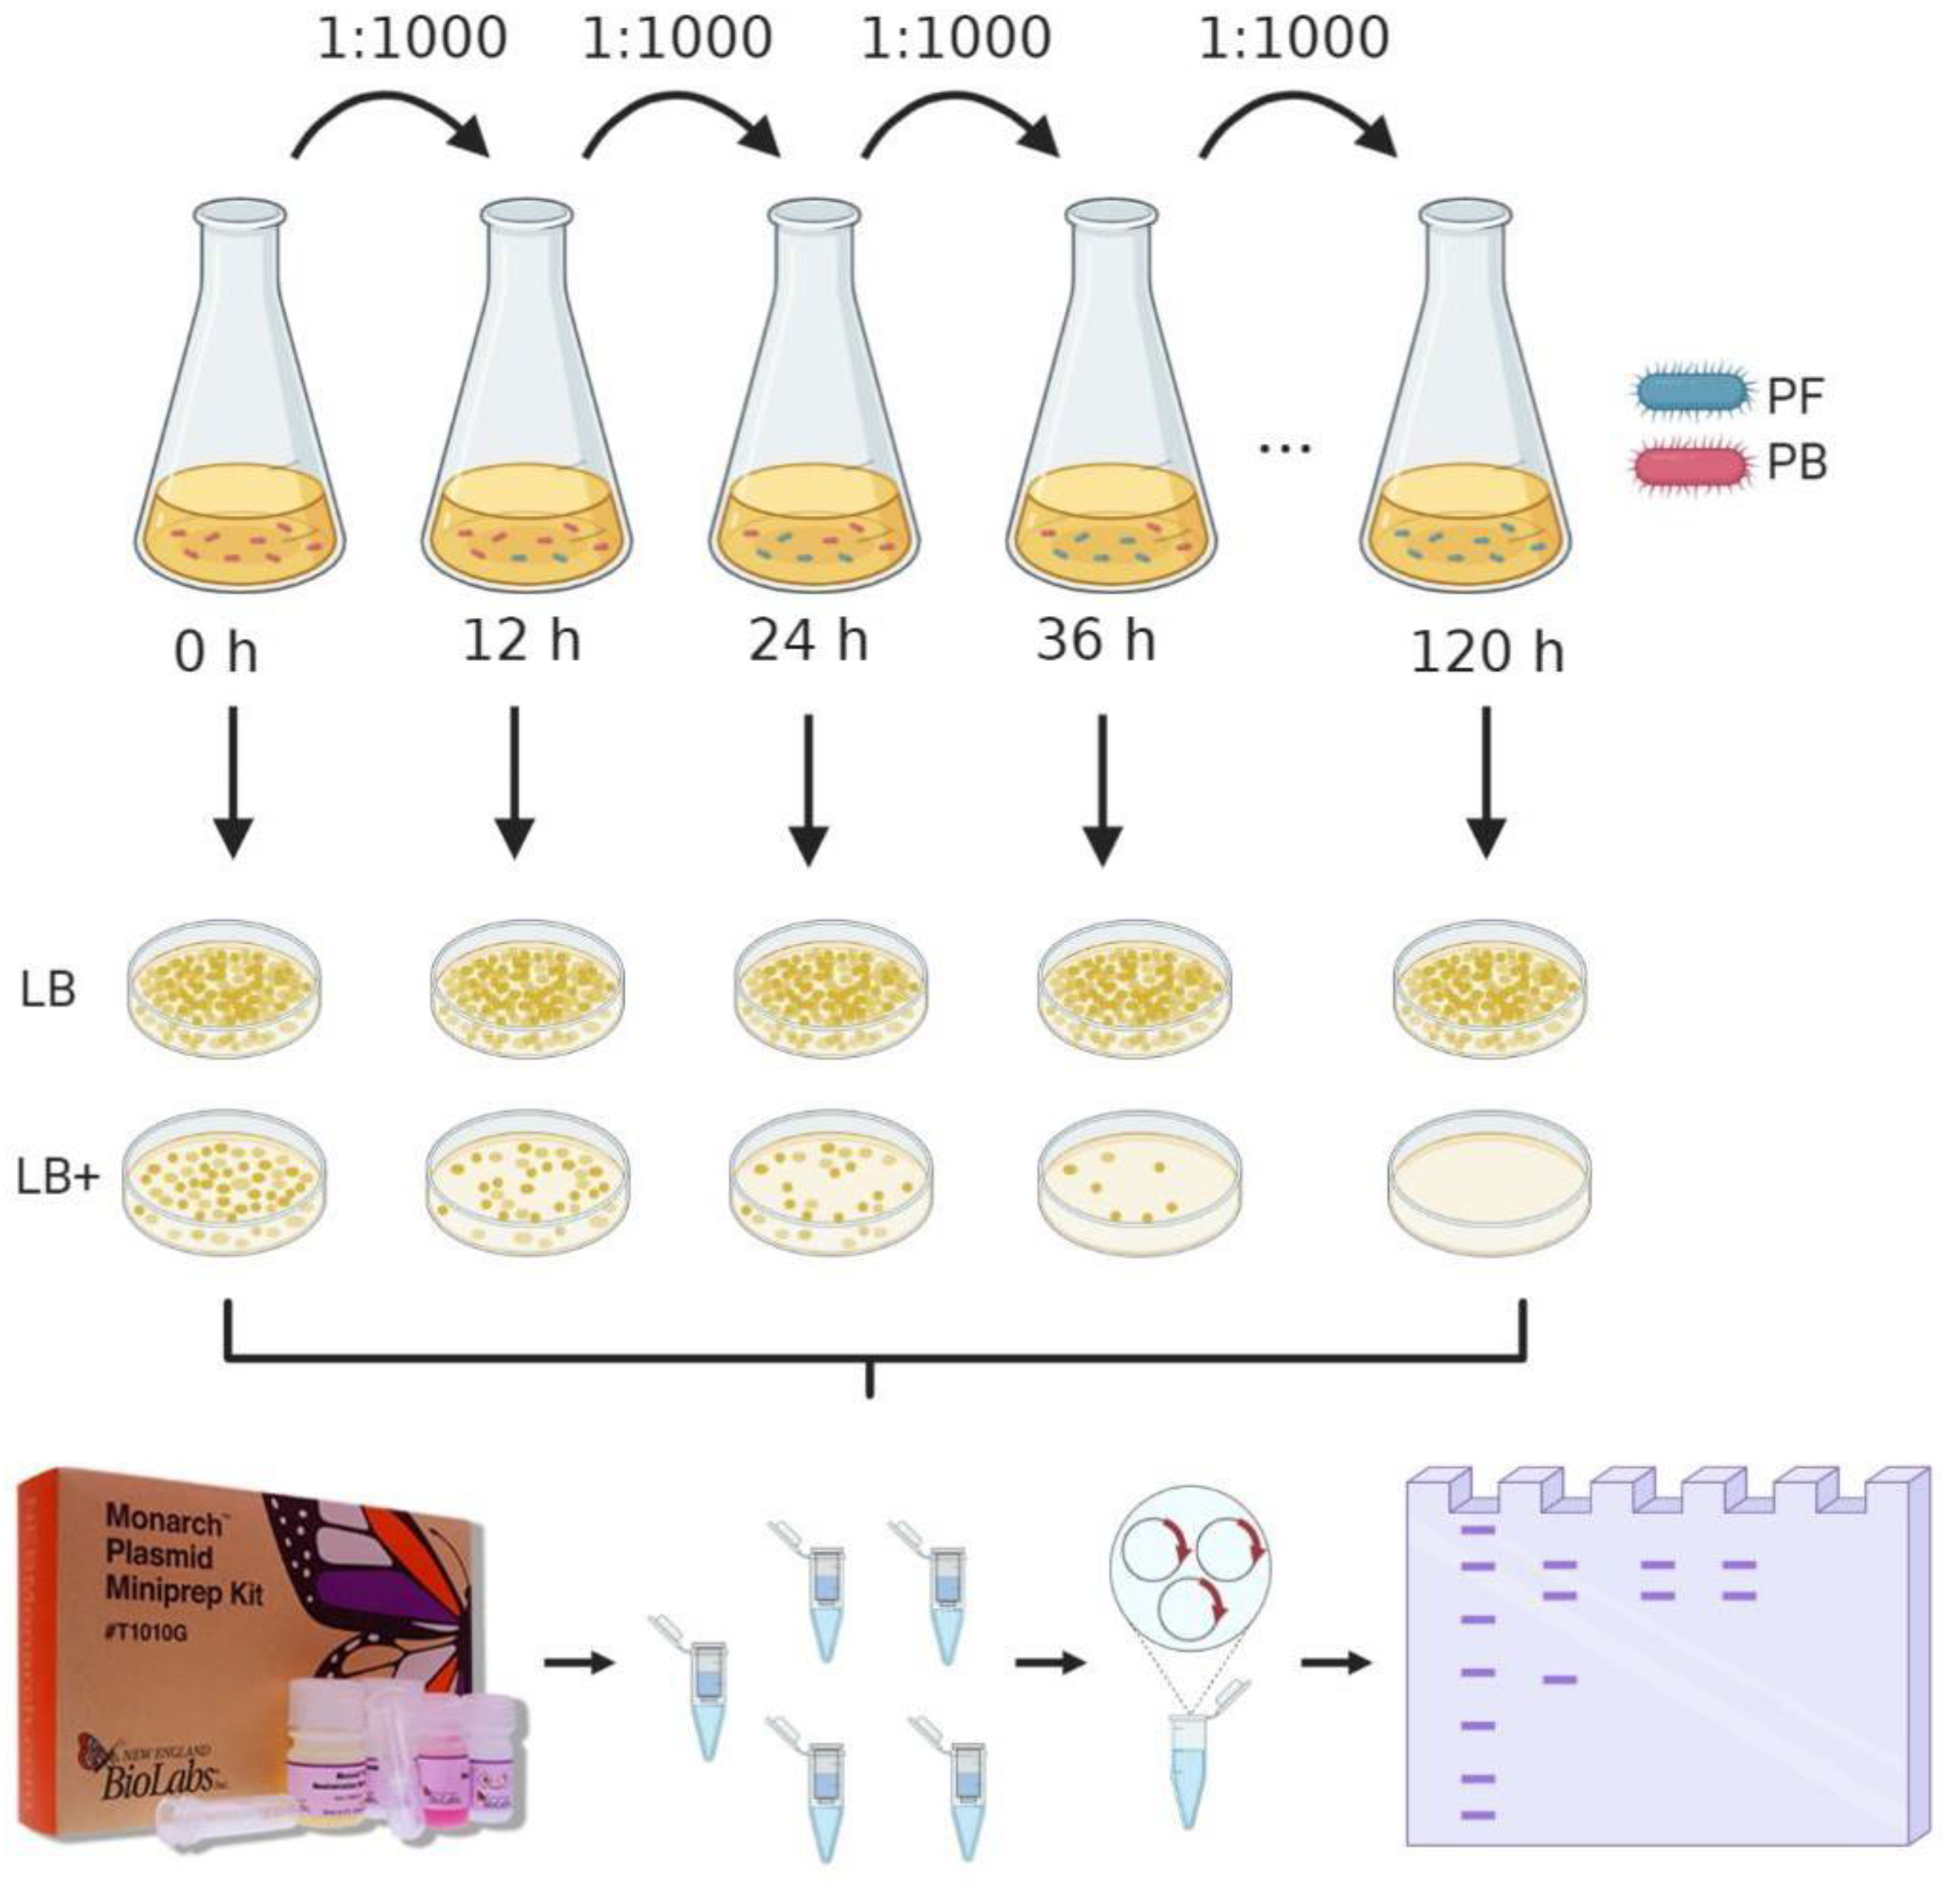
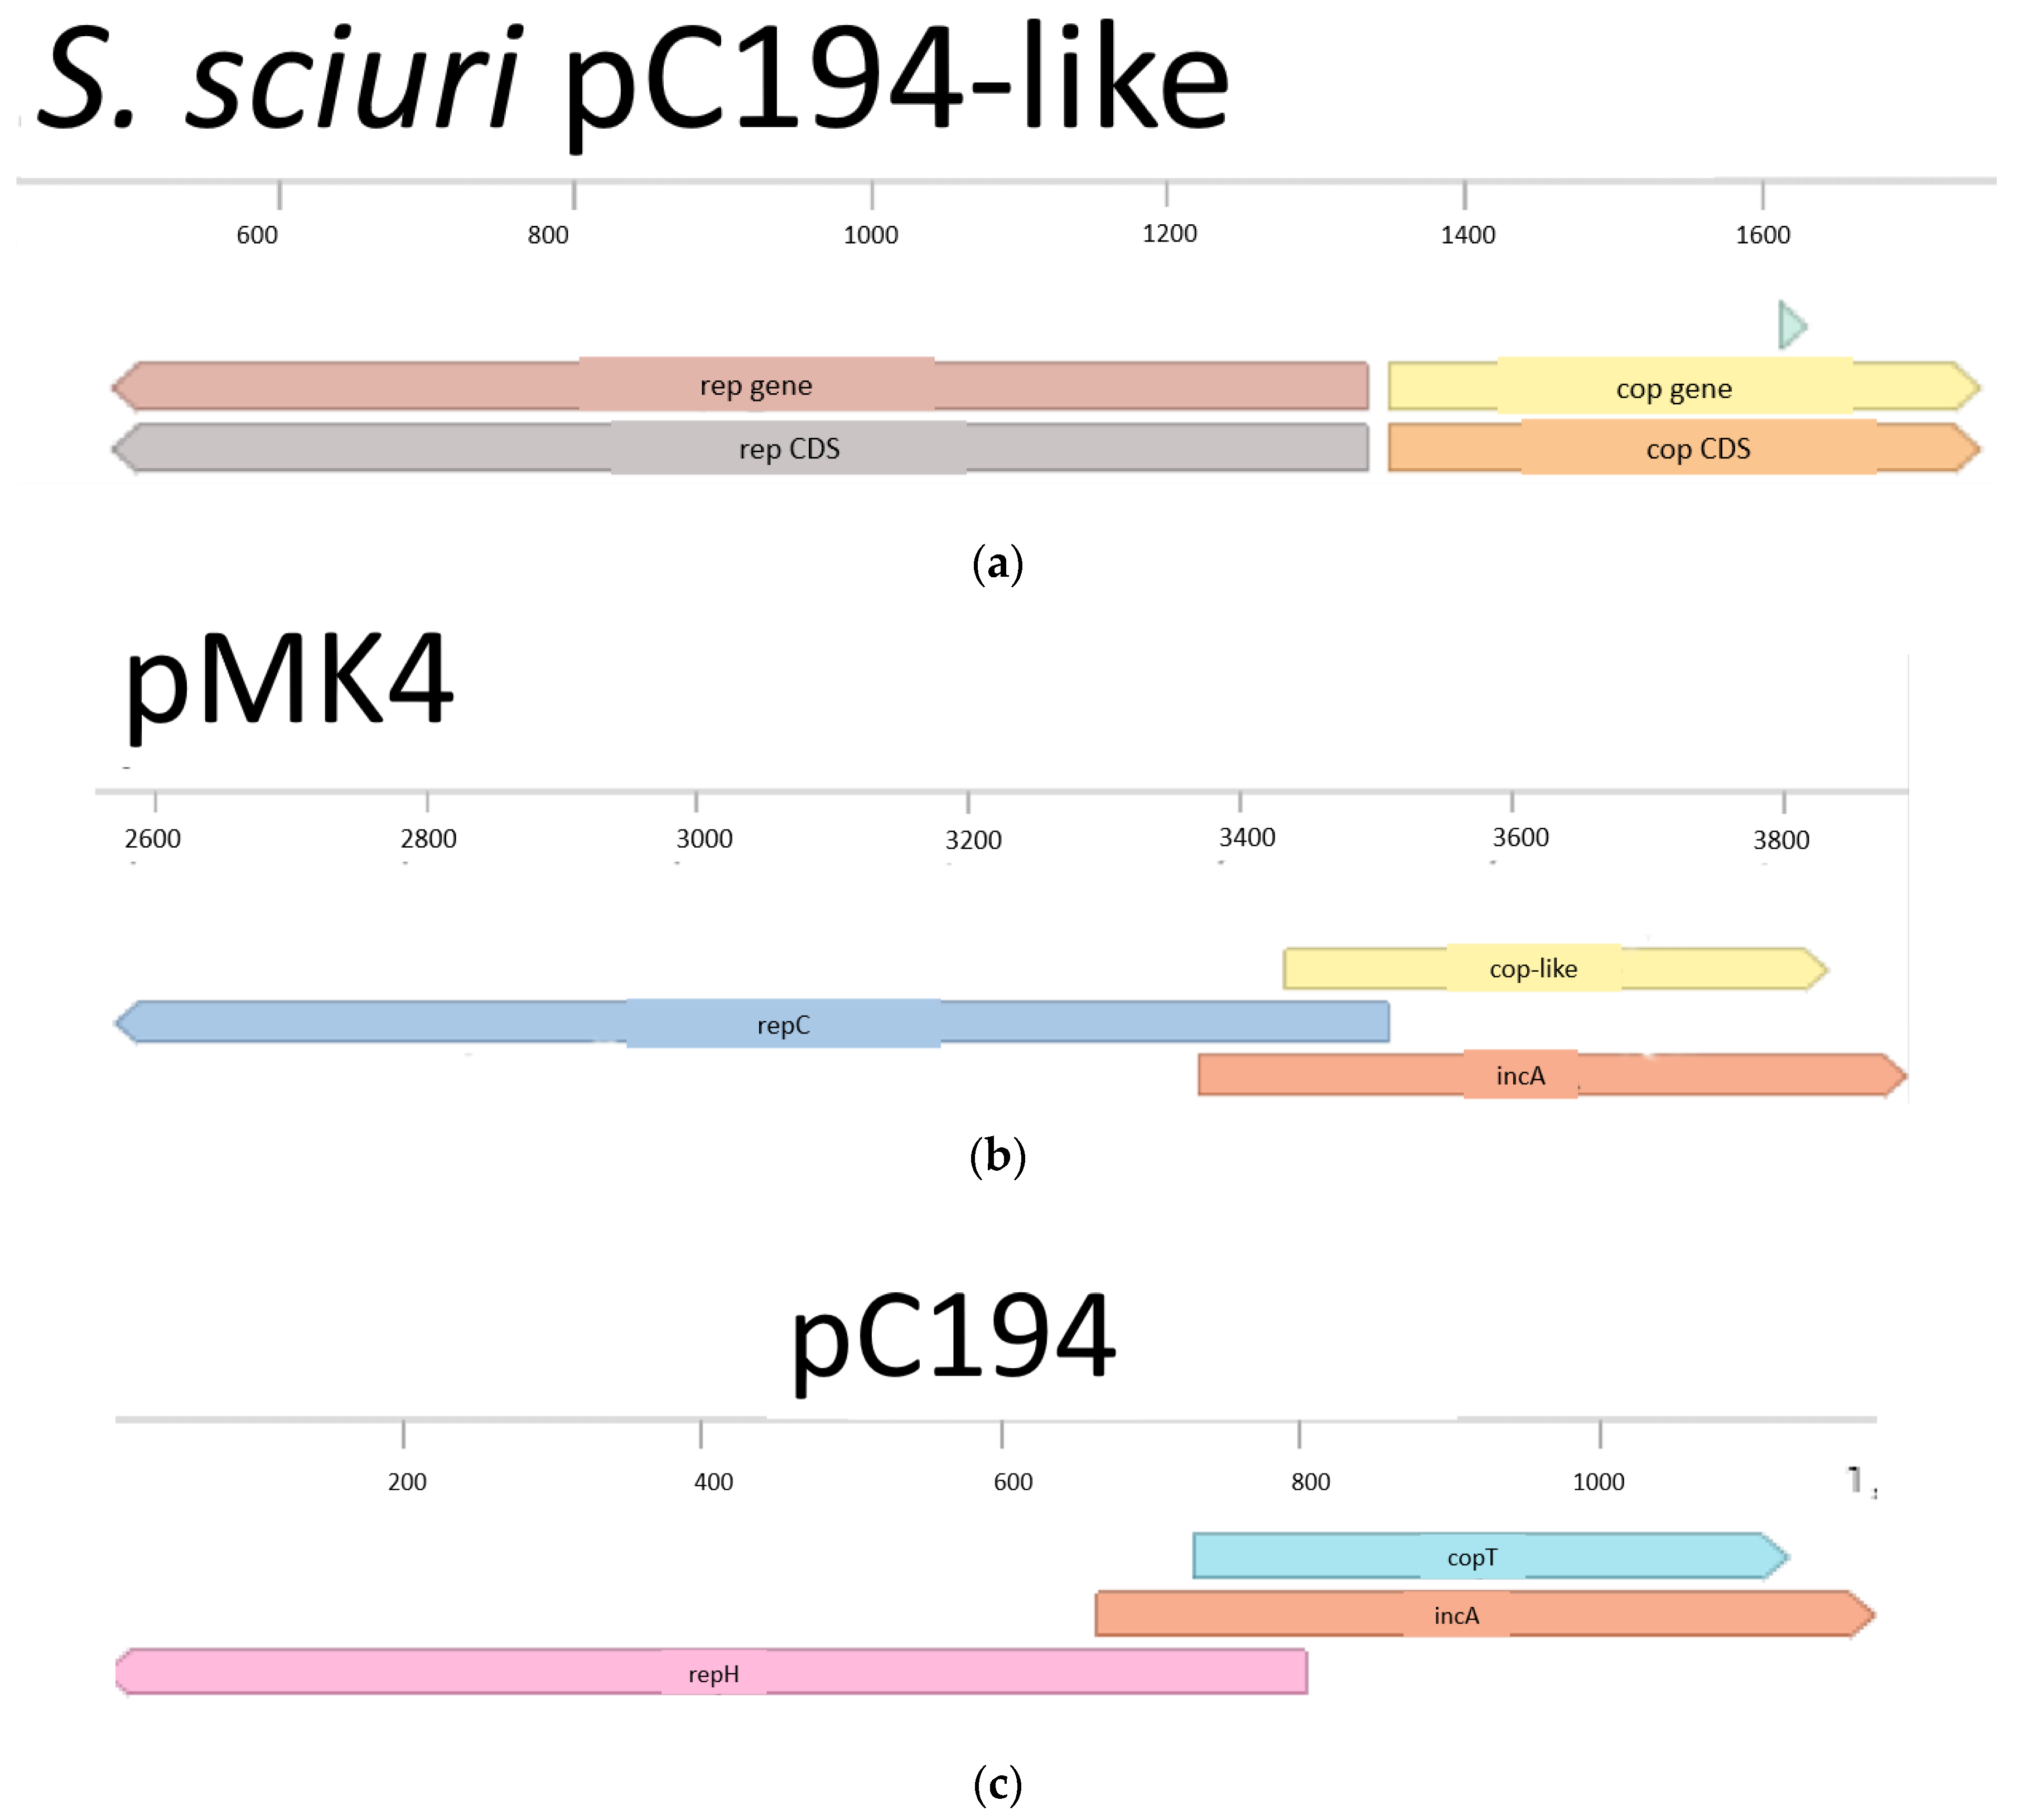
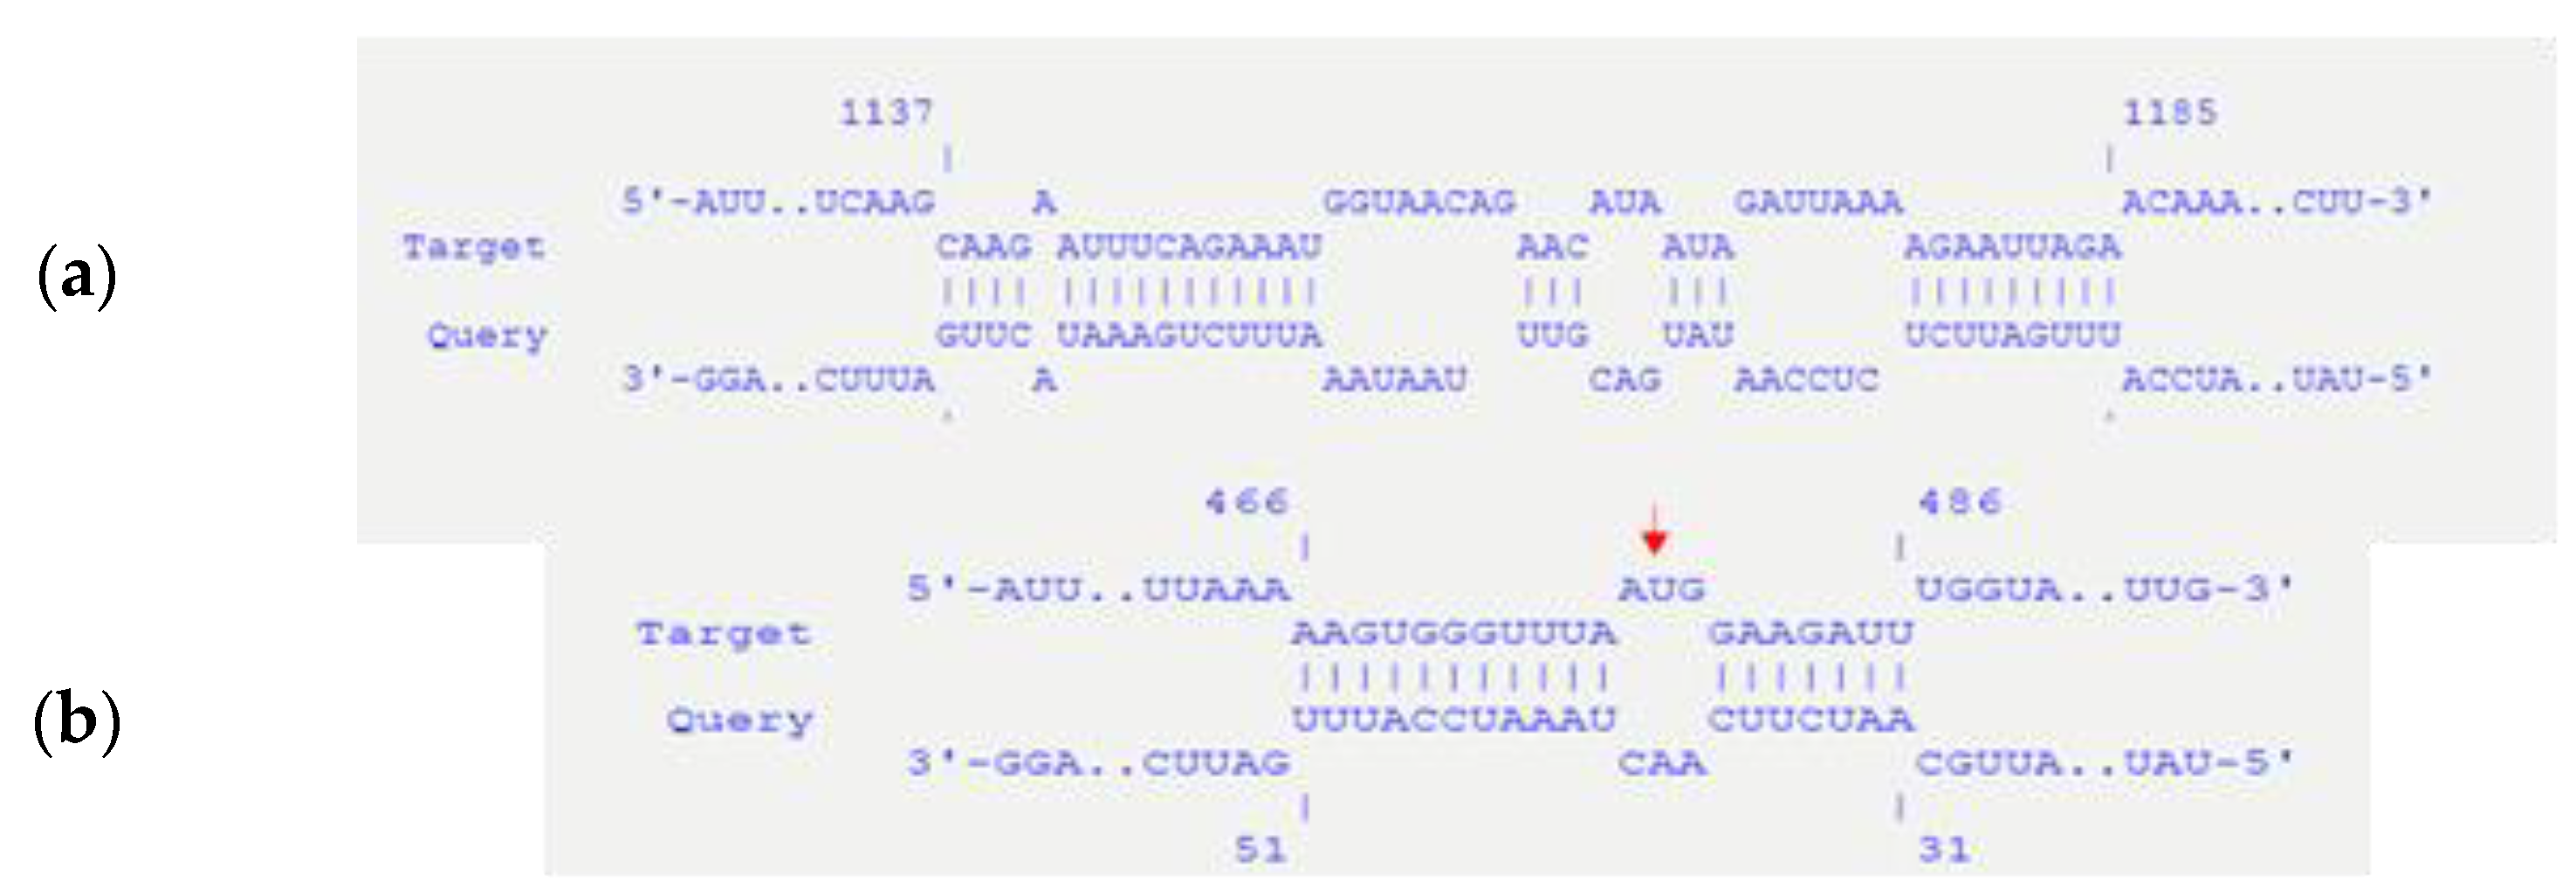
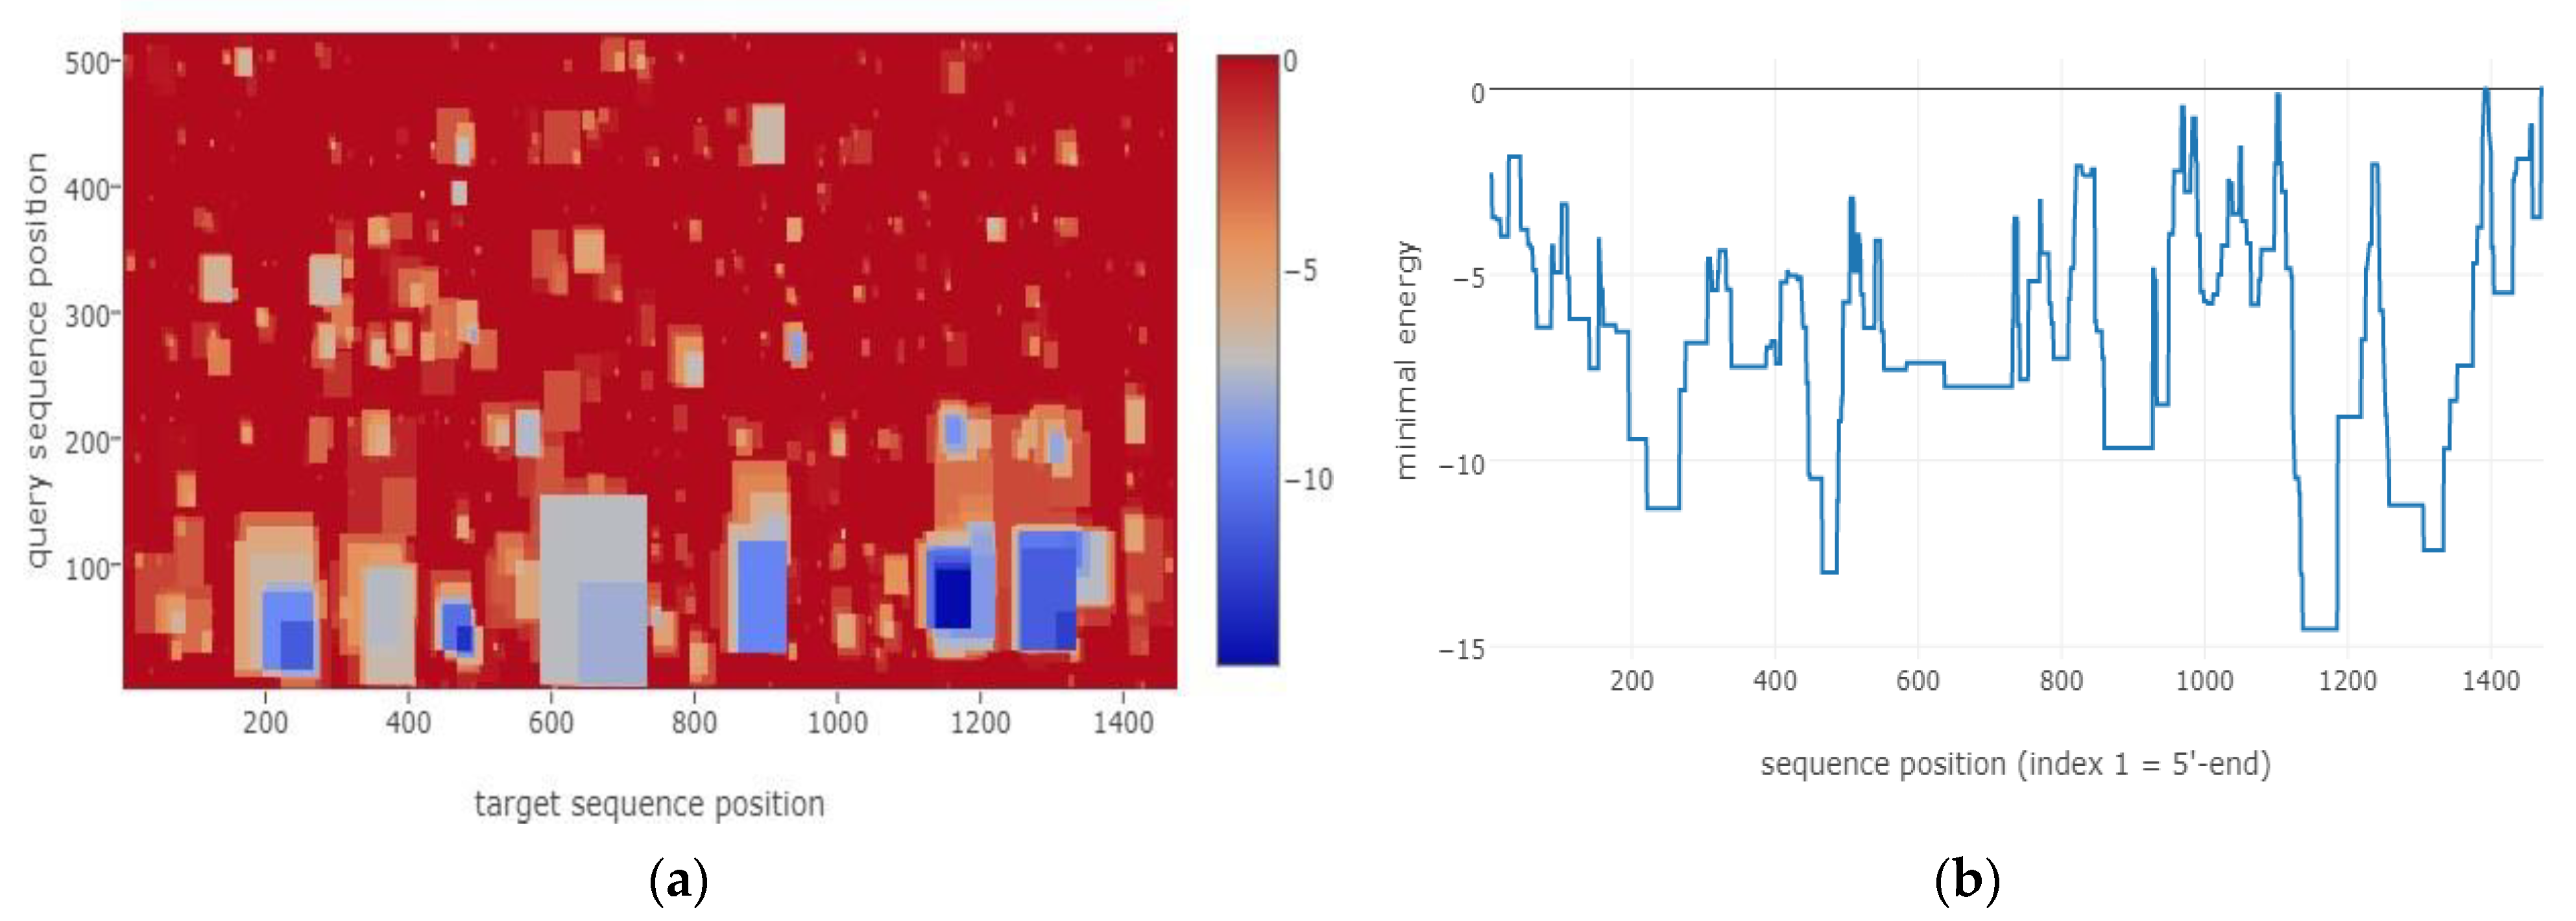
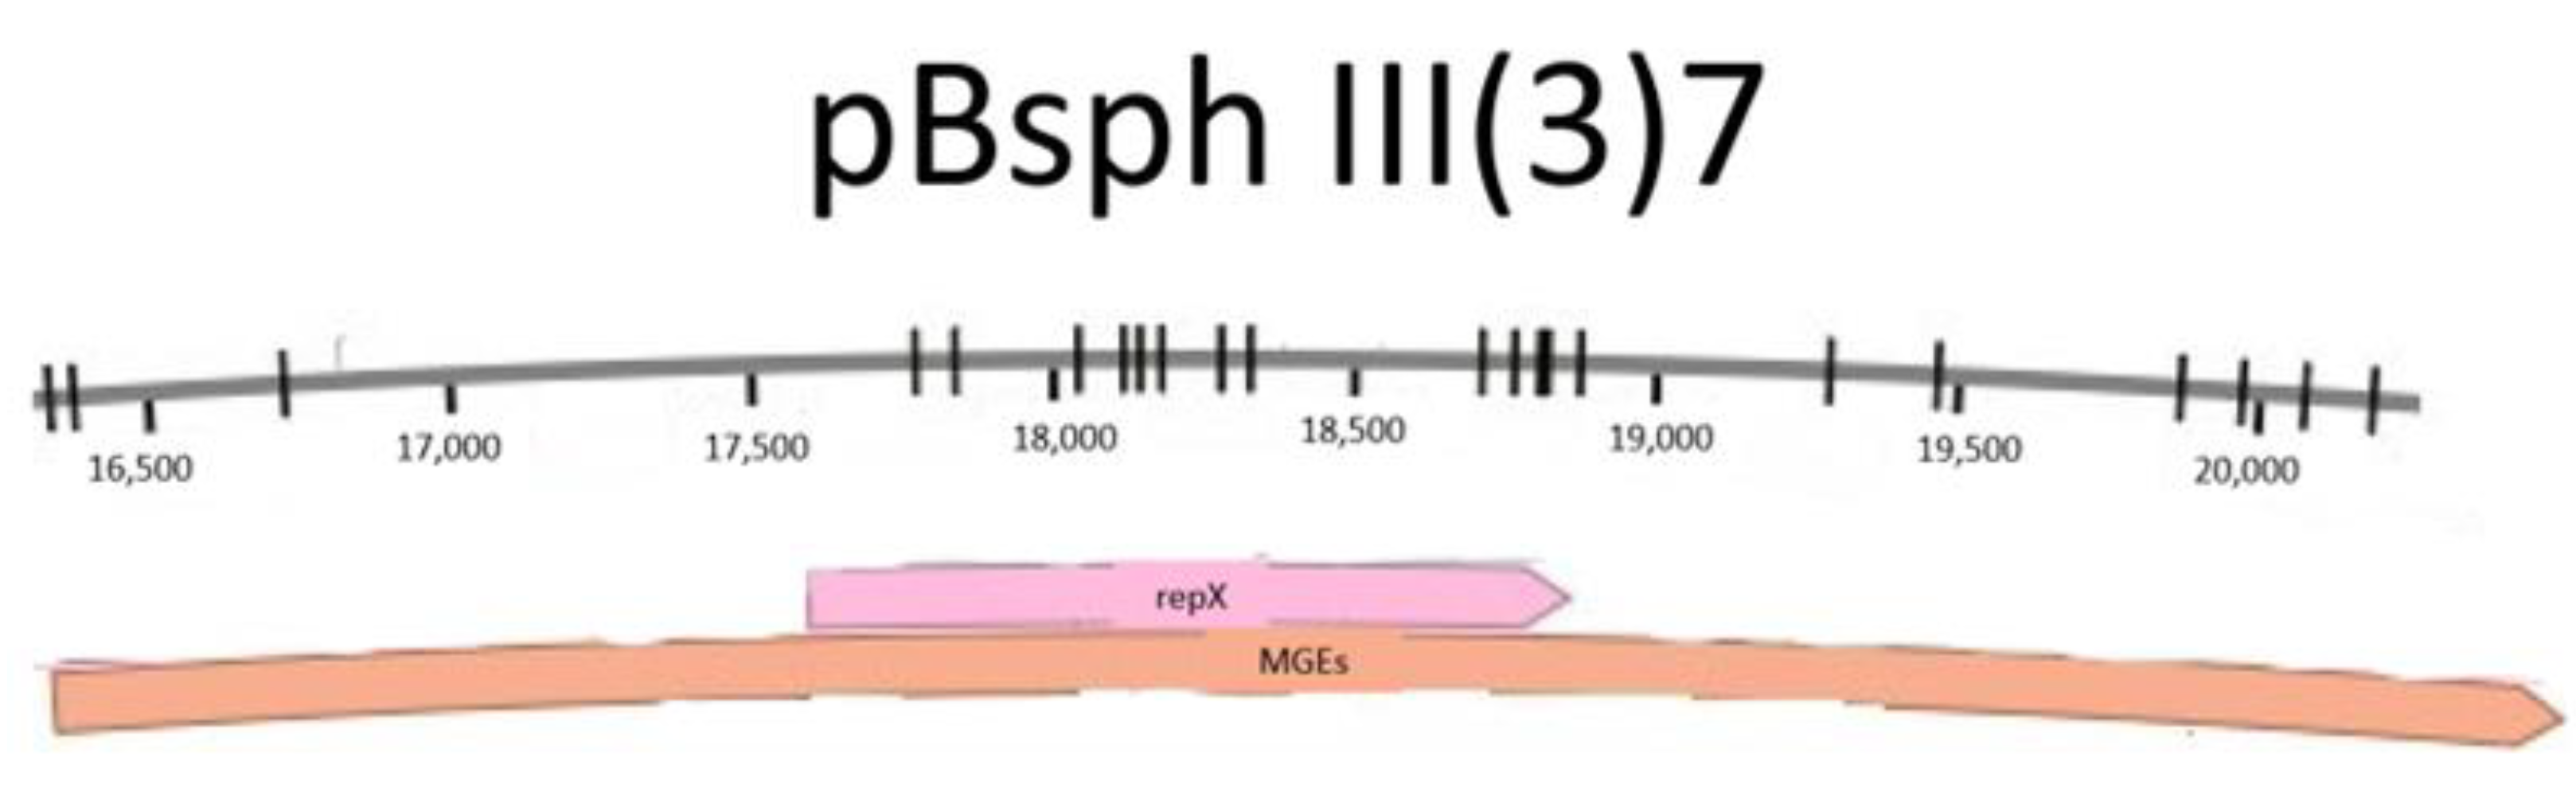
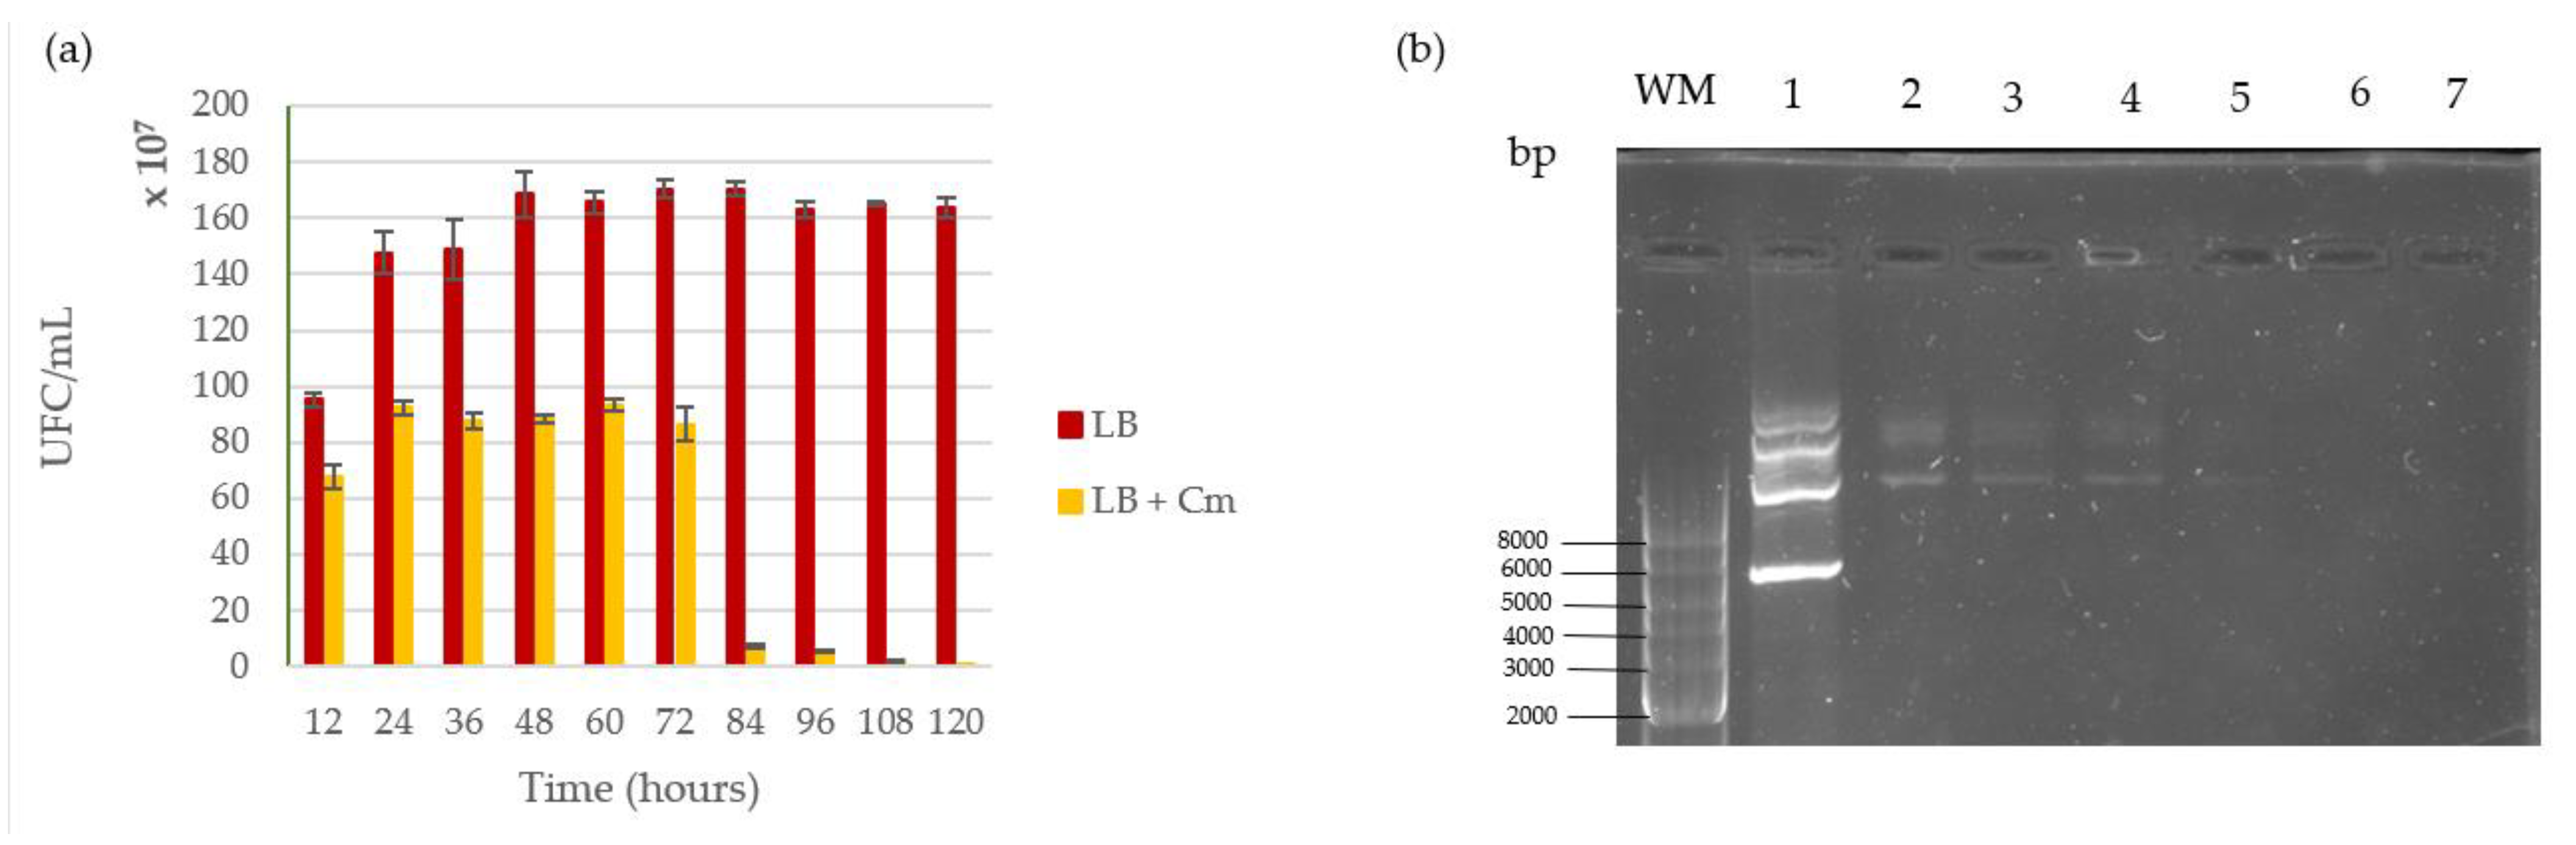
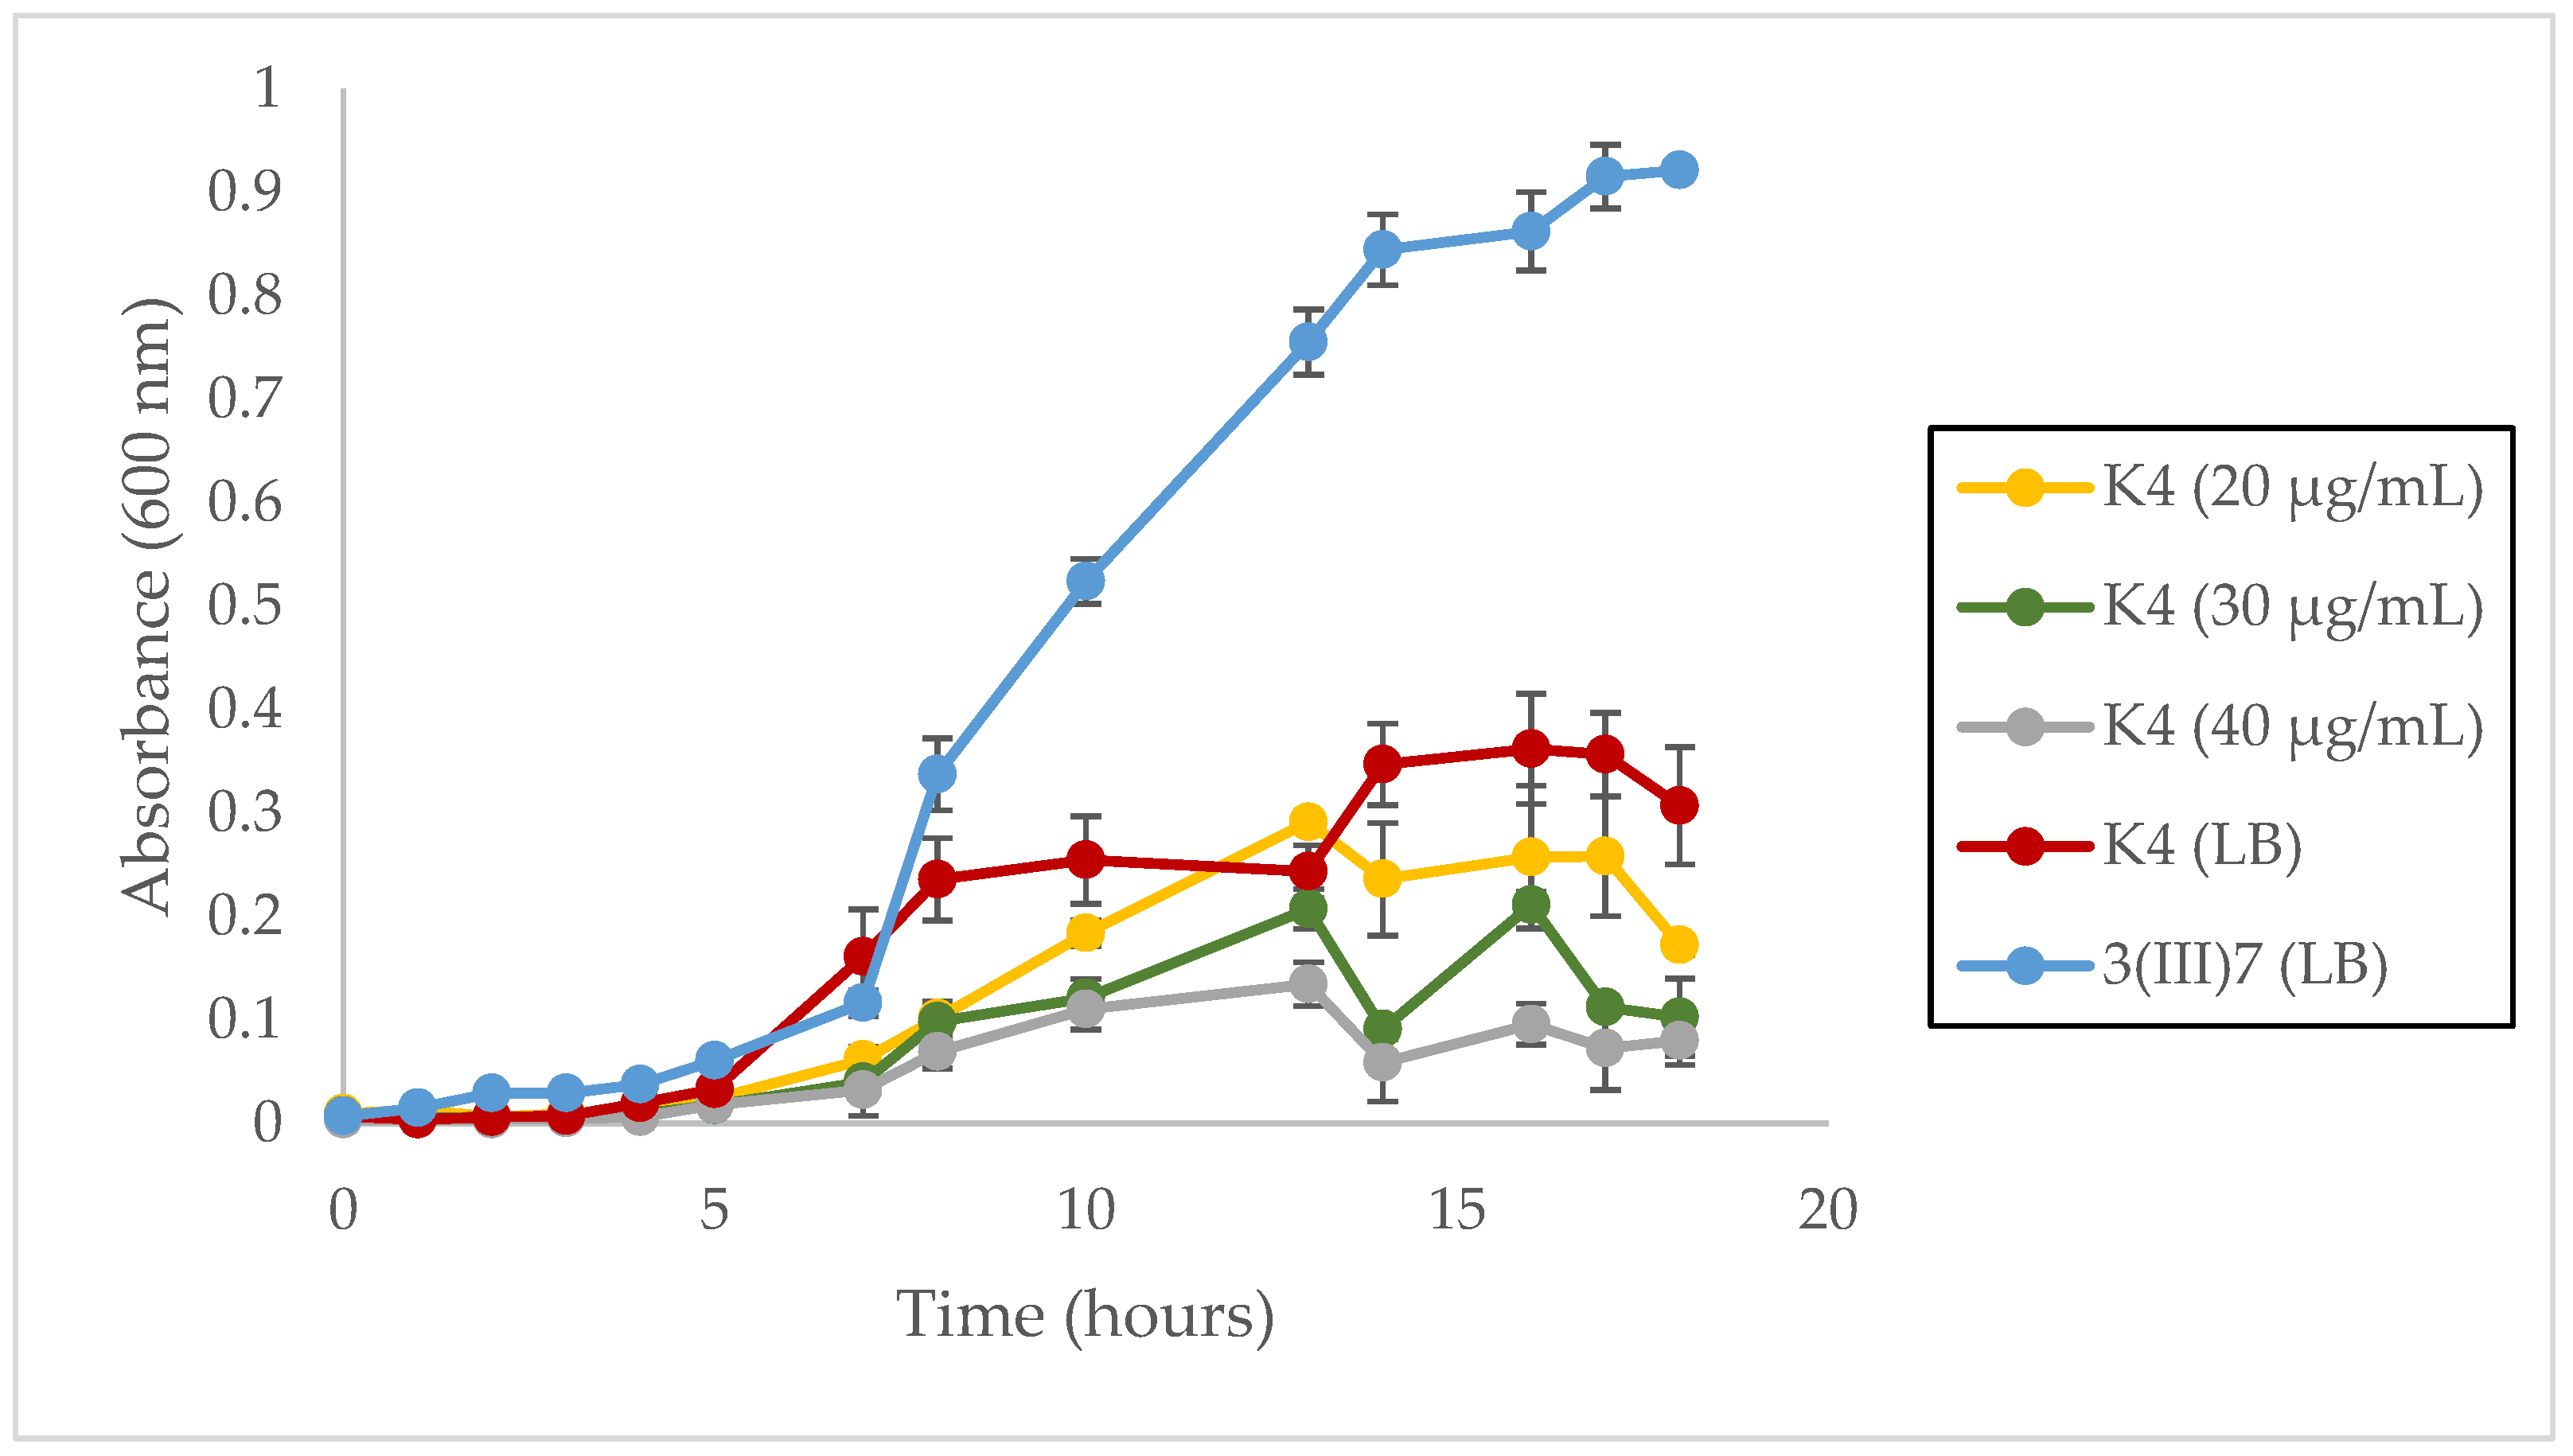
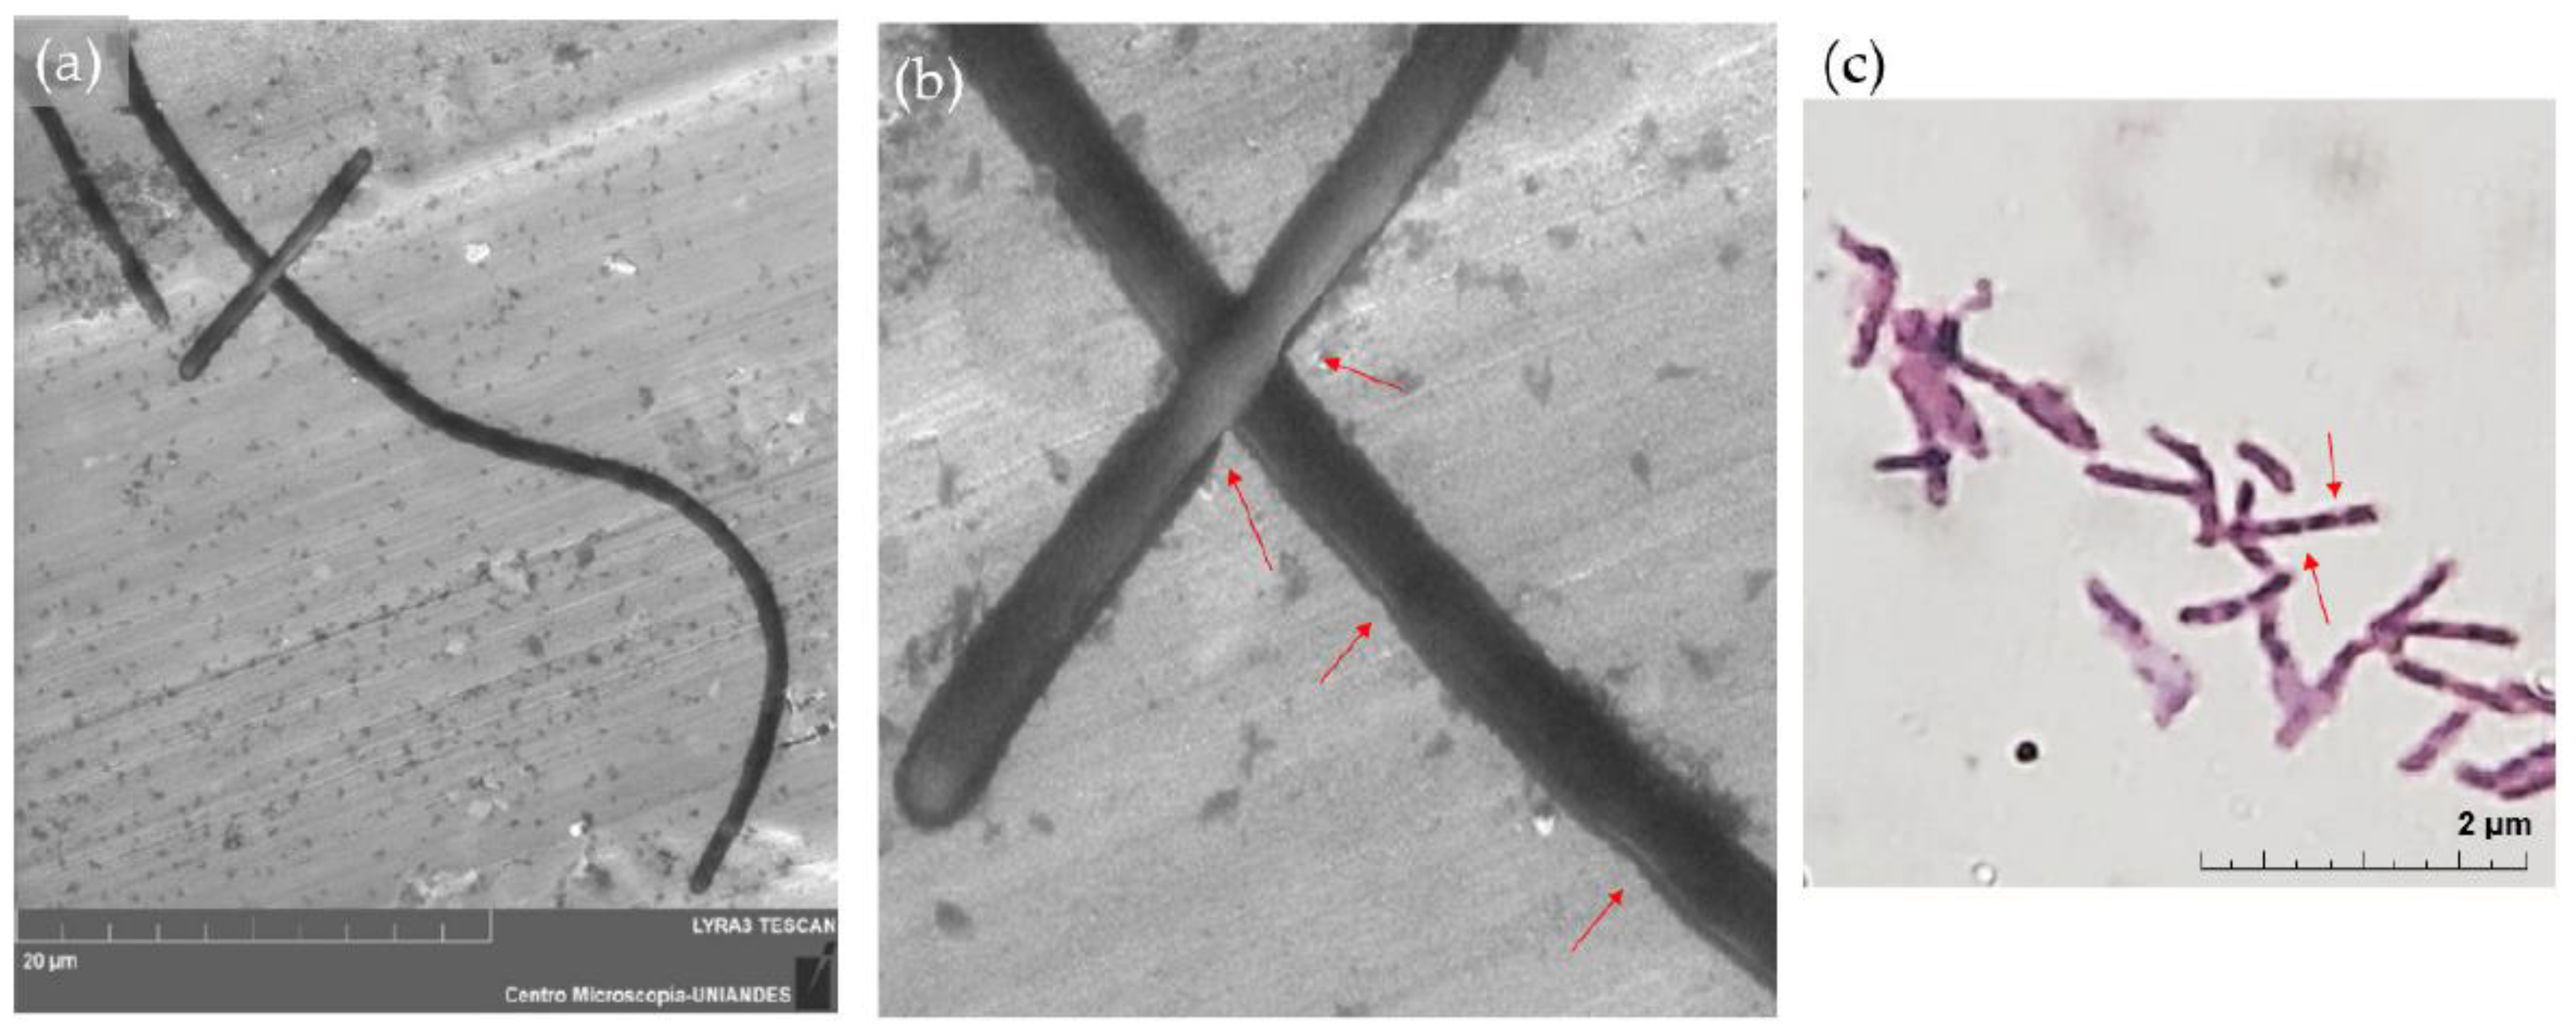
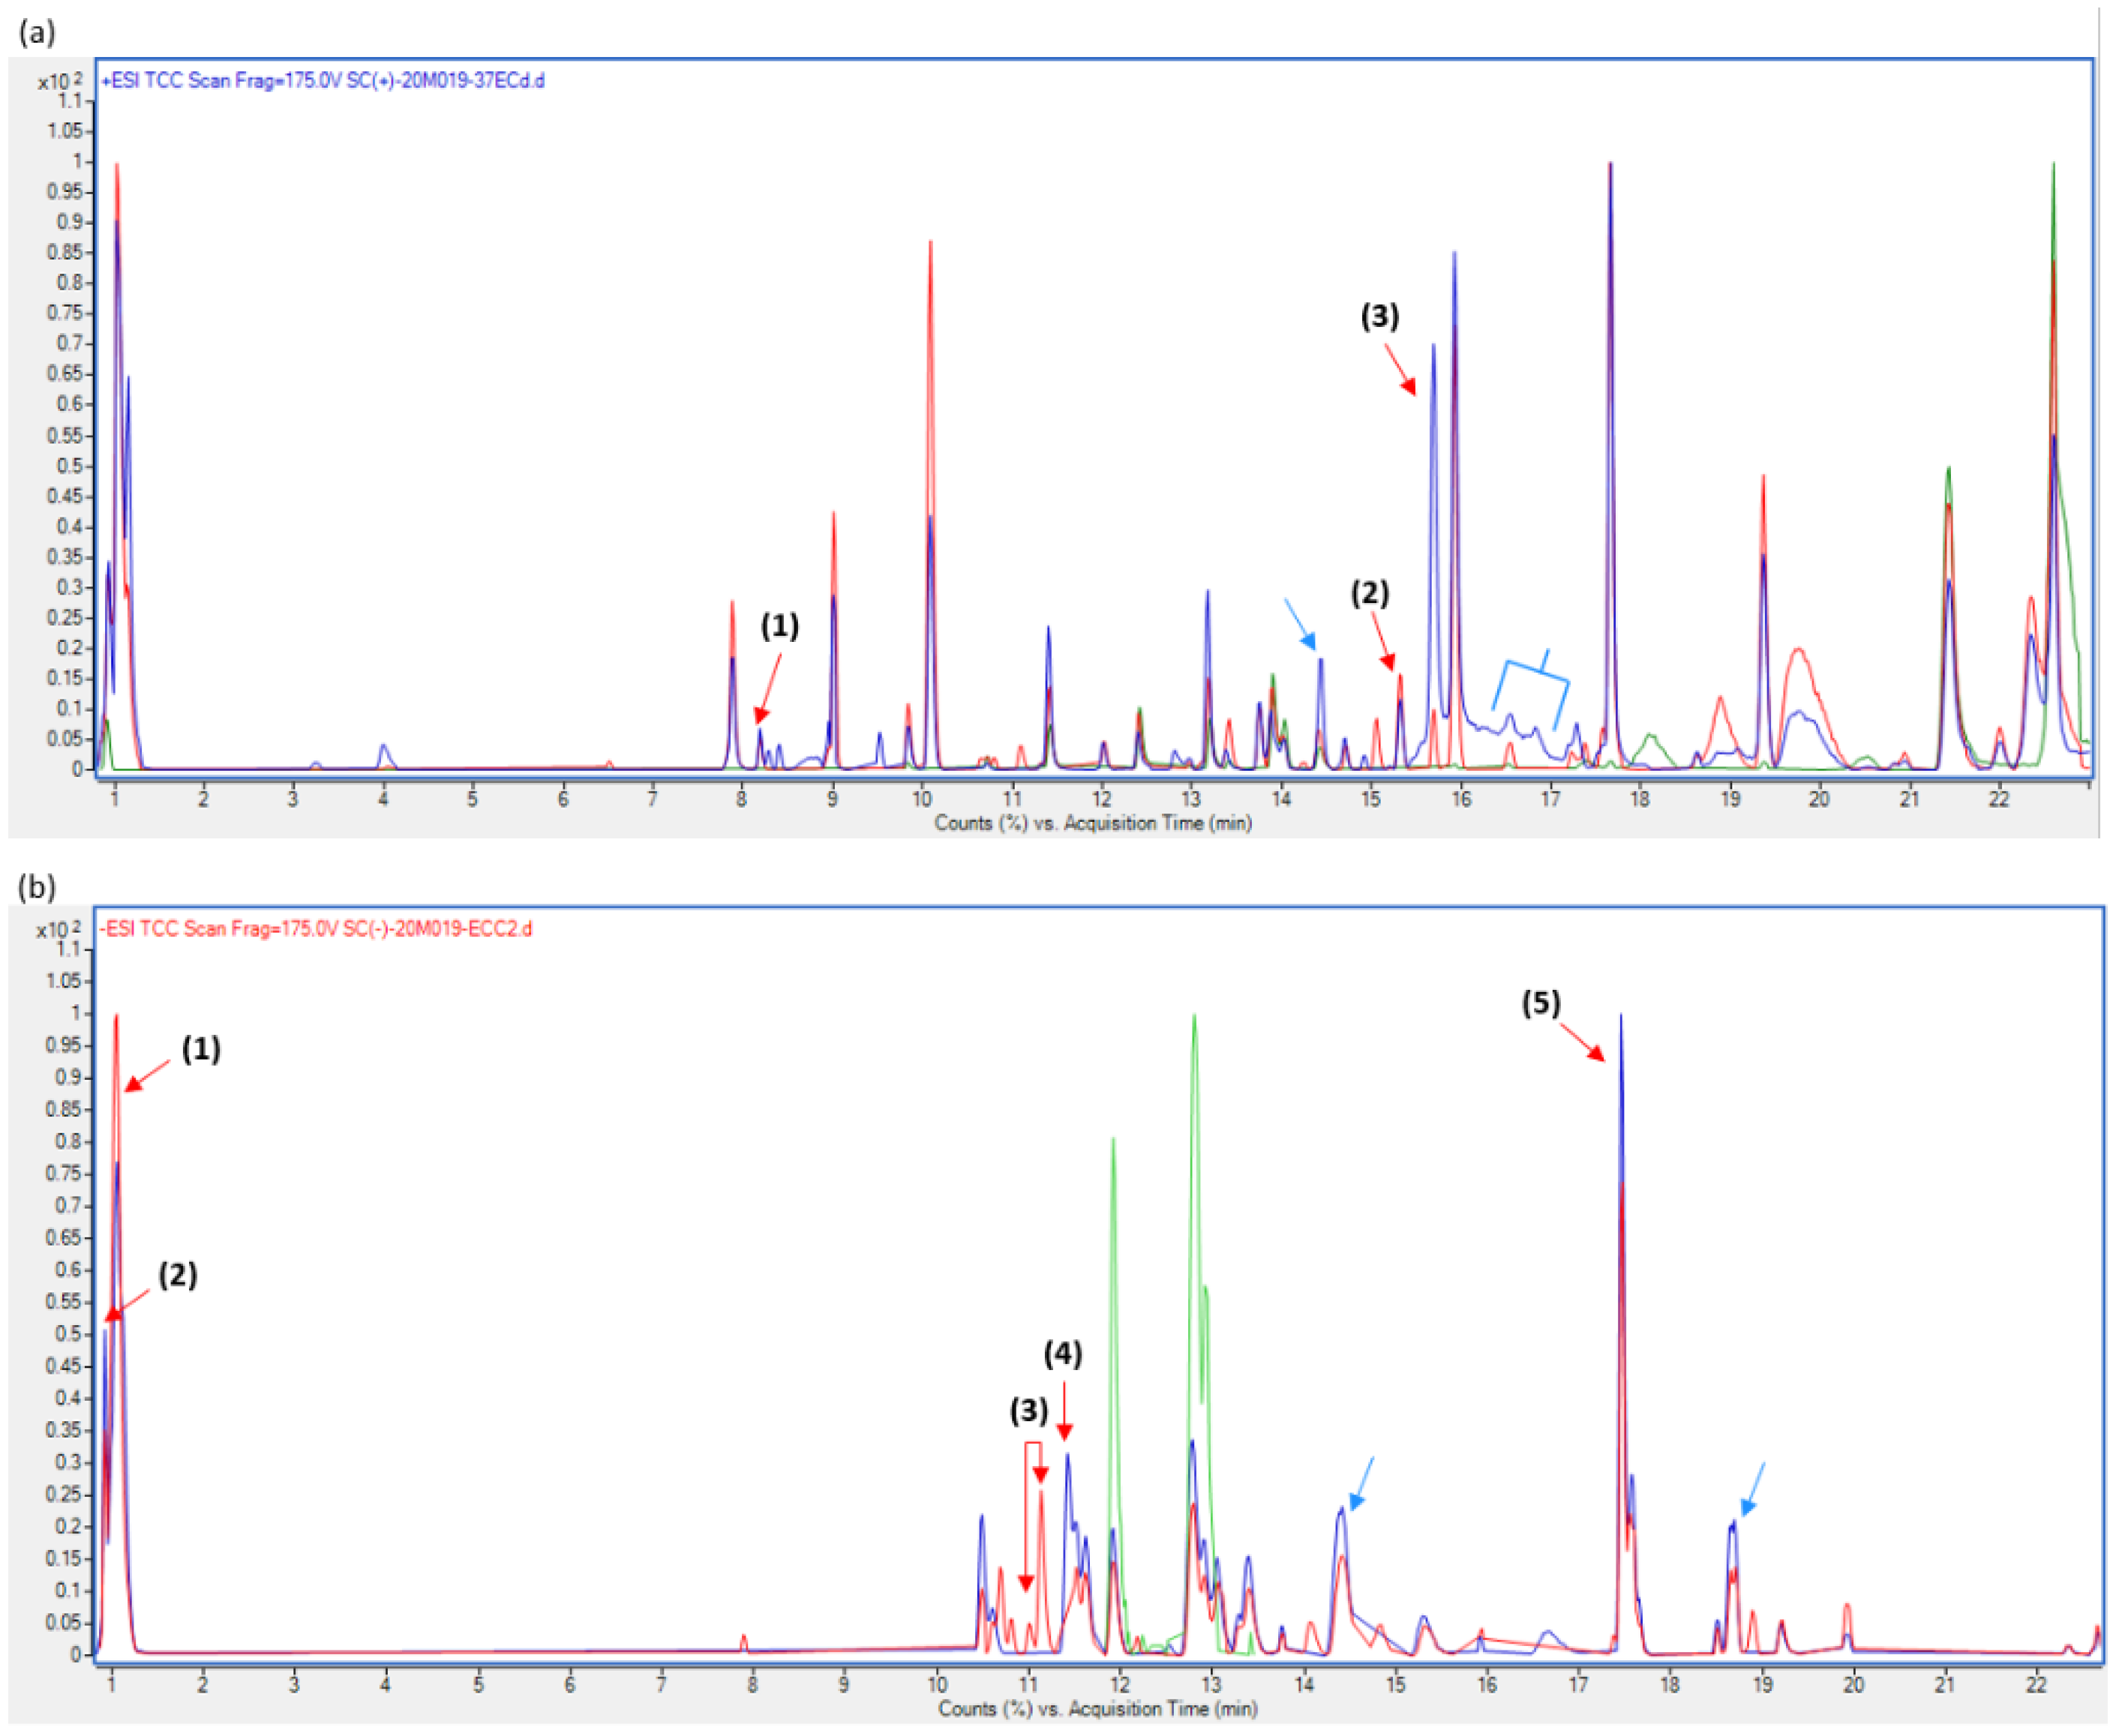
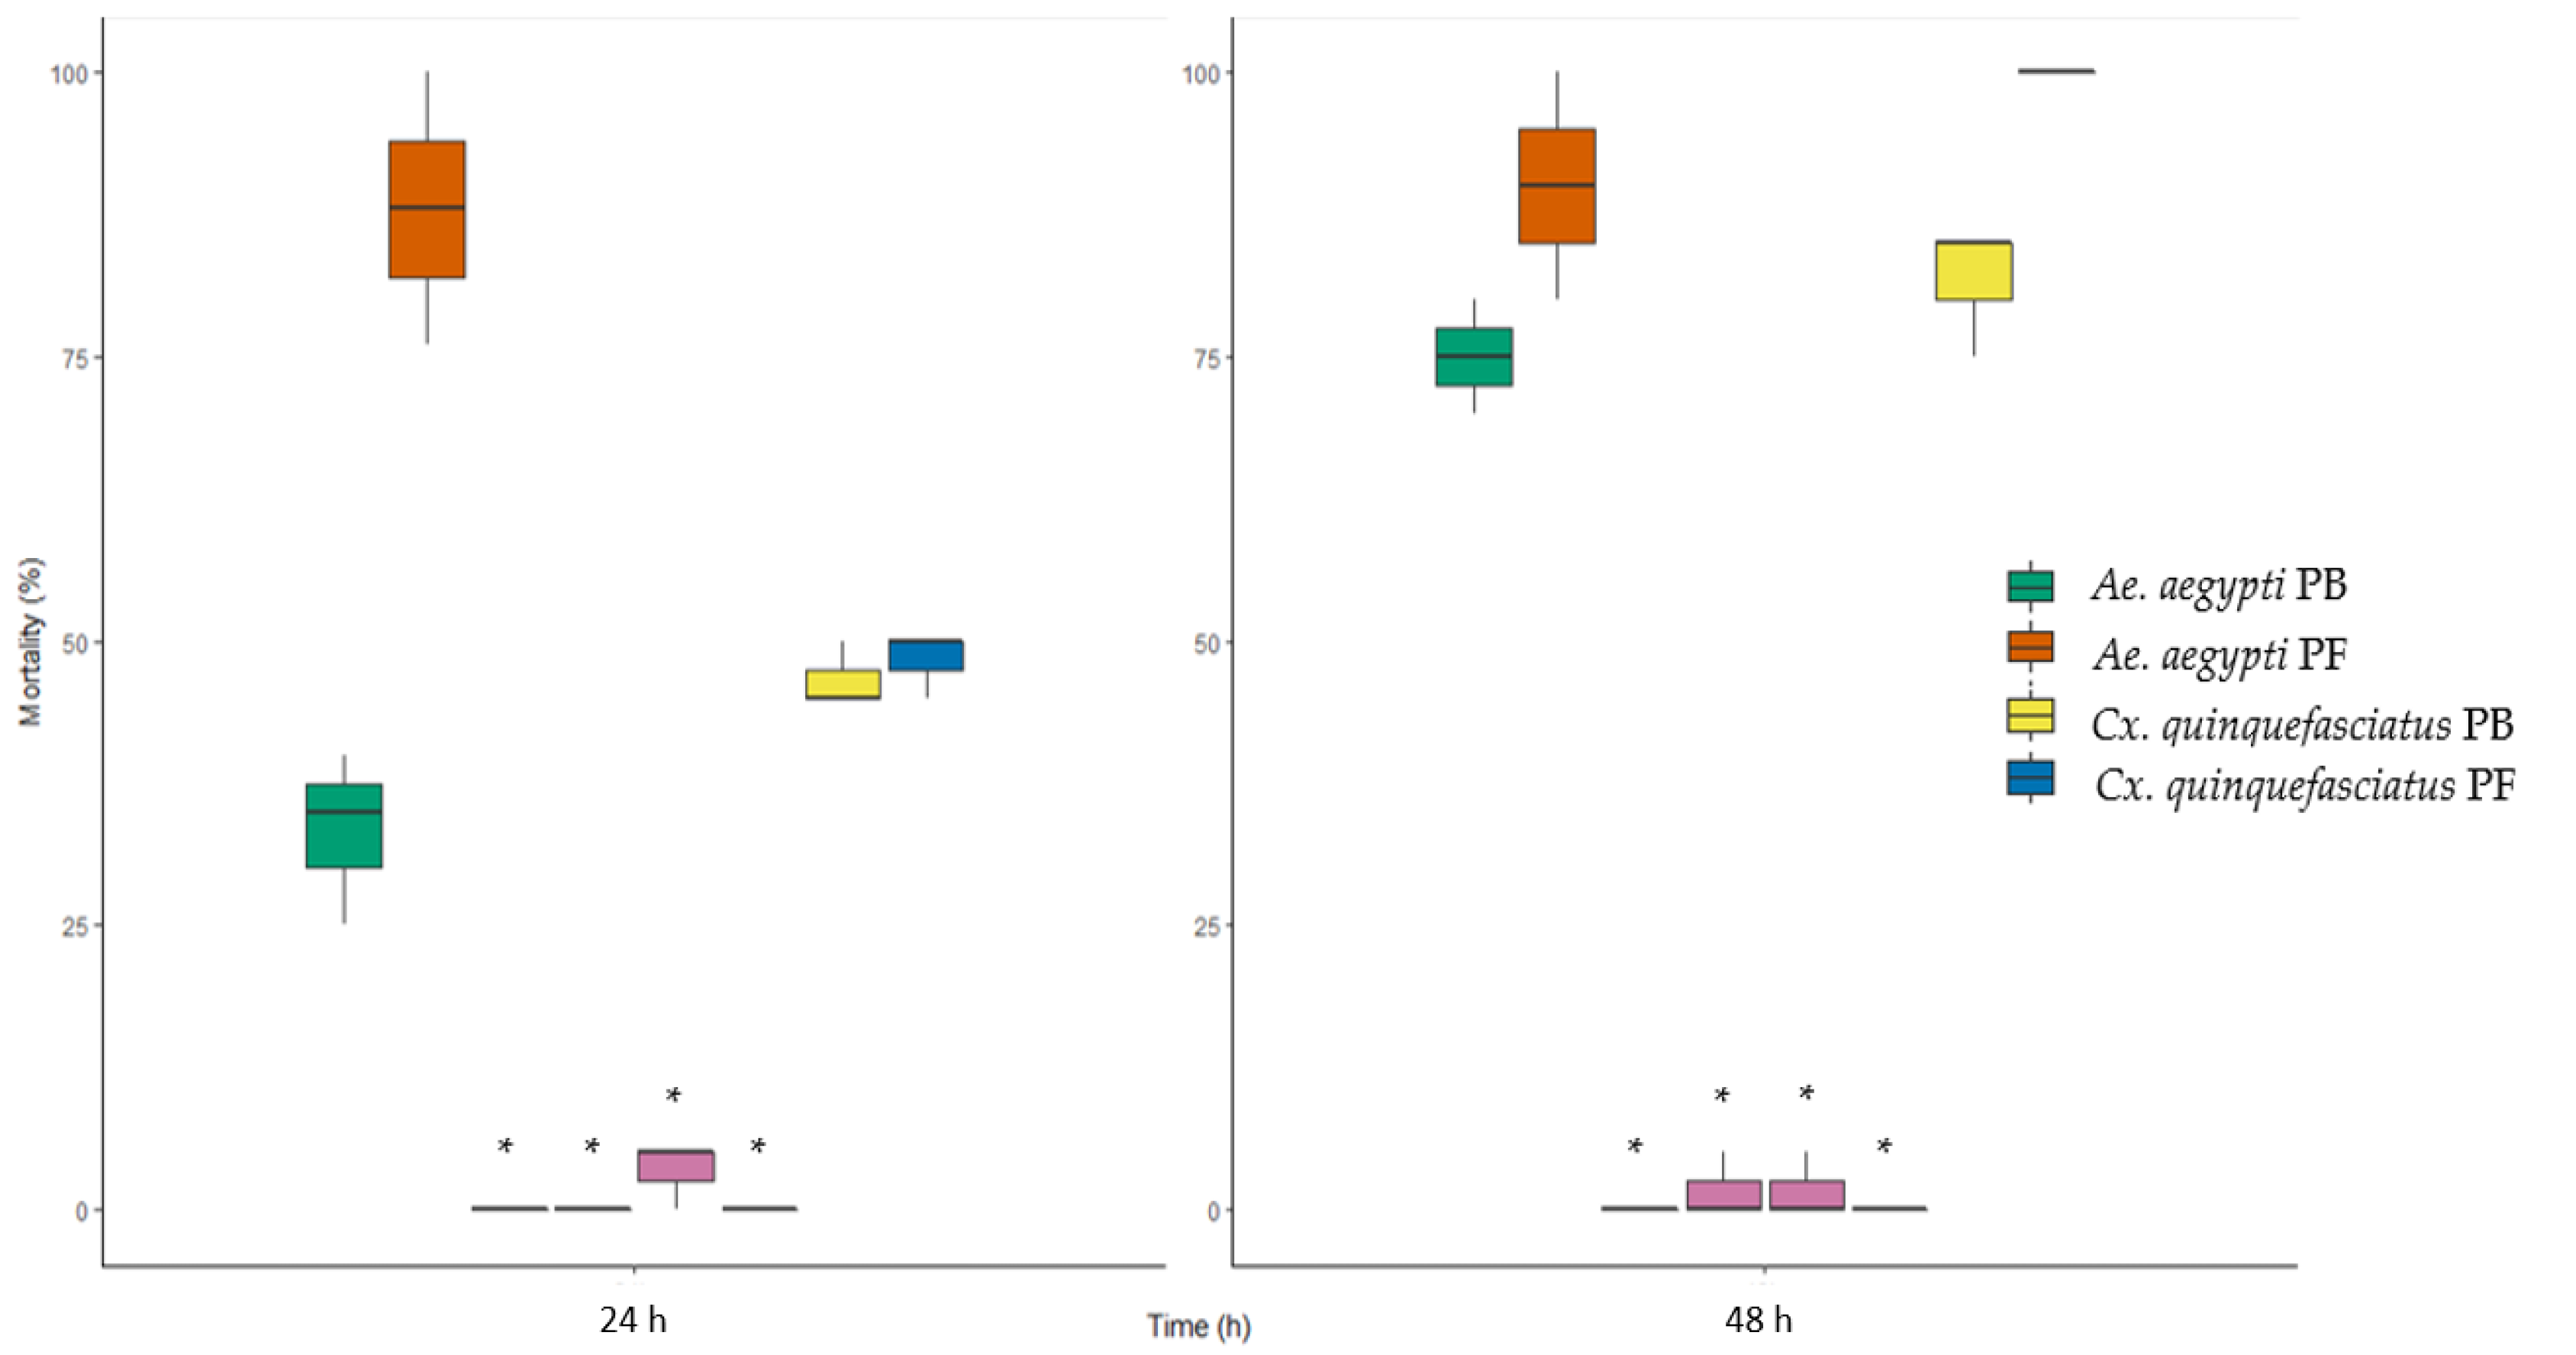
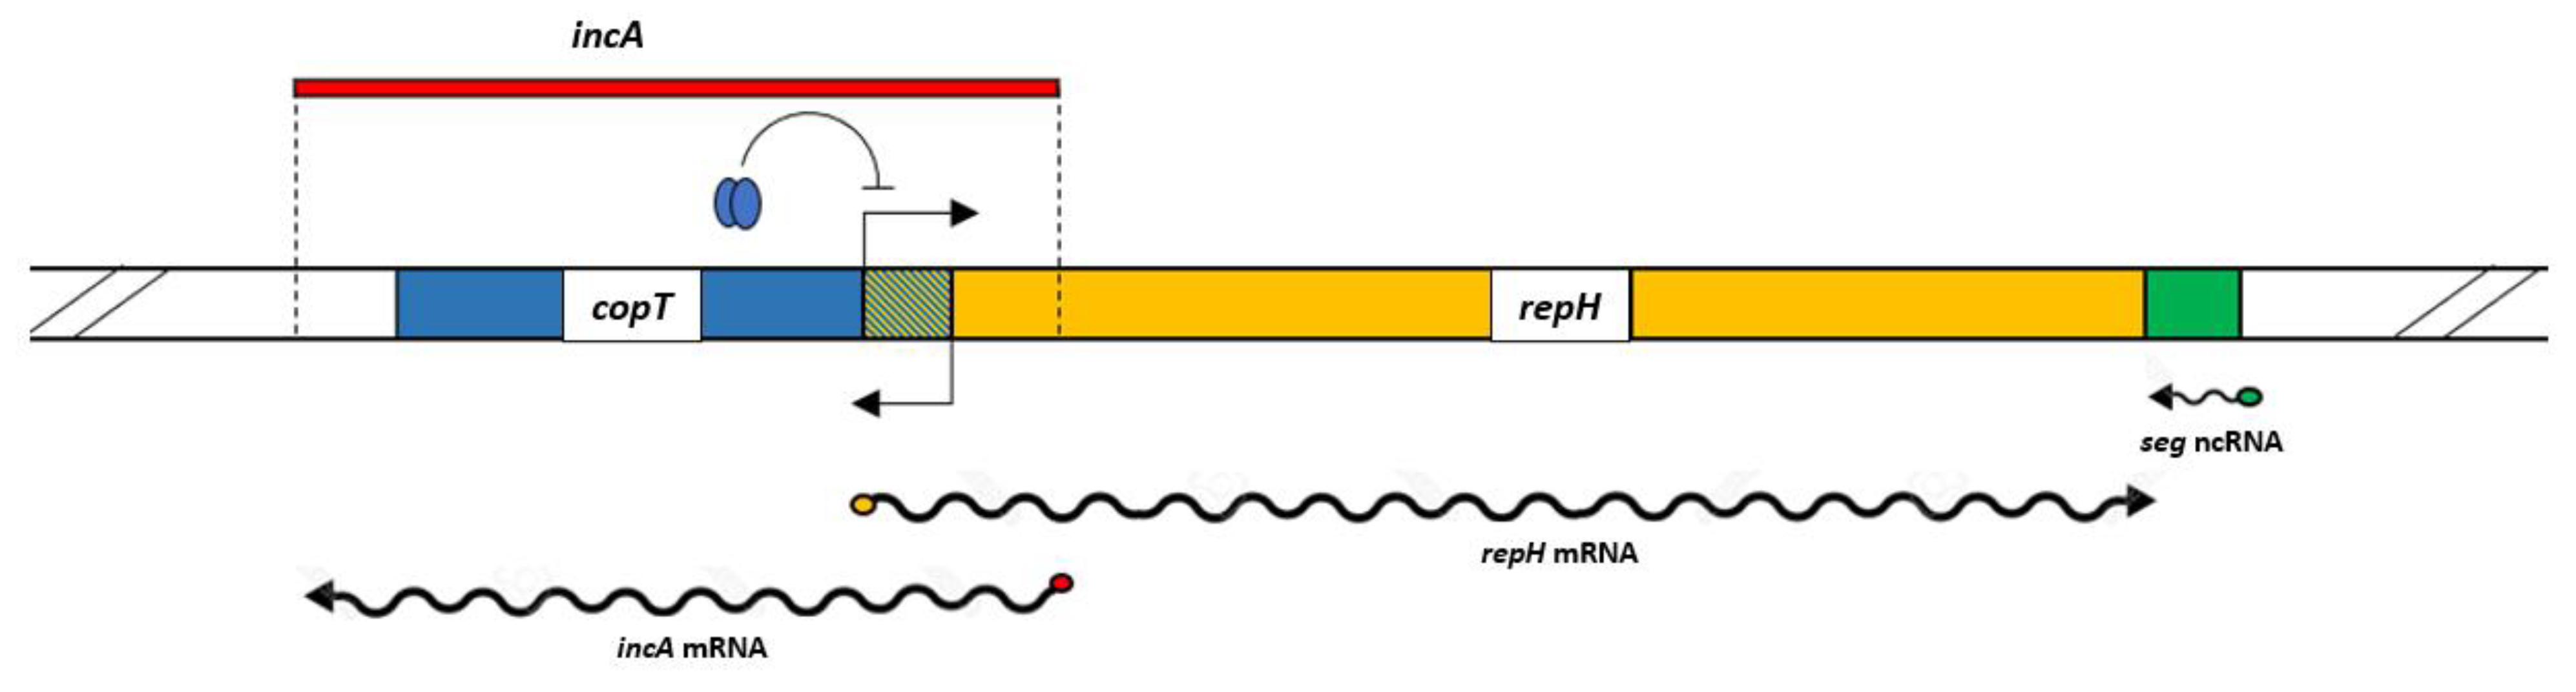
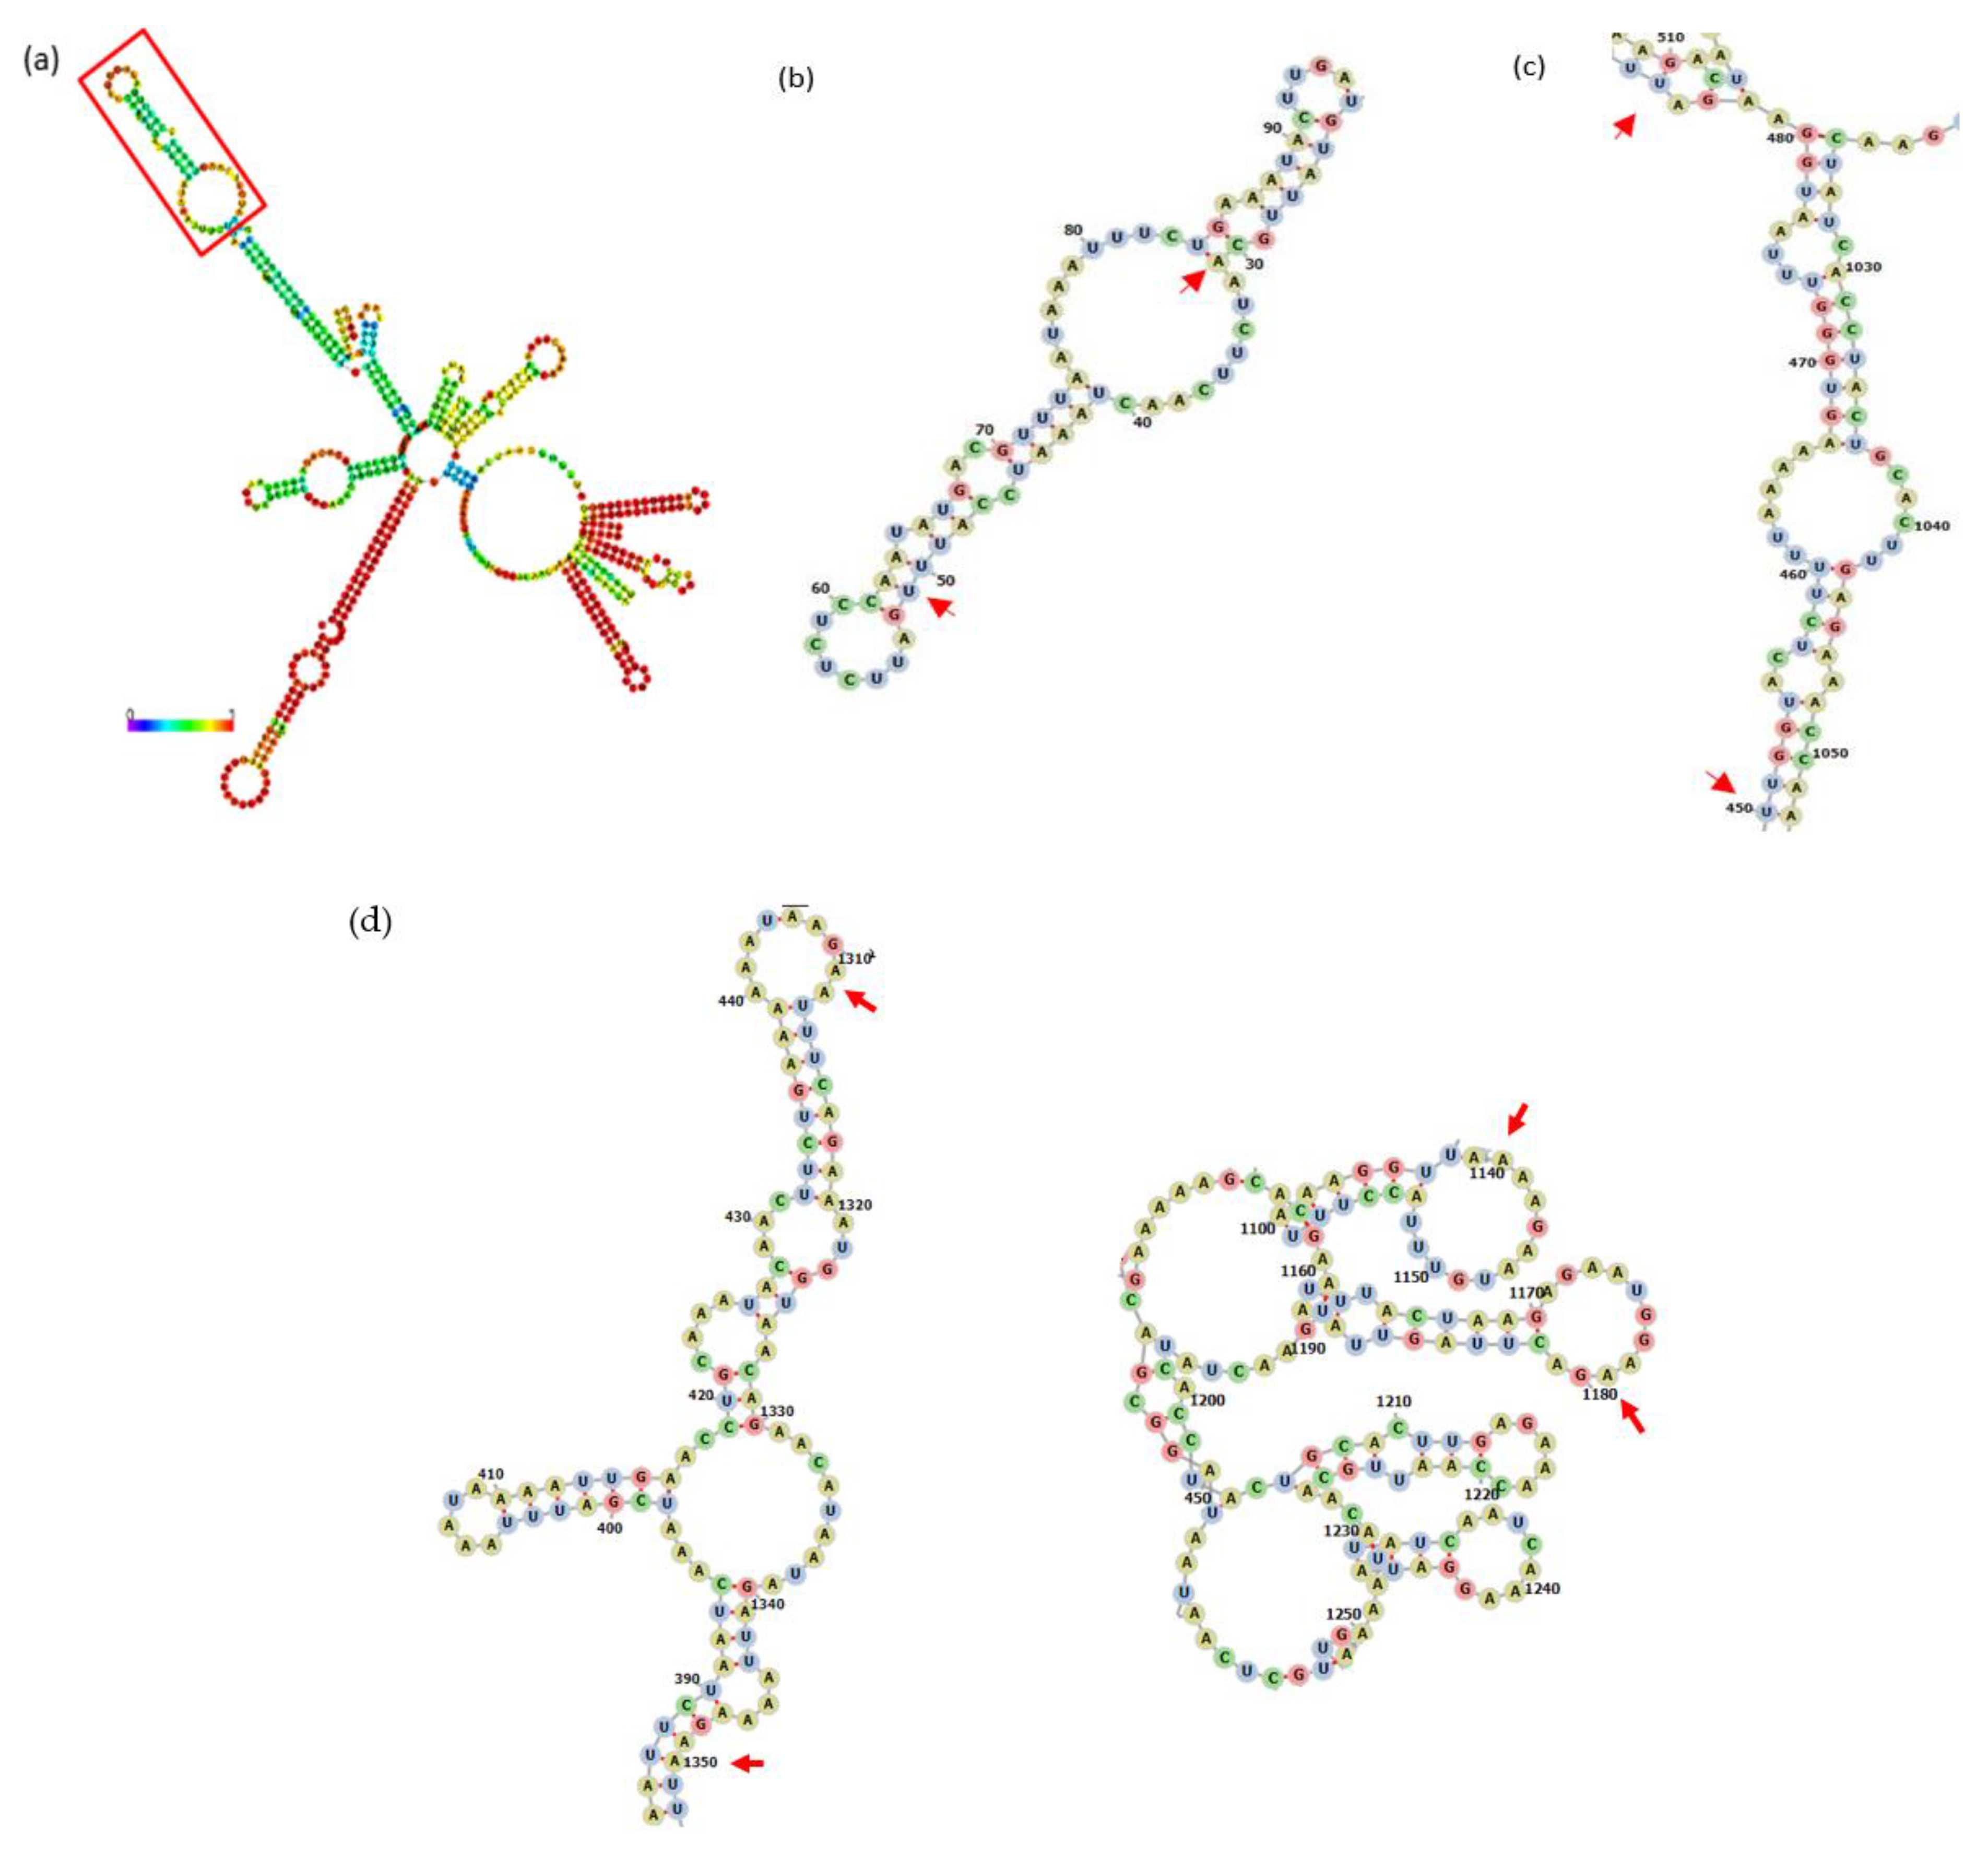
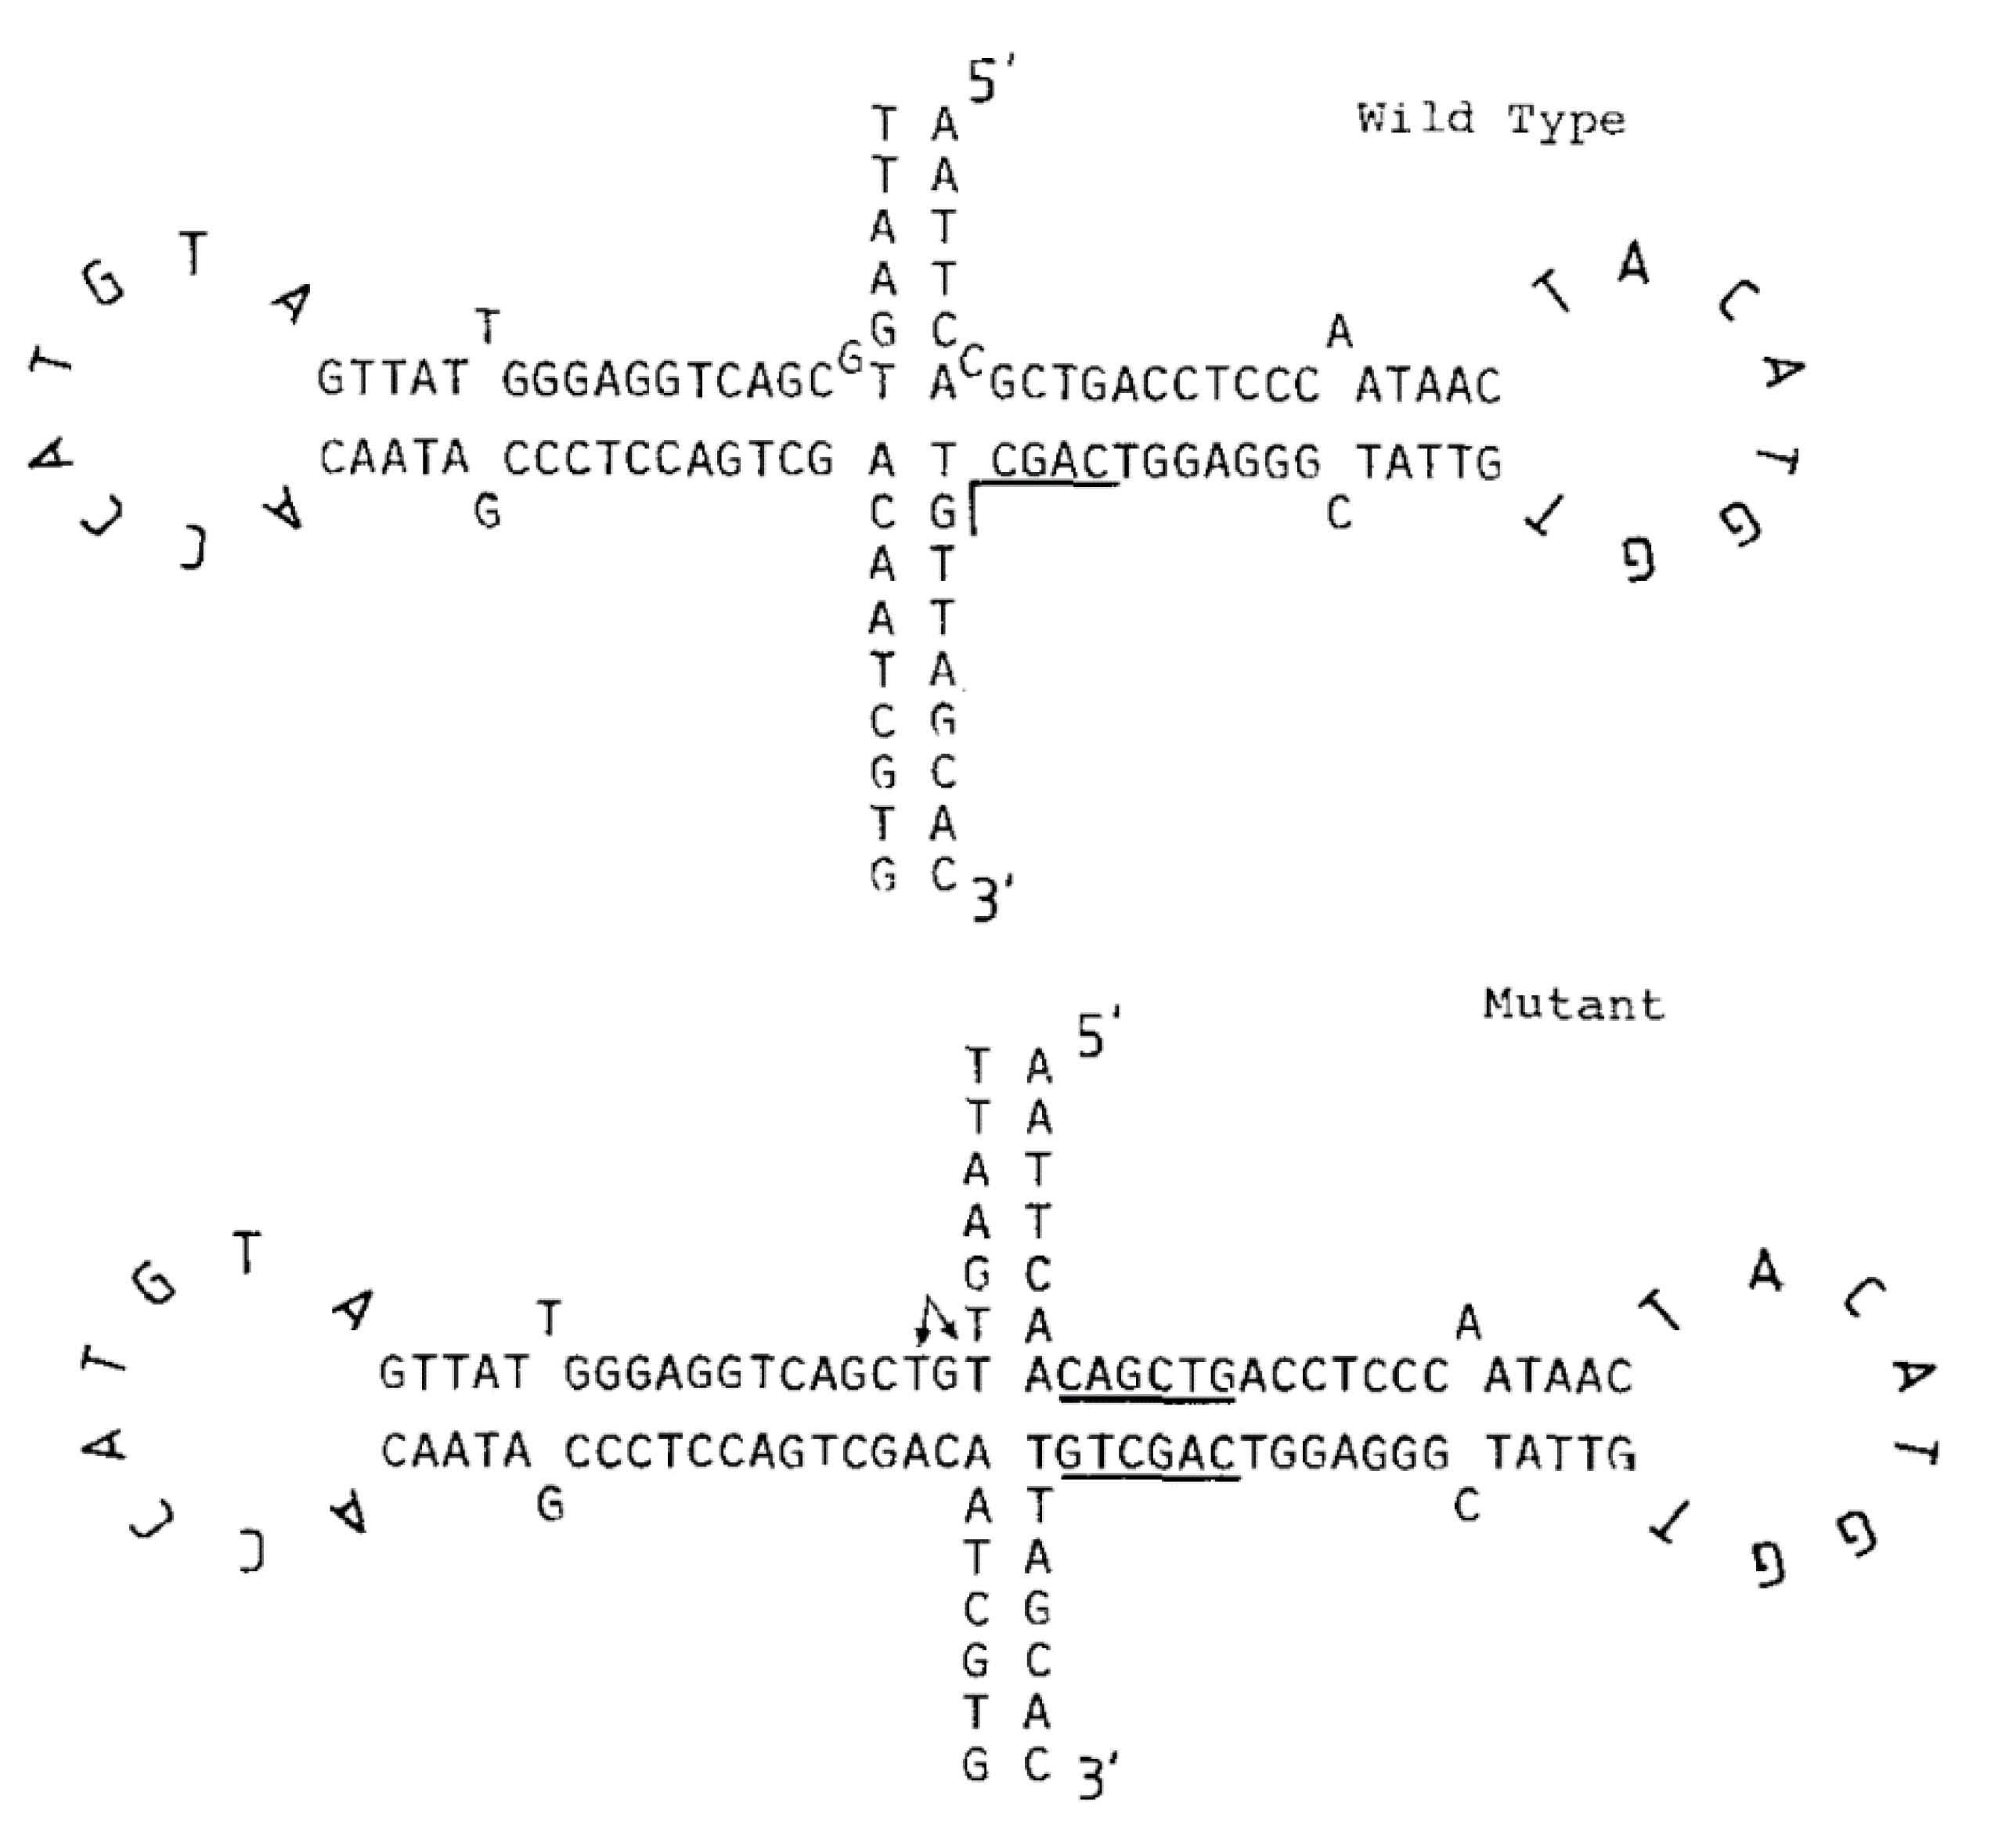
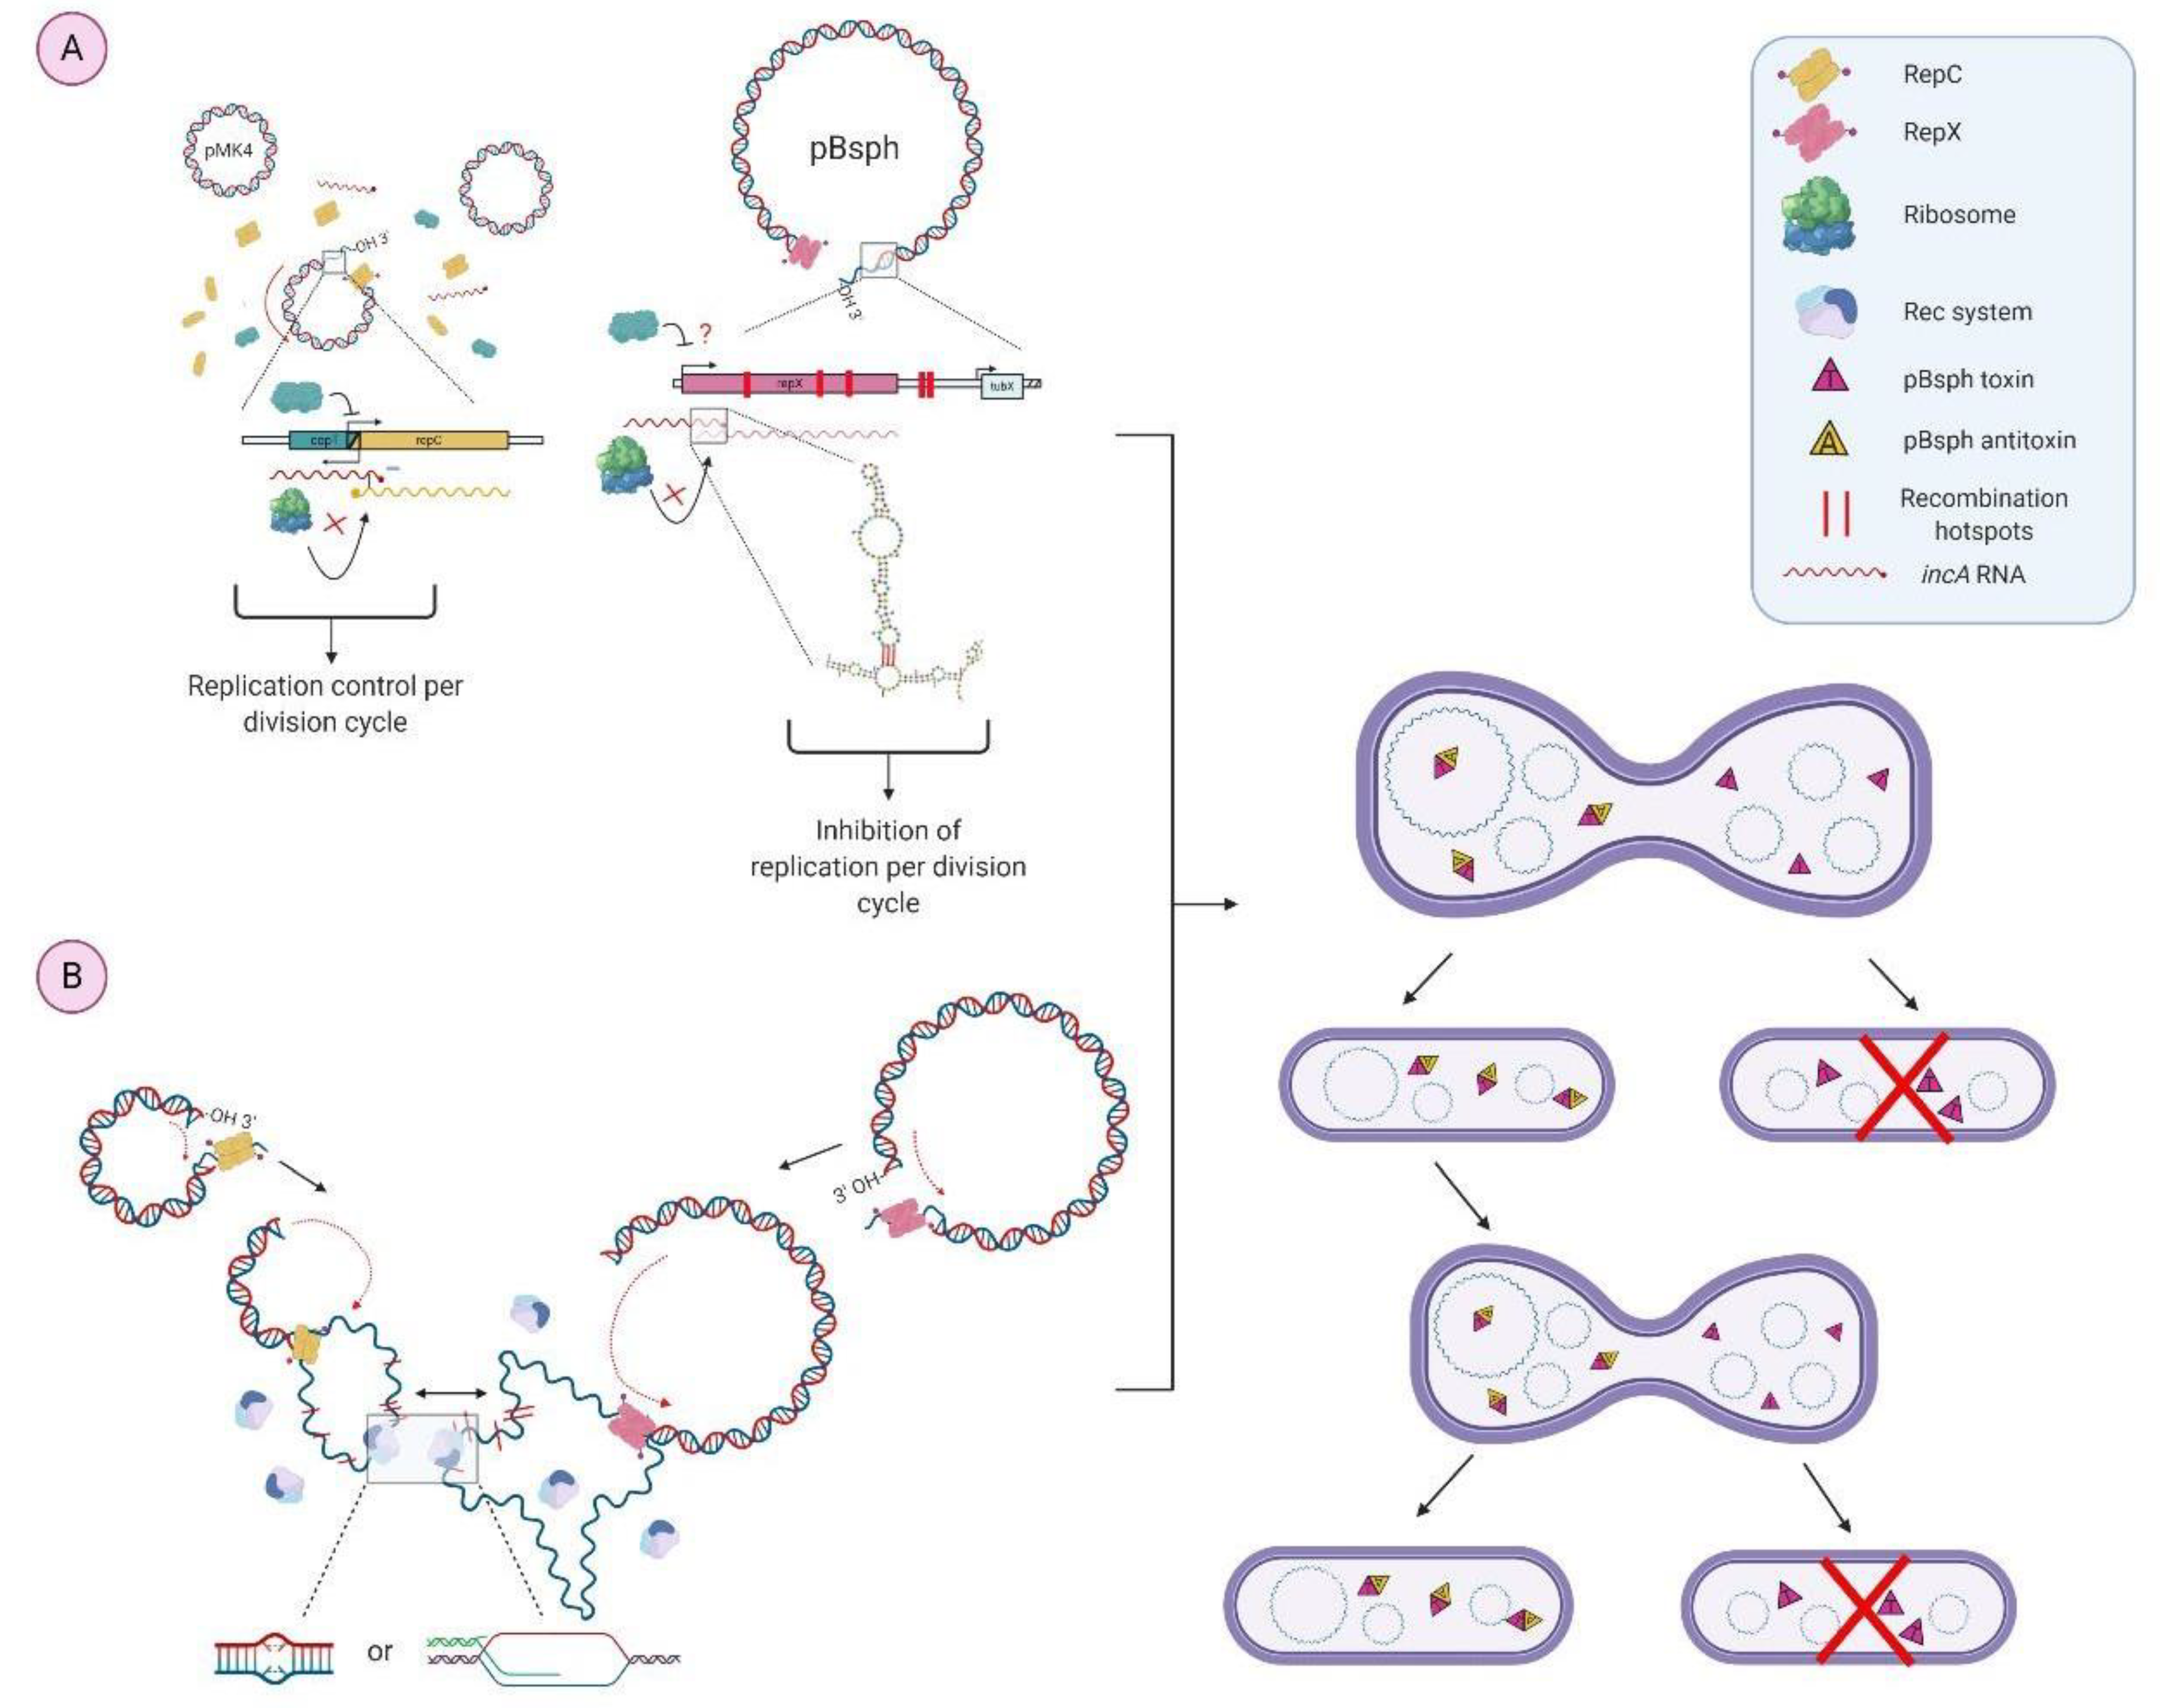
Table 1.
IntaRNA report for RNA-RNA interactions between repX replicon and incA. Position and mfe for each relevant reported structure are specified. Structures with higher mfe than −9 kcal/mol were excluded.
Table 1.
IntaRNA report for RNA-RNA interactions between repX replicon and incA. Position and mfe for each relevant reported structure are specified. Structures with higher mfe than −9 kcal/mol were excluded.
| Target | Start (T) | End (T) | Query | Start (Q) | End (Q) | Energy (kcal/mol) |
|---|---|---|---|---|---|---|
| pBsph-repX replicon | 1137 | 1185 | incA | 49 | 94 | −14.54 |
| pBsph-repX replicon | 466 | 486 | incA | 31 | 51 | −13.06 |
Table 2.
Identity percentage reported between Tns regions found in pMK4 and in MGEs analysis region within pBsph.
Table 2.
Identity percentage reported between Tns regions found in pMK4 and in MGEs analysis region within pBsph.
| MGE | Family | Identity Percentage of Tn Region with pBsph (MGEs Analysis Region) |
|---|---|---|
| Tn2 | Tn3 | 41.1% |
| Tn3 | Tn3 | 40.6% |
Table 3.
Adducts identified using MassHunter Qualitative within negative and positive polarity chromatograms.
Table 3.
Adducts identified using MassHunter Qualitative within negative and positive polarity chromatograms.
| Compound Name | Compound Structure | Found Predominantly in |
|---|---|---|
| L-malate |  | Plasmid-bearing cells |
| Glycerol-1-phosphate |  | Plasmid-free cells |
| Succynil glutamate |  | Plasmid-free cells |
| Acetyldihydrolipoamide |  | Plasmid-free cells |
| Lysine |  | Plasmid-free cells |
| Butylhydroquinone |  | Plasmid-free cells |
| Monoethanolamine | Plasmid-free cells | |
| Methyl lucidenate |  | Plasmid-bearing cells |
Table 4.
Percentage of identity between pMK4 sequence and sporulation regulatory sRNAs of B. subtilis.
Table 4.
Percentage of identity between pMK4 sequence and sporulation regulatory sRNAs of B. subtilis.
| Regulatory sRNA Name | Regulated Gene in B. subtilis | Percentage of Identity with pMK4 (%) |
|---|---|---|
| S1058 | spo0A | 84.62 |
| S1024 | sigA, sigK | 86.21 |
| S424 | spoVIF | 82.24 |
Publisher’s Note: MDPI stays neutral with regard to jurisdictional claims in published maps and institutional affiliations. |
© 2021 by the authors. Licensee MDPI, Basel, Switzerland. This article is an open access article distributed under the terms and conditions of the Creative Commons Attribution (CC BY) license (https://creativecommons.org/licenses/by/4.0/).
Share and Cite
MDPI and ACS Style
León, D.C.; Dussán, J. Lysinibacillus sphaericus III(3)7 and Plasmid Vector pMK4: New Challenges in Cloning Platforms. Microbiol. Res. 2021, 12, 455-479. https://0-doi-org.brum.beds.ac.uk/10.3390/microbiolres12020031
AMA Style
León DC, Dussán J. Lysinibacillus sphaericus III(3)7 and Plasmid Vector pMK4: New Challenges in Cloning Platforms. Microbiology Research. 2021; 12(2):455-479. https://0-doi-org.brum.beds.ac.uk/10.3390/microbiolres12020031
Chicago/Turabian StyleLeón, Diana C., and Jenny Dussán. 2021. "Lysinibacillus sphaericus III(3)7 and Plasmid Vector pMK4: New Challenges in Cloning Platforms" Microbiology Research 12, no. 2: 455-479. https://0-doi-org.brum.beds.ac.uk/10.3390/microbiolres12020031