
Metabolically Unhealthy Phenotype: A Key Factor in Determining “Pediatric” Frailty

 , , , ,
Abstract
:1. Introduction
2. Patients and Methods
2.1. Patients
- -
- Fifty undernourished children (defined as having a body mass index of BMI ≤ 2, standard deviation score, SDS, according to World Health Organization [8]) with severe NI (Level 5m according to Gross Motor Function Classification System [6]; cerebral palsy was apparent in 38% of subjects; 36% suffered from epileptic encephlopathy; a neurological disability in dysmorphic syndrome was clear in 26%). All NI children were bedridden and lived in sheltered communities. In all subjects, at least 2 anticonvulsive drugs were administered, including phenobarbital, phenytoin, valproic acid, topiramate, lamotrigine, carbamazepine, and clonazepam, and enteral feeding was adopted. The patients were enrolled between 1 February 2016 and 1 June 2016, and referred to the Pediatric Surgery Unit, Fondazione IRCCS Policlinico San Matteo for treatment and/or management of nutrition support.
- -
- Fifty children with obesity (BMI ≥ 2 SDS) [8] comparable for age and sex. Due to excessive body weight, these subjects were referred by their general practitioner or primary care pediatrician to the outpatient clinic of the Pediatric Endocrinology Unit and were consecutively enrolled. Children were excluded from enrollment if they had concurrent chronic or acute illnesses, any known secondary syndromes, or were on any medication.
- -
- Fifty historical normal weight children (−1 SDS ≤BMI ≤ +1 SDS) [8] matched for age and sex. The subjects were admitted to the pediatric outpatient clinic of the Pediatric Endocrinology Unit and were referred by their general practitioner or primary care pediatrician for auxological evaluation. They were consecutively enrolled.
- -
- Twenty-one hospitalized patients older than 75 were included as an FI risk group. The patients were referred to a clinic (Istituto di Cura Città di Pavia) for vascular evaluation.
2.2. Anthropometric Parameters and Blood Pressure
2.3. Biochemical Parameters
2.4. Statistical Methods
3. Results
3.1. Pediatric Groups
3.2. Pediatric Groups in Comparison to Older Patients
4. Discussion
5. Conclusions
Author Contributions
Funding
Institutional Review Board Statement
Informed Consent Statement
Data Availability Statement
Conflicts of Interest
References
- Hubbard, R.E.; Theou, O. Frailty: Enhancing the known knowns. Age Ageing 2012, 41, 574–575. [Google Scholar] [CrossRef] [PubMed] [Green Version]
- Feng, Z.; Lugtenberg, M.; Franse, C.; Fang, X.; Hu, S.; Jin, C.; Raat, H. Risk factors and protective factors associated with incident or increase of frailty among community-dwelling older adults: A systematic review of longitudinal studies. PLoS ONE 2017, 12, e0178383. [Google Scholar] [CrossRef] [PubMed] [Green Version]
- Calcaterra, V.; Cena, H.; De Silvestri, A.; Albertini, R.; De Amici, M.; Valenza, M.; Pelizzo, G. Stress Measured by Allostatic Load in Neurologically Impaired Children: The Importance of Nutritional Status. Horm Res Paediatr. 2017, 88, 224. [Google Scholar] [CrossRef] [PubMed]
- Calcaterra, V.; Vinci, F.; Casari, G.; Pelizzo, G.; De Silvestri, A.; De Amici, M.; Albertini, R.; Regalbuto, C.; Montalbano, C.; Larizza, D.; et al. Evaluation of Allostatic Load as a Marker of Chronic Stress in Children and the Importance of Excess Weight. Front Pediatr. 2019, 7, 335. [Google Scholar] [CrossRef] [PubMed] [Green Version]
- Maduro, A.T.; Luís, C.; Soares, R. Ageing, cellular senescence and the impact of diet: An overview. Porto Biomed. J. 2021, 6, e120. [Google Scholar] [CrossRef] [PubMed]
- Green, S.; Hillersdal, L. Aging biomarkers and the measurement of health and risk. Hist. Philos. Life Sci. 2021, 43, 28. [Google Scholar] [CrossRef] [PubMed]
- Kane, A.E.; Gregson, E.; Theou, O.; Rockwood, K.; Howlett, S.E. The association between frailty, the metabolic syndrome, and mortality over the lifespan. Geroscience 2017, 39, 221–229. [Google Scholar] [CrossRef] [PubMed] [Green Version]
- World Health Organization. Available online: https://www.who.int/tools/growth-reference-data-for-5to19-years/indicators/bmi-for-age (accessed on 30 May 2021).
- Izaks, G.J.; Westendorp, R.G. Ill or just old? Towards a conceptual framework of the relation between ageing and disease. BMC Geriatr. 2003, 3, 7. [Google Scholar] [CrossRef] [PubMed] [Green Version]
- Pelizzo, G.; Calcaterra, V.; Acierno, C.; Cena, H. Malnutrition and Associated Risk Factors among Disabled Children. Special Considerations in the Pediatric Surgical “Fragile” Patients. Front Pediatr. 2019, 7, 86. [Google Scholar] [CrossRef] [PubMed]
- Lorenzo, I.; Serra-Prat, M.; Yébenes, J.C. The Role of Water Homeostasis in Muscle Function and Frailty: A Review. Nutrients 2019, 11, 1857. [Google Scholar] [CrossRef] [PubMed] [Green Version]
- Stevenson, R.D. Use of segmental measures to estimate stature in children with cerebral palsy. Arch. Pediatr. Adolesc. Med. 1995, 149, 658–662. [Google Scholar] [CrossRef] [PubMed]
- Matthews, D.R.; Hosker, J.P.; Rudenski, A.S.; Naylor, B.A.; Treacher, D.F.; Turner, R.C. Homeostasis model assessment: Insulin resistance and β-cell function from fasting plasma glucose and insulin concentrations in man. Diabetologia 1985, 28, 412–419. [Google Scholar] [CrossRef] [Green Version]
- Alberti, K.G.; Eckel, R.H.; Grundy, S.M.; Zimmet, P.Z.; Cleeman, J.I.; Donato, K.A.; Fruchart, J.C.; James, W.P.; Loria, C.M.; Smith, S.C., Jr.; et al. Harmonizing the metabolic syndrome: A joint interim statement of the International Diabetes Federation Task Force on Epidemiology and Prevention; National Heart, Lung, and Blood Institute; American Heart Association; World Heart Federation; International Atherosclerosis Society; and International Association for the Study of Obesity. Circulation 2009, 120, 1640–1645. [Google Scholar]
- Chang, T.; Ravi, N.; Plegue, M.A.; Sonneville, K.R.; Davis, M.M. Inadequate Hydration, BMI, and Obesity Among US Adults: NHANES 2009–2012. Ann. Fam. Med. 2016, 14, 320–324. [Google Scholar] [CrossRef] [PubMed]
- Genovesi, S.; Antolini, L.; Orlando, A.; Gilardini, L.; Bertoli, S.; Giussani, M.; Invitti, C.; Nava, E.; Battaglino, M.G.; Leone, A.; et al. Cardiovascular Risk Factors Associated With the Metabolically Healthy Obese (MHO) Phenotype Compared to the Metabolically Unhealthy Obese (MUO) Phenotype in Children. Front. Endocrinol. 2020, 11, 27. [Google Scholar] [CrossRef] [PubMed] [Green Version]
- Damanhoury, S.; Newton, A.S.; Rashid, M.; Hartling, L.; Byrne, J.L.S.; Ball, G.D.C. Defining metabolically healthy obesity in children: A scoping review. Obes Rev. 2018, 19, 1476–1491. [Google Scholar] [CrossRef]
- Riobó Serván, P.; Sierra Poyatos, R.; Soldo Rodríguez, J.; Gómez-Candela, C.; García Luna, P.P.; Serra-Majem, L. Special considerations for nutritional studies in elderly. Nutr. Hosp. 2015, 31 (Suppl. 3), 84–90. [Google Scholar] [PubMed]


| Variables | Pediatric Patients | Old Patients (OP) | p Value | |||||||
|---|---|---|---|---|---|---|---|---|---|---|
| Normal Weight (N) | Disabled (D) | Obese (O) | N vs. D | N vs. O | O vs. D | N vs. OP | OP vs. D | O vs. OP | ||
| Age (years) | 11.97 (3.59) | 11.82 (5.82) | 11.51 (3.18) | 79.2 (3,2) | 0.88 | 0.50 | 0.73 | <0.001 | <0.001 | <0.001 |
| Females n (%) | 23 (46) | 22 (44) | 25 (50) | 10 (47.62) | 0.84 | 0.68 | 0.54 | 0.90 | 0.776 | 0.85 |
| Metabolically unhealthy phenotype n (%) | 3 (6) | 35 (77.78) | 23 (46) | 18 (85.71) | <0.001 | <0.01 | <0.001 | <0.001 | 0.45 | <0.01 |
| Waist circumference (cm) | 67.75 (8.91) | 67.23 (15.4) | 84.41 (8.98) | nd | 0.83 | <0.001 | <0.001 | nd | nd | nd |
| Waist to height ratio | 0.48 (0.14) | 0.5 (0.11) | 0.56 (0.6) | nd | <0.001 | <0.001 | <0.001 | |||
| Glycemia (mg/dL) | 77.36 (9.42) | 82.24 (48.31) | 72.78 (11.9) | 99.57 (26.72) | 0.48 | 0.03 | 0.18 | <0.001 | 0.13 | <0.001 |
| Fasting insulin (μUI/mL) | 8.4 (2.8–11.6) | 14.5 (5.5–24.35) | 9.7 (6.1–15.6) | <0.001 | 0.02 | 0.06 | nd | nd | nd | |
| HOMA-IR | 1.53 (.45–2 | 2.75 (1.06–5) | 1.544 (1.05–2) | <0.001 | 0.07 | 0.04 | nd | nd | nd | |
| Tryglicerides (mg/dL) | 63.5 (49.5–87) | 85 (66–131) | 73 (59–104) | 92 (77–129) | <0.001 | 0.01 | 0.12 | <0.001 | 0.31 | 0.11 |
| Total cholesterol (mg/dL) | 151.08 (24.02) | 146.02 (36.83) | 159.84 (30.96) | 169.81 (52.94) | 0.53 | 0.21 | 0.05 | 0.11 | 0.03 | 0.32 |
| HDL cholesterol (mg/dL) | 54.67 (10.41) | 44.07 (13.07) | 47.6 (10.1) | <0.001 | <0.001 | 0.14 | nd | nd | nd | |
| Systolic blood pressure (mmHg) | 105.4 (9.03) | 103.6 (17.39) | 113.76 (10.22) | 138.71 (16.44) | 0.52 | <0.01 | <0.001 | <0.001 | <0.001 | <0.001 |
| Diastolic blood pressure (mmHg) | 67 (8.39) | 65.91 (12.9) | 70.64 (8.3) | 82.29 (7.38) | 0.62 | 0.03 | 0.03 | <0.001 | <0.001 | <0.001 |
| GOT (U/L) | 23.3 (6.42) | 26.53 (13.32) | 22.85 (6.44) | 19.48 (7.03) | 0.22 | 0.76 | 0.09 | 0.04 | 0,02 | 0.05 |
| GPT (U/L) | 14 (12–16) | 14.5 (11.5–22.5) | 15 (13–24) | 77 (62–90) | 0.49 | 0.07 | 0.53 | <0.001 | <0.001 | <0.001 |
| GGT (U/L) | 12.85 (5.15) | 28.21 (21.06) | 15.6 (6.74) | 29 (21) | <0.001 | 0.07 | 0.03 | <0.001 | 0.88 | <0.001 |
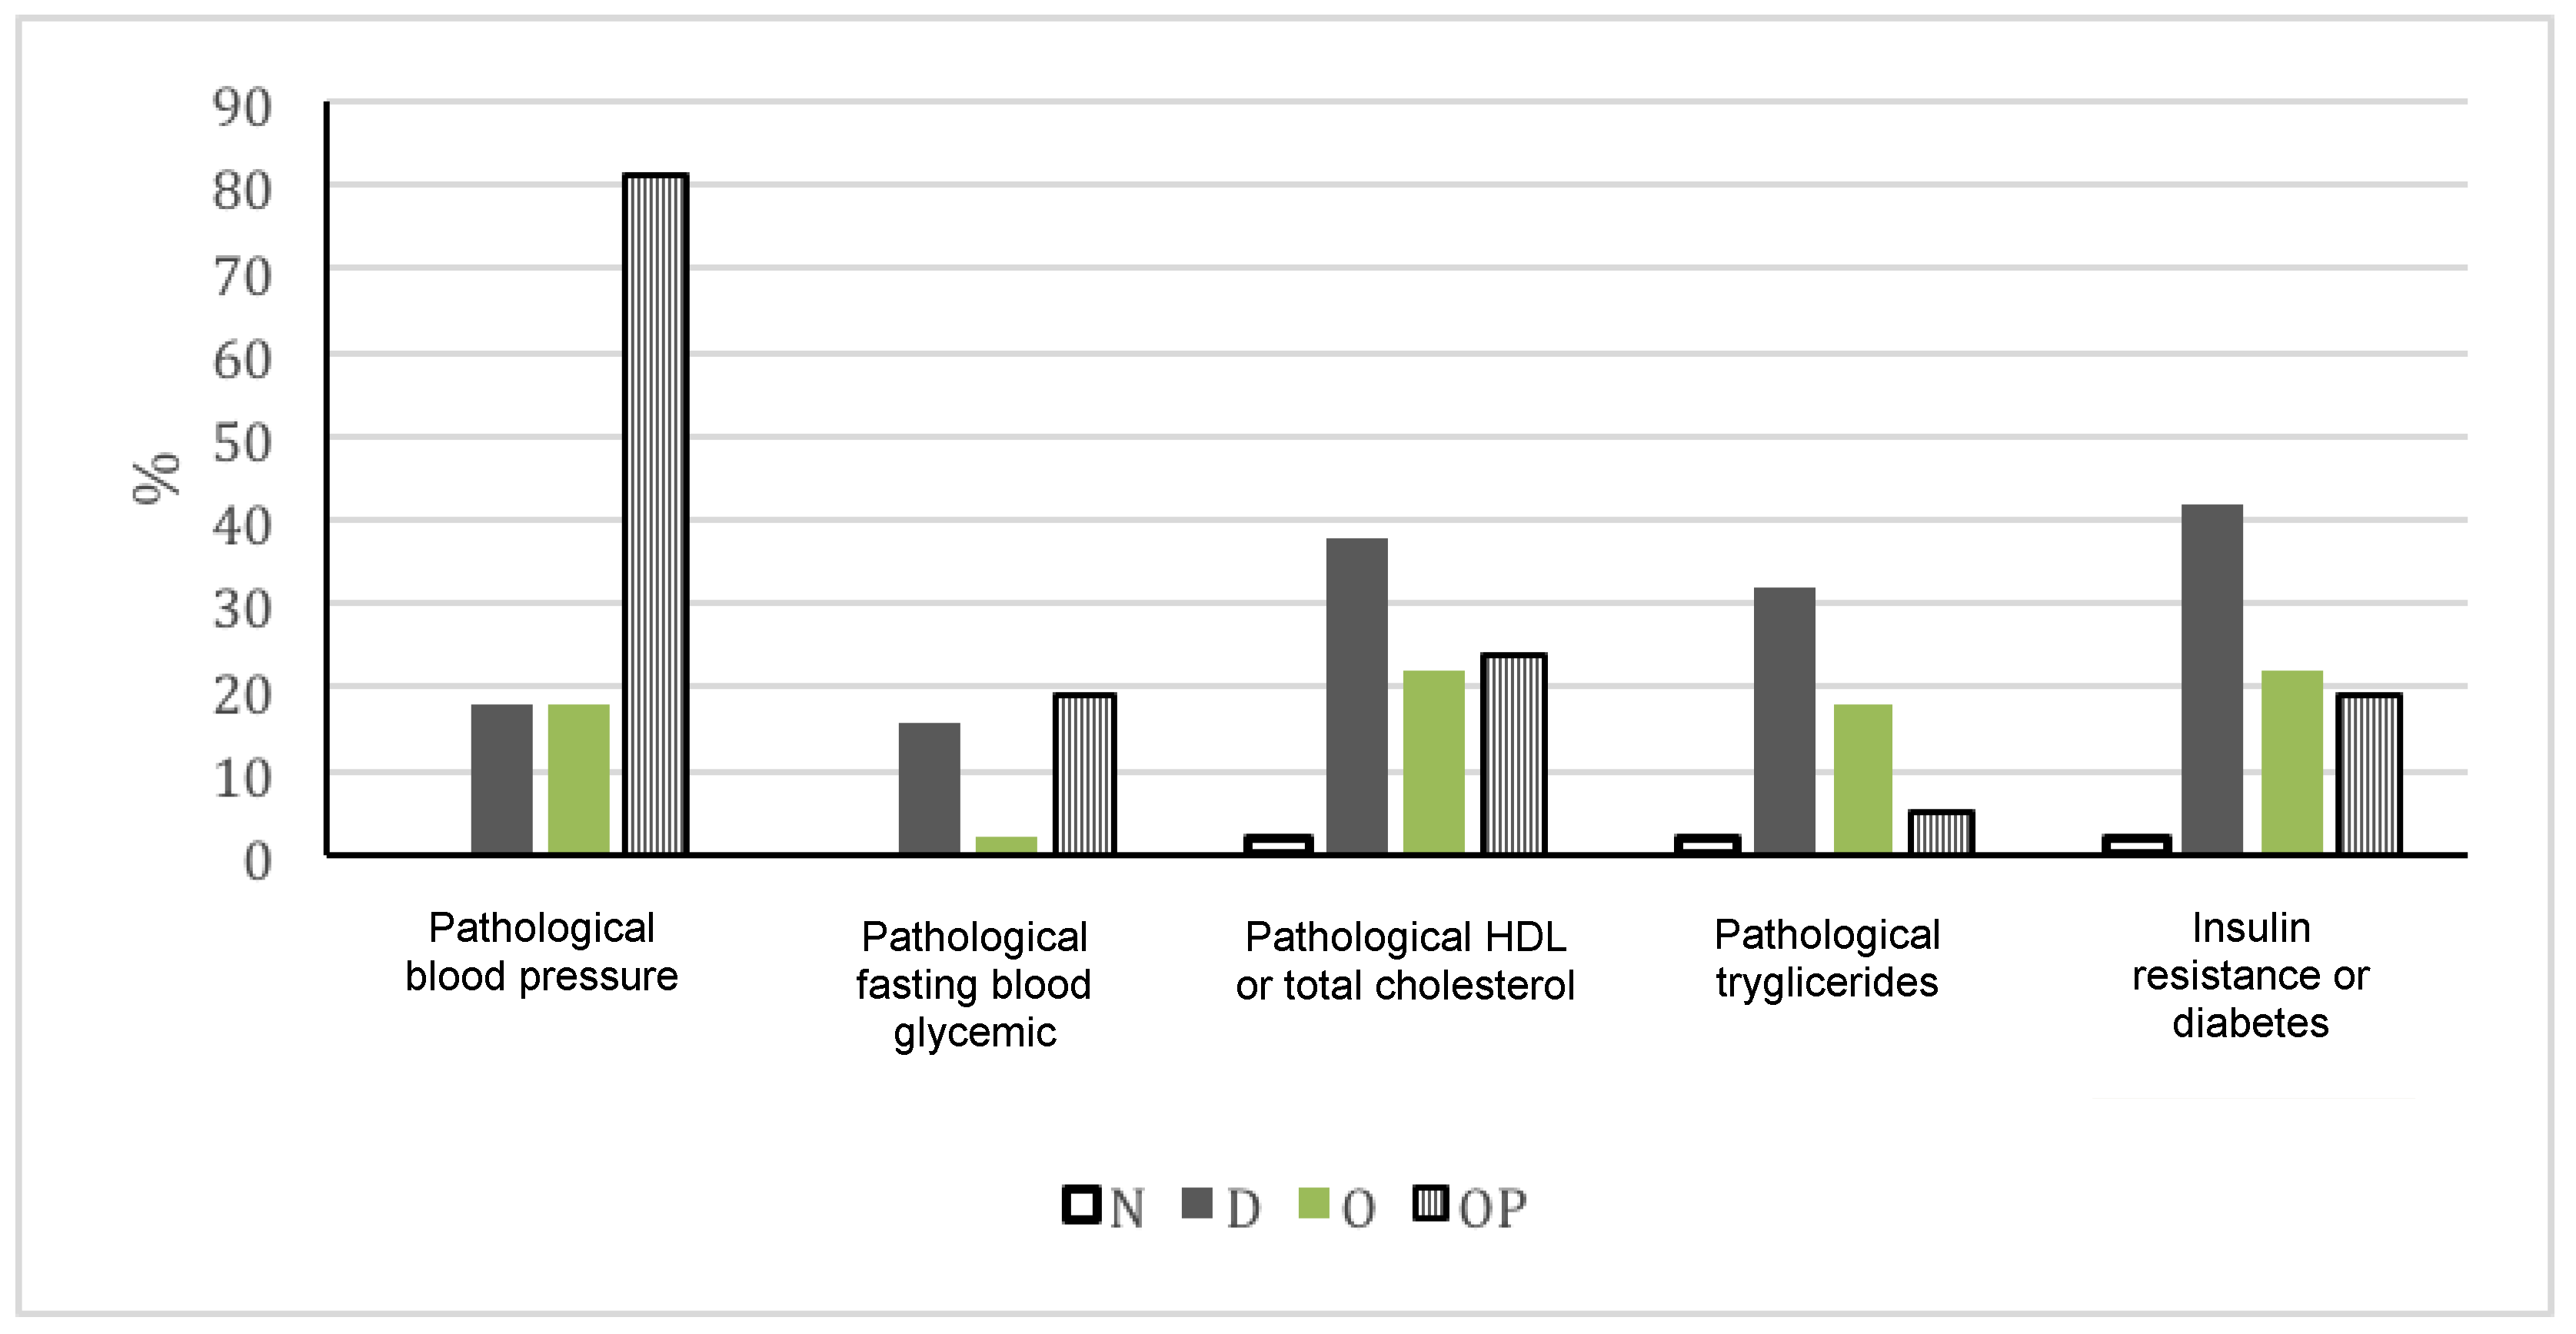
| Pathological blood pressure n (%) | 0 (0) | 9 (18) | 9 (18) | 17 (80.95) | <0.01 | 0.001 | 1 | <0.001 | <0.001 | <0.001 |
| Pathological fasting blood glycemia n (%) | 0 (0) | 7 (15.56) | 1 (2) | 4 (19.05) | <0.01 | 0.31 | 0.01 | <0.01 | 0.72 | 0.01 |
| Pathological HDL or total cholesterol n (%) | 1 (2) | 17 (37.78) | 11 (22) | 5 (23.81) | <0.001 | <0.01 | 0.09 | <0.01 | 0.26 | 0.86 |
| Pathological tryglicerides n (%) | 1 (2) | 16 (32) | 9 (18) | 1 (4.76) | <0.001 | <0.01 | 0.10 | 0.52 | 0.01 | 0.14 |
| Insulin resistance or diabetes n (%) | 1 (2) | 21 (42) | 11 (22) | 4 (19.05) | <0.001 | <0.01 | 0.03 | 0.01 | 0.06 | 0.78 |
Publisher’s Note: MDPI stays neutral with regard to jurisdictional claims in published maps and institutional affiliations. |
© 2021 by the authors. Licensee MDPI, Basel, Switzerland. This article is an open access article distributed under the terms and conditions of the Creative Commons Attribution (CC BY) license (https://creativecommons.org/licenses/by/4.0/).
Share and Cite
Calcaterra, V.; Cena, H.; Ruggieri, A.; Zuccotti, G.; De Silvestri, A.; Bonalumi, G.; Pelizzo, G. Metabolically Unhealthy Phenotype: A Key Factor in Determining “Pediatric” Frailty. Pediatr. Rep. 2021, 13, 340-346. https://0-doi-org.brum.beds.ac.uk/10.3390/pediatric13030042
Calcaterra V, Cena H, Ruggieri A, Zuccotti G, De Silvestri A, Bonalumi G, Pelizzo G. Metabolically Unhealthy Phenotype: A Key Factor in Determining “Pediatric” Frailty. Pediatric Reports. 2021; 13(3):340-346. https://0-doi-org.brum.beds.ac.uk/10.3390/pediatric13030042
Chicago/Turabian StyleCalcaterra, Valeria, Hellas Cena, Annamaria Ruggieri, Gianvincenzo Zuccotti, Annalisa De Silvestri, Gianni Bonalumi, and Gloria Pelizzo. 2021. "Metabolically Unhealthy Phenotype: A Key Factor in Determining “Pediatric” Frailty" Pediatric Reports 13, no. 3: 340-346. https://0-doi-org.brum.beds.ac.uk/10.3390/pediatric13030042