Article

Analysis of Evolution Mechanism and Optimal Reward-Penalty Mechanism for Collection Strategies in Reverse Supply Chains: The Case of Waste Mobile Phones in China

College of Mechanical Engineering, Zhejiang University of Technology, Hangzhou 310014, China
*
Author to whom correspondence should be addressed.
Sustainability 2018, 10(12), 4744; https://0-doi-org.brum.beds.ac.uk/10.3390/su10124744
Submission received: 30 October 2018 / Revised: 28 November 2018 / Accepted: 30 November 2018 / Published: 12 December 2018

Abstract

:
The aim of this paper is to discuss the coopetition (cooperative competition) relationship between a manufacturer and a collector in the collection of waste mobile phones (WMPs) and examine the evolution mechanism and the internal reward-penalty mechanism (RPM) for their collection strategies. A coopetition evolutionary game model based on evolutionary game theory was developed to obtain their common and evolutional collection strategies. The pure-strategy Nash equilibriums of this model were obtained which showed their collection strategy choices of perfect competition or cooperation. The mixed strategy Nash equilibrium was obtained which revealed evolution trends and laws. In addition, the optimal RPM was obtained in the sensitivity analysis of related parameters. The example of WMPs in China was taken to examine the simulation of the RPM. Results show that (i) although the manufacturer and the collector may change their strategies of cooperation and competition over time, cooperation is their best choice to increase payoffs; (ii) the optimal RPM is beneficial to propel their cooperation tendency and then to increase their payoffs.

1. Introduction

Mobile phones have become essential parts of daily life and the most commonly manufactured electronic equipment [1]. Since China became the largest producer and seller of mobile phones in 2004, the total number of mobile phone users has achieved 1.5 billion in 2018 [2]. The life expectancy of a mobile phone is shorter than 3 years according to studies from many scholars [3,4,5]. Obviously, the generation of waste mobile phones (WMPs) is huge and now they have become an environmental problem as a part of waste electrical and electronic equipment (WEEE). In 2017, there were approximately 1 billion WMPs in China, and the recycling rate was only 2% [6]. However, WEEE management has been implemented in developed countries since 2000 [7,8,9], and many compulsory laws and directives such as the EU Directive on WEEE (2002/96/EC) [10], its revised version (2008/34/EC) [11], and the newest one (2012/19/EU) [12] have been enacted based on extended producer responsibility (EPR) principles. The Directive (2012/19/EU) requires that 75% of WMPs should be recovered, and 55% of WMPs should be reused and recycled by 2018 [12]. The EPR principles require producers including manufacturers and importers to take responsibility for the whole lifespan of a product, especially for the collecting, dismantling, and recycling at its end-of-life stage [13].
The collection of WMPs in the reverse supply chain (RSC) is mainly conducted by formal collectors in many developed countries. Switzerland first established a formal and comprehensive management system of WEEE, which is well operated with producer responsibility organizations (PROs) [14]. Manufacturers, importers, distributors, and retailers collect WMPs through established collection points and retail locations supported by the Swiss Association for Information, Communication and Organization Technology, which is one of the most important PROs [15]. In Japan, the Law on the Promotion of Recycling and Reuse of Used Small Electronic Equipment was enacted to support the tack-back of 28 types of small electronic products including WMPs in 2012 [16]. Under the guidance of related laws, retailers and mobile phone operators have collected WMPs through recycling bins at their business outlets [17].
In many developing countries including China, the collection of WMPs is conducted by formal and informal collectors [18,19,20]. Street peddlers and repairers in China dismantle WMPs harmfully and crudely and put them into the market with rough refurbishment, who are the leading collectors in the informal collection. As to the formal collection, there are mainly two ways in China. One is the manufacturer’s collection, such as the Old-for-New (OFN) service of Mi (http://huanxin.mi.com), and the other is the collector’s collection like the third-party collection platform represented by Aihuishou (https://www.aihuishou.com/shouji). They have a competitive and cooperative relationship for WMPs collection. The collector can be served for the manufacturer. On the other hand, they also compete for the surplus value of WMPs such as remanufacturing materials. One of main reasons why they engage in e-waste collection is to recapture the value of the recycled materials and end-of-life products [21]. Their coopetition (cooperative competition) relationship continues throughout the whole game process, and they adjust with each other’s strategy according to opponent’s responses and their own payoffs.
The relationship between the manufacturer and the collector can be presented by evolutionary game theory (EGT) which assumes the man of bounded rationality [22]. It is more in line with the reality because of incomplete information and changing environment. The EGT emphasizes the behavioral interaction among players which can affect their payoffs directly. The behavioral interaction between the manufacturer and the collector in the WMPs collection is who will do the collection and how to bind them with a contract. They develop their own strategies in the process of the interaction. The EGT can entirely reflect the relationship between strategies change and payoffs fluctuation, can also effectively reflect their complex coopetition relationships. Rosas [23] pointed out that social scientists usually exploit the EGT to study human cooperation. Ji et al. [24] argued that the EGT can effectively observe the changing of cooperation tendency among multi-stakeholders. Some studies have exploited the EGT to analyze the collection of WEEE. Esmaeili et al. [25] adapted the EGT to discuss whether performing collection or not for the manufacturer and the retailer. Wu and Xiong [26] studied cooperation behavior between manufacturers and collectors under a government subsidy mechanism with the EGT.
Except for the subsidy mechanism, the reward-penalty mechanism (RPM) made by the government in a closed-loop supply chain is examined by Wang et al. [27,28,29,30]. The RPM is one of incentive mechanisms which are usually used to coordinate forward and reverse supply chains. The producers will face penalties if they cannot achieve the target collection rate set by the EU Directives on WEEE. Unlike this, the Chinese government prefers subsidies or rewards, which set up a WEEE treatment fund in 2012 [31] and added the WMPs to the Waste Electrical and Electronic Equipment Treatment Directory (2014 Edition) in 2015 [32]. The EPR principles were adopted in this fund. Specifically, the government levies funds on the electrical and electronic equipment producers and provides subsidies or rewards to authorized WEEE dismantling companies according to their actual disposal quantity. The RPM for the manufacturer and the collector is conducive to enhancing collection rate and increasing their payoffs. In addition, the RPM can be used to promote positive strategy evolution. Therefore, we examine an internal RPM negotiated by the manufacturer and the collector, which is rare in other literature.
Based on the theory and practice of the RSC, EGT, RPM, and the motivating example, we investigate an RSC comprising one manufacturer and one collector under an RPM. This paper uses the evolutionary game to discuss the relationships between members in the RSC and to analyze the evolution mechanism of their collection strategies, meanwhile, an optimal RPM is obtained. Finally, we take the collection of Chinese WMPs as an example to conduct the simulation of the RPM. Specifically, we address the following research questions:
(1)
What kind of relationship between the manufacturer and the collector is beneficial to them?
(2)
How does the evolution mechanism of their collection strategies affect their coopetition?
(3)
What kind of RPM should be negotiated by them?
This paper exploits the EGT to discuss the coopetition relationship between a manufacturer and a collector in the collection and to examine the evolution mechanism and the optimal RPM for their collection strategies. Their strategy changes, evolution trends, and payoff fluctuations have been thoroughly studied, which is rare in other literature. The majority of incentive mechanisms is imposed by the government in a closed-loop supply chain (CLSC); there are few internal RPMs from players. However, this paper provides the internal RPM negotiated by the manufacturer and the collector.
The remainder of this paper is organized as follows. In the next section, we provide a literature review. The coopetition evolutionary game model (CEGM) is given in Section 3. Section 4 provides the analysis of evolutionary stability strategy (ESS) and the detailed analysis of the model including the optimal RPM. The simulation of the RPM is conducted in Section 5. Section 6 concludes this paper, discusses managerial implications, and proposes future research opportunities. List of acronyms in this paper is shown in Appendix A.

2. Literature Review

The RSC contains activities of product acquisition, reverse logistics, testing, sorting, refurbishing, and remarketing [33]. A great deal of work has been done in the WEEE collection, as reviewed in Section 2.1. In Section 2.2, we discuss incentive mechanisms for an RSC. The applications of the EGT are reviewed in Section 2.3.

2.1. WEEE Collection

WEEE management has attracted many scholars’ interests all over the world. Hischier et al. [34] investigated the positive impacts on the environment of the Swiss take-back and recycling systems for WEEE. Ylä-Mella et al. [35] described the implementation of the WEEE Directive and the development of the WEEE recovery infrastructure in Finland and found that they have made a success. Chi et al. [4] found that informal collection was the primary disposal channel of urban household e-waste after they investigated the collection channels of e-waste and household recycling behaviors in Taizhou, China. Jang [36] presented an overview of recycling practices and the management of WEEE since the EPR policy was introduced in South Korea in 2003. Pathak et al. [37] pointed out that although the Indian legislation has been improved and the EPR principles have been implemented, the grey market for WEEE has been enlarged by the social-economic structures of India with a large population of lower-to-middle income groups.
WEEE collection is the first and crucial step in an RSC of WEEE. In Europe, the majority of collection schemes for WEEE has been established in partnership with existing municipal collection schemes for recyclables and hazardous household waste, and additional take-back schemes by retailers [38]. In Canada, Recycle My Cell is a national WMPs recycling program which operates more than 3500 drop-off locations in the country. Besides, Customers can return their used mobile devices with a postage-paid service [39]. Similar to Canada, Australia also has over 3500 WMPs drop-off points and provides pre-paid shipping service to return [39]. In Japan, though, consumers must pay the end-of-life fees that cover part of the recycling and transportation costs while manufacturers afford the rest of the cost [40]. Completely different from the above developed countries, the manufacturer, the retailer, and the collector need to buy back WEEE from consumers in China. HUAWEI, one of mobile phone manufacturing giants in China, initiated an online recycling program called “Green Action 2.0” to carry out the OFN policy which provided up to 798 USD cash coupon for new purchase [41]. Large online retailers such as Jingdong and Suning set up OFN websites to collect the WEEE including WMPs. The third-party collection platform represented by Aihuishou also has the online collection system, and it has established four collection modes of store collection, face-to-face collection, mailing collection, and collecting machine collection [42].
There are formal and informal collection channels in many developing countries. Nduneseokwu et al. [43] examined factors influencing consumers’ intentions to participate in a formal e-waste collection system in Nigeria, suggested enhancing consumer’s intentions to choose the formal collection and developing an e-waste collection infrastructure. Wang et al. [44] investigated barriers to the formal collection of e-waste in China which mainly were households’ preference and informal collectors. Chi et al. [4] pointed out that economic benefit and convenience of disposal were the key factors of choosing collection channels for customers in China, and informal collectors had these advantages. Pathak et al. [37] argued that the informal collection and treatment of WEEE in India have become a serious threat to the sustainable development of the country. Li et al. [45] presented governance mechanisms out of governments and enterprises to control informal collection. There are the monopolistic and competitive take-back schemes for WEEE recycling between competing manufacturers and recyclers in Europe. Toyasaki et al. [46] found that the competitive recycling channel usually achieves a win–win situation. In addition to these kinds of collection channels, there are other channels decided by structure power, such as a manufacturer-led collection channel, a retailer-led collection channel, and a third-party collector-led collection channel [47,48,49].
This paper focuses on the formal collection system of WMPs in China, discusses the coopetition relationship between the manufacturer and the collector and their collection strategies. Different from most of the existing literature, we investigate their parallel relationship in the RSC.

2.2. Incentive Mechanisms for RSCs

Most of incentive mechanisms are set by the government. One of them is government subsidy, several researchers have reviewed the positive effects of subsidies on the WEEE collection especially on the formal one and environment in China [50,51,52]. In June 2009, the Chinese government introduced the OFN policy which stipulated that consumers trading in WEEE for new goods could get subsidy up to 10% of the price of the new products [53]. Besides, authorized WEEE recycling enterprises can receive subsidies for WEEE treatment provided by the government, which has continued to the present. This policy has greatly promoted the development of the formal WEEE treatment in China. However, this policy towards consumers expired at the end of 2011 for short of financial support. To better implement the EPR principles and maintain the policy sustainability, Gu et al. [54] redesigned the WEEE fund mode in China. Liu et al. [55] agreed that the government subsidy is beneficial to the development of the formal sector, but the marginal effect of that is not strong when at a higher quality level of e-waste. In addition to subsides, the RPM from the government has been examined. Wang et al. investigated some RPMs under the centralized, the manufacturer-led, and the collector-led CLSCs [28]. Wang et al. also examined the CLSC consisting of two sequential competing manufacturers and one retailer with or without the RPM from the government [29].
To the best of our knowledge, few studies discussed incentive mechanisms from members in the RSC, except for Jørgensen et al. [56] and De Giovanni [57], who have examined the endogenous incentive mechanisms, but their setting was the manufacturer as the leader and the retailer as the follower. The most similar setting with this paper is De Giovanni et al. [58], who discussed a two-sided incentive problem in a dynamic CLSC made up of a manufacturer and a retailer to increase the return rate of end-of-use products, and the manufacturer and the retailer carried out the incentive strategies jointly. Different from above literature, our study is focusing on the two-sided internal incentive mechanism negotiated by the manufacturer and the collector and implemented by the manufacturer. The motivation of the mechanism is to coordinate their strategies and to maximize their payoffs.

2.3. Applications of the EGT

The EGT has been used to deal with cooperation and competition relationships between two parties and to observe their evolution trends. Feng et al. [59] applied the EGT to analyze cooperation and competition behavior of partners in the supply chain of prefabricated construction. Cheng et al. [60] discussed the technology-licensing cooperation problem of two firms with the EGT and obtained the evolution trend of the technology-licensing deal and cooperation strategy under the fixed-fee licensing and royalty licensing situation. An evolutionary game model was built by Yuan et al. [61] to analyze the evolution process of long-term cooperation between the manufacturer’s emission reduction and the retailer’s low-carbon promotion. Ji et al. [24] developed an evolutionary game model to analyze their long-term green purchasing relationships between suppliers and manufacturers and to observe their cooperation tendency. The EGT takes the frequencies of strategies adopted during the evolutionary game process as the evaluation criterion for decision-making. Then the replicator dynamic method [62], the simulation method [63], and the differential equation method [64] were proposed to solve the frequencies and the game equilibrium.
There were many scholars studying the RSCs with EGT. Wang et al. [65] examined whether two manufacturers took an active part in recycling in the RSC with the EGT. Fu et al. [66] studied the recycling channel decision under competition between two RSCs consisting of one recycler and one waste handler respectively based on the evolutionary game. Han and Xue [67] also used the EGT to study the recycling channel decision with two competitive manufactures and one dominant retailer. The EGT was adopted by Tomita and Kusukawa [68] to analyze the evolutionary stability for behavior strategies of the retailer’s cooperation and the manufacturer’s monitoring in the RSC. In this paper, we also adopt the EGT to examine the collection strategies in the RSC. However, we extend the prior studies to investigate the coopetition relationship between the manufacturer and the collector in the RSC under the RPM, which is one focus of this paper. Their collection strategies and evolution trends, and the optimal RPM are derived by using the replicator dynamics.

3. Coopetition Evolutionary Game Model

3.1. Problem Definition

The manufacturer such as Mi can collect waste phones by himself and can also authorize the third-party collector such as Aihuishou to undertake the collecting tasks. This paper will refer to the manufacturer as “he” and to the third-party collector as “she” hereinafter. Their choices of strategy are presented in Table 1. When he chooses the competitive strategy, he will undertake the task of self-collection, i.e., take into account both manufacturing and collecting; When he chooses the cooperation strategy, he will authorize her to undertake the collection, but there may be some risks of cooperation such as uncontrollable collecting process and difficult to guarantee service quality. When she chooses the competitive strategy, she will collect his waste phones for other manufacturers, which will reduce his remanufacturing materials; Otherwise, she will collect the waste phones for him.
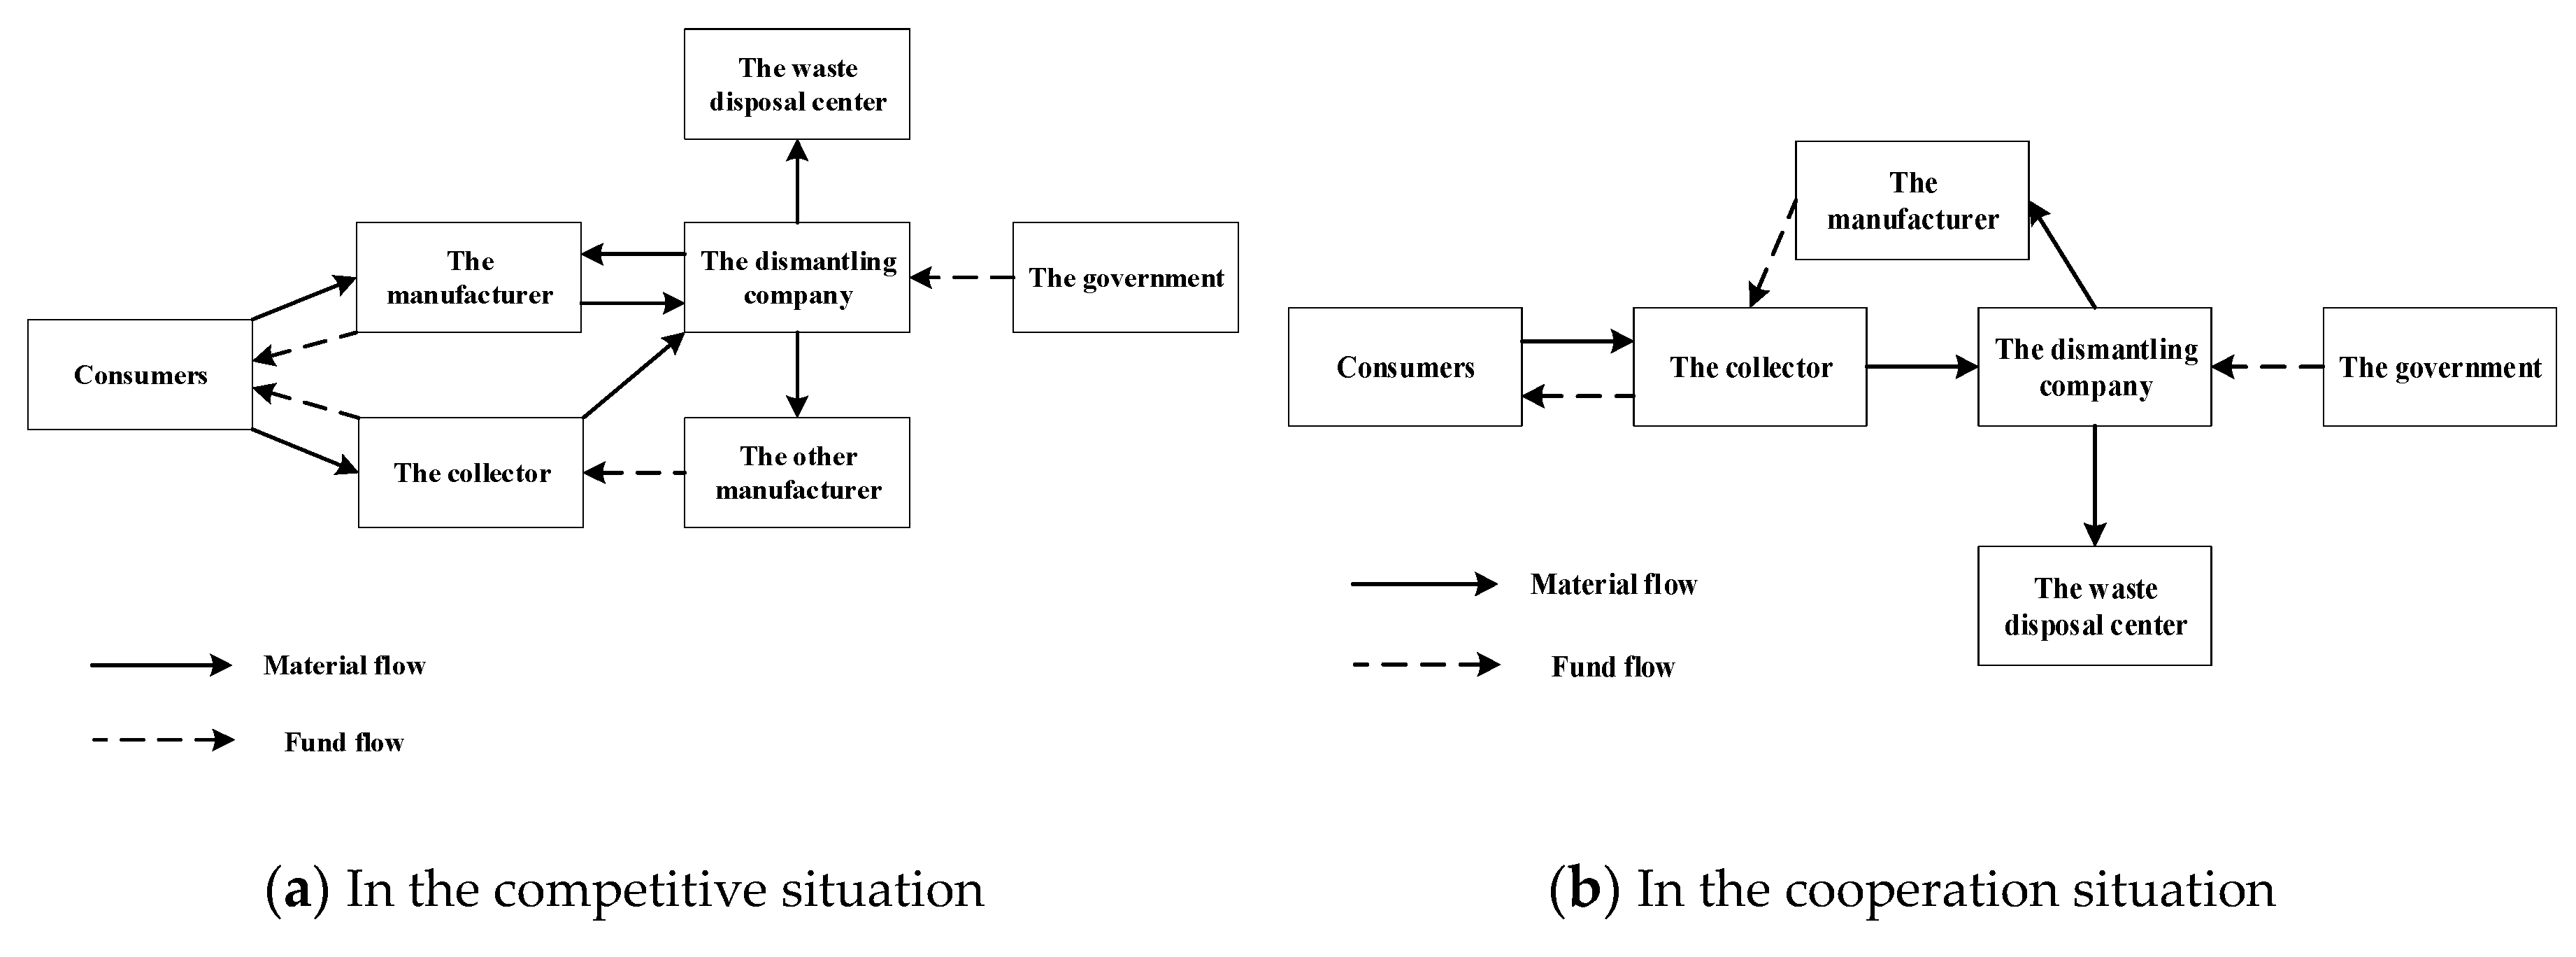
There are several parties including the manufactures, the collector, the dismantling company, the waste disposal center, the government, and consumers to achieve the collection in the RSC. Consumers’ waste phones would be bought back by the manufacturer and the collector for collection, then the waste ones would be disassembled by the dismantling company. The company will deliver remanufacturing materials to the corresponding manufacturer according to the collecting source of the waste phones, namely, returning them to him who takes the self-collection or to the manufacturer who cooperates with her. Here we assume that the other manufacturer does not take the collection. The government funds the dismantling company for environmental protection and resources conservation, and the cooperative manufacturer pays the collector collecting fees. The RSC structure in the competitive and cooperation situation is shown in Figure 1.
As shown in Figure 1, they compete for the collection of consumers’ WMPs in the competitive situation, and she collects his WMPs for the other manufacturer. Then the dismantling company delivers remanufacturing materials to the manufacturers according to the source of the waste. While in the case of cooperation, all the waste ones are collected by her for him. Then the dismantling company only delivers the remanufacturing materials to him. The key point of this RSC structure lies in their choice of collection strategies. Thus, we study the RSC consisting of one manufacturer and one collector.

3.2. Notations and Assumptions

The following notations in Table 2 are used throughout the paper:
The following assumptions are made in the light of the actual situation and the characteristics of the model.
(1)
The total amount and quality of collected phones would not be changed by their different strategies.
(2)
His basic income is greater than the sum of the operating cost of his self-collection and the risk cost of his cooperation, namely, v s > e s + c s ; Her basic income is greater than the initial cost of her cooperation, that is, v t > c t .
(3)
To ensure that the both sides have the potential to cooperate, their potential profits are higher than cooperative risk inputs, namely, Δ v s > c s + l , Δ v t > e t + c t + k .

3.3. Modeling

To improve their cooperative quality and protect their interests, this paper introduced an RPM ( l ,   k ) under cooperation, which is negotiated by them and implemented by him. Their payoff matrix of the CEGM is set up based on the model descriptions and assumptions above, as shown in Table 3.
As can be seen in Table 3, when they both adopt the competitive strategy, his income is the basic income excluding the operating cost of self-collection, namely v s e s , and her income is the basic income v t ; When he takes the competition strategy and she takes the opposite one, his income is still v s e s , but her income is the basic income excluding the initial cost of choosing cooperation, i.e., v t c t . In addition, when he adopts the cooperation strategy and she is the opposite, his income is the basic income excluding the sum of the operating cost of self-collection and the risk cost of choosing cooperation, i.e., v s e s c s , and her income is the basic income v t ; When they both adopt the cooperation strategy, his income depends on the RPM, cooperative risk cost, and his potential profit in a cooperative strategy, that is, v s ( 1 β ) l + β k c s + Δ v s , and her income relies on the RPM, her operating cost of collection, her initial cost of cooperation, and her potential profit in a cooperative strategy, i.e., v t + ( 1 β ) l β k e t c t + Δ v t .
If she takes the competitive strategy, his income set (competition, cooperation) is ( v s e s , v s e s c s ), and he will obviously choose the competitive strategy. However, if she adopts the cooperative strategy, his income set (competition, cooperation) is ( v s e s ,   v s ( 1 β ) l + β k c s + Δ v s ). Since the latter is bigger, he will choose to cooperate with each other. Similarly, when he chooses the cooperation strategy, she also adopts the cooperation strategy; When he adopts the competition strategy, she adopts the same one. Therefore, the pure strategy Nash equilibriums of the CEGM are (competition, competition), (cooperation, cooperation).
When both of them choose cooperation, their income set (he, she) is ( v s ( 1 β ) l + β k c s + Δ v s ,   v t + ( 1 β ) l β k e t c t + Δ v t ), which both reach the maximum value. Besides, the integration of resources caused by cooperation is beneficial to the overall interests of the RSC. Thus, the best choice for them is to adopt cooperative strategies.
In reality, when being under competition, they will vigorously pursue cooperation for greater interests. That is because he needs more remanufacturing materials and she pursues more profits. When they are under cooperation, he would doubt her operation capacity not matched with expenses, and she may dissatisfy their RPM. Therefore, it is not eternally immutable for their cooperative or competitive relationship with each other. In the long run, they will choose a competitive or cooperative strategy randomly.

4. Model Analysis and Discussion

4.1. Analysis of ESS

To obtain the evolution mechanism and the stability state of the coopetition relationship in the RSC, this paper analyzes ESSs.
It can be available from Table 3 that his expected income of cooperative strategy is:
E s c = ( 1 q ) ( v s e s c s ) + q ( v s ( 1 β ) l + β k c s + Δ v s ) ,
and his expected income of competitive strategy is:
E s m = ( 1 q ) ( v s e s ) + q ( v s e s ) .
Then his average expectation of expected income can be showed as:
E s ¯ = p E s c + ( 1 p ) E s m .
Similarly, her expected income of cooperative strategy is:
E t c = ( 1 p ) ( v t c t ) + p ( v t + ( 1 β ) l β k e t c t + Δ v t ) ,
her expected income of competitive strategy is:
E t m = ( 1 p ) v t + p v t .
Then her average expectation of expected income can be represented as:
E t ¯ = q E t c + ( 1 q ) E t m .
The replicator dynamics [69] was used to obtain the ESS. The replicator dynamic equation of his cooperative strategy is:
f ( p ) = d p / d t = p ( E s c E s ¯ ) = p [ E s c ( p E s c + ( 1 p ) E s m ) ] = p ( 1 p ) ( E s c E s m ) .
Put his expected incomes into Equation (7), can obtain:
f ( p ) = p ( 1 p ) [ q ( e s ( 1 β ) l + β k + Δ v s ) c s ] .
Similarly, the replicator dynamic equation of her cooperative strategy is:
f ( q ) = d q / d t     = q ( 1 q ) [ p ( ( 1 β ) l e t β k + Δ v t ) c t ] .
When { f ( p ) = 0 f ( q ) = 0 is simultaneous, it can obtain p = c t ( 1 β ) l e t β k + Δ v t , q = c s e s ( 1 β ) l + β k + Δ v s .
In the plane N = {(p, q); 0 ≤ p, q ≤ 1}, there are five equilibrium points including O (0, 0), A (0, 1), B (1, 0), C (1, 1), and M   ( p ,   q ) . The local stability of the RSC system is analyzed at these five equilibrium points by analyzing the local stability of Jacobian matrix. The partial derivatives of f ( p ) and f ( q ) are taken with respect to p and q respectively, and the Jacobian matrix is given as:
J = [ f ( p ) p f ( p ) q f ( q ) p f ( q ) q ] = [ b 11 b 12 b 21 b 22 ] ,
where
  • b 11 = ( 1 2 p ) [ q ( e s ( 1 β ) l + β k + Δ v s ) c s ] , b 12 = p ( 1 p ) [ ( e s ( 1 β ) l + β k + Δ v s ) ] , b 21 = q ( 1 q ) [ ( 1 β ) l e t β k + Δ v t ) ] , b 22 = ( 1 2 q ) [ p ( ( 1 β ) l e t β k + Δ v t ) c t ] .
Denote the determinant of J as det J , and det J = b 11 b 22 b 21 b 12 . Denote the trace of J as tr J , and tr J = b 11 + b 22 . According to the method proposed by Friedman [62], the criteria for judging the local stability of the Jacobian matrix are as follows:
The necessary and sufficient condition for the equilibrium point to be an evolutionary stable point is det J > 0 , tr J < 0 ; The necessary and sufficient condition for the equilibrium point to be an instability point is det J > 0 , tr J > 0 ; The necessary and sufficient condition for the equilibrium point to be a saddle point is tr J = 0 .
The local stability of the equilibrium points in the RSC system can be obtained by calculation, as shown in Table 4.
In Table 4, “+” represents more than 0, and “-” represents less than 0.
It can be seen from Table 4 that O (0, 0), C (1, 1) are evolutionary stable points; A (0, 1), B (1, 0) are instability points; M   ( p ,   q ) is a saddle point. Therefore, the ESSs of this CEGM are (competition, competition), (cooperation, cooperation).

4.2. Coopetition Evolution Analysis

In combination with Table 3 and Table 4, point A corresponds to the case where he chooses cooperation and she chooses the opposite one. Her competitive strategy is because she is not satisfied with the RPM. Point B corresponds to the case where he chooses the competitive strategy and she is the opposite. He dissatisfies with her service and adopts a competitive strategy. Their cooperation in these two cases ends in failure. However, they hope to achieve the maximization of their interests by means of cooperation. Therefore, point A and B are instability points.
Point O corresponds to the situation that they both choose competition, and point C corresponds to the cooperation situation. When they do not trust each other, they will be in competition for collection. However, when they reach an agreement, he will be not involved in the collecting business and she will provide quality services for him.
Denote his mixed strategy set as X 1 = { [ ( 1 p ) s 1 ,   p s 2 ] | 0 < p < 1 } , denote her mixed strategy set of as X 2 = { [ ( 1 q ) s 1 ,   q s 2 ] | 0 < q < 1 } , where s 1 represents the pure strategy of competition, s 2 represents that of cooperation. It is easy to verify that f ( p ) is concave in p and f ( q ) is concave in q from Equations (8) and (9), resulting in the income of V ( 1 p ,   p ) V ( 1 p ,   p ) and V ( 1 q ,   q ) V ( 1 q ,   q ) for any 0 < p < 1 and 0 < q < 1 . According to the definition of the mixed strategy Nash equilibrium [70], when he chooses the strategy of ( 1 p ,   p ) and she chooses ( 1 q ,   q ) , they are just the best response to each other, achieving the mixed strategy Nash equilibrium. Thus, ( p ,   q ) is the mixed strategy Nash equilibrium of the CEGM.
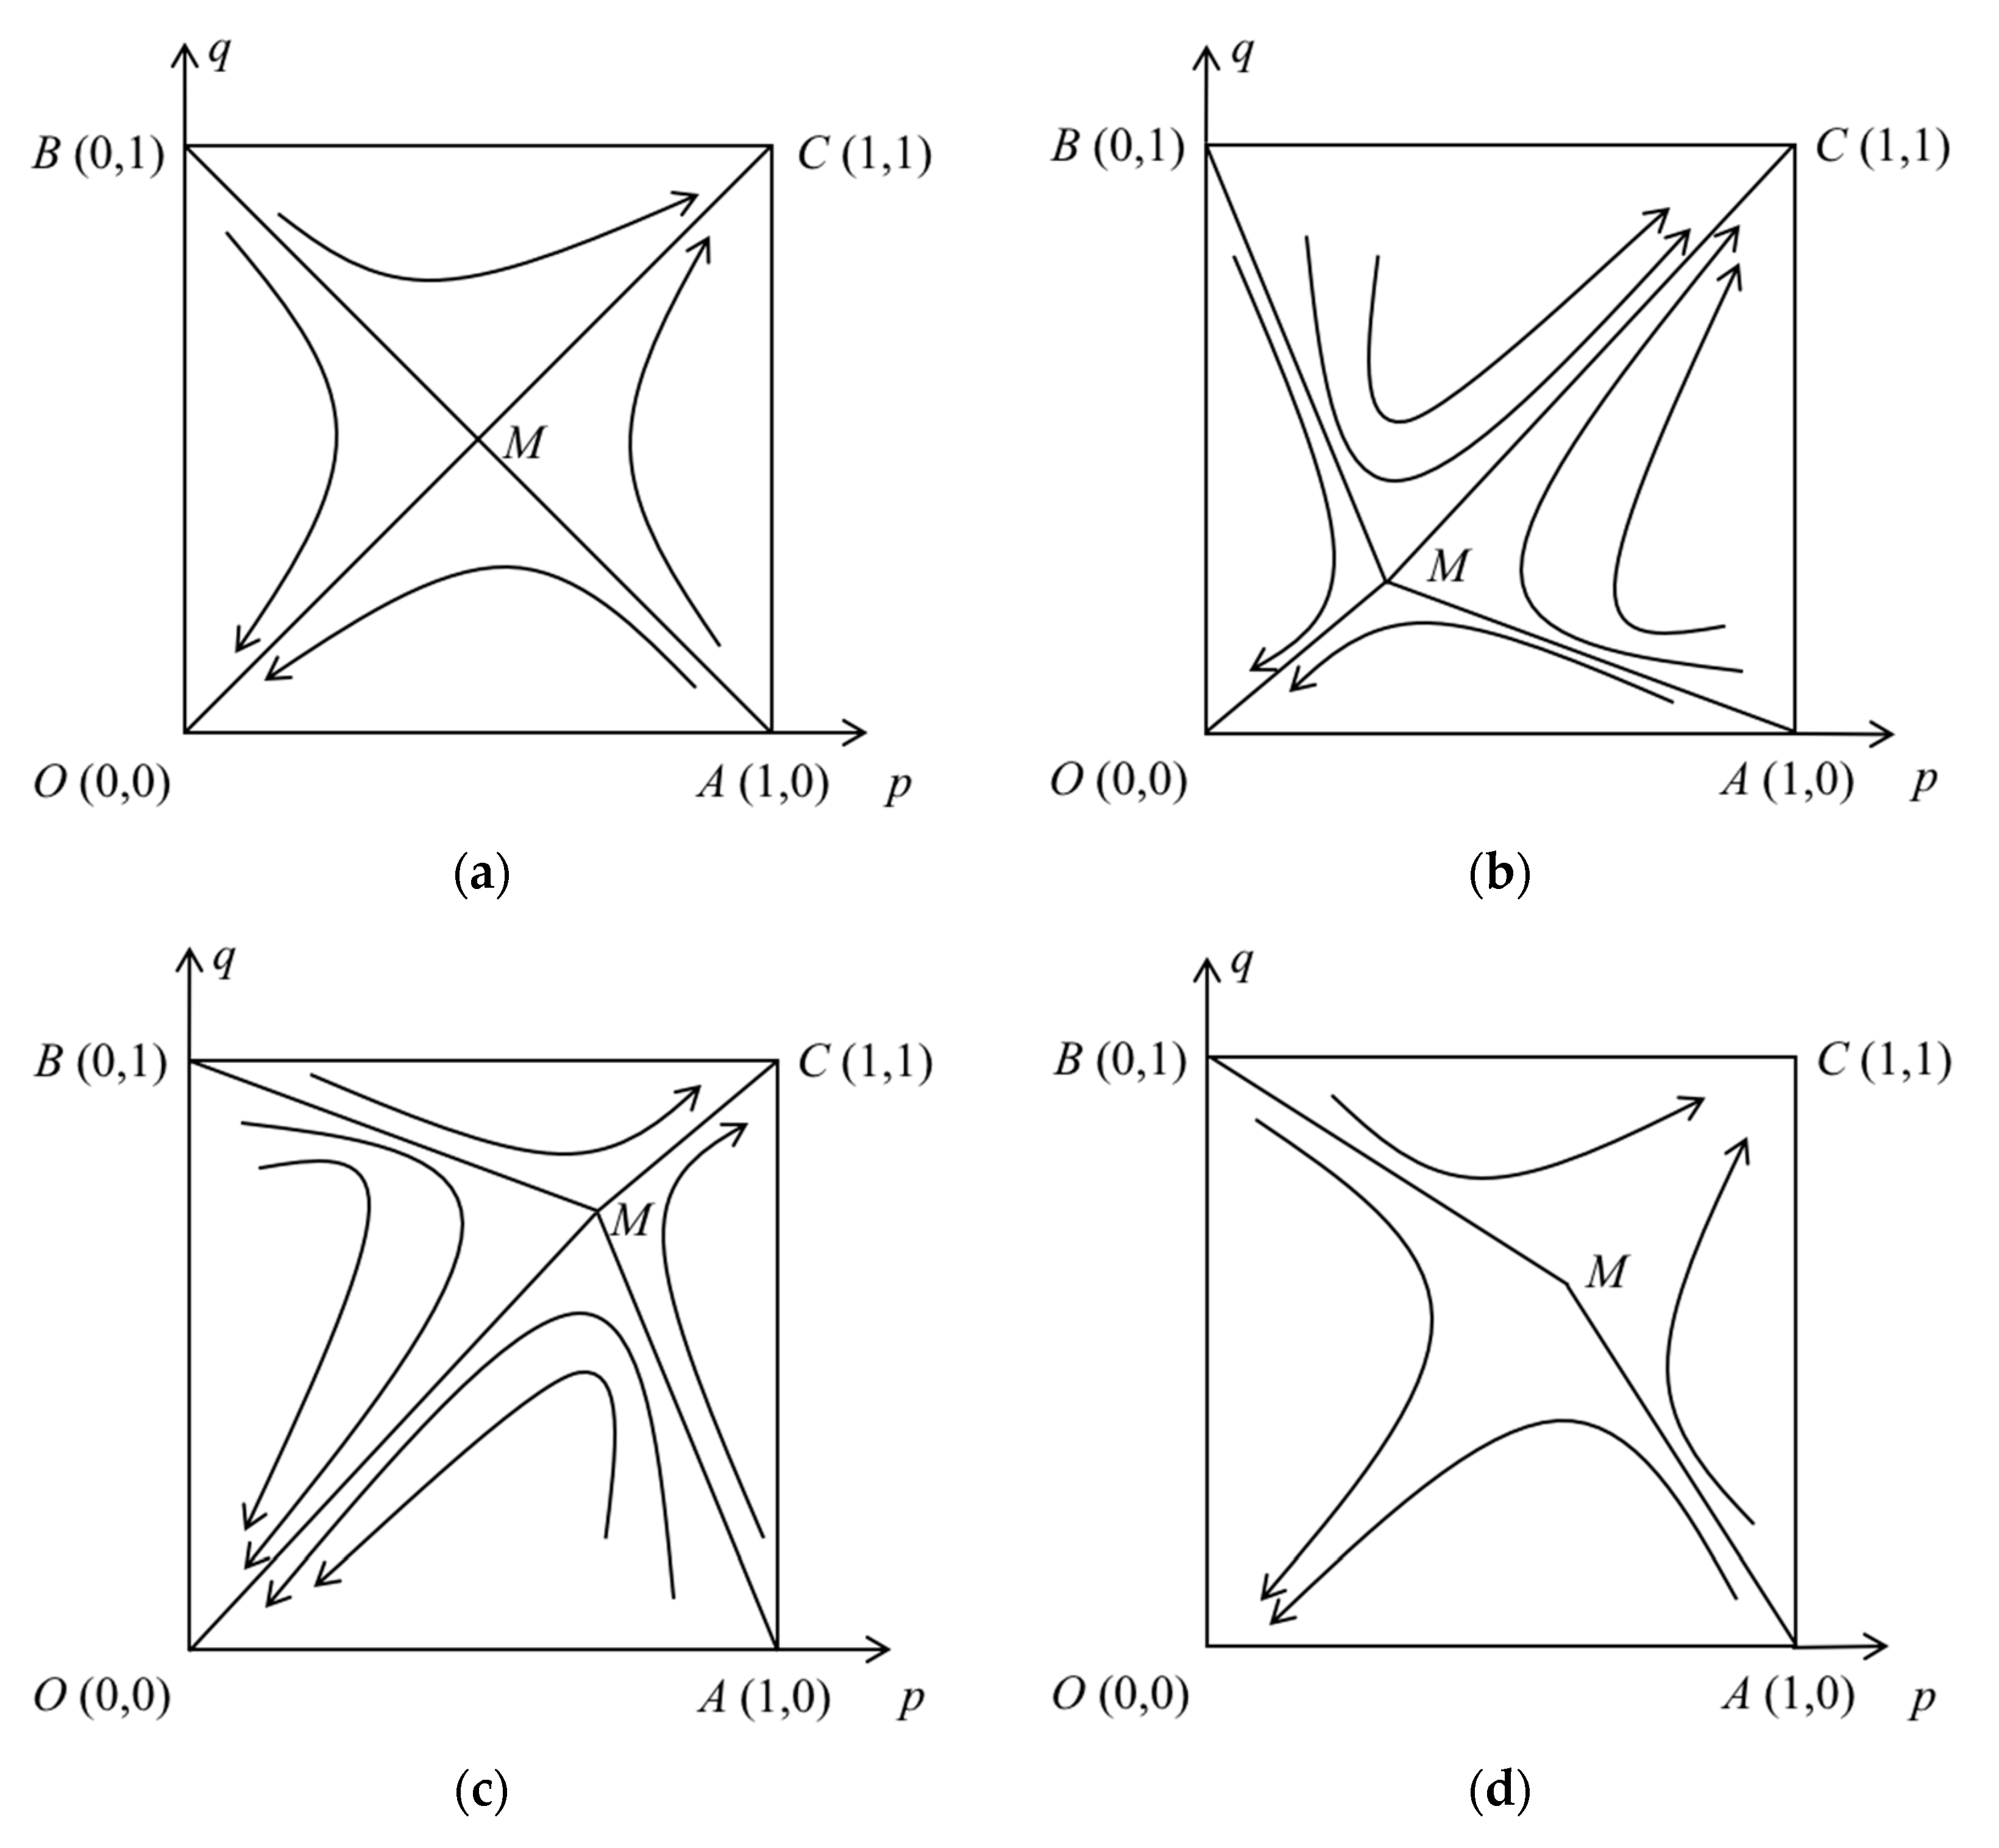
In the long-term evolution, they will alternate the situation of competition and cooperation, and achieve a dynamic equilibrium in the saddle point M   ( p ,   q ) . The evolution laws of the RSC system at different positions of point M are shown in Figure 2.
In Figure 2a, the point M is in the position (0.5, 0.5), and they have the same probability of overall competition or cooperation here; The point M is in the position ( p < 0.5, q < 0.5) in Figure 2b, and they are more convergent to point C (cooperation), that is, more likely to choose the comprehensive cooperation strategy; In Figure 2c, it is in the position ( p > 0.5, q > 0.5), and here they are more convergent to point O (competition), namely, more likely to choose overall competition; The position of point M is to be determined in Figure 2d, and it is necessary to determine whether the system converges to point O or point C by means of further analysis.
Denote the area of quadrilateral AMBO as S 1 , the area of quadrilateral AMBC as S 2 . Then
S 1 = 1 2 ( 1 × p ) + 1 2 ( 1 × q ) = 1 2 [ c t ( 1 β ) l e t β k + Δ v t + c s e s ( 1 β ) l + β k + Δ v s ] ,
S 2 = 1 S 1 = 1 1 2 [ c t ( 1 β ) l e t β k + Δ v t + c s e s ( 1 β ) l + β k + Δ v s ] .
The probability of the system convergence to the equilibrium point O is higher than C when S 1 > S 2 , as shown in Figure 2c; The probability of the system convergence to O is lower than C when S 1 < S 2 , as shown in Figure 2b; The probability of the system convergence to O is equal to C when S 1 = S 2 , as shown in Figure 2a. Therefore, the probability of their competition is positively related to S 1 , and the probability of cooperation is positively related to S 2 .
It can be seen from Equations (11) and (12) that the factors that influence S 1 and S 2 are Δ v s , Δ v t , c s , c t , e s , e t , l , k , and β in this game model. The detailed analysis will be presented below.

4.3. Sensitivity Analysis

Combining Equations (11) and (12) and the previous model assumptions, we can get the sensitivity analysis of the related parameters in the CEGM, as illustrated in Table 5.
In Table 5, the signs + and − represent an increase and decrease in equilibrium, in response to a marginal increase of the corresponding parameter, respectively. The sign ± indicates that the equilibrium climbs up and then declines with a marginal increase of the corresponding parameter; The sign indicates that the equilibrium decreases first and then increases with a marginal increase of the corresponding parameter. The superscripts ,   ~ ,   # denote the different turning points of corresponding parameters.
As shown in Table 5, the bigger Δ v s , the smaller S 1 and the bigger S 2 , that is, the probability of the system convergence to O is smaller, but to C is greater. Similarly, the bigger Δ v t , the smaller the probability of the system convergence to O and the greater to C. That means the greater the potential profit, the smaller the barrier to cooperation, and the probability of the waste phone RSC system evolved into cooperation is greater. It implicates that she should increase the collection quantity and quality of WMPs, and he should comply with the contract of cooperation.
The bigger c s , the bigger S 1 and the smaller S 2 , namely, the probability of the system convergence to O is greater, but to C is smaller. Similarly, the bigger c t , the greater the probability of the system convergence to O and the smaller to C. In other words, the greater the initial cost or risk cost of the cooperation strategy, the lower the willingness to cooperate, and the probability of the system evolved into competition is greater. It shows that she should improve operational management capability to reduce the risk cost of his cooperation strategy. She should also make full use of their resources, for example, take advantage of his sales outlets to conduct collection. He should evaluate her carefully according to her contractual history and operational capability.
The greater the operating cost of his self-collection e s and the smaller the operating cost of her collection e t , the greater the willingness to cooperate, and the probability of the system evolved into cooperation is greater. It indicates that she should improve operational management capability to reduce her operating costs.
The greater his reward to her, the greater the probability of her cooperation, but the smaller that of his cooperation. The greater his penalty to her, the smaller the probability of her cooperation, but the greater one of his cooperation. That means there are some contradictions that complicate the effects of the reward implemented by him for her successful service l and the penalty implemented by him for her failed service k on the probability of cooperation. These contradictions implicate that they have an optimal RPM to promote the cooperation tendency. As shown in Table 5, S 1 decreases first and then increases as l or k increases, and S 2 is the opposite, namely, the system first tends to converge to C and then to O. In this case, both l and k have an optimal value, making the probability of the system evolved into cooperation to the maximum. The probability of her service failure β has a direct impact on the implementation of l and k , and its change is consistent with k .
It can be obtained by solving Equation (11) that the optimal reward implemented by him for her successful service l is ( e s + β k + Δ v s ) ( c t c s c t ) + ( e t + β k Δ v t ) ( c s c t c s ) ( 1 β ) ( c t c s ) , and the optimal penalty implemented by him for her failed service k is [ ( 1 β ) l e t + Δ v t ] ( c s c s c t ) + [ e s ( 1 β ) l + Δ v s ] ( c t c s c t ) ( c s c t ) β . The probability of her service failure that is most conducive to cooperative evolution β is ( l e t + Δ v t ) ( c s c s c t ) + ( e s l + Δ v s ) ( c t c s c t ) ( l + k ) ( c s c t ) .
In conclusion, the optimal RPM is l = ( e s + β k + Δ v s ) ( c t c s c t ) + ( e t + β k Δ v t ) ( c s c t c s ) ( 1 β ) ( c t c s ) , k = [ ( 1 β ) l e t + Δ v t ] ( c s c s c t ) + [ e s ( 1 β ) l + Δ v s ] ( c t c s c t ) ( c s c t ) β .

5. Simulation of RPM

Although the theoretical solution of the optimal RPM has been analyzed in Section 4.3, to enhance understanding, a simulation of the RPM is conducted to further clarify the meaning of the optimal RPM. Therefore, we investigated a famous mobile phone manufacturer A and a prosperous third-party collector B as a case study. The parameters, as shown in Table 6, in the following simulation experiments were collected from them, but were modified for the confidentiality reason. These experiments were conducted on the simulation platform of MATLAB R2017b.
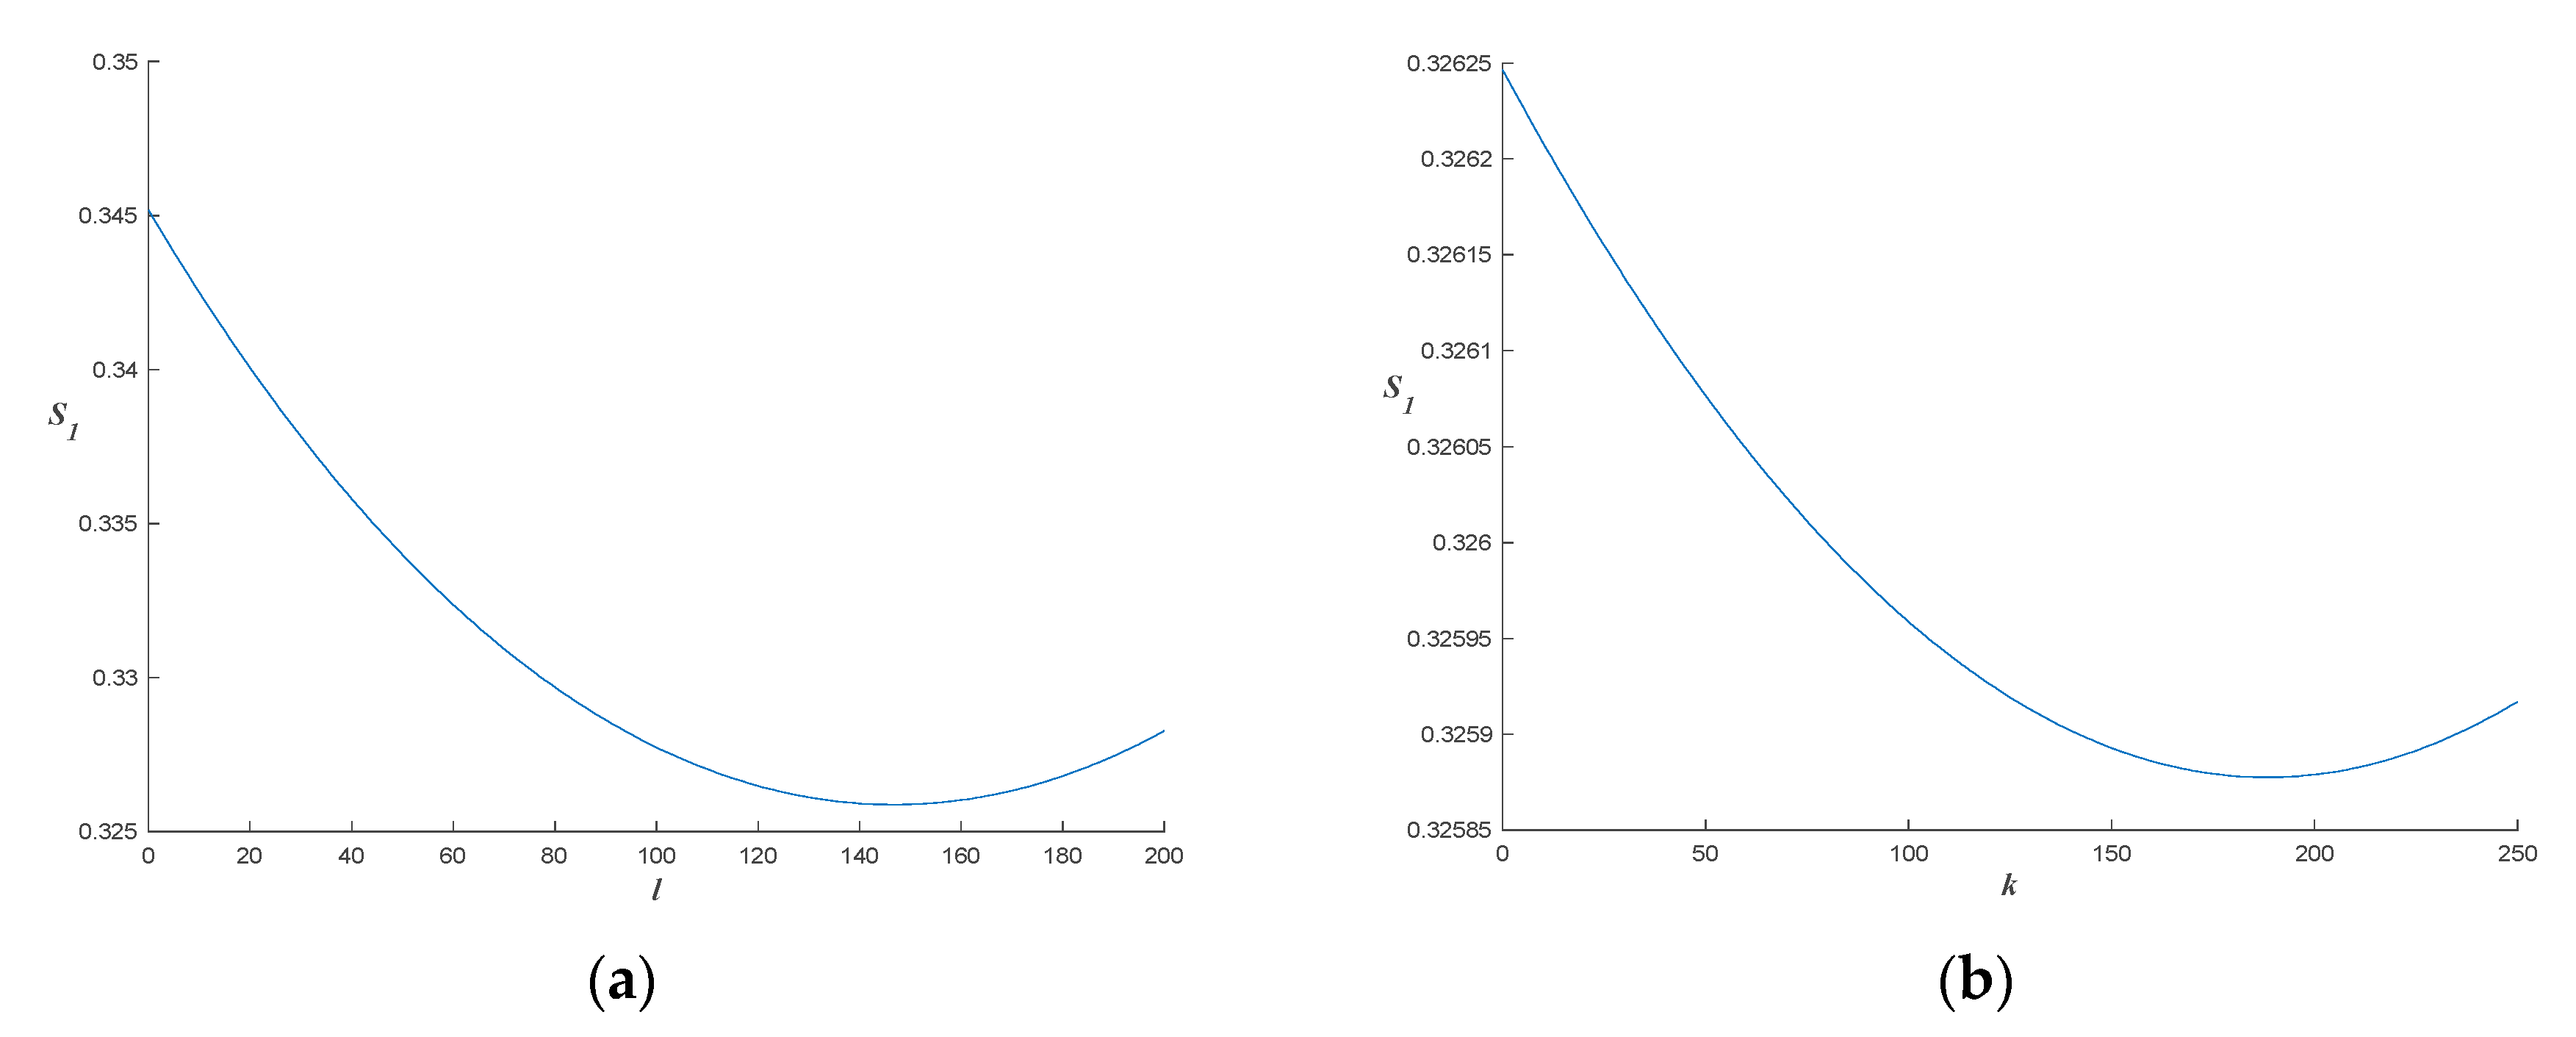
To obtain the optimal reward implemented by him for her successful service l , we made the range of l 0–200, and the simulation result is shown in Figure 3a. Similarly, to obtain the optimal penalty implemented by him for her failed service k , we made the range of k 0–250, and the result is shown in Figure 3b.
It can be seen from Figure 3a that S 1 decreases first and then increases as l increases. In this case, when l = 150 , the value of S 1 is the minimum, that is, it is the largest for the probability of the system evolved into cooperation. k has the similar effect on S 1 as l , which is shown in Figure 3b. When k = 190 , the value of S 1 is the minimum in this case, namely, it is the largest for the probability of the system evolved into cooperation.
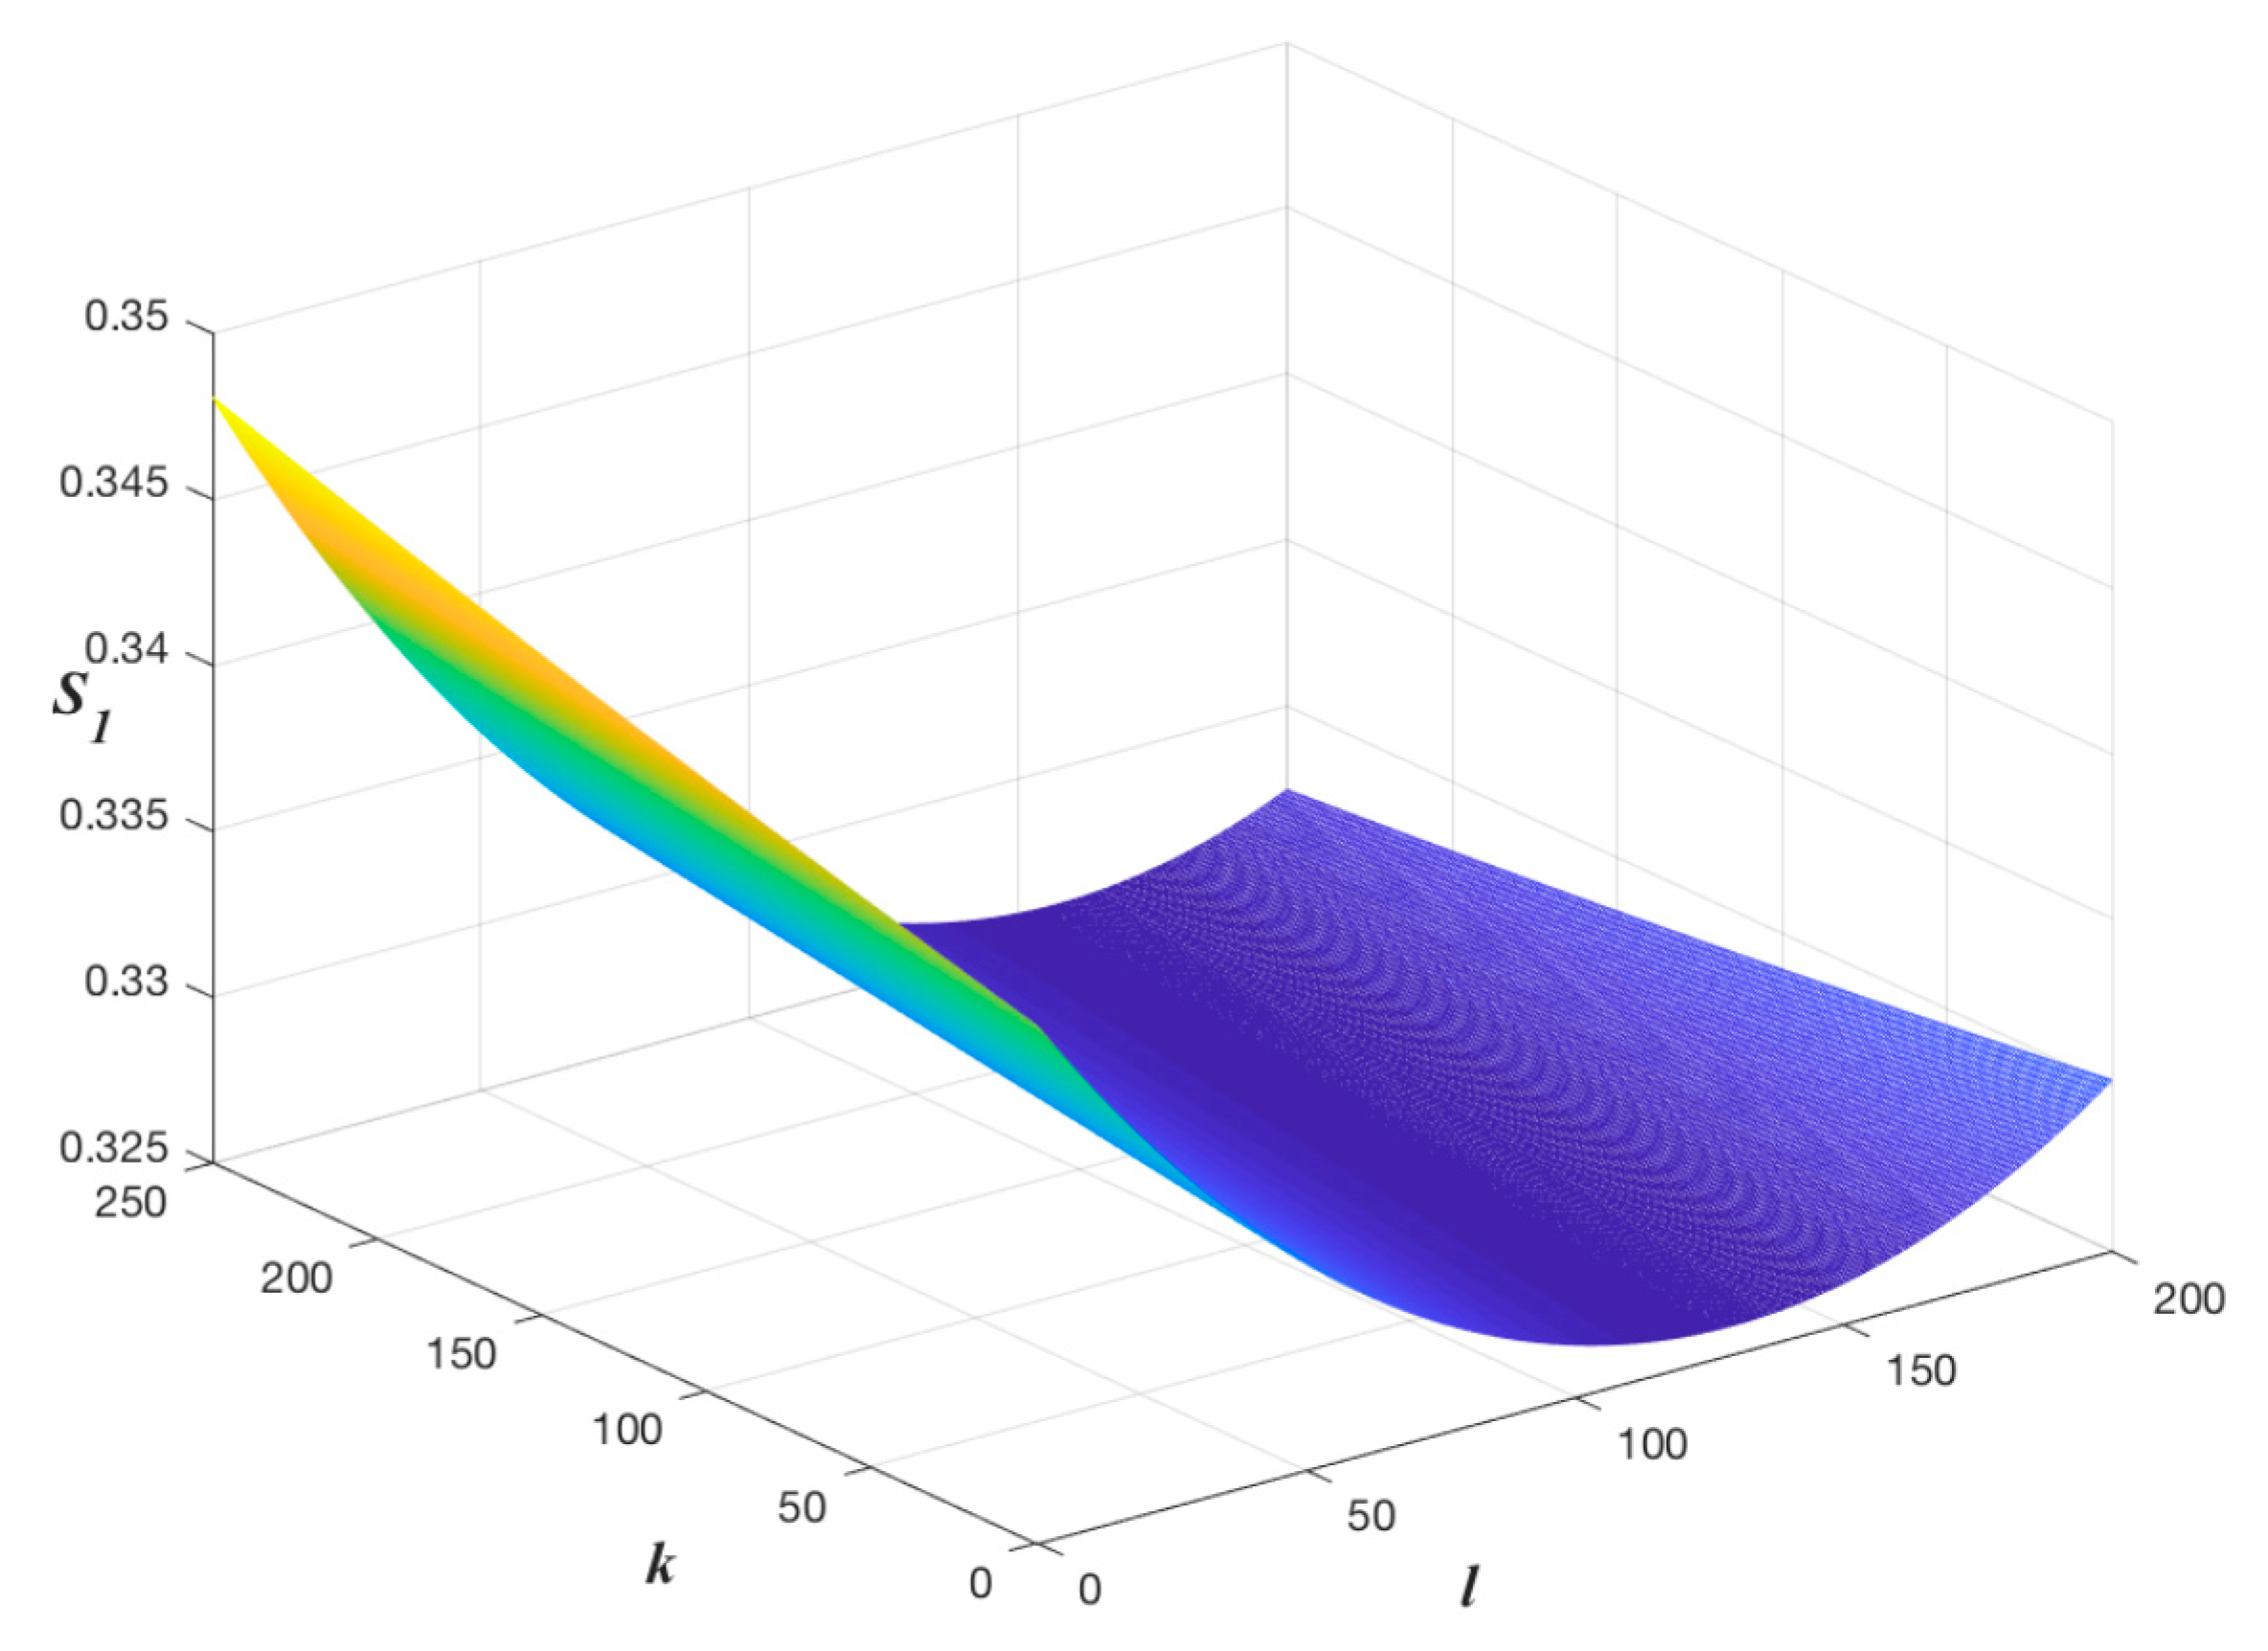
We also made the simulation of S 1 with the ranges of l 0–200 and k 0–250, the result is shown in Figure 4.
It can be seen from Figure 4 that S 1 is under the double influence of l and k . When l is low, S 1 increases with the increase of k , otherwise, S 1 decreases with the increase of k . However, S 1 decreases first and then increases as l increases no matter whether k is big or small. It shows that the optimal RPM consisting of the optimal reward and penalty is interrelated, and they need to be developed at the same time, which is the same as the implication of their formulas. According to the calculated results, the optimal reward and penalty here are 147 and 143, respectively.

6. Conclusions, Insights, and Future Research

This paper presents a CEGM to discuss the coopetition relationship between members in an RSC comprising one manufacturer and one collector and examines the evolution mechanism and the internal RPM for their collection strategies. The pure strategy Nash equilibriums in this model are obtained which show their collection strategy choices of perfect competition or cooperation. However, their cooperative or competitive relationship is not eternally immutable. In the long run, they will choose a competitive or cooperative strategy randomly. The mixed strategy Nash equilibrium and the optimal RPM are obtained in the model analysis and discussion. Finally, this paper takes the example of WMPs in China to examine the simulation of the RPM.
The contributions of this paper include two parts: Firstly, it examines the coopetition relationship between the manufacturer and the collector. It provides common collection strategies and then analyzes the evolution of them, which is of practical significance to implement their collection of WMPs. Secondly, it discusses the two-sided RPM negotiated by the manufacturer and the collector in the RSC, which is beneficial to promote their cooperation tendencies and then to increase their payoffs.
We find that cooperation is the best choice for the manufacturer and the collector to increase their payoffs. There is an optimal RPM for them to propel the cooperation tendency. We provide some practical insights for the manufacturer and the collector as follows. They need to simultaneously negotiate the two-sided RPM consisting of the optimal reward and penalty. The manufacturer should evaluate the potential partner carefully according to her contractual history and operational capability. Once cooperation is reached, he should faithfully perform it. The collector should improve operational management capability to reduce her operating costs and the risk cost of his cooperation strategy and to increase the collection quantity and quality of WMPs. She should also make full use of their resources, for example, take advantage of his sales outlets to conduct collection.
This paper adopts the failure probability of the collector’s service instead of the quantitative analysis of her service to define her success or failure. However, the latter is more feasible to implement the RPM, because to obtain the failure probability of her service needs accurate evaluation and prediction. Thus, the future research should quantitatively analyze her service and provide more specific RPM. In addition, other competitors are neglected in this paper, it is more practical to deal with internal and external competition from members in the RSC.

Author Contributions

Conceptualization, Y.D. and Y.Z.; Formal analysis, Y.D. and L.M.; Investigation, L.M. and Y.Z.; Writing—original draft, Y.D.; Writing—review and editing, D.F.; Funding acquisition, D.F.

Funding

This research was funded by the Zhejiang Province Public Welfare Technology Application Research Project (No. 2015C33014), and the Natural Science Foundation of Zhejiang Province (No. LY18G010019).

Conflicts of Interest

The authors declare no conflict of interest.

Appendix A

Table A1. List of acronyms.
AcronymExplanation
WMPsWaste mobile phones
RPMReward-penalty mechanism
WEEEWaste electrical and electronic equipment
EPRExtended producer responsibility
RSCReverse supply chain
PROsProducer responsibility organizations
EGTEvolutionary game theory
CLSCClosed-loop supply chain
CEGMCoopetition evolutionary game model
ESSEvolutionary stability strategy
OFNOld-for-New

References

  1. Osibanjo, O.; Nnorom, I.C. Material flows of mobile phones and accessories in Nigeria: Environmental implications and sound end-of-life management options. Environ. Impact Assess. Rev. 2008, 28, 198–213. [Google Scholar] [CrossRef]
  2. List of China’s Mobile Phone Users and Brand Market Share in 2018. Available online: http://www.mrcjcn.com/n/280617.html (accessed on 28 October 2018).
  3. Yin, J.F.; Gao, Y.N.; Xu, H. Survey and analysis of consumers’ behaviour of waste mobile phone recycling in China. J. Clean. Prod. 2014, 65, 517–525. [Google Scholar] [CrossRef]
  4. Chi, X.; Wang, M.Y.; Reuter, M.A. E-waste collection channels and household recycling behaviors in Taizhou of China. J. Clean. Prod. 2014, 80, 87–95. [Google Scholar] [CrossRef]
  5. Ylä-Mella, J.; Keiski, R.L.; Pongrácz, E. Electronic waste recovery in Finland: Consumers’ perceptions towards recycling and re-use of mobile phones. Waste Manag. 2015, 45, 374–384. [Google Scholar] [CrossRef] [PubMed]
  6. Where Are the Waste Mobile Phones Going? Available online: http://paper.people.com.cn/rmrb/html/2017-03/17/nw.D110000renmrb_20170317_1-17.htm (accessed on 28 October 2018).
  7. Feszty, K.; Murchison, C.; Baird, J.; Jamnejad, G. Assessment of the quantities of waste electrical and electronic equipment (WEEE) in Scotland. Waste Manag. Res. 2003, 21, 207–217. [Google Scholar] [CrossRef] [PubMed]
  8. Torretta, V.; Ragazzi, M.; Istrate, I.A.; Rada, E.C. Management of waste electrical and electronic equipment in two EU countries: A comparison. Waste Manag. 2013, 33, 117–122. [Google Scholar] [CrossRef] [PubMed]
  9. Bernard, S. North–south trade in reusable goods: Green design meets illegal shipments of waste. J. Environ. Econ. Manag. 2015, 69, 22–35. [Google Scholar] [CrossRef]
  10. Directive 2002/96/EC of the European Parliament and of the Council of 27 January 2003 on Waste Electrical and Electronic Equipment (WEEE)—Joint Declaration of the European Parliament, the Council and the Commission Relating to Article 9. Available online: https://eur-lex.europa.eu/legal-content/EN/TXT/?uri=CELEX:32002L0096 (accessed on 13 November 2018).
  11. Directive 2008/34/EC of the European Parliament and of the Council of 11 March 2008 Amending Directive 2002/96/EC on Waste Electrical and Electronic Equipment (WEEE), as Regards the Implementing Powers Conferred on the Commission. Available online: https://eur-lex.europa.eu/legal-content/EN/TXT/?qid=1542126929487&uri=CELEX:32008L0034 (accessed on 13 November 2018).
  12. Directive 2012/19/EU of the European Parliament and of the Council of 4 July 2012 on Waste Electrical and Electronic Equipment (WEEE) Text with EEA Relevance. Available online: https://eur-lex.europa.eu/legal-content/EN/TXT/?uri=CELEX:32012L0019 (accessed on 13 November 2018).
  13. Organization for Economic Cooperation and Development (OECD). Extended Producer Responsibility: A Guidance Manual for Governments; OECD: Paris, France, 2001; ISBN 978-9-26-418600-2. [Google Scholar]
  14. Sinha-Khetriwal, D.; Kraeuchi, P.; Schwaninger, M. A comparison of electronic waste recycling in Switzerland and in India. Environ. Impact Assess. Rev. 2005, 25, 492–504. [Google Scholar] [CrossRef]
  15. Ongondo, F.O.; Williams, I.D.; Cherrett, T.J. How are WEEE doing? A global review of the management of electrical and electronic wastes. Waste Manag. 2011, 31, 714–730. [Google Scholar] [CrossRef]
  16. Law on the Promotion of Recycling and Reuse of Used Small Electronic Equipment. Available online: http://www.env.go.jp/recycle/recycling/raremetals/law.html (accessed on 13 November 2018).
  17. Xu, C.; Zhang, W.; He, W.; Li, G.; Huang, J. The situation of waste mobile phone management in developed countries and development status in China. Waste Manag. 2016, 58, 341–347. [Google Scholar] [CrossRef]
  18. Dwivedy, M.; Mittal, R.K. An investigation into e-waste flows in India. J. Clean. Prod. 2012, 37, 229–242. [Google Scholar] [CrossRef]
  19. Gu, Y.; Wu, Y.; Xu, M.; Wang, H.; Zuo, T. The stability and profitability of the informal WEEE collector in developing countries: A case study of China. Resour. Conserv. Recycl. 2016, 107, 18–26. [Google Scholar] [CrossRef]
  20. Chi, X.; Streicher-Porte, M.; Wang, M.Y.; Reuter, M.A. Informal electronic waste recycling: A sector review with special focus on China. Waste Manag. 2011, 31, 731–742. [Google Scholar] [CrossRef] [PubMed]
  21. Govindan, K.; Popiuc, M.N.; Diabat, A. Overview of coordination contracts within forward and reverse supply chains. J. Clean. Prod. 2013, 47, 319–334. [Google Scholar] [CrossRef]
  22. Weibull, J.W. Evolutionary Game Theory, 1st ed.; MIT Press: Cambridge, MA, USA, 1997; ISBN 978-0-26-273121-8. [Google Scholar]
  23. Rosas, A. Evolutionary game theory meets social science: Is there a unifying rule for human cooperation? J. Theor. Biol. 2010, 264, 450–456. [Google Scholar] [CrossRef] [PubMed] [Green Version]
  24. Ji, P.; Ma, X.; Li, G. Developing green purchasing relationships for the manufacturing industry: An evolutionary game theory perspective. Int. J. Prod. Econ. 2015, 166, 155–162. [Google Scholar] [CrossRef]
  25. Esmaeili, M.; Allameh, G.; Tajvidi, T. Using game theory for analysing pricing models in closed-loop supply chain from short-and long-term perspectives. Int. J. Prod. Res. 2016, 54, 2152–2169. [Google Scholar] [CrossRef]
  26. Wu, X.; Xiong, W. Evolutionary Game Analysis of the Reverse Supply Chain Based on the Government Subsidy Mechanism. In Proceedings of the 2012 Second International Conference on Business Computing and Global Informatization, Shanghai, China, 12–14 October 2012; IEEE: Piscataway, NY, USA, 2012. [Google Scholar]
  27. Wang, W.; Zhou, S.; Zhang, M.; Sun, H.; He, L. A Closed-Loop Supply Chain with Competitive Dual Collection Channel under Asymmetric Information and Reward–Penalty Mechanism. Sustainability 2018, 10, 2131. [Google Scholar] [CrossRef]
  28. Wang, W.; Zhang, Y.; Zhang, K.; Bai, T.; Shang, J. Reward–penalty mechanism for closed-loop supply chains under responsibility-sharing and different power structures. Int. J. Prod. Econ. 2015, 170, 178–190. [Google Scholar] [CrossRef]
  29. Wang, W.; Fan, L.; Ma, P.; Zhang, P.; Lu, Z. Reward-penalty mechanism in a closed-loop supply chain with sequential manufacturers’ price competition. J. Clean. Prod. 2017, 168, 118–130. [Google Scholar] [CrossRef]
  30. Wang, W.; Zhang, Y.; Li, Y.; Zhao, X.; Cheng, M. Closed-loop supply chains under reward-penalty mechanism: Retailer collection and asymmetric information. J. Clean. Prod. 2017, 142, 3938–3955. [Google Scholar] [CrossRef]
  31. Administrative Measures on the Collection and Using of Waste Electrical and Electronic Equipment Disposal Fund. Available online: http://www.miit.gov.cn/n1146295/n1146557/n1146619/c3072768/content.html (accessed on 14 November 2018).
  32. Waste Electrical and Electronic Equipment Disposal Directory (2014 Edition). Available online: http://www.ndrc.gov.cn/zcfb/zcfbgg/201502/W020150213320200835524.pdf (accessed on 15 November 2018).
  33. Guide, V.D.R.; Harrison, T.P.; Van Wassenhove, L.N. The challenge of closed-loop supply chains. Interfaces 2003, 33, 3–6. [Google Scholar] [CrossRef]
  34. Hischier, R.; Wäger, P.; Gauglhofer, J. Does WEEE recycling make sense from an environmental perspective? The environmental impacts of the Swiss take-back and recycling systems for waste electrical and electronic equipment (WEEE). Environ. Impact Assess. Rev. 2005, 25, 525–539. [Google Scholar] [CrossRef]
  35. Ylä-Mella, J.; Poikela, K.; Lehtinen, U.; Keiski, R.L.; Pongrácz, E. Implementation of waste electrical and electronic equipment directive in Finland: Evaluation of the collection network and challenges of the effective WEEE management. Resour. Conserv. Recycl. 2014, 86, 38–46. [Google Scholar] [CrossRef]
  36. Jang, Y.C. Waste electrical and electronic equipment (WEEE) management in Korea: Generation, collection, and recycling systems. J. Mater. Cycles Waste 2010, 12, 283–294. [Google Scholar] [CrossRef]
  37. Pathak, P.; Srivastava, R.R.; Ojasvi. Assessment of legislation and practices for the sustainable management of waste electrical and electronic equipment in India. Renew. Sustain. Energy Rev. 2017, 78, 220–232. [Google Scholar] [CrossRef]
  38. Salhofer, S.; Steuer, B.; Ramusch, R.; Beigl, P. WEEE management in Europe and China—A comparison. Waste Manag. 2016, 57, 27–35. [Google Scholar] [CrossRef] [PubMed]
  39. Ongondo, F.O.; Williams, I.D. Mobile phone collection, reuse and recycling in the UK. Waste Manag. 2011, 31, 1307–1315. [Google Scholar] [CrossRef] [PubMed]
  40. Silveira, G.T.; Chang, S.Y. Cell phone recycling experiences in the United States and potential recycling options in Brazil. Waste Manag. 2010, 30, 2278–2291. [Google Scholar] [CrossRef]
  41. HUAWEI Mall—Green Action 2.0. Available online: https://www.vmall.com/recycle (accessed on 16 November 2018).
  42. Aihuishou Official Website. Available online: https://www.aihuishou.com (accessed on 16 November 2018).
  43. Nduneseokwu, C.K.; Qu, Y.; Appolloni, A. Factors influencing consumers’ intentions to participate in a formal e-waste collection system: A case study of Onitsha, Nigeria. Sustainability 2017, 9, 881. [Google Scholar] [CrossRef]
  44. Wang, W.; Tian, Y.; Zhu, Q.; Zhong, Y. Barriers for household e-waste collection in China: Perspectives from formal collecting enterprises in Liaoning Province. J. Clean. Prod. 2017, 153, 299–308. [Google Scholar] [CrossRef]
  45. Li, Y.; Xu, F.; Zhao, X. Governance mechanisms of dual-channel reverse supply chains with informal collection channel. J. Clean. Prod. 2017, 155, 125–140. [Google Scholar] [CrossRef]
  46. Toyasaki, F.; Boyaci, T.; Verter, V. An analysis of monopolistic and competitive take-back schemes for WEEE recycling. Prod. Oper. Manag. 2011, 20, 805–823. [Google Scholar] [CrossRef]
  47. Giri, B.C.; Chakraborty, A.; Maiti, T. Pricing and return product collection decisions in a closed-loop supply chain with dual-channel in both forward and reverse logistics. J. Manuf. Syst. 2017, 42, 104–123. [Google Scholar] [CrossRef]
  48. Wu, X.; Zhou, Y. The optimal reverse channel choice under supply chain competition. Eur. J. Oper. Res. 2017, 259, 63–66. [Google Scholar] [CrossRef]
  49. Choi, T.M.; Li, Y.; Xu, L. Channel leadership, performance and coordination in closed loop supply chains. Int. J. Prod. Econ. 2013, 146, 371–380. [Google Scholar] [CrossRef]
  50. Liu, Z.; Tang, J.; Li, B.Y.; Wang, Z. Trade-off between remanufacturing and recycling of WEEE and the environmental implication under the Chinese Fund Policy. J. Clean. Prod. 2017, 167, 97–109. [Google Scholar] [CrossRef]
  51. Zhu, S.; He, W.; Li, G.; Zhuang, X.; Huang, J.; Liang, H.; Han, Y. Estimating the impact of the home appliances trade-in policy on WEEE management in China. Waste Manag. Res. 2012, 30, 1213–1221. [Google Scholar] [CrossRef] [PubMed]
  52. Yu, L.; He, W.; Li, G.; Huang, J.; Zhu, H. The development of WEEE management and effects of the fund policy for subsidizing WEEE treating in China. Waste Manag. 2014, 34, 1705–1714. [Google Scholar] [CrossRef]
  53. Cao, J.; Chen, Y.; Shi, B.; Lu, B.; Zhang, X.; Ye, X.; Zhai, G.; Zhu, C.; Zhou, G. WEEE recycling in Zhejiang Province, China: Generation, treatment, and public awareness. J. Clean. Prod. 2016, 127, 311–324. [Google Scholar] [CrossRef]
  54. Gu, Y.; Wu, Y.; Xu, M.; Wang, H.; Zuo, T. To realize better extended producer responsibility: Redesign of WEEE fund mode in China. J. Clean. Prod. 2017, 164, 347–356. [Google Scholar] [CrossRef]
  55. Liu, H.; Lei, M.; Deng, H.; Leong, G.K.; Huang, T. A dual channel, quality-based price competition model for the WEEE recycling market with government subsidy. Omega 2016, 59, 290–302. [Google Scholar] [CrossRef]
  56. Jørgensen, S.; Taboubi, S.; Zaccour, G. Incentives for retailer promotion in a marketing channel. In Advances in Dynamic Games, 1st ed.; Haurie, A., Muto, S., Petrosjan, L.A., Raghavan, T.E.S., Eds.; Birkhäuser Boston: Cambridge, MA, USA, 2006; Volume 8, pp. 365–378. ISBN 978-0-81-764500-7. [Google Scholar]
  57. De Giovanni, P. Closed-loop supply chain coordination through incentives with asymmetric information. Ann. Oper. Res. 2017, 253, 133–167. [Google Scholar] [CrossRef]
  58. De Giovanni, P.; Reddy, P.V.; Zaccour, G. Incentive strategies for an optimal recovery program in a closed-loop supply chain. Eur. J. Oper. Res. 2016, 249, 605–617. [Google Scholar] [CrossRef]
  59. Feng, T.; Tai, S.; Sun, C.; Man, Q. Study on cooperative mechanism of prefabricated producers based on evolutionary game theory. Math. Probl. Eng. 2017, 2017. [Google Scholar] [CrossRef]
  60. Cheng, J.; Gong, B.; Li, B. Cooperation strategy of technology licensing based on evolutionary game. Ann. Oper. Res. 2017, 268, 387–404. [Google Scholar] [CrossRef]
  61. Yuan, B.; He, L.; Gu, B.; Zhang, Y. The Evolutionary Game Theoretic Analysis for Emission Reduction and Promotion in Low-Carbon Supply Chains. Appl. Sci. 2018, 8, 1965. [Google Scholar] [CrossRef]
  62. Friedman, D. On economic applications of evolutionary game theory. J. Evol. Econ. 1998, 8, 15–43. [Google Scholar] [CrossRef] [Green Version]
  63. Nowak, M.A.; May, R.M. Evolutionary games and spatial chaos. Nature 1992, 359, 826–829. [Google Scholar] [CrossRef]
  64. Roca, C.P.; Cuesta, J.A.; Sánchez, A. Effect of spatial structure on the evolution of cooperation. Phys. Rev. E 2009, 80. [Google Scholar] [CrossRef] [Green Version]
  65. Wang, Y.; Li, B.; Shen, L. A study of the evolutionary game of two manufacturer’s reverse supply chain. Syst. Eng. Theory Pract. 2008, 28, 43–49. [Google Scholar] [CrossRef]
  66. Fu, X.; Zhu, Q.; Dou, Y. Evolutionary game analysis of recycling channel of reverse supply chain under collection competition. Oper. Res. Manag. Sci. 2012, 41–51. [Google Scholar] [CrossRef]
  67. Han, X.; Xue, S. Reverse channel decision for competition closed-loop supply chain based on evolutionary game. Comput. Integr. Manuf. Syst. 2010, 16, 1487–1493. [Google Scholar] [CrossRef]
  68. Tomita, D.; Kusukawa, E. Analyzing the evolutionary stability for behavior strategies in reverse supply chain. Ind. Eng. Manag. Syst. 2015, 14, 44–57. [Google Scholar] [CrossRef]
  69. Taylor, P.D.; Jonker, L.B. Evolutionary stable strategies and game dynamics. Math. Biosci. 1978, 40, 145–156. [Google Scholar] [CrossRef]
  70. Nash, J. Non-cooperative games. Ann. Math. 1951, 54, 286–295. [Google Scholar] [CrossRef]
Figure 1. RSC structure in the competitive and cooperation situation.
Sustainability 10 04744 g001
Figure 2. Evolution laws of the RSC system at different positions of point M: (a) M is in ( p = 0.5, q = 0.5). (b) M is in ( p < 0.5, q < 0.5). (c) M is in ( p > 0.5, q > 0.5). (d) M is to be determined.
Sustainability 10 04744 g002
Figure 3. (a) Simulation of S 1 varying with l . (b) Simulation of S 1 varying with k .
Sustainability 10 04744 g003
Figure 4. Simulation of S 1 varying with l and k .
Sustainability 10 04744 g004
Table 1. Their strategy choices.
Competitive StrategyCooperation Strategy
ManufacturerSelf-collectionAuthorizing the collector to undertake collection
CollectorCollecting his waste phones for other manufacturersCollecting waste phones for him
Table 2. Notations.
Table 2. Notations.
SymbolDescription
Parameters
v s His basic income from manufacturing
e s Operating cost of his self-collection including fees of buy-back and transportation
c s Risk cost of his choice of cooperation caused by her not achieving the excepted quantity and quality of collected products
v t Her basic income from collecting WMPs for other manufacturers
c t Initial cost of her choice of cooperation for additional service personnel and facilities
e t Operating cost of her collection including fees of buy-back and transportation
l Reward implemented by him for her successful service
k Penalty implemented by him for her failed service, which means that she does not meet his requirements for the quantity and quality of the collection
β Probability of her service failure which depends on the random quantity and quality of WMPs, 0 < β < 1
Δ v s His potential profit from additional remanufacturing materials in a cooperative strategy
Δ v t Her potential profit from additional collecting income in a cooperative strategy
Variables
p Probability of his choice of cooperation
q Probability of her choice of cooperation
Table 3. Payoff matrix of the CEGM.
CollectorCompetition (1−q)Cooperation (q)
Manufacturer
Competition (1−p) v s e s , v t v s e s , v t c t
Cooperation (p) v s e s c s , v t v s ( 1 β ) l + β k c s + Δ v s ,
v t + ( 1 β ) l β k e t c t + Δ v t
Table 4. The local stability of the equilibrium points in the RSC system.
Equilibrium Point det J tr J Local Stability
O (0, 0)+-Evolutionary stable point
A (0, 1)++Instability point
B (1, 0)++Instability point
C (1, 1)+-Evolutionary stable point
M   ( p ,   q )+0Saddle point
Table 5. Sensitivity analysis of the related parameters in the CEGM.
Δ v s Δ v t c s c t e s e t l k β
S 1 + + + ( ) ( ) ~ (∓)#
S 2 + + + ( ± ) ( ± ) ~ ( ± ) #
Probability of cooperation + + + ( ± ) ( ± ) ~ ( ± ) #
Table 6. The simulation parameters’ value.
Parameters v s v t c s c t e s e t Δ v s Δ v t l k β
Values18001200185180100905805301501600.1

