Article

Levels of Technical, Allocative, and Groundwater Use Efficiency and the Factors Affecting the Allocative Efficiency of Wheat Farmers in Pakistan

1
School of Environment, Resources and Development, Asian Institute of Technology, P.O. Box 4, Khlong Luang, Pathumthani 12120, Thailand
2
G-EAU, University Montpellier, AgroParisTech, CIRAD, IRD, IRSTEA, Montpellier SupAgro, 34093 Montpellier, France
*
Author to whom correspondence should be addressed.
Sustainability 2018, 10(5), 1619; https://0-doi-org.brum.beds.ac.uk/10.3390/su10051619
Submission received: 23 March 2018 / Revised: 25 April 2018 / Accepted: 1 May 2018 / Published: 18 May 2018
(This article belongs to the Special Issue Sustainable Agribusiness and Agri-food Prospects)

Abstract

:
In Pakistan, excessive lowering of the groundwater table has made crop irrigation costlier and without improving production efficiency, Pakistan’s rural economy will be adversely affected. This study estimated the technical, allocative, and groundwater use efficiency of wheat producers, identified the factors affecting their allocative efficiency, and suggested policy implications from these results. The data were collected from 84 tubewell owners, 65 tubewell shareholders, and 75 water buyers. The technical, allocative, and groundwater use efficiency were estimated by the Data Envelopment Analysis (DEA) method, and the important factors affecting the allocative efficiency were identified by two-limit tobit regression analysis. The results highlighted that the tubewell owners, tubewell shareholders, and water buyers had above 90% technical and groundwater use efficiency. However, allocative efficiency was substantially lower for all groups, indicating that wheat production costs could be significantly reduced by the optimal allocation of inputs. The allocative efficiency of wheat farmers decreased significantly with the increasing capacity of the tubewells, with the sharing of tubewells, and with the use of tractor-operated tubewells. The results imply that wheat farmers should be provided with technical and decision-making support to select an appropriate tubewell system that minimises their cost of production and improves their allocative efficiency. Furthermore, the resource allocation system of tubewell shareholders should be further studied to improve the allocative efficiency of wheat farmers.

1. Introduction

Groundwater irrigation plays a key role in agricultural production in arid regions due to its advantages, such as the provision of a more secure water supply than surface water, and its reliability during extended droughts [1]. Pakistan has the fourth largest area equipped with groundwater irrigation covering approximately 5.2 million hectares [2], with the Punjab and Balochistan Provinces predominately irrigated with groundwater. The proportion of area under groundwater irrigation has increased gradually from 8% in 1960 to 47% in 2010 [3] to cope with insufficient canal water supplies. Farmers extract up to 39 km3 of groundwater per year in Pakistan [2]—largely for irrigating wheat, sugarcane, maize, and rice crops. Groundwater accessibility played a vital role in achieving higher economic growth by ensuring predictable and increased crop yields and by reducing crop exposure to external shocks such as droughts [4,5,6]. However, excessive mining of aquifers in fresh groundwater areas has resulted in falling water tables, to the extent that groundwater has become inaccessible in 5% and 15% of the irrigated areas of the Punjab and Balochistan provinces, respectively [4]. Excessive lowering of the groundwater table has left farmers with no choice other than to drill deeper wells, which has made pumping costlier and energy intensive.
Wheat is one of the main irrigated crops in Pakistan, with 80% of farmers growing wheat as a food crop as well as a cash crop [7], and it is cultivated on nine million hectares, contributing about 10% of the total value of the country’s agriculture and 2.1% of gross domestic product [8]. Eighty five percent of the total wheat production is dependent on surface and groundwater irrigation [7]. Accessibility to groundwater has positively impacted the yield of irrigated wheat and boosted the profit margins of farmers [9]. This has improved the rural livelihood and the agricultural economy of Pakistan at large [10]. However, the increasing depth of the groundwater table has caused pumping costs to rise from 4.2 USD per 1000 m3 for shallow tubewells (<15 m) to 12 USD per 1000 m3 for deep tubewells (>15 m) [11]. The increased cost of pumping increases the cost of production, thereby decreasing the profit margins of farmers [12]. This development can eventually render groundwater irrigation economically unviable for wheat crops.
The cost of production can be brought down by decreasing the cost of inputs [13], by adjusting management practices, i.e., by improving technical and resource use efficiency [14], or by adjusting inputs according to the cost minimising proportion, i.e., by achieving allocative efficiency [15]. There is little hope of a decrease in the price of agricultural inputs as over the recent years, the prices of gas, electricity, and other agricultural inputs have been revised upwards several times, with these increases in input prices having been much higher than the increase in the price of agricultural outputs [16]. Therefore, improvement in technical efficiency, allocative efficiency, and groundwater use efficiency is more effective tools for reducing production costs. Previous studies have found that wheat farmers lack technical and groundwater use efficiency [17,18,19]. The drivers of technical and groundwater use efficiency have also been studied [17], and the results have revealed that beside the socio-economic characteristics of farmers, the ownership of tubewells significantly improves technical and irrigation efficiency. The extent of allocative efficiency and its drivers have not been well studied in Pakistan. However, we conjecture that the rise in irrigation costs can adversely affect the allocative efficiency of wheat farmers.
In Pakistan, groundwater users are divided into three groups on the basis of tubewell ownership: tubewell owners, tubewell shareholders, and water buyers [20,21]. Tubewell owners install a private tubewell on a legally owned piece of land over an aquifer to extract unchecked amounts of groundwater. The farmers who cannot afford to install a tubewell buy groundwater from neighbouring tubewell owners through over-the-counter (informal) groundwater markets [6] or they become shareholders in a tubewell by contributing to the installation and operational costs of the tubewell [21]. For tubewell owners and tubewell shareholders, the cost of groundwater irrigation is equal to the sum of extraction and operational costs. On the other hand, water buyers pay the cost of groundwater extraction and a fixed hourly charge for the purchase of water. Therefore, the cost of irrigation is higher for water buyers than it is for the other two groups [5,22,23]. The difference in cost is also attributed to the type of tubewell, i.e., whether it is electric or diesel operated, as electricity is cheaper than diesel fuel and so electric tubewell users bear less costs for irrigation than diesel tubewell users. Differences in the cost of input can affect farmers’ ability to allocate inputs according to their costs, leading to inefficiencies in production [13,24].
Although technical and groundwater use efficiency provides important information about the management practices of farmers, these indicators do not explain farmers’ ability to allocate irrigation water and other inputs to their cost-minimising input proportions [25]. Information about allocative efficiency and its determinants provides crucial help to policy makers in devising policies for expediting rural development and increasing farm income [26,27]. Due to its importance in reducing production costs and improving profit margins, this study focused on the allocative efficiency in wheat production among groundwater users in Pakistan.
This paper aimed to (1) simultaneously analyse the level of technical, allocative, and groundwater use efficiency of tubewell owners, tubewell shareholders, and water buyers; (2) identify the major factors affecting the allocative efficiency; and (3) suggest policy implications from the results.

2. Methodology

2.1. Conceptual Framework

Studies on efficiency differentials by agronomists and irrigation engineers tend to be based on computationally easy and intuitively appealing techniques using measures such as crop yield per unit of land or water applied. However, such measures do not provide complete knowledge about the causes of variations in crop yield at different farms, due to the disregard of probable dissimilarities and heterogeneity in other production factors such as labour, machine use, or chemical inputs [14]. In contrast, the measurement of technical efficiency is a more detailed and reliable assessment approach, in which all factors of production and inputs are considered simultaneously to assess productivity and efficiency [28]. Technical efficiency is achieved when a farmer produces a given output from the least possible quantity of inputs [24,29]. Groundwater use efficiency estimates possible relative reductions in groundwater use without changing the remaining inputs and output levels [30,31]. Technical efficiency considers the physical aspects of production without considering the market prices of the inputs or the value of the outputs. Allocative efficiency is achieved when a farmer allocates inputs in order to minimise the cost of producing a given level of output [29].

2.2. Efficiency Estimation—Data Envelopment Analysis

In this study, the estimation of technical and allocative efficiency was based on Farrell’s concept of relative efficiency and the production possibility frontier [29]. There are two approaches used to estimate relative efficiency: (1) a parametric approach (e.g., Stochastic Frontier Approach (SFA)) and (2) a non-parametric approach (e.g., Data Envelopment Analysis (DEA)). Data envelopment analysis (DEA), is a non-parametric frontier approach to evaluate the relative efficiency of a set of homogeneous decision-making units (DMUs) featuring multiple inputs and outputs [32]. Using the DEA method, each farm’s efficiency score is individually optimised through mono-objective linear programming, comparing resources used (inputs) and quantities produced (outputs) to the levels of other units [33]. The result is the construction of an efficient frontier. The DMUs lying on the frontier are efficient (score of 100%), while the others are inefficient (score of less than 100%). DEA has recently been widely applied to analyse the efficiency of energy consumption [34], agricultural production [35,36,37], and the tourism [38] and banking sectors, among others [39].
This study applied the DEA approach to estimate the efficiency of wheat producers for the following reasons: (a) it requires no specification of any functional form between inputs and output, a priori, nor distributional assumptions of the data, thus it is resistant to specification bias and non-normality [40]; (b) simultaneous inclusion of more than one input and output into the analysis does not incur aggregation bias; (c) it identifies efficient farmers (peers) used as benchmarks to compare the performance of less efficient farms; (d) the analysis is unit invariant [35,41]; (e) the DEA model is ideal to calculate total factor efficiency to comprehensively measure input–output efficiency and compare the efficiency among DMUs; and (f) the weights in the DEA model are not influenced by subjective factors [34]. Reason (a) is particularly relevant as some important categorical variables are included in the analysis.
A range of DEA models have been developed that measure efficiency in different ways. One categorisation refers to input-oriented models and output-oriented models [35,41]. Our study adopted the input-oriented approach, as the main focus was to analyse possible input reduction to maintain given output levels. Another categorisation can be made with respect to the scale assumptions that underpin the model. Commonly, constant returns to scale (CRS) or variable returns to scale (VRS) are considered. The latter encompasses both increasing and decreasing returns to scale [35,41]. There are generally a priori reasons for assuming that agricultural production would be subject to variable returns and, in particular, decreasing returns to scale [35,40,41,42]. Therefore, the VRS model was employed in this paper.

3. Technical Efficiency Estimation

Technical efficiency was estimated by solving the linear minimisation problem given in Equation (1), as developed by [43]:
M i n ( λ , θ ) θ k ,
subject to the following constraints:
j = 1 n λ j w j w k 0
j = 1   n λ j z i j θ z i k 0 j = 1 n λ j = 1 λ j 0
where θ k denotes the relative technical efficiency of the farmer (or DMU) “k” under study; λj are the weights to be used as multipliers for the input levels of a reference farm to indicate the input levels that an inefficient farm should aim to achieve to become efficient. zik is the level of input “i” on farm “k” and wk is the level of output (i.e., wheat yield) for farmer k”. “n” is the number of sampled farmers. j = 1 n λ j = 1 imposes the restriction that the production frontier is convex, implying that the technical efficiency is estimated under the VRS assumption.

4. Groundwater Use Efficiency Estimation

The efficiency of a single input can be estimated by the sub-vector efficiency method (SVM) or the slack-based DEA method (SBM). While both methods estimate input efficiency through non-radial measures, only the SBM estimates slack values, as well as efficiency scores [37]. Slacks assess unwarranted usage of an input in a production procedure. The current study used the SBM model to estimate the excessive use of groundwater in wheat production, which is expressed in Equation (2), given by [31].
M i n ( λ , θ ,   S , S + ) [ θ ε ( i = 1 m S i + q = 1 s S q + ) ] ,
subject to the following constraints:
j = 1   n λ j z i j + S i = θ z i k
j = 1 n λ j w q j S q + = w q k j = 1 n λ j = 1 λ j 0
where S represents the excessive quantity of a particular input, and S + gives the extra output that could be achieved. The character 𝜀 is a “non-Archimedean infinitesimal” demarcated to be less than any positive real number. The outcomes of this minimisation problem can be interpreted such that a wheat farmer is strongly efficient if θ * = 1 and all slacks are zero; and weakly efficient if θ * = 1 and all slacks are not equal to zero [35].
Groundwater use efficiency is estimated by Equation (3), by following [31]:
G r o u n d w a t e r   u s e   e f f i c i e n c y = T e c h n i c a l   e f f i c i e n c y V e t V o t ,
whereas V e t is the excessive amount of the input t, and V o t is the actual quantity of the input t.

5. Allocative Efficiency Estimation

To estimate the allocative efficiency of the kth farmer by DEA, we followed Equation (4) [15]:
M i n ( λ , z k ) c k z k
subject to the following constraints:
j = 1   n λ j z i j z k 0 ,
j = 1 n λ j w q j w k 0 , j = 1 n λ j = 1 , λ j 0 ,
where, z k denotes the cost-minimising set of inputs with the price of inputs and outputs given as vector c k . The allocative efficiency for the kth farmer is calculated by dividing his minimum possible cost of production ( c k z k ) with his or her actual cost of production ( c k z k ) , as given by Equation (5):
A l l o c a t i v e   e f f i c i e n c y = c k z k c k z k ,

5.1. Determinants of Allocative Efficiency—Two-Limit Tobit Regression

The estimation of efficiency scores was followed by the construction of a statistical model to estimate the determinants of allocative efficiency scores. Allocative efficiency scores are bounded between zero and one. Such variables are termed as two-sided censored variables. The most frequently used method to predict the values of such variables is the two-limit tobit regression model [17,28,44,45,46]. In our case, the dependent variable represents a proportion, which requires that there should not be an excessive amount of censoring (values of zero and one). This requirement is satisfied, as shown in Section 3. The two-limit tobit regression model is given by Equation (6):
θ k = α j 0 + j = 1 m n β j t j k + ε j k ,
θ k = { θ k ,   i f   0 < θ k < 1 0 ,   i f   θ k < 0 1 ,   i f   θ k 1 ,
where θk is the efficiency value; tj is the set of explanatory variables for j = 1, …, m; and ε j is the error term. The parameters in the tobit regression model were estimated using the maximum likelihood approach [47].

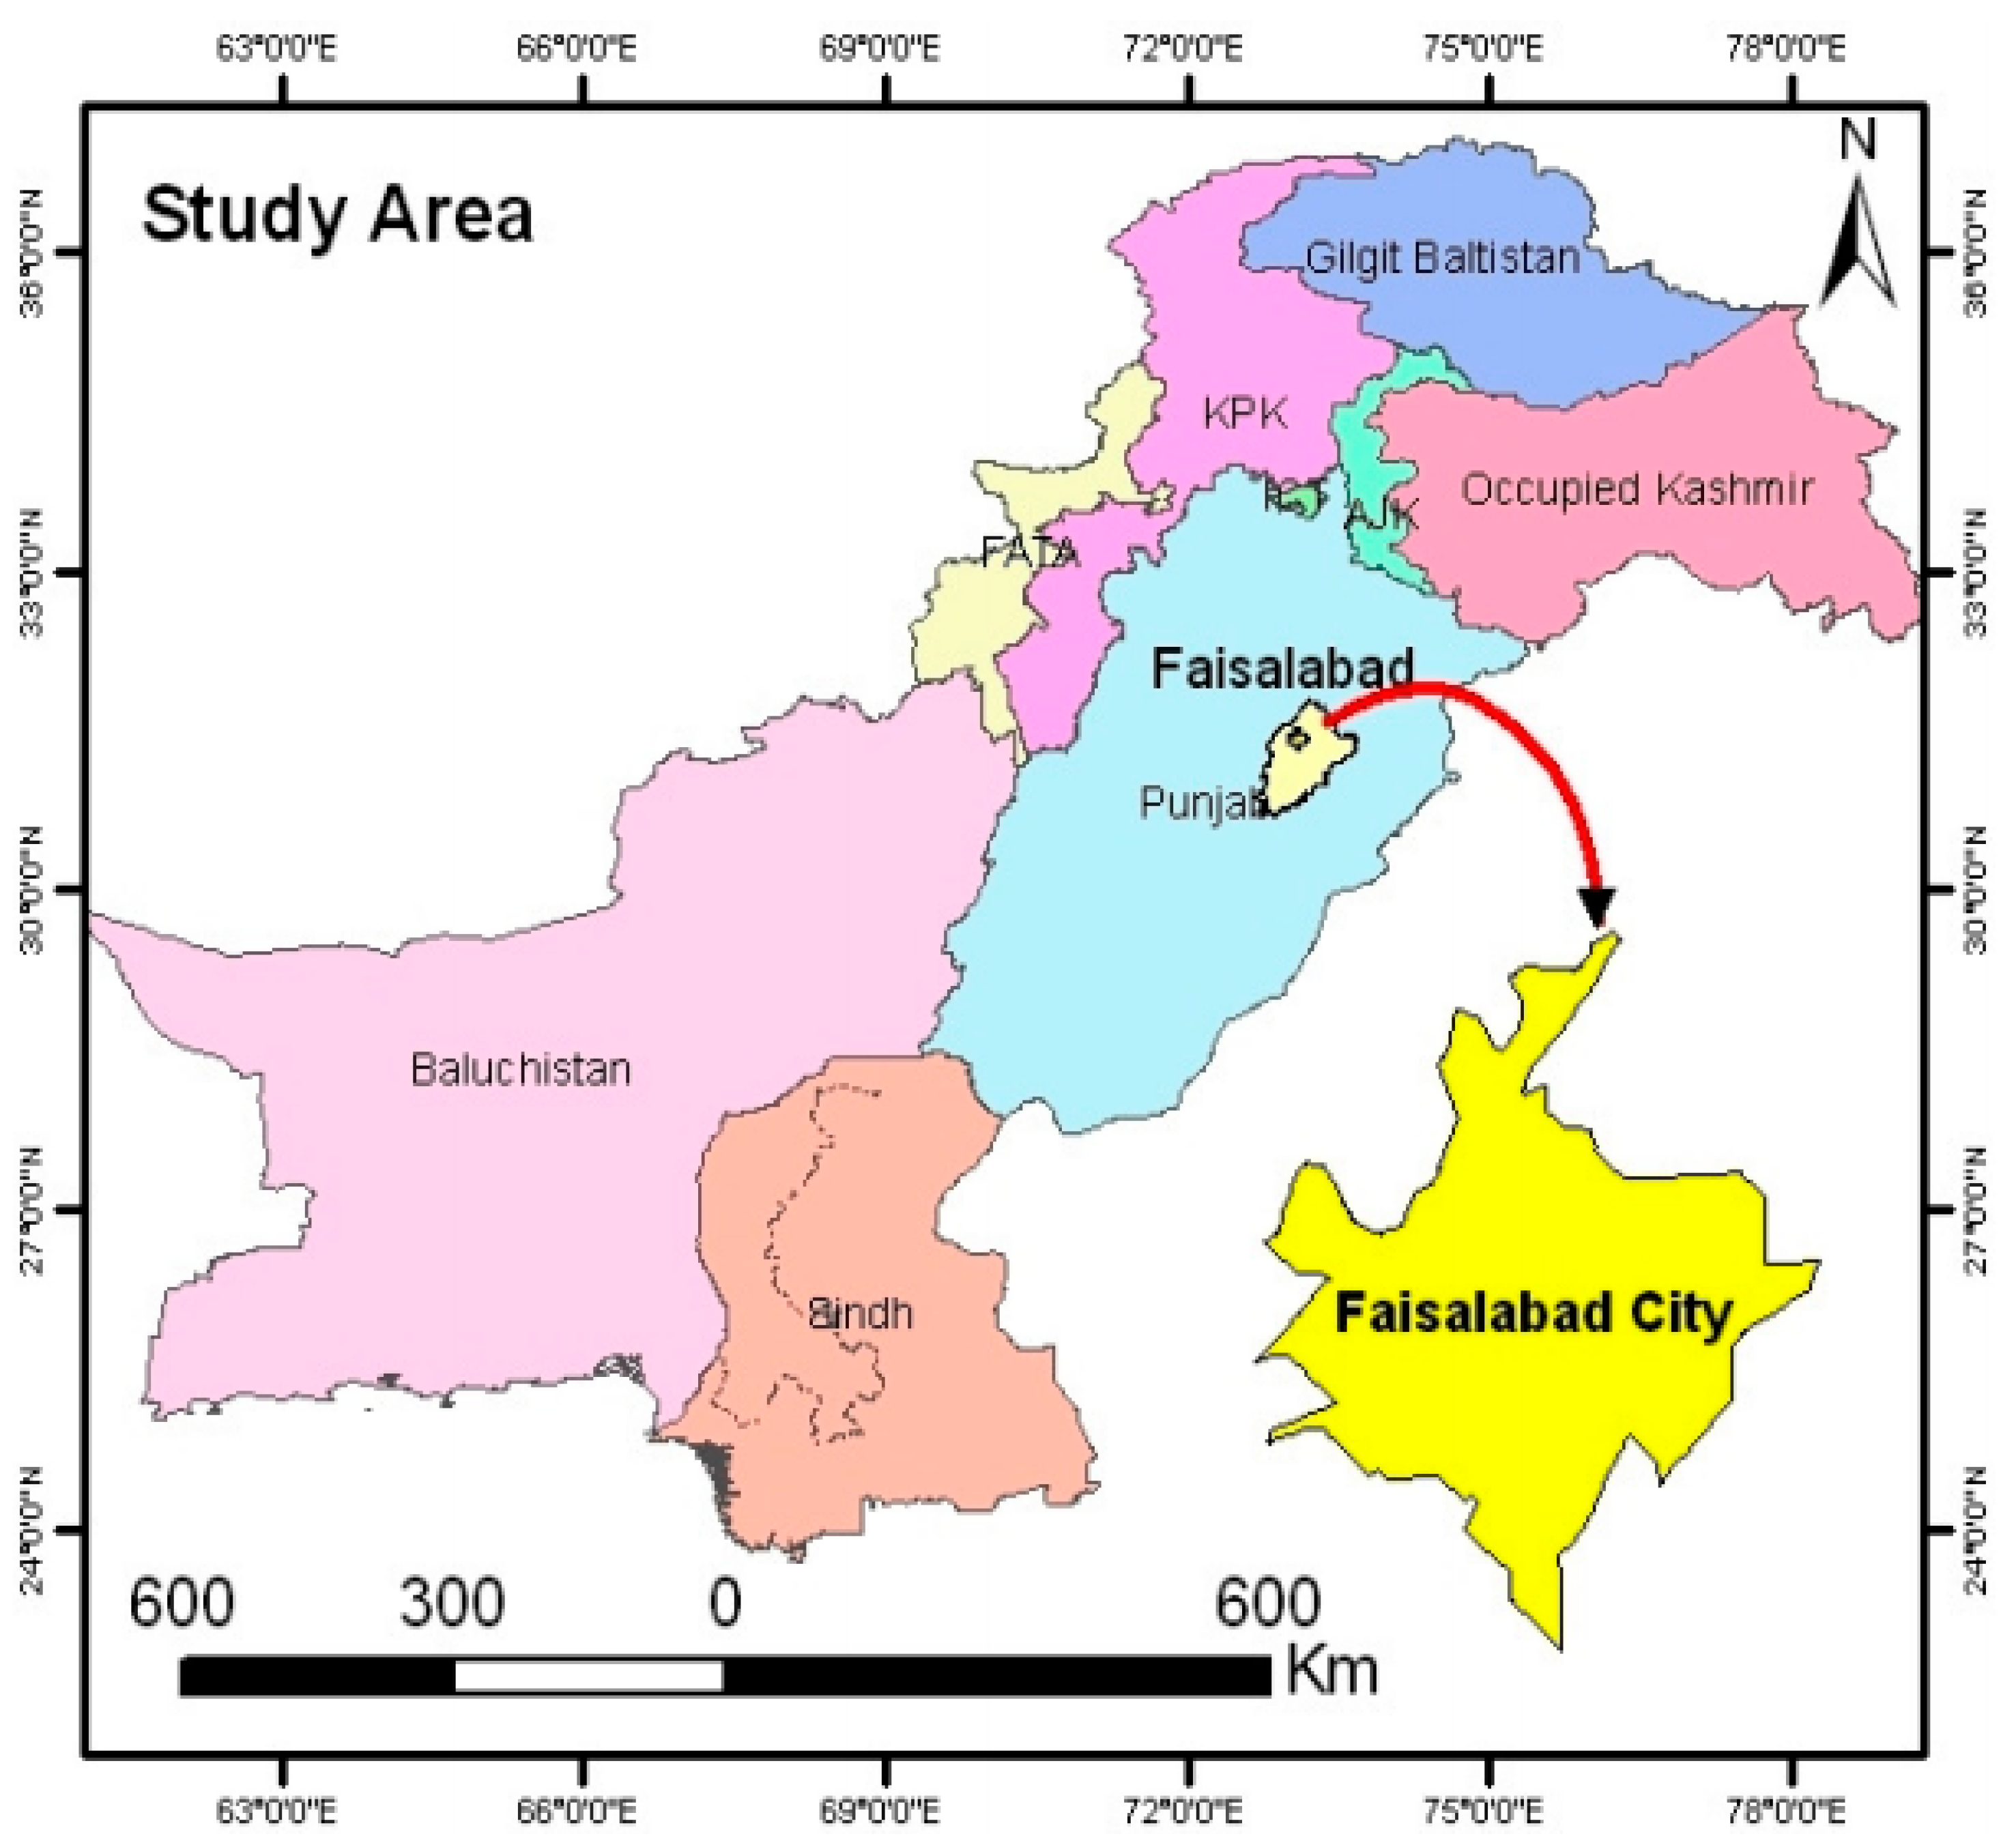
5.2. Study Area and Sampling

This study was carried out in the Faisalabad district of Punjab Province in Pakistan (Figure 1). Faisalabad district lies between two rivers: the Chenab and Ravi. As a result, its agricultural land is composed of alluvial soils that enable farmers to cultivate a variety of different crops, such as grains, fodders, cotton, sugarcane, and horticultural crops. In the selected study area, the predominant cropping patterns include rice–wheat, cotton–wheat, and wheat–sugarcane systems. Wheat is cultivated over 0.3 million hectares in Faisalabad, making it the second largest wheat-growing district in Pakistan [48]. Due to the arid climate, wheat production depends on surface and groundwater irrigation. Groundwater irrigation had been used as a supplementary or main source of irrigation in the study area for more than two decades [49]. In 2012–2013, 60% of the total crop area was irrigated with groundwater, out of which 52% was irrigated through exclusively owned and shared tubewells, and 48% by purchased water [50]. There were 31,190 irrigation tubewells reported in Faisalabad in the year 2011–2012 [50]. Groundwater exploitation has resulted in the gradual decline of groundwater tables, leading to increases in extraction costs [5]. The present study site was selected bearing in mind its prominent position in wheat production, dependence on groundwater, and declining groundwater levels.
A multistage sampling method was adopted to collect the primary data. In the first stage, 15 villages were randomly selected from Faisalabad district. In the second stage, stratified sampling was used to categorise wheat farmers as tubewell owners, tubewell shareholders, and water buyers. In the third stage, 15 farmers were selected randomly from each village. This gave a total of 224 farmers, of which 84 were tubewell owners, 65 tubewell shareholders, and 75 water buyers. The numbers of tubewell owners, tubewell shareholders, and water buyers were determined proportionately from each village, based on their population in the respective village.

5.3. Data and Variable Definition

A structured questionnaire was used to conduct interviews with each of the wheat farmers to collect information on wheat yield, seed rate, irrigation quantity, fertiliser rate, machine use, labour input, and herbicide use, with the respective prices. This information was used for the estimation of technical, allocative, and groundwater use efficiency. Household demographics, characteristics of the farmer and farm, and tubewell data were also collected to help understand their effects on allocative efficiency. The quantities and prices of wheat inputs were entered into the DEA model in per-hectare units to enable a comparison of performance across various farm sizes. All of the prices were measured in Pakistani rupees and were converted into values per hectare (PKR/ha). (1 USD = 100 PKR) (Table 1).
To estimate the quantity of groundwater applied to irrigate each farmer’s wheat crop and its cost, the questionnaire gathered information about the number of groundwater irrigations applied to the wheat crop, the duration of each irrigation, and the per-hour cost of using groundwater irrigation for the farmer.
Following [17,51,52], an approximate estimation model was applied to obtain the groundwater irrigation volume (Equation (7)):
Q = [ t × 129574.1 × B H P [ d + ( 255.5998 × B H P 2 d 2 × D 4 ) ] ] / 1000 ,
where,
  • Q is the total volume of groundwater (cubic meters),
  • t is the total irrigation time (h),
  • d is the depth of the bore (metres),
  • D is the diameter of the suction pipe (inches), and
  • BHP is the power of the engine (horsepower).
The total cost of groundwater irrigation was estimated as given in Equation (8). The irrigation cost was expressed as Pakistani rupees per hectare.
T o t a l   C o s t   o f   I r r i g a t i o n = t   ×   c ,
where,
  • t is the total irrigation time (h per hectare),
  • c is the cost of irrigation (Pakistani rupees per hour).

6. Results

This section first presents descriptive statistics of the selected variables, as well as the estimated scores and frequencies of the technical, allocative, and groundwater use efficiency of wheat farmers, which is followed by the identification of factors affecting the allocative efficiencies of the sampled wheat farmers.

6.1. Economics of Wheat Cultivation by Tubewell Ownership

Table 2 presents differences in the input use and cost of producing wheat among tubewell owners, shareholders, and water buyers. Additionally, the differences in wheat yields and the value of wheat produce realised are highlighted in the table. It is important to understand these differences because they are the main source of variation in technical and allocative efficiency among wheat farmers. Tukey’s Honestly Significant Difference (Tukey’s HSD) test [53,54] was applied on each input and cost item to examine the significance of group-wise differences, where the statistical significance level was kept at 0.05. The test results indicated that the wheat area was significantly different for all the three pairs, with the shareholders allocating the largest area and the water buyers allocating the smallest. The tubewell owners applied significantly higher quantities and costs of nitrogen and phosphorous fertiliser compared to the two other groups. It was observed that the shareholders used significantly higher quantities and costs of seed, labour, and machines per hectare.
The input of interest in this paper was groundwater irrigation. Descriptive and inferential statistics showed that the shareholders had considerably higher irrigation water use at 1549 m3/ha, while the owners and water buyers used 1252 m3/ha and 1000 m3/ha of water, respectively. However, the cost of irrigation water per hectare borne by the shareholders was the lowest among all three groups. This is because the buyers paid higher unit costs than the owners and shareholders, and electrical tubewells ran on subsidised electricity, rendering the cost of groundwater lifting from electric tubewells lower than from diesel engine and tractor-operated tubewells.
Table 3 presents the correlations between different inputs and the output of wheat production. The correlation between inputs and yield depicts that groundwater use, seed rate, phosphorous and nitrogen fertiliser, and machine use are significantly associated with wheat yield. Labour input has a significant and positive correlation with the seed rate, bio-fertiliser, phosphorous and nitrogen fertiliser, and machine use. This is institutive because in the study area, most of the farmers apply all inputs manually, and therefore, labour use increases with increased input application. Groundwater use is significantly associated with fertiliser use, which suggests that irrigation and fertilisers are complementary inputs in the study area. The complementarity of irrigation and fertilisers has also been established by [55]. Input prices have similar correlations with the cost of wheat yield (Appendix A).

6.2. Characteristics of Irrigation Water Users by Tubewell Ownership

Table 4 displays the personal characteristics of farmers, the household characteristics, and the farm properties for the three groups of groundwater users. For the average age, it was observed that the shareholders were the oldest while the exclusive owners were the youngest of the three groups. The data for education level revealed that the tubewell owners were more educated than the shareholders and water buyers, while the shareholders and water buyers had the same education level. Appendix C shows the results of a t-test of mean differences across these groups.
Regarding the average farm size, it was observed that the tubewell shareholders had the largest landholding (7.4 ha), followed by the tubewell owners (5.3 ha) and water buyers (2.4 ha). Family size followed the same pattern as farm size. The tubewells of the shareholders were the deepest and had the largest discharge capacity. Deeper and larger capacity tubewells are more expensive to install and require more energy to draw water, which might have encouraged the sharing of expenses and the joint investment in tubewells. It is interesting to find that all of the tubewell shareholders used the same type of tubewells, i.e., electric tubewells. The relationship between tubewell shareholding and the installation of electric tubewells was highly correlated (Appendix D). Exclusive owners of tubewells had either diesel or tractor-operated tubewells. Albeit not presented, the water buyers purchased water predominantly from diesel tubewells, followed by electric and tractor-operated tubewells, in descending order. The result showed that the water buyers seemed to have the highest proportion of off-farm income sources, though there was no statistical significance in the differences among the three groups (Appendix D).
A total of 44% of the exclusive owners, 63% of the shareholders, and 63% of the water buyers perceived that their groundwater was saline, though none of the farmers had tested the quality of the groundwater to check for its suitability for irrigation.

6.3. Technical and Groundwater Use Efficiency by Tubewell Ownership

Table 5 presents the results of the input-oriented DEA model estimation. The average technical efficiency score was 99% for both types of tubewell owners, and 97% for the water buyers. The overall level of technical efficiency was fairly high, and the frequency distribution showed that 75% of the tubewell owners, 71% of tubewell shareholders, and 65% of water buyers had 100% technical efficiency.
The slack variable resulting from the technical efficiency analysis allowed for the estimation of groundwater use efficiency. Slack estimation revealed that the mean groundwater use efficiency score for the tubewell owners, tubewell shareholders, and water buyers was 97%, 96%, and 94%, respectively. The frequency distribution showed that 31% of the tubewell owners, 32% of tubewell shareholders, and 39% of water buyers used groundwater irrigation with some inefficiency.

6.4. Allocative Efficiency by Tubewell Ownership

The results of the VRS cost minimising DEA model revealed that the mean allocative efficiency was 70%, 56%, and 69% for the tubewell owners, tubewell shareholders, and water buyers, respectively (Table 6). Only 4% of the tubewell owners, 5% of the tubewell shareholders, and 5% of the water buyers operated at 100% allocative efficiency.

6.5. Factors Affecting Allocative Efficiency

The second part of the analysis investigated the factors affecting the allocative efficiency of wheat farmers. The allocative efficiency scores of wheat farmers were negatively related to the discharge capacity of the tubewells, being tubewell shareholders, and with the use of tractor-operated tubewells (Table 7).
To inspect the robustness of the model, stepwise removal of insignificant variables was performed. The three variables with the largest p-values were removed one by one. The results showed that the removal of insignificant variables affected neither the likelihood ratio of the model nor the coefficients and significance of the other variables to a large extent. The results for the key variables were not sensitive to the alteration of specifications.

7. Discussion

The present study estimated the technical, allocative, and groundwater use efficiency of wheat farmers using data envelopment analysis. The major determinants of the allocative efficiency were also identified using two-limit tobit regression analysis. The sampled data included 84 tubewell owners, 65 tubewell shareholders, and 75 water buyers from Faisalabad district in Pakistan.
The technical efficiency results highlighted that wheat farmers operated with fairly high levels of technical efficiency. Studies in other agro-ecological zones of Pakistan have found lower technical efficiency in irrigated wheat production, such as [17,18,19,56]. It is very likely that the improved technical efficiency scores in our study were due to the higher education level and larger farm size of the sampled farmers in our study area. There is empirical evidence that the technical efficiency of wheat production is positively related to education levels [17] and farm size [57]. The lack of any significant difference in the technical efficiency among different groundwater users implies that they all used similar production technologies and the efficiency in use of such technologies had saturated. Groundwater use efficiency scores also portrayed the sufficiently high efficiency performance of the wheat farmers. The results of groundwater use efficiency imply that the tubewell owners, tubewell shareholders, and water buyers could reduce their groundwater use by 3%, 4%, and 6%, respectively, without increasing the quantities of other inputs or compromising the level of wheat output. The lack of significant difference in groundwater use efficiency among the different user groups indicates that all user groups have similar qualities of irrigation services.
Despite being technically efficient, a substantial number of the wheat farmers did not achieve allocative efficiency. The low allocative efficiency scores imply that, if the wheat farmers optimised their input allocation, they could attain the same output level with markedly lower production costs. More specifically, there is room for the tubewell owners, tubewell shareholders, and water buyers to reduce their wheat production costs by 30%, 44%, and 31%, respectively. The tubewell shareholders employed more groundwater, labour, machinery, and seed than the tubewell owners and water buyers (see Table 2). They also had the highest cost of seed, labour, and machinery as well, among all three groups (see Table 2). These excessive costs might explain the lowest allocative efficiency scores of the tubewell shareholders compared to the two other groups of wheat farmers.
Two-limit tobit analysis showed that the allocative efficiency of wheat farmers decreased in line with the increasing capacity of their tubewells, being a shareholder, and use of a tractor operated tubewell. The correlations among independent variables included in the tobit model revealed that the capacity of tubewells was positively related to tractor-operated tubewells and shareholder tubewells (Appendix C), indicating that tractor-operated tubewells and shared tubewells use a higher capacity operating system. An association between the depth and capacity of tubewells and tractor-operated tubewells was also observed by [58]. As tractors use 42–80 horse power engines, the power capacity of these engines has been found to be higher than the optimal capacity required to draw water from the given water depth [58]. The shareholders used electric tubewells (Table 2) that were exposed to voltage fluctuations and load shedding [58,59]. Farmers use over-sized electric motors to adapt to the situation of voltage fluctuations [60]. Tubewells with a larger capacity also have more operational and management problems, as well as higher extraction costs [59,61]. It is very likely that the use of higher capacity tractors and shared ownership tubewells decrease allocative efficiency by leading to energy overuse and incurring a higher cost of production.

Policy Implications

The noticeable absence of allocative efficiency for wheat farmers implies that policy instruments should target the price or allocation of inputs in wheat farming, such as groundwater pricing. The differences in allocative efficiency and groundwater costs imply that these policy instruments will not have similar efficiency effects for all groups. Moreover, given that the shareholders have to use tubewells with high capacity in order to satisfy their demand, they cannot switch to use smaller capacity wells. However, extension services should provide economic decision-making support to all farmers, especially the tubewell shareholders, to minimise their cost of production, which will improve allocative efficiency. The tractor-operated tubewells should only be used in deeper water level areas where it is not feasible to extract groundwater with lower capacity diesel engine tubewells. Diesel engines of appropriate capacity should be preferred over tractor-operated tubewells where the water table is not extremely low.
Our study findings imply that the local extension staff, irrigation department, and on-farm water management offices should help to improve the allocation efficiency of farmers by providing technical support and consultation in selecting the appropriate capacity of tubewells according to their irrigation demands, water level, and power source. As the extension staff, irrigation department, and on-farm water management offices cannot reach each and every farmer, private drilling services should also be targeted to help farmers choose an appropriate tubewell system.

8. Conclusions

This research estimated the farm-level technical, allocative, and groundwater use efficiency of wheat farmers, along with the associated determinants of allocative efficiency. The cross-sectional dataset included three groups of wheat farmers: tubewell owners, tubewell shareholders, and water buyers. The results showed that all three groups of wheat farmers operated with fairly high levels of technical and groundwater use efficiency. However, their allocative efficiency was remarkably low. These results advocate that reviewing technical efficiency alone does not provide adequate information about the efficiency of farmers in terms of other aspects, such as allocative efficiency.
The tubewell shareholders had noticeably lower allocative efficiency than the tubewell owners and water buyers, due to their higher cost of production. These findings suggest that policymakers should consider tailored policy interventions to improve the allocative efficiency of different groundwater user groups.
The allocative efficiency of wheat farmers decreased in line with the increasing capacity of their tubewells, being a shareholder, and use of a tractor operated tubewell. Based on these findings, it is suggested that instead of tractor-operated tubewells, farmers should be encouraged to install diesel tubewells of appropriate capacity according to their water depth and irrigation demands. Along with recommendations about crop management practices, the farmers should be provided with recommendations for optimal allocation of inputs according to the input prices. In this regard, the local extension staff, irrigation department, and on-farm water management offices should provide technical support and training on the economics of groundwater extraction to farmers and private drilling services so that they can select an appropriate tubewell system that minimises the cost of groundwater irrigation.
Overall, the research findings suggest that further research should empirically analyse the process of selecting tubewells to devise policy measures for the appropriate selection of tubewells. To investigate potential improvements in allocative efficiency, there is a need to conduct further study of the factors affecting farmers’ choices of tubewells, factors affecting their ownership status, and the associated difference in the cost of producing wheat.

Author Contributions

S.A. conceived the idea, collected, and analysed the data, and drafted the paper. N.S. substantially improved the flow and the general structure of the paper. D.J. provided guidance in the selection of analysis tools and strengthened the methodological framework of the paper. T.W.T. significantly contributed to the resubmission of the paper in terms of analysis and clarity.

Acknowledgments

The first author accredits the Higher Education Commission (HEC) Pakistan for supporting her Ph.D. study and the Asian Institute of Technology (AIT), Thailand for its fellowship. We are thankful to Clemens Grunbuhel and Yousre Badir for their helpful comments and suggestions in designing this study. We are also thankful to Farhad Zulfiqar for his comments and review of the paper and to all the survey respondents in this study for their time and participation in interviews.

Conflicts of Interest

The authors declare no conflict of interest. The founding sponsors had no role in the design of the study; in the collection, analyses, or interpretation of data; in the writing of the manuscript, and in the decision to publish the results.

Appendix A

Table A1. Pearson product moment coefficient of linear correlation across wheat input cost and total cost of wheat production used in the allocative efficiency analysis.
Total CostGroundwater CostLabour CostSeed CostBio-Fertiliser CostPhosphorus Fertiliser CostUrea Fertiliser CostHerbicide CostMachine Cost
Total cost (PKR/ha) 11
Groundwater cost (PKR/ha)−0.0701
(0.299)
Labour cost (PKR/ha)0.534 **0.230 **1
(0.000)(0.000)
Seed cost (PKR/ha)0.230 **0.0230.161 *1
(0.001)(0.734)(0.016)
Bio-fertiliser (PKR/ha)0.462 *−0.0440.330 *0.081
(0.000)(0.511)(0.000)(0.231)
Phosphorus fertiliser cost (PKR/ha)0.585 **−0.253 **0.138 *0.0080.0631
(0.000)(0.000)(0.039)(0.907)(0.347)
Urea fertiliser cost (PKR/ha)0.507 **−0.1080.194 **0.054−0.0120.483 **1
(0.000)(0.108)(0.004)(0.425)(0.861)(0.000)
Herbicide cost (PKR/ha)0.214 **−0.0630.169 *−0.0710.0070.1200.0071
(0.001)(0.348)(0.011)(0.293)(0.914)(0.072)(0.917)
Machine cost (PKR/ha)0.568 **0.0300.164 *0.083−0.021−0.0360.0580.0171
(0.000)(0.651)(0.014)(0.217)(0.759)(0.587)(0.384)(0.801)
Source: Derived from the survey data, 2015. The Pearson product moment coefficient was estimated by using SPSS software. The p-values are shown in the parentheses. * Correlation is significant at the 0.05 level (2-tailed). ** Correlation is significant at the 0.01 level (2-tailed). 1 PKR/ha = Pakistani rupees per hectare.

Appendix B

Table A2. Pearson product moment coefficient of linear correlation across continuous variables used in the tobit analysis.
Respondent’s AgeRespondent’s EducationFamily SizeTotal Farm AreaTubewell DepthCapacity of Tubewell
Respondent’s age (years)1
Respondent’s education (years)−0.159 *1
(0.017)
Family size (number)0.086−0.0941
(0.200)(0.159)
Total farm area (hectares)0.149 *0.0330.260 **1
(0.026)(0.619)(0.000)
Tubewell depth (metres)−0.019−0.0220.0370.281 **1
(0.774)(0.743)(0.584)(0.000)
Capacity of tubewell (cubic metres per hour)0.032−0.142 *0.200 **0.182 **0.332 **1
(0.629)(0.033)(0.003)(0.006)(0.000)
Source: Derived from the survey data, 2015. The Pearson product moment coefficient was estimated by using SPSS software. The p-values are shown in the parentheses. * Correlation is significant at the 0.05 level (2-tailed). ** Correlation is significant at the 0.01 level (2-tailed).

Appendix C

Table A3. Mean difference in continuous variables between the two categories (0 = no and 1 = yes) for each categorical variable, and its statistical significance: two-sample t-test.
Mean Difference (Mean for Category 1 (=yes) Minus Mean for Category 0 (=No), and the p-Value for the t-Test
Off-Farm IncomeSalinity PerceptionTubewell OwnerTubewell ShareholderWater BuyerDiesel TubewellElectric TubewellTractor-Operated Tubewell
Respondent’s Age (years)4.852 **2.078−2.1192.755−0.319−0.269−0.1000.687
(0.003)(0.204)(0.207)(0.152)(0.851)(0.869)(0.952)(0.759)
Respondent’s Education (years)0.9980.2221.621 *−0.916−0.8581.117−1.100−0.119
(0.123)(0.731)(0.028)(0.193)(0.205)(0.081)(0.093)(0.892)
Family size (number)1.222 *−0.3320.0521.584 *−1.520 **−1.280 **1.095 *0.434
(0.013)(0.503)(0.918)(0.013)(0.001)(0.009)(0.045)(0.524)
Total farm area (hectares)−1.235−0.5640.6003.446 **−3.817 **−2.675 **2.222 **1.030
(0.070)(0.412)(0.395)(0.000)(0.000)(0.000)(0.006)(0.273)
Tubewell depth (metres)−1.4111.185−2.801 **6.300 **−2.876 **−6.584 **6.026 **1.529
(0.180)(0.251)(0.007)(0.000)(0.009)(0.000)(0.000)(0.291)
Capacity of tubewell (cubic metres per hour)−3.390−3.310−0.47611.097 **−9.762 **−30.112 **13.856 **31.680 **
(0.256)(0.269)(0.888)(0.000)(0.002)(0.000)(0.000)(0.000)
Source: Derived from the survey data, 2015. The analysis was conducted using SPSS software. The values without parentheses show the difference in mean of a continuous variable which is calculated by subtracting mean for category 0 (for No) from category 1 (for Yes). The p-values are shown in the parentheses. * Correlation is significant at the 0.01 level (2-tailed). ** Correlation is significant at the 0.05 level (2-tailed).

Appendix D

Table A4. Association between binary variables included in the tobit analysis: Chi-square test statistic and p-value.
Tubewell OwnersTubewell ShareholdersWater BuyersDiesel TubewellElectric TubewellTractor-Operated TubewellSalinity PerceptionOff-Farm Income
(1 = yes; 0 = no)(1 = yes; 0 = no)(1 = yes; 0 = no)(1 = yes; 0 = no)(1 = yes; 0 = no)(1 = yes; 0 = no)(1 = yes; 0 = no)(1 = yes; 0 = no)
Tubewell ownersNA 1
(1 = yes; 0 = no)
Tubewell shareholdersNANA
(1 = yes; 0 = no)
Water buyers NANANA
(1 = yes; 0 = no)
Diesel tubewell27.001 **
(0.000)
76.560 **
(0.000)
9.512 **
(0.002)
NA 2
(1 = yes; 0 = no)
Electric tubewell85.349 **144.200 **4.289 *NANA
(1 = yes; 0 = no)(0.000)(0.000)(0.038)
Tractor-operated tubewell27.815 **16.958 **2.103NANANA
(1 = yes; 0 = no)(0.000)(0.000)(0.147)
Salinity perception7.513 **1.9642.1530.6221.5100.322
(1 = yes; 0 = no)(0.006)(0.161)(0.142)(0.430)(0.219)(0.570)
Off-farm income0.0772.9531.8736.337 *4.373 *0.4170.000
(1 = yes; 0 = no)(0.782)(0.086)(0.171)(0.012)(0.037)(0.518)(0.992)
Source: Derived from the survey data, 2015. The analysis was conducted using SPSS software. The values in the parentheses show p-value. NA = Not applicable. 1 Tubewell owners, tubewell shareholders, and water buyers are mutually exclusive variables, and their correlation coefficient is not calculated. 2 Diesel tubewell, electric tubewell, and tractor-operated tubewell are mutually exclusive categories, and therefore their correlation coefficient is not calculated. * Correlation is significant at the 0.05 level (2-tailed); ** Correlation is significant at the 0.01 level (2-tailed).

References

  1. Konikow, L.; Custodio, E.; Villholth, K.; van der Gun, J.; Klingbeil, R. Food Security & Groundwater. Strategic Overview Series; International Association of Hydrogeologists: Reading, UK, 2015. [Google Scholar]
  2. Siebert, S.; Burke, J.; Faures, J.M.; Frenken, K.; Hoogeveen, J.; Döll, P.; Portmann, F.T. Groundwater use for irrigation—A global inventory. Hydrol. Earth Syst. Sci. 2010, 14, 1863–1880. [Google Scholar] [CrossRef] [Green Version]
  3. FAO. Indus River Basin; FAO: Rome, Italy, 2011. [Google Scholar]
  4. Qureshi, A.S. Improving food security and livelihood resilience through groundwater management in Pakistan. Glob. Adv. Res. J. Agric. Sci. 2015, 4, 687–710. [Google Scholar]
  5. Ashfaq, M.; Akram, M.; Baig, I.; Saghir, A. Impact of ground water on wheat production in District Jhang, Punjab, Pakistan. Sarhad J. Agric. 2009, 25, 121–125. [Google Scholar]
  6. Meinzen-Dick, R.S. Performance of groundwater markets in Pakistan. Pak. Dev. Rev. 1993, 32, 833–845. [Google Scholar]
  7. Williams, D.; Raza, A. Pakistan: Grain and Feed Annual; USDA Foreign Agricultural Service: Washington, DC, USA, 2017.
  8. Government of Pakistan. Pakistan Economic Survey: 2014–15; Government of Pakistan: Islamabad, Pakistan, 2015.
  9. Meinzen-Dick, R.S.; Sullins, M. Water Markets in Pakistan: Participation and Productivity; International Food Policy Research Institute (IFPRI): Washington, DC, USA, 1994. [Google Scholar]
  10. Shah, T. The groundwater economy of South Asia: An assessment of size, significance and socio-ecological impacts. In The Agricultural Groundwater Revolution: Opportunities and Threats to Development; Giordano, M., Villholth, K.G., Eds.; International Water Management Institute: Colombo, Sri Lanka, 2007; pp. 7–36. [Google Scholar]
  11. Qureshi, A.S.; McCornick, P.G.; Sarwar, A.; Sharma, B.R. Challenges and prospects of sustainable groundwater management in the Indus Basin, Pakistan. Water Resour. Manag. 2010, 24, 1551–1569. [Google Scholar] [CrossRef]
  12. Watto, M.A.; Mugera, A.W. Groundwater depletion in the Indus Plains of Pakistan: Imperatives, repercussions and management issues. Int. J. River Basin Manag. 2016, 14, 447–458. [Google Scholar] [CrossRef]
  13. Bashir, M.; Khan, D. An analysis of allocative efficiency of wheat growers in Northern Pakistan. Pak. Dev. Rev. 2005, 44, 643–657. [Google Scholar]
  14. Coelli, T.; Rao, D.S.P.; O’Donnell, C.J.; Battese, G.E. An Introduction to Efficiency and Productivity Analysis; Springer: New York, NY, USA, 2005. [Google Scholar]
  15. Coelli, T.; Rahman, S.; Thirtle, C. Technical, allocative, cost and scale efficiencies in Bangladesh rice cultivation: A non-parametric approach. J. Agric. Econ. 2002, 53, 607–626. [Google Scholar] [CrossRef]
  16. Afzal, N.; Ahmad, S. Agricultural input use efficiency in Pakistan: Key issues and reform areas. Manag. Nat. Resour. Sustain. Future Agric. Res. Brief. 2009, 1, 1–12. [Google Scholar]
  17. Watto, M.A.; Mugera, A.W. Wheat farming system performance and irrigation efficiency in Pakistan: A bootstrapped metafrontier approach. Int. Trans. Oper. Res. 2016. [Google Scholar] [CrossRef]
  18. Fatima, H.; Khan, M.A. Influence of wheat varieties on technical efficiency and production of wheat crop in Pakistan (In selected area of Punjab). Sarhad J. Agric. 2015, 31, 114–122. [Google Scholar] [CrossRef]
  19. Mekonnen, D.; Siddiqi, A.; Ringler, C. Drivers of groundwater use and technical efficiency of groundwater, canal water, and conjunctive use in Pakistan’s Indus irrigation system. Int. J. Water Resour. Dev. 2015, 32, 459–476. [Google Scholar] [CrossRef]
  20. Meinzen-Dick, R.S. Public, private, and shared water: Groundwater markets and groundwater access in Pakistan. In Negotiating Water Rights; Bruns, B.R., Meinzen-Dick, R.S., Eds.; Intermediate Technology Publications: London, UK, 1996. [Google Scholar]
  21. Malik, A.K.; Junaid, M.; Tiwari, R.; Kumar, M.D. Towards Evolving Groundwater Rights: The Case of Shared Well Irrigation in Punjab; Institute of Rural Management Anand: Anand, India, 2008. [Google Scholar]
  22. Meinzen-Dick, R.S. Groundwater Markets in Pakistan: Participation and Productivity; International Food Policy Research Institute: Washington, DC, USA, 1996. [Google Scholar]
  23. Watto, M.A. The Economics of Groundwater Irrigation in the Indus Basin, Pakistan: Tube-Well Adoption, Technical and Irrigation Water Efficiency and Optimal Allocation; The University of Western Australia: Crawley, Australia, 2015. [Google Scholar]
  24. Pearson Education Company Explaining Different Concepts of Efficiency. Available online: http://wps.prenhall.com/wps/media/objects/1308/1340291/ragan_econ_11ce_Ch08_topic.pdf (accessed on 12 October 2017).
  25. Tang, J.; Folmer, H.; Xue, J. Technical and allocative efficiency of irrigation water use in the Guanzhong Plain, China. Food Policy 2015, 50, 43–52. [Google Scholar] [CrossRef]
  26. Thabethe, L.; Mungatana, E.; Labuschange, M. Estimation of Technical, Economic and Allocative Efficiencies in Sugarcane Production in South Africa: A Case of Mpumalanga Growers. J. Econ. Sustain. Dev. 2014, 5, 86–96. [Google Scholar]
  27. Ouattara, W. Economic efficiency analysis in Côte d’Ivoire. Am. J. Econ. 2012, 2, 37–46. [Google Scholar] [CrossRef]
  28. Frija, A.; Chebil, A.; Speelman, S.; Buysse, J.; Van Huylenbroeck, G. Water use and technical efficiencies in horticultural greenhouses in Tunisia. Agric. Water Manag. 2009, 96, 1509–1516. [Google Scholar] [CrossRef]
  29. Farrell, M.J. The measurement of productive efficiency. J. R. Stat. Soc. 1957, 120, 253–290. [Google Scholar] [CrossRef]
  30. Varghese, K.S.; Veettil, P.C.; Buysse, J.; Speelman, S.; Frija, A.; Van Huylenbroeck, G. Effect of water scarcity on groundwater use efficiency in the rice sector of Karnataka: A case study. WIT Trans. Ecol. Environ. 2011, 145, 783–791. [Google Scholar]
  31. Watto, M.A.; Mugera, A.W. Measuring production and irrigation efficiencies of rice farms: Evidence from the Punjab Province, Pakistan. Asian Econ. J. 2014, 28, 301–322. [Google Scholar] [CrossRef]
  32. Zhang, Z.; Chen, X.; Heck, P. Emergy-based regional socio-economic metabolism analysis: An application of data envelopment analysis and decomposition analysis. Sustainability 2014, 6, 8618–8638. [Google Scholar] [CrossRef]
  33. Carlucci, F.; Cirà, A.; Coccorese, P. Measuring and explaining airport efficiency and sustainability: Evidence from Italy. Sustainability 2018, 10, 400. [Google Scholar] [CrossRef]
  34. Yang, W.; Li, L. Analysis of Total Factor Efficiency of Water Resource and Energy in China: A Study Based on DEA-SBM Model. Sustainability 2017, 9, 1316. [Google Scholar] [CrossRef]
  35. Watto, M.A.; Mugera, A.W. Measuring groundwater irrigation efficiency in Pakistan: A DEA approach using the sub-vector and slack-based models. In Proceedings of the 57th Annual AARES Conference, Sydney, Australia, 5–8 February 2013; pp. 4–9. [Google Scholar]
  36. Manjunatha, A.V.; Speelman, S.; Chandrakanth, M.G.; Van Huylenbroeck, G. Impact of groundwater markets in India on water use efficiency: A data envelopment analysis approach. J. Environ. Manag. 2011, 92, 2924–2929. [Google Scholar] [CrossRef] [PubMed]
  37. Pang, J.; Chen, X.; Zhang, Z.; Li, H. Measuring eco-efficiency of agriculture in China. Sustainability 2016, 8, 398. [Google Scholar] [CrossRef]
  38. Xia, B.; Dong, S.; Ba, D.; Li, Y.; Li, F.; Liu, H.; Li, Z.; Zhao, M. Research on the Spatial Differentiation and Driving Factors of Tourism Enterprises’ Efficiency: Chinese Scenic Spots, Travel Agencies, and Hotels. Sustainability 2018, 10, 901. [Google Scholar] [CrossRef]
  39. Zhang, A.; Li, A.; Gao, Y. Social sustainability assessment across provinces in China: An analysis of combining intermediate approach with Data Envelopment Analysis (DEA) window analysis. Sustainability 2018, 10, 732. [Google Scholar] [CrossRef]
  40. Latruffe, L.; Fogarasi, J.; Desjeux, Y. Efficiency, productivity and technology comparison for farms in Central and Western Europe: The case of field crop and dairy farming in Hungary and France. Econ. Syst. 2012, 36, 264–278. [Google Scholar] [CrossRef]
  41. Zulfiqar, F.; Datta, A.; Thapa, G.B. Determinants and resource use efficiency of “better cotton”: An innovative cleaner production alternative. J. Clean. Prod. 2017, 166, 1372–1380. [Google Scholar] [CrossRef]
  42. Tipi, T.; Yildiz, N.; Nargeleçekenler, M.; Çetin, B. Measuring the technical efficiency and determinants of efficiency of rice (Oryza sativa) farms in marmara region, Turkey. N. Z. J. Crop Hortic. Sci. 2009, 37, 121–129. [Google Scholar] [CrossRef]
  43. Banker, R.D.; Charnes, A.; Cooper, W.W. Some models for estimating technical and scale inefficiencies in Data Envelopment Analysis. Manag. Sci. 1984, 30, 1078–1092. [Google Scholar] [CrossRef]
  44. Dhungana, B.R.; Nuthall, P.L.; Nartea, G. V Measuring the economic inefficiency of Nepalese rice farms using data envelopment analysis. Aust. J. Agric. Resour. Econ. 2004, 48, 347–369. [Google Scholar] [CrossRef]
  45. Kounetas, K.; Anastasiou, A.; Mitropoulos, P.; Mitropoulos, I. Departmental efficiency differences within a Greek University: An application of a DEA and Tobit analysis. Int. Trans. Oper. Res. 2011, 18, 545–559. [Google Scholar] [CrossRef]
  46. Wadud, A.; White, B. Farm household efficiency in Bangladesh: A comparison of stochastic frontier and DEA methods. Appl. Econ. 2000, 32, 1665–1673. [Google Scholar] [CrossRef]
  47. Verbeek, M. A Guide to Modern Econometrics; John Wiley & Sons, Ltd.: Rotterdam, The Netherlands, 2008. [Google Scholar]
  48. Crop Reporting Service-Punjab. Crop Bulletin; Crop Reporting Service-Punjab: Lahore, Pakistan, 2015; Volume 2.
  49. Johnson, R. Private Tube Well Development in Pakistan’s Punjab: Review of Past Public Programmes/Policies and Relevant Research; International Water Management Institute: Colombo, Sri Lanka, 1989. [Google Scholar]
  50. Punjab Bureau of Statistics. Punjab Development Statistics; Punjab Bureau of Statistics: Lahore, Pakistan, 2013.
  51. Eyhorn, F.; Mäder, P.; Ramakrishnan, M. The Impact of Organic Cotton Farming on the Livelihoods of Smallholders; Research Institute of Organic Agriculture: Ackerstrasse, Switzerland, 2005. [Google Scholar]
  52. Srivastava, S.K.; Kumar, R.; Singh, R.P. Extent of Groundwater Extraction and Irrigation Efficiency on Farms under Different Water-market Regimes in Central Uttar Pradesh. Agric. Econ. Res. Rev. 2009, 22, 87–97. [Google Scholar]
  53. Drake, L.; Simper, R. Productivity estimation and the size-efficiency relationship in English and Welsh police forces. Int. Rev. Law Econ. 2000, 20, 53–73. [Google Scholar] [CrossRef]
  54. Hutchings, M.R.; Harris, S. Effects of farm management practices on cattle grazing behaviour and the potential for transmission of bovine tuberculosis from badgers to cattle. Vet. J. 1997, 153, 149–162. [Google Scholar] [CrossRef]
  55. Aregay, F.A.; Minjuan, Z. Impact of Irrigation on Fertilizer Use Decision of Farmers in China: A Case Study in Weihe River Basin. J. Sustain. Dev. 2012, 5, 74–82. [Google Scholar] [CrossRef]
  56. Gill, J. Assessing Technical Efficiency of Wheat Farmers in Pakistan: A Comparison to Prior Productivity Analyses of Pakistani Agriculture. Master’s Thesis, Michigan State University, East Lansing, MI, USA, 2015. [Google Scholar]
  57. Sarker, D.; De, S. High technical efficiency of farms in two different agricultural lands: A study under deterministic production frontier approach. Indian J. Agric. Econ. 2004, 2, 197–208. [Google Scholar]
  58. Qureshi, A.S.; Shah, T.; Akhtar, M. The Groundwater Economy of Pakistan; Pakistan Country Series No. 19; International Water Management Institute: Lahore, Pakistan, 2003. [Google Scholar]
  59. Malik, S.M.; Strosser, P. Management of Private Tubewells in a Conjunctive Use Environment; International Water Management Institute: Colombo, Sri Lanka, 1993. [Google Scholar]
  60. Ahmad, S. Growth of Agricultural Tubewells and State of Energy in Pakistan—Is Subsidy a Sustainable Option for Helping Farmers? Pakistan Water Gateway: Islamabad, Pakistan, 2007; Volume 3. [Google Scholar]
  61. Strosser, P.; Kuper, M. Water Markets in the Fordwah/Eastren Sadiqia Area: An Answer to Perceived Deficiencies in Canal Water Supplies? International Water Management Institute: Colombo, Sri Lanka, 1994. [Google Scholar]
Figure 1. Map of Faisalabad district in Punjab, Pakistan.
Sustainability 10 01619 g001
Table 1. Definition and measurement of the variables.
VariablesUnitDefinition
Wheat yield wKilograms per hectareThe quantity of wheat harvested per hectare
Wheat area z1HectaresThe area under wheat cultivation
Seed rate z2Kilograms per hectareThe quantity of wheat seed used per hectare
Labour z3Person-h per hectareNumber of labour h used per hectare (including both family and hired labour)
Nitrogen fertiliser z4Kilograms per hectareThe quantity of nitrogen fertiliser used per hectare
Phosphorous fertiliser z5Kilograms per hectareThe quantity of phosphorous fertiliser used per hectare
Bio-fertiliser z6Kilograms per hectareThe quantity of farmyard manure used per hectare
Herbicide z7Number of applications per hectareThe frequency of herbicide use per hectare
Groundwater irrigation z8Cubic metres per hectareThe volume of groundwater applied per hectare
Machinery z9Machine-h per hectareNumber of machine h used per hectare for land preparation
Farm and Farmer Characteristics
Respondent’s age t1YearsAge of the respondent
Respondent’s education t2Years of schoolingEducation of the respondent
Farm area t3HectaresTotal farm area operated by the household
Family size t4Number of personsNumber of persons dependent on the income of the farm household
Tubewell depth t5MetresThe depth of the borehole of the tubewell
Capacity of tubewell t6Cubic metres per hourThe groundwater discharge capacity of the tubewell
Electrical tubewell 1 t7binary1 if the farmer uses groundwater from an electric tubewell, 0 otherwise
Tractor-operated tubewell 1 t8binary1 if the farmer uses groundwater from a tractor-operated tubewell, 0 otherwise
Off-farm income t9binary1 if the household has an off-farm income source, 0 otherwise
Salinity perception t10binary1 if the farmer perceives that groundwater is saline, 0 otherwise
1 The diesel tubewells were used as the base category for comparing the effects of variables t7 and t8 on allocative efficiency.
Table 2. Descriptive and inferential statistics of quantity and costs of inputs to wheat production (included in the input-oriented DEA model): mean and its difference among tubewell owners, tubewell shareholders, and water buyers.
VariableUnitTubewell OwnersTubewell ShareholdersWater Buyers
(n = 84)(n = 65)(n = 75)
Quantities of Inputs and Output
Wheat area(ha)3.01 (b,c)4.50 (a,c)1.63 (a,b)
Groundwater irrigation(m3/ha)1252 (b,c)1549 (a,c)1000 (a,b)
Seed rate(kg/ha)119.4 (b)127.2 (a,c)118.6 (b)
Bio-fertiliser(kg/ha)12,01213,38511,857
Labour(h/ha)165.4 (b)200.0 (a,c)172.1 (b)
Machinery(h/ha)23.60 (b)27.64 (a,c)23.42 (b)
Nitrogen fertiliser(kg/ha)162 (b,c)140 (a)141 (a)
Phosphorous fertiliser(kg/ha)90 (b,c)74 (a)71 (a)
Weedicide applications(number/ha)1.201.041.06
Wheat output(kg/ha)4374.04254.44172.5
Cost of Inputs
Groundwater irrigation cost(PKR/ha)2618 (b,c)2425 (a,c)2544 (a,b)
Seed cost(PKR/ha)4058.8 (b)5152.2 (a,c)4066.2 (b)
Bio-fertiliser cost(PKR/ha)8427.19146.97929.0
Labour wage(PKR/ha)10,341 (b)12,375 (a,c)10,741 (b)
Machinery cost(PKR/ha)137,712114,15213,883
Nitrogen cost(PKR/ha)10,460 (b,c)9155.4 (a)9362.6 (a)
Phosphorous cost(PKR/ha)15,206 (b,c)12,425 (a)12,012 (a)
Herbicide cost(PKR/ha)3037.73396.72705.1
Total cost(PKR/ha)66,425 (c)66,800 (c)62,736 (a,b)
Source: Derived from the survey data, 2015. The Tukey’s HSD test was performed using SPSS software. Note: The small letters a, b, and c represent tubewell owners, shareholders, and water buyers respectively. When a letter appears with a value, it indicates a significant mean difference between the groups. For Tukey’s HSD test, the significance level was kept at 0.05. kg = kilograms; ha = hectares; m3 = cubic metres; PKR = Pakistani rupees.
Table 3. Pearson product moment coefficient of linear correlations across wheat inputs and wheat yield used in the efficiency analysis.
Wheat YieldGroundwater IrrigationLabourSeed RateBio-FertiliserPhosphorous FertiliserNitrogen FertiliserHerbicideMachinery
Wheat Yield1
Groundwater Irrigation0.173 **1
(0.009)
Labour−0.008−0.0661
(0.901)(0.327)
Seed Rate0.185 **−0.0210.135 *1
(0.006)(0.757)(0.044)
Bio-Fertiliser0.0980.0340.389 **0.0581
(0.144)(0.615)(0.000)(0.386)
Phosphorous Fertiliser0.265 **0.1120.138 *0.0650.0611
(0.000)(0.096)(0.039)(0.332)(0.362)
Nitrogen Fertiliser0.228 **0.135 *0.194 **−0.0160.0030.483 **1
(0.001)(0.043)(0.004)(0.811)(0.968)(0.000)
Herbicide0.041−0.0810.101−0.270 **−0.0020.0650.1211
(0.548)(0.228)(0.131)(0.000)(0.977)(0.329)(0.072)
Machinery0.181 **0.0080.289 **0.136 *0.0040.1140.109−0.0721
(0.007)(0.906)(0.000)(0.041)(0.949)(0.088)(0.103)(0.286)
Source: Derived from the survey data, 2015. The Pearson product moment coefficient was estimated using SPSS software version 16. The values in parenthesis show the p-value. * Correlation is significant at the 0.05 level (2-tailed). ** Correlation is significant at the 0.01 level (2-tailed).
Table 4. Descriptive statistics of socio-economic characteristics and groundwater irrigation attributes of the tubewell owners, tubewell shareholders, and water buyers (included as predictors in the two-limit tobit regression).
CharacteristicTubewell OwnersTubewell ShareholdersWater Buyers
(n = 84)(n = 65)(n = 75)
MeanSD1MeanSDMeanSD
Respondent’s age (years)45.411.348.713.546.511.8
Respondent’s education (years)10.06.08.04.18.03.4
Total farm area (hectares)5.33.27.47.92.41.6
Family size (number)9.03.410.04.67.02.7
Tubewell depth (metres)137.722.6158.226.2137.223.7
Capacity of tubewell (cubic metres per hour)143.927.3152.08.2137.722.3
Other Characteristics
Farms using diesel tubewells (%)68060
Farms using electrical tubewells (%)010030
Farms using tractor-operated tubewells (%)32010
Households having off-farm income (%)554560
Salinity in water (0 = no, 1 = yes) (% of Yes)446363
Source: Derived from the survey data, 2015. 1 SD = Standard Deviation.
Table 5. Distribution of technical and groundwater use efficiency of the tubewell owners, tubewell shareholders, and water buyers.
Efficiency ScoresTechnical Efficiency (%)Groundwater Use Efficiency (%)
Tubewell OwnersTubewell ShareholdersWater BuyersTubewell OwnersTubewell ShareholdersWater Buyers
(n = 84)(n = 65)(n = 75)(n = 84)(n = 65)(n = 75)
(%)(%)(%)(%)(%)(%)
<0.40000001
0.41–0.50000101
0.51–0.60000121
0.61–0.70000421
0.71–0.80000203
0.81–0.9000124613
0.91–0.99252923192317
1.00757165696861
Total100100100100100100
Mean0.990.990.970.970.960.94
SD0.020.030.050.110.080.12
Source: Derived from the survey data, 2015. The analysis was conducted using the “Benchmarking” Package in R software.
Table 6. Distribution of allocative efficiency scores of the tubewell owners, tubewell shareholders, and water buyers.
Efficiency ScoresTubewell OwnersTubewell ShareholdersWater Buyers
(n = 84)(n = 65)(n = 75)
(%)(%)(%)
<0.40060
0.41–0.501375
0.51–0.60192924
0.61–0.70291427
0.71–0.8027324
0.81–0.901937
0.91–0.99139
1.00454
Total100100100
Mean0.700.560.69
SD0.120.160.14
Source: Derived from the survey data, 2015. The analysis was conducted using the “Benchmarking” Package in R software.
Table 7. Factors affecting the allocative efficiency of wheat farmers: two-limit tobit regression.
VariablesModel 1Model 2Model 3Model 4
Respondent’s age (years)−0.0005−0.00050.0014−0.0006
(0.0008)(0.0008)
Respondent’s education (years)0.00140.0014−0.01360.0015
(0.0019)(0.0019)(0.0183)(0.0019)
Total farm area (hectares)−0.0029−0.0029−0.0028−0.0026
(0.0019)(0.0019)(0.002)(0.0019)
Family size (number of persons)0.00260.00260.00260.0027
(0.0026)(0.0026)(0.0026)(0.0026)
Tubewell depth (metres)0.0001---
(0.0013)
Capacity of tubewell (cubic metres per hour)−0.0012 **−0.0012 **−0.0014 **−0.0014 **
(0.0006)(0.0006)
Off-farm income (0 = no, 1 = yes)0.01760.01760.01680.0165
(0.0192)(0.0192)(0.0191)(0.0191)
Electric tubewell (0 = no, 1 = yes)0.02020.0204--
(0.0391)(0.039)
Tractor-operated tubewell (0 = no, 1 = yes)−0.0722 *−0.0722 *−0.0798 **−0.0761 **
(0.0366)(0.0365)(0.0335)(0.0327)
Tubewell shareholders (0 = no, 1 = yes)−0.1836 ***−0.1834 ***−0.1667 ***−0.1610 ***
(0.0421)(0.0419)(0.027)(0.0243)
Water buyer (0 = no, 1 = yes)−0.0167−0.0166−0.0110-
(0.0253)(0.0253)(0.0229)
Salinity perception (0 = no, 1 = yes)−0.0138−0.0137−0.0006−0.0149
(0.0184)(0.0183)(0.0008)(0.0181)
Constant0.5545 ***0.5562 ***0.5405 ***0.5359 ***
(0.1007)(0.092)
Log likelihood135.943135.805135.689135.400
Likelihood ratio test59.0279 ***59.277 ***59.004 ***58.771 ***
Source: Derived from the survey data, 2015. The analysis was conducted using the “VGAM” Package in R software. The values in parentheses are the standard error. Note: * Significant at 10%, ** Significance at 5%, *** Significant at 1%.

