Neuroeconomics Meets Aquaponics: An Eye-tracking Pilot Study on Perception of Information about Aquaponics

Faculty of Agriculture, South Westphalia University of Applied Sciences, 59494 Soest, Germany
*
Author to whom correspondence should be addressed.
Sustainability 2019, 11(13), 3580; https://0-doi-org.brum.beds.ac.uk/10.3390/su11133580
Submission received: 31 May 2019
/
Revised: 24 June 2019
/
Accepted: 25 June 2019
/
Published: 28 June 2019
(This article belongs to the Special Issue Motivations, Drivers, and Barriers to the Development of Sustainable Agri-Food Systems and Consumption Patterns)
Abstract
:Aquaponics is an innovative food production method that combines the production of aquatic organisms with plant production. This can have environmental advantages such as reducing land conversion and resource input and waste output through nutrient cycling. To support the dissemination of aquaponics, key stakeholders need to be appropriately informed about this production method, an aspect that has received little attention so far. In this pilot study, visual perception of information about aquaponics was explored using eye tracking combined with a questionnaire. The results show that people distinguish between aquaponics variants when evaluating aquaponics. A production system with a more natural appearance is preferred. Allocation of visual attention is linked to the specific information content and to the assessment of the naturalness of aquaponics production. The results of the present study could form a basis for further research, not only to make information about food production systems more appropriate but also to develop food production systems in a way that people become more aware of the sustainability aspects of production methods and its products.
1. Introduction
Sustainable food production is one of the key challenges of the future. The world’s population, estimated at 7.7 billion in 2019, continues to grow at an annual rate of 1.1 percent. It is estimated that the earth will be populated by 9.7 billion people in 2050 and by roughly 11 billion at the end of the century. The continuing increase in global population in conjunction with a continuing rise in prosperity is leading to an increasing demand for animal products [1]. In this context, the consumption of meat, dairy and fish products is particularly criticised due to high environmental impacts [2,3]. However, people with high consumption levels are rather reluctant to embrace alternatives that ban or replace animal products in their meal—but rather accept alternatives such as moderation of animal product consumption or products from more sustainable production systems [4].
An innovative food production method that could potentially contribute to both, populations’ demand for animal products and to sustainable consumption patterns, is aquaponics. Aquaponics is the combined production of aquatic organisms and plants, where more than 50 percent of the nutrients for optimal plant growth derive from waste originating from feeding the aquatic organisms [5]. The aquatic organisms are normally fish that are an excellent source of high-quality animal protein, essential fatty acids and micronutrients in human nutrition [6]. The aquaponics-grown plants, such as herbs and leafy or fruiting vegetables [7], further contribute to a healthy human diet [8]. In addition, the combined fish and plant production of aquaponics is more environmentally friendly than separate production as it reduces the input of resources and the output of waste, and avoids the use of antibiotics and pesticides [9,10]. Further benefits are the potential to take pressure off land conversion if areas that had already been sealed are used (e.g., brownfields) and the opportunity of food production by urban residents [11].
Despite these advantages, aquaponics has not yet been adopted on a wider scale and is still largely unknown in Europe [12]. Thus, some authors emphasise the importance of generating comprehensive knowledge about this production method [12,13]. Yet, developing appropriate communication strategies have so far received only a little attention in all areas of aquacultural production [14]. It is also known that innovative food production methods can fail, or diffuse very slowly, if they do not adequately address societal mainstream values or constraints perceived by food producers [15]. Therefore, it is important for a successful dissemination of aquaponics not only to inform potential key stakeholders but also to understand their concerns about this innovation [15,16].
In research, the perception of picture, video and text information about food production methods is increasingly analysed to gain knowledge about stakeholders’ requirements, concerns or criticism regarding specific food production methods. These studies repeatedly show the public’s doubts about animal welfare in intensive farming systems and their criticism of the lack of naturalness in agricultural production [17,18,19,20,21,22,23]. Although aquaponics is a potentially sustainable method of food production based on natural cycles, similar concerns seem to exist. Laypersons are particularly critical of commercial aquaponics farms, as they are concerned about the artificial appearance of the systems, the soilless crop-production, potential health risks associated with wastewater use, and fish welfare. Small aquaponics farms with a more natural appearance seem more likely to be accepted [24,25].
However, to the authors’ knowledge, only Busch et al. [22] have explicitly analysed visual attention related to information about farming practices. This is astonishing, as it is well known that visual attention to information content is linked to the decision about the object to which the information is provided. Due to several biases, decision makers often ignore parts of information that are available to them. This challenges the way information about food production systems is presented [26]. In low involvement situations, choices might be affected by an affective response due to the visual characteristics of the information, e.g., visual salience, surface size, position and emotional elements [26,27]. These factors are often referred to as bottom-up factors leading to stimulus-driven attention [28]. In high involvement situations, in-depth processing of the information takes place [27] and top-down factors influence gaze behaviour. Decision goals, pre-existing preferences, interests or task instructions then drive visual attention (goal-driven attention) [29,30].
Visual attention occurs when a person physically move the eyes towards a visual stimulus [27]. These eye movements are mainly characterised by fixations and saccades. Saccades are rapid eye movements between fixations to move the gaze from one point to another. During fixations, the eyes are relatively stationary [31], and information is processed during this time [32]. Eye trackers can record these eye movements and thus enable objective measurements of allocation of visual attention. Since eye tracking technology is becoming less expensive and easier to use, it is increasingly applied in different fields of research, including analysing the effects of information on decision making [26,27,33]. Eye tracking can help to analyse the effect of attention on information processing, preference, choice behaviour and valuation [27], in particular when used together with other methods of empirical social research, such as ‘think aloud’ or personal interviews [28]. Related to information about innovative food production methods such as aquaponics, eye tracking could help to better understand obstacles and drivers to the adoption of this production method and its products, and to optimise communication to key stakeholders.
The aim of the present pilot study was, therefore, to explore visual perception of information about aquaponics. Eye tracking, combined with a questionnaire, was used to reveal possible relationships between visual attention to specific information content and assessment of this production method. The results could form a basis for further research, not only to make information about food production systems more appropriate but also to develop food production systems in a way that people become more aware of the sustainability aspects of production methods and its products.
2. Materials and Methods
2.1. Sample Characteristics
The experiment was carried out at the eye tracking laboratory of the South Westphalia University of Applied Sciences. Eighteen adults (10 female, 8 male) aged from 20 to 47 years (M = 24.8 years; SD = 6.7) voluntarily participated in the study. All participants were either students (7 female, 7 male) or staff members (3 female, 1 male) of the department of agriculture of the university. This implies that the participants were familiar with agriculture due to their professional background.
2.2. Eye Tracking
2.2.1. Stimuli
To examine the perception of information about aquaponics, a virtual three-page flyer was created. Each page was presented as a visual stimulus (Figure A1). The first page of the flyer, shown as the first stimulus, contained information on the general functioning of recirculating aquaponics systems to educate all participants about how aquaponics works. The two following pages provided picture and text information about two fictional aquaponics farms. The second page, which served as the second stimulus, described AquaPonTec (AT) as a modern high-tech farm producing high-quality food and providing optimal conditions for fish growth. The third page, which was used as the third stimulus, characterised AquaNatura (AN) as a farm that values naturalness and offers the fish a pleasant environment and enough space to behave naturally. The second and third stimulus were designed in the same way: Three pictures depicting the farm building, the aquaculture and the hydroponics production, were placed on the left side of each page. On the right side, three text sections provided information on farm philosophy, aquaculture and hydroponics production (for detailed English translation see Appendix A).
2.2.2. Procedure
A remote eye-tracker (SMI RED, Senso Motoric Instruments GmbH, Germany) was used to record the participants’ gaze behaviour with a sampling rate of 250 Hz. Infrared illumination and camera of the device were located beneath a 19” computer screen. At this screen, the visual stimuli were presented using the stimulus presentation software SMI Experiment Center™ (SensoMotoric Instruments GmbH, Teltow, Germany).
To run the eye tracking experiment, the participants were seated on a chair in front of the computer screen at a distance of approximately 60 to 70 centimetres. They were able to move their heads freely, allowing them to look at the screen in a largely natural way. The experiment started with a 9-point calibration to estimate the individual geometric characteristics of the eyes as the basis for an accurate gaze point calculation. After that, the following instruction was presented at the screen as long as the respective participant needed for reading the text: ‘Please imagine the following: You are a visitor at a food and agriculture exhibition. Information about aquaponics is available at one of the stands. The three-page flyer provides graphical information about the basic functionality of aquaponics on the first page. On the next two pages, one farm each presents itself. Both farms use aquaponics systems to produce their products. These three pages of the flyer you will see hereafter. Please have a look at these pages.’
Following this instruction, the first stimulus was presented for 25 s. Then the second and third stimulus were displayed for 50 s each. Each participant received all stimuli in the same order.
2.2.3. Measured Values
The gaze behaviour was analysed based on defining areas of interest (AOIs). AOIs are certain regions of a visual stimulus selected with a software-tool. Defining AOIs allows extracting eye tracking metrics specifically for these regions of interest [34]. Using the software SMI BeGazeTM (SensoMotoric Instruments GmbH, Germany), each picture of the second and third stimulus was defined as an AOI (picture AOI): ‘Building’, ‘Aquaculture’, ‘Hydroponics’. The same applied to each text section (text AOI): ‘Farm’, ‘Aquaculture’, ‘Hydroponics’. A fish tank window, through which the fish could be seen vaguely, was defined as an additional AOI in the third stimulus (see Figure 1).
The following AOI events, the software calculates by default, were used to describe the visual perception of the stimuli:
- Fixation count: Number of fixations of a participant inside an AOI
- Fixation time: Duration of all fixations of a participant inside an AOI
- Average fixation duration: Average duration of a single fixation within an AOI (Fixation time divided by fixation count)
The eye tracking data for each AOI were generated with the default settings of SMI BeGazeTM. The software works in high-speed settings (more than 200 Hz) with a velocity based algorithm that first searches for saccade events. Blinks and fixations are derived from the primary saccade events. The minimum duration of a fixation in this mode is pre-set to 50 milliseconds [38].
2.3. Questionnaire
Immediately after the eye tracking experiment, participants answered a questionnaire on a tablet PC. First, participants were asked about their associations with the farms shown. They were able to point out five key points for each farm.
Subsequently, the participants could indicate whether they had missed any information. If they had answered yes, they were asked what information was missing. The answers to the two questions mentioned above were used to create a new dichotomous variable. This variable recorded whether a participant had declared in one or both questions that information about the fish was missing (information was missing = 1; information was not missing = 0).
Then, the participants were asked about their attitudes towards aquaponics in general with four items (cf. Figure 3). Using six-point Likert scales, respondents rated whether they would reject or accept the central message of each item.
To determine the participants’ preferences towards the concrete design of aquaponics variants, they should indicate which type of farm they would choose in relation to seven questions (cf. Figure 4). For this, the pictures of AT and AN were shown again on the tablet-PC. The classification was done with a fully verbalised, bipolar rating scale, with the possibility of abstention (definitely AT; rather AT; rather AN; definitely AN; no answer).
2.4. Data Analysis
During this study, two data sets were collected. One file contained the eye tracking metrics of the participants and the other, the responses to the questionnaire. The files were merged for statistical analysis by using a unique identification number for each participant as the key variable. Quantitative data analyses were performed with SPSS 25 (IBM Corporation).
Data obtained from the questionnaire were analysed qualitatively and quantitatively. Qualitative data analysis was performed for the participants’ associations with the farms. Terms referring to the same concept or with a similar meaning were grouped into the same categories by involving two researchers to generate the categories and to assign the responses to the categories.
Descriptive statistics were used to present percentages relating to attitudes towards aquaponics in general and attitudes towards the two aquaponics farms. Correlations were tested with Spearman’s correlation coefficient to receive more robust results.
For statistical analyses of gaze behaviour, only the measured values of the participants’ right eye were used, because it is generally assumed that both eyes make the same movement at approximately the same time, and look at roughly the same position [34]. The eye tracking data were described by presenting medians and quartiles. Nonparametric tests for dependent samples were used to test differences in gaze behaviour between AOIs.
As the responses to the questionnaire indicated the importance of naturalness for the assessment of aquaponics, the participants were divided into two groups according to their response on the six point Likert scale to the item ‘For me, aquaponics is too far from nature’:
- Group 1 (n = 9): do quite clearly not agree with this item, point 1–2 on the Likert scale
- Group 2 (n = 9): do rather agree with this item, ≥ point 3 on the Likert scale
First, the eye tracking results were visualised using heat maps, which optically contrast the gaze behaviour of these two groups. A heat map allows the qualitative exploration of gaze behaviour [39] using a colour scale. The maps were generated with the software SMI BeGazeTM. In this software, each fixation of each participant adds a value to the map that is proportional to the duration of the respective fixation. This intensity value is averaged with the number of participants selected. Colour changes from blue to green to yellow and finally to red show an increasing fixation intensity [38]. This visualisation technique enables a more qualitative exploration of the eye tracking results and makes the data better comprehensible. Quantitative data analyses were performed using Friedman’s two-way analysis of variance by rank to test differences in fixation time between the individual text and picture AOIs within each group. Mann–Whitey-U-tests were performed to test differences in fixation time of each text and picture AOI between groups.
3. Results
3.1. Eye-tracking Measurements
3.1.1. Overview of the Allocation of Visual Attention to Text and Pictures
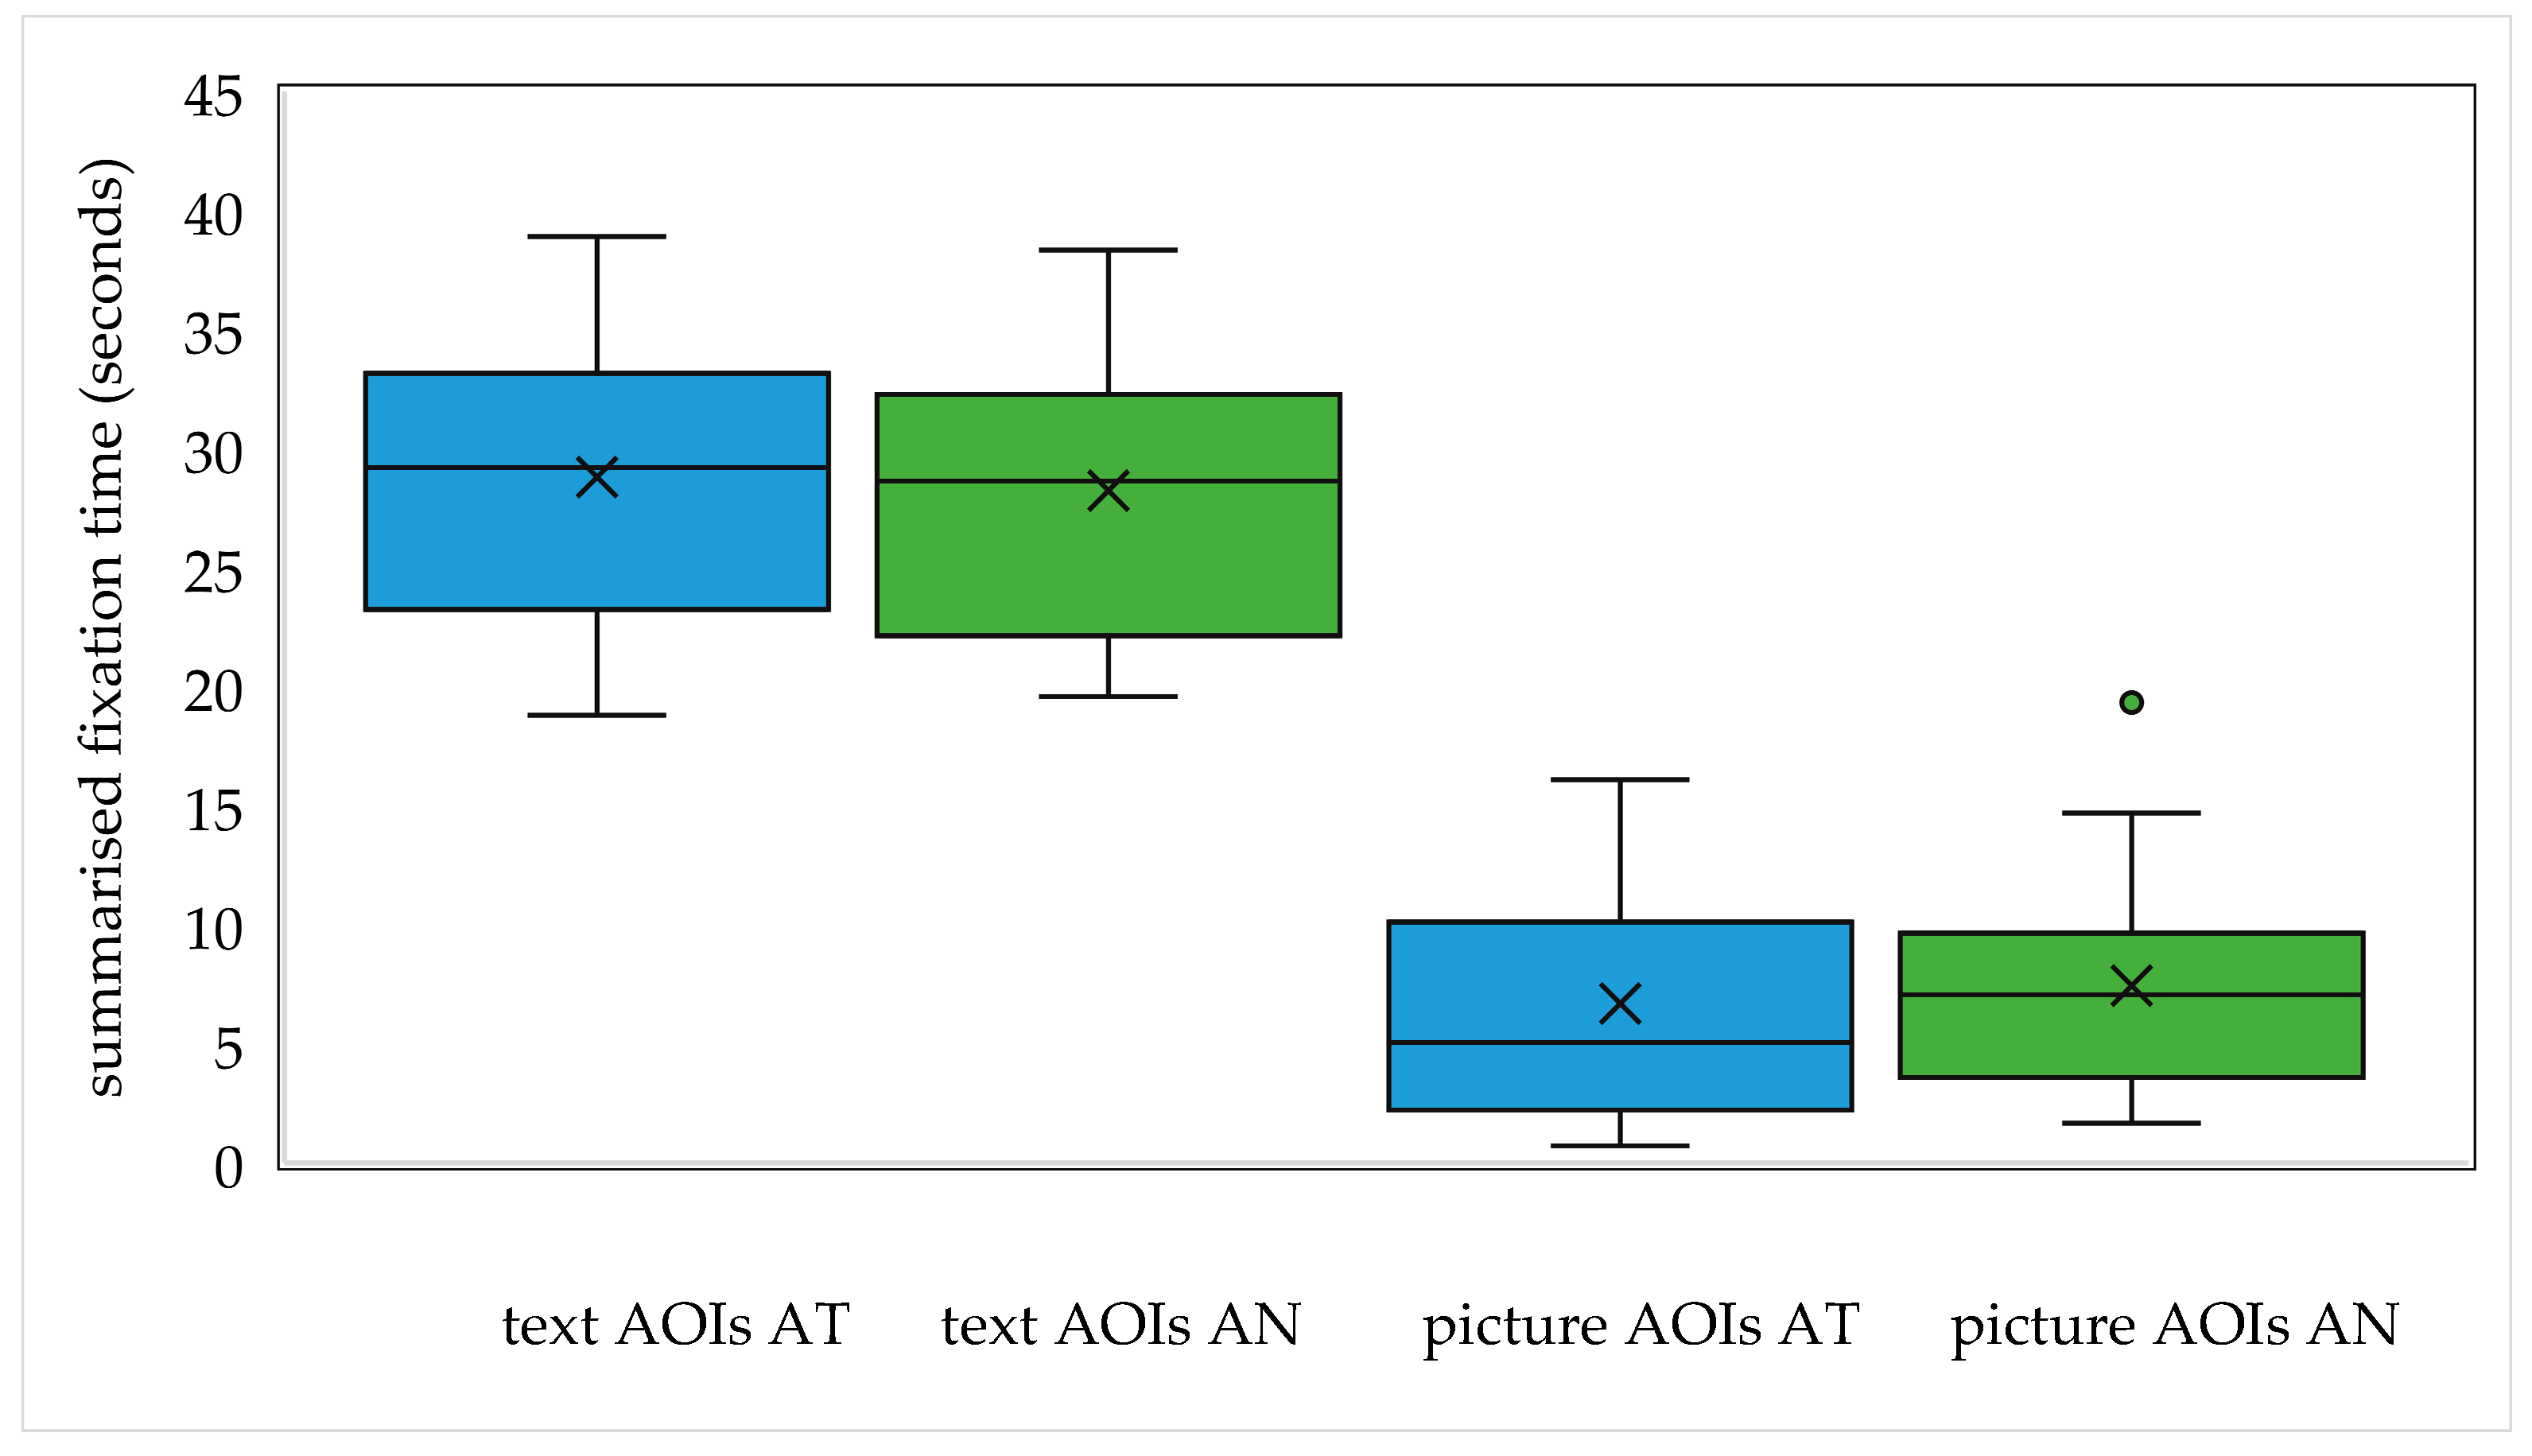
To give an overview of how the participants spread their visual attention to the text and picture sections of the stimuli AT and AN, Figure 2 represents the summarised fixation times of all text and picture AOIs of the respective stimulus. Summed up over all text AOIs, participants fixated the text sections of stimulus AT as long as those of stimulus AN (AT: Mdn = 29.20 s, AN: Mdn = 28.64 s; Wilcoxon signed-rank test p = 0.53). The same applied to the picture AOIs (AT: Mdn = 5.05, AN: Mdn = 7.06; Wilcoxon signed-rank test p = 0.23). That means that the participants distributed their visual attention between text and pictures in both stimuli in a similar way.
The more visual attention a participant paid to the text (pictures) of AT, the more visual attention he/she paid to the text (pictures) of AN. The summarised fixation time of the text (picture) AOIs of AT correlated strongly with the summarised fixation time of the text (picture) AOIs of AN, rs = 0.87 p < 0.001 (rs = 0.68, p = 0.002).
Participants spent significantly more time reading the text than looking at the pictures. Within each stimulus, the summarised fixation time of the text AOIs was significantly higher than the summarised fixation time of the picture AOIs (Wilcoxon signed-rank tests p < 0.001 for both stimuli).
Closer inspection of Figure 2 may lead to a question if one considers the display time of 50 s for each stimulus. The sum of the median fixation time of the text and picture AOIs was only about 35 s within each stimulus. What did the participants do during the remaining time, which was about 15 s? During this time, saccades and eye blinks occurred or the participants fixated areas outside the marked AOIs, e.g., the headlines or the white space.
3.1.2. Visual Perception of the Individual Picture Sections
Since pictures are of great importance as information sources and eye-catchers, the eye tracking measurements for the picture AOIs of stimulus AT and AN are presented in detail in Table 1.
Within stimulus AT, participants paid the least visual attention to the picture showing the farm building. Although the differences are in most cases not significant, the AOI Building received least fixations, was fixated for the shortest time and average fixation duration was lowest. One participant did not fixate this AOI at all. Median fixation time and median average fixation duration were the longest for the AOI Hydroponics.
In stimulus AN, in contrast, median fixation counts and fixation time were lowest for the AOI Hydroponics. Within this stimulus, the AOI Aquaculture received most visual attention reflected in the highest number of fixations and the longest fixation time.
Comparing the stimuli AT and AN, the AOIs Building and Aquaculture of stimulus AN seemed to be visually more interesting. Both AOIs received significantly more fixation counts and were fixated significantly longer than the same AOIs of stimulus AT. The average fixation time of the AOI Building was also significantly longer for stimulus AN. Interestingly, the average fixation duration of the AOI Hydroponics was significantly shorter for stimulus AN compared to stimulus AT.
3.2. Questionnaire
3.2.1. Evaluation of Aquaponics
Most of the participants were positively inclined towards aquaponics production (Figure 3). More than two-thirds tended to think that it is a good idea to combine fish and plant production in a recirculating system, that aquaponics has good future prospects and, that aquaponics represents a good opportunity for sustainable food production. These participants answered these statements with points 4 to 6 on the Likert-scale. The answers to these three items correlate strongly positively with each other, with p < 0.01 for all correlations (Table 2).
The answers to the fourth item, ‘For me, aquaponics is too far from nature’, correlate negatively with the answers to the three aforementioned items, p > 0.05. Half of the participants quite clearly rejected the statement (points 1–2 on the Likert-scale) the other half agreed more with the statement (points 3–5). Nobody fully agreed (point 6 on the Likert scale) with this item. Even though the correlations between the fourth item and the other items are not significant in our sample, the similarity of the three correlation coefficients suggests that the evaluation of aquaponics may be linked to the perceived naturalness of the production method.
3.2.2. Evaluation of Aquaponics Variants
Table 3, which categorises the associations with AT and AN, gives a first impression of the participants’ assessment of these aquaponics variants. The participants associated both farms with sustainability. In this study, ‘sustainability’ is interpreted as environmental sustainability, the most common understanding of this term [40]. AT was much more frequently associated with the rather positive terms ‘innovative’ and ‘interesting’ but also with the rather negative term ‘artificial’ than AN. Two participants linked AT to factory farming. In contrast, participants associated AN much more frequently with the positive terms ‘natural’ and ‘animal welfare’ than AT.
The category ‘uncertainty’ includes questions regarding the system size ‘Does it also exist in a larger version?’, to the taste of the products ‘Does it taste good?’, ‘Do vegetables from aquaponics taste different from conventionally produced vegetables?’ and to animal welfare ‘How are the fish?’. This category also contains responses disclosing a lack of information about the fish, such as ‘Where are the fish?’ or ‘How many fish are in such a basin?’.
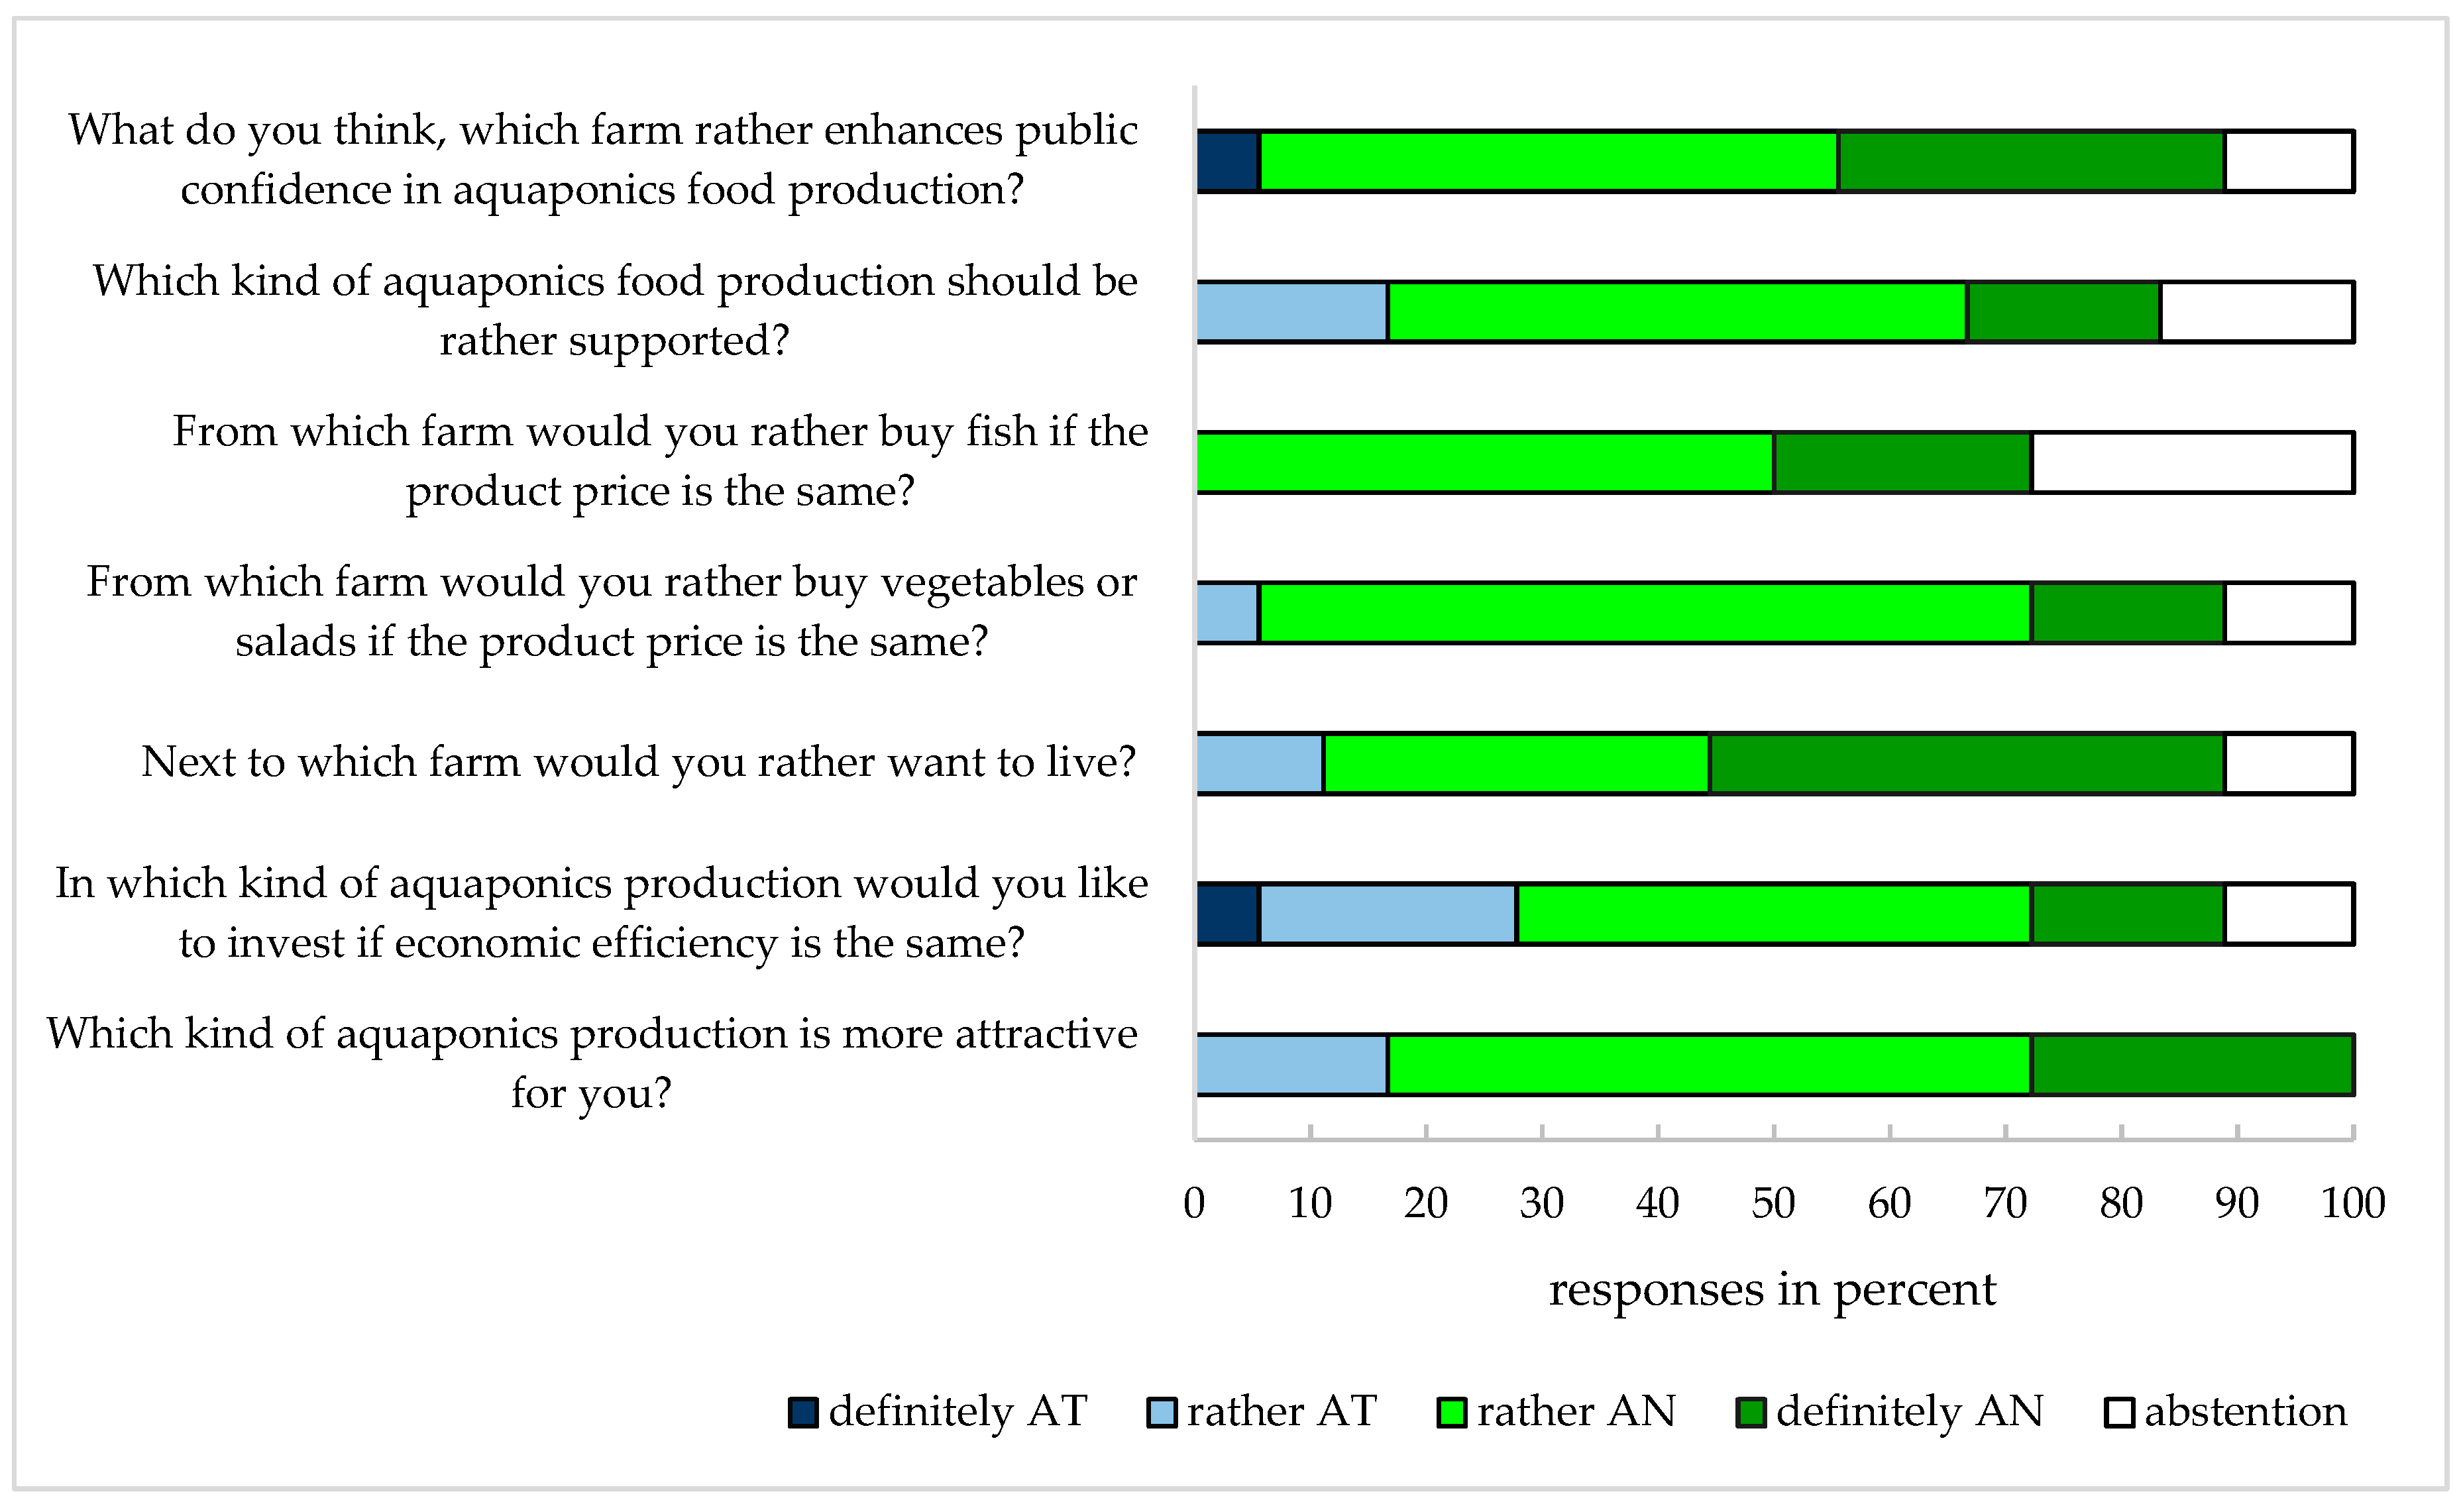
Figure 4 allows a more precise evaluation of the participants’ preferences regarding the aquaponics variants shown. The information about AN seemed to be more convincing since the majority of the participants preferred AN for all the questions asked to determine the preferences for one of the farms. However, abstentions occurred in six of the seven questions. Interestingly, some people would rather invest in AT but would prefer AN in other cases. For instance, two participants would prefer to live next to AN, but would rather invest in AT. Two people would rather buy vegetables from AN, and three persons would rather buy fish from AN, even though they would rather invest in AT. Only one participant would prefer to invest in AT and buy vegetables from AT. All participants who would definitely or rather prefer AT were male. This applies for each of the seven items.
3.2.3. Missing Information
Seven participants answered the question ‘Did you miss any text/picture information’ with ‘yes’. Six of these participants requested additional information about the fish, with five participants criticising missing pictures of the fish and one participant criticising missing information about the fish species and the design of the fish basins. Together with two other participants who had indicated in their associations with the aquaponics variants (cf. Section 3.2.2) that they would have liked to see pictures of the fish, eight participants (44%) missed information about the fish.
3.3. Linkage of Eye-tracking and Questionnaire Data
3.3.1. Gaze Behaviour Depending on Perceived Naturalness of Aquaponics
Figure 5 contrasts the participants’ gaze patterns depending on the perceived naturalness of aquaponics. For the first stimulus, which explained the aquaponics cycle, the heat map of group 1 (Figure 5a; participants who perceived aquaponics as not too far from nature) differs only slightly from the heat map of group 2 (Figure 5d; participants who perceived aquaponics rather as too far from nature). Apparently, the participants of both groups were similarly interested in the visual information given in this stimulus. The situation is different for the second and the third stimulus. The heat maps suggest a greater interest of group 1 (Figure 5b,c) in the pictures of both stimuli compared to group 2 (Figure 5e,f). The allocation of visual attention to the text sections also seems to differ between the participant groups.
The differences in gaze behaviour observed in the heat maps of the second and the third stimulus were quantitatively analysed within the marked AOIs. Since fixation time is the basis for generating the heat maps [38] and a key indicator for cognitive processing time [37], this measurement is reported for all text and picture AOIs for each participant group. As Table 4 shows, no significant differences could be observed between the groups in the text AOIs. However, group 2 seemed to be particularly interested in the text sections about aquaculture. Median fixation time of this group was 5.21 s longer for the AOI aquaculture in stimulus AT and 2.54 s longer for the same AOI of stimulus AN compared to the median fixation time of group 1.
When comparing the fixation time of the text AOIs within the groups, it should be noted that the respective text sections contained a different number of words (cf. Appendix A). Both groups fixated the text AOIs, which contained the farm philosophy of the respective farm, for the shortest time. These were also the text sections with the fewest words. However, differences in fixation time between the text AOIs were only significant in group 1. Participants of this group spent the most time reading the text of the hydroponics section. Participants of group 2 spread their visual attention more evenly across the text AOIs of the respective stimulus.
Table 5 shows the fixation times of the groups for the picture AOIs. As the heat maps already suggest, group 1 fixated all picture AOIs considerably longer than group 2, with the exception of the picture AOI Building of stimulus AT. The differences in fixation time between the groups were significant or nearly significant for all picture AOIs of AN.
Comparing fixation time between the AOIs within each group, group 1 fixated the picture AOI Building of stimulus AT significantly shorter than the other two AOIs of this stimulus. In contrast, group 2 fixated all picture AOIs of stimulus AT for a similar time span. In stimulus AN, no significant differences in fixation time of the picture AOIs could be observed within the groups. Both groups tendentially fixated the AOI Aquaculture of this stimulus the longest.
3.3.2. Gaze Behaviour and Interest in Information about the Fish
The interest in additional information about the fish is reflected in the participants’ gaze behaviour within the AOI fish basin window (Figure 6). Mann–Whitney-U tests show that participants who criticised missing information about the fish tended to have more fixation counts (Mdn = 3 vs. Mdn = 1; U = 20.00, p = 0.083) and a longer fixation time (Mdn = 0.56 vs. Mdn = 0.20 s; U = 19.00, p = 0.068). Average fixation duration was significantly longer for these participants than for participants who did not miss any information about the fish (Mdn = 0.24 vs. 0.17 s; U = 16.00, p = 0.034).
4. Discussion
Previous work has stressed the importance of informing key stakeholders and different target groups about aquaponics to support the dissemination of this production method and to ensure long-term economic sustainability [12,13]. However, these studies have not focused on information content and its perception by information recipients.
4.1. Visual Attention to Information Contents
In this study, visual perception of information about aquaponics was explored using eye tracking. The results indicate that allocation of visual attention is linked to the specific information content and to the evaluation of the naturalness of aquaponics production. Considering the trend towards an increased use of realistic pictures in agriculture public relations, the information about two aquaponics farms was designed with realistic pictures of aquaponics systems, supplemented by text elements. The eye tracking results show that the participants gathered their information from both text and picture sections of the information material. In accordance with previous studies, they fixated the text AOIs significantly longer than the picture AOIs [41,42]. This is primarily due to the fact that viewers can encode much more information per fixation from a picture than from a text [41]. A person needs one to two seconds to capture the information encoded in a picture of medium complexity. In the same period, about five to ten words can be read. Such few words are usually not able to convey such complex impressions as a picture [43]. The result could also be attributed to the fact that the text was more informative for the participants [42]. Furthermore, the participants’ knowledge that they have to complete a survey after the eye tracking might have contributed to an extended fixation time of the text, since the task can influence the gaze behaviour [42,44]. Perhaps they wanted to gather as much information as possible from the text to be well prepared to answer the survey. The correlations between the fixation time of the text of AT and AN, respectively, between the fixation time of the pictures of AT and AN indicate that personal traits, such as preferences for either pictures or for text and reading speed, may also have influenced the gaze behaviour.
Even if total fixation time of the picture AOIs does not differ between the stimuli AT and AN, the fixation time of the individual picture AOIs differs within the respective stimulus and between the corresponding AOIs of the two stimuli. The low interest in the AOI Building of stimulus AT could be explained by the monotonous design of the picture. A white company building with a grey paved entrance area dominate the picture, the picture content and the colours do not have an activating effect [43]. Moreover, the content of the picture can be captured quickly. Similar buildings exist in almost every industrial zone, so everyone knows the sight of such a building from everyday life. One participant did not fixate this AOI at all. This does not mean that this person did not receive any information from this picture. It could be that the participant had captured the picture peripherally [28,43] and considered a closer inspection superfluous.
Even if one participant did not fixate the AOI Aquaculture of AT, this AOI and the AOI Hydroponics seemed to be informative for the other participants despite the monotonous appearance of the pictures. A picture or an object in a picture is informative to the extent that it is unexpected given the rest of the information and the observer’s previous experiences [45]. Since society’s knowledge of modern aquaculture is generally low [21], the participants may have been surprised by the high-tech appearance of the recirculating aquaculture system. And even though the participants should know the production of greenhouse crops, the cultivation system presented might have been new for them and therefore interesting. The longer fixation times and the longer average fixation durations of these AOIs might represent the cognitive effort to add the pictures into an existing scheme of knowledge and understanding [45].
Within stimulus AN, the participants paid most visual attention to the AOI Aquaculture. Here too, the participants might have tried to synchronise the picture content with their previous experiences. In addition, the picture contained some emotional elements. Emotional elements attract and maintain the observers’ attention and can generate positive moods, even if they are perceived only peripherally [43,46]. Emotional elements of this AOI that might have created positive moods are the surrounding trees and plants as well as the aquatic plants in the fish tanks. Another emotional element could have been the fish, although they were only vaguely visible through a window integrated into the fish tank. This fish tank window was of particular interest to participants who criticised insufficient information about the fish. Specifically, the long average fixation duration indicates a higher cognitive load on this participant group. This cognitive load may have resulted from searching for the fish behind the window, since search tasks are usually associated with longer fixation durations [28].
4.2. Relationship between Gaze Behaviour and Evaluation of Aquaponics Production
Our study also suggests a relationship between gaze behaviour and evaluation of aquaponics production. In line with previous studies [21,22], the majority of participants had positive attitudes towards aquaponics. However, this openness towards the production method seemed to be related to its perceived naturalness. Although all participants had received the same information in the same order, they evaluated naturalness of aquaponics quite differently. Participants who assessed aquaponics as more natural had paid more attention to the pictures of AT and AN. This might be an indication for primarily stimulus-driven gaze behaviour. Perhaps these participants liked the general idea of aquaponics as described in the first slide. Therefore, they might have been less critical against the specific production design and saw no reason to read the text very intensively. In answering the questionnaire, these participants might have primarily remembered the information they had seen last (‘recency effect’) and made their assessment against that backdrop [26]. The gaze behaviour of participants who were less interested in the pictures and more interested in the text might have been more goal-driven. Higher motivation and involvement with a particular issue related to food choices can result in a search for specific information, thus leading to longer fixation time [47,48]. Perhaps these participants are more sceptical about innovations in general or (new) intensive food production methods. Possibly, the text in combination with the pictures of the high-tech farm notably confirmed their caveats and they rated aquaponics as rather far from nature because of a ‘Halo effect’ of this information. It is equally conceivable that for these participants, ‘natural’ fish production should always be associated with open water (e.g., outdoor ponds) and ‘natural’ crop production should always be linked to soil.
4.3. Evaluation of Aquaponics Variants
Our results indicate a considerable influence of farm design on the evaluation of aquaponics variants. Participants associated both farms with environmental sustainability, a trait well accepted by the public in terms of aquaculture production [49]. In addition, AT was perceived as innovative and interesting. Nevertheless, these aspects did not convince most of the participants of the advantageousness of AT. A high degree of innovation combined with a high artificialness may have made it difficult to fully understand the production process and to recognise all benefits of the system [50]. Even if all participants should be familiar with intensive farming methods due to their professional background, they might have biased by the assumption that sustainable food production should always be ‘natural’. Soil-less crop production does not fit this vision [51] just as closed recirculation aquaculture systems do not meet expectations for production close to nature [21].
The participants’ preference for AN might be due to the use of substrate in hydroponics and to the integration of the fish tanks in a greenhouse with soil-based crop production. Furthermore, the participants might have rated fish welfare in AN better than in AT. Previous studies have shown that most people expect good housing conditions for the aquaculture fish [21,49]. For highly engineered recirculating aquaculture systems as shown in stimulus AT, fish welfare is heavily doubted by laypersons [21]. In our study, two participants linked AT explicitly with ‘factory farming’, an aspect that has been controversially discussed in other areas of animal farming for years [17,22,23]. The negative evaluation of intensive farming systems can be influenced only slightly by rational arguments, such as sustainability, reduced disease pressure, work safety or food security as fundamental ethical considerations are hurt [21,52]. Apparently, also in the case of AT the advantages (e.g., ideal condition for fish growth, top-quality products) mentioned in the text did not convince the participants. In contrast, images with nature-related contents are pleasant for the human feeling [53] and can influence the assessment of animal welfare in a positive manner [17,21,54]. This is because naturalness and contact to outdoor areas act as key factors for assessing the adequacy of a husbandry system by laypeople [17]. The environmental conditions in stimulus AN, where the fish basins were located in a greenhouse, may have created an impression of naturalness due to the exposure to daylight, the surrounding plants and the aquatic plants in the basins and thus, they may have improved perception of fish welfare.
As investors, some participants would prefer AT, even if they had decided against AT in other points. It is conceivable that familiarity with intensive livestock farming or considerations related to labour organisation and fascination for technology led to this result [55]. It might also be possible that in the role of an investor, possible negative external effects of an aquaponics farm are neglected. This result could be an indication that potential investors may have a different focus when assessing aquaponics systems than the public. This might be a challenge for communication as well as for the successful dissemination of aquaponics. A very divergent view of potential investors compared to other stakeholder groups could lead to innovation failure if investors are not willing to debate with other stakeholders and to take their concerns and demands into account [15]. With regard to communication, it seems important to focus on the aspects relevant to the respective stakeholder group, this means to provide target-group oriented information.
4.4. Limitations of the Study and Suggestions for Further Research
However, to underline the interpretations mentioned above, further research is necessary. Since the study was designed as a pilot study, the number and choice of participants was limited. Even if the participants could be considered as laypersons with regard to aquaponics, they all were some kind of experts regarding agriculture. In this context, it should be noted that differences in values and norms between people from the public and those working in agriculture can strongly influence how pictures and practices of agriculture are perceived and evaluated [17,56]. Thus, the results may not apply to potential key stakeholders such as the German or European public. Another question the study cannot answer relates to cause and effect. The relationship between top-down and bottom-up processes in gaze behaviour makes it difficult to define gaze behaviour as either an independent or a dependent variable [28]. Our study does not allow any interpretation if the results of the questionnaire can be explained by gaze behaviour or if gaze behaviour can be explained by the results of the questionnaire. On the one hand, gaze behaviour could have been influenced mainly by the participants’ general attitudes towards food production, and these attitudes were reflected in the responses to the questionnaire. It is equally possible that the information provided has mainly influenced the participants’ attitudes towards the aquaponics systems. In further studies, a survey could be carried out before and after the eye-tracking procedure to clarify this problem. Furthermore, additional neuroeconomic methods such as electroencephalography (EEG) or mobile functional near infrared spectroscopy (fNIRS) could be used to gain an even deeper understanding of perceptual processes during information reception [57]. Possible effects of the task or experimental situation on gaze behaviour might be reduced by carrying out future experiments under more natural conditions. For example, wearable eye-tracking glasses could be used to track peoples’ gaze behaviour when looking at a real flyer in a situation without limitation of viewing time. Another interesting question to be addressed in further research is whether and how the design of aquaponics systems affects the willingness to pay for aquaponics products.
5. Conclusions
The present study indicates that eye tracking in combination with standardised personal interviews, could be a useful approach to better understand perception and evaluation of information about aquaponics. The results can provide first impulses for the development of information material about aquaponics and for the development of aquaponics itself. If the intention of the information is not only to inform but also to promote the dissemination of aquaponics, picture design, as well as the text content of communication material, should be carefully tested in advance. In this context, it may be advisable to emphasise the use of natural cycles in aquaponics production. Pictures depicting fish in their housing environment could be useful to make aquaponics production more transparent and to meet information needs regarding the fish. At least for certain target groups, it seems important that aquaponics production is not only based on natural cycles but also takes place in a more ‘natural’ environment. The findings could be a starting point to identify ways to make aquaponics production attractive for different target groups, a prerequisite to support the diffusion of this production method as well as sustainable consumption patterns. In this context, more research is needed to better understand the effects of different types of information material on different target groups.
Author Contributions
Conceptualization, I.S. and M.M.; methodology, I.S.; validation, I.S. and M.M.; formal analysis, I.S.; investigation, I.S.; resources, M.M.; data curation, I.S.; writing—original draft preparation, I.S.; writing—review and editing, M.M. and I.S.; visualization, I.S.
Funding
This research received no external funding.
Acknowledgments
We thank the volunteers for their participation in the study and the Department of Mechanical Engineering for providing the eye tracking laboratory.
Conflicts of Interest
The authors declare no conflict of interest.
Appendix A
Figure A1.
The three pages of the virtual flyer used as stimuli for the eye tracking experiment: (a) first stimulus: aquaponics cycle (b) second stimulus: farm AT (c) third stimulus: farm AN.
Figure A1.
The three pages of the virtual flyer used as stimuli for the eye tracking experiment: (a) first stimulus: aquaponics cycle (b) second stimulus: farm AT (c) third stimulus: farm AN.

Translation of the text of the second (AT) and third (AN) stimulus. The number of words of the German text is indicated below each text section:
Second stimulus (AT): AquaPonTec
We produce food fish and vegetables with high professional competence. With aquaponics, we use state-of-the-art knowledge to guarantee our customers sustainable products of first-class quality.
The German version contains 26 words.
Our aquaculture section:
Our fish need silence, darkness, food and optimal water parameters for good growth. With our modern recirculating aquaponics system, we consume significantly less water and can keep considerably more fish safely than in a pond.
The German version contains 42 words.
Our hydroponics section:
The second system component of our facility is hydroponics, where we primarily produce lettuce and basil. The plants are cultivated in gutters in which the plant roots are continuously washed around by the filtered, nutrient-rich water from the aquaculture.
The German version contains 39 words.
Third stimulus (AN):
AquaNatura
Our passion is the sustainable production of high-quality food for our customers. With aquaponics, we use a method that is based on natural cycles and is therefore particularly resource-efficient.
The German version contains 31 words.
Our aquaculture section:
Animal welfare is very important to us. The fish get enough space to realise their natural behaviour. To offer our fish optimal conditions, they grow up in tanks that are integrated into our greenhouses.
The German version contains 36 words.
Our hydroponics section:
We focus on diversity in plant production. We produce lettuce, chard, tomatoes and various herbs. The plants find support in a substrate made of expanded clay and are supplied with nutrient-rich water from the aquaculture.
The German version contains 36 words.
References
- United Nations (UN). Review and appraisal of the Programme of Action of the International Conference on Population and Development and its contribution to the follow-up and review of the 2030 Agenda for Sustainable Development. Economic and Social Council, Commission on Population and Development, Fifty-second session 1–5 April 2019, General debate. Report of the Secretary-General, 2019 (E/CN.9/2019/2). Available online: https://documents-dds-ny.un.org/doc/UNDOC/GEN/N19/015/35/PDF/N1901535.pdf?OpenElement (accessed on 3 May 2019).
- Poore, J.; Nemecek, T. Reducing food’s environmental impacts through producers and consumers. Science 2018, 360, 987–992. [Google Scholar] [CrossRef]
- Lemken, D.; Kraus, K.; Nitzko, S.; Spiller, A. Staatliche Eingriffe in die Lebensmittelwahl: Welche klimapolitischen Instrumente unterstützt die Bevölkerung? GAIA—Ecol. Perspect. Sci. Soc. 2018, 27, 363–372. [Google Scholar] [CrossRef]
- Vanhonacker, F.; van Loo, E.J.; Gellynck, X.; Verbeke, W. Flemish consumer attitudes towards more sustainable food choices. Appetite 2013, 62, 7–16. [Google Scholar] [CrossRef] [PubMed]
- Palm, H.W.; Knaus, U.; Appelbaum, S.; Goddek, S.; Strauch, S.M.; Vermeulen, T.; Haїssam Jijakli, M.; Kotzen, B. Towards commercial aquaponics: A review of systems, designs, scales and nomenclature. Aquac. Int. 2018, 39, 510. [Google Scholar] [CrossRef]
- Beveridge, M.C.M.; Thilsted, S.H.; Phillips, M.J.; Metian, M.; Troell, M.; Hall, S.J. Meeting the food and nutrition needs of the poor: The role of fish and the opportunities and challenges emerging from the rise of aquaculture. J. Fish Biol. 2013, 83, 1067–1084. [Google Scholar] [CrossRef] [PubMed]
- Azad, K.N.; Salam, M.A. Aquaponics in Bangladesh: Current status and future prospects. J. Biol. Agric. Res. 2016, 669–677. [Google Scholar] [CrossRef]
- Grusak, M.A.; DellaPenna, D. Improving the nutrient composition of plants to enhance human nutrition and health. Annu. Rev. Plant Physiol. Plant Mol. Biol. 1999, 50, 133–161. [Google Scholar] [CrossRef]
- Goddek, S.; Delaide, B.; Mankasingh, U.; Ragnarsdottir, K.; Jijakli, H.; Thorarinsdottir, R. Challenges of Sustainable and Commercial Aquaponics. Sustainability 2015, 7, 4199–4224. [Google Scholar] [CrossRef] [Green Version]
- Shete, A.P.; Verma, A.K.; Chadha, N.K.; Prakash, C.; Peter, R.M.; Ahmad, I.; Nuwansi, K.K.T. Optimization of hydraulic loading rate in aquaponic system with Common carp (Cyprinus carpio) and Mint (Mentha arvensis). Aquac. Eng. 2016, 72, 53–57. [Google Scholar] [CrossRef]
- Somerville, C.; Cohen, M.; Pantanella, E.; Stankus, A.; Lovatelli, A. Small-Scale Aquaponic Food Production. Integrated Fish and Plant Farming; FAO: Rome, Italy, 2014. [Google Scholar]
- Miličić, V.; Thorarinsdottir, R.; Santos, M.; Hančič, M. Commercial aquaponics approaching the European market: To consumers’ perceptions of aquaponics products in Europe. Water 2017, 9, 80. [Google Scholar] [CrossRef]
- Short, G.; Yue, C.; Anderson, N.; Russell, C.; Phelps, N. Consumer Perceptions of Aquaponic Systems. HortTechnology 2017, 27, 358–366. [Google Scholar] [CrossRef] [Green Version]
- Searles, K.; Münchhausen, S.V.; Kirwan, J.; Chiswell, H.; Maye, D.; Prosperi, P.; Vergamini, D.; Minarelli, F.; Vlahis, G.; Tsakalou, E. ‘Adding value to the fish!’: Business strategies in fish farming and small-scale fishery. In Evidence-Based Policies to Face New Challenges for Agri-Food Systems, Proceedings of the 7th AIEAA Conference, Conegliano, Italy, 14–15 June 2018; AIEAA Associazione Italiana di Economia Agraria E Applicata: Conegliano, Italy, 2018. [Google Scholar]
- Weary, D.M.; Ventura, B.A.; von Keyserlingk, M.A.G. Societal views and animal welfare science: Understanding why the modified cage may fail and other stories. Animal 2016, 10, 309–317. [Google Scholar] [CrossRef] [PubMed]
- Rogers, E.M. Diffusion of Innovations, 5th ed.; Free Press trade paperback; Free Press: New York, NY, USA, 2003; p. 289. ISBN 978-0743222099. [Google Scholar]
- Busch, G.; Spiller, A. Pictures in public communications about livestock farming. Anim. Front. 2018, 8, 27–33. [Google Scholar] [CrossRef] [Green Version]
- Wille, S.C.; Busch, G.; Spiller, A. Tiertransporte in der Schweinehaltung: Führen mehr Informationen und Wissen bei Verbrauchern zu einer positiveren Einstellung? Ger. J. Agric. Econ. (GJAE) 2017, 66, 1–12. [Google Scholar]
- Kühl, S.; Gauly, S.; Spiller, A. Analysing public acceptance of four common husbandry systems for dairy cattle using a picture-based approach. Livest. Sci. 2019, 220, 196–204. [Google Scholar] [CrossRef]
- Wernsmann, A.; Wildraut, C.; von Meyer-Höfer, M.; Mergenthaler, M. Perception and evaluation of a pig fattening pen based on film material in an online survey experiment with German citizens. Ger. J. Agric. Econ. (GJAE) 2018, 67, 246–266. [Google Scholar]
- Feucht, Y.; Zander, K. Of earth ponds, flow-through and closed recirculation systems—German consumers’ understanding of sustainable aquaculture and its communication. Aquaculture 2015, 438, 151–158. [Google Scholar] [CrossRef]
- Busch, G.; Gauly, S.A.; Spiller, A. Ich sehe was, was du nicht siehst: Eine Eye-Tracking-Studie zur Betrachtung und Bewertung von Bildern aus der Schweinemast. Ger. J. Agric. Econ. (GJAE) 2017, 66, 65–84. [Google Scholar]
- Busch, G.; Schwetje, C.; Spiller, A. Bewertung der Tiergerechtheit in der intensiven Hähnchenmast durch Bürger anhand von Bildern: Ein Survey-Experiment: Citizens’ evaluation of animal welfare on pictures of intensive broiler fattening: A survey experiment. Ger. J. Agric. Econ. (GJAE) 2015, 64, 131–147. [Google Scholar]
- Specht, K.; Sanyé-Mengual, E. Risks in urban rooftop agriculture: Assessing stakeholders’ perceptions to ensure efficient policymaking. Environ. Sci. Policy 2017, 69, 13–21. [Google Scholar] [CrossRef]
- Pollard, G.; Ward, J.D.; Koth, B. Aquaponics in Urban Agriculture: Social Acceptance and Urban Food Planning. Horticulturae 2017, 3, 39. [Google Scholar] [CrossRef]
- Orquin, J.L.; Perkovic, S.; Grunert, K.G. Visual Biases in Decision Making. Appl. Econ. Perspect. Policy 2018, 118, 73. [Google Scholar] [CrossRef]
- van Loo, E.J.; Grebitus, C.; Nayga, R.M.; Verbeke, W.; Roosen, J. On the Measurement of Consumer Preferences and Food Choice behavior: The Relation Between Visual Attention and Choices. Appl. Econ. Perspect. Policy 2018, 54, 333. [Google Scholar] [CrossRef]
- Geise, S. Eyetracking in der Kommunikations- und Medienwissenschaft: Theorie, Methode und kritische Reflexion. SCM Stud. Commun. Media 2011, 149–263. [Google Scholar] [CrossRef] [Green Version]
- Corbetta, M.; Shulman, G.L. Control of goal-directed and stimulus-driven attention in the brain. Nat. Rev. Neurosci. 2002, 3, 201–215. [Google Scholar] [CrossRef]
- Pieters, R.; Wedel, M. Attention Capture and Transfer in Advertising: Brand, Pictorial, and Text-Size Effects. J. Mark. 2004, 68, 36–50. [Google Scholar] [CrossRef]
- Pieters, R.; Rosbergen, E.; Wedel, M. Visual Attention to Repeated Print Advertising: A Test of Scanpath Theory. J. Mark. Res. 1999, 36, 424–438. [Google Scholar] [CrossRef]
- Just, M.A.; Carpenter, P.A. A theory of reading: From eye fixations to comprehension. Psychol. Rev. 1980, 87, 329–354. [Google Scholar] [CrossRef]
- Naspetti, S.; Pierdicca, R.; Mandolesi, S.; Paolanti, M.; Frontoni, E.; Zanoli, R. Automatic Analysis of Eye-Tracking Data for Augmented Reality Applications: A Prospective Outlook. In Augmented Reality, Virtual Reality, and Computer Graphics, Proceedings of the Part II. Third International Conference, AVR 2016, Lecce, Italy, 15–18 June 2016; de Paolis, L.T., Mongelli, A., Eds.; Springer International Publishing: Cham, Switzerland, 2016; pp. 217–230. [Google Scholar]
- Holmqvist, K.; Nyström, M.; Andersson, R.; Dewhurst, R.; Jarodzka, H.; van de Weijer, J. Eye Tracking. A Comprehensive Guide to Methods and Measures, 1st ed.; Oxford Univ. Press: Oxford, UK, 2011; ISBN 0-19-969708-6. [Google Scholar]
- Bylinskii, Z.; Borkin, M.A.; Kim, N.W.; Pfister, H.; Oliva, A. Eye Fixation Metrics for Large Scale Evaluation and Comparison of Information Visualizations. In Eye Tracking and Visualization; Chuang, L., Fisher, B., Schmidt, A., Weiskopf, D., Bylinskii, Z., Borkin, M.A., Kim, N.W., Pfister, H., Oliva, A., Eds.; Springer International Publishing: Cham, Burch, 2017; ISBN 978-3-319-47024-5. [Google Scholar]
- Poole, A.; Ball, L.J.; Phillips, P. In Search of Salience: A Response-time and Eye-movement Analysis of Bookmark Recognition. In Design for Life: Proceedings of HCI 2004; [Human Computer Interaction 2004]; Fincher, S., Ed.; Springer: London, UK; Berlin/Heidelberg, Germany, 2005; pp. 363–378. ISBN 978-1-85233-900-5. [Google Scholar]
- Just, M.A.; Carpenter, P.A. Eye fixations and cognitive processes. Cognit. Psychol. 1976, 8, 441–480. [Google Scholar] [CrossRef]
- SMI SensoMotoric Instruments. BeGaze Manual; Version 3.4; SMI SensoMotoric Instruments: Teltow, Germany, 2014. [Google Scholar]
- Blascheck, T.; Kurzhals, K.; Raschke, M.; Burch, M.; Weiskopf, D.; Ertl, T. Visualization of Eye Tracking Data: A Taxonomy and Survey. Comput. Gr. Forum 2017, 36, 260–284. [Google Scholar] [CrossRef]
- Hanss, D.; Böhm, G. Sustainability seen from the perspective of consumers. Int. J. Consum. Stud. 2012, 36, 678–687. [Google Scholar] [CrossRef]
- Rayner, K.; Rotello, C.M.; Stewart, A.J.; Keir, J.; Duffy, S.A. Integrating text and pictorial information: Eye movements when looking at print advertisements. J. Exp. Psychol. Appl. 2001, 7, 219–226. [Google Scholar] [CrossRef] [PubMed]
- Hughes, A.; Wilkens, T.; Wildemuth, B.M.; Marchionini, G. Text or Pictures? An Eyetracking Study of How People View Digital Video Surrogates. In Image and Video Retrieval: Second International Conference, CIVR 2003 Urbana-Champaign, IL, USA, 24-25 July 2003 Proceedings; Bakker, E.M., Lew, M.S., Huang, T.S., Sebe, N., Zhou, X.S., Eds.; Springer: Berlin/Heidelberg, Germany, 2003; pp. 271–280. ISBN 978-3-540-40634-1. [Google Scholar] [Green Version]
- Kroeber-Riel, W. Bildkommunikation. Imagerystrategien für die Werbung; Vahlen: München, Germany, 1996; ISBN 3800620405. [Google Scholar]
- Borji, A.; Itti, L. Defending Yarbus: Eye movements reveal observers task. J. Vis. 2014, 14, 29. [Google Scholar] [CrossRef] [PubMed]
- Loftus, G.R.; Mackworth, N.H. Cognitive determinants of fixation location during picture viewing. J. Exp. Psychol. 1978, 4, 565–572. [Google Scholar] [CrossRef]
- Batra, R.; Stayman, D.M. The role of mood in advertising effectiveness. J. Consum. Res. 1990, 17, 203–214. [Google Scholar] [CrossRef]
- Hess, R.; Visschers, V.H.M.; Siegrist, M. The role of health-related, motivational and sociodemographic aspects in predicting food label use: A comprehensive study. Public Health Nutr. 2012, 15, 407–414. [Google Scholar] [CrossRef] [PubMed]
- van Loo, E.J.; Caputo, V.; Nayga, R.M.; Seo, H.-S.; Zhang, B.; Verbeke, W. Sustainability labels on coffee: Consumer preferences, willingness-to-pay and visual attention to attributes. Ecol. Econ. 2015, 118, 215–225. [Google Scholar] [CrossRef]
- Risius, A.; Janssen, M.; Hamm, U. Consumer preferences for sustainable aquaculture products: Evidence from in-depth interviews, think aloud protocols and choice experiments. Appetite 2017, 113, 246–254. [Google Scholar] [CrossRef]
- Siegrist, M. Factors influencing public acceptance of innovative food technologies and products. Trends Food Sci. Technol. 2008, 19, 603–608. [Google Scholar] [CrossRef]
- Muller, A.; Ferré, M.; Engel, S.; Gattinger, A.; Holzkämper, A.; Huber, R.; Müller, M.; Six, J. Can soil-less crop production be a sustainable option for soil conservation and future agriculture? Land Use Policy 2017, 69, 102–105. [Google Scholar] [CrossRef]
- Sonntag, W.I.; Kaiser, A.; von Meyer-Höfer, M.; Spiller, A. Wie können Ansprüche der Gesellschaft in mögliche Veränderungsprozesse eingebunden werden? Konfrontation von Verbrauchern mit Zielkonflikten aus der Schweinhaltung. Berichte über Landwirtschaft—Zeitschrift für Agrarpolitik und Landwirtschaft 2017, 95. [Google Scholar] [CrossRef]
- Hartmann, P.; Apaolaza-Ibáñez, V. Green advertising revisited. Int. J. Advert. 2009, 28, 715–739. [Google Scholar] [CrossRef]
- Böhm, J.; Kayser, M.; Nowak, B.; Spiller, A. Produktivität vs. Natürlichkeit—Die deutsche Agrar- und Ernährungswirtschaft im Social Web. In Die Ernährungswirtschaft in der Öffentlichkeit: Social Media als neue Herausforderung der PR, 1st ed.; Kayser, M., Böhm, J., Spiller, A., Eds.; Cuvillier Verlag: Göttingen, Germany, 2010; pp. 105–140. ISBN 978-3-86955-584-3. [Google Scholar]
- Vierboom, C.; Härlen, I.; Simons, J. Akzeptanz organisatorischer und technologischer Innovationen in der Landwirtschaft bei Verbrauchern und Landwirten. In Organisatorische und technologische Innovationen in der Landwirtschaft: Schriftenreihe Band 21; Landwirtschaftliche Rentenbank: Frankfurt am Main, Germany, 2006; pp. 171–209. [Google Scholar]
- Rogge, E.; Nevens, F.; Gulinck, H. Perception of rural landscapes in Flanders: Looking beyond aesthetics. Landsc. Urban Plan. 2007, 82, 159–174. [Google Scholar] [CrossRef]
- Krampe, C.; Strelow, E.; Haas, A.; Kenning, P. The application of mobile fNIRS to “shopper neuroscience”—first insights from a merchandising communication study. Eur. J. Mark. 2018, 52, 244–259. [Google Scholar] [CrossRef]
Figure 1.
Stimuli used for the eye tracking experiment: (a) first stimulus: aquaponics cycle (b) second stimulus: farm AquaPonTec (AT) (c) third stimulus: farm AquaNatura (AN). Defined text and picture areas of interest (AOIs) are marked red, the AOI fish tank window is marked green.
Figure 1.
Stimuli used for the eye tracking experiment: (a) first stimulus: aquaponics cycle (b) second stimulus: farm AquaPonTec (AT) (c) third stimulus: farm AquaNatura (AN). Defined text and picture areas of interest (AOIs) are marked red, the AOI fish tank window is marked green.

Figure 2.
Boxplots with visualisation of the mean value (marked with x) representing the distribution of the summarised fixation time of all text and picture AOIs of stimulus AT and AN.
Figure 2.
Boxplots with visualisation of the mean value (marked with x) representing the distribution of the summarised fixation time of all text and picture AOIs of stimulus AT and AN.

Figure 3.
Responses to the items used to determine the participants’ attitudes towards aquaponics.

Figure 4.
Responses to the seven questions asked to determine the participants’ preferences regarding the aquaponics variants shown. The overarching question was: ‘For each of the following questions, please indicate which variant of aquaponics production you would choose’.
Figure 4.
Responses to the seven questions asked to determine the participants’ preferences regarding the aquaponics variants shown. The overarching question was: ‘For each of the following questions, please indicate which variant of aquaponics production you would choose’.

Figure 5.
Heat maps representing the fixation intensity of group 1 (upper row) and group 2 (lower row) for the respective stimulus: aquaponics cycle (a,d); AquaPonTec (b,e); AquaNatura (c,f). Colour changes from blue to green to yellow and finally to red show an increasing fixation intensity. Participants of group 1 perceived aquaponics as not too far from nature, participants of group 2 perceived aquaponics as rather too far from nature.

Figure 6.
Boxplots with visualisation of the mean value (marked with x) representing the distribution of fixation count (a), fixation time (b) and average fixation duration (c) within the AOI fish basin window, separated by participants who had missed information about the fish and those who did not miss this information.


Table 1.
Eye tracking measurements (median [lower quartile, upper quartile]) related to the picture AOIs of the respective stimulus.
Table 1.
Eye tracking measurements (median [lower quartile, upper quartile]) related to the picture AOIs of the respective stimulus.
| Stimulus | Building | Aquaculture | Hydroponics | Statistics1 | ||
|---|---|---|---|---|---|---|
| Number of participants who hit the AOI | AT | 17 | 17 | 18 | ||
| AN | 18 | 18 | 18 | |||
| Fixation count (n) | AT | 5.50 [3.75, 10.00] | 8.00 [2.75, 12.50] | 8.00 [1.75, 16.00] | χ2 (2) = 3.57 p = 0.167 | |
| AN | 9.00a [4.00, 11.00] | 12.00b [7.25, 16.00] | 7.00ab [5.00, 12.25] | χ2 (2) = 10.94 p = 0.004 | ||
| Statistics2 | z = −1.97 p = 0.48 | z = −2.37 p = 0.018 | z = −0.37 p = 0.710 | |||
| Fixation time (s) | AT | 1.49 [0.74, 2.07] | 1.75 [1.17, 3.88] | 2.10 [0.66, 4.32] | χ2 (2) = 5.78 p = 0.056 | |
| AN | 2.21a [1.13, 2.81] | 2.67b [1.45, 3.80] | 1.79ab [1.02, 3.47] | χ2 (2) = 8.11 p = 0.017 | ||
| Statistics2 | z = −2.42 p = 0.016 | z = −2.20 p = 0.028 | z = −1.28 p = 0.199 | |||
| Average fixation time (s) | AT | 0.21a [0.15, 0.23] | 0.26ab [0.20, 0.35] | 0.29b [0.26, 0.32] | χ2 (2) = 8.44 p = 0.015 | |
| AN | 0.25 [0.22, 0.29] | 0.25 [0.20, 0.30] | 0.25 [0.20, 0.30] | χ2 (2) = 0.33 p = 0.846 | ||
| Statistics2 | z = −2.63 p = 0.008 | z = −1.02 p = 0.306 | z = −3.07 p = 0.002 | |||
1 within stimulus: Friedman-test; different superscripts indicate statistically significant differences identified by post-hoc Dunn test with Bonferroni correction; 2 between stimuli: Wilcoxon signed rank test.
Table 2.
Correlations between the responses to the four items used to determine the participants’ attitudes towards aquaponics.
Table 2.
Correlations between the responses to the four items used to determine the participants’ attitudes towards aquaponics.
| Aquaponics is an Agricultural Production System with Good Future Prospects. | Aquaponics is a Good Opportunity to Produce Sustainable Food. | I Like the Idea of Producing Fish and Food Plants in a Recirculating System. | ||
|---|---|---|---|---|
| For me, aquaponics is too far from nature. | rs | −0.349 | −0.391 | −0.307 |
| p | 0.155 | 0.109 | 0.215 | |
| Aquaponics is an agricultural production system with good future prospects. | rs | 0.783 | 0.610 | |
| p | <0.001 | 0.007 | ||
| Aquaponics is a good opportunity to produce sustainable food. | rs | 0.630 | ||
| p | 0.005 | |||
Table 3.
Associations with the aquaponics farms AquaPonTec (AT) and AquaNatura (AN): Share of responses in each category relative to total responses for each farm in percent (total responses AT: 63; total responses AN: 53).
Table 3.
Associations with the aquaponics farms AquaPonTec (AT) and AquaNatura (AN): Share of responses in each category relative to total responses for each farm in percent (total responses AT: 63; total responses AN: 53).
| Category | Subcategory | Farm AT | Farm AN |
|---|---|---|---|
| General properties of the farms | Innovative | 14.29 | 3.77 |
| Interesting | 9.52 | 3.77 | |
| Environmentally sustainable | 11.11 | 16.98 | |
| Aspects of fish farming | Factory farming | 3.17 | 0.00 |
| Animal welfare | 0.00 | 9.43 | |
| Artificiality vs. naturalness | Artificial | 9.52 | 3.77 |
| Natural | 1.59 | 16.98 | |
| Neutral associations | Related to environment | 23.81 | 18.87 |
| Related to urban farming | 4.76 | 0.00 | |
| Related to research | 7.94 | 0.00 | |
| Other associations (neutral/positive/negative) | Related to information | 4.76 | 7.55 |
| Related to products | 3.17 | 3.77 | |
| Not assignable | 1.59 | 5.66 | |
| Uncertainty | Questions/uncertainty | 4.76 | 9.43 |
Table 4.
Fixation time in seconds (median [lower quartile, upper quartile]) of the text AOIs of stimulus AT and AN, for participants who perceived aquaponics as not too far from nature (group 1) and those who perceived aquaponics rather as far from nature (group 2).
Table 4.
Fixation time in seconds (median [lower quartile, upper quartile]) of the text AOIs of stimulus AT and AN, for participants who perceived aquaponics as not too far from nature (group 1) and those who perceived aquaponics rather as far from nature (group 2).
| AOI | Farm | Aquaculture | Hydroponics | Statistics1 |
|---|---|---|---|---|
| Stimulus AT | ||||
| Group 1 | 6.18a [5.01, 7.33] | 9.32ab [7.63, 11.50] | 10.92b [8.59, 12.76] | χ2 (2) = 9.56 p = 0.008 |
| Group 2 | 6.12 [5.45, 11.82] | 14.53 [8.44, 17.41] | 8.78 [8.22, 10.70] | χ2 (2) = 4.22 p = 0.121 |
| Statistics2 | U = 36.00 p = 0.730 | U = 25.00 p = 0.190 | U = 28.00 p = 0.297 | |
| Stimulus AN | ||||
| Group 1 | 7.62a [5.99, 8.69] | 8.38ab [6.55, 11.24] | 9.68b [8.00, 12.46] | χ2 (2) = 8.00 p = 0.018 |
| Group 2 | 7.99 [6.46, 9.47] | 10.92 [8.46, 15.29] | 11.26 [7.94, 12.98] | χ2 (2) = 3.56 p = 0.169 |
| Statisitics2 | U = 31.00 p = 0.436 | U = 24.00 p = 0.161 | U = 38.00 p = 0.863 |
1 within group: Friedman test; different superscripts indicate statistically significant differences identified by post-hoc Dunn test with Bonferroni correction; 2 between groups: Mann–Whitney-U test.
Table 5.
Fixation time in seconds (median [lower quartile, upper quartile]) of the picture AOIs of the respective stimulus, for participants who perceived aquaponics as not too far from nature (group 1) and those who perceived aquaponics rather as too far from nature (group 2).
Table 5.
Fixation time in seconds (median [lower quartile, upper quartile]) of the picture AOIs of the respective stimulus, for participants who perceived aquaponics as not too far from nature (group 1) and those who perceived aquaponics rather as too far from nature (group 2).
| AOI | Building | Aquaculture | Hydroponics | Statistics1 |
|---|---|---|---|---|
| Stimulus AT | ||||
| Group 1 | 1.19a [0.75, 1.99] | 2.79b [1.32, 4.19] | 2.98b [1.88, 5.66] | χ2 (2) = 10.67 p = 0.005 |
| Group 2 | 1.79 [0.46, 2.30] | 1.40 [0.24, 3.07] | 1.58 [0.41, 3.87] | χ2 (2) = 0.89 p = 0.641 |
| Statistics2 | U = 37.00 p = 0.796 | U = 24.00 p = 0.161 | U = 23.00 p = 0.136 | |
| Stimulus AN | ||||
| Group 1 | 2.57 [2.17, 3.11] | 3.11 [2.52, 5.23] | 2.44 [1.79, 4.06] | χ2 (2) = 4.22 p = 0.121 |
| Group 2 | 1.20 [0.42, 2.24] | 1.60 [0.75, 3.76] | 1.06 [0.72, 1.85] | χ2 (2) = 4.67 p = 0.097 |
| Statisitics2 | U = 14.00 p = 0.019 | U = 18.00 p = 0.050 | U = 12.00 p = 0.011 |
1 within group: Friedman test; different superscripts indicate statistically significant differences identified by post-hoc Dunn test with Bonferroni correction; 2 between groups: Mann–Whitney-U test.
© 2019 by the authors. Licensee MDPI, Basel, Switzerland. This article is an open access article distributed under the terms and conditions of the Creative Commons Attribution (CC BY) license (http://creativecommons.org/licenses/by/4.0/).
Share and Cite
MDPI and ACS Style
Schröter, I.; Mergenthaler, M. Neuroeconomics Meets Aquaponics: An Eye-tracking Pilot Study on Perception of Information about Aquaponics. Sustainability 2019, 11, 3580. https://0-doi-org.brum.beds.ac.uk/10.3390/su11133580
AMA Style
Schröter I, Mergenthaler M. Neuroeconomics Meets Aquaponics: An Eye-tracking Pilot Study on Perception of Information about Aquaponics. Sustainability. 2019; 11(13):3580. https://0-doi-org.brum.beds.ac.uk/10.3390/su11133580
Chicago/Turabian StyleSchröter, Iris, and Marcus Mergenthaler. 2019. "Neuroeconomics Meets Aquaponics: An Eye-tracking Pilot Study on Perception of Information about Aquaponics" Sustainability 11, no. 13: 3580. https://0-doi-org.brum.beds.ac.uk/10.3390/su11133580
Note that from the first issue of 2016, this journal uses article numbers instead of page numbers. See further details here.