Article

Extended Technology Acceptance Model to Predict Mobile-Based Money Acceptance and Sustainability: A Multi-Analytical Structural Equation Modeling and Neural Network Approach

1
Institute of Finance and Accounting, Faculty of Economics, University of Miskolc, 3515 Miskolc-Egyetemvaros, Hungary
2
School of International Business, Southwestern University of Finance and Economics, 55, Guanghuacun Street, Qingyang District, Chengdu 610074, China
3
Business School, York St John University, Lord Mayor’s Walk, York Y031 7EX, UK
*
Author to whom correspondence should be addressed.
Sustainability 2019, 11(13), 3639; https://0-doi-org.brum.beds.ac.uk/10.3390/su11133639
Submission received: 22 May 2019 / Revised: 22 June 2019 / Accepted: 22 June 2019 / Published: 2 July 2019
(This article belongs to the Section Economic and Business Aspects of Sustainability)

Abstract

:
This research is a pioneering study into the adoption of mobile-based money services for financial inclusion and sustainability in developing countries like Togo. Owing to their differences from more usual mobile-based banking and payment services, such technology is being aggressively promoted by providers of network telecommunication companies. However, the factors influencing its sustainable acceptance remain largely unknown. This paper extends the original Technology Acceptance Model (TAM), by integrating self-efficacy (SEMM), technology anxiety (TAMM), and personal innovativeness (PIMM). The research model is assessed with survey data of 539 actual and prospective mobile money users employing structural equation modeling–artificial neural networks (SEM–ANN) approach. A feed-forward-back-propagation (FFBP) multi-layer perceptron (MLP) ANN with significant predictors obtained from SEM as the input units and the root mean square of errors (RMSE) indicated that the ANN method achieves high prediction accuracy. The results present conclusive evidence that perceived ease-of-use (PEMM) is the most significant factor affecting consumers’ attitudes to mobile-based money. While perceived usefulness (PUMM) and PIMM affect adoption decisions, their impact is much lower. Consumer attitudes and intentions were found to have a significant relationship with TAM. SEMM and TAMM; however, they showed mixed results. These findings will be useful to retain prevailing users and attract new ones.

1. Introduction

The business environment has become dynamic and has experienced a rapid shift due to the introduction of new technologies and innovations, together with increased demand from customers. With this advancement of information and communication technology (ICT) and the advent of 3G and 4G services by telecom companies, mobile technology has become an integral part of our everyday human life. Mobile services have been introduced into various areas like banking, commerce, government, and healthcare [1,2,3]. From this perspective, a bibliometric analysis recently performed by Hew [4] showed increased interest in the scientific world in mobile technology, and suggested avenues for the future research of mobile technologies. As businesses become complex with changing conditions and unpredictable economic climates, innovation is inevitable if a businesses is to remain competitive. In 2019, the number of mobile phone users is forecast to reach 4.68 billion, and that figure is expected to increase significantly every year thereafter [5]. The high level of penetration of smartphones worldwide offers significant growth opportunities for increasing mobile financial services (MFS) usage and motivating financial institutions and telecommunication service providers by providing new mobile applications to increase and satisfy customers bases [6,7,8].
The widespread adoption of mobile phones, particularly in developing countries, has brought about the rise of mobile money services considered as one type of MFS. Mobile money (m-money) is a crucial recent technological innovations in mobile communication technology. The introduction of mobile money has brought new challenges and opportunities for businesses and individuals. Riquelme and Rios [9] stressed that as technology changes, both financial companies and consumers are embracing the advantages of the efficiency which comes along with it. Mobile users see mobile money services as an added value offered to them for carrying various banking as well as non-banking activities in real-time in a highly competitive world [6,10]. Mobile money, regarded as an innovative and effective means to achieve financial inclusion, is expected to provide financial services to two billion unbanked adults [11] in emerging economies that lack access to affordable financial services [5]. The unbanked are defined as adults who are not bank account holders or do not have access to a financial institution.
For the last ten years, access to financial services by unbanked individuals has been expanding partly because of the rapid growth in the adoption of mobile money services [11]. Mobile money bridges the gap between the cash and digital economies, enabling those without access to banks to load cash in a mobile wallet and transact digitally using money transfers, deposits, withdrawals of money, and paying bills, to mention a few, through a mobile phone network. In developing countries, these services have been highly successful, led by the example of the world’s leading mobile money service, M-Pesa, which was launched in Kenya in 2007 and operates today in 8 countries. Mobile money services have had a tremendous positive impact on people’s lives, and have contributed to increasing financial inclusion and economic growth, absorbing financial shocks, and reducing poverty [12,13].
In this paper, the adoption and usage of mobile money are examined in one of the emerging economies of the sub-Saharan West Africa countries, Togo, which has a population of more than 7.5 million people [14]. The adoption of products and customer engagement are the main indicators of the sustainability of the designated products (i.e., mobile money services), such that the number of active accounts is employed to comprehend how customers are accepting the services [15]. A service such as mobile money can be availed without internet connectivity by employing basic mobile phones, and it is viewed as convenient and safe. Based on the mobile money report published in 2018, Togo has made significant improvements from 2014 to 2017, since the services were launched in 2013 in the country. Under the sub-Saharan Africa category and over the period, the country obtained the best financial inclusion rate ahead of countries such as Côte d’Ivoire, Madagascar, Chad and Mali [16]. Noticeably, various companies in Togo have attempted to encourage their customers to use mobile money for their financial transactions. Recently, the national social security fund (i.e., la Caisse Nationale de Sécurité Sociale: CNSS) has admonished various employers to pay their social security contributions via Flooz and T-Money [17]. There are presently two major mobile telecommunication companies (Moov and Togocel) which provide mobile money service in Togo: Flooz and T-Money respectively.
Despite the inherent benefits of such services, the mobile money adoption rate in Togo has remained somehow low, a phenomenon which requires further investigation. Nearly 67% of the Togolese population was subscribed to mobile telephony in 2015, and the number of mobile internet users doubled between 2014 and 2015. However, less than 15% of consumers have bank accounts in Togo [18,19]; in addition, mobile banking acceptance rates are lower than expected, i.e., 1% [20]. It is then rational to merely presume that mobile money should provide significant input to nurture the rate of mobile financial services usages. In reality, this is far from being reality. Although most financial institutions, together with the government of Togo, offer subsidies to farmers through e-wallet technology to support a digitization project of the agriculture transformation agenda [21], the sustained usage of the designated technology has not been embraced on an adequately large scale.
Regarding their environment, based on a World Bank survey on mobile money financial inclusion (2018), mobile phone subscribers currently represent almost 80% of phone users, while the penetration rate of m- money accounted only for almost 45% in Togo, ranking behind its neighbor country Ghana (60%) [16]. Therefore, the rate of mobile money acceptance in the West Africa nation also differs. These phenomena create a challenge both for established players and for new participants like Fintech startups. Whereas mobile money has stimulated financial inclusion to lots of unbanked Ghanaians, Togo lags behind in its mobile money acceptance rate. Early studies have investigated consumer adoption of mobile money services in Africa (including Togo) [22,23,24]. However, limited studies have probed the factors that contribute to the continued usage of mobile-based money technology and services within the underbanked and unbanked user segment and beyond.
Moreover, mobile money services are yet to focus on traditional offers such as money transfers, bill payments, and airtime top-ups and are not tailored enough to the demands of the low-income population [25]. There is still a large group of customers who are reluctant to espouse such services due to uncertainty and technology anxiety issues about mobile financial services in general [26,27]. Nevertheless, such services have been well accepted in similar emerging economies, including the Philippines and Kenya. In recent work, for instance, Suri et al. [28] stressed that the mobile money service M-Pesa lifted 2% of Kenyan households out of poverty. The literature on the espousal of mobile-based money in Togo is very scant [23], and no research has been found in Togo regarding the mobile money adoption using the TAM model, although this model has had extensive relevance in explaining consumers’ responses to IT use and adoption [29]. There are still important challenges delaying their disposition if digital finance is to reach its full potential in Togo. Customers are not adequately empowered to be active players in the ecosystem. All these reports led the authors to choose Togo as a good experiment field for assessing the determinants of mobile-based money services adoption and sustainable development from the developing country context.
Since it is unclear how Togolese mobile money users perceive technology usage, the motivation behind this research is to assess and predict key antecedents influencing behavioral users’ attitudes towards adopting mobile money services. This study attempts to bridge the gap in the existing literature by analyzing the perceptions that users have towards this technology while presenting a strategic framework for policymakers and practitioners to use the inherent advantages offered by mobile money. This research differs from past studies in three ways:
First, it aims to explore the attributes that warrant the adoption and sustainability of mobile money services among both potential and actual users. Therefore, the result provides a practical analysis, so that providers could understand customer behavioral intentions regarding the provided services, which, in turn, help in taking effective decisions.
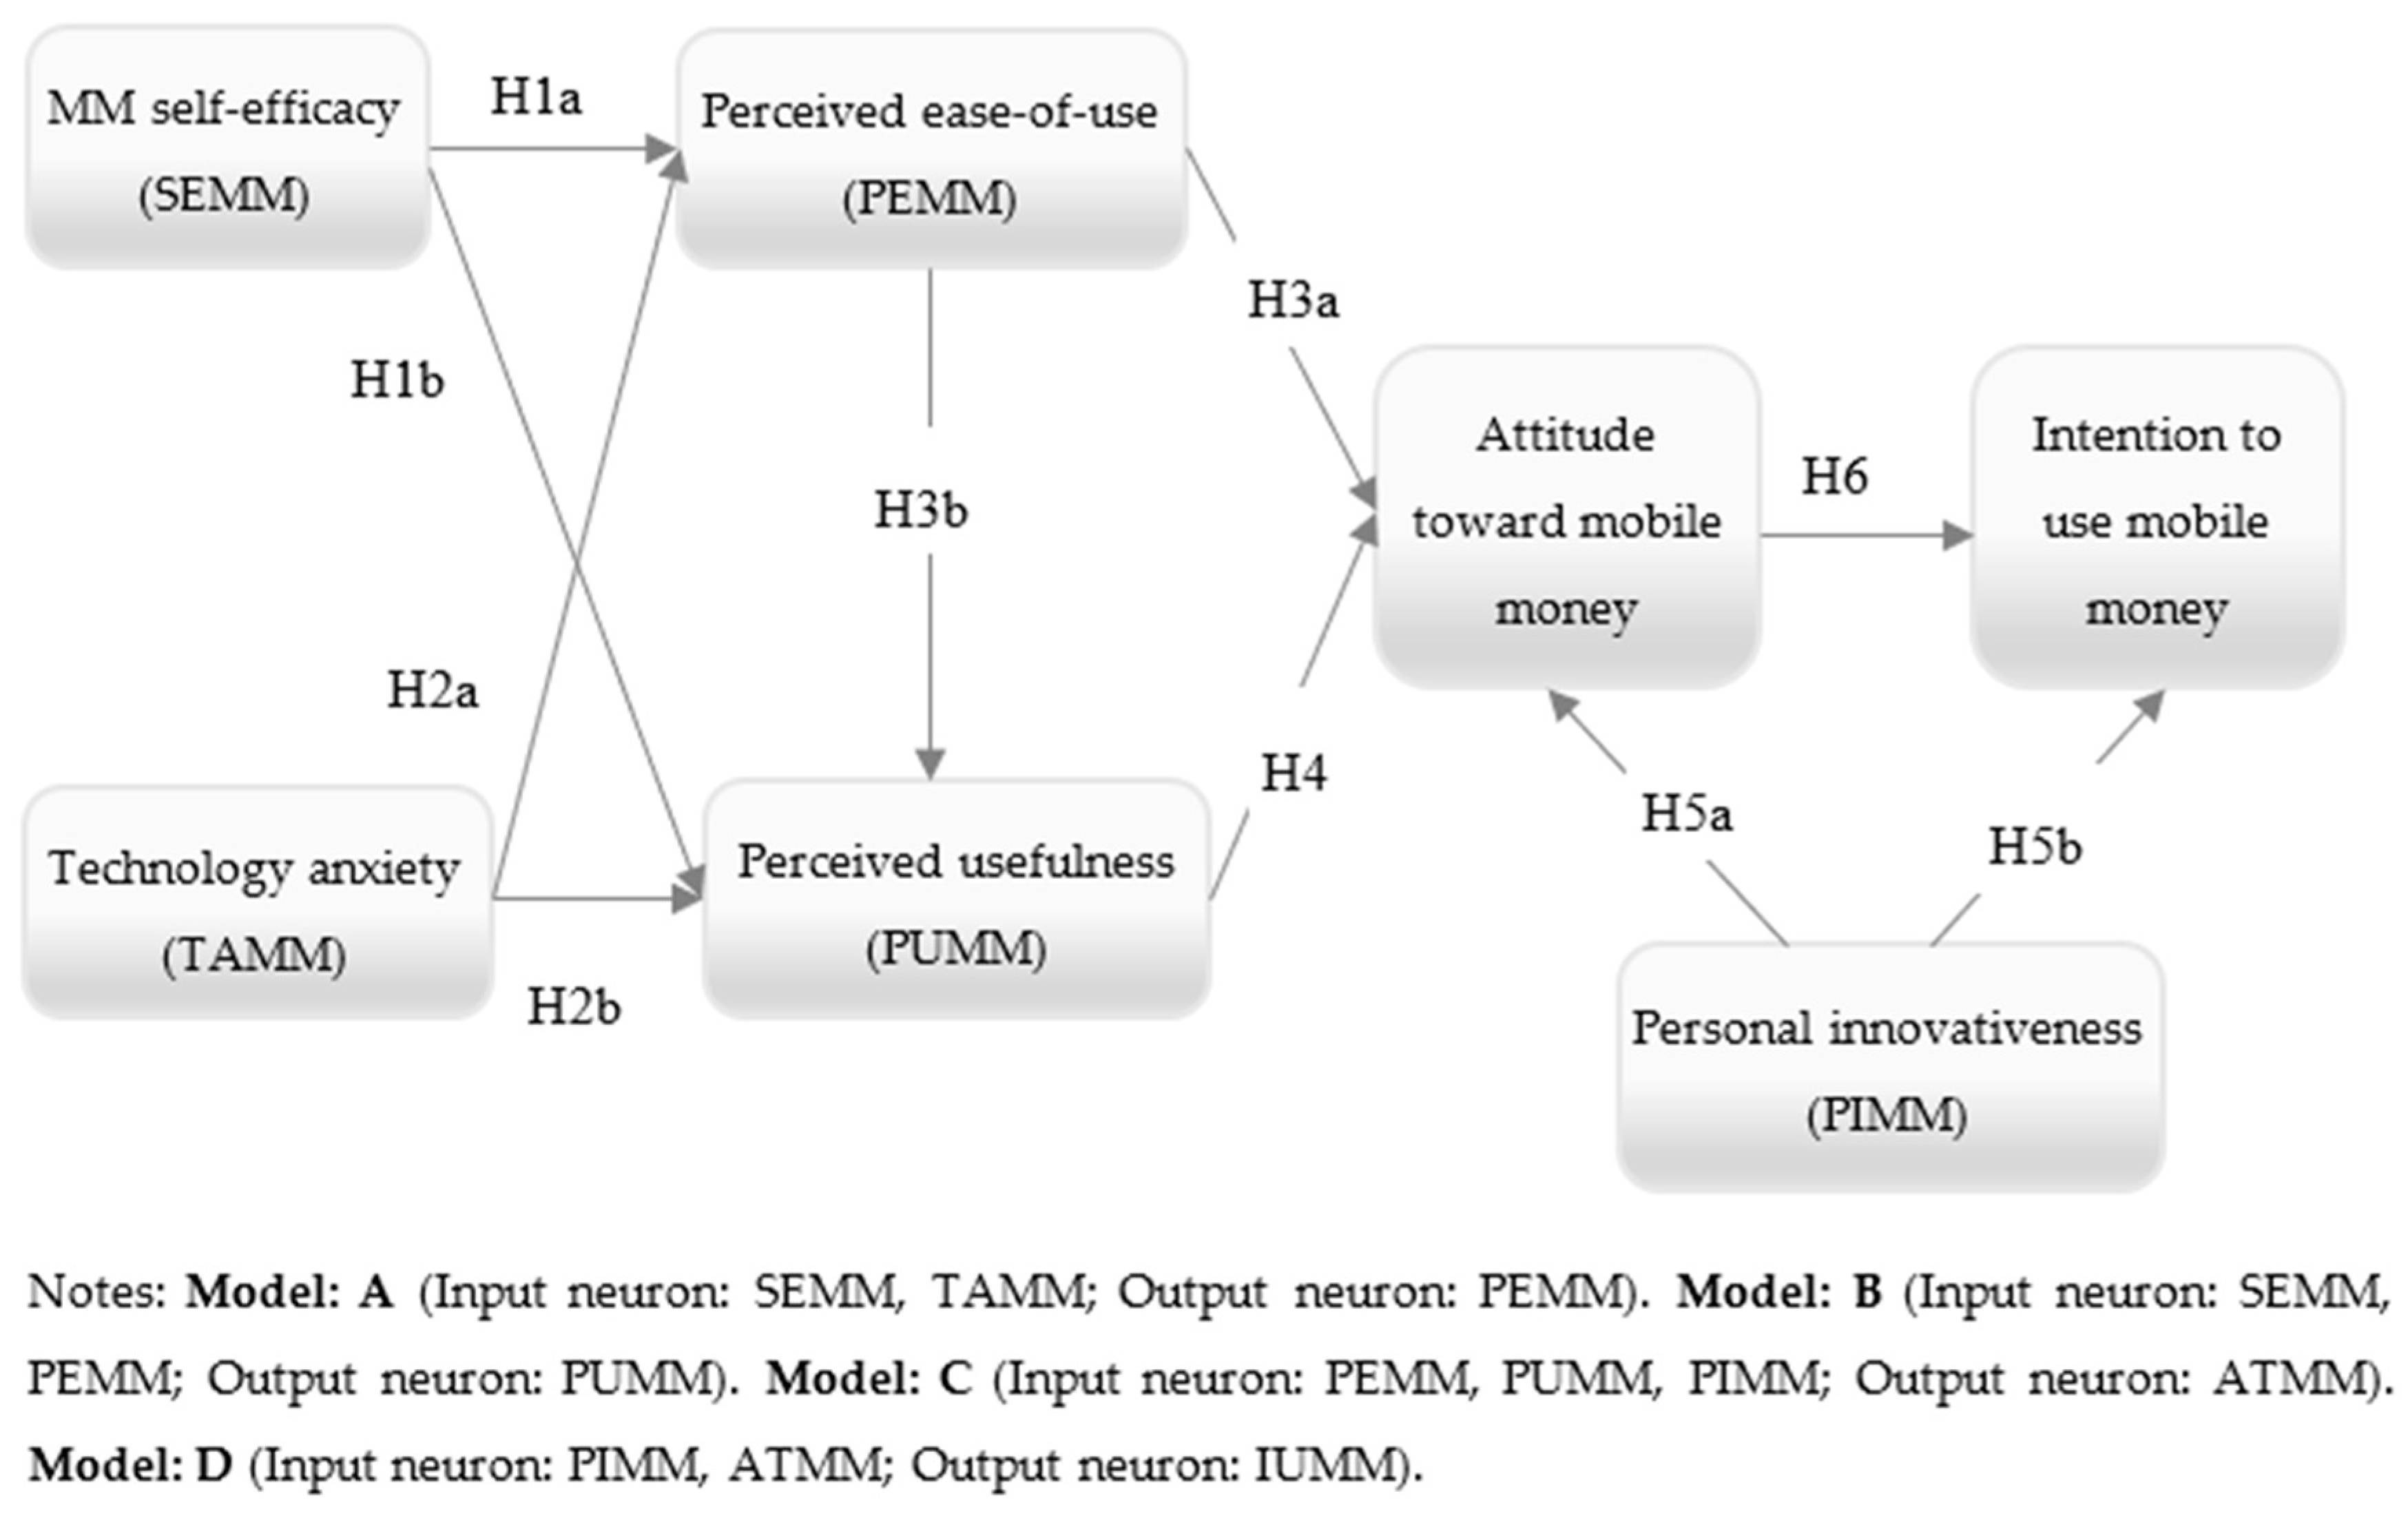
Second, the study empirically creates a framework to test the applicability of the TAM to mobile money transfer context, as it is a useful research model to explain the internal and external motivation in initiating technology adoption [30]. TAM has been utilized successfully in assessing the antecedents that drive the adoption of several technologies. The projected model has similarities to earlier extended TAMs used in the developed countries, i.e., acceptance of self-service technology (SST) by French consumers [31] and assessing the adoption of mobile payment through US consumers [29]. We utilize the TAM from the perspective of developing countries and incorporate into the model mobile money self-efficacy, new technology anxiety, and personal innovativeness of IT. The effect of these constructs on the core TAM variables (perceived ease-of-use and perceived usefulness) is examined, as they are likely to impact the perceived ease-of-use and perceived usefulness on mobile money attitude and mobile money use intention.
Finally, this study aims to use an innovative research methodology presented in a two-stage approach. In the first stage, a structural equation model (SEM) is adopted to understand the significant influence of antecedents on mobile money services acceptance. The second stage used an artificial neural network (ANN) model to identify the importance of the antecedents. Therefore, this study develops a more inclusive and predictive model that can overcome the basic drawback of the prevailing model and offer a predictive analysis of the user perceptions of mobile money adoption in developing economies.
This research makes several contributions regarding an evolving market and technology to researchers, the literature on innovation systems and financial inclusion for developing countries, financial institutions, users and government by exploring and discussing direct implications for m- money role players.
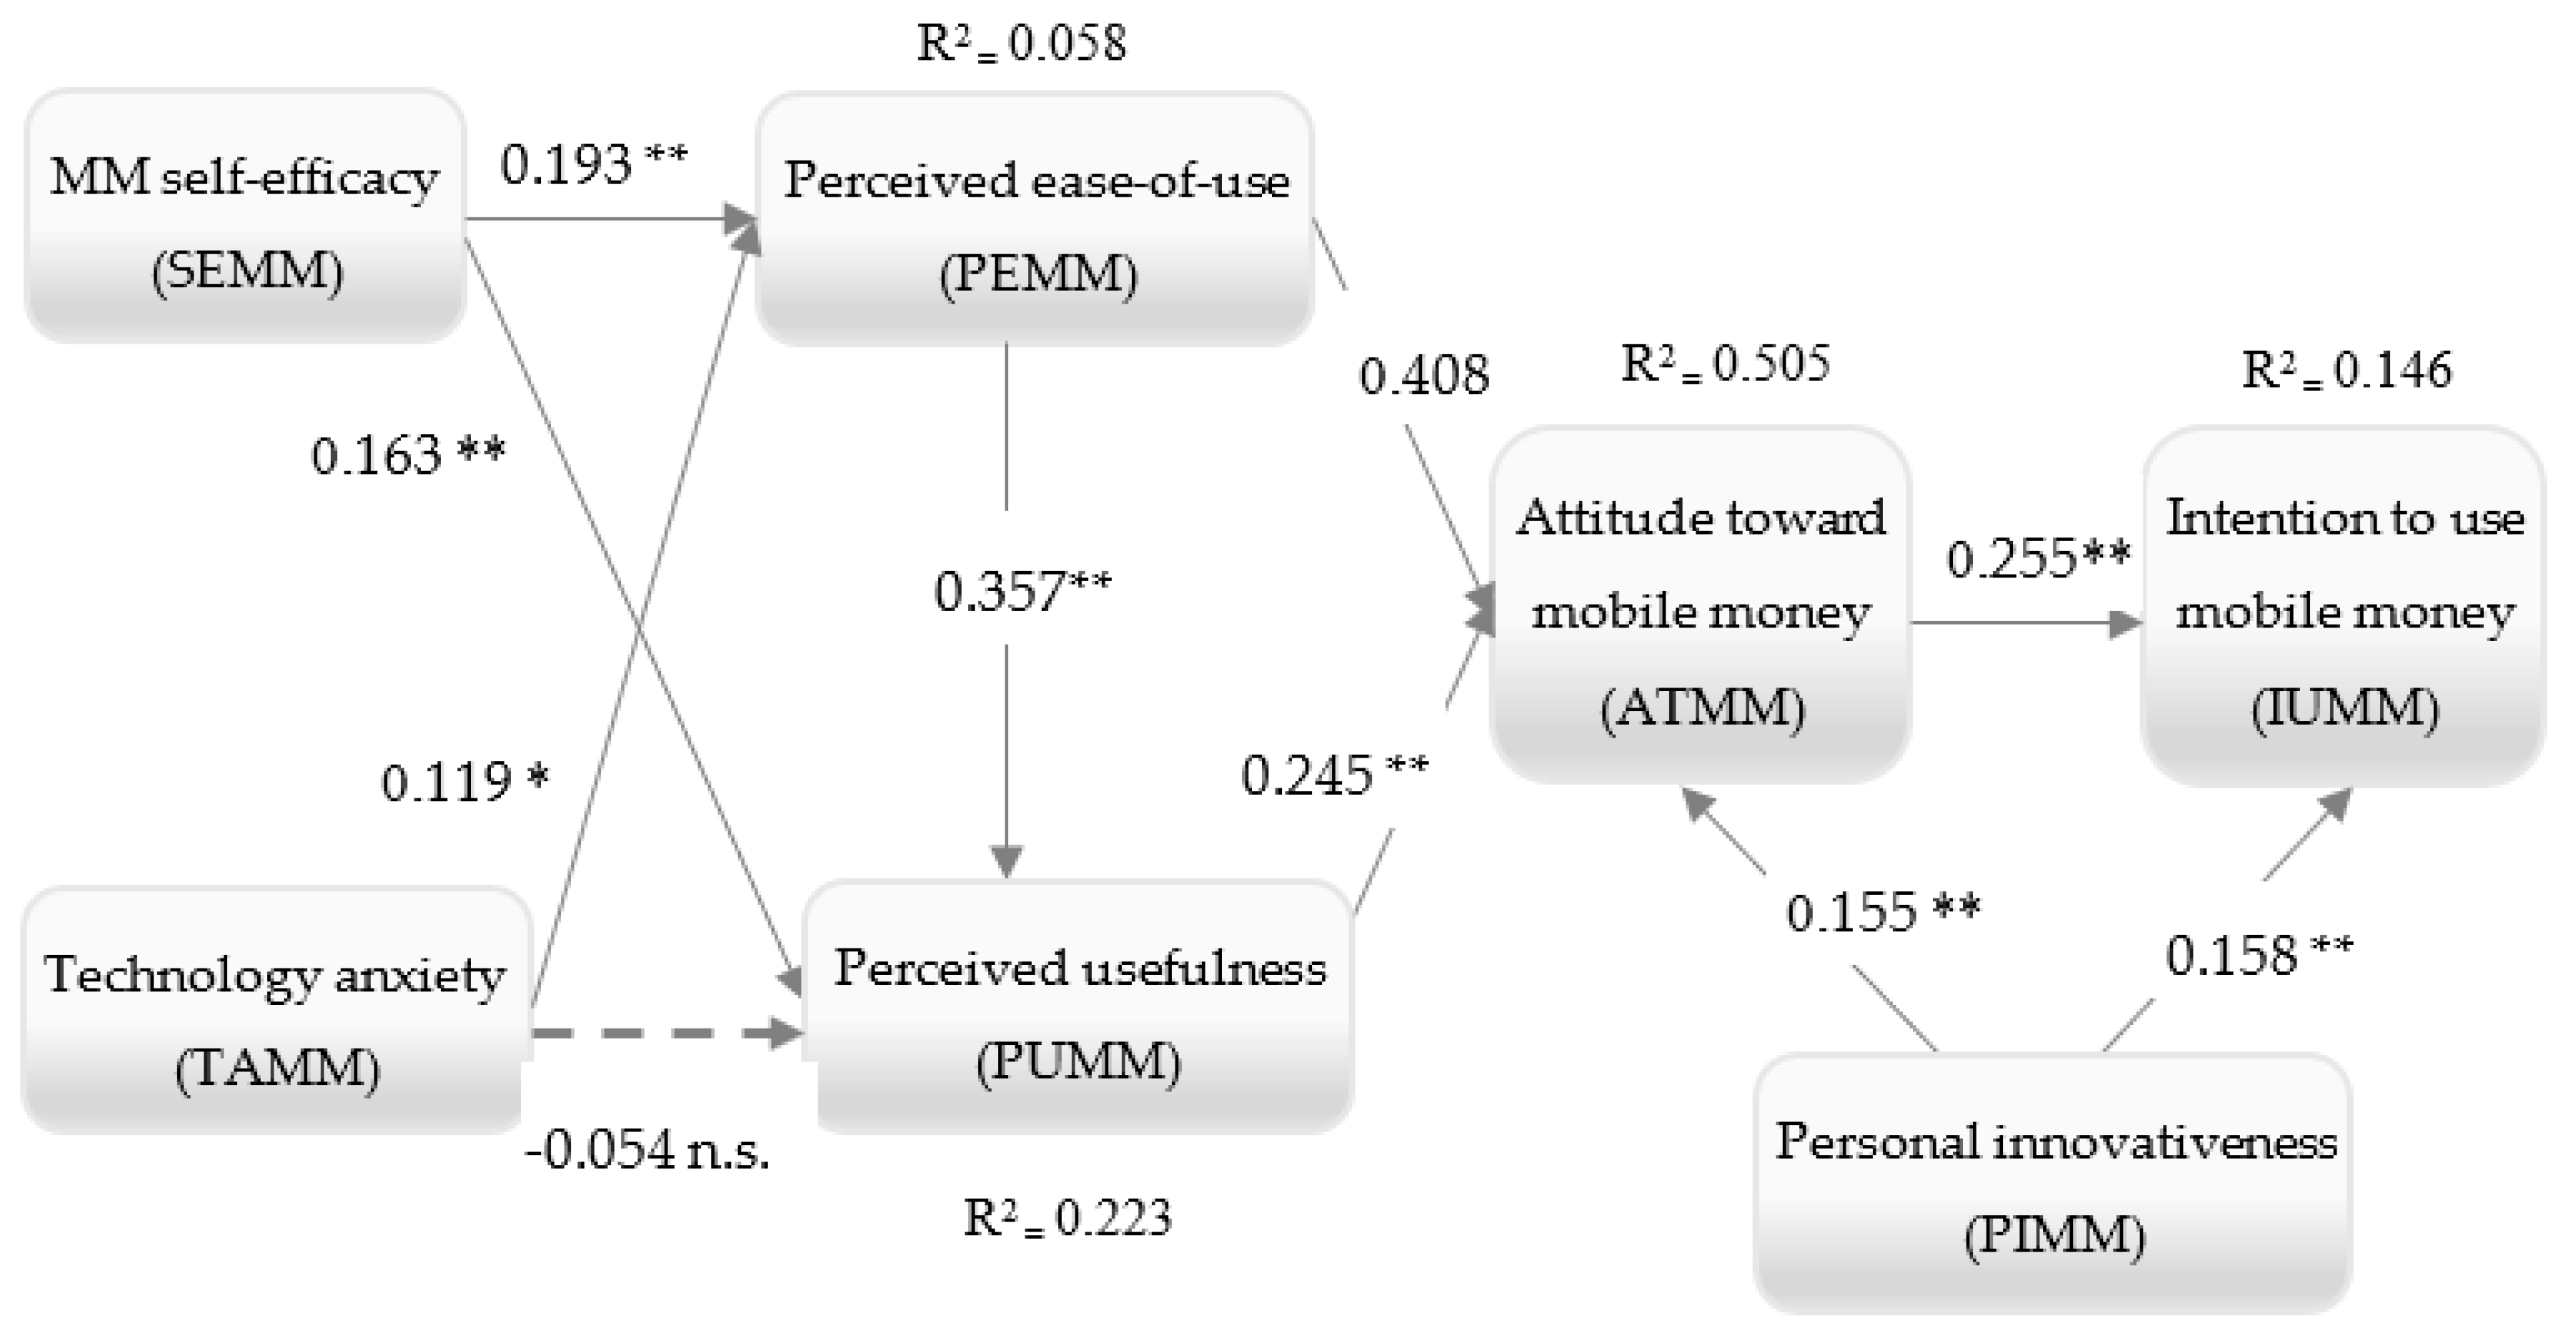
Primarily, we offer nuanced empirical outcomes on the fundamental factors that drive the success or failure of mobile money innovations by extending the traditional TAM. Given the result of the integrated methodology and the variables of TAM, the perception of ease-of-use is revealed to be the most important predictor, followed by the perceived usefulness in mobile-based money regarding the attitude constructs. It is important therefore that mobile money transfer providers consider how to make the use of the services easily, as well as emphasize on building the user-centric apps to create the awareness of usefulness. This study sheds further light upon the attitude of the Togolese consumer regarding mobile data services in general, and the usage of mobile-based phones for financial services specifically. Considering the extended variables associated with TAM, personal innovativeness acts as an enabler of user behavior, and company providers require to stimulate this aspect to facilitate the usage of mobile money services. Therefore, these implications could lead to an increase in financial transactions conducted on mobile devices. The contributions go along way towards extending the understanding of TAM to recently emerging contexts such as the mobile-based money in Togo.
Moreover, this research provides a robust tool combining SEM and ANN in order to predict the determinants that are more prone to the adoption and sustainability of mobile-based money services. Unlike earlier researches that studied consumer behaviors using a single approach (e.g., SEM), our study applied an SEM-artificial neural network technique to explain consumer behaviors regarding m-money. The SEM–ANN methodology shows to be a powerful technique, as it examines and provides the “what” and the “why” factors that have affected or will affect in the future. The result shows that SEM and ANN analyses complemented each other in shedding light on the complex process associated with the various influential factors to the development of mobile money innovations. Our SEM analysis contributes to the understanding of the relationships between various factors. One of the most substantial attributes of ANNs remains to be adjusted to periodic variations and detecting patterns in intricate natural nonlinear schemes. Therefore, the results of this study prove ANN to better predict than the usage of the SEM technique regarding the adoption of m-money. Correspondingly, this research can grasp the advantages of both methods (multi-analytic method: SEM-ANN) and assess complex linear and non-linear associations along with ranking the relative importance of the predictors.
Having established the justification and purpose of this study, the remainder of the paper is organized as follows: We present the contextual setting viewed as literature review while covering hypotheses development and research model presentation. Then, we present the research methodology, including the background of SEM-ANN analysis. In the final section, the findings, conclusion and implications, limitation, and future research regarding mobile-based money services adoption and sustainability are discussed.

2. Literature Review and Hypothesis Development

2.1. Mobile Money in the Context of Mobile Financial Services

The interest manifested in the growth of inclusion has been captured by the advent of money transfer services offered over mobile phones and the further potential that this technology has provided for financial service development [32]. Mobile money services accelerate the speed of money transfer as funds move in electronic instead of the physical form [33]. Mobile money transfer is viewed as a service for transferring money through mobile phone-based [34]. Mobile money employs IT tools and channels that are non-banking for extending financial services access to subscribers who cannot be attained by banks [34]. Although past research reveals that people tend to prefer mobile financial services (MFS) to other self-service technology (SST) in Togo [35], this study will focus merely on the mobile money service which is one type of MFS [3]. Traditional banks continue to offer their mobile banking services and facilities; however, it is important to clarify the difference between mobile banking, mobile payment, and mobile money.
In the context of mobile banking, there are also various applications provided by banks, which can be installed on a wide range of mobile platforms and can easily be utilized. The transactions are done between the customer and the bank, or alternatively, between a customer to another third party, with the bank intermediating between the two. The channel of communication might be different, such as a customer, and the third party may be subscribers to different internet mobile service companies. Mobile payment involves the transfer of money (e-money) from one party (e.g., consumer) to another party (e.g., merchant or seller) employing a mobile-based device [36]. It is an add-on service on mobile technology to ease fund transfers between individuals and/or merchants. Considering mobile banking as well as and mobile payments, consumers need to have a bank account in the back end.
For mobile money, the process differs. Monetary transactions occur between two parties (users and merchants) where both of them are subscribers to a similar mobile money service in the same telecom service provider’s domain. For transferring money, a mobile phone user registers with a mobile money agent and then deposits cash that will be used for later transaction [37]. The authorized agent handles the monetary transactions between the parties. This cash is shown as e-money in a mobile wallet on the sender’s phone [33]. The customer can then use her/his electronic money to perform transactions like sending money and paying bills [23,38]. Once a user transfers money to another mobile phone, the receiver obtains prompt notification with a unique code through short message service (SMS). The recipient can visit the closest agent to collect the cash, or keep the money as a deposit in her or his e-wallet for future transactions [39]. Regarding mobile money, customers typically are not required to have bank accounts in the back end. Therefore, the costs to access the designated service and switch between service providers are significantly lower than that of mobile banking and mobile payment, which might have theoretical implications for user demands.

2.2. An Extended TAM and Mobile Money Transfer Services

To understand user behavior towards the adoption of innovative technology, academics have developed various behavioral decision theories and intentional models over the last four decades. Studies have been inclined to employ variables from the most prominent theories and models, including the theory of reasoned action (TRA), the theory of innovation diffusion (IDT), the technology acceptance model (TAM), the theory of planned behavior (TPB), and the unified theory of acceptance and use of technology [40,41,42,43,44].
Within the Information Systems (IS) literature, models such as the TAM [45] have been employed to explore the factors of technology acceptance empirically. Grounded on the objectives of this study, and due to the importance concerning the explanation of online consumer behavior, we have employed these attitudinal models and theories based on social psychology, like TAM [45]. TAM is one of the most widely used theories in IS research. It has been considered as the most robust, parsimonious and persuasive model in innovations acceptance behavior [45,46]; thus, we consider this theoretical model as a background for the drive of the present study. The TAM model positioned attitude toward the use of new technology as a construct may be explained by two perceived variables: usefulness and ease-of-use. Various studies apply the TAM model to predict intentions to adopt new technology by individuals, groups, or organizations [45]. Drawing on the theory of reasoned action (TRA) [47] and in its simplest form, TAM suggests that perceived ease-of-use, perceived usefulness, attitude regarding use, and behavioral intention will predict actual usage of technology. Additionally, the TAM has been contingent on numerous additions and developments, including the unified theory of the acceptance and use of technology (UTAUT) [48].
With the review of TAM literature, Maranguni´ and Grani´ [49] acknowledged seven past TAM related works. The objectives of these works and the analysis techniques employed differ. For instance, Legris et al. [50] and Turner et al. [51] examine the question of whether the TAM explains actual use, Hsiao and Yang [52] investigated factor analysis to find trends in the usage of the TAM whereas Mortenson et al. [53] conducted the review using the computational literature review (CLR) based on the TAM. The CLR is an answer to the challenge encounter in selecting, filtering, and analyzing large volumes of research articles. It complements rather than substitutes the human researcher in the systematic literature review (SLR) process, and is beneficial for more generic analysis of journals and individual researchers and teams. TAM has also been applied and empirically supported in the prediction of the adoption of E-commerce [46], mobile marketing [54], mobile wallets [55], e-learning [56]; mobile banking [57], Big Data [58], business-related technologies [59] and much other information. Considering the performance of the mobile-money business and the various determinants acquaint from literature, it will be prudent to empirically examine some key factors. Therefore, Narteh et al. [60] assessed the effect of eight exogenous constructs, including perceived (usefulness, ease-of-use, risk, trust, complexity, cost of use), social influence, and relative advantage on the behavioral intentions of users of mobile money services. The results revealed that perceived (usefulness, ease-of-use, trust, cost of use), and social influence significantly contribute to the mobile money technology adoption [60]. Many studies have patronized TAM’s explanatory power within the context of IS application in general [61], and several studies have successfully extended its application to the context of mobile financial services [29,62,63].
Despite recent and various extensions of the Davis et al. [45] technology acceptance model (TAM), just a few studies have focused on the factors that influence the acceptance of the mobile-based money services from a holistic approach integrating several principles [64]. In order to bridge the gap, the propose tested model in this research integrates individual difference factors, considering earlier criticism that TAM suffered from the lack of individual difference factors and inclusion of these features by researchers who proposed extended models [29,31,61]. Based on the above discussion and the result of the pretest that probed on respondents regarding the factors that would either drive or hinder their use of mobile money transfer, the study integrates mobile money transfer self-efficacy, technology anxiety and personal innovativeness of information technology with the TAM variables. These factors have not only been revealed to be significant in prior research, but also, their theoretical foundations are rooted in some of the most influential theories and models in the field of technology adoption. Variables such as perceived usefulness, perceived ease-of-use, attitude, and intention to use are adopted from the TAM [45]. Additionally, self-efficacy and its role in technology acceptance have been an aspect of the investigation on the acceptance of various technologies [29,65,66,67,68]. New technology anxiety and personal innovativeness in information technology, which have also been factored in the rate of acceptance of new technology, are adopted from the literature of information technology [31,34,69]. The relationships between the variables will be explained in detail in the next section.

2.3. Mobile Money Self-Efficacy (SEMM)

Self-efficacy denotes a self-confidence regarding the possession of the required skills to complete a task; it is people’s judgment of their capabilities to organize and execute courses of action required to attain designated types of performances [70]. Dominant in Bandura’s concept of self-efficacy, it is the clue that this personal belief remains the main basis and a direct element of an individual’s behavior and actions. It conceptualizes the individual perception of internal control [71,72]. This implies that mobile money services consumers are more likely to pursue activities within their arrays of perceived competencies, and is an important factor in understanding individual responses to new technology [66]. Self-efficacy has been included in studies of the acceptance of mobile data services [65], online shopping [73], and information communication of technology (ICT) [74], particularly in mobile money transfer [75]. Therefore, the following hypotheses are presented:
Hypothesis 1a.
Mobile money self-efficacy has a significant link to the perceived ease-of-use of mobile money services.
Hypothesis 1b.
Mobile money self-efficacy has a significant link to mobile money perceived usefulness.

2.4. New Technology Anxiety (TAMM)

Technology anxiety is an apprehensive belief showing the consumer’s state of mind concerning his/her ability and willingness to adapt when considering using technology in general [61,76]. Fast changes in technology bring challenges to companies due to consumers’ resistance to espousing new technology [77]. In the transition to new technology products, consumers might come across various difficulties, such as being unable to operate products correctly [78,79], which lead to technology anxiety. Technology anxiety, conceived as an anchoring belief, impacts the perceived ease-of-use of a system [61,80]; therefore, customers who are anxious about the application of IT may not perceive mobile money transfer as being easy to use. Technology anxiety has a negative influence on the acceptance of self-service technology (SST) usage [31] and the adoption of new technological forms, such as mobile service industries [26]. Hence, we proposed the following hypotheses:
Hypothesis 2a.
Technology anxiety has a significant link with mobile money perceived ease-of-use.
Hypothesis 2b.
Technology anxiety has a significant link with mobile money perceived usefulness.

2.5. Perceived Ease-of-Use (PEMM), Perceived Usefulness (PUMM), and Attitudes (ATMM) toward Mobile Money Services

The traditional TAM integrates perceived ease-of-use (PE) of technology and perceived usefulness (PU) of the technology as two main constructs. Alike with the concept in Davis et al. [45], PU in this research denotes the extent to which a person believes that using mobile money will enhance his or her performance. Mobile money is supposed to provide diverse benefits to its users, such as general convenience, simplification of payment as compared to other forms of payments, all of which might endorse a positive attitude towards and a higher intention to use mobile-based money transfer payment [64]. PE of mobile money denotes the consumers’ perception of the effort and time that has to be expended in to use mobile money service and the degree to which the technology is understandable or not. The mobile money interface should be simple and easy to comprehend, considering the low rate of technological sophistication and literacy rates in Togo [81]. Previous studies have consistently recognized PE to have direct effects on PU and attitude [64,82]. A study employing TAM reveals that there is a positive relationship between PU and PE [83,84]. The ease-of-use of a mobile money system can impact its usefulness and user’s attitude. Hence, the following hypotheses are posited as follow:
Hypothesis 3a.
Mobile money perceived ease-of-use has a significant link to attitudes towards m-money.
Hypothesis 3b.
Mobile money perceived ease-of-use has a significant link to mobile money perceived usefulness.
Hypothesis 4.
Mobile money perceived usefulness has a significant link on attitude towards mobile money.

2.6. Personal Innovativeness (PIMM)

Agarwal and Prasad [85] (p. 206) explained personal innovativeness as “the willingness of an individual to try out any new information technology”; it remains conceptualized as an attribute which is not impacted by environmental or internal factors. Individual innovativeness prevails as a determined trait that is reflective of an individual’s primary nature when exposed to innovation [86]. Innovativeness can be grouped under the personality characteristics that outline the degree to which individuals accept and adopt new ideas, products, and systems [87]. It has been used to predict the adoption of technological innovation among consumers [88]. Regarding the innovation diffusion concepts [89], people react differently to a novel idea, practice, or object due to their differences in individual innovativeness, a willing tendency regarding adopting an innovation. In the earlier work, Fang et al. [90] assessed the psychological variables (trust in sponsor and personal web innovativeness) entail in a decision for or against participation in web surveys. Their findings revealed that both variables exerted direct determinant effects rather than moderate effects on participation attitude and perceived behavioral control, which, in turn, significantly influenced participation intention. From this end, personal innovativeness would influence attitude and intention in the context of consumer participation in mobile money services.
Several empirical studies have found a significant relationship between personal innovativeness and behavioral intention [91,92]. Thus, we propose:
Hypothesis 5a.
Personal innovativeness has a significant link with the attitude of using mobile money.
Hypothesis 5b.
Personal innovativeness has a significant link with the intention of using mobile money.

2.7. Attitudes (ATMM) and Intentions of Use (IUMM)

The relationship between attitude and intention emphasized in the TAM proposes that attitude acts as an evaluative predisposition to behavior. The attitude towards using mobile money transfer (MMT) has been considered as the extent to which an individual perceives a positive or negative feeling related to MMT. Prior studies on TAM and in other consumer fields have found a link between attitudes and intentions [82,93]. A plethora of studies have established that consumers with a positive attitude towards a technology are more inclined to use it [49,94]. Indeed, past studies have confirmed attitude as the most influential predictor of intention to use IT in the original TAM [82,95,96]. From this perspective, it is highly important to educate users of mobile money at the point of sale. Based on these discussions, we, therefore, posit that:
Hypothesis 6.
Attitude towards mobile money has a significant link with mobile money behavioral intention.

2.8. Research Hypotheses

Using the theoretical background of the TAM, mobile money self-efficacy (SEMM), new technology anxiety (TAMM) and personal innovativeness (PIMM) discussed above; we propose a research model that identifies several attributes as predictors of mobile money transfer (MMT) users’ attitude and intention. Due to the proposed combined methodology, particularly the application of the ANN technique, the research model is categorized into fourfold such as model A, B, C, and D. The relationships between these constructs and groups are integrated into the conceptual model, as depicted in Figure 1 below.

3. Research Methodology

3.1. Variable Measurement

A draft of items, prospecting each construct’s underlying dimension was settled, based on a review of the prior literature and an attribute classification of a small group of experts in the area of mobile-based payment together with some highly experienced users of mobile money, who made a final choice of relevant components [97]. Their suggestions were used to adapt the wording and some of the most recognized scales to make them tailored to the current context.
Specifically, we revised new technology anxiety (TAMM) scale, which reflected consumers’ apprehensions and fears concerning using technology, from Meuter et al. [76] and Park et al. [69]. Self-efficacy (SEMM) is adapted from Venkatesh and Bala [61]. The personal innovativeness (PIMM) scale was adapted from Agarwal and Prasad [98], Ramos de Luna et al. [99], and Zoran et al. [59]. The perceived ease-of-use (PEMM) scales follow the similar scales employed by Venkatesh [59] Venkatesh and Davis [80] and Parijat et al. [34]. The Perceived usefulness (PUMM) scale was adapted from Bhattacherjee and Premkumar [59], and Davis et al. [45],. The attitude (ATMM) scales drew on established scales from the consumer behavior literature [100,101]. Lastly, items of usage intention (IUMM) are adopted from Venkatesh [71] and Venkatesh and Davis [102]. The scales were all measured in 5-point Likert scales anchored between 1 (totally disagree) and 5 (totally agree), except for Attitude which was based on a 5-point semantic differential scale. Appendix A Table A1 offers more information about constructs.
The second part of the questionnaire included a series of questions concerning respondents’ socio-demographic characteristics and behavior (i.e., gender, educational qualifications, age, and respondents’ experience with mobile money transfer). The adapted questionnaire was tested for its face validity among a group of eight experts. Changes were included grounded on the recommendations of the experts, and the questionnaire was therefore employed for pretesting.

3.2. Pretesting the Questionnaire

A total of 32 items were engendered and screening through an iterative process that employed item-total correlations and explorative factor analysis [103]. A pre-test of all items was done on a sample of 97 participants (e.g., academic experts and graduate students) to confirm that their meaning and understanding was clear, to determine the time taken to complete the questionnaire. The outcomes of this pilot study prompt to minor revisions of the questionnaire’s wording and diminish the original 32 items to 24. Therefore, the result of testing the purified items revealed that the Cronbach’s alpha was above 0.70, which was regarded to be acceptable for unidimensionality. The factor loadings were greater than or equal to 0.60 [103]. Per the revised 24 items accessible, data were collected for a sample of 510 individuals.

3.3. Sampling and Data Collection

The focus of this research is to establish the relationship between various constructs (intention and attitude) while extending the traditional TAM regarding mobile money services. Therefore, this study is built based on data from a survey of mobile money users in Lomé, the Capital city of Togo. Lomé is the busiest, the most crowded district with the highest number of mobile money agents, and major economic city of Togo.
A purposive sampling technique was applied to select the various study areas, and simple random sampling was employed to sample the subscribers. The application of the purposive sampling method was employed to sample the district business units since the majority of users of mobile money services reside in these areas. The application of the simple random technique was to offer an equal chance to the users of the service. This came out by randomly selecting users, who were physically present at each of the business/service center until designated members or units were chosen. The questionnaire was administered directly, and the samples were contacted directly.
With the aim of guaranteeing data quality, the study objectives were clarified to participants before each interview, and assured participants that the collected data would remain confidential and be used for research purposes only. This study followed the original version of the questionnaire in English, which was then translated into French (the official language of Togo). In the translation phase, two bilingual IT professionals independently with extensive experience with mobile money service translated the questionnaire from English to French, favoring conceptual rather than literal translation. It was translated into simple French at a roughly 6th-grade reading level to obtain a better understanding of the questions by the general population. After the initial translation, both translators, along with the researcher (bilingual: French-English), convened to resolve any discrepancies and integrate both translations into a single version. The primary data using a structured questionnaire (in French) was administered to respondents (prospective and current users of mobile money). Literate people completed their survey themselves, while for illiterates, help was offered. The questionnaire typically took 10–15 min to complete. The collected questionnaire was retranslated from French to English following the same procedure for the data analysis purpose.
According to Hinkin [104], an ideal sample size should have an item-to-response proportion ranging from as low as 1:4 to as high as 1:10 for each set of scales to be factor examined. In this study, there were 24 items (see Appendix A Table A1) to be assessed; hence, an ideal sample size should be between 96 and 240 respondents for adequate factor analysis. From this perspective, a total of 539 responses from the collected data were found to be useable after excluding partial returns and missing responses (whether in the scale section or the demographic section) [105]. The sample descriptive statistics are shown in Table 1.
There were 53.2% female and 46.8% male participants in the survey. The age distribution of participants was as follows: 14.1% participants were under 18 years old, 26.9 were 19-24 years old, 36.9 were 25-30 years old, and the remaining participants belonged to more than 31 years age group. The majority of respondents had a high school certificate or below, i.e., Baccalaureate (49.7%), followed by Undergraduate degree (37.7%), Master degree (10.7%) and Doctorate (2%) respectively. The majority of participants in this survey were mobile money users and their years of mobile experiences were as follows: 38.6% had less than one year, 25.2% between one and two years, 6.7% between three and four years whereas 6.5% respondents had five and more years of experience. However, 23% of respondents had no mobile money experience. Table 1 displays a summary of the demographic variables pertaining to the analyzed sample.

3.4. Common Method Bias (CMB)

Using a questionnaire in behavioral studies is regarded as a standard technique to collect data and conduct the analysis. This approach leads to a standard method by which the variance and measurement error can be assessed [106]. Moreover, common method bias (CBM) is viewed to be a potential issue in social research and thus might mitigate or weaken the credibility of the data analysis outcomes [106,107]. Concern arose that CMB may have inflated the outcomes in the study, i.e., mainly the relationships between the variables, due to the self-reported data employed [108]. In addressing this issue, a common scale was applied in the form of two widely tests i.e., Harman’s single-factor analysis and the unmeasured latent marker construct (ULMC) [109,110].
The guidelines suggested that the single factor should be extracted if there is less than a 50% variance as to determine the controlled level of CMB within the research’s constructs [106]. In this study, the result of Harman’s single factor test revealed that the largest variance explained by individual factors accounted for 22.94% of the variance. This is lower than the threshold value (50%) of the total variance explained. Therefore, none of the factors can explain the majority of the variance; such a result shows evidence of no common method bias in this study.
The ULMC technique compared the coefficient of determination (R2) with a CMB construct to the R2 without a CMB construct, and indicated that ULMC explained only 5.28% average variance of the measures, and their related construct explained 78.9%. This outcome signposts as well that CMB is not a major problem in the study [111].

3.5. SEM-Artificial Neural Network Approach

The methodology used in this study is comparable to those of earlier studies [10,43,112,113] to validate the research model and test the suggested research hypotheses. There are two stages in the data analysis. During the first stage, the structural equation model (SEM) is used to understand the significant influence of predictors on mobile money transfer (MMT) acceptance. The second stage adopted artificial neural network (ANN) model to identify the importance of the predictors. Therefore, the results of the performance between the two approaches will be checked whether there are differences in determinants predicting the adoption of mobile money transfer.
Given that SEM is generally applied to verify hypothesized relationships, it has seldom been integrated with other artificial intelligence algorithms [114,115] when users are making technology adoption decisions; SEM may often oversimplify the complexities involved as it is merely detecting linear model. In addressing this challenge, an SEM-ANN technique was booked for the application, since ANN is useful for detecting both linear and non-linear relationships without necessitating any distribution assumptions like normality, linearity, or homoscedasticity [116]. Another advantage offers by using ANN resides in its ability to perform more accurate predictions in comparison to traditional regression techniques such as multiple regression analysis (MRA), multiple discriminant analysis (MDA) or SEM [117]. Contrarily, ANN presents also some drawbacks. Due to the “black-box” approach related to its application, ANN is unsuitable for testing hypotheses of causal relationships [118]. When analyzing a model, it is often difficult for researchers to understand how the neural nets arrive at their results [119]. To overcome these issues, significant variables derived from SEM are used as the input units to the ANN [92]. This is one of the few mobile money adoptions and sustainability studies which combine SEM with ANN by taking a developing country context.

4. Structural Equation Modeling (SEM) Analysis

The research model, as depicted in Figure 1, was analyzed by employing structural equation modeling (SEM). We used a two-step modeling process proposed by Anderson and Gerbing [120] for data analysis. Step one involves the measurement model analysis, whereas step two tests the structural model (including hypothesis testing).
Notably, the PLS-SEM technique, with the help of the SmartPLS 3.2.8 statistical package, was employed to perform the SEM analysis. Due to the analysis of key sources of explanation for a certain target construct, PLS-SEM is mainly used in exploratory research and theory development [105,121]. As suggested by Chin and Newsted [122], the PLS method places fewer boundaries on the measurement scales, residual distribution, and sample size and is therefore appropriate for our explorative study. In most consumer behavior research, the data are non-normal, and PLS is unbound by the normality assumption [123] that is necessitated in covariance-based SEM [124]. Moreover, the estimates of mediation effects obtained by PLS are more accurate, and the method accounts for measurement errors [125]. Compared with other SEM methods, the strength of this approach resides in its flexibility for distributional assumptions and handling complex predictive models [122].

4.1. Measurement Model Assessment

We conducted a confirmatory factor analysis (CFA) to validate the measurement model regarding the reliability, internal consistency, and validity of the observed variables [126]. Consistency evaluations are grounded on single observed and construct reliability tests, while convergent and discriminant validity are employed for assessing validity [127]. The observed variables with an outer loading of 0.7 or greater are considered to be acceptable [127], whereas the outer loading of a value less than 0.7 should be rejected [128]. From this perspective, the cut-off value accepted for the outer loading was 0.7 in this research.
From Table 2, the outer loadings bounded between 0.717 and 0.942. We employed Cronbach’s alpha and Composite Reliability (CR) to assess the internal consistency in the construct reliability. As compared to the Cronbach’s alpha, CR is regarded as a better assessment criterion for internal consistency since it retains the standardized loadings of the observed variables [129]. However, Cronbach’s alpha and CR value were used alongside in this study. All the values of Cronbach’s alpha and CR are greater than 0.8 (See Table 2). We concluded that all indicators are reasonably reliable and indicated that all the latent construct values exceeded the minimum threshold level of 0.70 [130].
To assess the validity of constructs, both convergent validity and discriminant validity are employed. The examination of the convergent validity is grounded on average variance extracted (AVE) values as evaluation criterion [105]. From Table 2, it is seen that all the AVE values were more than 0.5 [129]. Therefore, convergent validity was sufficient for this study model, indicating that each latent variable explained more than 50% of their indicator’s variance on average.
Discriminant validity describes that the manifest variable in any construct is different from other constructs in the path model, where its cross-loading value in the latent variable is greater than that in any other constructs [131]. The Fornell and Larcker criterion and cross-loadings were employed to estimate the discriminant validity [129] in this study. The recommended standard is not to have a construct displaying the same variance as any other construct that is more than its AVE value [131]. Table 3 displays that all of the correlations were smaller relative to the square root of average variance employed along the diagonals, suggesting satisfactory discriminant validity. Furthermore, the investigation of cross-factor loadings in Table 4 demonstrates the appropriate discriminant validity, as the loading of every indicator on the allocated construct exceeds its loading on other constructs [125]. Therefore, the discriminant validity of the study constructs is acceptable.
Since we can never exhaust all the determinants affecting users or potential users of mobile money services, the consideration of endogeneity is important when applying the regression-based technique such as PLS-SEM [132]. We used an instrumental variable (IV) approach following the guideline recommended by Kock [133] to test and control for endogeneity in PLS-SEM, in which the IV created through independent variable should have a direct link to the dependent variable but not with the independent structural variables. Notably, the study tested the endogeneity in the outcome variable [134], i.e., mobile money usage intention (IUMM) using the two endogenous variables such as perceived ease-of-use (PEMM) and perceived usefulness (PUMM). For PEMM-IUMM, the estimate of instrumental variable (iPEMM-IUMM) revealed a path coefficient β = 0.056 and p-value = 0.097 > 0.05. For PUMM-IUMM, the estimate of instrumental variable (iPUMM-IUMM) is β = 0.071, p-value = 0.051 > 0.05. Given that IVs have a significant level higher than 0.05, we conclude that endogeneity bias may not be an issue in this research, and that it does not influence the robustness of the structural model that generated the results of this study.

4.2. Structural Model and Validation

The next step in the analysis included testing of the structural model and corresponding theoretical relationships. To assess the structural model, collinearity issues, significance, and relevance of the model paths, coefficients of determination (R2), predictive sample reuse technique (Q2) and the effect size (f2) were tested. From there, to remove any suspicion of collinearity concerns, variance inflation factors (VIF) and tolerance for each set of predictors were analyzed, and their values were found below the suggested thresholds of 5 and 0.2 respectively [105].
The R2 values were computed for all endogenous constructs to measure the variance quantity explained in the dependent variables viewed as the predictive power of the structural model. According to Hair et al. [138], in the marketing field, the R2 value of 0.25 is weak, 0.50 is moderate, and 0.75 is substantial. However, unless the adjusted R2 is employed, (for a formal explanation see Hair et al. [105] (p. 176), this coefficient can be upward-biased in complex models where more paths are directed towards the endogenous construct. From this perspective, the coefficient of determination required to be judged in the context of a research project’s discipline. As shown in Table 5, all the two variables (self-efficacy and technology anxiety) explained a low value of the variance, i.e., 5.8% within perceived ease-of-use (R2: PEMM = 0.058). The remaining of the 94.2% can be elucidated by other variables not included in the model. Identically, the consumer attitude and personal innovativeness also explained merely 14.6% within usage intention. However, perceived ease-of-use and perceived usefulness, are better predictors of the attitude of users since they explain the majority of variance (R2: ATMM = 0.502); whereas self-efficacy, technology anxiety and perceived ease-of-use explain 22.3% of the variance within perceived usefulness outputs (R2: PUMM = 0.223).
After assessing the size of R2, therefore, the Q2 can effectively be employed as a criterion for predictive relevance [139]. Q2 was then calculated using blindfolding procedures [140], and cross-validated redundancy was performed as recommended by Chin [141]. According to Fornell and Cha [142], a Q2 greater than 0 implies that the model has predictive relevance, while Q2 less than 0 implies that the model lacks predictive relevance. From Table 5, it reveals that the Q2 values for attitude, usage intention, perceived ease-of-use, and perceived usefulness were 0.241, 0.077, 0.032, and 0.110, respectively, indicating acceptable predictive relevance.
The effect size (f2) of the variables of interest was investigated to assess the impact of each exogenous latent construct on the endogenous latent construct if deleted from the model (Table 5). The f2 values of 0.35 indicate a strong effect, 0.15 is a moderate effect, and 0.02 is a weak effect, according to Cohen’s [143] and Hair et al. [105]. Given the established guidelines, Table 5 shows the value of f2 obtained from SEM analysis. SEMM has a weak effect on PEMM and PUMM, whereas TAMM has no significant statistic effect on both PEMM and PUMM. PEMM has a large effect on attitude and a moderate effect on PUMM. PUMM has a moderate effect on ATMM. PIMM presents a weak effect on both ATMM and IUMM. Lastly, the importance of ATMM construct on IUMM is supported with a weak value of effect size.
In conclusion, the results of R2, Q2, and f2 test imply that the finding and conclusions drawn from this research are relatively robust.
PLS-SEM does not emphasize the model fit. However, it prioritizes maximizing the explained variance of the target constructs by considering this criterion as sufficient fit criteria [144]. Therefore, PLS-SEM using the global goodness of fit index (GOF) is adopted as an index for the comprehensive model fit to validate whether the model adequately explains the empirical data [140]. The GOF values range between 0 and 1, where values of 0.10 (small), 0.25 (medium), and 0.36 (large) signpost the global validation of the path model. A good model fit shows that a model is parsimonious and plausible [145]. The GOF is computed by using the geometric mean value of the average communality (AVE values) and the average R2 value(s). Based on the formula proposed by Tenenhaus et al. [140] and the guidelines introduced by Wetzels et al. [146] to assess the effect size of the GOF, the obtained value of GOF = 0.412 (See Table 6) led us to conclude that the goodness of fit index is large enough to support the global model validity. The GOF of the model is calculated using Equation (1) below [140].
G O F = C o m u n a l i t y ¯ × R 2 ¯
The next step in the analysis involved testing the corresponding theoretical relationships. The structural path analysis results are shown in Figure 2; the bold lines reveal significant relationships, while the dotted line shows insignificant relationships. Table 7 displays the results of hypothesis testing. A t-test was adopted since all the hypotheses are well directional [123]. Bootstrapping was performed to compute t-statistics following p-values for the path coefficients (See Table 7). Most of the hypothesized relationships regarding the direct effect were significant, except for H2b (β TAMM → PUMM = -0.054, t = 1.08, p > 0.05). The results confirm the statistical significance of nine out of the ten tested direct effects. Regarding the indirect relationship, seven hypotheses were statistical significance amongst the eight tested indirect effects (i.e., mediating effect). Based on path coefficients, H3a (β PEMM → ATMM = 0.408, t = 8.397, p < 0.001) was the most significant. This implies that during mobile money adoption, mobile money users rely on the perceived ease-of-use with low perceived usefulness. Based on H5a (β PIMM → ATMM = 0.155, t = 4.173, p < 0.01) and H5b (β PIMM → IUMM = 0.158, t = 3.248, p < 0.01), personal innovativeness contributes significantly to both user’s attitude and intention to adopt mobile money service. As shown in Table 7, the positive and statistically significant direct effect of H5b (β PIMM → IUM = 0.158, t = 3.248, p < 0.01) and the positive and statistically significant indirect effect of H9a (β PIMM→ATMM→IUMM = 0.04, t = 3.103, p < 0.01) support the complementary mediation effect [105] of the attitude of users on the relationship between personal innovativeness and intention to use. Similarly, the positive and statistically significant direct effect of H3a (β PEMM → ATMM = 0.408, t = 8.397, p < 0.01), together with the positive and statistically significant indirect effect of H8 (β PEMM→PUMM →ATMM = 0.088, t = 4.214, p < 0.01), represent the complementary mediation of the perceived usefulness regarding the relationship between perceived ease-of-use and attitude.

5. Artificial Neural Networks (ANNs) and Sensitivity Analysis

Many statistical techniques are parametric, necessitating a great statistic background, whereas artificial neural networks (ANNs) are non-parametric models [147]. ANNs are the most effective models among intelligent methods [148]. ANNs techniques refer to a massively parallel distributed processor comprise of simple processing units, which have a neural tendency for storing experimental knowledge and making it available for use [
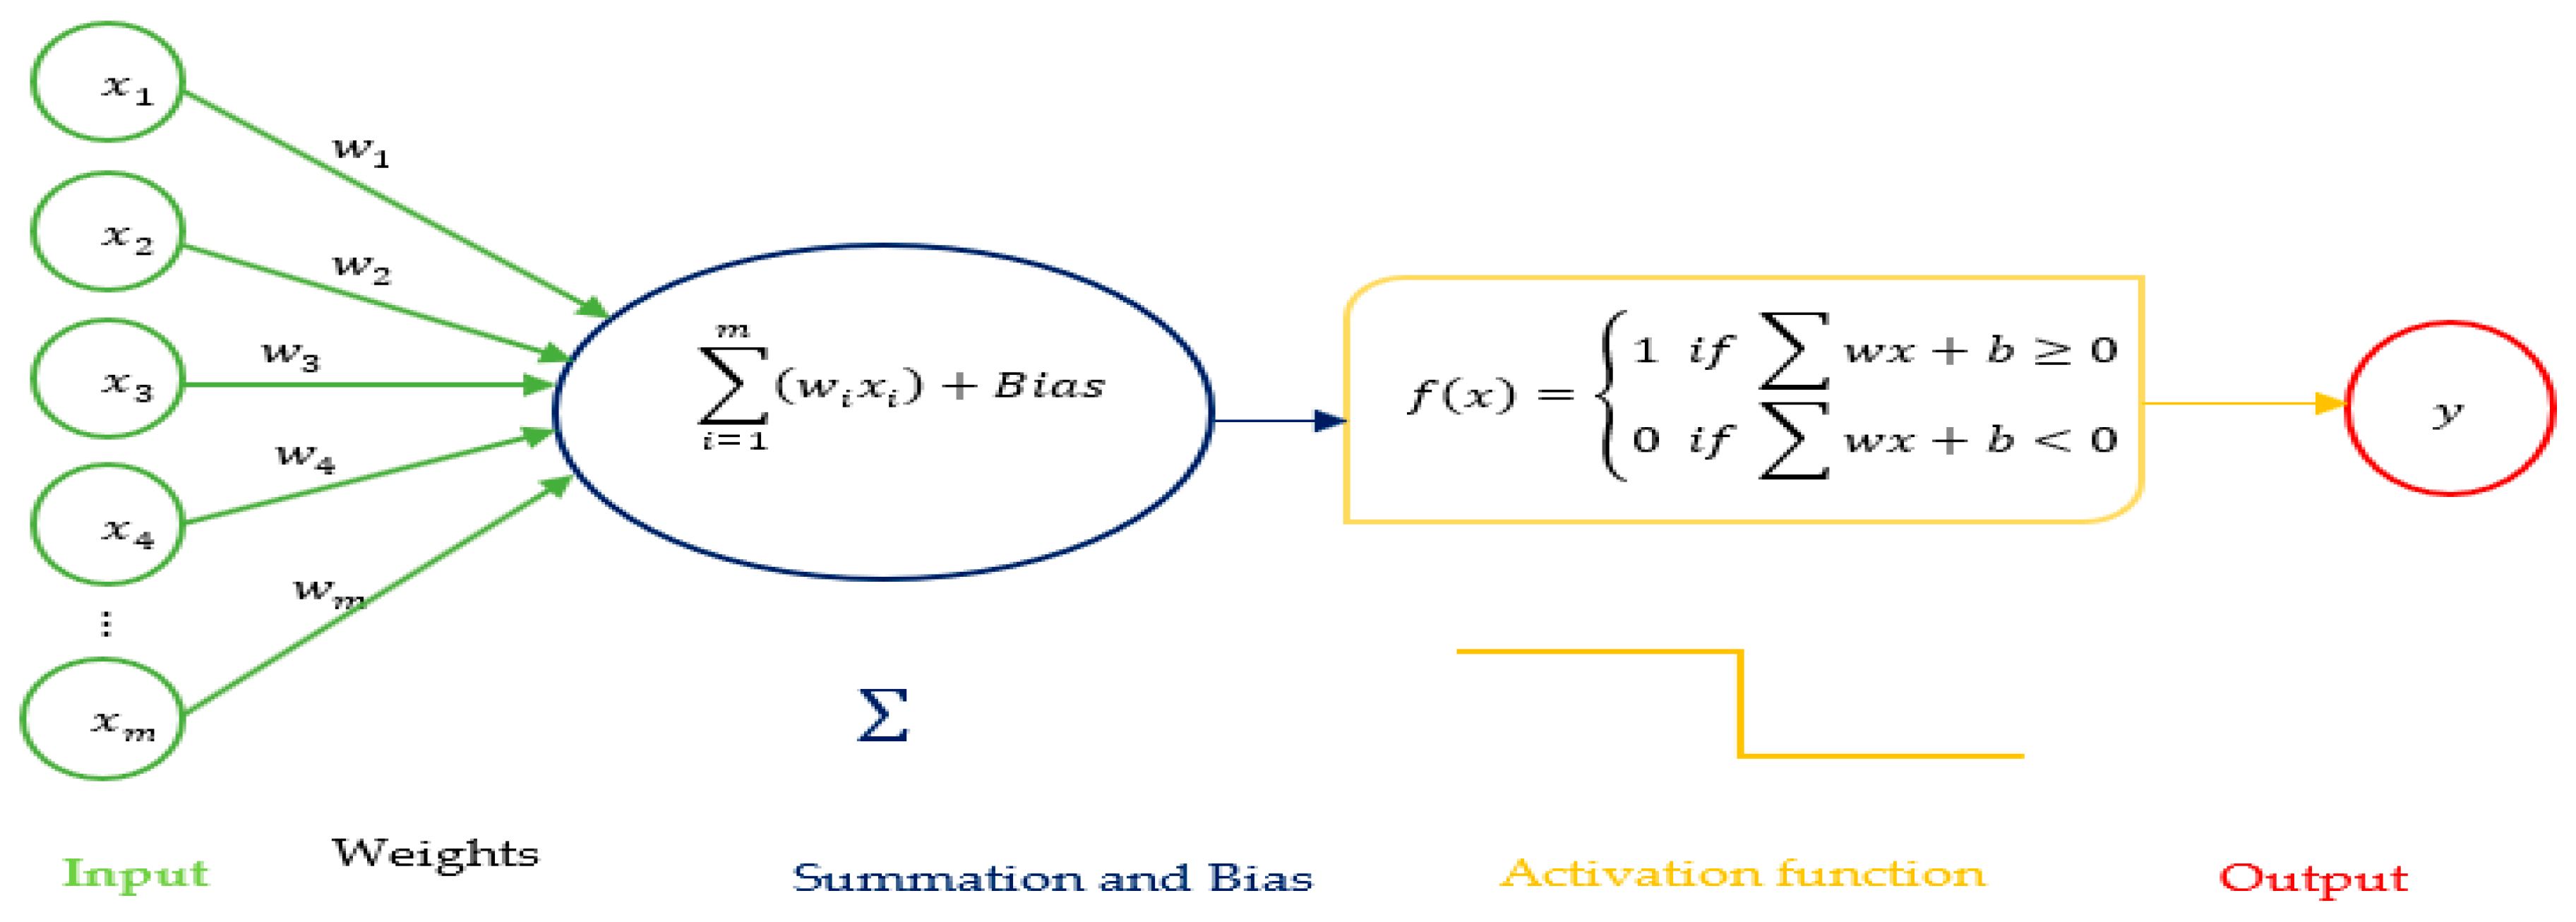
149]. They are very comparable to the biological neural networks in the human brain, in the sense that knowledge is collected through learning or training process and stored by “interneuron connection strengths recognized as synaptic weights”. They use a massive interconnection of simple computing units termed as neurons or nodes in input, hidden, and output layers with connection strengths called synaptic weights that are adjusted via an iterative process [118]. The interconnection pattern between these neurons in ANN represent the network architecture. Each input has a connected weighted (w), which is attributed based on its relative importance to other inputs. The node uses a function f defined as a weighted sum of its inputs based on the following formula:
Y = f ( w 1 x 1 + w 1 x 1 + b )
where w1 and w2 are weighted, x1 and x2 are input, b representing the bias and Y the output. Figure 3 represents the general network architecture for a single layer perceptron.
One of the particularities of ANN is to deal equally with a linear and non-linear relationship with requiring any distribution assumptions such as normality, linearity, or homoscedasticity as compared to SEM [118]. Hence, the function f is non-linear, which is a so-called activation function.
Selecting a proper activation function remains an important consideration because it can affect how the input data should be set up, as well as how the output format would be generated.
There are three commonly used activation functions, i.e., sigmoid, hyperbolic tangent (Tanh), and rectified linear unit (ReLU) as presented in the formula below. The Sigmoid function is an activation function having an output bound between [0, 1]; while Tanh function has an output range of [−1, 1]. Relu function refers to the type of activation function returning the max (0, x). Although the output layer can have any activation functions, Sigmoid is the widely used activation function for the output layer in the information technology context [113]. The Sigmoid function and its combinations generally work better in the context of classifiers and sometimes prefer when the researcher expects an output or intermediate layer of the net to represent the probability of an event. Based on the output value range of sigmoid, the normalizing output of each neuron can be assessed as well.
Sigmoid ( x ) = 1 1 + e x
T anh ( x ) = 2 1 + e 2 x 1
ReLU ( x ) = max ( 0 , x )
A feedforward backpropagation (FFBP) neural network is an ANN which employs a supervised learning procedure with a feed-forward algorithm for prediction. It is viewed as advanced multiple regression analysis (MRA) or SEM able to deal with complex and non-linear relationships.
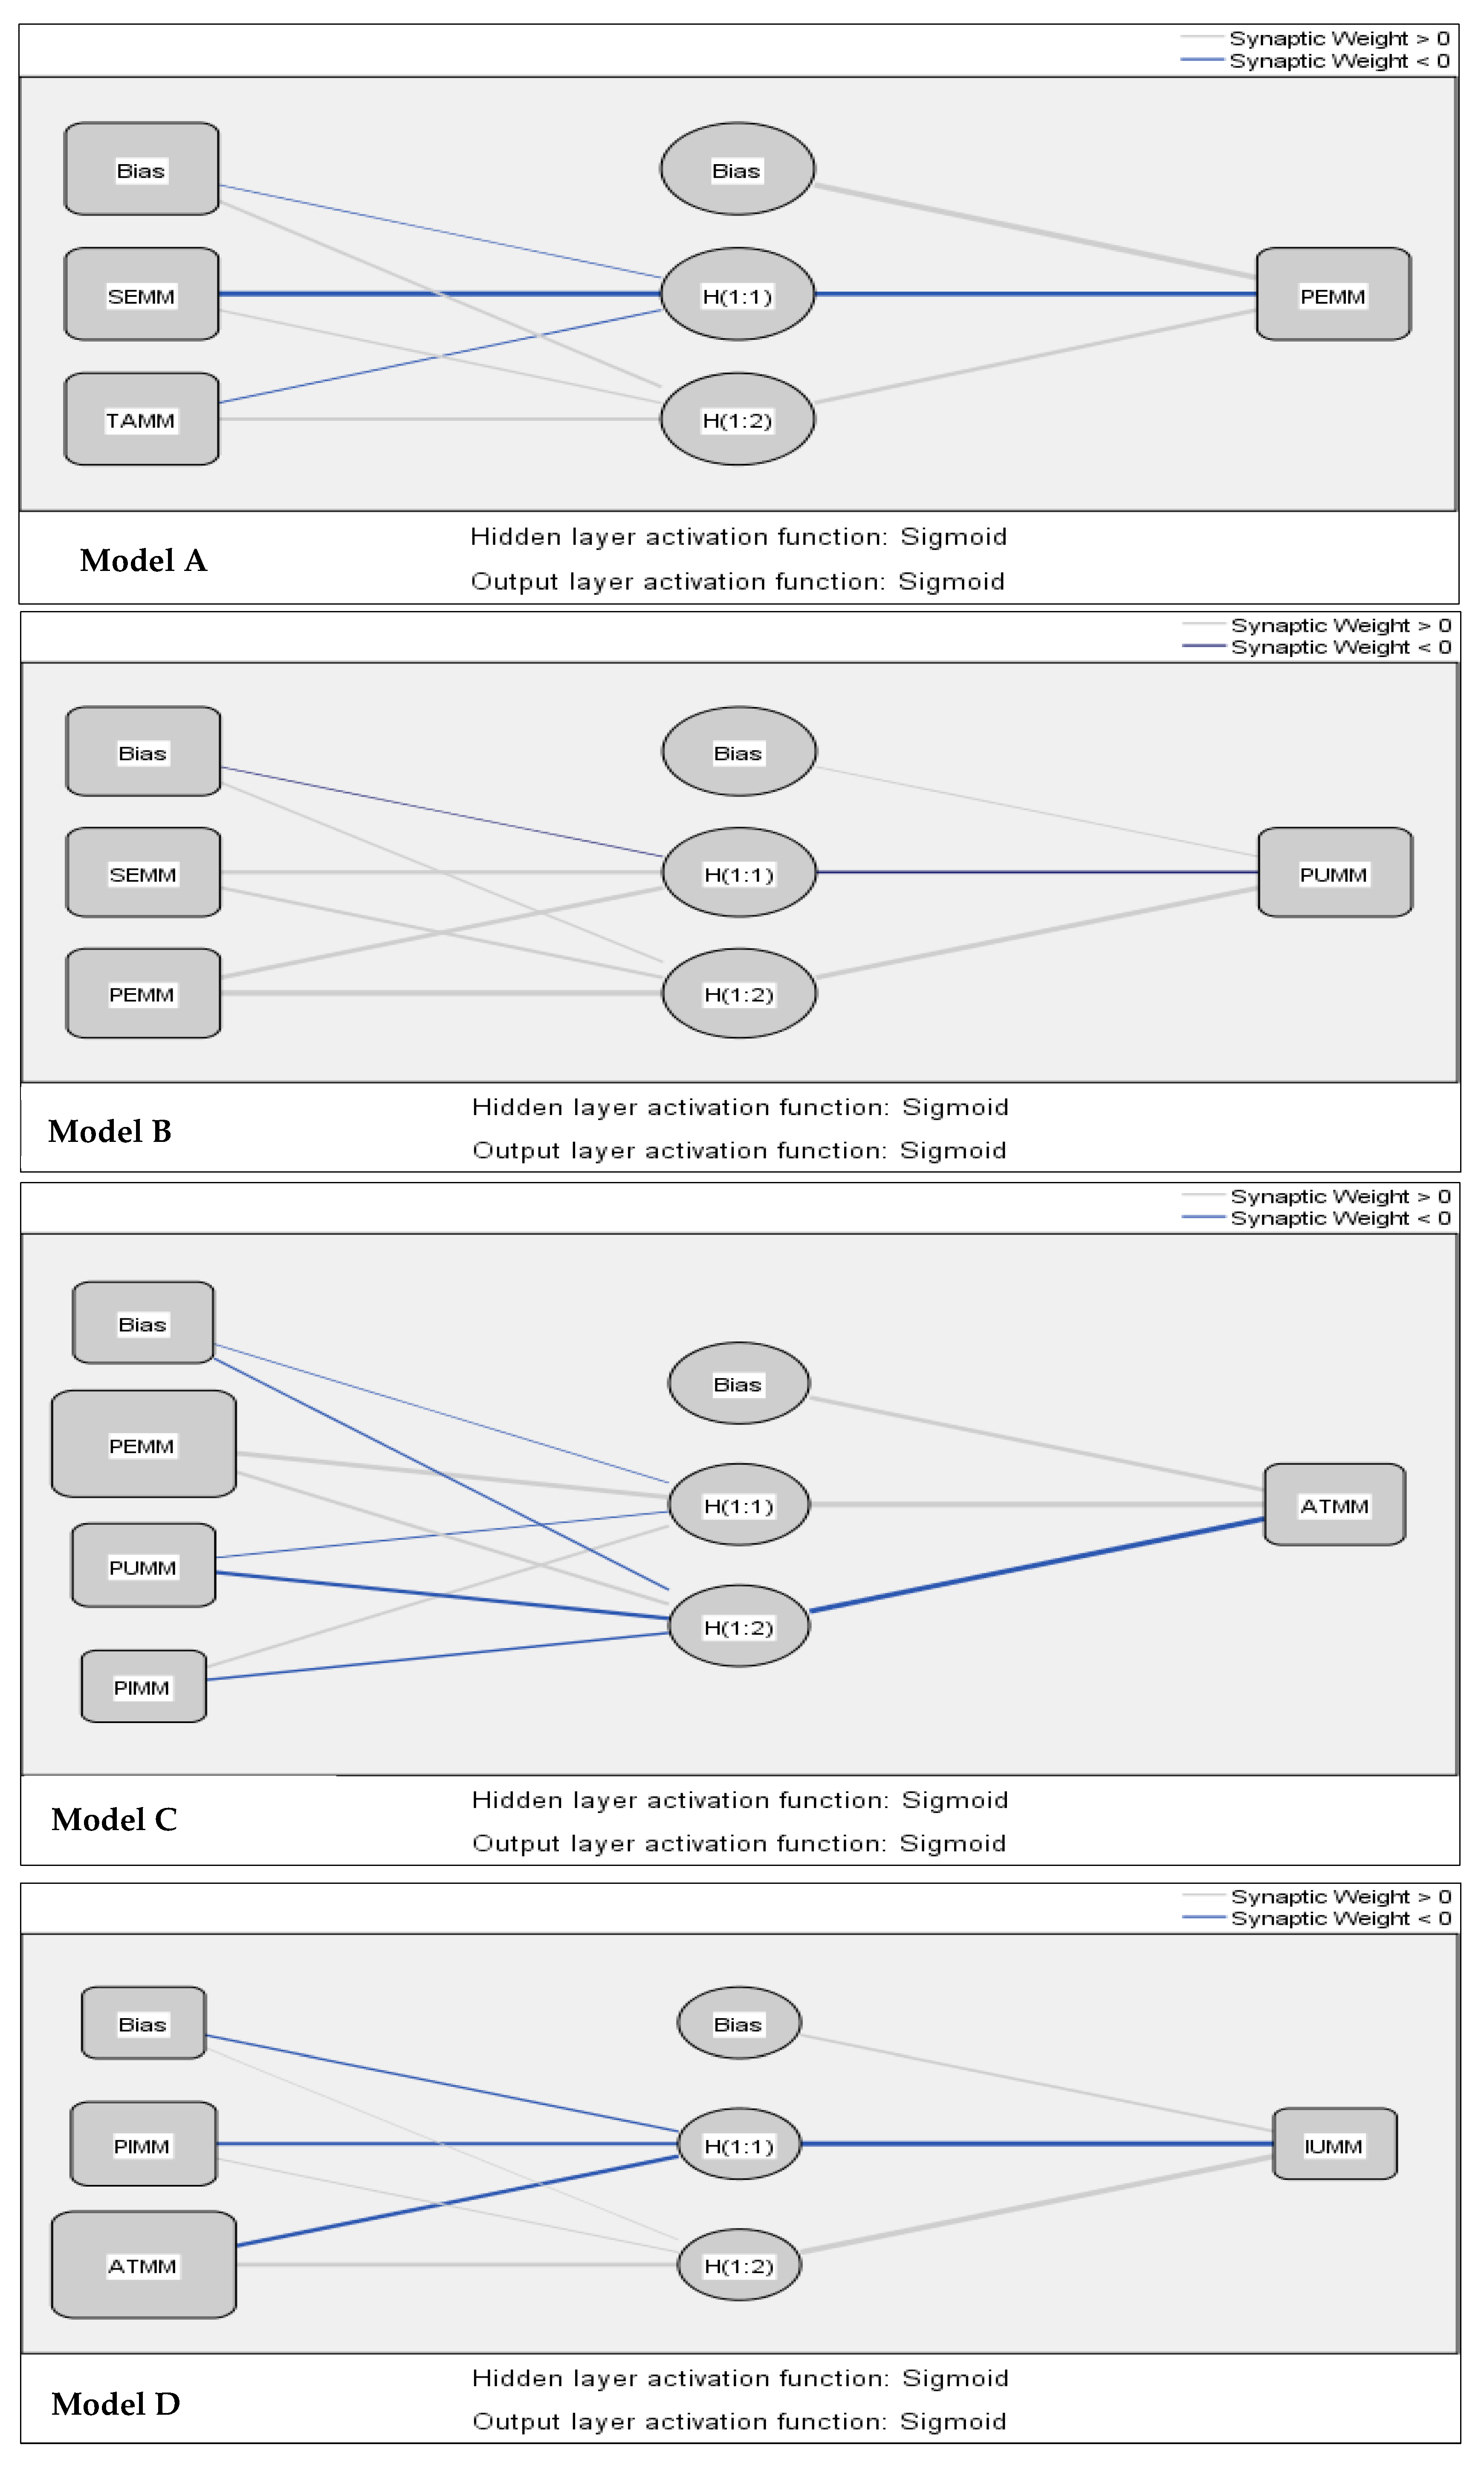
In this study, the extensive neural network model—multilayer perceptron (MLP) with the FFBP training algorithm—was applied [10,150] in SPSS 21 using the sigmoid activation function for hidden and output layers [112,151]. This sigmoid function will be converging to one for large positive numbers and 0.5 for zero and very close to zero for large negative numbers. Therefore, it allows transitions to be calculated between the low and high output of the neuron. The output is subject to the activation and which in turn rely on the input values and their corresponding weights. The number of neurons in the input layer is equivalent to the number of predictor constructs. Similarly, the number of neurons in the output layer is equal to the number of dependent variables, i.e., predicted constructs, and the problem scheme determines all.
Over-fitting is a major issue in the predictive modeling approach. To avoid over-fitting, a ten-fold cross-validation technique was performed, with 90% of the sample used for training and the remaining 10% of the hold-out data for testing purpose [112,151]. The determination of hidden nodes is regarded in the literature as one of the greatest challenges. Wang and Elhag [152] suggested a range of 1 to 10 hidden nodes in the neural network model. The number of hidden units was engendered automatically, and the root-mean-square-error (RMSE) values were computed together with the normalized importance in the sensitivity analysis.
The accuracy of the network models is assessed by RMSE [10,150], which is computed as the difference between actual and predicted values of the dependent constructs, i.e., consumers intention to use mobile-based money services. The summary of RMSE values for all four ANN models is provided in Table 8. The RMSE values achieved through all four neural network models, both for training and testing data points, are very small. Hence, the results generated are relatively accurate [112,113]. The number of non-zero synaptic weights linked to the relevant hidden units is used to validate the relevance of the variables (See Table 9). Hence, all factors are found to be relevant in predicting the dependent variable. The normalized or relative importance values were computed as the ratio of the relative importance of each variable with its largest importance and expressed in percentage form [112]. Only significant linear factors obtained via the SEM technique were regarded as the input units of the ANN models. From Table 10, the sensitivity analysis performance was then computed by averaging the importance of the input variables in predicting the output for the ten networks [10]. Therefore, the relative strengths of the causal relationships were assessed grounded on the normalized importance from the sensitivity analysis [92]. SEMM was found to be the key determinant in predicting PEMM followed by TAMM in model A. In model B, PEMM is the most prominent predictor for PUMM, followed by SEMM. For model C, the order of importance towards ATMM in descending order is PEMM, followed by PUMM and PIMM. Last but not least, ATMM constituted the most effective in term of predicting IUMM, followed by PIMM.
Remarkably, the ANN models (See Figure 4) are able to learn both complex linear and nonlinear relationships among decision variables, as compared to structural models, which detect linear relations only [113].

6. Discussion

The need to assess the main factors impacting the adoption of new technologies is grounded in many studies. In this study, the determinants of mobile money adoption and sustainability include TAM constructs, extended with variables like self-efficacy, technology anxiety, and personal innovativeness which were identified and tested in various studies, were tested in the context of Togo.
The proposed hypotheses deriving from these factors were tested using a hybrid structural equation modeling–artificial neural networks approach (SEM-ANN). The majority of the hypotheses were validated by the finding, with only two paths connecting new technology anxiety (TAMM) and perceived usefulness (PUMM) found to be statistically insignificant. The abovementioned analytical results reveal that the research model examined in this study is acceptable. The subsequent subsections offer more detailed discussions on the findings.

6.1. Relationships between SEMM, TAMM, and PEMM

Self-efficacy in mobile money service (SEMM) has the highest normalized importance, and also showed a significant relationship with the perceived ease-of-use (PEMM) of mobile money in the present study. This finding supports prior researches on mobile payment acceptance [29,153]. Notably, the construct of SEMM has long been associated with perceived ease-of-use in the IS adoption literature [154]. Altogether, it is rational to argue that self-efficacy will lead a consumer to believe in his or her ability or to see the procedure of performing mobile money ease-of-use, therefore carrying out successfully mobile money adoption. The findings in this study also show that TAMM with 63.6% normalized importance is positively related to the ease of use of mobile money. Therefore, customers who are anxious about using the technology may, to some extent, perceive mobile money as being easy to use. When the user’s anxiety for mobile money is mitigated, the user’s system perceived ease of use would be lower. This result contradicts past research that defines anxiety, particular computer anxiety, as the propensity of a person to experience a level of uneasiness about his or her impending use of a computer [155].

6.2. Relationships between SEMM, PEMM, TAMM, and PUMM

The path coefficient between SEMM and PUMM is 0.163 (p < 0.01), which is a significant positive correlation with the highest normalized importance. This result indicates that when users perceived his ability to master the use of mobile money transfers, their effectiveness increase usefulness or utility of mobile money. Concerning self-efficacy effect on perceived usefulness, the finding of this research is compatible with the findings of existing studies [156]. The path coefficient between PEMM and PUMM with 0.357 (p < 0.01) was found to be positive and significant, which confirms the results of earlier studies [34,83,157]. The degree of usefulness of technology is viewed based on how much users perceive the ease-of-use. This result is in line with the work of Munoz-Leiva et al. [62]. With other things being equal, users view technology as being more beneficial and helpful when it is free of effort concerning the effort of expectancy. This finding contradicts the research conducted by Sumedha [64] toward the adoption of mobile money amongst the poor citizens of India. There is no empirical evidence to accept H2b (β = − 0.054; p > 0.05), thus failing to demonstrate the importance of new technology anxiety through the usefulness to use mobile money services. This result opposes the previous study in the context of mobile payment in the USA [29].

6.3. Relationships between PEMM, PUMM, and PIMM on ATMM

PEMM is the most significant factor in determining ATMM as well as the one having the highest normalized value, followed by PUMM and PIMM. A probable explanation is that mobile money services remain a relatively new phenomenon in the field of e-business, and most mobile financial companies are still in an early stage of diffusion. When a technology has emerged recently, it is probable that users delay espousing it due to their concern with the efforts involved in using the technology and its intricacy. Similarly, users will be unwilling to welcome the novel technology if they do not know how it works. To some extent, this result is partially supported by earlier empirical studies in mobile banking [62]. Regarding the impact of perceived usefulness, empirical evidence is found to accept H4 (β = 0.245 p < 0.01), showing the importance of usefulness through the attitude based on the proposed mobile money services as it is consistent with the existing TAM research [62,158]. For many studies, the perception of usefulness has been viewed as a perceived relative advantage. Due to this motive, Rogers [89] explains the relative advantage as the way a product is perceived as being preferable than its predecessor. The present finding suggests that this factor is relevant for mobile money services are considered innovative within mobile financial services, and the usefulness offers to users is closely associated with the advantages that it provides. Therefore, if people are alerted to mobile money’s usefulness, including transferring money quickly and safely at low cost, it will offer a push for its usage as significance leads momentum according to Kelly [159]. The service providers should ensure that there should be conscious and focused efforts on spreading the message of the usefulness of mobile money to its potential users through a focused marketing strategy. Regarding the fundamental constructs of TAM, such as perceived ease-of-use and perceived usefulness, it was detected in the SEM outcome that these two factors impact attitudes significantly towards the application of mobile money. The outcomes signpost that mobile money users in Togo are not only attracted by the usefulness of mobile money services, but are also concerned with the ease of use in its operations. Furthermore, the innovativeness of the services finds to be one of the factors that influence the usage of mobile money, which is supported by earlier results in the context of web survey [90]. For mobile money usefulness and ease of use to happen, the service providers should strive to incorporate features that users find useful with less effort of application as the majority of respondents have only A level degree (Baccalaureate) or below. It is expected that potential respondents with high personal technology innovativeness will be more willing to develop the attitude to use mobile money than those with low personal innovativeness, all things being equal. The most likely explanation of this empirical evidence is a low maturity level of users towards mobile money in this developing country.

6.4. Relationships between PIMM, and ATMM on IUMM

A PIMM with normalized importance of 79.2% was found to have a significant relationship in predicting IUMM. The result corroborates with research done in the context of mobile learning [160] and contradicts Lu et al. [161] and Chong et al. [162] studies. Personal innovativeness plays a central role in predicting intentions for the usage of technological innovation [163]. Most individuals with a greater level of personal innovativeness have more courage and higher personality principles and social-economic status, hence when undertaking any technology adoption, they are likely to develop positive feelings towards intention as opposed to individuals with lower personal innovativeness. ATMM shows a significant influence in predicting the UIMM, which is consistent with the prior study [29]. According to the finding of this research, once the users develop a good attitude regarding using mobile money, the behavioral intention to use it will follow. The result justifies the inclusion of attitude as a variable in the mobile money adoption and sustainable mobile financial industry.

7. Conclusions and Implications

Mobile money transfers are among the latest innovative financial applications of mobile technologies. Due to the lower acceptance of mobile money in Togo, this research grasped the importance of understanding and assessing key determinants affecting mobile money acceptance. Therefore, the research aimed to study beliefs and behavioral variables that impact the acceptance and sustainability of mobile money application from the developing country perspective, as well as offering conclusions beyond mere descriptive analysis.
To reach this objective, the traditional TAM model has been used, to which relevant constructs were added in the adoption of an innovation such as self-efficacy, new technology anxiety, personal innovativeness allied with the proposed methodological application. A survey was conducted among the users and potential users of mobile-based money services for the analysis of the proposed theoretical model. The proposed model employed a two-stage SEM-ANN approach—SEM for testing possible relationships and ANN for predicting the determinants of mobile money. The predictive analytical approach of the neural network was employed to assess the data, and the outputs from the data were utilized to compare with the ones from structural equation modeling analysis. Such an integrated methodology provides a rigorous and comprehensive reference for future research work in the area of mobile money transfer from the developing countries perspectives. Togolese mobile financial service providers may develop appropriate business policies and strategies for mobile money transfer system, which enhance the overall business performance.
Moreover, this research reveals the relevance of the two-stage approach integrating SEM and ANN techniques to enhance the assessment of technology adoption models for decisions makers. By comparing the results of the SEM and the ANN analyses, the major difference lies in the strength of the effect of the two constructs relating to innate personal ability and personality trait. The ANN analysis increases the relative importance of self-efficacy in ease-of using mobile money transfer. Similarly, the relative importance of personal innovativeness has been improved regarding its effect both on users’ attitude and intention to use mobile money with ANN analysis. The results reveal that ANNs are better than SEM at learning, predicting, and clarifying various factors influencing mobile money adoption. However, SEM supports the causal analysis (the reliability and validity of the measurements and path analysis) which found limited in ANN application. Therefore, a multi-analysis technique such as the integrated approach (SEM-ANN) contributes more to sharpen the understanding of the effect of model variables than using a sole technique.
From a different angle, the outcomes of this research have immense practical and managerial implications. This study can provide useful insights to the decision makers of telecommunication service providers, mobile money app developers, and mobile money service providers to enhance and maintain their customer base. First, the government of several emerging economies has been making efforts to achieve greater financial inclusion by using technology [21]. Recently, African Development Bank (AfDB) in collaboration with the government of Togo offer subsidies to farmers through e-wallets provided by mobile network operators Moov and Togocel in patronizing the digitization project of the agriculture transformation agenda [21]. Grounded on the World Bank/AfDB report, the mobile financial services (MFS) have a significant positive influence on the macroeconomic development of some West African Nations and even the percentage of effect could reach a double-digit. Based on the proportion of GDP, among the largest beneficiaries, are Togo (10.7%) and Cape Verde (9.4%) [164]. Asif et al. [165] reported the significant benefits of mobile money on a firm investment in three East Africa economies and encouraged the use of such services in other developing countries.
Given the importance of financial inclusion and sustainable development, mobile money transfer services might go a long way in solving the concerns of the non-existent banking network. Banks have been reluctant to open branches in far-reaching zones because of security and viability issues. Thus, services such as mobile money transfers can effectively fill that need, and can be an effective instrument with which to achieve greater financial inclusion [166]. This study reveals that perceived usefulness of the mobile money services impacts the consumer’s attitude regarding the decision to adopt this technology, including its ease of operations. The developers of mobile money apps require to focus on the development of the user-centric apps to create the awareness of usefulness together with ease in operations of users in their view. Then, in turn, should lead to an increase in financial transactions conducted on mobile devices. It is important to stress the influential role of personal innovativeness on the users’ attitude and intention to use mobile money. For the scholars’ conceptualization of personal innovativeness, a person is described as being innovative if he or she is early to adopt an innovation [98,167]. Therefore, personal innovativeness acts as an enabler of user behavior, and company providers need to stimulate this factor to facilitate the usage of mobile money services. This signpost that for the usage of such services, users are seeking not only basic functionality, but also innovations. Service providers may ponder directing some of their advertising campaigns to the segment of more innovative uses. As per the suggestion of Moore [168], innovators offer companies with great feedback early in the design cycle and start building a supporter who will impact buyers. Since it is now possible to gather big data on consumer behavior and habits through mobile phone sensors, an artificial intelligence approach could be utilized to profile each consumer and offer personalized service that the customer would find innovative and useful. For Midgley and Dowling [87], innovators regarded as early adopters are more likely to be opinion leaders and the messages these innovators addressing to others stimulate the interpersonal predisposed adoption process of light users or non-users. This will have a positive impact on the mobile-based money adoption rate.

8. Limitation and Future Research

This research presents a series of limitations that will pave the way for future study. This study did not consider moderating variables, such as individual customers’ experiences with mobile money in other mobile financial services, age, and gender proposed by Venkatesh and Bala [61], the impacts of which could be empirically tested in future studies. Furthermore, the model is cross-sectional, in that it measures perceptions, attitude, and intentions at a single point in time. However, perceptions alter over time as individuals gain experience [169]. With our cross-sectional data, we also only took a snapshot of this model. Due to the limitations, a stricter test of our argument, however, could lead researchers and practitioners who are interested in predicting mobile money usage over time to employ longitudinal studies. By using a longitudinal study in the future, the research model could be investigated in different periods and make comparisons, thus offering more insight into the phenomenon of mobile money adoption. Due to the objective of the research, this study could not test the endogeneity associated with omitted variables and feedback loops regarding all the various construct relationships in the model. Future studies are encouraged to assess the issues of endogeneity and the remedies in the context of determinants of information technology adoption using the PLS-SEM technique.

Author Contributions

Investigation, conceptualization, methodology, formal analysis, and writing the paper, K.G.; investigation, and resources, Y.X.; investigation, K.M.A.

Funding

This research received no external funding.

Acknowledgments

Sincerely thank experts who provide some technical guidance for this research. We appreciate Kovács Levente for his useful support. We thank the anonymous reviewers for their invaluable comments.

Conflicts of Interest

The authors declare no conflict of interest.

Appendix A

Table A1. Conceptual framework of variables.
ItemsMeasurement Scales
Mobile money self-efficacy (SEMM) [61]
SEMM1It would be easy for me to learn how to use a smartphone for mobile money
SEMM2I could use mobile money if someone showed me how to do it
SEMM4I am able to use mobile money if there is no one around to tell me what to do.
Mobile money technology anxiety (TAMM) [69,76]
TAMM1Mobile money service makes me feel uncomfortable
TAMM2I feel apprehensive about using new technology
TAMM3I fear that I will do the wrong thing when I use new technology
Perceived ease-of-use mobile money (PEMM) [34,102]
PEMM1MFS give people more control over their daily financial transactions
PEMM2MFS that use the newest mobile technologies is much more convenient to use.
PEMM3MFS gives you more freedom of mobility.
Mobile money perceived usefulness (PUMM) [45,59]
PUMM1In general, the mobile-based payment system could be useful for me
PUMM2I would find it useful to use a smartphone for my financial transaction
PUMM3The mobile money service system is a useful mode of payment
Attitude toward mobile money (ATMM) [100,101]
In sum, how would you classify your overall attitude towards using smartphones for m-money?
ATMM1Negative-Positive
ATMM2Unfavourable-Favourable
ATMM3Poor-Excellent
ATMM4Unattractive-Attractive
Personal innovativeness in mobile money (PIMM) [98,99]
PIMM1I heard about a new IT; I would look for ways to experiment with it.
PIMM2Among my peers, I am the first one to try out new information technologies.
PIMM3In general, I am not hesitant to try out new information technologies
PIMM4Other people come to me for advice on new mobile technologies and services.
Attitude toward mobile money (ATMM) [71,80]
IUMM1I intend to use/reuse mobile financial services shortly.
IUMM2Assuming that I have access to mobile financial services, I intend to use it.
IUMM3Given that I have access to mobile financial services, I predict that I would use it.
IUMM4To the extent possible, I would take advantage of mobile money for my transaction activities.

References

  1. Kapoor, K.K.; Dwivedi, Y.K.; Williams, M.D. Examining the role of three sets of innovation attributes for determining adoption of the interbank mobile payment service. Inf. Syst. Front. 2015, 17, 1039–1056. [Google Scholar] [CrossRef]
  2. Connor, Y.O.; Reilly, P.O. Examining the infusion of mobile technology by healthcare practitioners in a hospital setting. Inf. Syst. Front. 2018, 20, 1297–1317. [Google Scholar] [CrossRef]
  3. Gbongli, K. A two-staged SEM-AHP technique for understanding and prioritizing mobile financial services perspectives adoption. Eur. J. Bus. Manag. 2017, 9, 107–120. [Google Scholar]
  4. Hew, J.J. Hall of fame for mobile commerce and its applications: A bibliometric evaluation of a decade and a half (2000–2015). Telemat. Inform. 2017, 34, 43–66. [Google Scholar] [CrossRef]
  5. Klapper, L.; El-Zoghbi, M.; Hess, J. Achieving the Sustainable Development Goals—The Role of Financial Inclusion; CGAP & UNSGSA: Washington, DC, USA, 2016. [Google Scholar]
  6. Alalwan, A.A.; Dwivedi, Y.K.; Rana, N.P. Factors influencing adoption of mobile banking by Jordanian bank customers: Extending UTAUT2 with trust. Int. J. Inf. Manag. 2017, 37, 99–110. [Google Scholar] [CrossRef]
  7. Shaikh, A.A.; Karjaluoto, H. Mobile banking adoption: A literature review. Telemat. Inform. 2014, 32, 129–142. [Google Scholar] [CrossRef]
  8. Gbongli, K.; Dumor, K.; Mireku, K.K. MCDM technique to evaluating mobile banking adoption in the Togolese banking industry based on the perceived value: Perceived benefit and perceived sacrifice factors. Int. J. Data Min. Knowl. Manag. Process 2016, 6, 37–56. [Google Scholar]
  9. Riquelme, H.E.; Rios, R.E. The moderating effect of gender in the adoption of mobile banking. Int. J. Bank Mark. 2010, 28, 328–341. [Google Scholar] [CrossRef]
  10. Chong, A.Y.L. A two-staged SEM-neural network approach for understanding and predicting the determinants of m-commerce adoption. Expert Syst. Appl. 2013, 40, 1240–1247. [Google Scholar] [CrossRef]
  11. Demirguc-Kunt, A.; Klapper, L.; Singer, D.; van Oudheusden, P. The Global Findex Database 2014: Measuring Financial Inclusion around the World; World Bank Group: Washington, DC, USA, 2015. [Google Scholar]
  12. Burgess, R.; Pande, R. Do Rural Banks Matter? Evidence from the Indian Social Banking Experiment. Am. Econ. Rev. 2005, 95, 780–795. [Google Scholar] [CrossRef] [Green Version]
  13. Cull, R.; Ehrbeck, T.; Holle, N. Financial inclusion and development: Recent impact evidence. Focus Note 2014, 92, 1–12. [Google Scholar]
  14. UNdata. World Population Prospects: The 2017 Revision | United Nations Population. UNdata A World of Information. 2017. Available online: http://data.un.org/Data.aspx?q=Togo&d=PopDiv&f=variableID%3A12%3BcrID%3A768 (accessed on 9 April 2019).
  15. Penicaud, C.; Katakam, A. State of the Industry: Mobile Financial Services for the Unbanked. J. Am. Coll. Radiol. 2013, 10, 727–729. [Google Scholar]
  16. Fiacre, K.E. Togo: Mobile Money Drives Financial Inclusion According to World Bank (Global Findex). 2018. Available online: https://www.togofirst.com/en/finance/2504-723-togo-mobile-money-drives-financial-inclusion-according-to-world-bank-global-findex (accessed on 11 April 2019).
  17. CNSS. CNSS: Les Employeurs Peuvent Désormais Payer Les Cotisations Sociales Via T-Money et Flooz (CNSS: Employers Can Now Pay Social Security Contributions Via T-Money and Flooz). Portail Officiel de la République Togolaise. 2019. Available online: https://www.republiquetogolaise.com/services-publics/1101-2707-cnss-les-employeurs-peuvent-desormais-payer-les-cotisations-sociales-via-t-money-et-flooz (accessed on 12 April 2019).
  18. Couchoro, M.K. Challenges faced by MFIs in adopting Management information system during their growth phase: The case of Togo. Enterp. Dev. Microfinanc. 2016, 27. [Google Scholar] [CrossRef]
  19. Ashta, A.; Demay, I.; Couchoro, M. The Role of Stakeholders in the Historical Evolution of Microfinance in Togo. Econ. Hist. Dev. Reg. 2016, 303–344. [Google Scholar] [CrossRef]
  20. Financial Afrik. Faible Taux du «Mobile Banking» au Togo. Financial Afrik, Juillet 26. 2015. Available online: http://news.alome.com/cc/24339.html (accessed on 14 March 2019).
  21. Aggarwal, V.B.; Sharma, D.; Saxena, A. Rural e-banking: Gaps, inefficiencies and emerging solution through mobile terminals at customer door-step. In Proceedings of the 4th National Conference, Puna, India, 25–26 February 2010; pp. 1–6. [Google Scholar]
  22. Mothobi, O.; Grzybowski, L. Infrastructure deficiencies and adoption of mobile money in Sub-Saharan Africa. Inf. Econ. Policy 2017, 40, 71–79. [Google Scholar] [CrossRef]
  23. Gbongli, K.; Csordas, T.; Mireku, K.K. Impact of consumer multidimensional online trust-risk in adopting Togolese mobile money transfer services: Structural equation modelling approach. J. Econ. Manag. Trade 2017, 19, 1–17. [Google Scholar] [CrossRef]
  24. Akomea-Frimpong, I.; Andoh, C.; Akomea-Frimpong, A.; Dwomoh-Okudzeto, Y. Control of Fraud on Mobile Money Services in Ghana: An exploratory study. J. Money Laund. Control 2019, 22, 20–39. [Google Scholar] [CrossRef]
  25. Lahaye, E. Development Finance Agenda (DEFA)—Is digital finance hitting its stride in WAEMU? Dev. Financ. Agenda 2016, 2, 14. [Google Scholar]
  26. Hsu, L.C.; Wang, K.Y.; Chih, W.H.; Lin, W.C. Modeling revenge and avoidance in the mobile service industry: Moderation role of technology anxiety. Serv. Ind. J. 2019, 39, 1–24. [Google Scholar] [CrossRef]
  27. Gbongli, K.; Peng, Y.; Ackah, O. Selection and ranking of perceived risk associated with mobile banking in West Africa: An AHP Approach from customers’ perspective. Int. J. Sci. Eng. Res. 2016, 7, 80–86. [Google Scholar]
  28. Suri, T.; Jack, W. The long-run poverty and gender impacts of mobile money. Sci. J. 2016, 354, 1288–1292. [Google Scholar] [CrossRef] [PubMed]
  29. Bailey, A.A.; Pentina, I.; Mishra, A.S.; Mimoun, M.S.B. Mobile payments adoption by US consumers: An extended TAM. Int. J. Retail Distrib. Manag. 2017, 45, 626–640. [Google Scholar] [CrossRef]
  30. Davis, F.D. Perceived Usefulness, Perceived Ease of Use, and User Acceptance of Information Technology. MIS Q. 1989, 13, 319–340. [Google Scholar] [CrossRef]
  31. Demoulin, N.T.M.; Djelassi, S. An integrated model of self-service technology (SST) usage in a retail context. Int. J. Retail Distrib. Manag. 2016, 44, 540–559. [Google Scholar] [CrossRef]
  32. Aker, J.C.; Mbiti, I.M. Mobile Phones and Economic Development in Africa. J. Econ. Perspect. 2010, 24, 207–232. [Google Scholar] [CrossRef] [Green Version]
  33. Morawczynski, O. Exploring the usage and impact of ‘transformational’ mobile financial services: The case of M-PESA in Kenya. J. East. Afr. Stud. 2009, 3, 509–525. [Google Scholar] [CrossRef]
  34. Upadhyay, P.; Jahanyan, S. Analyzing user perspective on the factors affecting use intention of mobile based transfer payment. Internet Res. 2016, 26, 38–56. [Google Scholar] [CrossRef]
  35. Gbongli, K. Integrating AHP-TOPSIS approach on prioritizing self-service technology (SST) decision making in financial institution (Togo). Br. J. Math. Comput. Sci. 2016, 16, 1–22. [Google Scholar]
  36. Chandra, S.; Srivastava, S.; Theng, Y. Evaluating the role of trust in consumer adoption of mobile payment systems: An empirical analysis. Commun. Assoc. Inf. Syst. 2010, 27, 561–588. [Google Scholar] [CrossRef]
  37. Bisht, S.S.; Mishra, V. ICT-driven financial inclusion initiatives for urban poor in a developing economy: Implications for public policy. Behav. Inf. Technol. 2016, 35, 817–832. [Google Scholar] [CrossRef]
  38. Demirgüç-Kunt, A.; Klapper, L. Measuring Financial Inclusion: Explaining Variation in Use of Financial Services across and within Countries. Brook. Pap. Econ. Act. 2013, 2013, 279–340. [Google Scholar] [CrossRef] [Green Version]
  39. Lashitew, A.A.; van Tulder, R.; Liasse, Y. Mobile phones for financial inclusion: What explains the diffusion of mobile money innovations? Res. Policy 2019, 48, 1201–1215. [Google Scholar] [CrossRef]
  40. Khalilzadeh, J.; Ozturk, A.B.; Bilgihan, A. Security-related factors in extended UTAUT model for NFC based mobile payment in the restaurant industry. Comput. Hum. Behav. 2017, 70, 460–474. [Google Scholar] [CrossRef]
  41. Patil, P.P.; Dwivedi, Y.K.; Rana, N.P. Digital payments adoption: An analysis of literature. In Lecture Notes in Computer Science (Including Subseries Lecture Notes in Artificial Intelligence and Lecture Notes in Bioinformatics); 10595 LNCS; Spinger: Cham, Switzerland, 2017; pp. 61–70. [Google Scholar]
  42. Shen, H.; Liu, P.; Yi, S. Trust transfer mechanism and intention on accepting NFC mobile payment: An empirical research. In Advances in Intelligent Systems and Computing; Spinger: Cham, Switzerland, 2017; pp. 363–376. [Google Scholar]
  43. Liébana-Cabanillas, F.; Marinkovic, V.; de Luna, I.R.; Kalinic, Z. Predicting the determinants of mobile payment acceptance: A hybrid SEM-neural network approach. Technol. Forecast. Soc. Chang. 2018, 129, 117–130. [Google Scholar] [CrossRef]
  44. Liébana-Cabanillas, F.; Muñoz-Leiva, F.; Sánchez-Fernández, J. A global approach to the analysis of user behavior in mobile payment systems in the new electronic environment. Serv. Bus. 2018, 12, 25–64. [Google Scholar] [CrossRef]
  45. Davis, F.D.; Bagozzi, R.P.; Warshaw, P.R. User Acceptance of Computer Technology: A Comparison of Two Theoretical Models. Manag. Sci. 1989, 35, 982–1003. [Google Scholar] [CrossRef] [Green Version]
  46. Pavlou, A.P. Consumer Acceptance of Electronic Commerce: Integrating Trust and Risk with the Technology Acceptance Model. Int. J. Electron. Commer. 2003, 7, 101–134. [Google Scholar]
  47. Ajzen, I.; Fishbein, M. Belief, Attitude, Attitude, Intention and Behavior: An Introduction to Theory of Research; Addison-Wesley: Reading, MA, USA; Boston, MA, USA, 1975. [Google Scholar]
  48. Viswanath, V.; Michael, G.M.; Gordon, B.D.; Fred, D.D. User Acceptance of Information Technology: Toward a Unified View. MIS Q. 2003, 27, 425–478. [Google Scholar]
  49. Marangunić, N.; Granić, A. Technology acceptance model: A literature review from 1986 to 2013. Univers. Access Inf. Soc. 2015, 14, 81–95. [Google Scholar] [CrossRef]
  50. Legris, P.; Ingham, J.; Collerette, P. Why do people use information technology? A critical review of the technology acceptance model. Inf. Manag. 2003, 40, 191–204. [Google Scholar] [CrossRef]
  51. Turner, M.; Kitchenham, B.; Brereton, P.; Charters, S.; Budgen, D. Does the technology acceptance model predict actual use? A systematic literature review. Inf. Softw. Technol. 2010, 52, 463–479. [Google Scholar] [CrossRef]
  52. Hsiao, C.H.; Yang, C. The intellectual development of the technology acceptance model: A co-citation analysis. Int. J. Inf. Manag. 2011, 31, 128–136. [Google Scholar] [CrossRef]
  53. Mortenson, M.J.; Vidgen, R. A computational literature review of the technology acceptance model. Int. J. Inf. Manag. 2016, 36, 1248–1259. [Google Scholar] [CrossRef] [Green Version]
  54. Sultan, F.; Rohm, A.J.; Gao, T.T. Factors Influencing Consumer Acceptance of Mobile Marketing: A Two-Country Study of Youth Markets. J. Interact. Mark. 2009, 23, 308–320. [Google Scholar] [CrossRef]
  55. Shin, D.H. Towards an understanding of the consumer acceptance of mobile wallet. Comput. Hum. Behav. 2009, 25, 1343–1354. [Google Scholar] [CrossRef]
  56. Abdullah, F.; Ward, R. Developing a General Extended Technology Acceptance Model for E-Learning (GETAMEL) by analysing commonly used external factors. Comput. Hum. Behav. 2016, 56, 238–256. [Google Scholar] [CrossRef]
  57. Isaac, O.; Mutahar, A.M.; Daud, N.M.; Ramayah, T.; Aldholay, A.H. The effect of awareness and perceived risk on the technology acceptance model (TAM): Mobile banking in Yemen. Int. J. Serv. Stand. 2018, 12, 180–204. [Google Scholar] [CrossRef]
  58. Okcu, S.; Koksalmis, G.H.; Basak, E.; Calisir, F. Factors Affecting Intention to Use Big Data Tools: An Extended Technology Acceptance Model. In Industrial Engineering in the Big Data Era. Lecture Notes in Management and Industrial Engineering; Calisir, F., Cevikcan, E., Camgoz Akdag, H., Eds.; Springer: Cham, Switzerland, 2019; pp. 401–416. [Google Scholar]
  59. Kalinic, Z.; Marinkovic, V.; Molinillo, S.; Liébana-Cabanillas, F. A multi-analytical approach to peer-to-peer mobile payment acceptance prediction. J. Retail. Consum. Serv. 2019, 49, 143–153. [Google Scholar] [CrossRef]
  60. Narteh, B.; Mahmoud, M.A.; Amoh, S. Customer behavioural intentions towards mobile money services adoption in Ghana. Serv. Ind. J. 2017, 37, 426–447. [Google Scholar] [CrossRef]
  61. Venkatesh, V.; Bala, H. Technology acceptance model 3 and a research agenda on interventions. Decis. Sci. 2008, 39, 273–315. [Google Scholar] [CrossRef]
  62. Muñoz-Leiva, F.; Climent-Climent, S.; Liébana-Cabanillas, F. Determinants of intention to use the mobile banking apps: An extension of the classic TAM model. Span. J. Mark. ESIC 2017, 21, 25–38. [Google Scholar] [CrossRef]
  63. Malaquias, R.F.; Hwang, Y. Mobile banking use: A comparative study with Brazilian and U.S. participants. Int. J. Inf. Manag. 2019, 44, 132–140. [Google Scholar] [CrossRef]
  64. Chauhan, S. Acceptance of mobile money by poor citizens of India: Integrating trust into the technology acceptance model. Info 2015, 17, 58–68. [Google Scholar] [CrossRef]
  65. Yang, K. The effects of technology self-efficacy and innovativeness on consumer mobile data service adoption between American and Korean consumers. J. Int. Consum. Mark. 2010, 22, 117–127. [Google Scholar] [CrossRef]
  66. Lewis, T.L.; Loker, S. Technology usage intent among apparel retail employees. Int. J. Retail Distrib. Manag. 2014, 42, 422–440. [Google Scholar] [CrossRef]
  67. Joo, Y.J.; Park, S.; Lim, E. Factors influencing preservice teachers’ intentions to use technology. Educ. Technol. Soc. 2018, 21, 48–59. [Google Scholar]
  68. Balapour, A.; Reychav, I.; Sabherwal, R.; Azuri, J. Mobile technology identity and self-efficacy: Implications for the adoption of clinically supported mobile health apps. Int. J. Inf. Manag. 2019, 49, 58–68. [Google Scholar] [CrossRef]
  69. Park, J.K.; Ahn, J.; Thavisay, T.; Ren, T. Examining the role of anxiety and social influence in multi-benefits of mobile payment service. J. Retail. Consum. Serv. 2019, 47, 140–149. [Google Scholar] [CrossRef]
  70. Bandura, A. Self-Efficacy: The Exercise of Control; W H Freeman/Times Books/Henry Holt & Co.: New York, NY, USA, 1997. [Google Scholar]
  71. Venkatesh, V. Determinants of Perceived Ease of Use: Integrating Control, Intrinsic Motivation, and Emotion into the Technology Acceptance Model. Inf. Syst. Res. 2000, 11, 342–365. [Google Scholar] [CrossRef] [Green Version]
  72. Taylor, S.; Todd, P. Decomposition and crossover effects in the theory of planned behavior: A study of consumer adoption intentions. Int. J. Res. Mark. 1995, 12, 137–155. [Google Scholar] [CrossRef]
  73. Faqih, K.M.S. Exploring the influence of perceived risk and internet self-efficacy on consumer online shopping intentions: Perspective of technology acceptance model. Int. Manag. Rev. 2013, 9, 67–78. [Google Scholar]
  74. Hatlevik, O.E.; Throndsen, I.; Loi, M.; Gudmundsdottir, G.B. Students’ ICT self-efficacy and computer and information literacy: Determinants and relationships. Comput. Educ. 2018, 118, 107–119. [Google Scholar] [CrossRef]
  75. Baganzi, R.; Lau, A.K.W. Examining trust and risk in mobile money acceptance in Uganda. Sustainability 2017, 9, 2233. [Google Scholar] [CrossRef]
  76. Meuter, M.L.; Ostrom, A.L.; Bitner, M.J.; Roundtree, R. The influence of technology anxiety on consumer use and experiences with self-service technologies. J. Bus. Res. 2003, 56, 899–906. [Google Scholar] [CrossRef]
  77. Fournier, S.; Mick, G.D. Paradoxes of Technology: Consumer Cognizance, Emotions and Coping Strategies. J. Consum. Res. 1998, 25, 123–143. [Google Scholar]
  78. Cui, G.; Bao, W.; Chan, T.S. Consumers’ adoption of new technology products: The role of coping strategies. J. Consum. Mark. 2009, 26, 110–120. [Google Scholar] [CrossRef]
  79. Parasuraman, A. Index (TRI) A Multiple-Item Scale to Embrace New Technologies. J. Serv. Res. 2000, 2, 307–320. [Google Scholar] [CrossRef]
  80. Venkatesh, V.; Davis, F.D.; College, S.M.W. Theoretical acceptance extension model: Field four studies of the technology longitudinal. Manag. Sci. 2000, 46, 186–204. [Google Scholar] [CrossRef]
  81. Mas, I.; Morawczynski, O. Designing mobile money services lessons from M-PESA. Innovations 2009, 4, 77–91. [Google Scholar] [CrossRef]
  82. Yousafzai, S.Y.; Foxall, G.R.; Pallister, J.G. Technology acceptance: A meta-analysis of the TAM: Part 2. J. Model. Manag. 2007, 2, 281–304. [Google Scholar] [CrossRef]
  83. Van der Heijden, H. Factors influencing the usage of websites: The case of a generic portal in The Netherlands. Inf. Manag. 2003, 40, 541–549. [Google Scholar] [CrossRef]
  84. Yang, K. Consumer technology traits in determining mobile shopping adoption: An application of the extended theory of planned behavior. J. Retail. Consum. Serv. 2012, 19, 484–491. [Google Scholar] [CrossRef]
  85. Agarwal, R.; Karahanna, E. Time Flies When You’re Having Fun: Cognitive Absorption and Beliefs about Information Technology Usage. MIS Q. 2000, 24, 665–694. [Google Scholar] [CrossRef]
  86. Yi, M.Y.; Fiedler, K.D.; Park, J.S. Understanding the Role of Individual Innovativeness in the Acceptance of IT-Based Innovations: Comparative Analyses of Models and Measures. Decis. Sci. 2006, 37, 393–426. [Google Scholar] [CrossRef]
  87. Midgley, D.F. Innovativeness: The concept and its measurement. J. Consum. Res. 1978, 4, 229–242. [Google Scholar] [CrossRef]
  88. Wood, S.L.; Swait, J. Psychological indicators of innovation adoption: Cross-classification based on need for cognition and need for change. J. Consum. Psychol. 2002, 12, 1–13. [Google Scholar] [CrossRef]
  89. Rogers, E.M. Diffusion of innovations; Free Press: New York, NY, USA, 2003; p. 448. [Google Scholar]
  90. Fang, J.; Shao, P.; Lan, G. Effects of innovativeness and trust on web survey participation. Comput. Hum. Behav. 2009, 25, 144–152. [Google Scholar] [CrossRef]
  91. Lian, J.W.; Lin, T.M. Effects of consumer characteristics on their acceptance of online shopping: Comparisons among different product types. Comput. Hum. Behav. 2008, 24, 48–65. [Google Scholar] [CrossRef]
  92. Tan, G.W.H.; Ooi, K.B.; Leong, L.Y.; Lin, B. Predicting the drivers of behavioral intention to use mobile learning: A hybrid SEM-Neural Networks approach. Comput. Hum. Behav. 2014, 36, 198–213. [Google Scholar] [CrossRef]
  93. Yang, K.; Jolly, L.D. The effects of consumer perceived value and subjective norm on mobile data service adoption between American and Korean consumers. J. Retail. Consum. Serv. 2009, 16, 502–508. [Google Scholar] [CrossRef]
  94. Tao, D.; Yuan, J.; Shao, F.; Li, D.; Zhou, Q.; Qu, X. Factors Affecting Consumer Acceptance of an Online Health Information Portal among Young Internet Users. CIN—Comput. Inform. Nurs. 2018, 36, 530–539. [Google Scholar] [CrossRef] [PubMed]
  95. Teo, T.; Zhou, M. Explaining the intention to use technology among university students: A structural equation modeling approach. J. Comput. High. Educ. 2014, 26, 124–142. [Google Scholar] [CrossRef]
  96. Wu, B.; Chen, X. Continuance intention to use MOOCs: Integrating the technology acceptance model (TAM) and task technology fit (TTF) model. Comput. Hum. Behav. 2017, 67, 221–232. [Google Scholar] [CrossRef]
  97. Rossiter, J.R. The C-OAR-SE procedure for scale development in marketing. Int. J. Res. Mark. 2002, 19, 305–335. [Google Scholar] [CrossRef] [Green Version]
  98. Agarwal, R.; Prasa, J. A Conceptual and Operational Definition o f Personal Innovativeness in the Domain o f Information Technology. Inf. Syst. Res. 1998, 9, 204–215. [Google Scholar] [CrossRef]
  99. Flynn, L.R.; Goldsmith, R.E. A validation of the goldsmith and hofacker innovativeness scale. Educ. Psychol. Meas. 1993, 53, 1105–1116. [Google Scholar] [CrossRef]
  100. MacKenzie, S.B.; Lutz, R.J. An Empirical Examination of the Structural Antecedents of Attitude toward the Ad in an Advertising Pretesting Context. J. Mark. 1989, 53, 48–65. [Google Scholar] [CrossRef]
  101. Lafferty, B.A.; Goldsmith, R.E.; Newell, S.J. The Dual Credibility Model: The Influence of Corporate and Endorser Credibility on Attitudes and Purchase Intentions. J. Mark. Theory Pract. 2015, 10, 1–11. [Google Scholar] [CrossRef]
  102. Venkatesh, V.; Davis, F.D. A Theoretical Extension of the Technology Acceptance Model: Four Longitudinal Field Studies. Manag. Sci. 2000, 46, 186–204. [Google Scholar] [CrossRef] [Green Version]
  103. Steenkamp, J.B.E.M.; van Trijp, H.C.M. The use of lisrel in validating marketing constructs. Int. J. Res. Mark. 1991, 8, 283–299. [Google Scholar] [CrossRef]
  104. Hinkin, T.R. A Review of Scale Development Practices in the Study of Organizations. J. Manag. 1995, 21, 967–988. [Google Scholar] [CrossRef]
  105. Hair, J.F.; Hult, J.G.T.; Ringle, C.M.; Sarstedt, M. A Primer on Partial Least Squares Structural Equation Modeling (PLS-SEM), 2nd ed.; SAGE: Thousand Oaks, CA, USA, 2017. [Google Scholar]
  106. Podsakoff, P.M.; MacKenzie, S.B.; Lee, J.; Podsakoff, N.P. Common method biases in behavioral research: A critical review of the literature and recommended remedies. J. Appl. Psychol. 2003, 88, 879–903. [Google Scholar] [CrossRef] [PubMed]
  107. Malhotra, N.K.; Kim, S.S.; Patil, A. Common Method Variance in IS Research: A Comparison of Alternative Approaches and a Reanalysis of Past Research. Manag. Sci. 2006, 52, 1865–1883. [Google Scholar] [CrossRef]
  108. Conway, J.M.; Lance, C.E. What reviewers should expect from authors regarding common method bias in organizational research. J. Bus. Psychol. 2010, 25, 325–334. [Google Scholar] [CrossRef]
  109. Harman, H.H. Modern Factor Analysis, 3rd ed.; University of Chicago Press: Chicago, IL, USA, 1976. [Google Scholar]
  110. Sun, Y.; Wang, N.; Yin, C.; Zhang, J.X. Understanding the relationships between motivators and effort in crowdsourcing marketplaces: A nonlinear analysis. Int. J. Inf. Manag. 2015, 35, 267–276. [Google Scholar] [CrossRef]
  111. Podsakoff, P.M.; Organ, D.W. Self-Reports in Organizational Research: Problems and Prospects. J. Manag. 1986, 12, 531–544. [Google Scholar] [CrossRef]
  112. Liébana-Cabanillas, F.; Marinković, V.; Kalinić, Z. A SEM-neural network approach for predicting antecedents of m-commerce acceptance. Int. J. Inf. Manag. 2017, 37, 14–24. [Google Scholar] [CrossRef]
  113. Sharma, S.K. Integrating cognitive antecedents into TAM to explain mobile banking behavioral intention: A SEM-neural network modeling. Inf. Syst. Front. 2017, 1, 1–13. [Google Scholar] [CrossRef]
  114. Hsu, C.I.; Shih, M.L.; Huang, B.W.; Lin, B.Y.; Lin, C.N. Predicting tourism loyalty using an integrated Bayesian network mechanism. Expert Syst. Appl. 2009, 36, 11760–11763. [Google Scholar] [CrossRef]
  115. Wong, T.C.; Law, K.M.Y.; Yau, H.K.; Ngan, S.C. Analyzing supply chain operation models with the PC-algorithm and the neural network. Expert Syst. Appl. 2011, 38, 7526–7534. [Google Scholar] [CrossRef]
  116. Leong, L.Y.; Ooi, K.B.; Chong, A.Y.L.; Lin, B. Modeling the stimulators of the behavioral intention to use mobile entertainment: Does gender really matter? Comput. Hum. Behav. 2013, 29, 2109–2121. [Google Scholar] [CrossRef]
  117. Morris, S.A.; Greer, T.H.; Hughes, C.; Clark, W.J. Prediction of CASE adoption: A neural network approach. Ind. Manag. Data Syst. 2003, 104, 129–135. [Google Scholar] [CrossRef]
  118. Leong, L.Y.; Hew, T.S.; Tan, G.W.H.; Ooi, K.B. Predicting the determinants of the NFC-enabled mobile credit card acceptance: A neural networks approach. Expert Syst. Appl. 2013, 40, 5604–5620. [Google Scholar] [CrossRef]
  119. Garson, G. Neural networks: An Introductory Guide for Social Scientists; SAGE: Thousand Oaks, CA, USA, 1998. [Google Scholar]
  120. Anderson, J.C.; Gerbing, D.W. Structural Equation Modeling in Practice: A Review and Recommended Two-Step Approach. Psychol. Bull. 1988, 103, 411–423. [Google Scholar] [CrossRef]
  121. Kline, R.B. Principles and Practice of Structural Equation Modeling, 4th ed.; Guilford Publications: New York, NY, USA, 2015. [Google Scholar]
  122. Chin, W.W.; Newsted, P.R. Structural Equation Modeling Analysis with Small Samples Using Partial Least Squares. In Statistical Strategies for Small Sample Research; Hoyle, R.H., Ed.; Sage Publications, Inc.: Thousand Oaks, CA, USA, 1999. [Google Scholar]
  123. Lu, J.; Wei, J.; Yu, C.S.; Liu, C. How do post-usage factors and espoused cultural values impact mobile payment continuation? Behav. Inf. Technol. 2017, 36, 140–164. [Google Scholar] [CrossRef]
  124. Vuong Q-HHo, M.T.; Vuong, T.T.; La, V.P.; Ho, M.T.; Nghiem, K.P.; Tran, B.X.; Giang, H.H.; Giang, T.V.; Latkin, C.; Nguyen, H.T.; et al. Artificial Intelligence vs. Natural Stupidity: Evaluating AI readiness for the Vietnamese Medical Information System. J. Clin. Med. 2019, 8, 168. [Google Scholar] [CrossRef] [PubMed]
  125. Chin, W.W. The Partial Least Squares Approach for Structural Equation Modeling: Methodology for Business and Management; Lawrence Erlbaum Associates: Hillsdale, NJ, USA, 1998. [Google Scholar]
  126. Ho, R. Handbook of Univariate and Multivariate Data Analysis and Interpretation with IBM SPSS; Taylor & Francis: Abingdon-on-Thames/Oxfordshire, UK, 2013. [Google Scholar]
  127. Hair, J.F.; Sarstedt, M.; Ringle, C.M.; Mena, J.A. An assessment of the use of partial least squares structural equation modeling in marketing research. J. Acad. Mark. Sci. 2012, 40, 414–433. [Google Scholar] [CrossRef]
  128. Chin, W. The partial least squares approach to structural equation modeling. Mod. Methods Bus. Res. 1998, 295, 295–336. [Google Scholar]
  129. Fornell, C.; Larcker, D.F. Evaluating Structural Equation Models with Unobservable Variables and Measurement Error. J. Mark. Res. 1981, 18, 39–50. [Google Scholar] [CrossRef]
  130. Bagozzi, R.P.; Yi, Y. On the evaluation of structural equation models. J. Acad. Mark. Sci. 1988, 16, 74–94. [Google Scholar] [CrossRef]
  131. Sarstedt, M.; Ringle, C.M.; Smith, D.; Reams, R.; Hair, J.F. Partial least squares structural equation modeling (PLS-SEM): A useful tool for family business researchers. J. Fam. Bus. Strateg. 2014, 5, 105–115. [Google Scholar] [CrossRef]
  132. Hult, G.T.M.; Hair, J.F.; Proksch, D.; Sarstedt, M.; Pinkwart, A.; Ringle, C.M. Addressing Endogeneity in Partial Least Squares Structural. J. Int. Mark. 2018, 26, 1–21. [Google Scholar] [CrossRef]
  133. Kock, N. WarpPLS User Manual: Version 6.0; ScriptWarp: Laredo, TX, USA, 2017. [Google Scholar]
  134. Weerawardena, J.; Mort, G.S.; Salunke, S.; Knight, G.; Liesch, P.W. The role of the market sub-system and the socio-technical sub-system in innovation and firm performance: A dynamic capabilities approach. J. Acad. Mark. Sci. 2015, 43, 221–239. [Google Scholar] [CrossRef]
  135. Hulland, J. Use of partial least squares (PLS) in strategic management research: A review of four recent studies. Strategic 1999, 204, 195–204. [Google Scholar] [CrossRef]
  136. Gefen, D.; Straub, D.; Boudreau, M. Structural equation modeling and regression: Guidelines for research practice. Commun. Assoc. Inf. Syst. 2000, 4, 7. [Google Scholar] [CrossRef]
  137. Bernstein, I.; Nunnally, J. Psychometric Theory, 3rd ed.; McGraw-Hill: New York, NY, USA, 1994; p. 701. [Google Scholar]
  138. Hair, J.F.; Ringle, C.M.; Sarstedt, M. PLS-SEM: Indeed a Silver Bullet. J. Mark. Theory Pract. 2011, 19, 139–152. [Google Scholar] [CrossRef]
  139. Chin, W.W.; Peterson, R.A.; Brown, S.P. Structural Equation Modeling in Marketing: Some Practical Reminders. J. Mark. Theory Pract. 2008, 16, 287–298. [Google Scholar] [CrossRef]
  140. Tenenhaus, M.; Vinzi, V.E.; Chatelin, Y.M.; Lauro, C. PLS path modeling. Comput. Stat. Data Anal. 2005, 48, 159–205. [Google Scholar] [CrossRef]
  141. Chin, W.W. How to Write Up and Report PLS Analyses. In Handbook of Partial Least Squares; Springer: Berlin, Germany, 2010; pp. 655–690. [Google Scholar]
  142. Fornel, C.; Cha, J. Partial Least Squares. In Advance Method of Marketing Ressearch; Bagozzi, R.P., Ed.; Cambridge: Blackwell, New Zealand, 1994. [Google Scholar]
  143. Cohen, J. Statistical Power Analysis for the Behavioral Sciences, 2nd ed.; Routledge: Abington Thames, UK, 1988. [Google Scholar]
  144. Schloderer, M.P.; Sarstedt, M.; Ringle, C.M. The relevance of reputation in the nonprofit sector: The moderating effect of socio-demographic characteristics. Int. J. Nonprofit Volunt. Sect. Mark. 2014, 19, 110–126. [Google Scholar] [CrossRef]
  145. Henseler, J.; Hubona, G.; Ray, P.A. Using PLS path modeling in new technology research: Updated guidelines. Ind. Manag. Data Syst. 2016, 116, 2–20. [Google Scholar] [CrossRef]
  146. Wetzels, M.; Odekerken-Schröder, G.; van Oppen, C. Using PLS path m modeling for assessing hierarchical construct models: Guidelines and empirical. MIS Q. 2009, 33, 177–195. [Google Scholar] [CrossRef]
  147. Azizi, N.; Rezakazemi, M.; Zarei, M.M. An intelligent approach to predict gas compressibility factor using neural network model. Neural Comput. Appl. 2019, 31, 55–64. [Google Scholar] [CrossRef]
  148. Haykin, S.O. Neural Networks and Learning Machines, 3rd ed.; Pearson: London, UK, 2008. [Google Scholar]
  149. Kubat, M. Neural Networks: A Comprehensive Foundation. Knowl. Eng. Rev. 1999, 13, 409–412. [Google Scholar] [CrossRef]
  150. Yadav, R.; Sharma, S.K.; Tarhini, A. A multi-analytical approach to understand and predict the mobile commerce adoption. J. Enterp. Inf. Manag. 2016, 29, 222–237. [Google Scholar] [CrossRef]
  151. Ooi, K.B.; Tan, G.W.H. Mobile technology acceptance model: An investigation using mobile users to explore smartphone credit card. Expert Syst. Appl. 2016, 59, 33–46. [Google Scholar] [CrossRef]
  152. Wang, Y.M.; Elhag, T.M.S. A comparison of neural network, evidential reasoning and multiple regression analysis in modelling bridge risks. Expert Syst. Appl. 2007, 32, 336–348. [Google Scholar] [CrossRef]
  153. He, Y.; Chen, Q.; Kitkuakul, S. Regulatory focus and technology acceptance: Perceived ease of use and usefulness as efficacy. Cogent Bus. Manag. 2018, 5, 1–22. [Google Scholar] [CrossRef]
  154. Polites, G.; Karahanna, E. Shackled to the Status Quo: The Inhibiting Effects of Incumbent System Habit, Switching Costs, and Inertia on New System Acceptance. MIS Q. 2018, 36, 21–42. [Google Scholar] [CrossRef]
  155. Howard, G.S.; Smith, R.D. Computer anxiety in management: Myth or reality? Commun. ACM 2002, 29, 611–615. [Google Scholar] [CrossRef]
  156. Ariff, M.S.M.; Yeow, S.M.; Zakuan, N.; Jusoh, A.; Bahari, A.Z. The Effects of Computer Self-Efficacy and Technology Acceptance Model on Behavioral Intention in Internet Banking Systems. Procedia Soc. Behav. Sci. 2012, 57, 448–452. [Google Scholar] [CrossRef] [Green Version]
  157. Lee, J.; Ryu, M.H.; Lee, D. A study on the reciprocal relationship between user perception and retailer perception on platform-based mobile payment service. J. Retail. Consum. Serv. 2019, 48, 7–15. [Google Scholar] [CrossRef]
  158. Hung, S.Y.; Chang, C.M.; Kuo, S.R. User acceptance of mobile e-government services: An empirical study. Gov. Inf. Q. 2013, 30, 33–44. [Google Scholar] [CrossRef]
  159. Kelly, K. New Rules for the New Economy: Twelve Dependable Principles for Thriving in a Turbulent World; Penguin Group Penguin Putnam Inc.: New York, NY, USA, 1997. [Google Scholar]
  160. Liu, Y.; Li, H.; Carlsson, C. Factors driving the adoption of m-learning: An empirical study. Comput. Educ. 2010, 55, 1211–1219. [Google Scholar] [CrossRef]
  161. Lu, J.; Yao, J.E.; Yu, C.S. Personal innovativeness, social influences and adoption of wireless Internet services via mobile technology. J. Strateg. Inf. Syst. 2005, 14, 245–268. [Google Scholar] [CrossRef]
  162. Chong, A.Y.L. Predicting m-commerce adoption determinants: A neural network approach. Expert Syst. Appl. 2013, 40, 523–530. [Google Scholar] [CrossRef]
  163. Van der Heijden, H. User acceptance of hedonic information systems. MIS Q. 2004, 28, 695–704. [Google Scholar] [CrossRef]
  164. Ratha, D.; Mohapatra, S.; Ozden, C.; Plaza, S.; Shaw, W.; Shimeles, A. Leveraging Migration for Africa; The World Bank: Washington, DC, USA, 2011. [Google Scholar]
  165. Islam, A.; Muzi, S.; Meza, J.L.R. Does mobile money use increase firms’ investment? Evidence from Enterprise Surveys in Kenya, Uganda, and Tanzania. Small Bus. Econ. 2018, 51, 687–708. [Google Scholar] [CrossRef]
  166. Reeves, M.; Sabharwal, N. Microfinance and mobile banking for the bottom of the pyramid. J. Enterp. Commun. 2013, 7, 155–166. [Google Scholar] [CrossRef]
  167. Xu, H.; Gupta, S. The effects of privacy concerns and personal innovativeness on potential and experienced customers’ adoption of location-based services. Electron. Mark. 2009, 19, 137–149. [Google Scholar] [CrossRef]
  168. Moore, G.C.; Benbasat, I. Development of an instrument to measure the perceptions of adopting an information technology innovation. Inf. Syst. Res. 1991, 2, 192–222. [Google Scholar] [CrossRef]
  169. Mathieson, K. Predicting user intentions: Comparing the technology acceptance model with the theory of planned behavior. Inf. Syst. Res. 1991, 2, 173–191. [Google Scholar] [CrossRef]
Figure 1. Proposed research model.
Sustainability 11 03639 g001
Figure 2. SEM path analysis results. Notes: ** p < 0.01, * p < 0.05, n.s.= No statistically significant effect.
Sustainability 11 03639 g002
Figure 3. Network architecture for a single layer perceptron procedure.
Sustainability 11 03639 g003
Figure 4. Artificial neural network used in this study.
Sustainability 11 03639 g004
Table 1. Demographic information of respondents (n = 539).
Respondents’ ProfileNumberRate (%)
GenderWomen28753.2
Men25246.8
AgeUnder 187614.1
19–2414526.9
25–3019936.9
31 and over11922.1
EducationA Level26849.7
Undergraduate20337.7
Graduate5710.6
Doctorate112.0
Prior mobile money experiencenone12423.0
1 Year20838.6
1–2 Years13625.2
3–4 Years366.7
5 Years356.5
Table 2. Construct reliability and validity.
Constructs ItemsLoadings 1AVE 2CR 3α 4
Mobile money self-efficacy (SEMM)SEMM10.9220.7450.8970.85
SEMM20.817
SEMM40.846
Mobile money technology anxiety (TAMM)TAMM10.9350.8210.9320.896
TAMM20.838
TAMM30.942
Perceived ease-of-use mobile money (PEMM)PEMM10.8850.7440.8970.828
PEMM20.91
PEMM30.789
Mobile money perceived usefulness (PUMM)PUMM10.8790.7260.8880.815
PUMM20.887
PUMM30.786
Attitude toward mobile money (ATMM)ATMM10.870.6620.8860.83
ATMM20.829
ATMM30.795
ATMM40.755
Personal innovativeness in mobile money (PIMM)PIMM10.8470.670.890.838
PIMM20.811
PIMM30.717
PIMM40.891
Mobile money usage intention (IUMM)IUMM10.8520.720.9110.871
IUMM20.889
IUMM30.765
IUMM40.882
1 All item Loading > 0.5 indicates indicator Reliability [135]; 2 All Average Variance Extracted (AVE) > 0.5 as an indication of Convergent Reliability [130]; 3 All Composite Reliability (CR) > 0.7 indicates internal. Consistency [136]; 4 All Cronbach’s alpha > 0.7 indicates indicator Reliability [137].
Table 3. Discriminant validity (Fornell–Larcker criterion test).
ConstructsATMMSEMMTAMMIUMMPEMMPUMMPIMM
Attitude toward mobile money (ATMM)0.814
Mobile money self-efficacy (SEMM)0.2450.863
Mobile money technology anxiety (TAMM)0.1740.030.906
Mobile money usage intention (IUMM)0.3090.2180.0180.848
Perceived ease-of-use mobile money (PEMM)0.5560.1940.1250.3060.863
Mobile money perceived usefulness (PUMM)0.4350.227−0.0010.1870.3790.852
Personal innovativeness in mobile money (PIMM)0.3550.0980.1560.2460.3620.2190.819
Table 4. Indicator item cross-loading.
Items ATMMSEMMTAMMIUMMPEMMPUMMPIMM
ATMM10.8700.2860.1550.2930.5520.4090.382
ATMM20.8290.2170.1610.2570.4290.3300.281
ATMM30.7950.0940.1890.1990.4010.3190.207
ATMM40.7550.1690.0620.2420.4040.3460.257
SEMM10.2900.9220.0460.2390.2220.2710.165
SEMM20.0980.8170.0040.1490.0890.085−0.016
SEMM40.1570.8460.0060.1340.1280.1430.010
TAMM10.202−0.0020.9350.0200.125−0.0180.146
TAMM20.0710.0390.838−0.0070.061−0.0320.106
TAMM30.1610.0510.9420.0230.1300.0310.158
IUMM10.3290.2490.0240.8520.2940.2070.236
IUMM20.2420.1510.0160.8890.2520.1430.203
IUMM30.2040.161−0.0010.7650.2050.0950.142
IUMM40.2470.1590.0160.8820.2700.1640.232
PEMM10.5370.2050.1050.2870.8850.3750.378
PEMM20.4830.1830.1750.2740.9100.3110.289
PEMM30.4060.0970.0280.2250.7890.2860.254
PUMM10.4250.2710.0290.2120.4070.8790.243
PUMM20.3610.180−0.0070.1100.2880.8870.178
PUMM30.3060.092−0.0390.1400.2400.7860.113
PIMM10.3750.1400.1500.2470.3760.2150.847
PIMM20.2220.0360.1190.1640.2450.1220.811
PIMM30.2010.0140.0650.1470.1960.1420.717
PIMM40.3110.0890.1530.2170.3150.2110.891
Notes: ATMM = Attitude toward mobile money; SEMM = Mobile money self-efficacy; TAMM = Mobile money technology anxiety; IUMM = Mobile money usage intention; PEMM = Perceived ease-of-use mobile money; PUMM = Mobile money perceived usefulness; PIMM =Personal innovativeness in mobile money.
Table 5. Coefficient of determination (R2), predictive sample reuse technique (Q2) and effect size (f2).
Endogenous ConstructR2Q2Relationshipf2Decision
ATMM0.5050.241PEMM→ATMM0.327Large
PUMM→ATMM0.108Moderate
PIMM→ATMM0.035Weak
IUMM0.1460.077ATMM →IUMM0.082Weak
PIMM →IUMM0.024Weak
PEMM0.0580.032SEMM →PEMM0.042Weak
TAMM →PEMM0.018No effect
PUMM0.2230.110SEMM →PUMM0.029Weak
TAMM →PUMM0.005No effect
PEMM→PUMM0.215Moderate
Notes: ATMM = Attitude toward mobile money; SEMM = Mobile money self-efficacy; TAMM = Mobile money technology anxiety; IUMM = Mobile money usage intention; PEMM = Perceived ease-of-use mobile money; PUMM = Mobile money perceived usefulness; PIMM = Personal innovativeness in mobile money.
Table 6. Global goodness of fit index (GOF).
ConstructAVER2
Mobile money self-efficacy (SEMM) 0.745
Mobile money technology anxiety (TAMM) 0.821
Perceived ease-of-use mobile money (PEMM)0.7440.058
Mobile money perceived usefulness (PUMM)0.7260.223
Attitude toward mobile money (ATMM)0.6620.505
Personal innovativeness in mobile money (PIMM)0.67
Mobile money usage intention (IUMM)0.720.146
Average Values0.7270.233
AVE×R20.169
G O F = ( A V E   × R 2   )         0.412
Table 7. Result of hypotheses testing.
Hypothesis RelationshipβSEt-Values95% CI LL95%CI UL
Direct effect
H1aSEMM -> PEMM0.1930.0483.965 **0.1090.267
H1bSEMM -> PUMM0.1630.0423.794 **0.090.231
H2aTAMM -> PEMM0.1190.0512.337 *0.0310.201
H2bTAMM -> PUMM−0.0540.0461.08−0.1310.02
H3aPEMM -> ATMM0.4080.0488.397 **0.330.487
H3bPEMM -> PUMM0.3570.0497.187 **0.2770.435
H4PUMM -> ATMM0.2450.054.899 **0.1580.327
H5aPIMM -> ATMM0.1550.0374.173 **0.0960.214
H5bPIMM -> IUMM0.1580.0483.248 **0.0780.242
H6ATMM -> IUMM0.2550.0465.475 **0.1740.326
Indirect Effect
H7aSEMM -> PEMM -> ATMM0.0780.0233.428**0.0420.116
H7cTAMM -> PEMM -> ATMM0.0490.0212.254 **0.0140.083
H7bSEMM -> PUMM -> ATMM0.0410.0132.935 **0.020.063
H7dTAMM -> PUMM -> ATMM−0.0130.0111.099−0.0280.008
H8PEMM -> PUMM -> ATMM0.0880.0214.214 **0.0570.126
H9cPEMM -> ATMM -> IUMM0.1040.0234.502 **0.0680.143
H9bPUMM -> ATMM -> IUMM0.0640.0183.497 **0.0370.097
H9aPIMM -> ATMM -> IUMM0.040.0133.103 **0.020.062
Notes: ** p < 0.01, * p < 0.05; SEMM = Mobile money self-efficacy; TAMM = Mobile money technology anxiety; PEMM = Perceived ease-of-use mobile money; PUMM = Mobile money perceived usefulness; PIMM =Personal innovativeness in mobile money; ATMM = Attitude toward mobile money; IUMM = Mobile money usage intention.
Table 8. RMSE values of ten artificial neural networks.
Model: AModel: BModel: CModel: D
NetworkInput neuron: SEMM, TAMMInput neuron: SEMM, PEMMInput neuron: PEMM, PUMM, PIMMInput neuron: PIMM, ATMM
Output neuron: PEMMOutput neuron: PUMMOutput neuron: ATMMOutput neuron: IUMM
Training TestingTraining TestingTraining TestingTraining Testing
ANN10.13690.04950.13870.03750.09690.03670.14720.0579
ANN20.13900.05110.13210.05550.09720.03690.14980.0505
ANN30.13580.05210.14250.03060.10330.02540.14900.0554
ANN40.13950.04320.14130.04790.10880.04050.15050.0539
ANN50.13960.04150.13640.04410.10370.03420.15100.0516
ANN60.13710.04890.13790.03790.10040.03180.15430.0424
ANN70.13850.04720.13870.03550.10250.02340.14990.0524
ANN80.14000.05250.14300.04270.09770.03850.14850.0554
ANN90.13830.05330.13530.04590.10330.02390.14990.0522
ANN100.14150.05150.13510.04640.10210.03650.15220.0476
Mean RMSE0.13860.04910.13810.04240.10160.03280.15020.0519
Standard deviation0.00170.00400.00350.00720.00370.00640.00200.0044
Notes: SEMM = Mobile money self-efficacy; TAMM = Mobile money technology anxiety; PEMM = Perceived ease-of-use mobile money; PUMM = Mobile money perceived usefulness; PIMM =Personal innovativeness in mobile money; ATMM = Attitude toward mobile money; IUMM = Mobile money usage intention.
Table 9. Relevance of variables based on non-zero synaptic weight with hidden neurons.
ModelPredictor VariableArtificial Neural Network
ANN1ANN2ANN3ANN4ANN5ANN6ANN7ANN8ANN9ANN10
ASEMM
TAMM
BSEMM
PEMM
CPEMM
PUMM
PIMM
DPIMM
ATMM
Notes: Dependent variable = IUMM (Mobile money usage intention); SEMM = Mobile money self-efficacy; TAMM = Mobile money technology anxiety; PEMM = Perceived ease-of-use mobile money; PUMM = Mobile money perceived usefulness; PIMM = Personal innovativeness in mobile money; ATMM = Attitude toward mobile money; ✓ indicates at least one non-zero synaptic weight was connected to the hidden neurons.
Table 10. Neural network sensitivity analysis.
NetworkModel AModel BModel CModel D
Output neuron: PEMMOutput neuron: PUMMOutput neuron: ATMMOutput neuron: IUMM
Relative importanceRelative importanceRelative importanceRelative importance
SEMMTAMMSEMMPEMMPEMMPUMMPIMMPIMMATMM
ANN10.5620.4380.3340.6660.4950.3100.1940.4050.595
ANN20.6120.3880.3210.6790.5280.3080.1650.3680.632
ANN30.5660.4340.3340.6660.5410.2390.2200.4420.558
ANN40.5480.4520.1000.9000.4190.2550.3260.5170.483
ANN50.5200.4800.2990.7010.4220.2700.3080.5310.469
ANN60.5370.4630.2210.7790.6170.1840.1990.5000.500
ANN70.6300.3700.3280.6720.6020.2770.1200.4780.522
ANN80.8310.1690.5940.4060.3900.2780.3320.2860.714
ANN90.6600.3400.2200.7800.5680.2240.2080.3890.611
ANN100.6450.3550.2720.7280.4020.3030.2950.5030.497
Average relative importance0.6110.3890.3020.6980.4980.2650.2370.4420.558
Normalized importance (%) 100.063.643.3100.0100.053.147.579.2100.0
Notes: SEMM = Mobile money self-efficacy; TAMM = Mobile money technology anxiety; PEMM = Perceived ease-of-use mobile money; PUMM = Mobile money perceived usefulness; PIMM = Personal innovativeness in mobile money; ATMM = Attitude toward mobile money; IUMM = Mobile money usage intention.

