Optimal Layout of Static Guidance Information in Comprehensive Transportation Hubs Based on Passenger Pathfinding Behavior


Abstract
:1. Introduction
2. Methodology
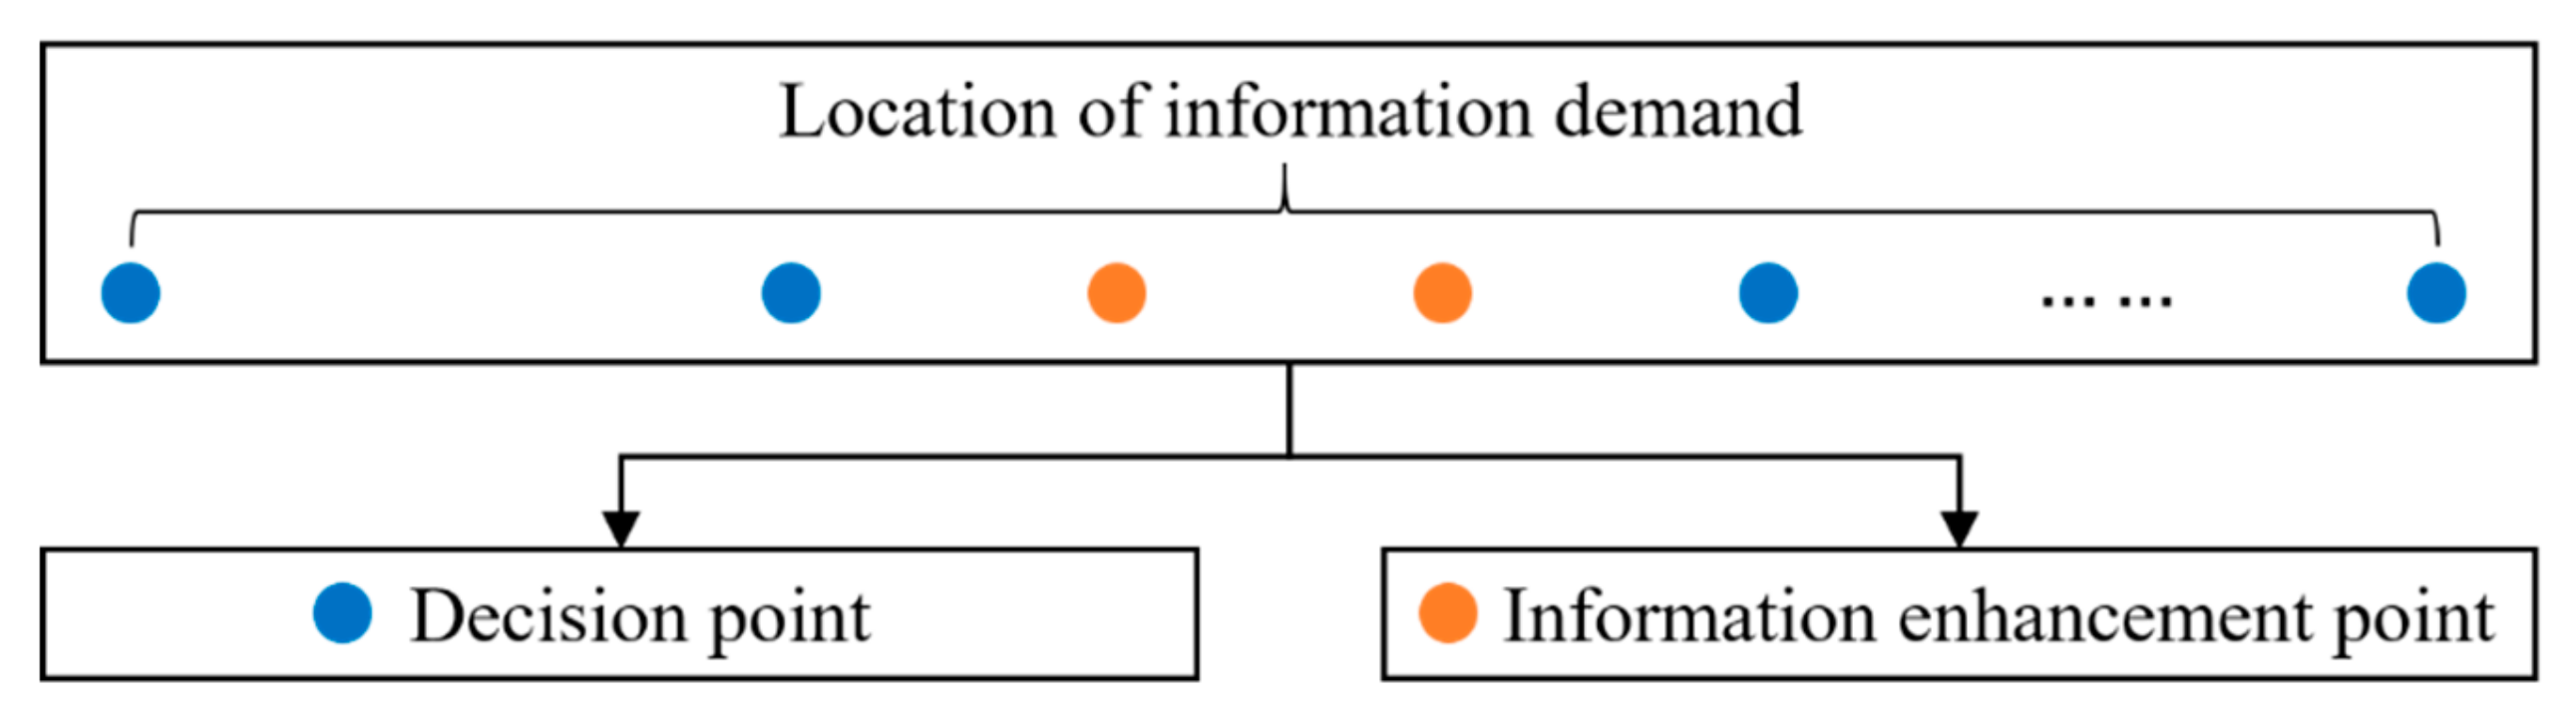
2.1. Definition of Information Demand
- (1)
- Information demand for path selectionIn the process of pathfinding, the location where the passenger needs to select a path is called the decision point, which is where the information demand for path selection is generated. That is, it is necessary to provide sufficient guidance signs at corresponding decision points to help passengers make pathfinding decisions.
- (2)
- Information demand for enhanced certaintyAfter the passenger enters the correct path, the location where the information demand for enhanced certainty is generated between decision points is called the information enhancement point. It is necessary to add appropriate guidance signs between decision points to ensure continuity of the passenger’s psychology.
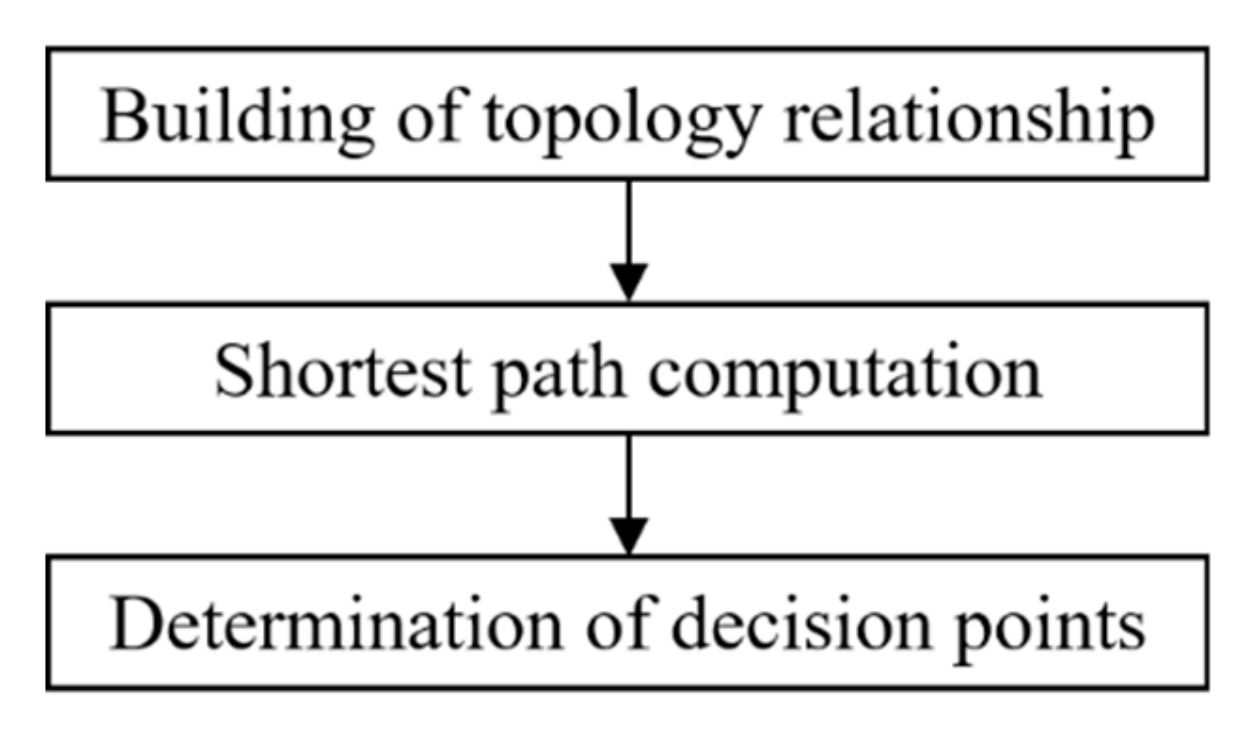
2.2. Determination of Decision Points for Information Demand
2.2.1. Building of Topology Relationship
2.2.2. Shortest Path Computation
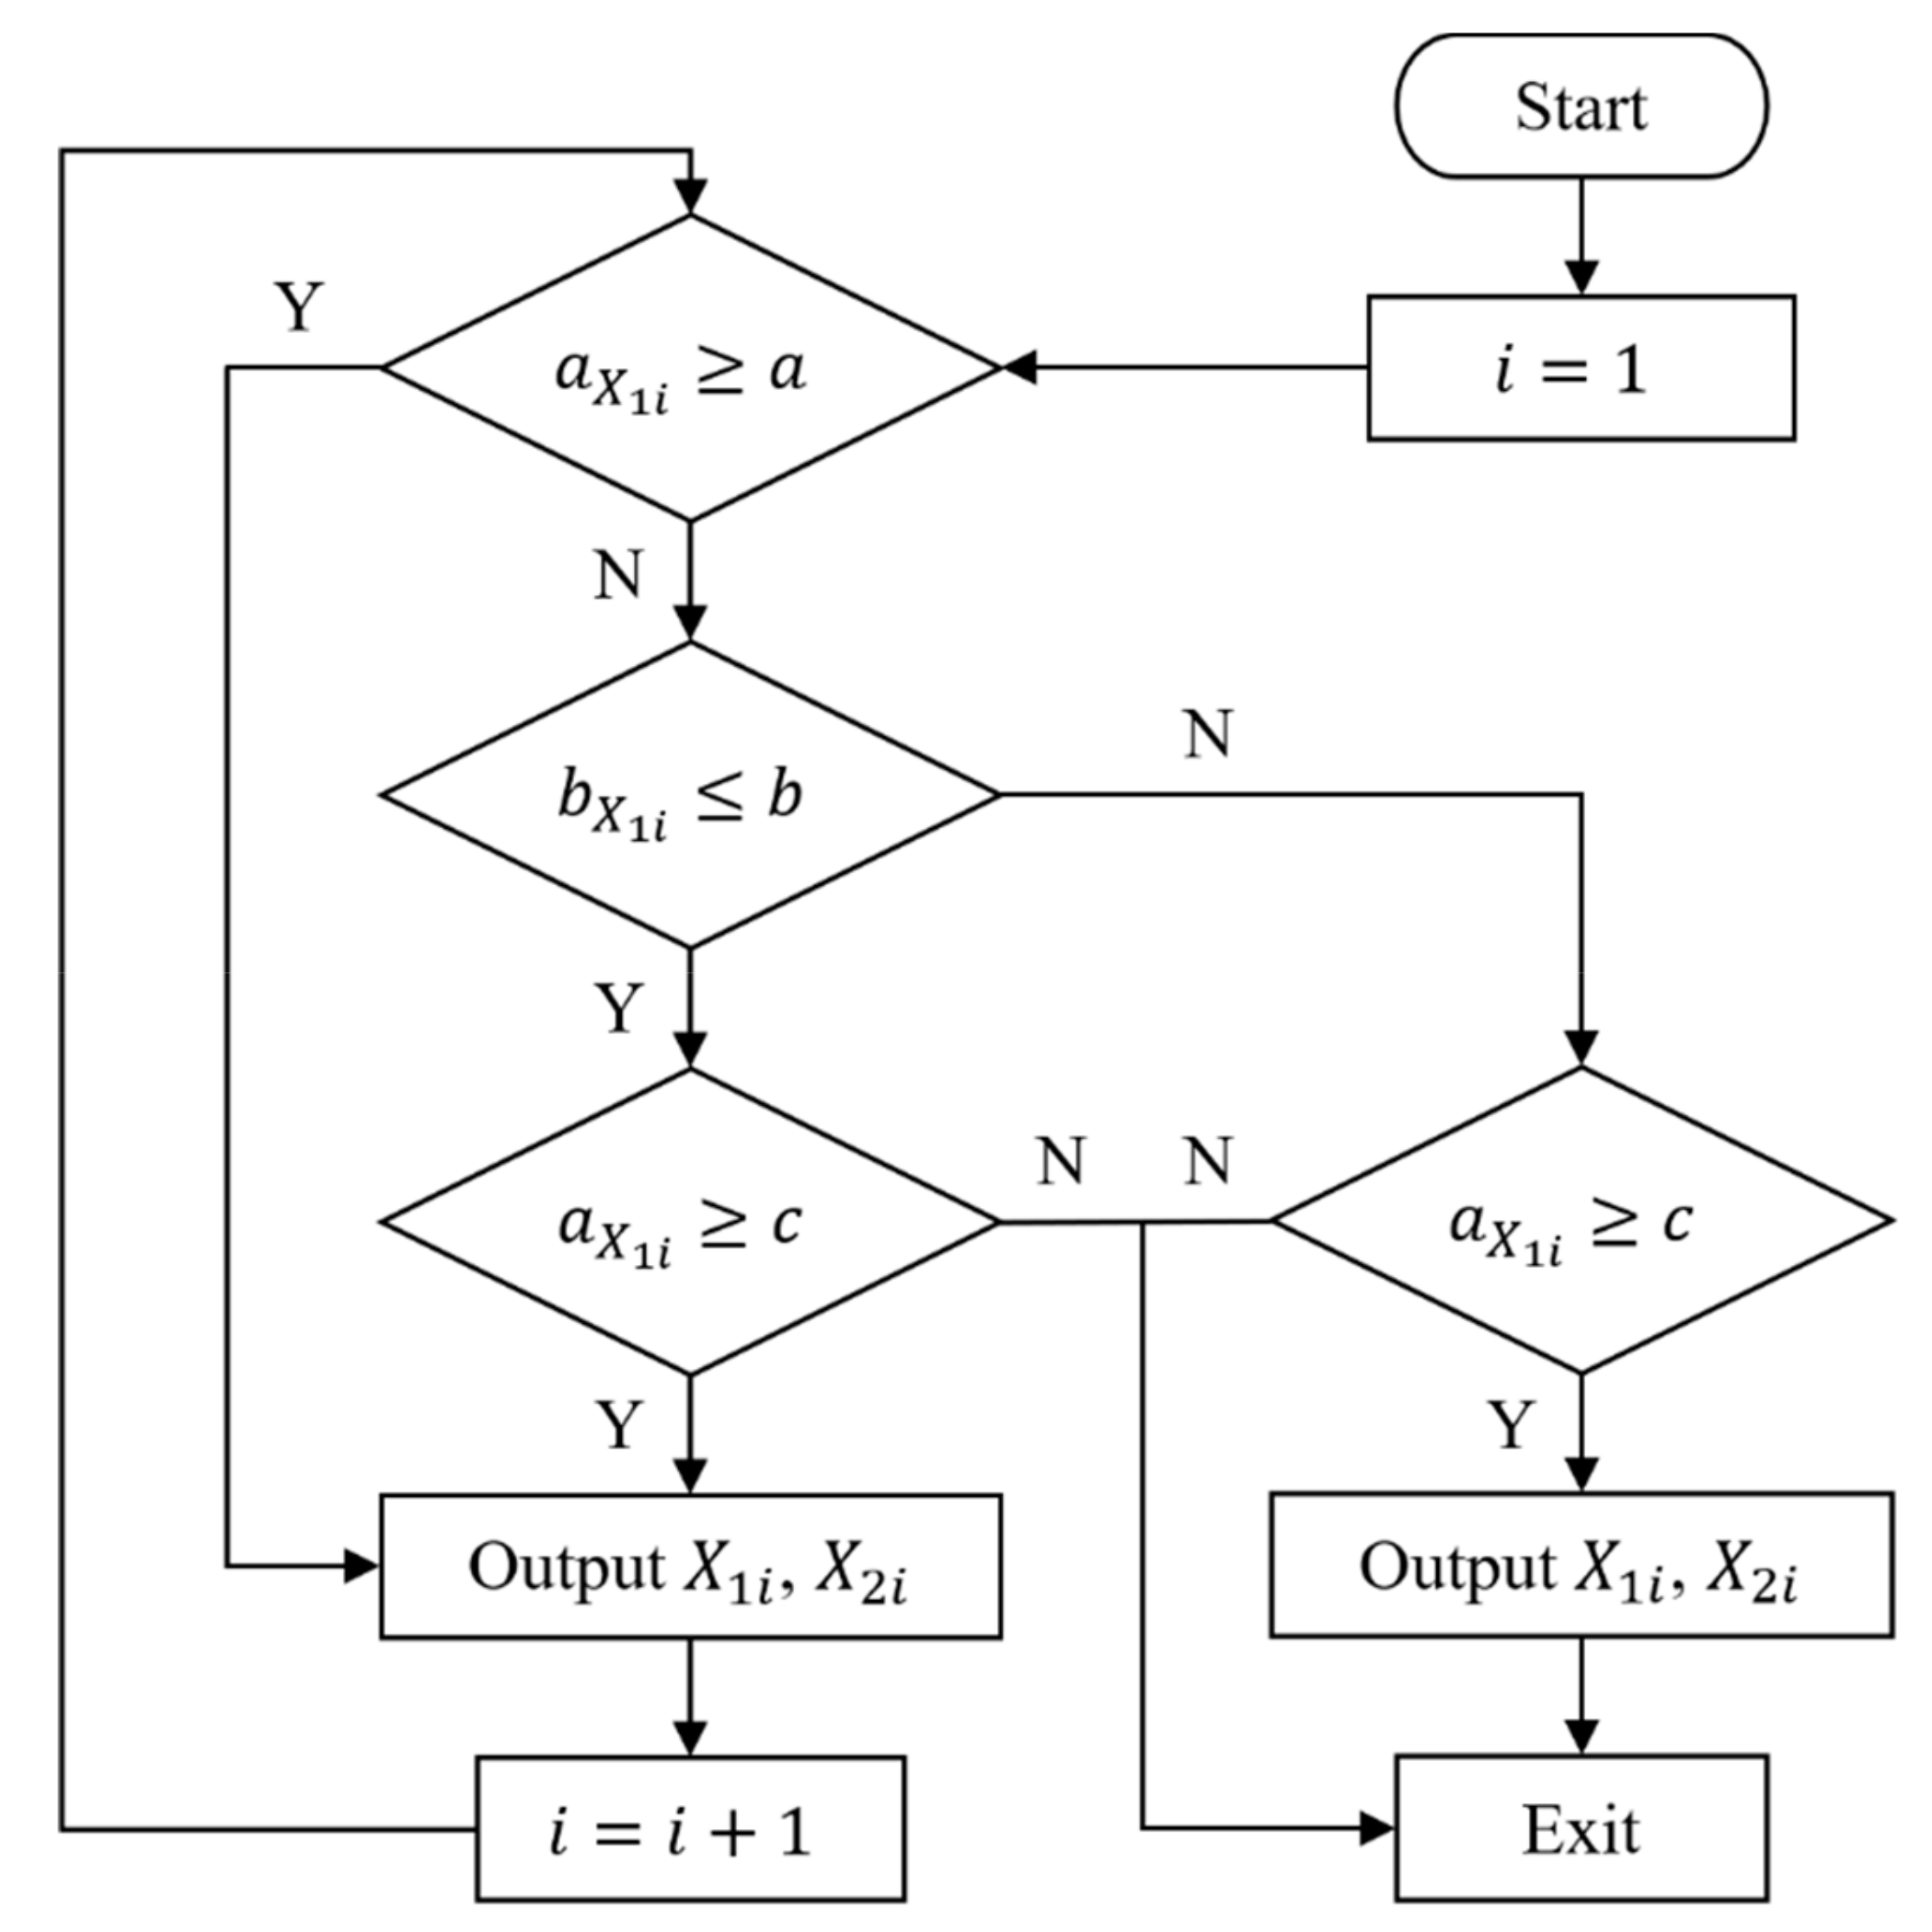
2.2.3. Determination of Decision Points
- (1)
- Priority of high ICDThe path selection of nodes with higher ICD is more complicated, so nodes with higher ICD are given top priority to reserve.
- (2)
- Priority of interfloor connection nodesNodes near elevators or escalators are more important than those on other passageways, because passengers need to decide whether to move between floors. Therefore, interfloor connection nodes are preferred to reserve when merging.
- (3)
- Merger of nodes with spacing shorter than the visual distance of signsAccording to the formula for calculating the visual distance of different character heights under different visual conditions, as shown in Equation (1) [43], nodes of the same type with spacing shorter than the visual distance are merged.where D is the visual distance, h is the character height, A is the absolute vision, and c is the conversion coefficient between characters and visual symbols, c = 3.0735.
2.3. Determination of Information Enhancement Points between Decision Points
2.3.1. Experimental Design
- (1)
- Follow-up surveyTaking two researchers as a group, a follow-up survey of pathfinding is conducted. One records the time when the passenger passes each marker point, and the other records the key behavior of the passenger in the pathfinding process. For each experimental scenario, a round-trip follow-up survey is conducted. After completing a one-way follow-up survey, the researcher waits in the place and selects the appropriate passenger to return from the original path for the next survey.
- (2)
- Passenger attribute recordBased on observation and inquiry, the researcher records the passengers’ gender, estimated age, baggage quantity, and destination.
- (3)
- Passenger pathfinding surveyThe passenger’s familiarity with the experimental scenario and whether the guidance sign was viewed during the pathfinding process are obtained by filling out the questionnaire.
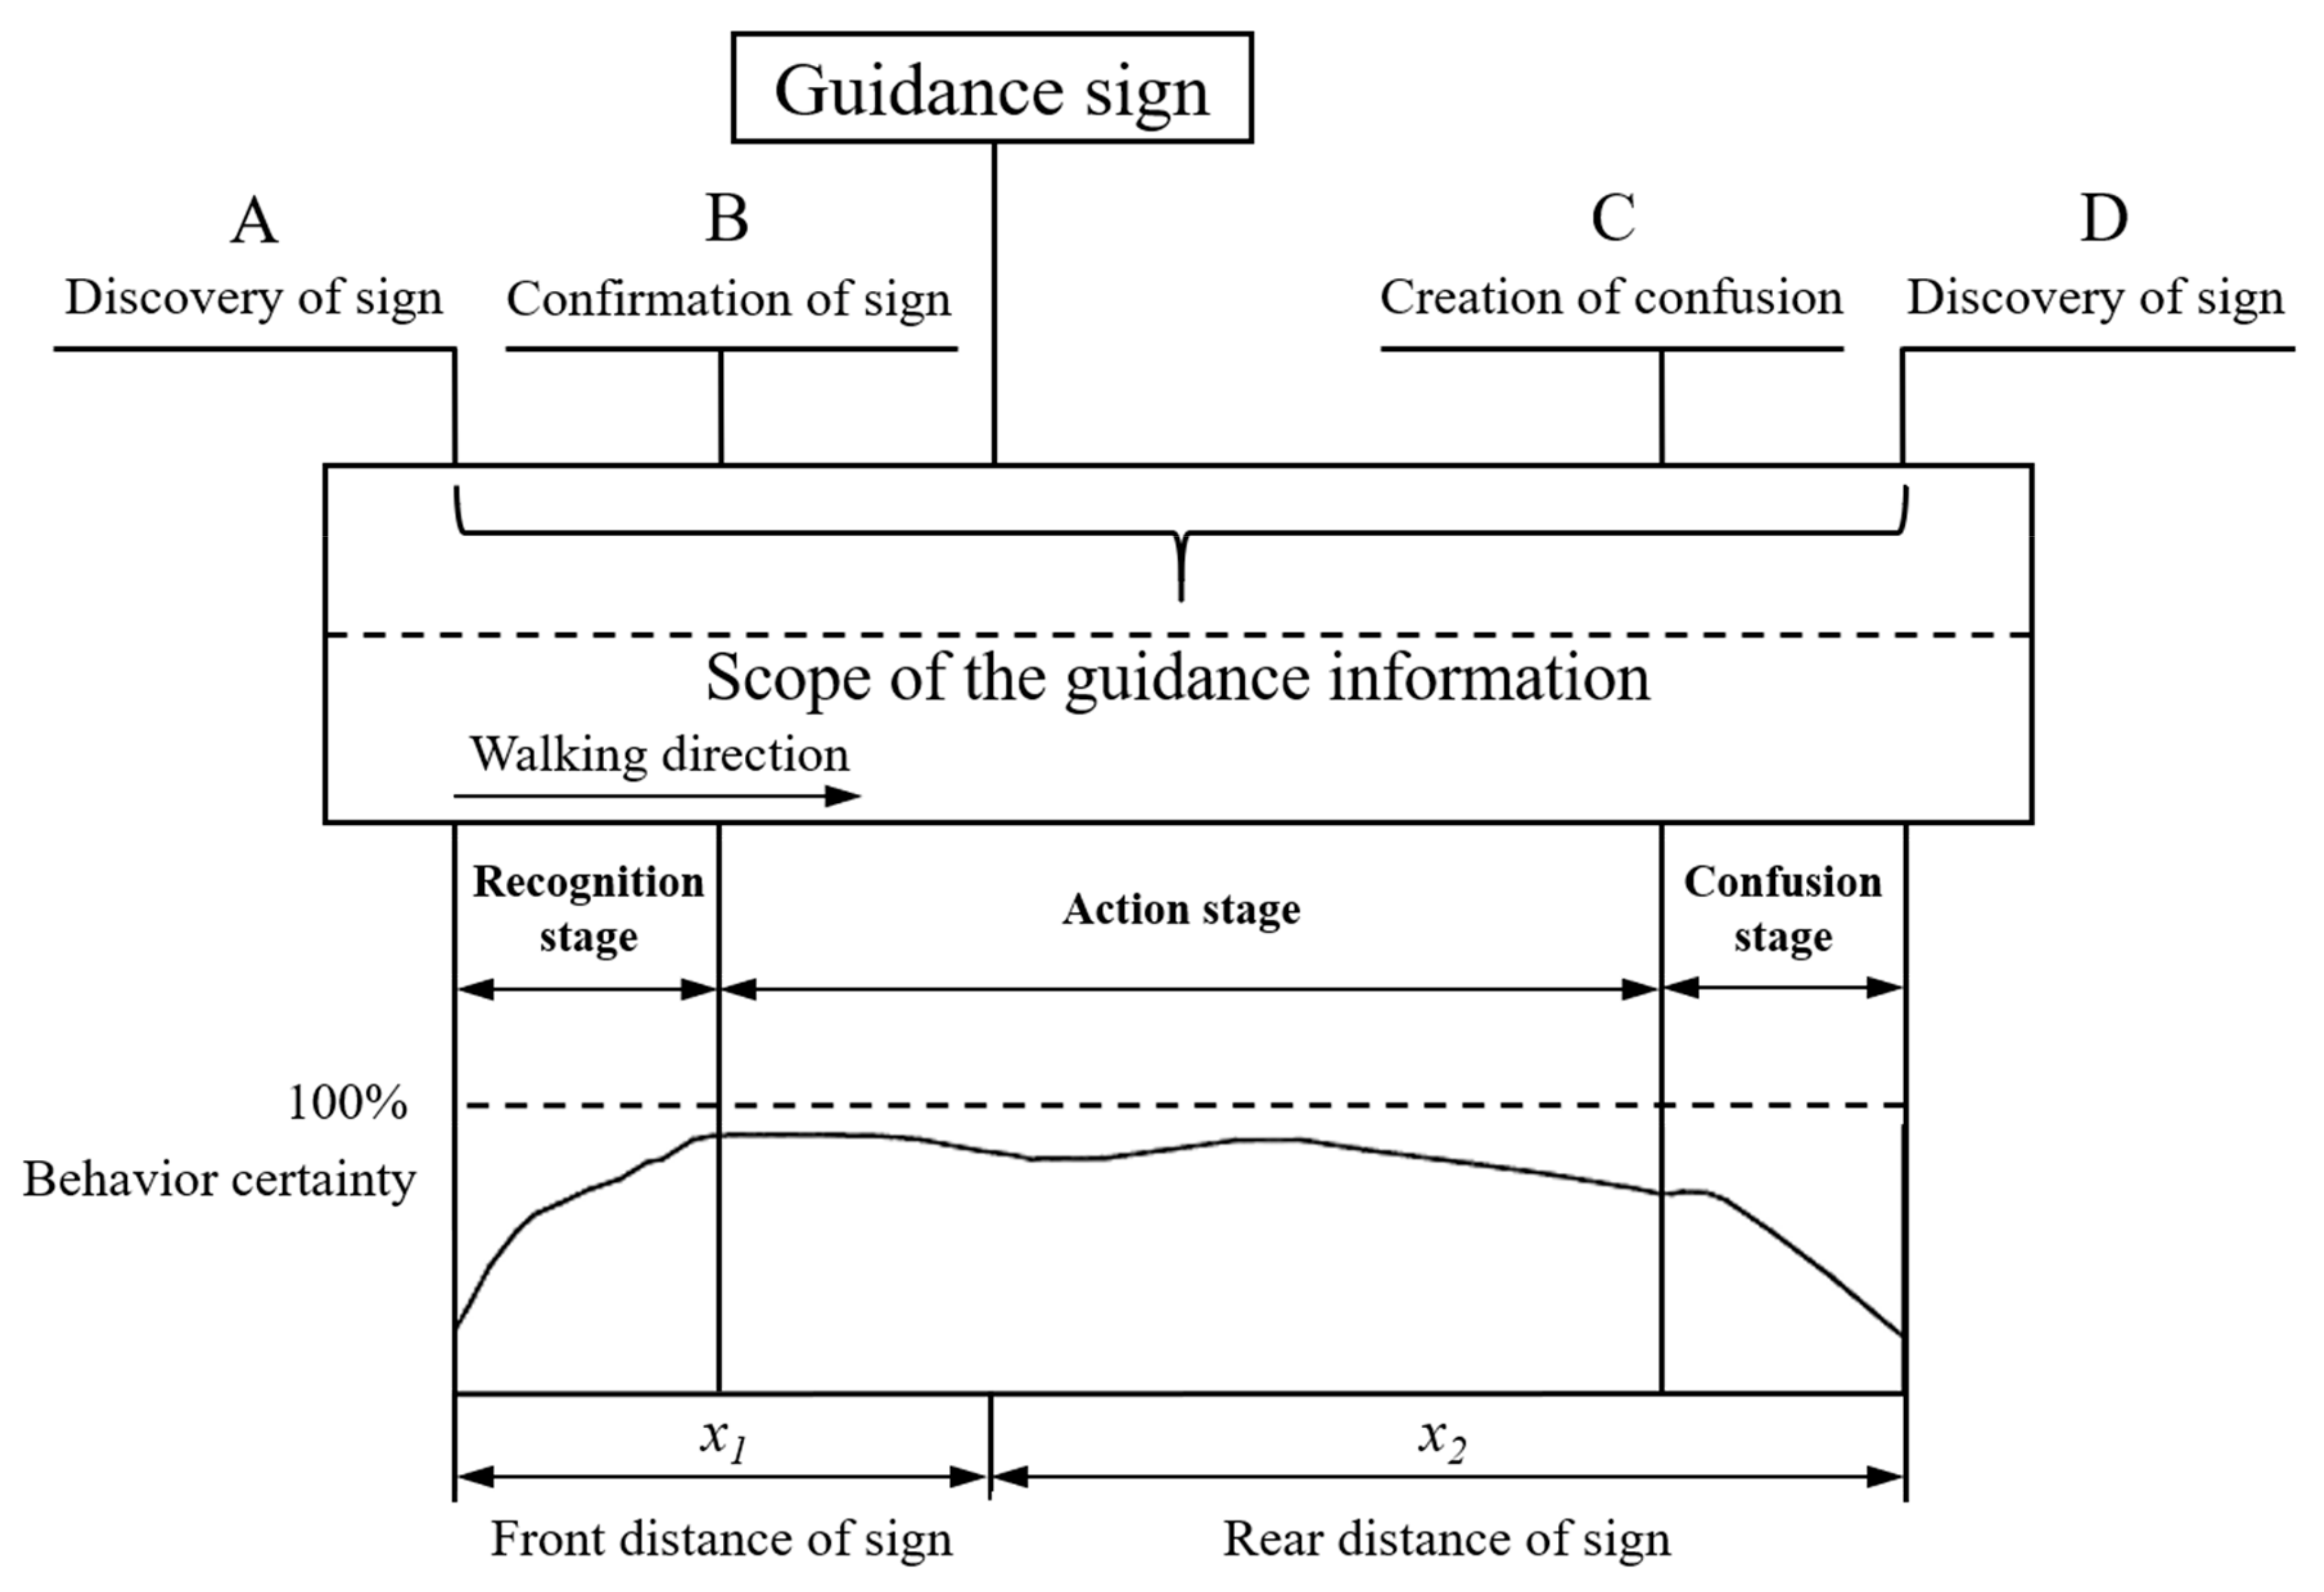
2.3.2. Analysis of Passenger Information Behavior
- (1)
- Recognition stageA passenger can clearly see the content of the sign, identify the information, and understand the displayed information.
- (2)
- Action stageAfter understanding the content of the displayed information, the passenger determines the direction of travel and begins to walk until the current path becomes uncertain.
- (3)
- Confusion stageIn the confusion stage, the passenger is slightly to completely uncertain about the current path. The confusion ends when the passenger discovers the next sign or asking point.
- (i)
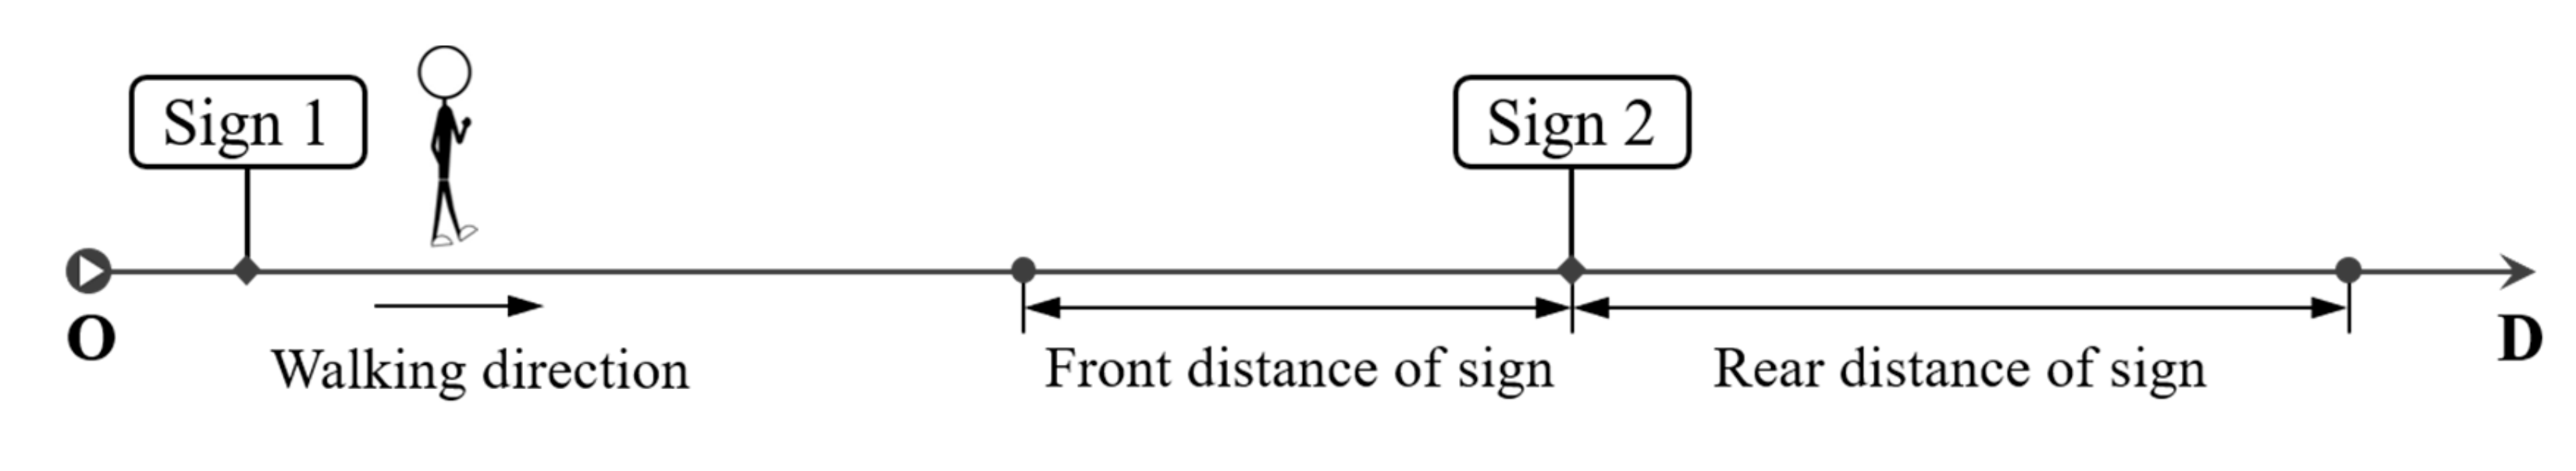
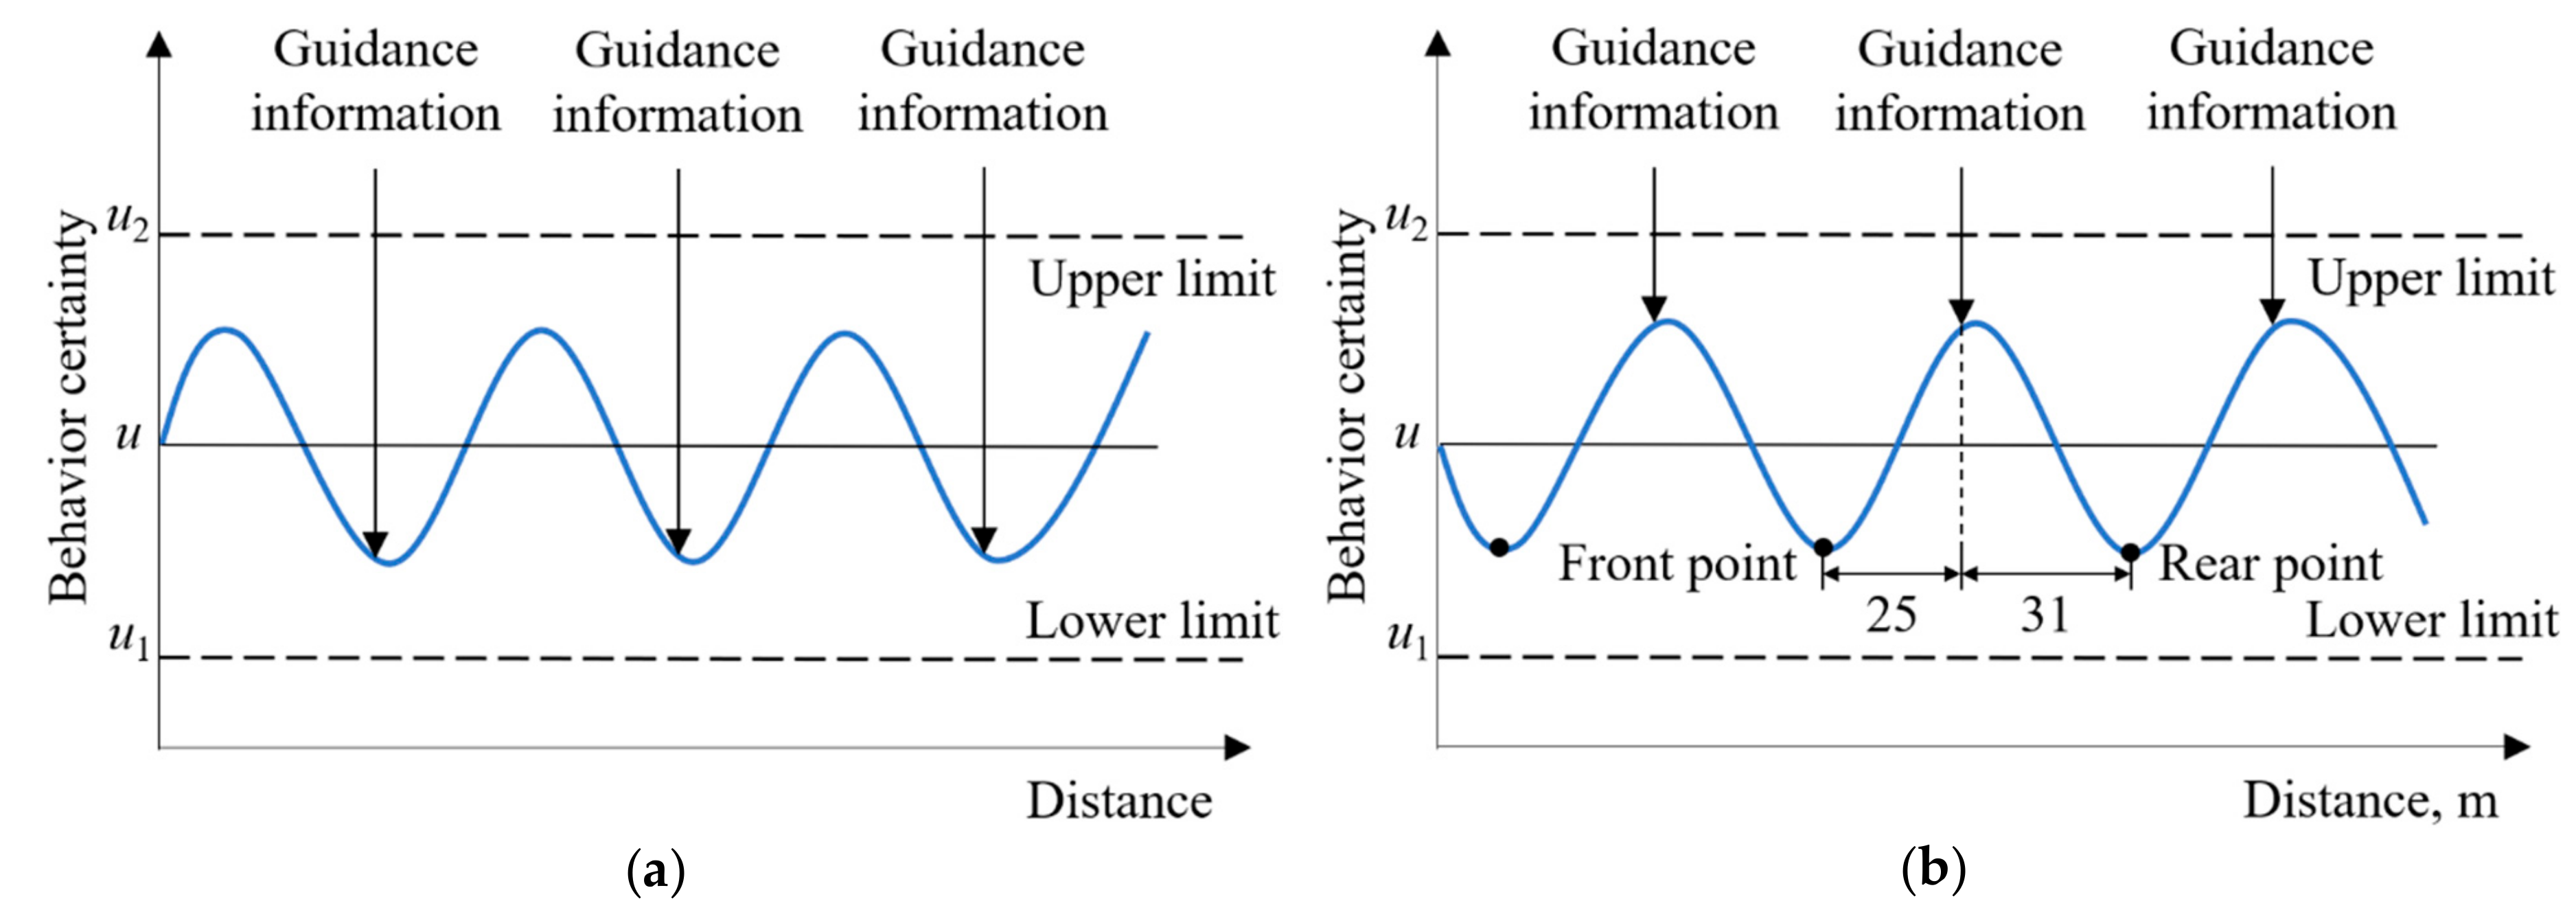
- Front distance of signPassengers move in continuous space and time, and the cognitive discontinuity makes them hesitate or suspend, which further leads to the generation of information demand. Also, passengers will be psychologically certain when they can clearly see what is on the guidance sign ahead. Therefore, the visual distance to recognize the sign is defined as the front distance of the sign.
- (ii)
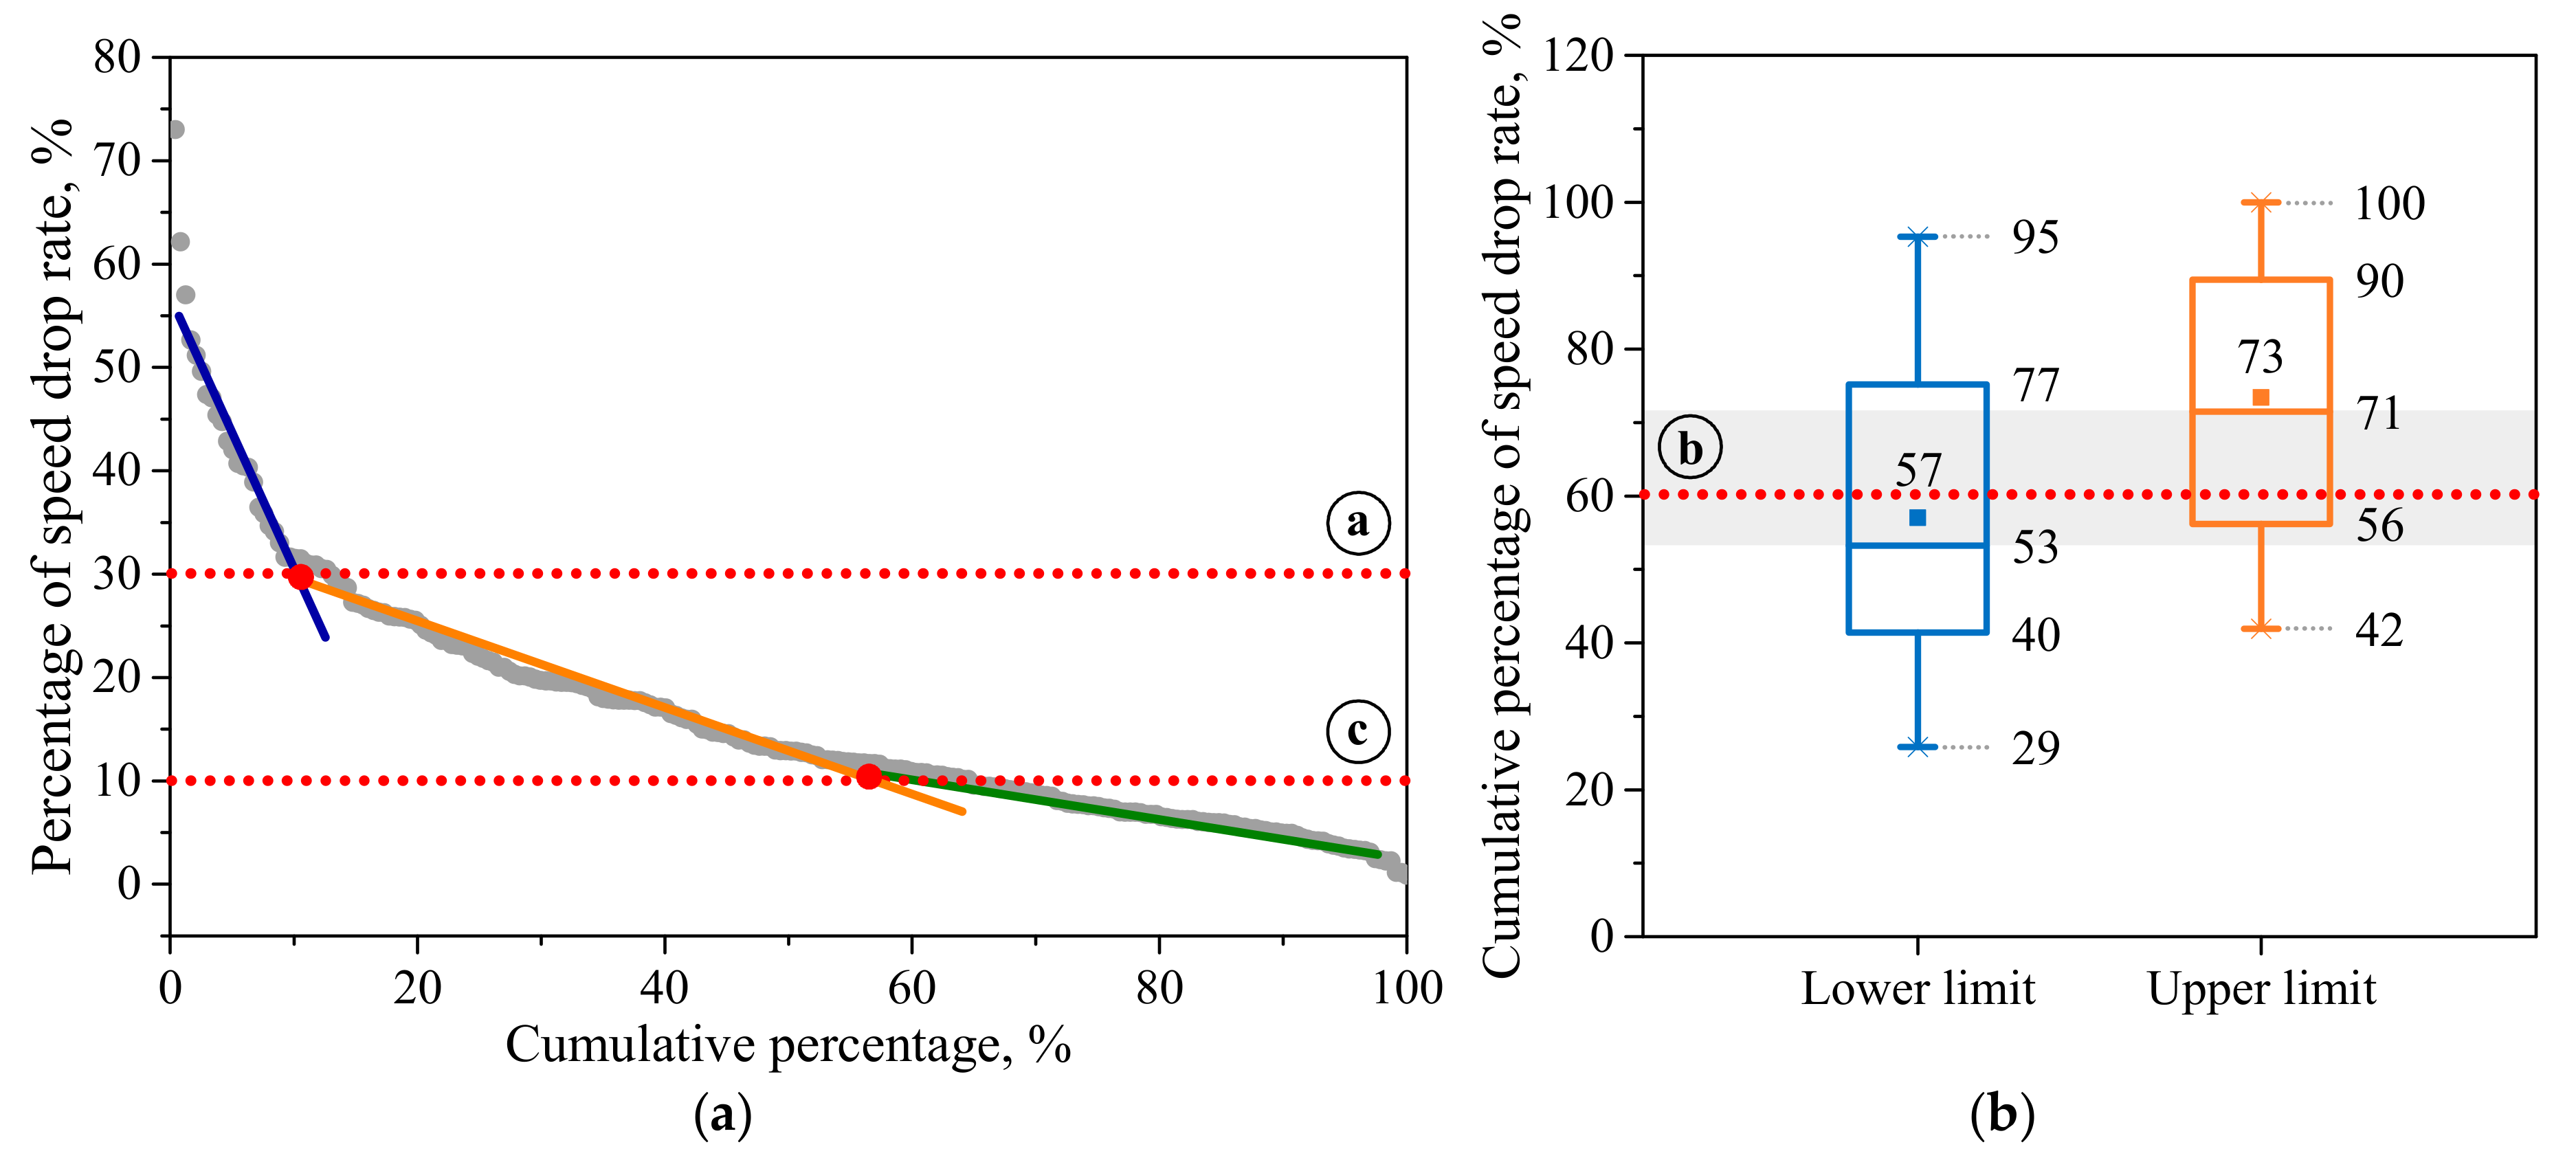
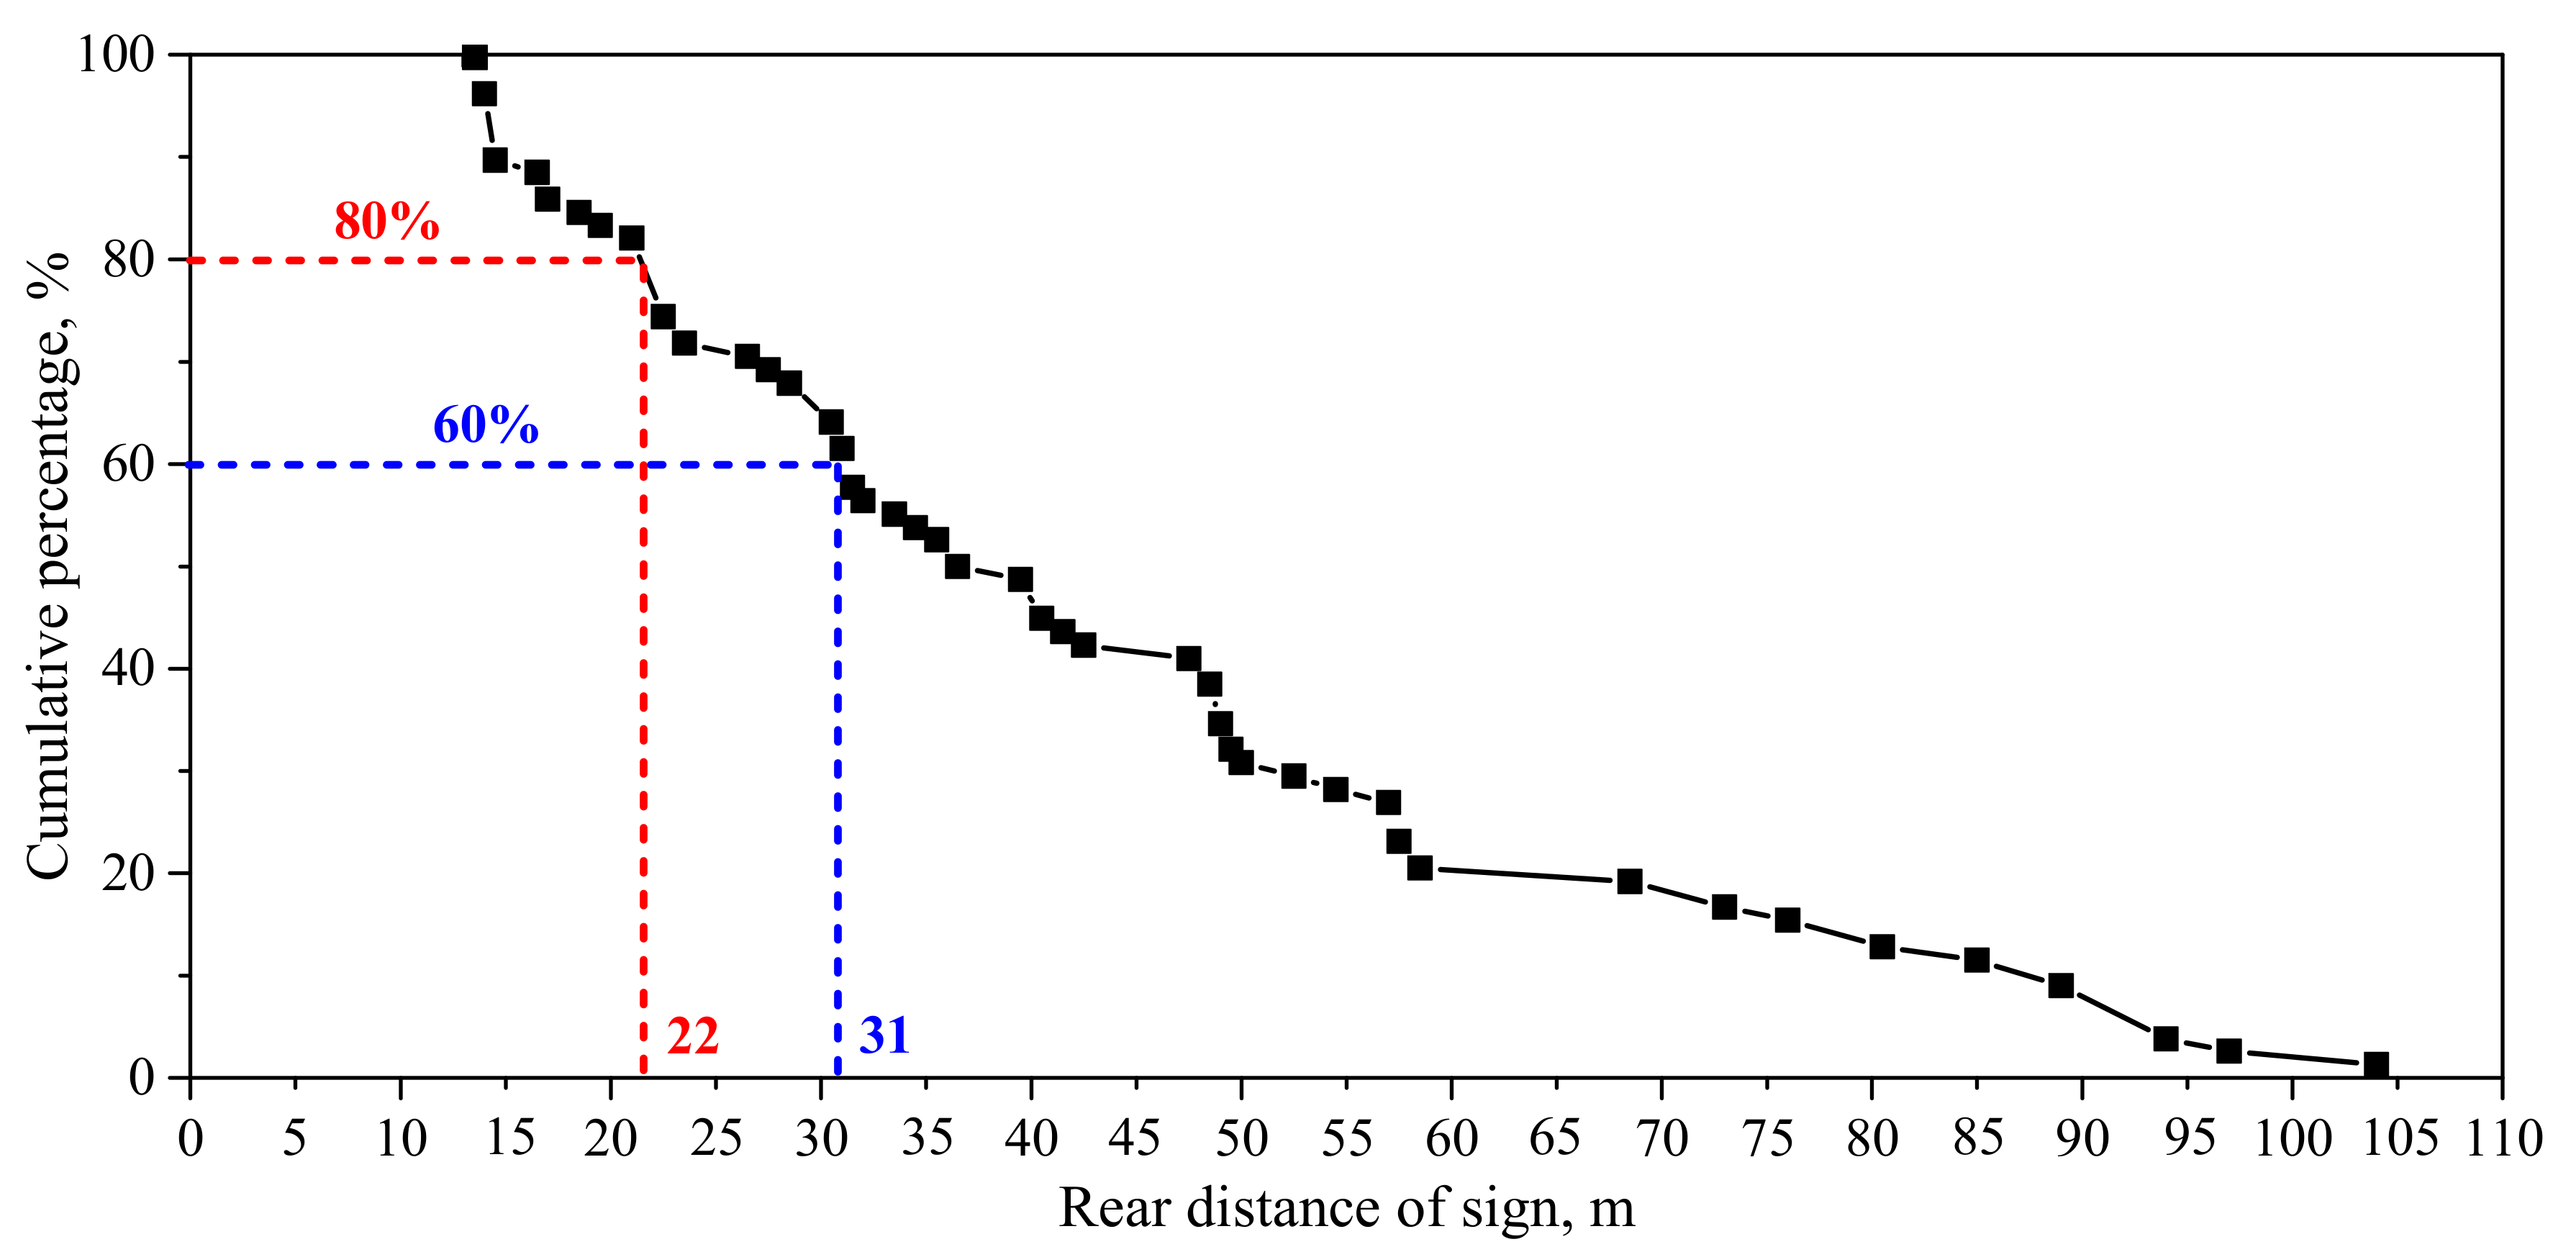
- Rear distance of signPassengers move on after they arrive from the previous sign and memorize its contents, and will experience a process of ambiguity or decline in psychological certainty before the next sign arrives. Therefore, the rear distance of the sign is the range from the previous sign to the point where certainty is lower than the threshold. A detailed explanation of the rear distance of the sign is determined by calculating the distance between the rear point of the speed drop section and the previous sign. The steps to determine the speed drop section are as follows:
3. Case Study
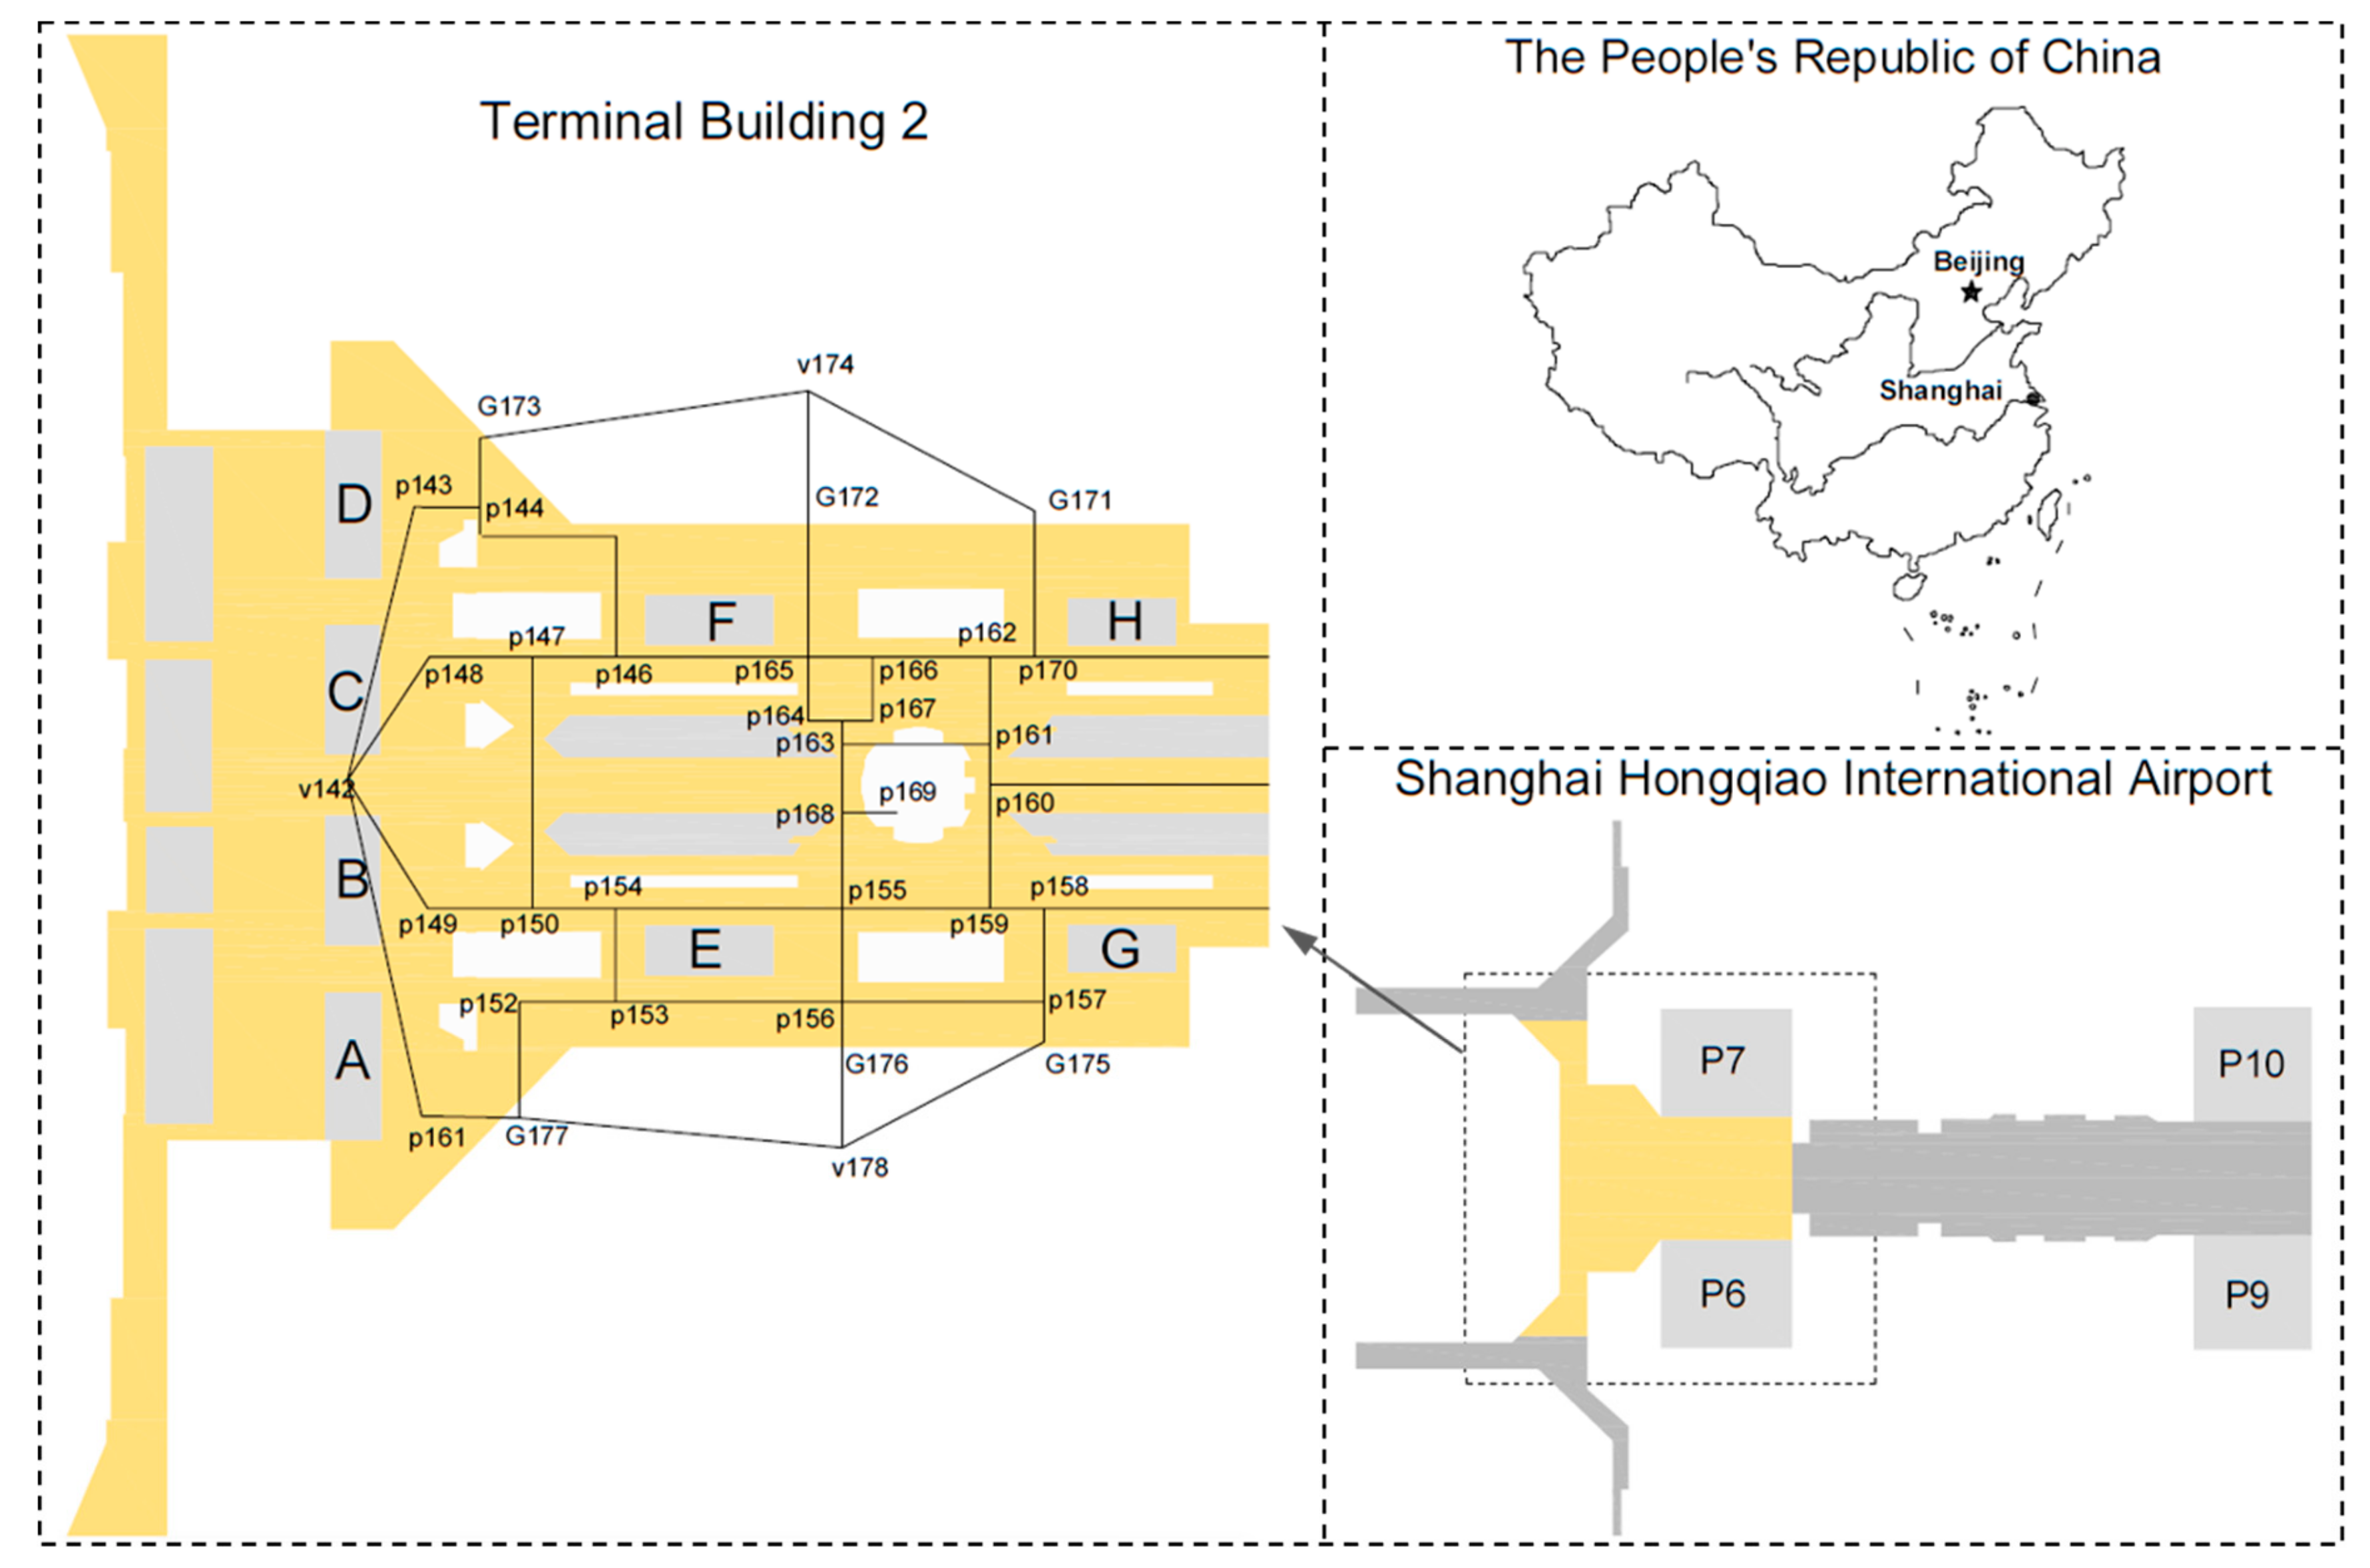
3.1. Study Objective
3.2. Data Preparation
- (1)
- From the subway station (Hongqiao railway station) to the high-speed rail departure floorThe passing nodes are in turn: V76-G74-P71-P44-P43-P42-P41-P40-P39-P202-P38-P37-P36-P35-P34-P203-P33-P32-P29-E30-E198.
- (2)
- From the bus station (1st floor of the East transportation center) to the high-speed rail departure floorThe passing nodes are in turn: V126-G124-P117-E116-E130-E167-P166-P162-P170-E198.
- (3)
- From the subway station (Terminal 2) to the airport departure floorThe passing nodes are in turn: G10-P5-P6-P16-L180-L181-L169-P168-P155-P154-P150-P149-V142.
- (4)
- From the high-speed rail arrival floor (B1) to the airport departure floorThe passing nodes are in turn: G111-P48-P47-P46-P45-P44-P43-P42-P41-P40-P39-P202-P38-P37-P36-P35-P34-P203-P33-P32-P29-P30-E198-P170-P162-P166-P165-P146-P147-P148-V142.
- (5)
- From the P7 parking garage to the airport departure floorThe passing nodes are in turn: V20-P12-P4-P7-P17-L180-L181-L169-P168-P155-P154-P150-P149-V142.
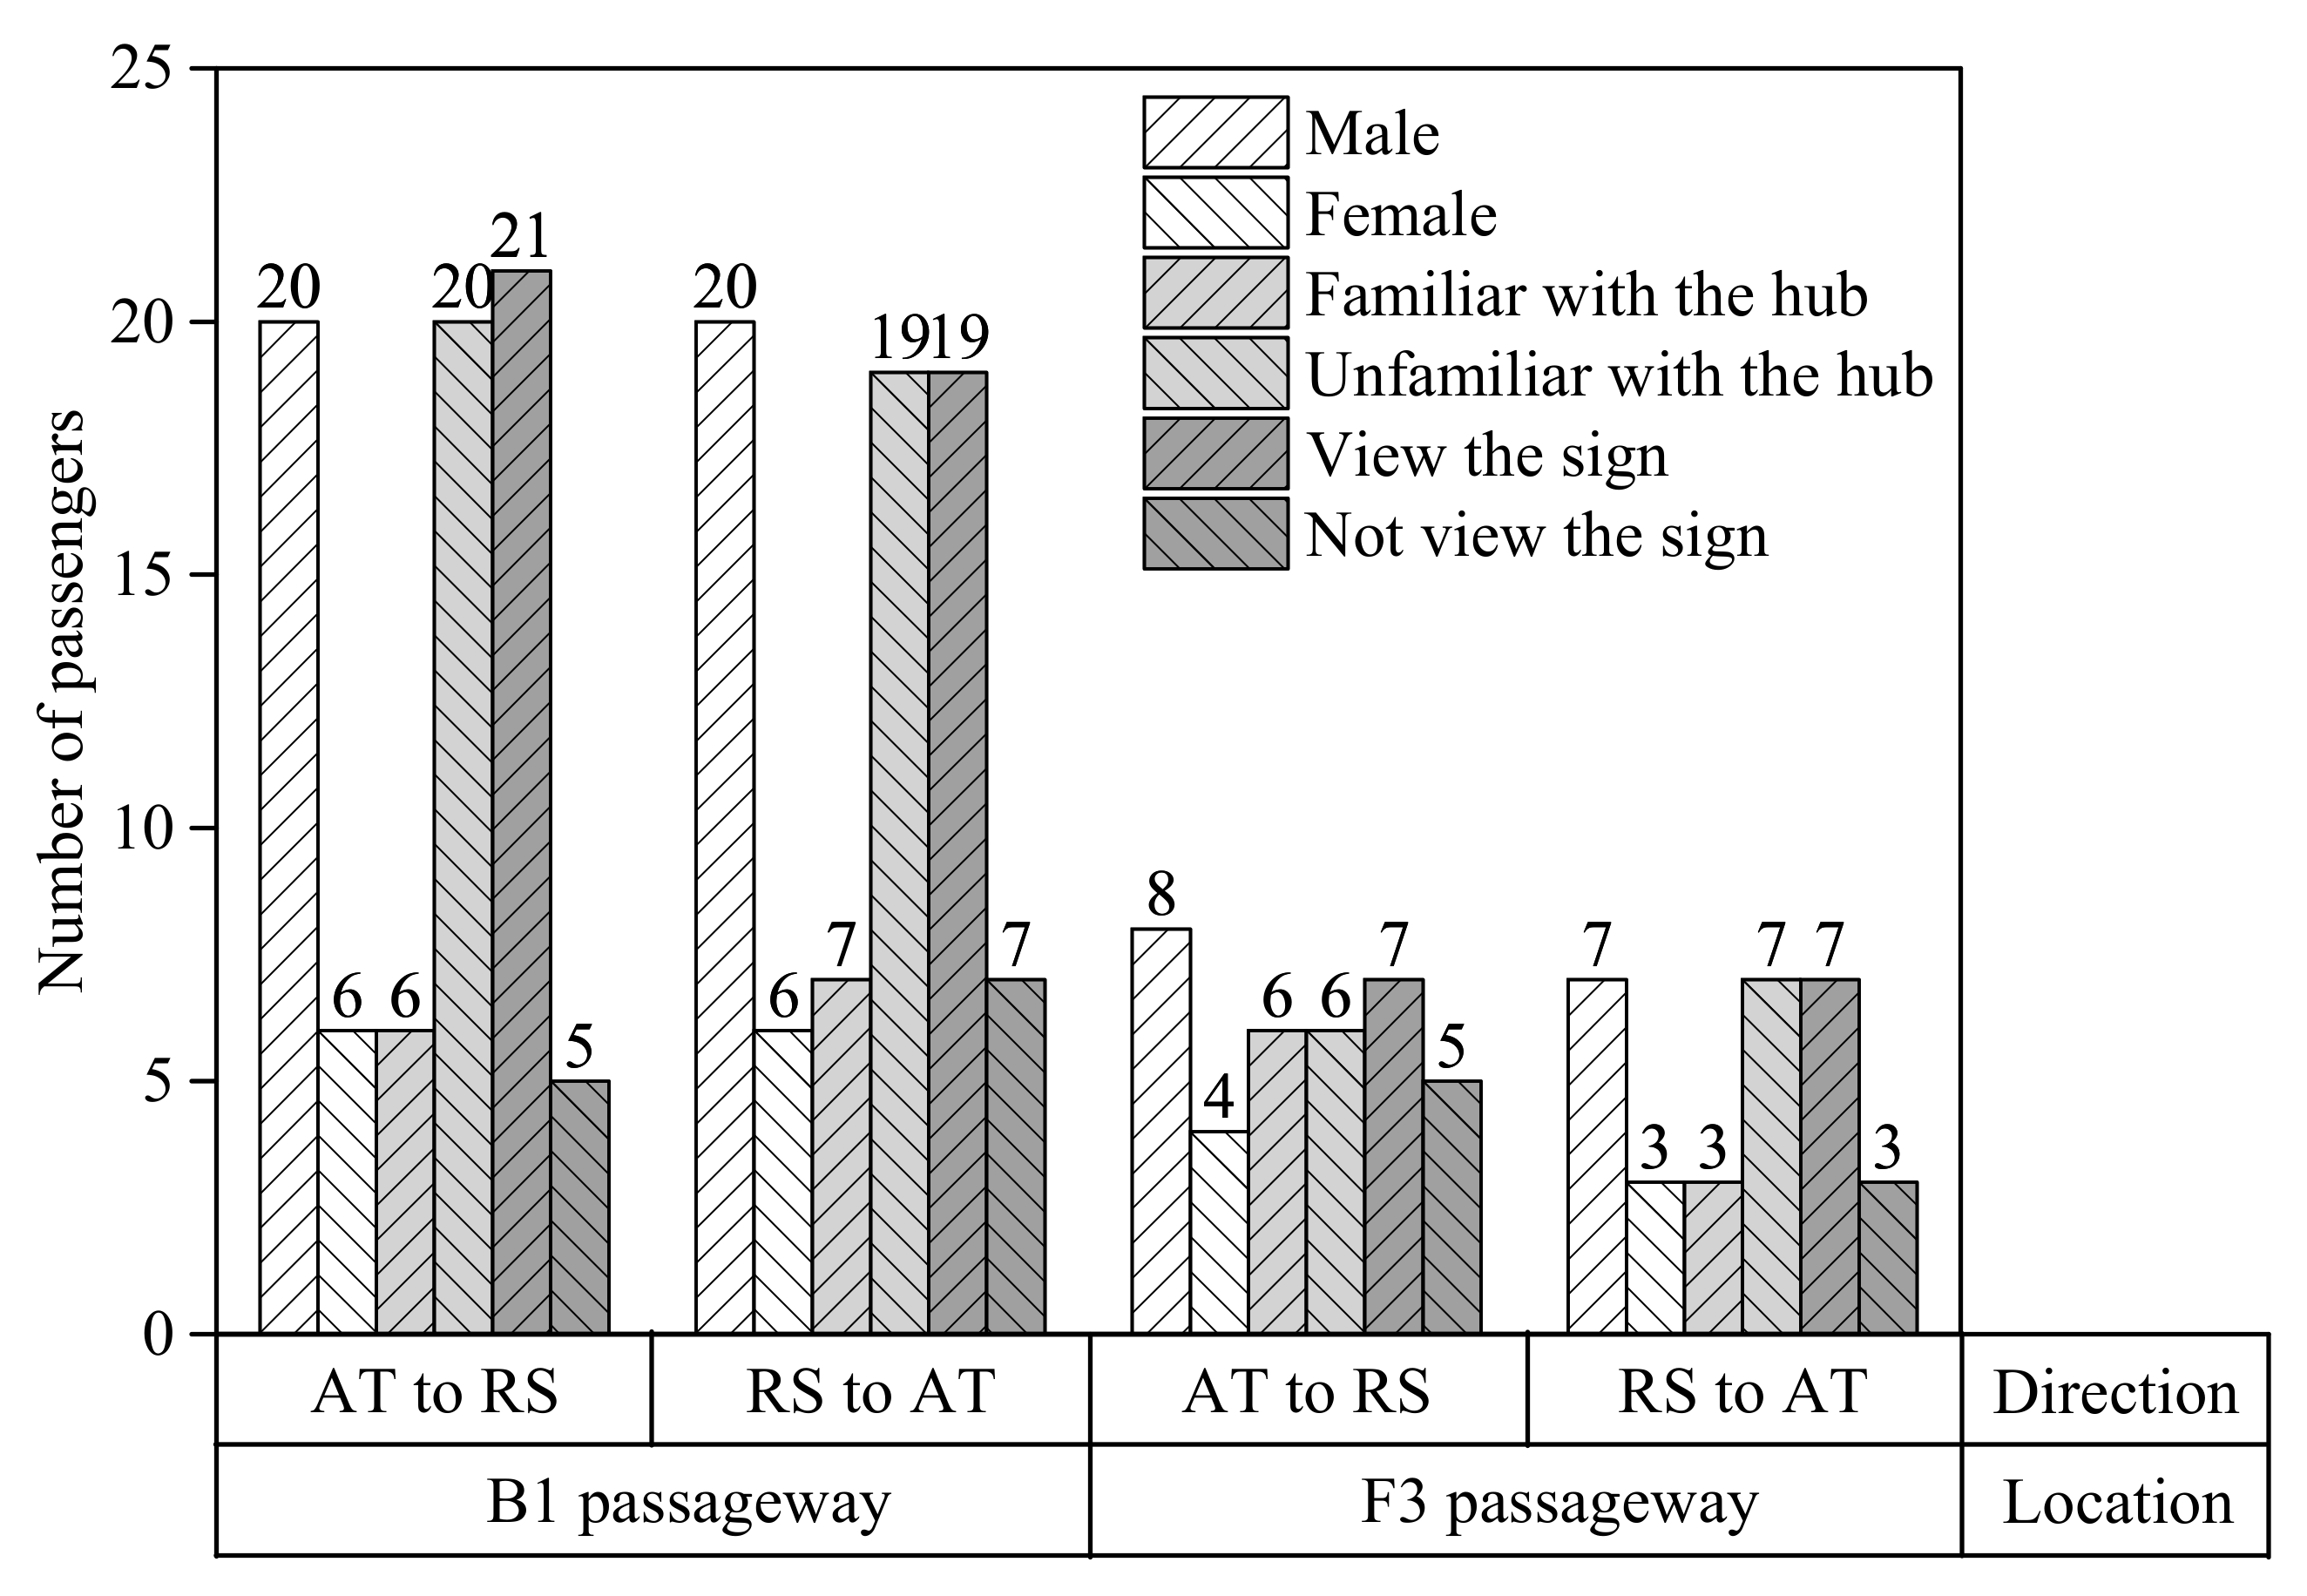
3.3. Field Experiment
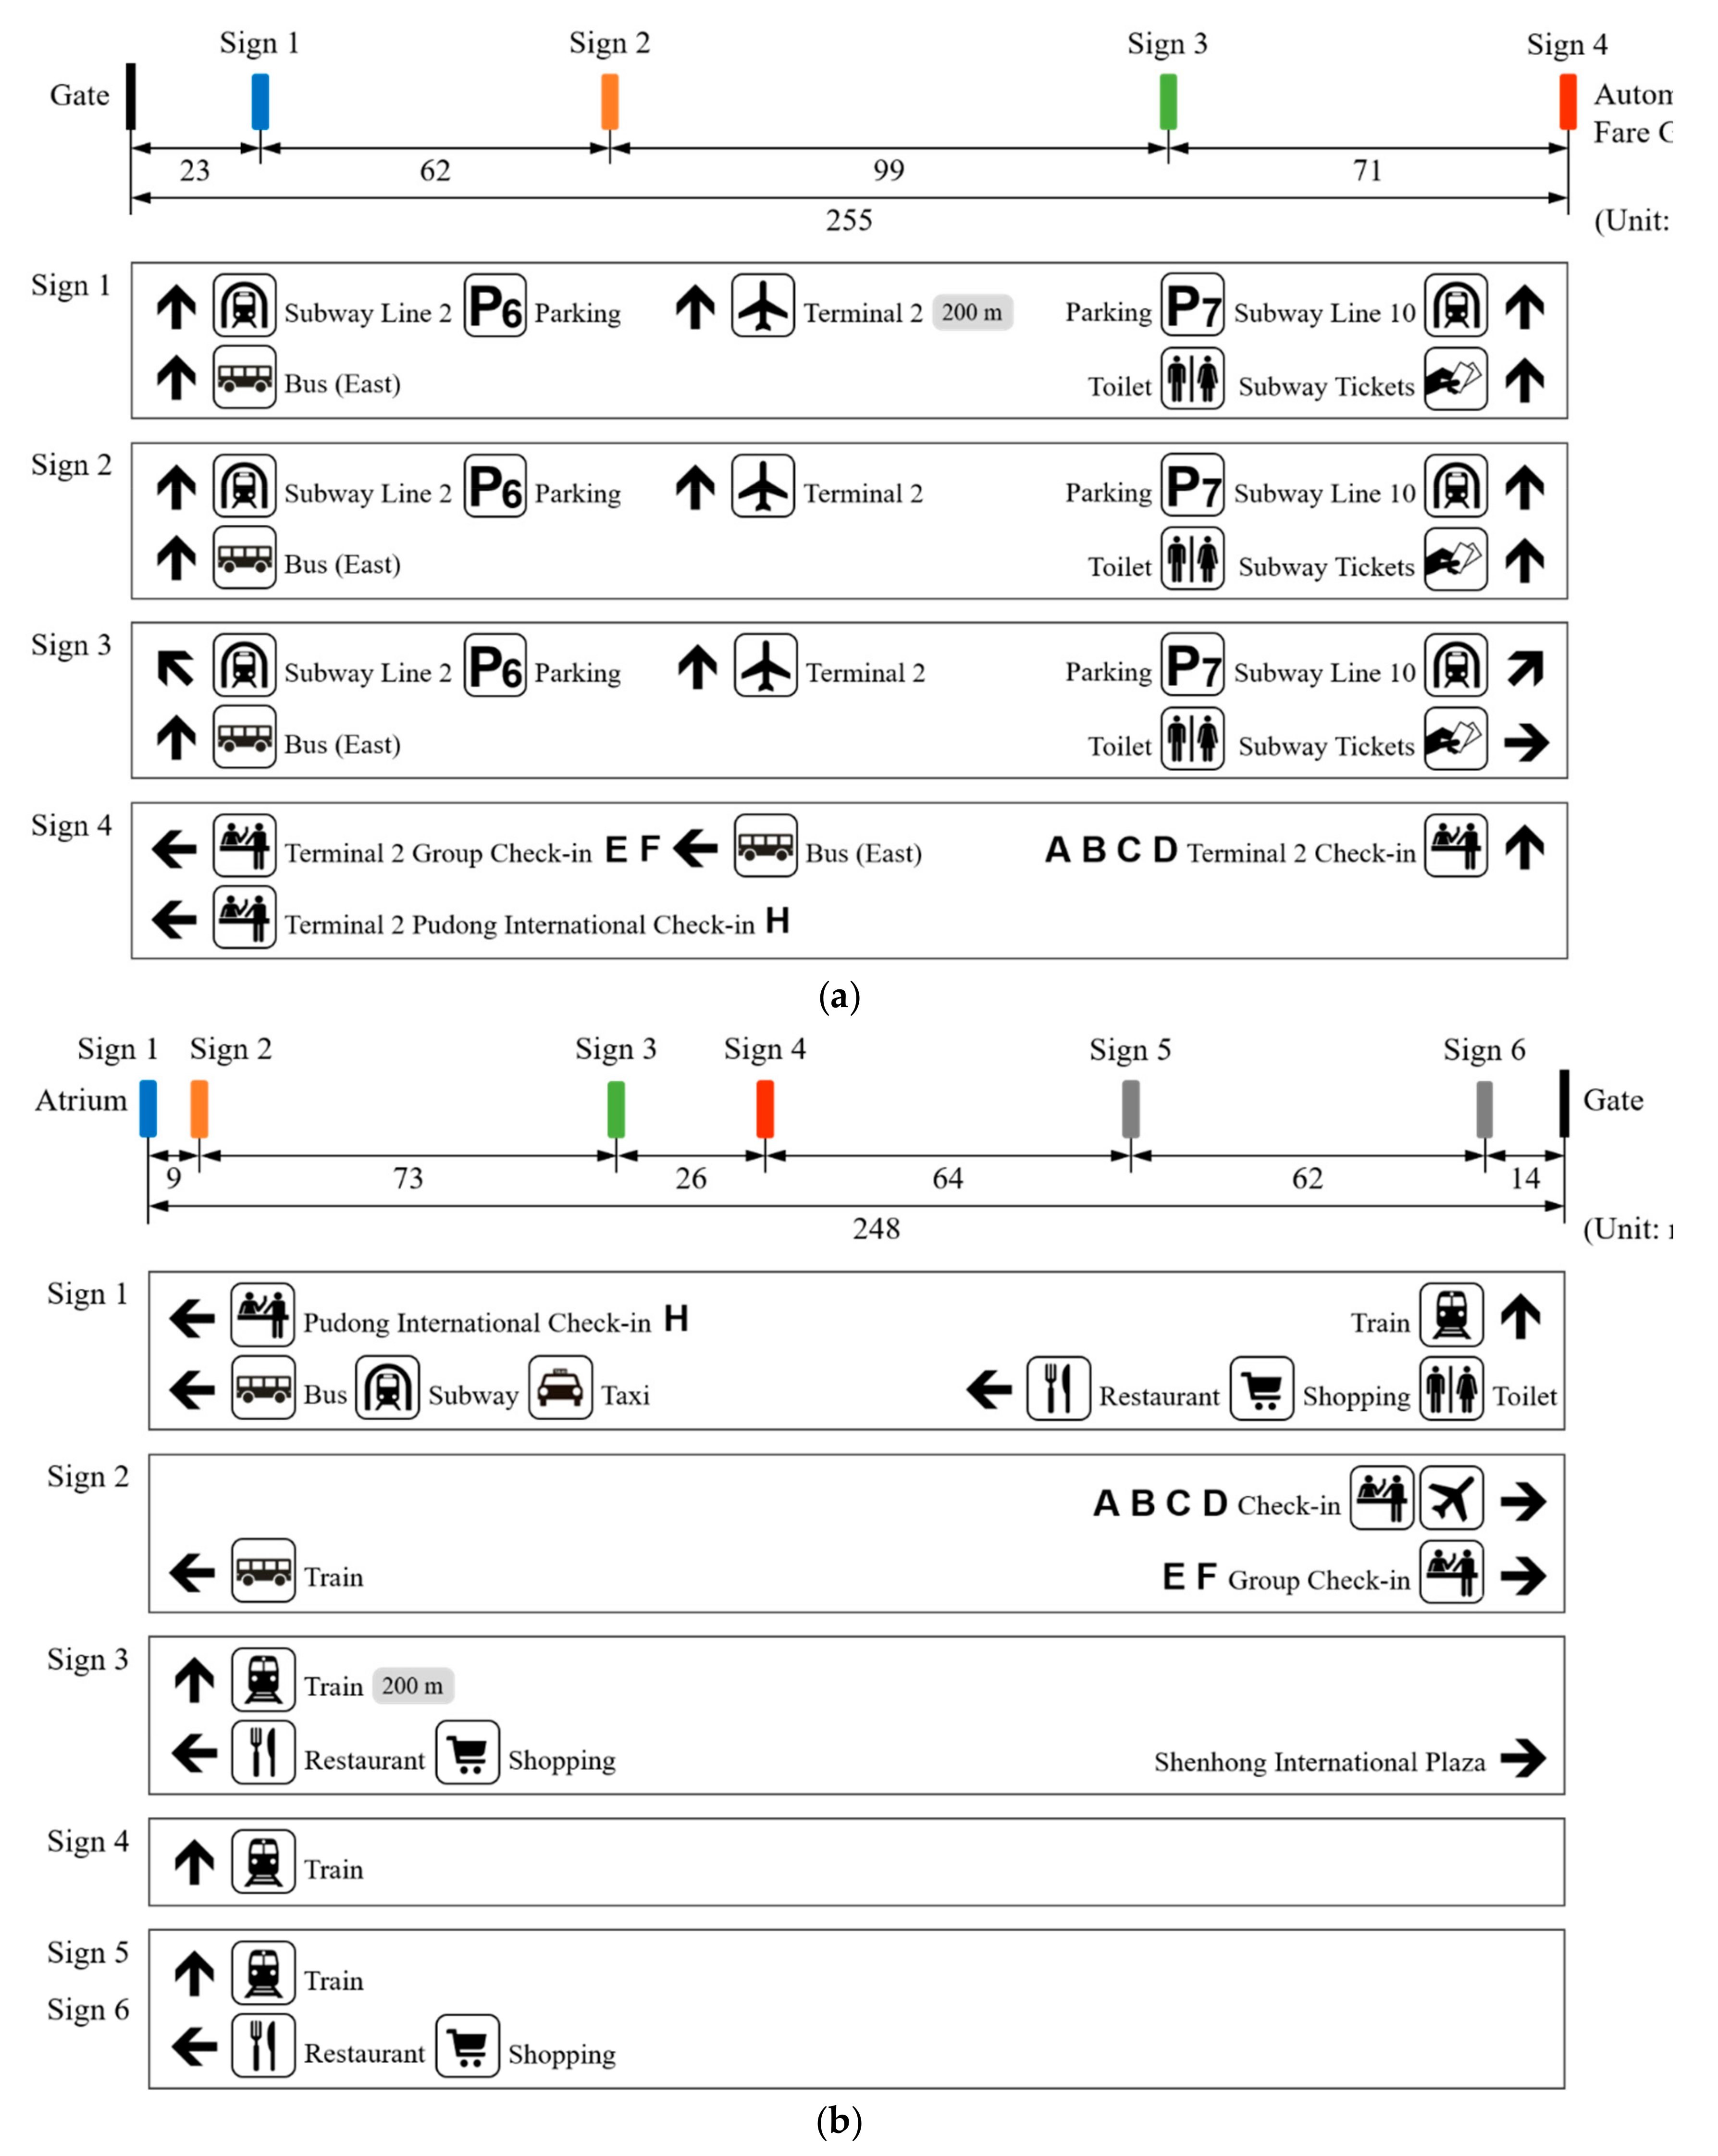
- (1)
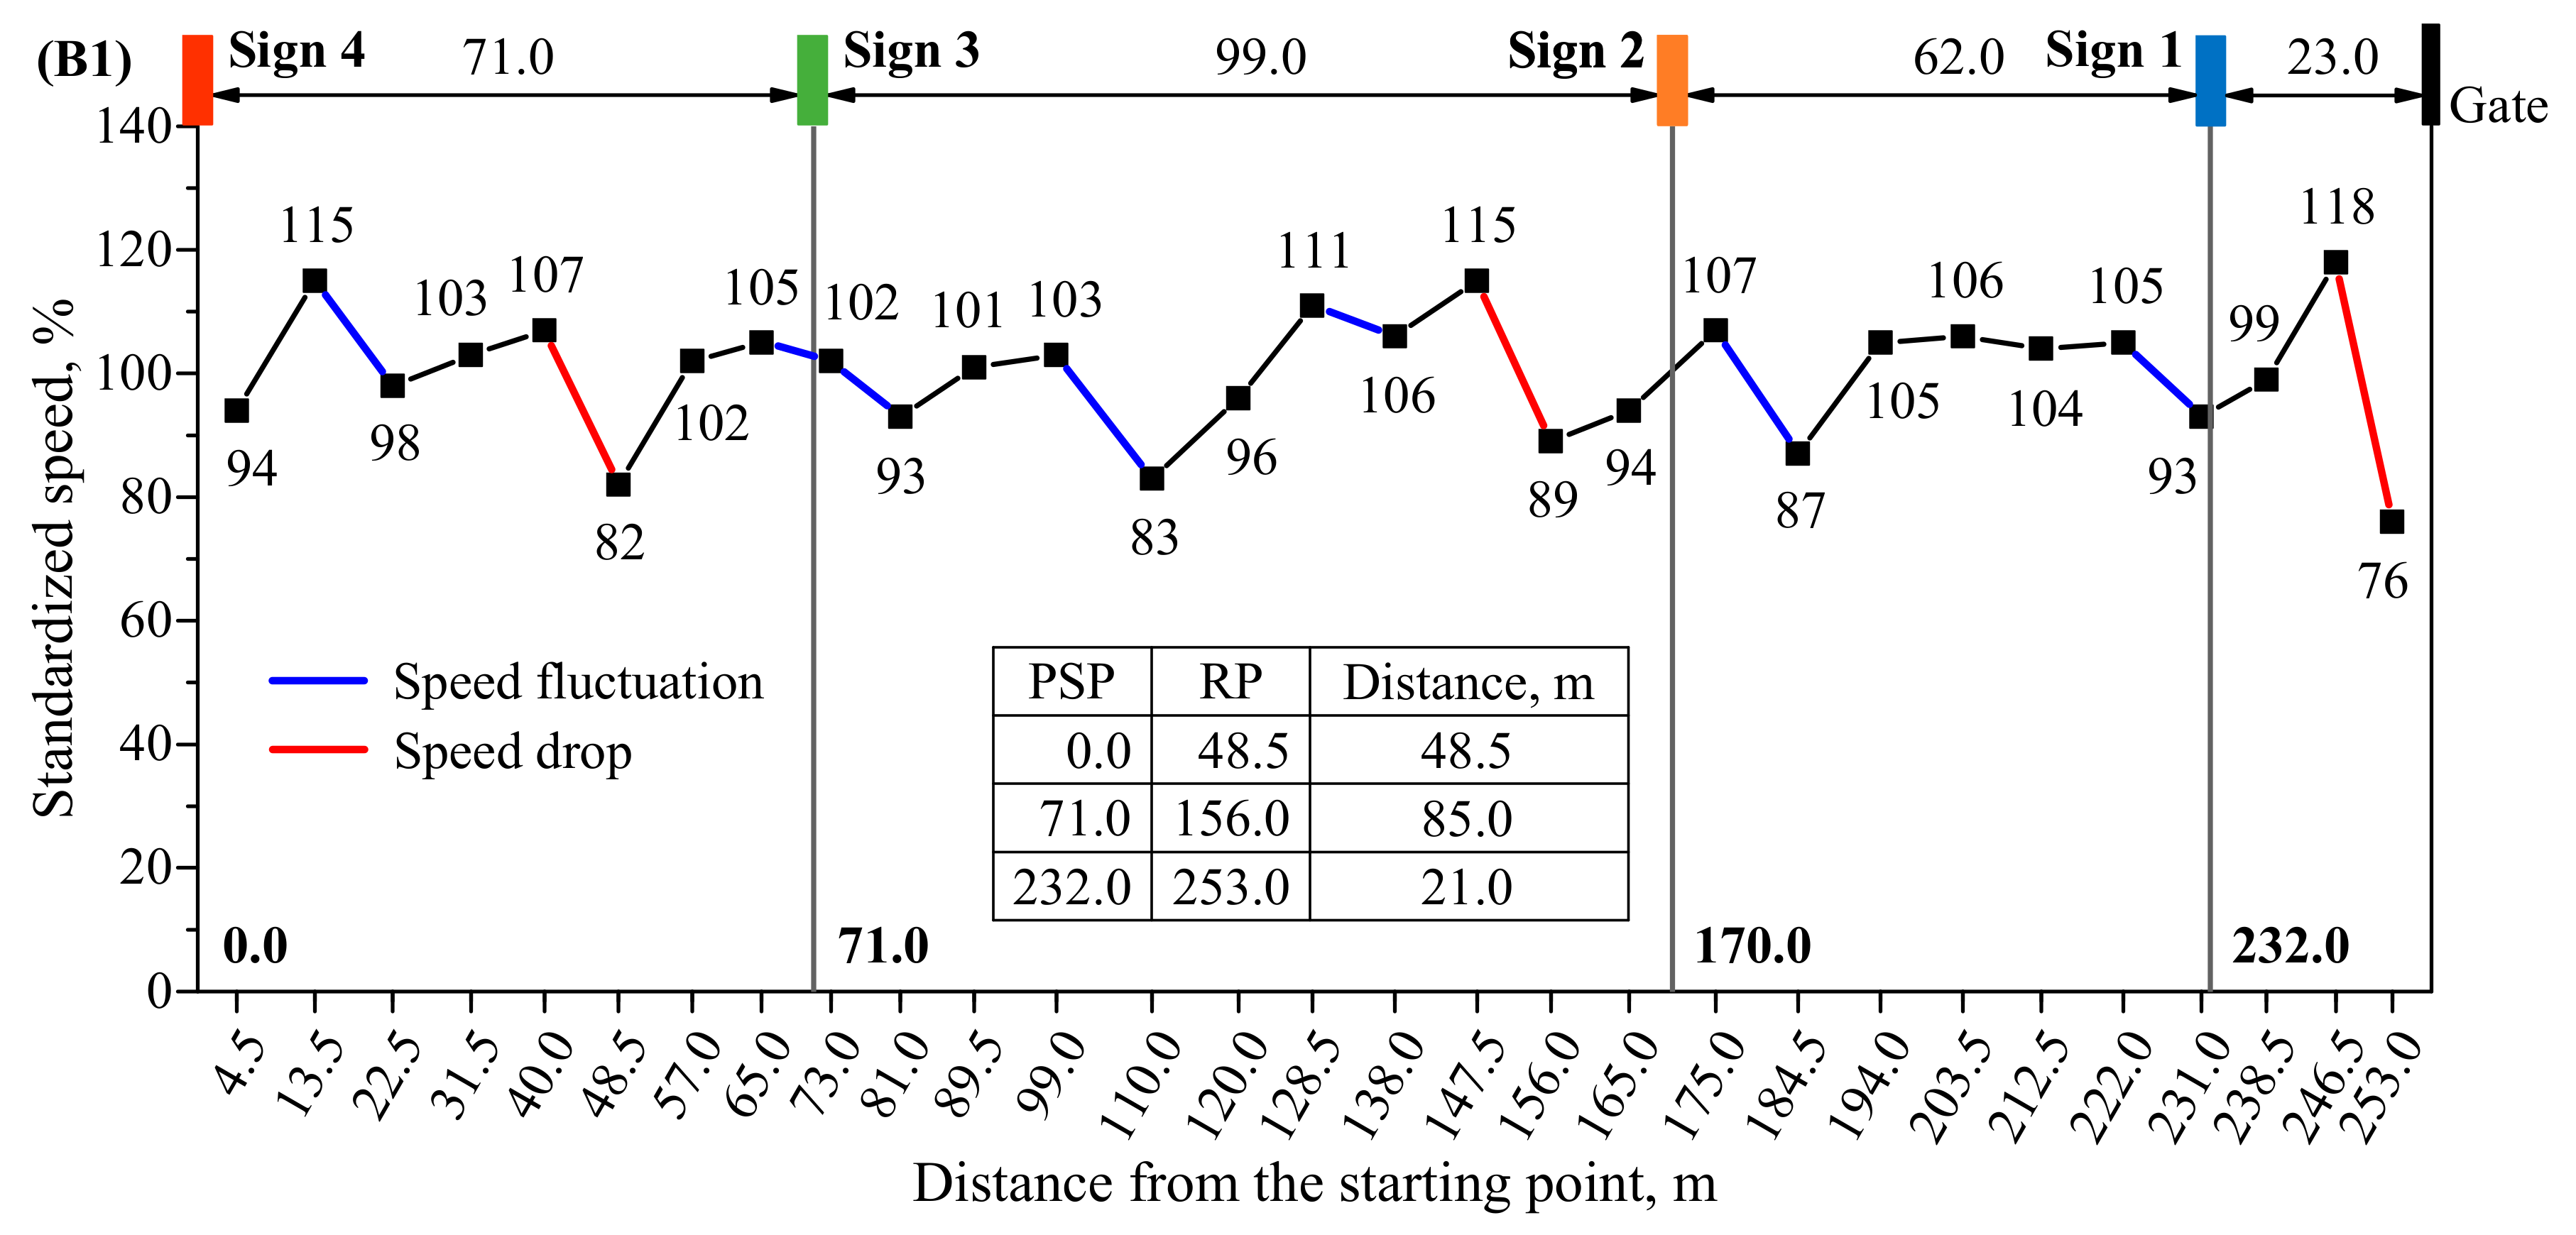
- Scenario 1The connected passageway on the basement 1st floor (B1) connects the terminal and high-speed rail areas. The length of the survey area is 255 m, and sign layout spacing is shown in Figure 8a.
- (2)
- Scenario 2The connected passageway on the third floor (F3) connects the airport departure and high-speed rail departure floors. The length of the survey area is 248 m, and sign layout spacing is shown in Figure 8b.
3.4. Results and Analysis
4. Discussion
5. Conclusions
Author Contributions
Funding
Acknowledgments
Conflicts of Interest
References
- Andre, A.D. Human orientation and wayfinding in airport passenger terminals. Transp. Res. Rec. J. Transp. Res. Board 1991, 1298, 25–32. [Google Scholar]
- Lin, J.; Dai, J.; Song, R. Status and problems in location model research for guidance signage in comprehensive passenger transportation hubs. Int. Rev. Spat. Plan. Sustain. Dev. 2016, 4, 27–35. [Google Scholar] [CrossRef]
- Tsami, M.; Budilovich, E.; Magginas, V.; Adamos, G.; Yatskiv, I. Assessing the design and operation of Riga’s International Coach Terminal. In Proceedings of the International Conference on Reliability and Statistics in Transportation and Communication, Riga, Latvia, 18–21 October 2017; Volume 26, pp. 497–506. [Google Scholar]
- Andre, A.D.; Koonce, J.M. Spatial orientation and wayfinding in airport passenger terminals: Implications for environmental design. In Proceedings of the Human Factors and Ergonomics Society Annual Meeting, San Francisco, CA, USA, 2–6 September 1991; Volume 35, pp. 561–565. [Google Scholar]
- Palmer, D.; Millard, K.; Harmer, C.; Spousta, J.; Kostiainen, J. Making a Successful Interchange in Reality. In City-HUBs: Sustainable and Efficient Urban Transport Interchanges; CRC Press: Boca Raton, FL, USA, 2016; pp. 83–114. [Google Scholar]
- Li, W.; Sun, Y. Research on the collaborative management and information service system of comprehensive passenger transportation hub. Green Intell. Transp. Syst. 2018, 419, 63–75. [Google Scholar]
- Taylor, R.S. Question-negotiation and information-seeking in libraries. Coll. Res. Libr. 1968, 29, 178–194. [Google Scholar] [CrossRef]
- Glynn, L. A critical appraisal tool for library and information research. Libr. Hi Tech 2006, 24, 387–399. [Google Scholar] [CrossRef]
- Travis Waller, S.; Ziliaskopoulos, A.K. A chance-constrained based stochastic dynamic traffic assignment model: Analysis, formulation and solution algorithms. Transp. Res. Part C Emerg. Technol. 2006, 14, 418–427. [Google Scholar] [CrossRef]
- Utsumi, S.; Takahashi, S.; Ohori, K.; Anai, H. Agent-based analysis for design of signage systems in large-scale facilities. In Proceedings of the Winter Simulation Conference, Huntington Beach, CA, USA, 6–9 December 2015; Volume 42, pp. 3134–3135. [Google Scholar]
- Duell, M.; Grzybowska, H.; Rey, D.; Waller, S. Strategic dynamic traffic assignment incorporating travel demand uncertainty. Transp. B Transp. Dyn. 2019, 7, 950–966. [Google Scholar] [CrossRef]
- Lin, J. Research on Hierarchical Guidance Signs Setting Method of Comprehensive Transport Passenger Hub Based on Passenger’ Visual Perception Behavior. Ph.D. Thesis, Beijing Jiaotong University, Beijing, China, 2017. [Google Scholar]
- Katz, J. Designing Information: Human and Common Sense in Information Design, 3rd ed.; Wiley: Hoboken, NJ, USA, 2012; pp. 13–40. [Google Scholar]
- Jiang, L.; Shao, M. Research on traveler information need in the interior of large-scale multi-modal transport hub. In Proceedings of the 14th COTA International Conference of Transportation Professionals (CICTP), Changsha, China, 4–7 July 2014; Volume 43, pp. 1327–1337. [Google Scholar]
- Li, Z.; Xu, W. Path decision modelling for passengers in the urban rail transit hub under the guidance of traffic signs. J. Ambient Intell. Humaniz. Comput. 2019, 10, 365–372. [Google Scholar] [CrossRef]
- Huang, H.; Lin, N.C.; Barrett, L.; Springer, D.; Wang, H.C.; Pomplun, M.; Yu, L.F. Automatic optimization of wayfinding design. IEEE Trans. Vis. Comput. Graph. 2018, 24, 2516–2530. [Google Scholar] [CrossRef] [PubMed]
- Zheng, M.C. Time constraints in emergencies affecting the use of information signs in wayfinding behavior. Procedia Soc. Behav. Sci. 2012, 35, 440–448. [Google Scholar] [CrossRef]
- Cao, D. Research of Sign-Oriented Set Project and Evaluation of Passenger in Large-Scale Integrated Transport Station. Master’s Thesis, Beijing Jiaotong University, Beijing, China, 2008. [Google Scholar]
- Han, Y. Optimization Method Research of Sign-Oriented Identification System in Large Passenger Station. Master’s Thesis, Beijing Jiaotong University, Beijing, China, 2010. [Google Scholar]
- Tam, M.L. An optimization model for wayfinding problems in terminal building. J. Air Transp. Manag. 2011, 17, 74–79. [Google Scholar] [CrossRef]
- Lin, Y.; Kang, L.; Shi, Y. Multi-objective modeling and optimization for layout of pedestrian-guidance signs with IFD-NSGA-II algorithm. J. Syst. Manag. 2013, 22, 553–558. [Google Scholar]
- Lin, J.; Song, R.; Dai, J.; Jiao, P. Pedestrian guiding signs optimization for airport terminal. Discret. Dyn. Nat. Soc. 2014. [Google Scholar] [CrossRef] [PubMed]
- Wang, H. The Research on Point Layout about Wayfinding Signage System of Huge Transportation Hub. Master’s Thesis, Beijing Jiaotong University, Beijing, China, 2017. [Google Scholar]
- Nassar, K. Sign Visibility for Pedestrians Assessed with Agent-Based Simulation. Transp. Res. Rec. J. Transp. Res. Board 2011, 2264, 18–26. [Google Scholar] [CrossRef]
- Zhao, R. Analysis on marking standard of integrated passenger terminal in China. In Proceedings of the 2nd IEEE International Conference on Intelligent Transportation Engineering, Singapore, 1–3 September 2017; pp. 169–173. [Google Scholar]
- Huang, Z.; Zhou, F.; Chen, X.; Deng, Y. Investigation and analysis of pedestrian behavior influenced by information in integrated passenger transport hub. Integr. Transp. 2017, 39, 52–56. [Google Scholar]
- Wang, X.; Yang, C.; Yang, L. The compared study of sign system for metro station. Undergr. Space 2004, 24, 677–884. [Google Scholar]
- Lynch, K. The Image of the City; MIT Press: Cambridge, MA, USA, 1960; pp. 1–13. [Google Scholar]
- Zaugg, H.; Child, C.; Bennett, D.; Brown, J.; Alcaraz, M.; Allred, A.; Andrus, N.; Babcock, D.; Barriga, M.; Brown, M.; et al. Comparing library wayfinding among novices and experts. Perform. Meas. Metr. 2016, 17, 70–82. [Google Scholar] [CrossRef]
- Morag, I.; Heylighen, A.; Pintelon, L. Evaluating the inclusivity of hospital wayfinding systems for people with diverse needs and abilities. J. Health Serv. Res. Policy 2016, 21, 243–248. [Google Scholar] [CrossRef] [Green Version]
- Greenroyd, F.L.; Hayward, R.; Price, A.; Demian, P.; Sharma, S. A tool for signage placement recommendation in hospitals based on wayfinding metrics. Indoor Built Environ. 2017, 27, 925–937. [Google Scholar] [CrossRef] [Green Version]
- Dogu, U.; Erkip, F. Spatial factors affecting wayfinding and orientation: A case study in a shopping mall. Environ. Behav. 2000, 32, 731–755. [Google Scholar] [CrossRef]
- Dada, E.S. Quantitative Measures of Orientation in Airport Terminals. Ph.D. Thesis, University of Calgary, Calgary, AB, Canada, 1997. [Google Scholar]
- Fewings, R. Wayfinding and airport terminal design. J. Navig. 2001, 54, 177–184. [Google Scholar] [CrossRef]
- Lam, W.H.K.; Tam, M.L.; Wong, S.C.; Wirasinghe, S.C. Wayfinding in the passenger terminal of Hong Kong International Airport. J. Air Transp. Manag. 2003, 9, 73–81. [Google Scholar] [CrossRef]
- Churchill, A.; Dada, E.; Barros, A.G.D.; Wirasinghe, S.C. Quantifying and validating measures of airport terminal wayfinding. J. Air Transp. Manag. 2008, 14, 151–158. [Google Scholar] [CrossRef]
- Zhang, Y.; Chen, X.; Jiang, J. Wayfinding-oriented design for passenger guidance signs in large-scale transit center in China. Transp. Res. Rec. J. Transp. Res. Board 2010, 2144, 150–160. [Google Scholar] [CrossRef]
- Arthur, P.; Passini, R. Wayfinding: People, Signs and Architecture; McGraw-Hill Companies: New York, NY, USA, 1992; pp. 1–238. [Google Scholar]
- Fang, J. Design of Guidance Information System in the Railway Passenger Transport Hub Based on Learning Concept. Master’s Thesis, Wuhan University of Technology, Wuhan, China, 2012. [Google Scholar]
- Bohari, Z.A.; Bachok, S.; Osman, M.M. Improving the quality of public transportation system: Application of simulation model for passenger movement. Procedia Soc. Behav. Sci. 2014, 153, 542–552. [Google Scholar] [CrossRef]
- Seneviratne, P.N.; Morrall, J.F. Analysis of factors affecting the choice of route of pedestrians. Transp. Plan. Technol. 1985, 10, 147–159. [Google Scholar] [CrossRef]
- O’Neill, M.J. Effects of signage and floor plan configuration on wayfinding accuracy. Environ. Behav. 1991, 23, 553–574. [Google Scholar] [CrossRef]
- Li, X.; Chen, J.; Luo, S. Static sign system of comprehensive passenger transport hub. Transp. Stand. Z 2009, 3, 192–195. [Google Scholar]
- Wang, M. Analysis of Passenger-Flow Organization Model of Comprehensive Passenger Hubs. Master’s Thesis, Beijing Jiaotong University, Beijing, China, 2011. [Google Scholar]
- Sun, L.; Cui, L.; Qiu, S.; Yao, L.; Rong, J. Impact on pedestrian flow of bends in passenger access tunnels. Proc. Inst. Civ. Eng. Transp. 2017, 171, 339–348. [Google Scholar] [CrossRef]
- Lebreton, M.; Bacily, K.; Palminteri, S.; Engelmann, J.B. Contextual influence on confidence judgments in human reinforcement learning. PLoS Comput. Biol. 2019, 15, e1006973. [Google Scholar] [CrossRef]
- Chen, Z. Research on Spatial Arrangement Evaluation of Guidance sign of Urban Passenger Transportation Hubs. Master’s Thesis, Tongji University, Shanghai, China, 2009. [Google Scholar]
- Daganzo, C.F.; Sheffi, Y. On stochastic models of traffic assignment. Transp. Sci. 1977, 11, 253–274. [Google Scholar] [CrossRef]
- Castro, M.; Martínez, F.; Munizaga, M.A. Estimation of a constrained multinomial logit model. Transportation 2013, 40, 563–581. [Google Scholar] [CrossRef]
- Zhang, Y.; Yao, E.; Wei, H.; Zuo, T.; Liu, S. Constrained multinomial probit route choice modeling for passengers in large-scaled metro networks in China. Transp. Res. Procedia 2017, 25, 2385–2395. [Google Scholar] [CrossRef]


| Starting Point | Ending Point | Travel Time, s | Segment Attribute | Segment Length, m | |
|---|---|---|---|---|---|
| L169 | P168 | 20.97 | Passageway | 30 | |
| P168 | P163 | 27.97 | Passageway | 40 | |
| P163 | P167 | 31.46 | Passageway | 45 | |
| P163 | P164 | 31.46 | Passageway | 45 | |
| P164 | P165 | 34.96 | Passageway | 50 | |
| P167 | P166 | 34.96 | Passageway | 50 | |
| P166 | P162 | 48.95 | Passageway | 70 | |
| P162 | P170 | 17.48 | Passageway | 25 | |
| P162 | P161 | 48.95 | Passageway | 70 | |
| P161 | P160 | 17.48 | Passageway | 25 | |
| P165 | G172 | 62.93 | Passageway | 90 | |
| P170 | G171 | 62.93 | Passageway | 90 | |
| P168 | P155 | 48.95 | Passageway | 70 | |
| P160 | P159 | 48.95 | Passageway | 70 | |
| P155 | P159 | 62.93 | Passageway | 90 | |
| P159 | P158 | 24.47 | Passageway | 35 | |
| P156 | P157 | 87.41 | Passageway | 125 | |
| P155 | P156 | 34.96 | Passageway | 50 | |
| P158 | P157 | 34.96 | Passageway | 50 | |
| P156 | G176 | 13.98 | Passageway | 20 | |
| P157 | G175 | 13.98 | Passageway | 20 | |
| P156 | P153 | 83.91 | Passageway | 120 | |
| P155 | P154 | 83.91 | Passageway | 120 | |
| P154 | P153 | 34.96 | Passageway | 50 | |
| P153 | P152 | 34.96 | Passageway | 50 | |
| P154 | P150 | 34.96 | Passageway | 50 | |
| P152 | G177 | 48.95 | Passageway | 70 | |
| G177 | P151 | 45.45 | Passageway | 65 | |
| P150 | P149 | 34.96 | Passageway | 50 | |
| P147 | P148 | 34.96 | Passageway | 50 | |
| P144 | P143 | 24.47 | Passageway | 35 | |
| P147 | P150 | 104.89 | Passageway | 150 | |
| P147 | P146 | 31.46 | Passageway | 45 | |
| P146 | P165 | 69.93 | Passageway | 100 | |
| P146 | P145 | 41.95 | Passageway | 60 | |
| P145 | P144 | 62.93 | Passageway | 90 | |
| P144 | G173 | 27.97 | Passageway | 40 | |
| P143 | V142 | Virtual path | |||
| P148 | V142 | Virtual path | |||
| P149 | V142 | Virtual path | |||
| P151 | V142 | Virtual path | |||
| G173 | V174 | Virtual path | |||
| G172 | V174 | Virtual path | |||
| G171 | V174 | Virtual path | |||
| G177 | V178 | Virtual path | |||
| G176 | V178 | Virtual path | |||
| G175 | V178 | Virtual path | |||
| P165 | P166 | 27.97 | Passageway | 40 | |
| P163 | P161 | 62.93 | Passageway | 90 | |
| P160 | E197 | 524.47 | Large span Passageway | 750 | |
| P170 | E198 | 524.47 | Large span Passageway | 750 | |
| P158 | E197 | 524.47 | Large span Passageway | 750 | |
| No. | OD Pairs | Decision Points of Guidance Signs |
|---|---|---|
| 1 | Subway station (Hongqiao railway station) to high-speed rail departure floor | P71 P44 P41 P40 P202 P36 P203 P32 P29 E30 |
| 2 | Bus station (1st floor of East Transportation Center) to high-speed rail departure floor | P117 E116 E130 E167 E166 P162 |
| 3 | Subway station (Terminal 2) to airport departure floor | P5 P6 L16 L180 L181 L169 P168 P155 P154 P150 |
| 4 | High-speed rail arrival floor (B1) to airport departure floor | P44 P41 P40 P202 P36 P203 P32 P29 E30 P162 P165 P146 P147 |
| 5 | P7 Parking garage to airport departure floor | P4 L17 L180 L181 L169 P155 P154 P150 |
| Object of Comparison | Layout Density of Guidance Information | |
|---|---|---|
| Standards | Germany | 25–100 m |
| Japan | 40–50 m | |
| Shanghai, China | 80 m | |
| Results of this study | 56 m (60% of information demand is satisfied) 47 m (80% of information demand is satisfied) |
© 2019 by the authors. Licensee MDPI, Basel, Switzerland. This article is an open access article distributed under the terms and conditions of the Creative Commons Attribution (CC BY) license (http://creativecommons.org/licenses/by/4.0/).
Share and Cite
Shao, M.; Xie, C.; Sun, L.; Jiang, L. Optimal Layout of Static Guidance Information in Comprehensive Transportation Hubs Based on Passenger Pathfinding Behavior. Sustainability 2019, 11, 3684. https://0-doi-org.brum.beds.ac.uk/10.3390/su11133684
Shao M, Xie C, Sun L, Jiang L. Optimal Layout of Static Guidance Information in Comprehensive Transportation Hubs Based on Passenger Pathfinding Behavior. Sustainability. 2019; 11(13):3684. https://0-doi-org.brum.beds.ac.uk/10.3390/su11133684
Chicago/Turabian StyleShao, Minhua, Congcong Xie, Lijun Sun, and Lijuan Jiang. 2019. "Optimal Layout of Static Guidance Information in Comprehensive Transportation Hubs Based on Passenger Pathfinding Behavior" Sustainability 11, no. 13: 3684. https://0-doi-org.brum.beds.ac.uk/10.3390/su11133684