Article

Effects on Carbon Sources and Sinks from Conversion of Over-Mature Forest to Major Secondary Forests and Korean Pine Plantation in Northeast China

1
Center for Ecological Research, Northeast Forestry University, No.26 Hexing Road Xiangfang District, Harbin 150040, China
2
Ministry of Education Key Laboratoty of Sustainable Forest Ecosystem Management, Northeast Forestry University, No.26 Hexing Road Xiangfang District, Harbin 150040, China
3
State Key Laboratory of Forest and Soil Ecology, Institute of Applied Ecology, Chinese Academy of Sciences, No. 72 Wenhua Road Shenhe District, Shenyang 110016, China
*
Author to whom correspondence should be addressed.
Sustainability 2019, 11(15), 4232; https://0-doi-org.brum.beds.ac.uk/10.3390/su11154232
Submission received: 4 July 2019 / Revised: 28 July 2019 / Accepted: 2 August 2019 / Published: 5 August 2019

Abstract

:
The effects of replacing over-mature forest with secondary forests and plantations are significant for terrestrial ecosystem carbon (C) dynamics. However, the carbon balance and recovery time of this replacement process remain unclear. This study measured the fluxes of CH4 and CO2 in soils and the annual net C sequestration (ANCS) from seven ecosystems with different vegetation types (over-mature forest (OMF), Korean pine plantation (KPP), hardwood forest (HWF), Betula platyphylla forest (BPF), Populous davidiana forest (PDF), mixed deciduous forest (MDF), and Mongolian oak forest (MOF)) using the static chamber-gas chromatography method and the relative growth equation method. We examined the effects of environmental factors (e.g., air and soil temperature, soil volumetric water content (SVWC), soil pH, nitrate nitrogen (NO3-N), ammonium nitrogen (NH4+-N), and soil organic carbon (SOC)) on CH4 and CO2 fluxes at the Maoershan Ecosystem Research Station in Northeast China. The carbon source or sink of OMF, KPP, and five secondary forests (HWF, BPF, PDF, MDF, and MOF) were then evaluated based on net ecosystem C balance. The results revealed that the mean annual CH4 fluxes varied between −0.046 and −0.077 mg m−2 h−1. The mean annual absorption of CH4 in the secondary forests and OMF were respectively 1.09–1.67 times and 1.11 times higher than that of KPP (0.046 mg m−2 h−1, p < 0.05). The mean annual CO2 fluxes varied between 140.425 and 250.023 mg m−2 h−1. The CO2 fluxes in the secondary forests and KPP soils were respectively 1.33–1.78 times and 1.16 times higher than that of OMF (140.425 mg m−2 h−1, p < 0.05). The CH4 and CO2 fluxes were mainly influenced by air and soil temperature, SVWC, soil pH, NO3-N, NH4+-N, and SOC in Northeast China. The ANCS of vegetation (3.41 ± 0.27 − 6.26 ± 0.75 t C ha−1 y−1) varied widely among different forest types: KPP had the largest ANCS (6.26 ± 0.75 t C ha−1 y−1, which was higher than secondary forests and OMF by 1.20–1.84 times and 1.46 times, respectively, p > 0.05). Carbon sources and sinks were significantly different among the seven types of vegetation: OMF and KPP were observed to be the greatest C sinks, and secondary forests were shown to be the weakest carbon sinks or net C sources in the study region.

1. Introduction

Global climate changes caused by increasing major greenhouse gases (CH4, CO2, and N2O) in the atmosphere have aroused worldwide concerns [1]. Research has shown that the earth’s response to greenhouse gases could be more sensitive than predicted, and global temperature could rise by more than 3 °C (1.8–4.0 °C) by the end of the 21th century compared to the end of the 20th century [2]. Therefore, it is urgent to enhance the Carbon (C) sinks capacity of terrestrial ecosystems which could effectively mitigate the increased CO2 concentration in the atmosphere [3]. Forests have relatively stronger sustainability with the higher stability of structure and function in comparison with other terrestrial ecosystems (i.e., prairie ecosystem and desert ecosystem) [4]. They have stored approximately 40% and 80% of belowground and aboveground carbon in terrestrial ecosystems, respectively [5]. Therefore, the forest ecosystem has contributed significantly to global C sinks, and also has a positive effect on slowing or even reversing global warming [6,7].
In the past few decades, extensive research has focused on C cycling in forest ecosystems [8,9,10]. The preliminary assessments have shown that mature and growing forests generally remove carbon from the atmosphere at a rate of a few tons per hectare (t/ha) annually [11]. Carbon sinks were usually observed in boreal and hemiboreal forested areas [12,13]. Northern mid-latitude forests in the United States along with primary ponderosa pine forests in Oregon serve as a sink for atmospheric CO2 [14,15]. However, several studies have shown that disturbances (such as harvest and fire) can transform mature forests from C sinks to sources [16,17]. Artificial afforestation and natural restoration after deforestation or fire are two effective ways to restore forest carbon sinks, while the recovery process is significantly influenced by the recovery mode [18,19]. Plantations and secondary forests are two methods for recovering from the effects of anthropogenic disturbances, and related source or sink characteristics will be significantly altered as land-use changes [20]; as such, the carbon balances of such regenerating forest have numerous uncertainties [21]. For instance, several commercial plantations have been observed to be net C sinks in the eastern United States [22,23]. A young ponderosa pine forest, which replaced an old-growth ponderosa pine forest, was shown to be a source of C to the atmosphere [15]. There is also uncertainty about the length of time required for the C balance recovery. For example, it took decades to recover the sink statuses in Siberia [16,17], the United States [15,24], and Europe [25] due to a wide range of emission rates. Net Primary Productivity (NPP) can take decades to exceed heterotrophic respiration in the boreal forest [26], and it took 20–30 years for Pacific Northwest regenerating coniferous forests to convert C source into net atmospheric CO2 sinks following the disturbance of forest regeneration [27]. Simulations have indicated it could take between 50 and 100 years for regrowth to restore C sinks after a stand-replacing disturbance caused by a clearcut or fire [15]. Although this is influenced by forest management as far as C sequestration, the amount of time required for temperate secondary forests and plantations to convert carbon sources into forest sinks remains unclear.
Forestry practices may not only affect C sequestration but may also change soil respiration (RS) [28]. As the structure and function of a forest ecosystem could be altered after the replacement of the over-mature forests by secondary forests and plantations [29], forest conversion has shown complex and changeable effects on RS [30]. An estimate based on limited data has shown that the conversion of natural forest to secondary forests and plantations has led to reduced RS by 32% and 46%–48%, respectively [31], while a significant increase in CO2 emission was observed by stand-replacing from secondary forest to plantations [32]. However, the environmental changes (soil temperatures, soil organic material, etc.) caused by disturbance have been observed to decrease [33], increase [34,35], or have no effect on soil heterotrophic respiration rates [36,37]. Additionally, some evidence has shown that carbon emissions can be gradually restored to the state of native vegetation using the secondary succession process; however, significant differences were observed in its recovery time in the results among these researchers. It took 30 years for CH4 emissions to be restored to forest level after conversion from pasture to forest in Costa Rica and Indonesia [38,39], 40 years in Switzerland [40], and 100 years in Denmark [41]. The phenomenon was caused by various factors (such as vegetation types and composition, climate conditions, and the activities of microbial enzymes, and so on) [42]. Therefore, a comprehensive study should be conducted on C balance based on NPP and RS at the ecosystem level of the over-mature forest, plantations, and secondary forests; this type of study is greatly needed in the temperate region of Asia.
Temperate forest in Northeast China is the largest temperate mixed forest in Asia. These forests have an important impact on the national C balance due to recent changes in land use including large standing tree volume and forested area [43,44], which account for 34.5% and 35.3% of the whole nation, respectively [30]. Due to the disturbance of human activities, secondary forests, which were developed due to the degradation of over-mature forest, have become the principal source of the current forest resources in China [45]. Therefore, the influence of secondary forests and plantations on C balance should be explored further to assist researchers in understanding their potential effects on climatic variation [46]. The specific objectives of the present study are twofold: (1) quantify the C emissions (CH4 and CO2) from soil heterotrophic respiration, vegetation NPP, and net carbon sequestration of over-mature forest, Korean pine plantation, and five major natural secondary forests; and (2) evaluate the effects of replacement of over-mature forest by Korean pine plantation and secondary forests on C sources and sinks of temperate forests at the Maoershan Ecosystem Research Station in Northeast China. Our results could be critical for estimating regional and national C sinks of forests and provide the basis for forest management guidelines.

2. Materials and Methods

2.1. Study Site and Plot Layout

The research presented in this paper is an experiment that was conducted at the Maoershan Ecosystem Research Station of Northeast Forestry University, Heilongjiang Province, Northeast China (127°30′–34′E, 45°20′–25′N). This region represents typical forest types and landscapes with an average altitude of 300 m above the mean sea level in Northeast China. The study area is characterized by a continental monsoon climate in the north temperate zone with a mean annual temperature of 2.8 °C, and mean minimum and maximum air temperatures are −21.5 and 32.0 °C, respectively [47]. Annual precipitation ranges from 600 to 800 mm, of which 80% falls in July and August. The parent material is granite bedrock with dark brown forest soil. Early frost occurs in September, late frost in May, and the frost-free period ranges from 120 to 140 days [48].
Korean pine is the dominant species in primary Chinese temperate forests and is mixed with such deciduous species as Quercus spp., Populus spp., and Betula spp., etc [44]. Since the turn of the 20th century, China’s over-mature forest has been harvested on a large scale for industrial use and replaced by secondary forests and plantations [49]. A representative land-use sequence was selected for the present research in this region, including an over-mature mixed-broadleaved Korean pine forest, five major secondary forests, and a Korean pine plantation. The over-mature forest located at the top of a mountain was an over-mature forest that had never been damaged or disturbed by human activities. The five secondary forests were regenerated naturally following the harvest of the over-mature mixed-broadleaved Korean pine forest between 1949 and 1953. The Korean pine plantation was also converted from the over-mature forest by reforestation in 1964. The above seven forest types had the same homogeneous substrate and original vegetation in history. The over-mature forest and six restored forests were all in the natural growth state without human disturbance or fertilization. They had a similar regional climate and topography, with slopes ranging from 7° to 23°. Seven forest types were distributed under different site conditions: over-mature forest at moist fertile gentle upper slopes, Mongolian oak forest at arid infertile steep upper slopes, mixed deciduous forest and Populus davidiana forest at well-drained fertile gentle mid-slopes, Betula platyphylla forest and Korean pine plantation at well-drained fertile gentle toe slopes, and hardwood forest at moist fertile gentle toe slopes [48]. The basic characteristics of these forest types are summarized in Table 1.
The experiment was designed as a randomized complete block with three randomly selected sites in each forest type [50]. The three sites were approximately 0.5 km apart, and each site was approximately 0.06 ha (20 × 30 m) in size. A comprehensive survey of soil and vegetation was conducted at the end of April 2015 to ensure the comparability (e.g., similar basic landform type in low mountain and hilly regions with an average slope of 10°–15°; the soil is dark brown forest soil) of the soil sampling plots. Three static chambers were randomly placed in each forest type.

2.2. Study Measurements

2.2.1. Carbon Sequestration and NPP

Based on significant differences in climate conditions and forest growth, annual experimental data were organized into six periods; Spring: March to May; Summer: June to August; Fall: September to November; Winter: December to February (the following year); Growing season: early May to late October; and Non-growing season: early November to mid-to-late April (the following year).
The vegetation at the Maoershan Ecosystem Research Station of Northeast Forestry University was investigated in 2015. For arborous plants, the diameter at breast height (DBH) was measured with a caliper and recorded before and after the growing season in 2015. Species of both living and dead arborous trees were also recorded. The annual net primary productivity of each tree in 21 plots was determined from the difference between the two DBH measurements using allometric equations [48]. Carbon sequestration was calculated from annual net primary productivity estimates and C concentration which were determined previously from a destructive sampling of biomass components for the studied arborous species within the Maoershan Ecosystem Research Station [51].
Shrubby and herbaceous plants (i.e., herbs, mosses, and grasses) were surveyed in five 5 × 5 m and 10 1 × 1 m subplots within each of the 21 fixed plots. Within these temporary plots, specimens were clipped at ground level and all species of shrubby and herbaceous plants (underground and aboveground) were collected and measured (measuring the fresh weight of plant samples). All the plant samples were dried at 70 °C for 24 h. The samples were then weighed, and the water content was calculated. Finally, the dry plant biomass of the shrubby and herbaceous layers was obtained. The biomass of the shrubby layer divided by its average age (5 years) provided the annual net primary production of the shrubby layer. The annual biomass of the herbaceous layer was calculated by the sum of the annual underground biomass (annual new roots near the stem and lighter in color) and aboveground biomass (all the parts on the ground) in each of the 21 fixed plots. As the growing season was relatively short, only one sampling period was needed [52], and the peak standing biomass was the estimated aboveground herbaceous biomass at the end of the growing season [53].
Plant samples (stem, root, branch, and foliage of arborous plants; root, branch, and foliage of shrubby plants; aboveground stem, aboveground foliage, and underground root of herbaceous plants) were dried at 70 °C for 24 h, weighed, and ground (in a Taisete mill with a 40–mesh screen; 0.85 mm mesh), and C concentration of subsamples were analyzed by a Multi CN 3100 analyzer (Analytik Jena AG, Jena, Germany).
The product of the annual net primary productivity at respective vegetation layers (arborous layer, shrubby layer, and herbaceous layer) multiplied by the corresponding carbon concentrations resulted in the annual net carbon sequestration. The sum of the annual net carbon sequestration at the three vegetation layers was the total annual net carbon sequestration of all vegetation layers.

2.2.2. Soil Gas Fluxes

Soil gas fluxes were measured using the static chamber-gas chromatography method. The static chamber was made of a stainless-steel square box consisting of two parts, the removable box (without a bottom, 0.5 × 0.5 × 0.5 m) and a fixed understructure (without a top, 0.5 × 0.5 × 0.2 m) [54]. By using stainless-steel channels, the fixed understructure remained in place for the duration of the year-long sample collections. The channels were inserted 10 cm into the soil and filled with water to make the system air-tight [55], and sticky tape and snow were used to maintain the seal in winter. The removable box was inserted directly into the understructure during sample collection. Before sample collection, it had to be determined that no vegetation was present in the fixed understructure. Two battery-operated fans on the top of each chamber (10 cm in diameter) were used to circulate the air inside the chamber when it was closed [50,55]. Two holes of 2 cm in diameter were made on the top of each chamber and were plugged with two rubber stoppers. One hole served as a sampling port, and the other was used to insert the digital thermometer probe. The electrical cord for the fan also passed through the top of the chamber, and the holes were sealed with silica gel [56]. Thermal foam insulation material was fastened to the exterior surface of the removable box to reduce the fluctuation of temperature in the removable box.
Soil gas fluxes were measured three times per month from May 2015 through April 2016, generally between 08:00 a.m. and 11:30 a.m. local time [57]. For CH4 and CO2, gas samples (50 mL each) were collected every 10 min using 50-mL plastic syringes which were made air tight with a three-way stopcock: four 50-mL samples of the air from the chambers were withdrawn at intervals of 0, 10, 20, and 30 min after closing the chamber [58]. After drawing the samples, the air in the syringes was transferred to previously evacuated and sealed reservoir bags, and was then brought to the laboratory for analysis. The headspace volume and air temperature inside the chamber were recorded to calculate the flux of CH4 and CO2 [55]. The collecting gas samples from inside the chambers and the monitoring of environmental factors (air temperature, as well as moisture and soil temperature at 0−40 cm below the soil surface) in each chamber were collected simultaneously. The collected gas samples were taken to the laboratory and analyzed for CH4 and CO2 within 24 h using a gas chromatograph (Agilent 7890A, Agilent Co., Santa Clara, CA, USA). Sample sets were rejected unless they yielded a linear regression value of r2 greater than 0.9 for CH4 and CO2 [59].

2.2.3. Soil Properties Analysis

Over one collection year, after soil gas collection at the end of every month, the surface litter beside each chamber location was removed, and a soil core of approximately 5 cm in diameter and 40 cm in length was also collected. After collection, soil samples were immediately transported in an insulated cooler to the laboratory and stored at +4 °C before analysis [57]. The nitrate nitrogen (NO3-N) and ammonium nitrogen (NH4+-N) of the soil were extracted with a 2 M KCl solution (soil: solution, 1:5) and then filtered through a 0.45 μm filter. The extracted solutions were measured by an AA3 Continuous Flow Analytical System. The collected soils (selecting a portion of collected soils from the experimental area) were sieved to 2 mm. An aliquot (approximately 10 g) of dried soil samples was used to measure soil pH. Soil pH was determined in suspensions composed of a 1:5 ratio of soil to water with a PHS-3S pH meter [50]. Air and soil temperature were measured using digital thermometers beside each chamber location. The soil temperature measure had eight different depths down from the layers: 0, 5, 10, 15, 20, 25, 30, and 40 cm. Soil volumetric water content (cm3 H2O cm−3 soil) was measured using a portable soil moisture tester (HS2, USA), which consisted of a soil moisture sensor and a handheld display. Soil organic carbon was analyzed using a multi-N/C 2100 analyzer (Analytik Jena AG, Jena, Germany).

2.2.4. Carbon Source and Sink Analysis

In order to determine the amount of carbon source and sink in over-mature forest, secondary forests, and Korean pine plantations in Northeast China, an evaluation was conducted based on annual net ecosystem carbon balance between May 2015 and May 2016 (the difference between the annual net carbon sequestration and the carbon emissions from soil heterotrophic respiration). It should be noted that throughout the research presented in this paper, carbon sinks are given a positive sign and carbon sources are given a negative sign.

2.3. Calculation and Statistical Analysis

Results are expressed as means with standard errors. Annual net primary productivity and annual net carbon sequestration, CH4 and CO2 fluxes, air and soil temperature, soil volumetric water content and pH, soil NO3-N and NH4+ -N, and soil organic carbon (SOC) for each treatment were calculated by averaging the three replicates for each sampling. The normality of distribution of all the experimental data was examined before the repeated measures using the Shapiro–Wilk’s test. The difference in CH4 and CO2 fluxes in different seasons and vegetation types were determined by one-way analyses of variance (LSD; p < 0.05); Pearson’s correlation coefficient (r) was conducted to assess the correlation between environmental factors and CH4 and CO2 fluxes across seasons; stepwise multiple linear regression was developed to quantify the response of the environmental variables to CH4 and CO2 fluxes in seven forest types. All data analyses were carried out using SPSS Statistics 17.0.

3. Results

3.1. Soil Properties

The annual average air temperature decreased in the following order: Mongolian oak forest (MOF) (6.93 ± 0.05 °C) > over-mature forest (OMF) (5.92 ± 0.01 °C) > Korean pine plantation (KPP) (5.63 ± 0.01 °C) > mixed deciduous forest (MDF) (4.93 ± 0.05 °C) > Betula platyphylla forest (BPF) (4.79 ± 0.02 °C) > Populous davidiana forest (PDF) (4.05 ± 0.21 °C) > hardwood forest (HWF) (3.44 ± 0.16 °C). As presented in Table 2, it can be observed that the annual average air temperature in OMF and KPP was higher than that of secondary forests (except for MOF) by 0.99–2.48 °C and 0.70–2.19 °C. The annual average soil temperature varied from 4.17 to 7.20 along with the seven sites, and it was higher in OMF than that in secondary forests by 0.30–3.03 °C and in KPP by 2.78 °C. The annual average soil volumetric water content was 35.45% in OMF that was higher by 27.1% and 14.9%–48.0% than that in KPP and secondary forests (except for HWF). Soil pH ranged from 5.43 to 6.02. The concentration of NO3-N in KPP was 9.76 mg kg−1 which was significantly higher than that in OMF (5.42 mg kg−1) and secondary forests (1.09−2.58 mg kg−1) by 80.1% and 278.3%–795.4%, and NO3-N in OMF was higher than that of secondary forests by 110.1%–397.2%. The concentration of NH4+-N in KPP (24.12 mg kg−1) was significantly higher than that in OMF (6.46 mg kg−1) and secondary forests (4.32−4.97 mg kg−1) by 273.4% and 385.3%–458.3%, and NH4+-N in OMF was higher than that in secondary forests by 30.0%–49.5% (p > 0.05). Soil organic C was 72.02, 55.26, and 48.42–96.37 g kg−1 in OMF, KPP, and secondary forests, respectively. SOC in HWF soils was also significantly higher than that in all the forest stands by 33.8%–99.0%. It was significantly higher in OMF than that in KPP and PBF, and MOF by 30.3%, 38.6%, and 48.7%.

3.2. Emission of GHGs

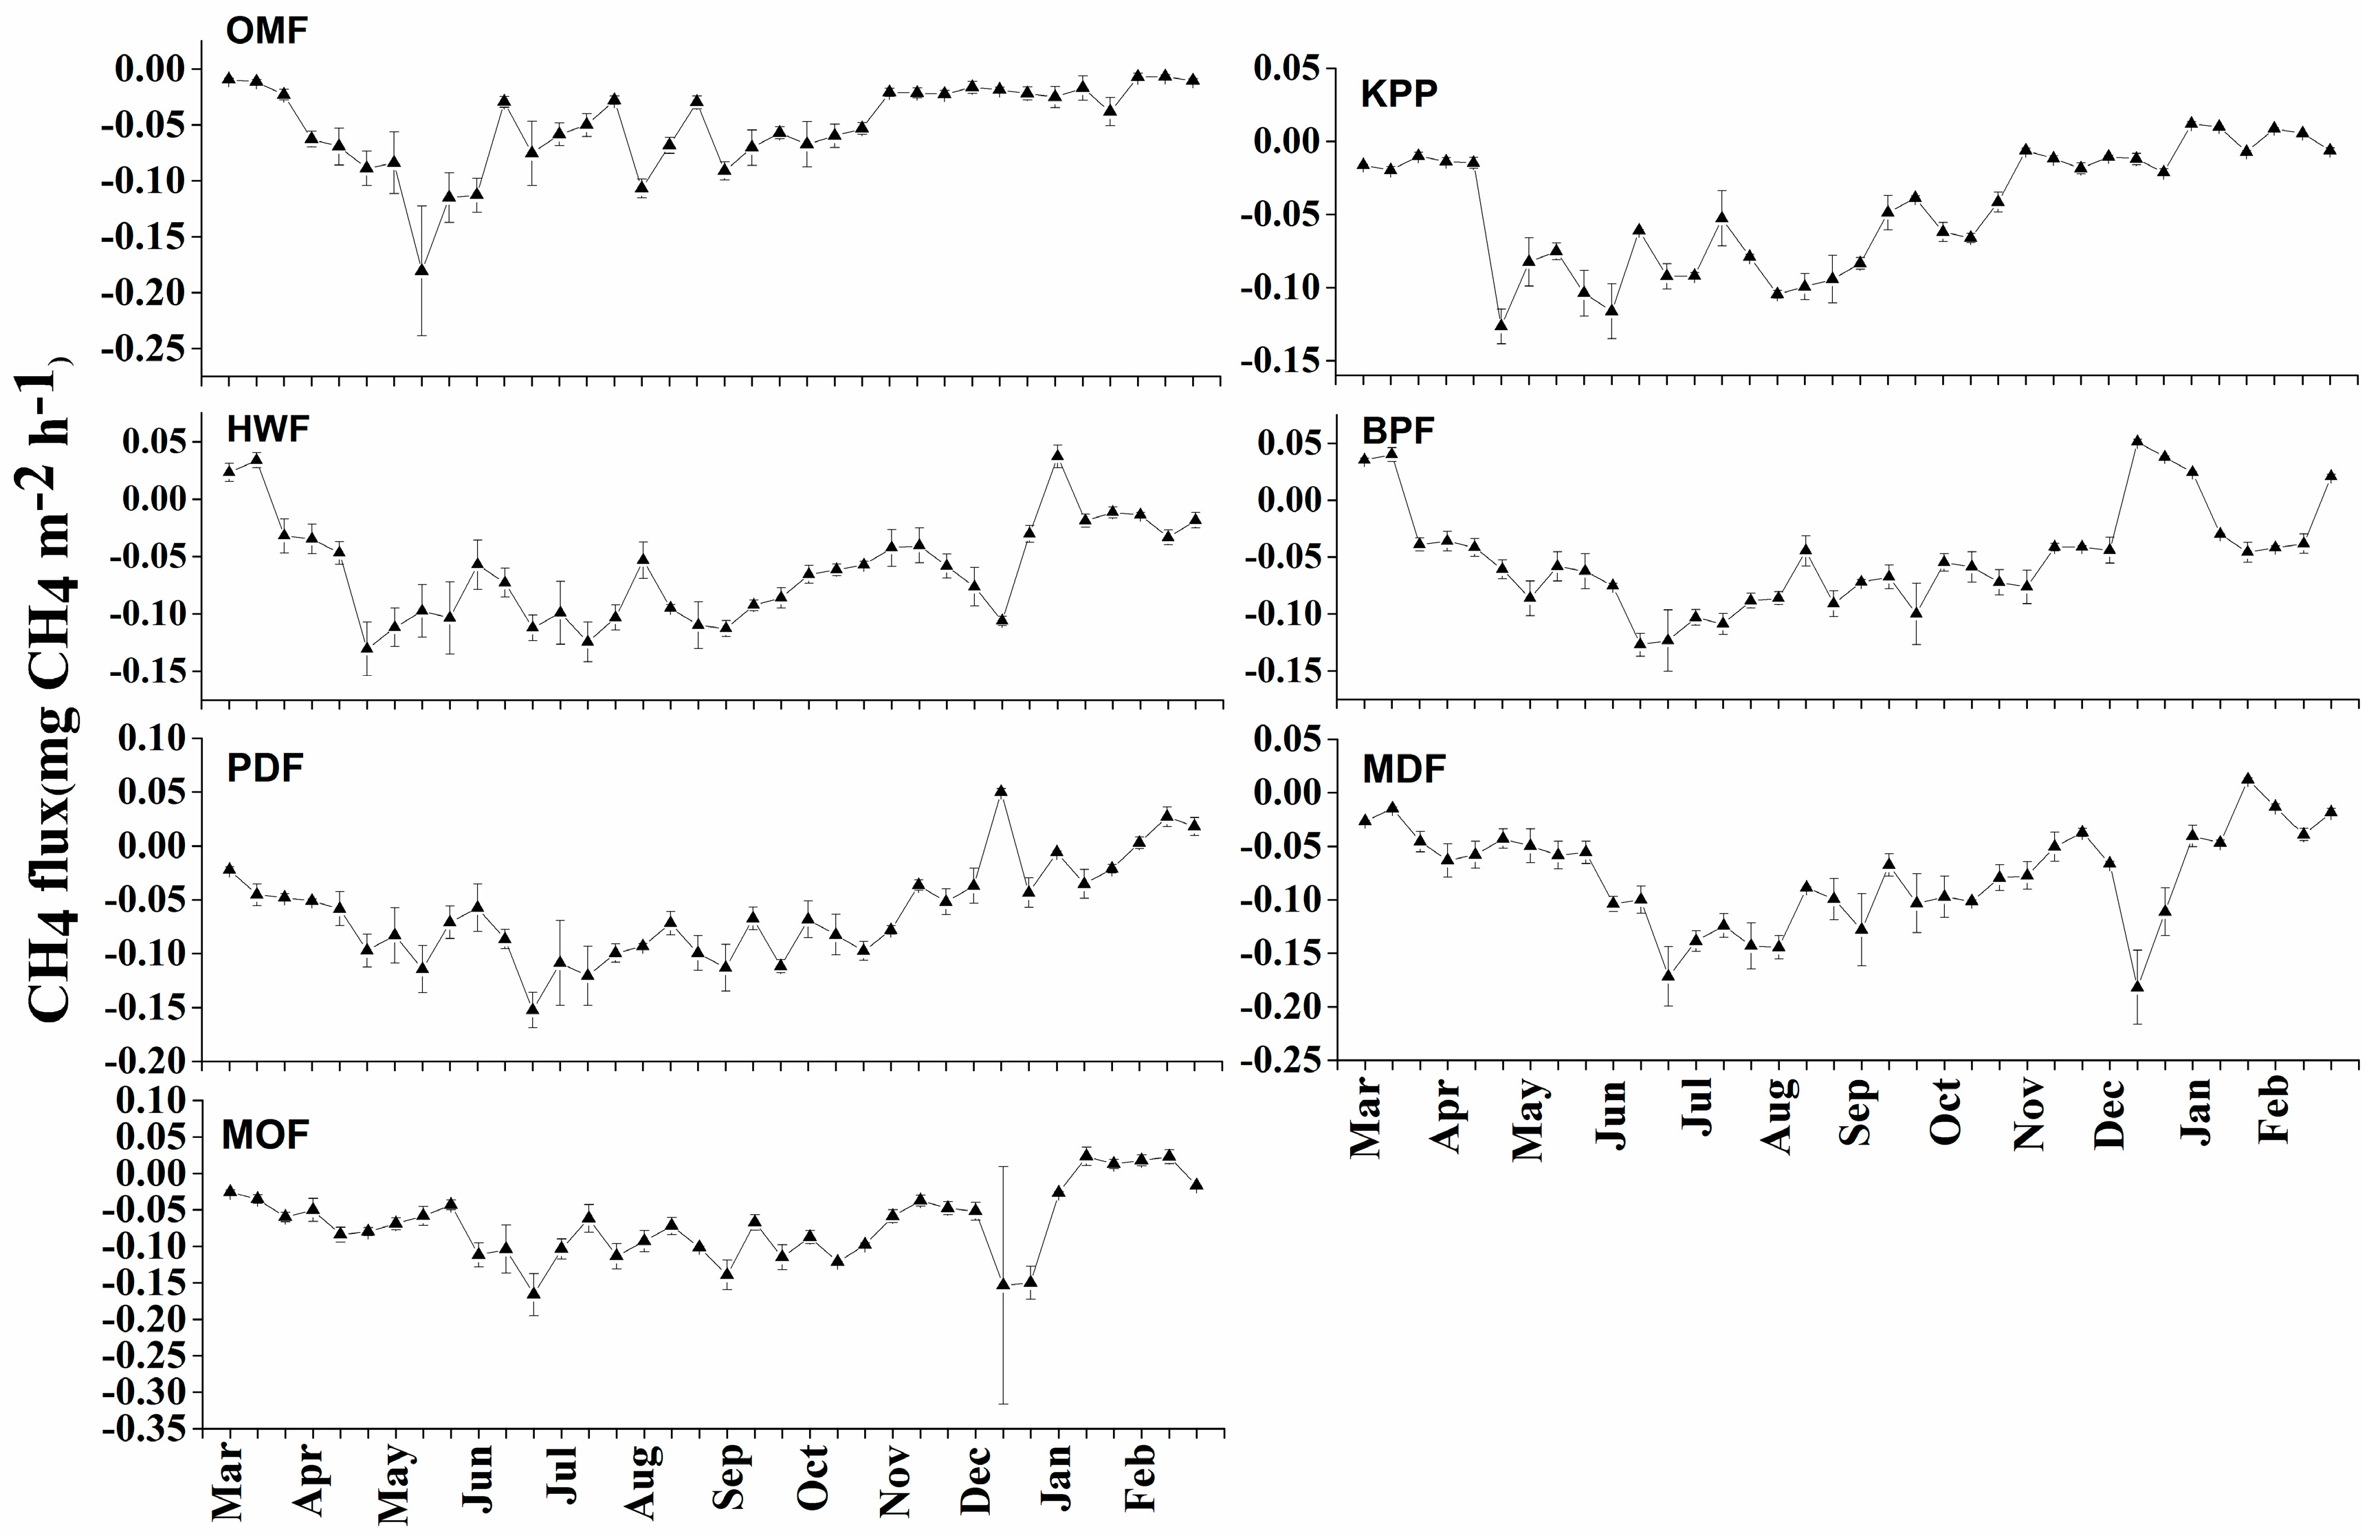
3.2.1. Methane Emission

The fluxes of CH4 from seven forest types indicated a consistent net soil consumption of CH4 (i.e., negative CH4 flux) (Figure 1 and Table 3). The mean annual CH4 fluxes varied between −0.046 and −0.077 mg m−2 h−1, and increased in the order of Korean pine plantation (−0.046 mg m−2 h−1) < over-mature forest (−0.051 mg m−2 h−1) < secondary forest (between −0.046 and–0.077 mg m−2 h−1) (Table 3), and significant differences were observed among the seven forest types (p < 0.05), of which, four secondary forest types (except for BPF) were significantly higher than that of KPP by 32.6%–67.4%, and two secondary forest types (MDF and MOF) were 37.3%–51.0% greater than that of OMF (Figure 1 and Table 3). Among five secondary forests, the annual CH4 absorption in MDF was 24.2%–54.0% greater than that of the other three forests except for MOF (Table 3).
Seasonality had a significant impact on CH4 absorption: the maximum CH4 absorption value primarily occurred in May or June (summer), while little emission value was found in January in only a few types (winter) (Figure 1 and Table 3). Variation in CH4 absorption was pronounced during the growing season(−0.079–0.101 mg m−2 h−1) compared to the non-growing season(−0.016–0.060 mg m−2 h−1) for all land-use types, of which the former was 1.7 to 5.5 times bigger than that of the latter (Table 3). No significant difference was observed in mean CH4 absorption values during the growing season, but significant differences were observed during the non-growing season. The mean CH4 absorption values in secondary forests (except for BPF) was significantly higher than that of KPP by 118.8%–275.0%, and in MDF and MOF the absorption value was 74.2% and 93.5% greater than that of OMF, which in OMF was 93.8% greater than that of KPP during the growing season (Table 3). It was also found that the difference of the mean CH4 absorption during the non-growing season was the primary cause of the differences in absorption value of the mean annual CH4 among seven forest types.

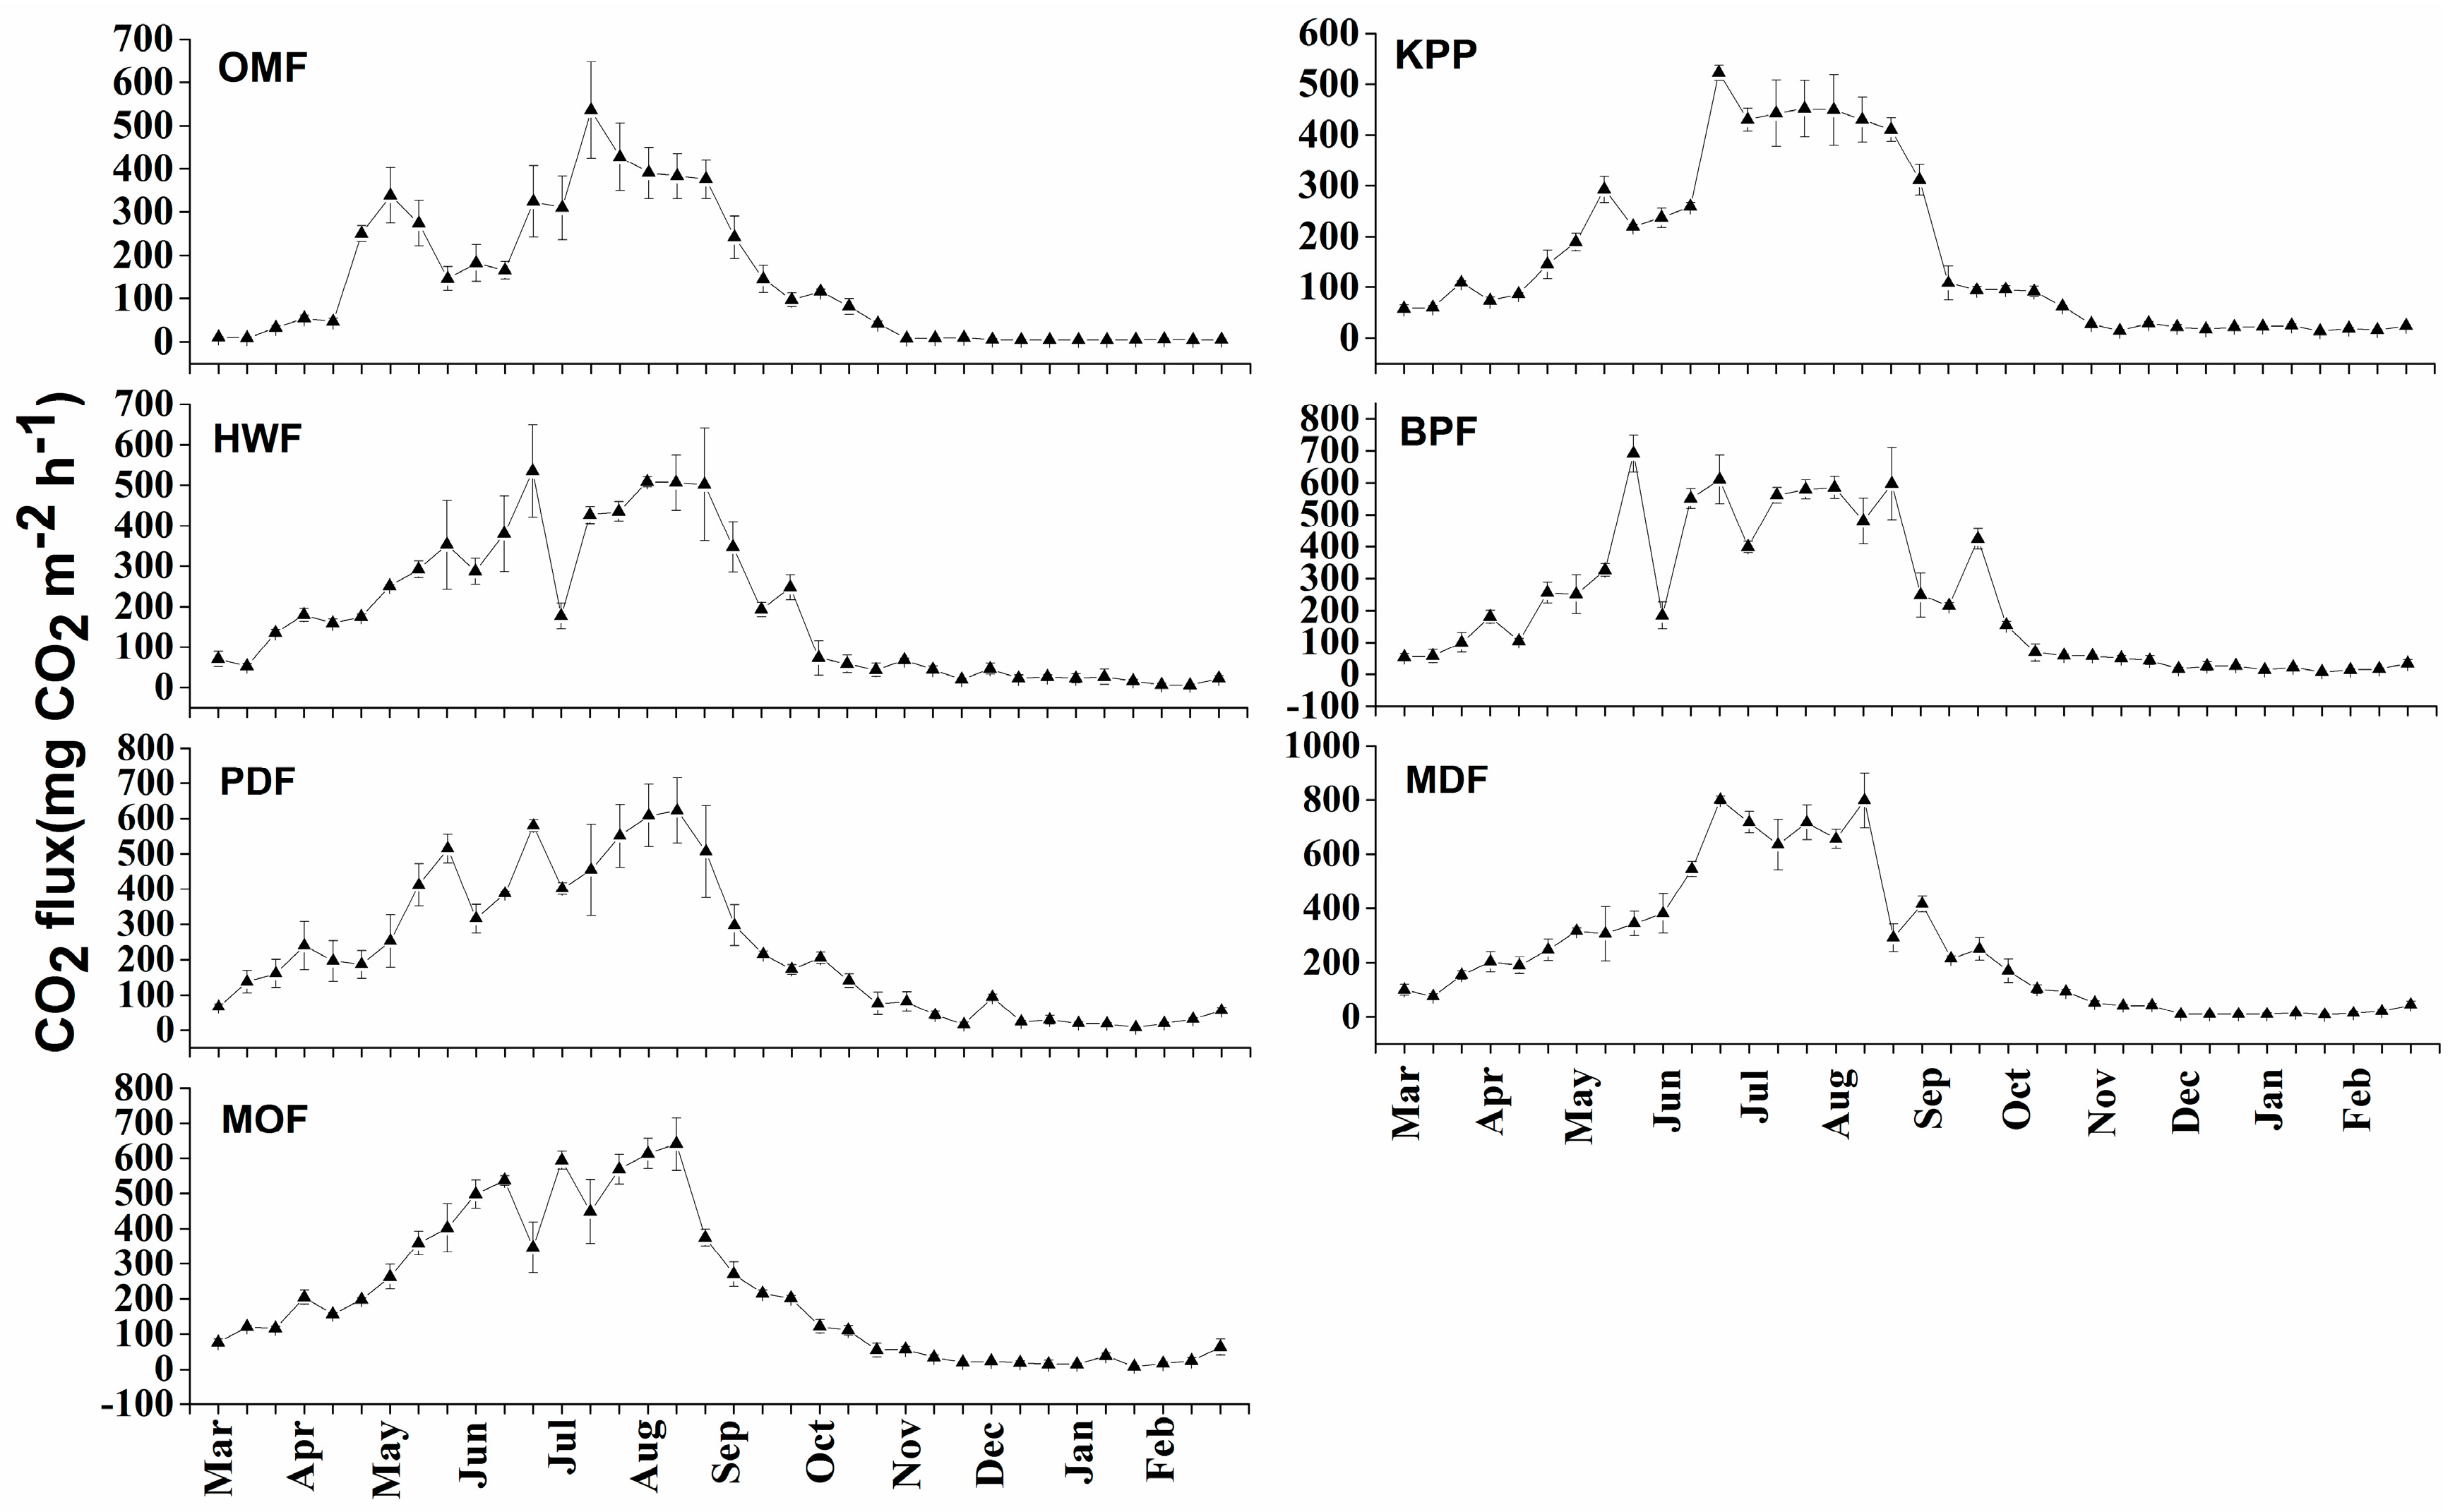
3.2.2. Carbon Dioxide Emission

A significant difference in the mean annual CO2 fluxes was observed from the seven forest types, which decreased in the following order: secondary forest (186.387−250.023 mg m−2 h−1) > Korean pine plantation (163.441 mg m−2 h−1) > over-mature forest (140.425 mg m−2 h−1). Specifically, four secondary forests (except for HWF) averaged higher CO2 flux by 33.0%−53.0% compared with KPP, and five secondary forests averaged higher CO2 flux by 32.7%−78.0% compared with OMF (p < 0.05) (Table 4). However, no significant difference was observed between OMF and KPP (the latter was higher than that of the former by 16.4%, p > 0.05). Among the five secondary forests, both MDF and PDF were 34.1% and 21.1% greater than that of HWF, respectively (Table 4).
There were clear seasonal dynamics apparent in the CO2 fluxes, which increased rapidly since the start of early spring; then the CO2 peak flux occurred in summer when the soil temperature was relatively high, and humidity was moderate. Figure 2 showed a trend of fluctuating downward during the late summer and fall, and the emissions were already low during winter when both soil temperature and moisture were low. The mean CO2 fluxes during the growing season (299.579–492.280 mg m−2 h−1) were 4.8 to 11.2 times bigger than that of the non-growing season (26.743–87.042 mg m−2 h−1) (Table 4). The mean CO2 fluxes in four secondary forests (except for HWF) were significantly higher than that of KPP by 28.6%–50.7% and in OMF by 40.2%–64.3%, respectively. No significant difference was observed in OMF and KPP. During the non-growing season, the four secondary forest types (except for HWF) were significantly higher than that of KPP by 52.2%–85.9%, and five secondary forest types were 139.1%–225.5% greater than that of OMF, but no significant difference was observed between OMF and KPP. Table 4 shows that the difference of the mean CO2 fluxes during both growing and non-growing seasons was the primary cause of the differences in the mean annual CO2 emissions among seven forest types.

3.2.3. Key Soil Factors Affecting CH4 and CO2 Fluxes

Correlation analysis of greenhouse gas with environmental temperature and soil volume water content for each land-use type is depicted in Table 5. CH4 fluxes were significantly negatively correlated with environmental temperature (air and soil temperature, 0–40 cm soil depth). CH4 fluxes from five secondary forests were significantly negatively correlated with soil volumetric water content (SVWC) at different soil depths. However, CH4 fluxes did not display any pronounced dependency on SVWC for OMF (Table 5). Note that CH4 fluxes from KPP were significantly negatively correlated with environmental temperature, but positively correlated with SVWC (Table 5).
CO2 fluxes, as measured from KPP, OMF, and secondary forests, were significantly positively correlated with air and soil temperature (0–40 cm soil depth) (Table 5). The results showed no correlation between CO2 fluxes and SVWC for OMF (Table 5). However, the CO2 emission in KPP was negatively correlated with the surface SVWC (0–10 cm soil depth) and a significantly positive correlation was observed between CO2 fluxes from secondary forests except for HWF, which showed a negative correlation (15–40 cm) (Table 5).
Stepwise multiple linear regression was used to identify the key environmental factors affecting CH4 and CO2 fluxes. The results indicated that air and soil temperature, SVWC, pH, NO3-N, NH4+-N, and SOC were the dominant factors controlling CH4 and CO2 fluxes from seven types of vegetation, and the CH4 and CO2 fluxes were influenced by different key environmental factors in the different forest types (Table 6).
In OMF, CH4 fluxes had significant negative correlations with pH, NH4+-N, and SOC (p < 0.05). In KPP, CH4 fluxes had significant positive correlations with SVWC, NO3-N, and NH4+-N, and negative correlations with air temperature (p < 0.01). In five secondary forests, CH4 fluxes had significant positive correlations with air temperature and negative correlations with soil temperature in HWF (p < 0.05) and MDF (p < 0.1). In BPF, CH4 fluxes had significant negative correlations with soil temperature and SOC, and positive correlations with SVWC and NO3-N (p < 0.001). In PDF and MOF, CH4 fluxes had significant negative correlations with air temperature (p < 0.05) and pH (p < 0.1), respectively (Table 6).
CO2 fluxes, as measured from KPP, OMF, and secondary forests, were significantly positively correlated with soil temperature (p < 0.001) (Table 6). In addition, CO2 fluxes from OMF also had significant positive correlations with SVWC and NO3-N (p < 0.001). In KPP, CO2 fluxes also had significant negative correlations with SVWC and NO3-N, and a positive correlation with pH (p < 0.001). In PDF, MDF, and MOF, CO2 fluxes also had significant correlations with air temperature (negative correlations in MDF and MOF), SVWC (positive correlations in PDF and MDF), pH (negative correlations in PDF), NO3-N (negative correlations in MOF), and SOC (negative correlations in PDF, MDF, and MOF) (Table 6).

3.3. Net Primary Productivity and Annual Net C Sequestration

Among seven investigative forest ecological systems, the annual net C sequestration in vegetation (tree + shrub + herb) was significantly greater (45.6% and 20.2%–83.6% ) in KPP (6.26 t ha−1 y−1) than in OMF (4.30 t ha−1 y−1) and secondary forests (3.41−5.21 t ha−1 y−1) (Table 7). From 82% to 97% of total vegetation C sequestration was stored in trees, which was significantly different among the seven forest types (p < 0.05). Annual net C sequestration (ANCS) was 1.1–1.5× greater (p < 0.05) in HWF (5.21 t ha−1 y−1) than in either MDF (4.76 t ha−1 y−1), MOF (3.85 t ha−1 y−1), BPF (4.38 t ha−1 y−1), or PDF (3.41 t ha−1 y−1), among the five secondary forests (Table 7).
KPP had the largest NPP (11.84 t ha−1 y−1); it was 1.2−1.5× and 1.3× higher than that of five secondary forests and OMF for NPP, respectively (Table 7).

3.4. Carbon Sources and Sinks

The annual C emission (ACE; that is heterotrophic soil respiration) ranged from 3.15 to 5.89 t ha−1 y−1 and differed significantly among the forest types (p < 0.05) (Table 8). It decreased in the following order: secondary forests (4.39–5.89 t ha−1 y−1) > Korean pine plantation (3.72 t ha−1 y−1) > over-mature forest (3.15 t ha−1 y−1) (Table 8).
Based on the difference between ANCS and ACE, in this study, OMF acted as a C sink ecosystem, accumulating 1.15 t ha−1 y−1 (Table 8). The 51-year-old KPP acted as a strong C sink absorbing 2.54 t ha−1 y−1 (Table 8), which was 1.2 times higher compared to OMF. Among the five secondary forests converted from over-mature forests 60–66 years ago, only HWF acted as a small C sink with 0.82 ha−1 y−1 (Table 8). However, the other four secondary forests acted as C sources emitting 1.12 (MDF), 1.27 (MOF), 0.89 (BPF), and 1.90 ha−1 y−1 (PDF), respectively (Table 8).

4. Discussion

4.1. Carbon Fluxes

4.1.1. Methane Emission and Seasonal Dynamics

Methane uptake by soils from seven forest types was observed in this study. This finding is consistent with the previous studies where the temperate forest soil acted as a net sink of atmospheric CH4 [60]. The annual average CH4 absorption increased in the following order: Korean pine plantation < over-mature forest < secondary forests, and small emissions to the atmosphere were observed in winter in the present study. The results indicated that the Korean pine plantation, over-mature forest, and secondary forest soils were all sinks for atmospheric CH4. The fundamental condition for producing methane in soils by the microbial decomposition of organic compounds was the strict anaerobic conditions [61]. When the reduction of sulphate, iron (III), nitrate, manganese (IV), and molecular oxygen was complete—that is to say, all of which maintained a higher potential—CH4 production was merely beginning [61]. Such low redox conditions usually required prolonged waterlogging, for instance, natural wetlands and in lake sediments, as well as flooded rice fields [61]. Soil moisture in the temperate forest of Northeast China did not accomplish the anaerobic conditions needed to affect the activities of CH4-consuming microbes during the monitoring period. Additionally, the shift in methanotrophic type is one of the factors that led to a change in soil CH4 oxidation [62], because the land-use changes greatly influence the methanotrophic community structure and activity [63]. Maurer et al. (2008) found that soil CH4 oxidation in methanotrophic community structure can be limited by toxic compounds from conifer species [64]. Thus, soil CH4 oxidation is impeded, which is the main reason for the lower CH4 absorption of the Korean pine plantation in this study area.
The soil CH4 fluxes among all the vegetation types have a clear seasonal pattern (Figure 1). The results showed that the permeability of atmospheric O2 into the soil had a significant impact on the balance between CH4 production (anaerobic environment) and consumption (aerobic environment), including the activities of methanogens and methanotrophs as well, which were affected by soil temperature, soil volumetric water content, and soil pH [65,66]. It was found that the CH4 absorbing and releasing peak occurred in summer and winter, respectively (Figure 1). Additionally, the CH4 fluxes were negatively correlated with soil temperature (p < 0.05) (Table 5). These results indicate that high soil temperatures are necessary conditions for supporting the diffusion and exchange of CH4 produced by microbial activity between soil and atmosphere [67]. Optimal CH4 consumption occurred in samples that were incubated at temperatures between −5 and 10 °C, and between 20 and 30 °C, under which condition methanogen has high activity. Note soil temperature is the dominant factor of CH4 absorption in forest soil. However, CH4 consumption was greatly reduced at 40 °C as the low and high temperature significantly reduce microbial activity [68]. Additionally, the soil temperature between 10 and 20 °C has no effect on CH4 consumption; this is because that other factors, such as soil moisture, become the most important controller of CH4 consumption [69]. According to Castro, Steudler [69], the minimum soil temperature is −5 °C in winter. However, in the present study, soil temperature below the depth of 5 cm was low (about −16.4 °C) in winter. The low temperature in winter is considered to be one of the factors affecting CH4 release in forest soils.

4.1.2. Carbon Dioxide Emission and Seasonal Dynamics

The results of the present study indicate that the minimum CO2 emissions occurred within over-mature forest plots. CO2 emissions significantly increased in secondary forest soils relative to those in KPP and OMF in any season (p < 0.05) (Figure 2), which is in agreement with previous studies that proved that the average annual soil CO2 efflux of mixed coniferous and broad-leaved over-mature forest was significantly lower than that of middle-aged, broad-leaved secondary forest [70]. The litter found in secondary forests is known to decompose more readily than that of coniferous species found in plantations and coniferous and broadleaf mixed species of over-mature forest [71]. The more rapid turnover of litter in secondary forests was one of the reasons for greater CO2 emissions than the other sites. Seven forest types used for this study had historically similar soil status, hydrological condition, and original vegetation type. As such, differences in CO2 emissions among secondary forest, KPP, and OMF may reflect the impact of the change in vegetation structure and species composition, the accompanying difference in C allocation pattern [72], differences in the quantity and quality of litter [73], and changes in soil microclimate and structure [73,74]. After human disturbance and the operation of the over-mature forest, the average CO2 emissions during the whole year from KPP and secondary forests increased by various degrees. The most direct reason for the changes in soil-to-atmosphere C flux is the variation of land use.
A clear seasonal dynamic of CO2 flux was observed following seven vegetation types at the Maoershan Ecosystem Research Station in Northeast China (Figure 2). The lowest CO2 flux in this study occurred in winter and the peak flux was observed in the seasonal pattern in summer (Figure 2). This finding is in agreement with most of the previous studies [46,50,59]. There is a broad consensus that soil temperature is the key environmental factor to affect the seasonal CO2 emission dynamics [46,75]. The proper soil temperature could promote the increase of microbial activity and then easily enhance mineralization of unavailable decomposable organic substrates [46,67]. It was found that soil temperature had a positive correlation with CO2 emission (Table 5). Therefore, the peak CO2 emission observed in summer is affected by its higher temperature compared with winter [50].

4.1.3. Emission Factors

The CH4 uptake from secondary forests, KPP, and OMF had a negative correlation with air and soil temperature (Table 5). Sun [76] studied the characteristics of greenhouse gas emissions of soil from a typical forest in Beijing. The results indicated that CH4 emissions positively correlated with soil temperature. In contrast, Dong, Shen [77] found a negative relation between CH4 uptake and soil temperature. However, research by Fest, Hinko-Najera [78] showed that soil temperature only had a minor influence on soil CH4 uptake. Therefore, affirmative conclusions about the impacts of soil temperature on CH4 emissions (uptake) from forests have yet to be achieved. This may be related to different research methods, soil properties, and climatic conditions [79]. The relations between SVWC and CH4 fluxes are significantly positively and negatively correlated, having occurred at Korean pine plantation and secondary forest sites but not in over-mature forest sites. This may be because soil moistures of over-mature forest did not reach the water-holding field capacity during the measurement period [59]. Furthermore, the soil moisture contents in over-mature forest do not reach the marginal values needed to affect the activities of CH4 consuming microbes throughout the study period.
Stepwise multiple linear regression conducted in the present study showed that CH4 fluxes from seven different vegetation types were influenced by different environmental factors and had no regulation (Table 6). This was related to the combination of a multitude of environmental factors. In addition to environmental temperature and surface soil volumetric water content, high concentrations of N could increase NH4+-oxidizer bacteria that significantly inhibits methanotrophic activities in soils [80]. Some scholars believe that large N concentrations reduced the number of methanotrophic bacteria, which inhibited the capacity of CH4 oxidization [81]. However, studies have also shown that N provides sufficient nutrients for methane-oxidizing bacteria, thus promoting the process of methane oxidation. Methane-producing archaea also revealed high activity due to stimulation by sufficient nutrients and energy [82]. In addition, lower pH had adverse effects on methane-oxidizing bacteria, which could reduce the rate of methane oxidation [83]. On the other hand, higher soil moisture was not conducive to gas diffusion in soil and resulted in more CH4 reserved in the soil, which could provide sufficient substrate for methane-oxidizing bacteria and promote CH4 oxidation. However, higher humidity provided an anaerobic environment that could promote CH4 production [50,84]. The changes in SOC may directly limit the total mineralizable C used for sustaining microbial activity, including methanogenesis, thus impacting the net CH4 flux. In addition, the changes in SOC could affect other soil properties (such as water retention and soil fertility), and thus the soil CH4 oxidation and activities of methanotroph communities can also be indirectly affected [50,66]. CH4 production and consumption have different responses to different forest types due to the comprehensive influence of the above factors. There is currently little related mechanism research, especially in the function and activity of related microorganisms, which still need to be researched further.
Soil CO2 emissions from secondary forests, Korean pine plantation, and over-mature forest were positively correlated with soil temperature (Table 5 and Table 6), which is not aligned with the conclusion that soil moisture is the most important factor for affecting the soil respiration and soil microbial activity [84], but is in accordance with the existing conclusion that soil temperature and soil volumetric water content are the most important factors for CO2 emissions [44]. The reason is that the increase of the soil temperature facilitates soil microbial activity and the decomposition of soil organic matter [85]. This leads to greater CO2 emissions as the soil temperature increases. One study indicated that soil microbial activity and the respiratory enzymes activity of plant roots increased as the temperature increased within the scope of 0–35 °C [86]. The condition of soil temperature is between −15.75 and 27.35 °C in the present study, and as such, the temperature of the growing season is suitable for microbial growth and CO2 emissions. Thus, there are clearly seasonal dynamics occurring in the CO2 fluxes in Northeast China. In addition, the present study exhibited the lower soil respiration from OMF with higher temperature and volume water content (Table 3). The content of soil moisture affects the production and emission of CO2 by influencing soil ventilation conditions, soil oxidation-reduction status, and the spread of the channel from soil to atmosphere [87]. Superfluous soil moisture causes the oxygen supply for microbial metabolism to reduce, resulting in a decrease in the soil respiration [79]. However, soil temperature could promote soil respiration [44]. The effect of soil moisture and temperature on CO2 emission frequently reveals strong interactions. The impacts of soil temperature on CO2 fluxes are covered by soil moisture effect in OMF. Furthermore, the composition of tree species and litters (conifer-broadleaf forest) that were difficult to decompose compared with broad-leaved forests were also the reason for high respiration from OMF [71].
In addition to environmental temperature and SVWC, the data presented in Table 6 shows that CO2 emissions were also controlled by soil pH, soil nitrogen, and SOC. The soil pH in this study ranged from 4.1 to 7.9, and previous studies have shown that it significantly affected soil microbial biomass and activity [88,89]. For soil nitrogen, on the one hand, the differences in soil nitrogen availability may facilitate CO2 emissions by stimulating the growth of microorganisms. On the other hand, soil nitrogen can reduce heterotrophic respiration by inhibiting decomposition of organic matter [90,91]. Additionally, negative correlations were observed in the present study between soil respiration rate and SOC in PDF, MDF, and MOF. This may be because SOC in the studied region was unable to provide adequate nutrition for soil organisms, leading to reduced biological activities and respiration rate.

4.2. Net Primary Productivity and Net Carbon Sequestration

The net primary productivity in the seven types of vegetation at the Maoershan Ecosystem Research Station (6.90–11.44 t ha−1 y−1) (Table 7) was higher than that reported for temperate forests in Northeast China (4.82–6.03 t ha−1 y−1) [92]. This is because their study sites are located in the cool temperate zone with lower productivity than the forest site of the proposed experiment [92]; however, it may also be due to differences in water availability and nutrients [93]. The results of the current study showed that the pine plantation had a higher NPP than over-mature forest and secondary forest types because it was in a period of rapid growth and had higher concentrations of NO3-N and NH4+-N with fertilization before 1965 (Table 3), that could significantly promote increased tree growth. Pine plantation with sufficient stand densities in the present study had a higher NPP than the other six forest types through the development of a multilayer canopy structure (Table 1) [94]. In addition, BPF had higher stand densities than the other forest types (Table 1), and the NPP in BPF was lower than that of pine plantation (Table 7). As the secondary forest and pine plantation have consistent stand age and environmental conditions, the growing ability of KPP is higher than other tree species. HWF was located at the foot of a mountain with a higher C collection compared with other forests (Table 3). Higher SOC caused it to have a higher NPP than the other secondary forest types.
The annual net C sequestration varied between 0.34 and 0.63 kg C m−2 y−1 among seven investigative ecosystems, thus the ability of annual C sequestration of terrestrial vegetation in China (0.49 kg C m−2 y−1) [95] and global annual C sequestration (0.41 kg C m−2 y−1) [96] were used for comparison. It was found that KPP had the largest biomass C sequestration rate, higher than the Chinese and global mean level by 28.6% and 53.7%, respectively. While the rate for OMF (0.43 kg C m−2 y−1) was similar to the Chinese mean level, and four secondary forests (except for HWF) for annual C sequestration were lower than the Chinese mean level by 2.9%–30.0%. This result shows that secondary forests have an intermediate-level capacity of C sequestration; however, KPP has the strongest biomass C sequestration capacity. The divergent sequestration rates may be due to different forest practices, different species, and densities of growing trees, or differences in soil properties.

4.3. Carbon Balance

The annual soil heterotrophic respiration (RH) reported in the present study agrees with previous research that the forest ecosystem respiration reveals a downward trend from younger to older forests [97]. Additionally, the finding showed that the secondary forests and KPP had a higher annual RH than in the mixed forest [92]. As an important process of releasing C from soils to the atmosphere, every forest type has the different biophysical environments associated with them, which leads to their different RH [98]. Moreover, the difference of size and source of the RH among different forest types was influenced by disturbance history through converting live vegetation into dead materials [99].
The function of seven forests as C sources and sinks was not identical at the Maoershan Ecosystem Research Station in Northeast China. The five secondary forests emerged as weak C sinks or net C sources; this is consistent with the previous conclusion that the downy birch stand (78 years of age) acted as a C source emitting 0.95 t C ha−1a−1 [10]. In contrast, OMF and KPP acted as stronger net C sinks in this study that was in the range reported for temperate forests [97]. This is owing to the intensive annual biomass production of the trees and management of such forests, which is essential in terms of effective C accumulation. The annual biomass production of an ecosystem increases, i.e., the C input exceeds C emission through soil RH [10]; however, as a net C source, secondary forests may suffer biological aging as well as a slow increase in DBH and volume, which leads to a significant decrease in the individual competition. Therefore, the secondary forest growth shows some stability [100]. The carbon sequestration of secondary forests is lower than that of KPP, but its soil C emissions are higher than that of KPP, thereby making secondary forests net C sources. KPP studied in this research was in a middle-aged stage and presented a stronger C sequestration ability at the intermediate stage of succession, and the C emissions of soil respiration were at a comparatively low level, thereby making it a stronger net C sinks. The annual net C sequestration and annual C emission of OMF were at a mid level (p > 0.05) and low level (p < 0.05) compared with the other forest ecosystems, respectively (Table 8). Therefore, the results of this study demonstrate that OMF is a net C sink. These results indicate that old-growth forests can still act as large C sinks. The regenerated forest types of approximately 60 years of age were weak C sinks or net C sources (secondary forest) and stronger net C sinks (Korean pine plantation) at the Maoershan Ecosystem Research Station in Northeast China.

5. Conclusions

In general, the absorption value of CH4 in secondary forest soils was significantly higher than that of OMF and KPP soils because the land-use changes led to shifts in methanotrophic type. However, the toxic compounds produced by conifer species can limit soil CH4 oxidation. Additionally, CO2 emissions from OMF and KPP soils were lower than that of soils of the secondary forests. This may be influenced by the change in tree species, the ensuing difference in the pattern of C allocation, differences in the quantity and quality of litter, and changes in soil structure and microclimate. The CH4 and CO2 fluxes were mainly controlled by air and soil temperature, soil volumetric moisture content, soil pH, ammonium nitrogen, nitrate nitrogen, and the soil organic carbon.
According to the difference between annual net C sequestration and C released from the soil in Northeast China, the over-mature forests remain C sinks despite being more than 150 years old, and Korean pine plantations (51 years old) are determined to be C sinks. The net primary productivity of KPP was 1.2 to 1.5× higher than that of other forest types because the higher concentrations of NO3-N and NH4+-N could promote the rapid growth of KPP with sufficient stand densities. Therefore, the role of over-mature forests and Korean pine plantation in regulating regional C balance should be explored in more detail, especially the selection of tree species in artificial afforestation. However, 60-year-old secondary forests that were regenerated naturally after clearcutting in Northeast China are small C sinks or main sources. This is caused by relatively high soil respiration and slow forest growth compared with OMF and KPP. The influence of secondary forest on regional C balance needs to be researched continuously and over a long period. It is especially important to study the secondary forests with different age gradients.
The authors of this paper, to strengthen C sink and C sequestration capacity of forests, recommends considering the following measures: (1) after forest regeneration, new stands (because of their high increments) start to accumulate more annual C than old-growth stands. Therefore, reasonable and sustainable forest harvesting and regeneration could be conducted. The young regenerated forest with high increments should be managed effectively. (2) Trees and timber after harvesting should be processed and utilized as much as possible; their comprehensive utilization rate should also be improved. As woody materials obtained from harvesting can be used for making building, furniture, and others, an important amount of carbon would be sequestered for long years apart from forests. This can be considered as a positive output of forest regeneration.
Further studies are required for the comparison of the C sources and sinks between over-mature forest, natural secondary forests, plantations, and croplands to forecast which vegetation type is the most similar to the over-mature forest in the aspects of ecosystem C cycles.

Author Contributions

C.M. and B.W. conceived the general idea of the paper; All authors analyzed and discussed the results; B.W. and C.M. wrote and revised the paper; C.M. reviewed the edited manuscript.

Funding

The authors wish to acknowledge financial assistance supported by the National Key Research and Development Program of China (2017YFC0504102), and the National Natural Science Foundation of China (41430639).

Acknowledgments

We would like to thank Xiuxiu Wang for her help with the laboratory analyses. We also would like to thank the reviewers and editors for their time and effort.

Conflicts of Interest

The authors are well informed about the study’s objectives, provided consent, and have declared no competing interest.

References

  1. Schimel, D.S.; House, J.I.; Hibbard, K.A.; Bousquet, P.; Ciais, P.; Peylin, P.; Braswell, B.H.; Apps, M.J.; Baker, D.; Bondeau, A. Recent patterns and mechanisms of carbon recent patterns and mechanisms of carbon exchange by terrestrial ecosystems. Nature 2001, 414, 169–172. [Google Scholar] [CrossRef] [PubMed]
  2. Shiogama, H.; Ogura, T. Climate science: Clouds of uncertainty. Nature 2014, 515, 34. [Google Scholar] [CrossRef] [PubMed]
  3. Tian, H.; Melillo, J.M.; Kicklighter, D.W.; McGuire, A.D.; Helfrich, J. The sensitivity of terrestrial carbon storage to historical climate variability and atmospheric CO2 in the United States. Tellus B Chem. Phys. Meteorol. 1999, 51, 414–452. [Google Scholar] [CrossRef]
  4. Gundersen, P.; Christiansen, J.R.; Alberti, G.; Brüggemann, N.; Castaldi, S.; Gasche, R.; Kitzler, B.; Klemedtsson, L.; Lobo–do–Vale, R.; Moldan, F.; et al. The response of methane and nitrous oxide fluxes to forest change in Europe. Biogeosciences 2012, 9, 6129–6168. [Google Scholar] [CrossRef]
  5. Dixon, R.K.; Solomon, A.M.; Brown, S.; Houghton, R.A.; Trexier, M.C.; Wiśniewski, J. Carbon Pools and Flux of Global Forest Ecosystems. Science 1994, 263, 185–190. [Google Scholar] [CrossRef] [PubMed]
  6. Zeng, Z.Q.; Wang, S.L.; Zhang, C.M.; Gong, C.; Hu, Q. Carbon storage in evergreen broad–leaf forests in mid–subtropical re–gion of China at four succession stages. J. For. Res. 2013, 24, 677–682. [Google Scholar] [CrossRef]
  7. Callewaert, P.; Lenders, S.; Gryze, S.D.; Morris, S.J.; Gregorich, E.G.; Paul, E.A.; Paustian, K. Measuring and understanding carbon storage in afforested soils by physical fractionation. Soil Sci. Soc. Am. J. 2007, 66, 1981–1987. [Google Scholar]
  8. Vogt, K. Carbon budgets of temperate forest ecosystems. Tree Physiol. 1991, 9, 69–86. [Google Scholar] [CrossRef]
  9. Luyssaert, S.; Inglima, I.; Jung, M.; Richardson, A.D.; Reichsteins, M.; Papale, D.; Piao, S.l.; Schulzes, E.D.; Wingate, L.; Matteucci, G.; et al. CO2 balance of boreal, temperate, and tropical forests derived from a global database. Glob. Chang. Biol. 2007, 13, 2509–2537. [Google Scholar] [CrossRef]
  10. Veiko, U.; Mai, K.; Jürgen, A.; Mats, V.; Hardo, B.; Gunnar, M.; Kalle, K. Ecosystems carbon budgets of differently aged downy birch stands growing on well–drained peatlands. For. Ecol. Manag. 2017, 399, 82–93. [Google Scholar]
  11. Valentini, R.; Matteucci, G.; Dolman, A.J.; Schulze, E.-D.; Rebmann, C.; Moors, E.J.; Granier, A.; Gross, P.; Jensen, N.O.; Pilegaard, K.; et al. Respiration as the main determinant of carbon balance in European forests. Nature 2000, 404, 861–865. [Google Scholar] [CrossRef]
  12. Liski, J.; Nissinen, A.; Erhard, M.; Taskinen, O. Climatic effects on litter decomposition from Arctic tundra to tropical rainforest. Glob. Chang. Biol. 2010, 9, 575–584. [Google Scholar] [CrossRef]
  13. Kaipainen, T.; Liski, J.; Pussinen, A.; Karjalainen, T. Managing carbon sinks by changing rotation length in European forests. Environ. Sci. Policy 2004, 7, 205–219. [Google Scholar] [CrossRef]
  14. Pacala, S.W.; Hurtt, G.C.; Baker, D.; Peylin, P.; Houghton, R.A.; Birdsey, R.A.; Heath, L.; Sundquist, E.T.; Stallard, R.; Ciais, P.; et al. Consistent Land- and Atmosphere-Based U.S. Carbon Sink Estimates. Science 2001, 292, 2316–2320. [Google Scholar] [CrossRef] [Green Version]
  15. Law, B.E.; Thornton, P.E.; Irvine, J.; Anthoni, P.M.; Tuyl, S.V. Carbon storage and fluxes in ponderosa pine forests at different developmental stages. Glob. Chang. Biol. 2010, 7, 755–777. [Google Scholar] [CrossRef]
  16. Schulze, E.-D.; Lloyd, J.; Kelliher, F.M.; Wirth, C.; Rebmann, C.; Lühker, B.; Mund, M.; Knohl, A.; Milyukova, I.M.; Schulze, W.; et al. Productivity of forests in the Eurosiberian boreal region and their potential to act as a carbon sink—A synthesis. Glob. Chang. Boil. 1999, 5, 703–722. [Google Scholar] [CrossRef]
  17. Machimura, T.; Kobayashi, Y.; Lwahana, G.; Hirano, T.; Lopez, L.; Fukuda, M.; Fedorov, A.N. Change of Carbon Dioxide Budget during Three Years after Deforestation in Eastern Siberian Larch Forest. J. Agric. Meteorol. 2005, 60, 653–656. [Google Scholar] [CrossRef]
  18. Zaehle, S.; Bondeau, A.; Carter, T.R.; Cramer, W.; Erhard, M.; Prentice, I.C.; Reginster, I.; Rounsevell, M.D.A.; Sitch, S.; Smith, B.; et al. Projected Changes in Terrestrial Carbon Storage in Europe under Climate and Land-use Change, 1990–2100. Ecosystems 2007, 10, 380–401. [Google Scholar] [CrossRef]
  19. Singh, J.S.; Singh, D.P. Reforestation: A potential approach to mitigate excess atmospheric CH4 build-up. Ecol. Manag. Restor. 2012, 13, 245–248. [Google Scholar] [CrossRef]
  20. Poeplau, C.; Don, A. Sensitivity of soil organic carbon stocks and fractions to different land-use changes across Europe. Geoderma 2013, 192, 189–201. [Google Scholar] [CrossRef]
  21. Geider, R.J.; Delucia, E.H.; Falkowski, P.G.; Finzi, A.C.; Grime, J.P.; Grace, J.; Kana, T.M.; Roche, J.L.; Long, S.P.; Osborne, B.A.; et al. Primary productivity of planet earth: Biological determinants and physical constraints in terrestrial and aquatic habitats. Glob. Chang. Biol. 2002, 7, 849–882. [Google Scholar] [CrossRef]
  22. Battle, M.; Bender, M.L.; Tans, P.P.; White, J.W.C.; Ellis, J.T.; Conway, T.; Francey, R.J. Global carbon sinks and their variability inferred from atmospheric O2 and δ13 C. Science 2000, 287, 2467–2470. [Google Scholar] [CrossRef]
  23. Schimel, D. Contribution of Increasing CO2 and Climate to Carbon Storage by Ecosystems in the United States. Science 2000, 287, 2004–2006. [Google Scholar] [CrossRef]
  24. Clark, K.L.; Gholz, H.L.; Castro, M.S. Carbon Dynamics Along a Chronosequence of Slash Pine Plantations in North Florida. Ecol. Appl. 2004, 14, 1154–1171. [Google Scholar] [CrossRef]
  25. Kowalski, S.; Sartore, M.; Burlett, R.; Berbigier, P.; Loustau, D. The annual carbon budget of a French pine forest (Pinus pinaster) following harvest. Glob. Chang. Biol. 2010, 9, 1051–1065. [Google Scholar] [CrossRef]
  26. chulze, E.D.; Wirth, C.; Heimann, M. Managing forests after Kyoto. Science 2000, 289, 2058–2059. [Google Scholar] [CrossRef]
  27. Cohen, W.B.; Harmon, M.E.; Wallin, D.O.; Fiorella, M. Two Decades of Carbon Flux from Forests of the Pacific Northwest. Bioscience 1996, 46, 836–844. [Google Scholar] [CrossRef] [Green Version]
  28. Laporte, M.; Duchesne, L.; Morrison, I. Effect of clearcutting, selection cutting, shelterwood cutting and microsites on soil surface CO2 efflux in a tolerant hardwood ecosystem of northern Ontario. Ecol. Manag. 2003, 174, 565–575. [Google Scholar] [CrossRef]
  29. Coutinho, R.P.; Urquiaga, S.; Boddey, R.M.; Alves, B.J.R.; Torres, A.Q.A.; Jantalia, C.P. Estoque de carbono e nitrogênio e emissão de N2O em diferentes usos do solo na Mata Atlântica. Pesqui. Agropecuária Bras. 2010, 45, 195–203. [Google Scholar] [CrossRef]
  30. Shi, B.; Gao, W.; Jin, G. Effects on rhizospheric and heterotrophic respiration of conversion from primary forest to secondary forest and plantations in northeast China. Eur. J. Soil Boil. 2015, 66, 11–18. [Google Scholar] [CrossRef]
  31. Sheng, H.; Yang, Y.; Yang, Z.; Chen, G.; Xie, J.; Guo, J.; Zou, S. The dynamic response of soil respiration to land-use changes in subtropical China. Glob. Chang. Boil. 2010, 16, 1107–1121. [Google Scholar] [CrossRef]
  32. Shi, Z.; Li, Y.; Wang, S.; Wang, G.; Ruan, H.; He, R.; Tang, Y.; Zhang, Z. Accelerated soil CO2 efflux after conversion from secondary oak forest to pine plantation in southeastern China. Ecol. Res. 2009, 24, 1257–1265. [Google Scholar] [CrossRef]
  33. Prescott, C. Effects of clearcutting and alternative silvicultural systems on rates of decomposition and nitrogen mineralization in a coastal montane coniferous forest. Ecol. Manag. 1997, 95, 253–260. [Google Scholar] [CrossRef]
  34. Ewel, K.C.; Cropper, W.P., Jr.; Gholz, H.L. Soil CO2 evolution in Florida slash pine plantations. I. Changes through time. Can. J. Res. 1987, 17, 325–329. [Google Scholar] [CrossRef]
  35. Kolari, P.; Pumpanen, J.; Rannik, Ü.; Ilvesniemi, H.; Hari, P.; Berninger, F. Carbon balance of different aged Scots pine forests in Southern Finland. Glob. Chang. Biol. 2010, 10, 1106–1119. [Google Scholar] [CrossRef]
  36. Litton, C.M.; Ryan, M.G.; Knight, D.H.; Stahl, P.D. Soil–Surface carbon dioxide efflux and microbial biomass in relation to tree density 13 years after a stand replacing fire in a lodgepole pine ecosystem. Glob. Chang. Biol. 2010, 9, 680–696. [Google Scholar] [CrossRef]
  37. Misson, L.; Tang, J.; Xu, M.; McKay, M.; Goldstein, A. Influences of recovery from clear-cut, climate variability, and thinning on the carbon balance of a young ponderosa pine plantation. Agric. Meteorol. 2005, 130, 207–222. [Google Scholar] [CrossRef]
  38. Veldkamp, E.; Purbopuspito, J.; Corre, M.D.; Brumme, R.; Murdiyarso, D. Land use change effects on trace gas fluxes in the forest margins of Central Sulawesi, Indonesia. J. Geophys. Res. Space Phys. 2008, 113. [Google Scholar] [CrossRef] [Green Version]
  39. Keller, M.; Reiners, W.A. Soil–atmosphere exchange in nitrous oxide, nitric oxide, and methane under secondary succession of pasture to forest in the Atlantic lowlands of Costa Rica. Glob. Biogeochem. Cycles 1994, 8, 399–409. [Google Scholar] [CrossRef]
  40. Hiltbrunner, D.; Zimmermann, S.; Karbin, S.; Hagedorn, F.; Niklaus, P.A. Increasing soil methane sink along a 120-year afforestation chronosequence is driven by soil moisture. Glob. Chang. Boil. 2012, 18, 3664–3671. [Google Scholar] [CrossRef]
  41. Priemé, A.; Christensen, S. Seasonal and spatial variation of methane oxidation in a Danish spruce forest. Soil Boil. Biochem. 1997, 29, 1165–1172. [Google Scholar] [CrossRef]
  42. Benanti, G.; Saunders, M.; Tobin, B.; Osborne, B. Contrasting impacts of afforestation on nitrous oxide and methane emissions. Agric. Meteorol. 2014, 198, 82–93. [Google Scholar] [CrossRef]
  43. Houghton, R.A. The annual net flux of carbon to the atmosphere from changes in land use 1850–1990. Tellus B Chem. Phys. Meteorol. 1999, 51, 298–313. [Google Scholar] [CrossRef]
  44. Wang, C.K.; Yang, J.Y.; Zhang, Q.Z. Soil respiration in six temperate forests in China. Glob. Chang. Biol. 2006, 12, 2103–2114. [Google Scholar] [CrossRef]
  45. Zhang, H.D.; You, W.Z.; Xing, Z.K.; Wei, W.J.; Zhao, G.; Yan, T.W. Soil respiration of natural secondary forest and larch plantation in Montane region of eastern Liaoning province. J. Soil Water Conserv. 2011, 25, 198–201. [Google Scholar]
  46. Li, Y.; Dong, S.; Liu, S.; Zhou, H.; Gao, Q.; Cao, G.; Wang, X.; Su, X.; Zhang, Y.; Tang, L.; et al. Seasonal changes of CO2, CH4 and N2O fluxes in different types of alpine grassland in the Qinghai-Tibetan Plateau of China. Soil Boil. Biochem. 2015, 80, 306–314. [Google Scholar] [CrossRef]
  47. Wang, X.; Wang, C.; Guo, Q.; Wang, J. Improving the CO2 storage measurements with a single profile system in a tall-dense-canopy temperate forest. Agric. Meteorol. 2016, 228, 327–338. [Google Scholar] [CrossRef]
  48. Wang, C.K. Biomass allometric equations for 10 co–occurring tree species in Chinese temperate forests. Ecol. Manag. 2006, 222, 9–16. [Google Scholar] [CrossRef]
  49. Chen, D.K.; Zhou, X.F.; Zhao, H.X.; Wang, Y.H.; Jing, Y.Y. Study on the Structure, Function and Succession of the Four Types in Natural Secondary Forest; Northeast Forestry University Press: Harbin, China, 1982. [Google Scholar]
  50. Dou, X.; Zhou, W.; Zhang, Q.; Cheng, X. Greenhouse gas (CO2, CH4, N2O) emissions from soils following afforestation in central China. Atmos. Environ. 2015, 126, 98–106. [Google Scholar] [CrossRef]
  51. Van Miegroet, H.; Nicholas, N.S.; Creed, I.F.; Barker, M. Variation in overstory nitrogen uptake in a small, high-elevation southern Appalachian spruce-fir watershed. Can. J. Res. 2002, 32, 1741–1752. [Google Scholar]
  52. Yarie, J. The Role of Understory Vegetation in the Nutrient Cycle of Forested Ecosystems in the Mountain Hemlock Biogeoclimatic Zone. Ecology 1980, 61, 1498–1514. [Google Scholar] [CrossRef] [Green Version]
  53. Van Miegroet, H.; Moore, P.; Tewksbury, C.; Nicholas, N. Carbon sources and sinks in high-elevation spruce–fir forests of the Southeastern US. Ecol. Manag. 2007, 238, 249–260. [Google Scholar] [CrossRef]
  54. Bhatia, A.; Sasmal, S.; Jain, N.; Pathak, H.; Kumar, R.; Singh, A. Mitigating nitrous oxide emission from soil under conventional and no-tillage in wheat using nitrification inhibitors. Agric. Ecosyst. Environ. 2010, 136, 247–253. [Google Scholar] [CrossRef]
  55. Jain, N.; Arora, P.; Tomer, R.; Mishra, S.V.; Bhatia, A.; Pathak, H.; Chakraborty, D.; Kumar, V.; Dubey, D.; Harit, R.; et al. Greenhouse gases emission from soils under major crops in Northwest India. Sci. Total Environ. 2016, 542, 551–561. [Google Scholar] [CrossRef]
  56. Mu, C.C.; Cheng, W.; Sun, X.X.; Wu, Y.X. Seasonal Variation of Emission Fluxes of CO2, N2O and CH4 from Larix gemlinii Swamps Soils in Xiaoxing’An Mountains of China. Sci. Silvae Sin. 2010, 46, 7–15. [Google Scholar]
  57. Carmo, J.B.D.; Neto, E.R.D.S.; Duarte-Neto, P.J.; Ometto, J.P.H.B.; Martinelli, L.A. Conversion of the coastal Atlantic forest to pasture: Consequences for the nitrogen cycle and soil greenhouse gas emissions. Agric. Ecosyst. Environ. 2012, 148, 37–43. [Google Scholar] [CrossRef]
  58. Mu, C.C.; Zhang, B.W.; Han, L.D.; Yu, L.L.; Gu, H. Short–term effects of fire disturbance on greanhouse gases emission from Betula platyphylla–forested wetland in Xiaoxing’an Mountains, Northeast China. Chin. J. Appl. Ecol. 2011, 22, 857–865. [Google Scholar]
  59. Tang, X.; Liu, S.; Zhou, G.; Zhang, D.; Zhou, C. Soil–atmospheric exchange of CO₂, CH₄, and N₂O in three subtropical forest ecosystems in southern China. Glob. Chang. Biol. 2006, 12, 546–560. [Google Scholar] [CrossRef]
  60. Geng, S.C.; Chen, Z.J.; Zhang, J.H.; Lou, X.; Wang, X.X.; Dai, G.H.; Han, S.J.; Yu, D.D. Soil methane fluxes of three forest types in Changbai Mountain of Northeast China. Chin. J. Ecol. 2013, 32, 1091–1096. [Google Scholar]
  61. Smith, K.A.; Ball, T.; Conen, F.; Dobbie, K.E.; Massheder, J.; Rey, A. Exchange of greenhouse gases between soil and atmosphere: Interactions of soil physical factors and biological processes. Eur. J. Soil Sci. 2003, 54, 779–791. [Google Scholar] [CrossRef]
  62. Tate, K.; Ross, D.; Saggar, S.; Hedley, C.; Dando, J.; Singh, B.; Lambie, S. Methane uptake in soils from Pinus radiata plantations, a reverting shrubland and adjacent pastures: Effects of land-use change, and soil texture, water and mineral nitrogen. Soil Boil. Biochem. 2007, 39, 1437–1449. [Google Scholar] [CrossRef]
  63. Kolb, S. The quest for atmospheric methane oxidizers in forest soils. Environ. Microbiol. Rep. 2009, 1, 336–346. [Google Scholar] [CrossRef]
  64. Maurer, D.; Kolb, S.; Haumaier, L.; Borken, W. Inhibition of atmospheric methane oxidation by monoterpenes in Norway spruce and European beech soils. Soil Boil. Biochem. 2008, 40, 3014–3020. [Google Scholar] [CrossRef]
  65. Konda, R.; Ohta, S.; Ishizuka, S.; Heriyanto, J.; Wicaksono, A. Seasonal changes in the spatial structures of N2O, CO2, and CH4 fluxes from Acacia mangium plantation soils in Indonesia. Soil Boil. Biochem. 2010, 42, 1512–1522. [Google Scholar] [CrossRef]
  66. Tate, K.R. Soil methane oxidation and land-use change—From process to mitigation. Soil Boil. Biochem. 2015, 80, 260–272. [Google Scholar] [CrossRef]
  67. Wu, X.; Yao, Z.; Brüggemann, N.; Shen, Z.; Wolf, B.; Dannenmann, M.; Zheng, X.; Butterbach-Bahl, K.; Shen, Z. Effects of soil moisture and temperature on CO2 and CH4 soil–atmosphere exchange of various land use/cover types in a semi-arid grassland in Inner Mongolia, China. Soil Boil. Biochem. 2010, 42, 773–787. [Google Scholar] [CrossRef]
  68. Nesbit, S.; Breitenbeck, G. A laboratory study of factors influencing methane uptake by soils. Agric. Ecosyst. Environ. 1992, 41, 39–54. [Google Scholar] [CrossRef]
  69. Melillo, J.M.; Aber, J.D.; Castro, M.S.; Steudler, P.A.; Bowden, R.D. Factors controlling atmospheric methane consumption by temperate forest soils. Glob. Biogeochem. Cycles 1995, 9, 1–10. [Google Scholar]
  70. Wang, X.; Jiang, Y.; Jia, B.; Wang, F.; Zhou, G. Comparison of soil respiration among three temperate forests in Changbai Mountains, China. Can. J. Res. 2010, 40, 788–795. [Google Scholar] [CrossRef]
  71. Zhang, P.; Tian, X.; He, X.; Song, F.; Ren, L.; Jiang, P. Effect of litter quality on its decomposition in broadleaf and coniferous forest. Eur. J. Soil Boil. 2008, 44, 392–399. [Google Scholar] [CrossRef]
  72. Imaji, A.; Seiwa, K. Carbon allocation to defense, storage, and growth in seedlings of two temperate broad–leaved tree species. Oecologia 2010, 162, 273–281. [Google Scholar] [CrossRef]
  73. Vesterdal, L.; Elberling, B.; Christiansen, J.R.; Callesen, I.; Schmidt, I.K. Soil respiration and rates of soil carbon turnover differ among six common European tree species. Ecol. Manag. 2012, 264, 185–196. [Google Scholar] [CrossRef]
  74. Christiansen, J.R.; Vesterdal, L.; Callesen, I.; Elberling, B.; Schmidt, I.K.; Gundersen, P. Role of six European tree species and land–use legacy for nitrogen and water budgets in forests. Glob. Chang. Biol. 2010, 16, 2224–2240. [Google Scholar] [CrossRef]
  75. Liu, H.; Zhao, P.; Lu, P.; Wang, Y.-S.; Lin, Y.-B.; Rao, X.-Q. Greenhouse gas fluxes from soils of different land-use types in a hilly area of South China. Agric. Ecosyst. Environ. 2008, 124, 125–135. [Google Scholar] [CrossRef]
  76. Sun, X. A Study on Forest Soil CO2, N2O and CH4 Emission Flux and Dynamics in Xishan Area, Beijing; Beijing Forestry University Press: Beijing, China, 1999. [Google Scholar]
  77. Dong, Y.; Zhang, S.; Qi, Y.; Chen, Z.; Geng, Y. Fluxes of CO2, N2O and CH4 from a typical temperate grassland in Inner Mongolia and its daily variation. Chin. Sci. Bull. 2000, 45, 1590–1594. [Google Scholar] [CrossRef]
  78. Fest, B.J.; Hinko-Najera, N.; Wardlaw, T.; Griffith, D.W.T.; Livesley, S.J.; Arndt, S.K. Soil methane oxidation in both dry and wet temperate eucalypt forests shows a near-identical relationship with soil air-filled porosity. Biogeosciences 2017, 14, 467–479. [Google Scholar] [CrossRef]
  79. Davidson, E.A.; Verchot, L.V.; Cattânio, J.H.; Ackerman, I.L.; Carvalho, J. Effects of soil water content on soil respiration in forests and cattle pastures of eastern Amazonia. Biogeochemistry 2000, 48, 53–69. [Google Scholar] [CrossRef]
  80. Whalen, S.; Reeburgh, W. Effect of nitrogen fertilization on atmospheric methane oxidation in boreal forest soils. Chemosphere—Glob. Chang. Sci. 2000, 2, 151–155. [Google Scholar] [CrossRef] [Green Version]
  81. Reay, D.S.; Nedwell, D.B. Methane oxidation in temperate soils: Effects of inorganic N. Soil Boil. Biochem. 2004, 36, 2059–2065. [Google Scholar] [CrossRef]
  82. Visscher, A.D.; Cleemput, O.V. Induction of enhanced CH4 oxidation in soils: NH4+ inhibition patterns. Soil Biol. Biochem. 2003, 35, 907–913. [Google Scholar] [CrossRef]
  83. Bradford, M.; Wookey, P.; Ineson, P.; Lappin-Scott, H.; Bradford, M. Controlling factors and effects of chronic nitrogen and sulphur deposition on methane oxidation in a temperate forest soil. Soil Boil. Biochem. 2001, 33, 93–102. [Google Scholar] [CrossRef]
  84. Sun, X.; Mu, C.; Shi, L.; Cheng, W.; Liu, X.; Wu, Y.; Feng, D. Methane emission from forested swamps in Xiaoxing’an Mountains, Northeastern China. Chin. J. Plant Ecol. 2009, 33, 535–545. [Google Scholar]
  85. Amundson, R.; Niu, X.-F.; Wang, Y.; Niu, X. Seasonal and altitudinal variation in decomposition of soil organic matter inferred from radiocarbon measurements of soil CO2 flux. Glob. Biogeochem. Cycles 2000, 14, 199–211. [Google Scholar]
  86. Andrews, J.A.; Matamala, R.; Westover, K.M.; Schlesinger, W.H. Temperature effects on the diversity of soil heterotrophs and the δ13C of soil-respired CO2. Soil Boil. Biochem. 2000, 32, 699–706. [Google Scholar] [CrossRef]
  87. Dong, Y.J.; Cai, M.; Zhou, J.B. Effects of moisture and carbonate additions on CO2 emission from calcareous soil during closed–jar incubation. J. Arid Land 2014, 6, 37–43. [Google Scholar] [CrossRef]
  88. Oertel, C.; Matschullat, J.; Zurba, K.; Zimmermann, F.; Erasmi, S. Greenhouse gas emissions from soils—A review. Geochemistry 2016, 76, 327–352. [Google Scholar] [CrossRef]
  89. Tian, Y.; Haibara, K.; Toda, H.; Ding, F.; Liu, Y.; Choi, D. Microbial biomass and activity along a natural pH gradient in forest soils in a karst region of the upper Yangtze River, China. J. Res. 2008, 13, 205–214. [Google Scholar] [CrossRef]
  90. Wang, Q.; Wang, S.; He, T.; Liu, L.; Wu, J. Response of organic carbon mineralization and microbial community to leaf litter and nutrient additions in subtropical forest soils. Soil Boil. Biochem. 2014, 71, 13–20. [Google Scholar] [CrossRef]
  91. Weintraub, M.N.; Schimel, J.P. Interactions between Carbon and Nitrogen Mineralization and Soil Organic Matter Chemistry in Arctic Tundra Soils. Ecosystems 2003, 6, 129–143. [Google Scholar] [CrossRef]
  92. Cai, H.; Shi, B.; Geng, P.; Di, X.; Chang, S.X.; Wang, C.; Jin, G. Carbon storage, net primary production, and net ecosystem production in four major temperate forest types in northeastern China. Can. J. Res. 2016, 46, 143–151. [Google Scholar] [CrossRef]
  93. Gower, S.T.; Gholz, H.L.; Nakane, K.; Galdwin, V.C. Production and carbon allocation patterns of pine forests. Ecol. Bull. 1994, 43, 115–135. [Google Scholar]
  94. Gough, C.M.; Vogel, C.S.; Hardiman, B.; Curtis, P.S. Wood net primary production resilience in an unmanaged forest transitioning from early to middle succession. Ecol. Manag. 2010, 260, 36–41. [Google Scholar] [CrossRef]
  95. He, H.; Pan, Y.; Zhu, W.; Liu, X.; Zhang, Q.; Zhu, X. Measurement of terrestrial ecosystem service value in China. J. Appl. Ecol. 2005, 16, 16. [Google Scholar]
  96. Li, Y.P.; Ji, J.J. Simulations of carbon exchange between global terrestrial ecosystem and the atmosphere. Acta Geogr. Sin. 2001, 56, 379–389. [Google Scholar]
  97. Pregitzer, K.S.; Euskirchen, E.S. Carbon cycling and storage in world forests: Biome patterns related to forest age. Glob. Chang. Boil. 2004, 10, 2052–2077. [Google Scholar] [CrossRef]
  98. Wang, C.K.; Yang, J.Y. Rhizospheric and heterotrophic components of soil respiration in six Chinese temperate forests. Glob. Chang. Biol. 2010, 13, 123–131. [Google Scholar] [CrossRef]
  99. Hardiman, B.S.; Bohrer, G.; Gough, C.M.; Vogel, C.S.; Curtis, P.S. The role of canopy structural complexity in wood net primary production of a maturing northern deciduous forest. Ecology 2011, 92, 1818–1827. [Google Scholar] [CrossRef] [Green Version]
  100. Hynynen, J.; Niemistö, P.; Viheräaarnio, A.; Brunner, A.; Hein, S.; Velling, P. Silviculture of birch (Betula pendula Roth and Betula pubescens Ehrh.) in northern Europe. Forestry 2010, 83, 103–119. [Google Scholar] [CrossRef]
Figure 1. Temporal emission of methane from soil samples of seven forest types during May 2015 and April 2016.
Sustainability 11 04232 g001
Figure 2. Temporal emission of carbon dioxide from soil samples of seven forest types during May 2015 and April 2016.
Sustainability 11 04232 g002
Table 1. Characteristics of stands from which sample trees were harvested a.
Forest TypeAge (Years)Main Species Composition b (Dominant Species)Land-use HistoryDensity (Trees ha−1)BA (m2 ha−1)DBH (cm)
MeanRange
OMF˃150(8), 9, 2, 3, 10, 11, 12, 13, 14Natural forest78954.625.34.0–69.1
KPP51(8), 6, 3, 9, 5, 7, 6Reforestation in 1965211142.115.03.9–34.4
HWF60(4), (3), 2, (7)Natural regeneration after clearcutting in 1955157826.210.11.6–50.3
BPF65(6), 15, 12, 17, 18Natural regeneration after clearcutting in 1950302225.47.41.4–34.8
PDF65(6), (5), 7, 4, 3, 2Natural regeneration after clearcutting in 1950183334.112.11.6–49.4
MDF652, 7, 4, 3, 5, 6Natural regeneration after clearcutting in 1950202234.811.31.9–49.6
MOF66(1), 2, 3, 4, 5, 6Natural regeneration after clearcutting in 1949151136.613.72.0–55.4
a Note: BA stands for the basal area; DBH for diameter at breast height; OMF for the over-mature forest; KPP for Korean pine plantation; HWF for hardwood forest; BPF for Betula platyphylla forest; PDF for Populus davidiana forest; MDF for the mixed deciduous forest; MOF for Mongolian oak forest. HWF, BPF, PDF, MDF, and MOF were five major secondary forests. b (1), Quercus mongolica Fisch.; (2), Tilia amurensis Rupr.; (3), Fraxinus mandshurica Rupr.; (4), Phellodendron amurense Rupr.; (5), Populus davidiana Dode.; (6), Betula platyphylla Suk.; (7), Juglans mandshurica Maxim.; (8), Pinus koraiensis Sieb. et Zucc.; (9), Betula costata Trautv. (10), Acer ukurunduense Trautv. et Mey; (11), Abies nephrolepis (Trautv.) Maxim; (12), Ulmus laciniata (Trautv.) Mayr; (13), Acer tegmentosum Maxim; (14), Acer mono Maxim; (15), Larix gmelinii Rupr.; (16), Picea koraiensis Nakai; (17), Ulmus japonica (Rehd.) Sarg; (18), Alnus sibirica Fisch. ex Turcz.
Table 2. Physico-chemical properties of experimental sites. Data are expressed as mean ± SE, n = 12.
PropertiesOMFKPPHWFBPFPDFMDFMOF
Air T (°C)5.92 ± 0.01B5.63 ± 0.01B3.44 ± 0.16E4.79 ± 0.02C4.05 ± 0.21D4.93 ± 0.05C6.93 ± 0.05A
Soil T (°C)7.20 ± 0.01A4.42 ± 0.01E4.17 ± 0.06F5.24 ± 0.07D5.63 ± 0.04C5.17 ± 0.15D6.90 ± 0.11B
Soil moisture (%)35.45 ± 0.49A27.90 ± 0.12C34.42 ± 0.33A26.58 ± 0.32D30.84 ± 0.41B27.35 ± 0.56D23.96 ± 0.47E
Soil pH5.51 ± 0.04C6.02 ± 0.03A5.66 ± 0.16B5.43 ± 0.05BC5.47 ± 0.24BC5.53 ± 0.06B5.72 ± 0.05B
NO3-N (mg kg−1)5.42 ± 0.35B9.76 ± 0.19A2.58 ± 0.26C1.09 ± 0.13D2.22 ± 0.42C2.18 ± 0.35C1.98 ± 0.20C
NH4+-N (mg kg−1)6.46 ± 0.48B24.12 ± 2.32A4.97 ± 0.07B4.95 ± 0.66B4.60 ± 1.69B4.38 ± 0.75B4.32 ± 0.19B
Soil organic C (g kg−1)72.02 ± 7.25B55.26 ± 1.08CD96.37 ± 8.15A51.96 ± 3.32D61.77 ± 2.07BCD69.92 ± 4.52BC48.42 ± 2.37D
Note: The different capital letters after numerical values indicate statistically significant differences within physico-chemical properties under different vegetation types (p < 0.05).
Table 3. Methane fluxes (mg CH4 m−2 h−1) from the over-mature forest, Korean pine plantation, and five secondary forest soils at the Maoershan Ecosystem Research Station in Northeast China. Data are expressed as mean ± SE, n = 3.
Observe PeriodVegetation Types
OMFKPPHWFBPFPDFMDFMOF
Spring−0.072 ± 0.010Db−0.051 ± 0.005BCb−0.053 ± 0.003BCb−0.033 ± 0.003Ab−0.067 ± 0.003CDb−0.043 ± 0.003ABa−0.053 ± 0.003BCab
Summer−0.062 ± 0.003Ab−0.088 ± 0.008ABc−0.093 ± 0.012ABCc−0.093 ± 0.003ABCd−0.100 ± 0.015BCc−0.123 ± 0.009Cc−0.100 ± 0.015BCc
Autumn−0.052 ± 0.006ABb−0.042 ± 0.003Ab−0.070 ± 0.006BCb−0.063 ± 0.003BCc−0.080 ± 0.010Cbc−0.080 ± 0.006Cb−0.083 ± 0.007Cbc
Winter−0.018 ± 0.003ABCa−0.002 ± 0.001Aa−0.030 ± 0.001BCa−0.007 ± 0.003ABa−0.007 ± 0.003ABa−0.057 ± 0.009Da−0.037 ± 0.019CDa
Gs−0.079 ± 0.006Ab−0.088 ± 0.003Ab−0.098 ± 0.007Ab−0.084 ± 0.004Ab−0.096 ± 0.011Ab−0.101 ± 0.006Ab−0.092 ± 0.011Ab
Ngs−0.031 ± 0.004Ba−0.016 ± 0.001Aa−0.035 ± 0.003Ba−0.026 ± 0.001ABa−0.038 ± 0.006Ba−0.060 ± 0.005Ca−0.054 ± 0.005Ca
Aa−0.051 ± 0.003AB−0.046 ± 0.002A−0.061 ± 0.004BC−0.050 ± 0.002AB−0.062 ± 0.006BC−0.077 ± 0.004D−0.070 ± 0.006CD
Note: The different lowercase letters after numerical values indicate statistically significant differences within treatments among different seasons. The different capital letters after numerical values indicate statistically significant differences within seasons among different treatments. Abbreviations: Gs—Growing Season; Ngs—Non-growing Season; Aa—Annual average.
Table 4. Carbon dioxide fluxes (mg CO2 m−2 h−1) from the over-mature forest, Korean pine plantation, and five secondary forest soils at the Maoershan Ecosystem Research Station in Northeast China. Data are expressed as mean ± SE, n = 3.
Observe PeriodVegetation Types
OMFKPPHWFBPFPDFMDFMOF
Spring129.295 ± 14.521Bb137.162 ± 5.692Bb185.272 ± 17.789ABb224.517 ± 12.656Ab240.538 ± 33.223Ab215.354 ± 29.795Ab210.625 ± 14.015Ab
Summer344.022 ± 58.402Ea403.728 ± 8.646DEa417.525 ± 3.152CDEa505.714 ± 21.556BCa491.544 ± 22.390BCDa615.834 ± 23.961Aa513.435 ± 31.230Ba
Autumn83.378 ± 11.224Cbc92.808 ± 2.466BCc121.463 ± 5.368ABc146.722 ± 10.923Ac138.262 ± 16.974Ac153.552 ± 10.633Ab120.554 ± 4.170ABc
Winter5.003 ± 0.418Cc20.063 ± 0.816Bd21.297 ± 6.254Bd19.283 ± 2.307Bd32.750 ± 1.515Ad15.347 ± 2.192Bc24.763 ± 3.564ABd
Gs299.579 ± 47.196Ca326.703 ± 6.949Ca357.814 ± 6.843BCa435.952 ± 8.252ABa420.000 ± 21.039ABa492.280 ± 23.938Aa421.820 ± 26.689ABa
Ngs26.743 ± 2.048Db46.825 ± 1.261Cb63.944 ± 6.477BCb72.707 ± 2.705ABb87.042 ± 12.142Ab76.979 ± 8.340ABb71.291 ± 3.665ABb
Aa140.425 ± 20.629D163.441 ± 3.610CD186.387 ± 5.151BC224.057 ± 2.277AB225.773 ± 15.610A250.023 ± 14.472A217.343 ± 9.122AB
Note: The different lowercase letters after numerical values indicate statistically significant differences within treatments among different seasons. The different capital letters after numerical values indicate statistically significant differences within seasons among different treatments. Abbreviations: Gs—Growing Season; Ngs—Non-growing Season; Aa—Annual average.
Table 5. Correlations between CH4 and CO2 fluxes and environmental temperature and soil volume water content in seven types of vegetation at the Maoershan Ecosystem Research Station in Northeast China.
Soil Layer/cmSample Site
OMFKPPHWFBPFPDFMDFMOF
CH4temperatureAir T−0.632 **−0.791 **−0.525 **−0.629 **−0.722 **−0.375 *−0.419 *
0−0.612 **−0.855 **−0.692 **−0.732 **−0.777 **−0.590 **−0.465 **
5−0.588 **−0.840 **−0.688 **−0.725 **−0.772 **−0.592 **−0.512 **
10−0.564 **−0.822 **−0.685 **−0.730 **−0.780 **−0.611 **−0.543 **
15−0.557 **−0.817 **−0.707 **−0.727 **−0.779 **−0.630 **−0.561 **
20−0.550 **−0.803 **−0.705 **−0.727 **−0.777 **−0.651 **−0.582 **
25−0.497 **−0.789 **−0.691 **−0.725 **−0.774 **−0.662 **−0.584 **
30−0.532 **−0.777 **−0.705 **−0.726 **−0.778 **−0.667 **−0.592 **
40−0.496 **−0.747 **−0.284 **−0.723 **−0.774 **−0.682 **−0.616 **
soil volume water content00.084 ns0.769 **−0.284 ns−0.308 ns−0.387 *0.077 ns−0.349 ns
50.007 ns0.750 **−0.404 *−0.456 **−0.470 **0.100 ns−0414 *
100.056 ns0.766 **−0.402 *−0.503 **−0.612 **0.030 ns−0.452 *
150.048 ns0.831 **−0.598 **−0.679 **−0.738 **−0.544 **−0.513 **
20−0.191 ns0.789 **−0.601 **−0.706 **−0.763 **−0.548 **−0.521 **
25−0.284 ns0.782 **−0.618 **−0.705 **−0.766 **−0.558 **−0.529 **
30−0.200 ns0.689 **−0.616 **−0.712 **−0.776 **−0.549 **−0.515 **
40−0.167 ns0.622 **−0.596 **−0.705 **−0.762 **−0.536 **−0.502 **
CO2temperatureAir T0.799 **0.780 **0.817 **0.791 **0.827 **0.826 **0.847 **
00.844 **0.930 **0.860 **0.891 **0.894 **0.921 **0.878 **
50.898 **0.939 **0.877 **0.892 **0.912 **0.914 **0.886 **
100.917 **0.927 **0.884 **0.890 **0.900 **0.914 **0.904 **
150.920 **0.932 **0.887 **0.885 **0.899 **0.905 **0.906 **
200.915 **0.932 **0.877**0.883 **0.890 **0.899 **0.900 **
250.820 **0.922 **0.879 **0.879 **0.887 **0.895 **0.899 **
300.903 **0.910 **0.871 **0.874 **0.885 **0.879 **0.897 **
400.882 **0.892 **0.856 **0.863 **0.873 **0.875 **0.889 **
soil volume water content0−0.269 ns−0.321 ns0.318 ns0.395 *0.591 **0.116ns0.724 **
5−0.052 ns−0.513 *0.175 ns0.445 *0.677 **0.132 ns0.741 **
10−0.057 ns−0.612 **0.151 ns0.482 **0.652 **0.303 ns0.763 **
15−0.088 ns−0.475 ns−0.434 *0.685 **0.761 **0.905 **0.826 **
200.004 ns−0.479 ns−0.443 *0.689 **0.748 **0.912 **0.814 **
250.009 ns−0.364 ns−0.449 *0.706 **0.734 **0.912 **0.811 **
30−0.222 ns−0.352 ns−0.434 *0.722 **0.727 **0.918 **0.826 **
40−0.257 ns−0.495 *−0.421 *0.742 **0.753 **0.913 **0.784 **
Note: No significant relationships were observed between CH4 and CO2 fluxes and pH, NO3-N, NH4+-N, and SOC. Therefore, the results are not listed in the table. ns: not significant; * p < 0.05 level of significant; ** p < 0.01 level of significant.
Table 6. The driving factors of CH4 and CO2 fluxes in seven types of vegetation at the Maoershan Ecosystem Research Station in Northeast China.
PlotATSTSVWCpHNO3-NNH4+-NSOCInterceptR2p
Models for soil CH4
OMF −0.056 + −0.008 *−0.005 **0.587 *0.663<0.05
KPP−0.002 * 0.002 + 0.004 *0.001 + −0.129 **0.842<0.01
HWF0.003 *−0.007 * −0.045 *0.612<0.05
BPF −0.004 **0.002 * 0.198 *** −0.003 +−0.117 *0.927<0.001
PDF−0.003 ** −0.047 ***0.626<0.01
MDF0.004 *−0.007 * −0.057 **0.441<0.1
MOF −0.160 + 0.836 +0.330<0.1
Models for soil CO2
OMF 12.920 ***15.382 * 14.930 + −512.687 *0.891<0.001
KPP 21.477 ***−6.017 *122.783+ −2.275 + −476.7290.973<0.001
HWF 16.692 *** 114.102 ***0.833<0.001
BPF 23.067 *** 57.177 *0.895<0.001
PDF 25.094 ***5.426 +−485.257 + −5.748 +2928.966 *0.944<0.001
MDF−8.155 +33.999 ***11.265 + −10.888 *454.856 *0.936<0.001
MOF−19.018 *49.746 *** −112.542 * −5.259 +388.194 **0.943<0.001
Note: +: indicates significant effects at p < 0.1; *: indicates significant effects at p < 0.05; **: indicates significant effects at p < 0.01; ***: indicates significant effects at p < 0.001. AT—air temperature; ST—soil temperature.
Table 7. Net primary productivity and net C sequestration of seven types of vegetation at the Maoershan Ecosystem Research Station in Northeast China.
uLayerVegetation Types
OMFKPPHWFBPFPDFMDFMOF
Net Primary Productivity (NPP)/(t ha−1 a−1)Arborous layer7.06 ± 1.17B11.44 ± 1.40A8.55 ± 0.51B7.98 ± 0.56B6.99 ± 0.70B8.81 ± 0.72B7.36 ± 0.27B
Shrubby layer0.08 ± 0.02AB0.04 ± 0.01B0.10 ± 0.01A0.07 ± 0.02AB0.08 ± 0.01AB0.10 ± 0.03A0.06 ± 0.01AB
Herbaceous layer1.71 ± 0.98A0.36 ± 0.02A1.34 ± 0.33A1.63 ± 0.71A0.80 ± 0.09A0.64 ± 0.05A0.71 ± 0.09A
Vegetation8.85 ± 0.51B11.84 ± 1.42A9.99 ± 0.49AB9.68 ± 0.82AB7.87 ± 0.62B9.55 ± 0.80AB8.13 ± 0.33B
Annual NetC Sequestration (ANCS)/(t ha−1 a−1)Arborous layer3.52 ± 0.58BC6.08 ± 0.75A4.57 ± 0.27B3.68 ± 0.25BC3.06 ± 0.31C4.42 ± 0.36BC3.50 ± 0.13BC
Shrubby layer0.03 ± 0.01AB0.02 ± 0.01B0.05 ± 0.01A0.03 ± 0.01AB0.03 ± 0.01AB0.05 ± 0.01A0.03 ± 0.01AB
Herbaceous layer0.75 ± 0.43A0.16 ± 0.01A0.59 ± 0.15A0.68 ± 0.29A0.32 ± 0.04A0.30 ± 0.02A0.32 ± 0.04A
Vegetation4.30 ± 0.27BCD6.26 ± 0.75A5.21 ± 0.25AB4.38 ± 0.35BCD3.41 ± 0.27D4.76 ± 0.40BC3.85 ± 0.16CD
Note: The different capital letters after numerical values indicate statistically significant differences within NPP or ANCS among different treatments.
Table 8. The carbon source or sink from seven types of vegetation at the Maoershan Ecosystem Research Station in Northeast China.
ItemVegetation Types
OMFKPPHWFBPFPDFMDFMOF
Annual Net C Sequestration (ANCS)/(t ha−1 y−1)4.30 ± 0.27BCD6.26 ± 0.75A5.21 ± 0.25AB4.38 ± 0.35BCD3.41 ± 0.27D4.76 ± 0.40BC3.85 ± 0.16CD
Annual C Emission (ACE)/(t ha−1 y−1)3.15 ± 0.47D3.72 ± 0.08CD4.39 ± 0.12BC5.28 ± 0.05A5.32 ± 0.37A5.89 ± 0.34A5.12 ± 0.21AB
Carbon Source/Sink (CSS)/(t ha−1 y−1)1.15 ± 0.65AB2.54 ± 0.80A0.82 ± 0.15B−0.89 ± 0.30C−1.90 ± 0.64C−1.12 ± 0.25C−1.27 ± 0.37C
Note: The different capital letters after numerical values indicate statistically significant differences within ANCS, ACE, or ANCS among different treatments.

