Housing Indicators for Sustainable Cities in Middle-Income Countries through the Residential Urban Environment Recognized Using Single-Family Housing Rating Systems

 , ,
, ,  , ,
, ,  and
and
Abstract
:
1. Introduction
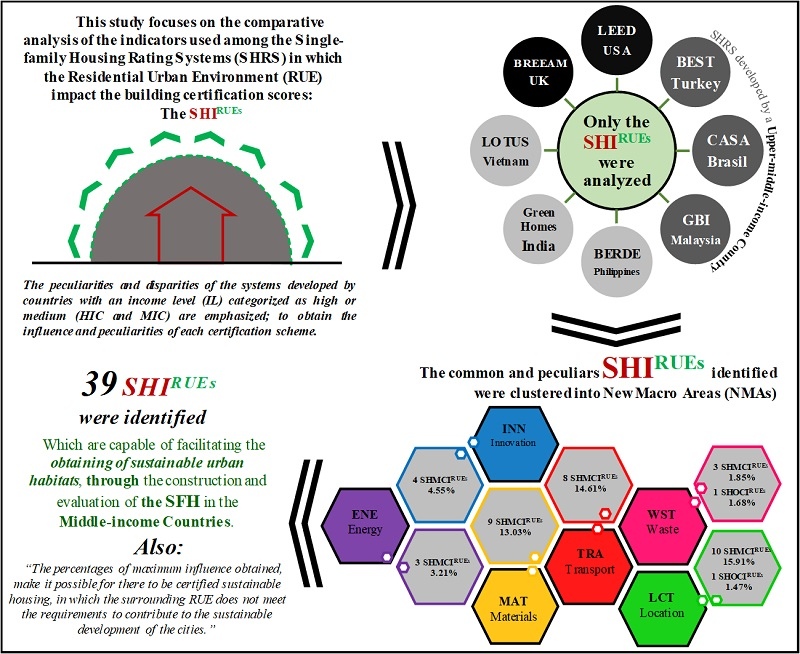
1.1. Background and Research Objectives
1.2. Why Address Single-Family Housing of the Middle-Income Countries through the Residential Urban Environment?
2. Research Method
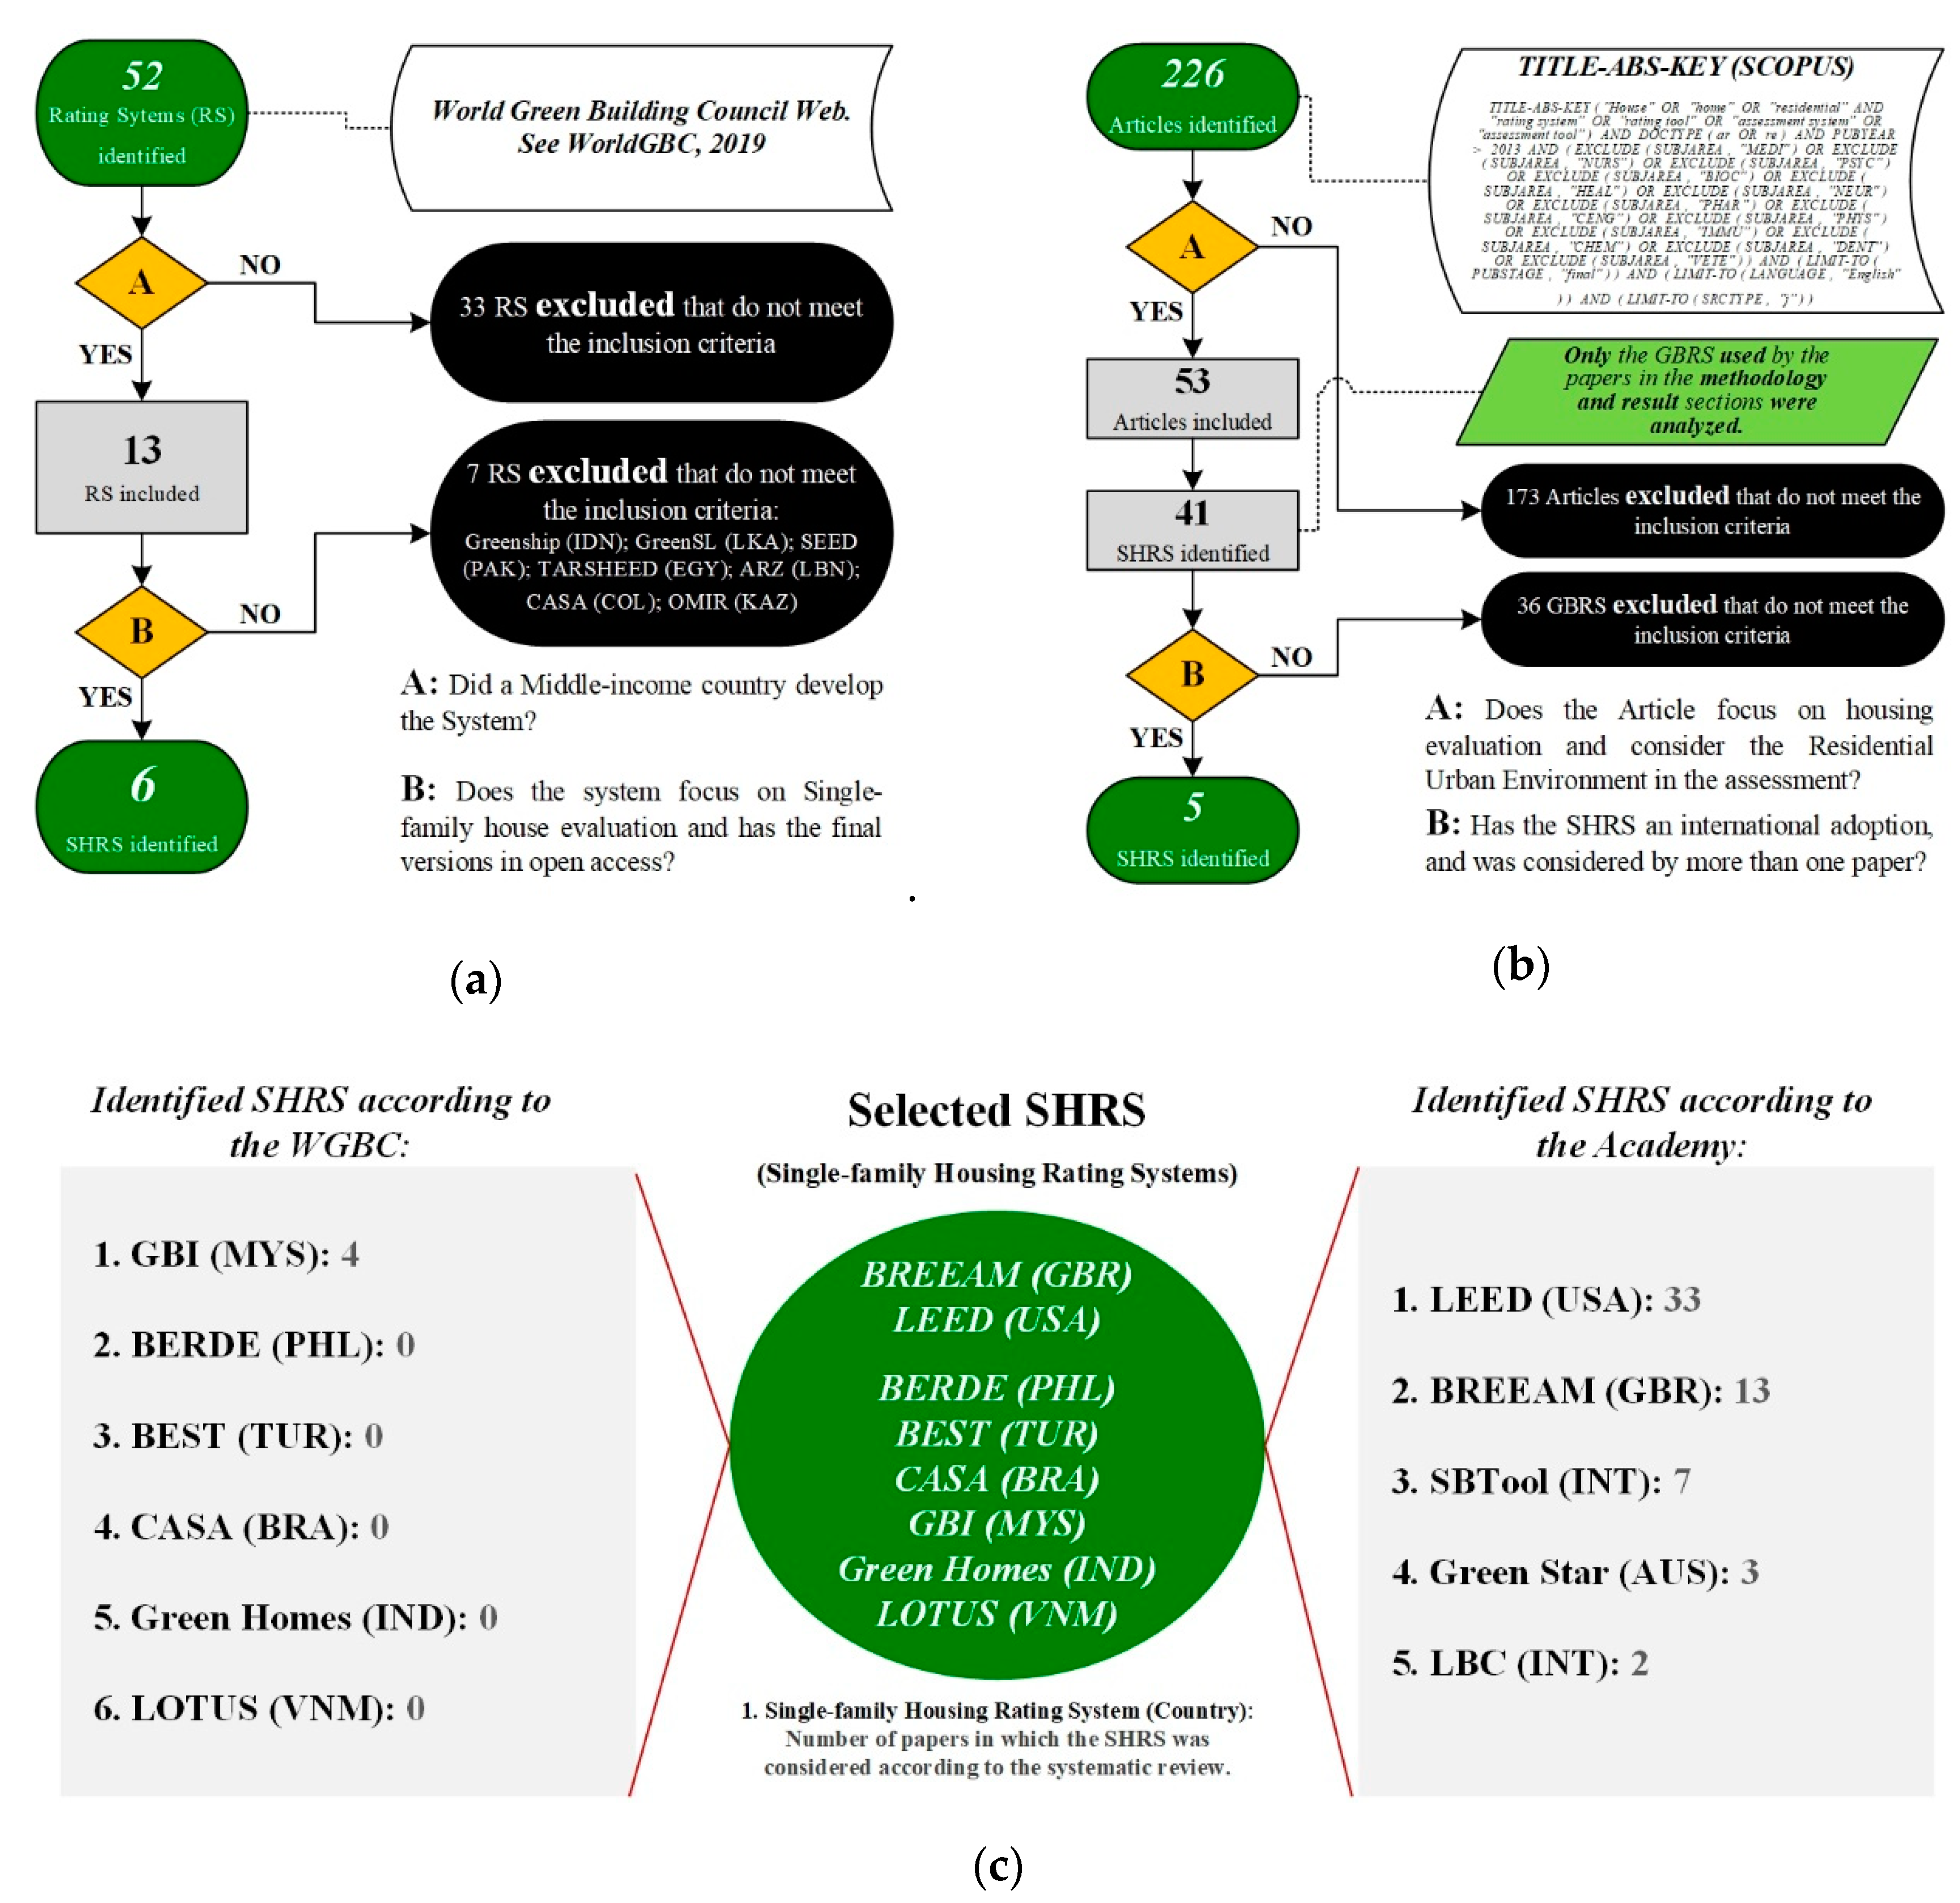
2.1. Definition of the Rating Systems
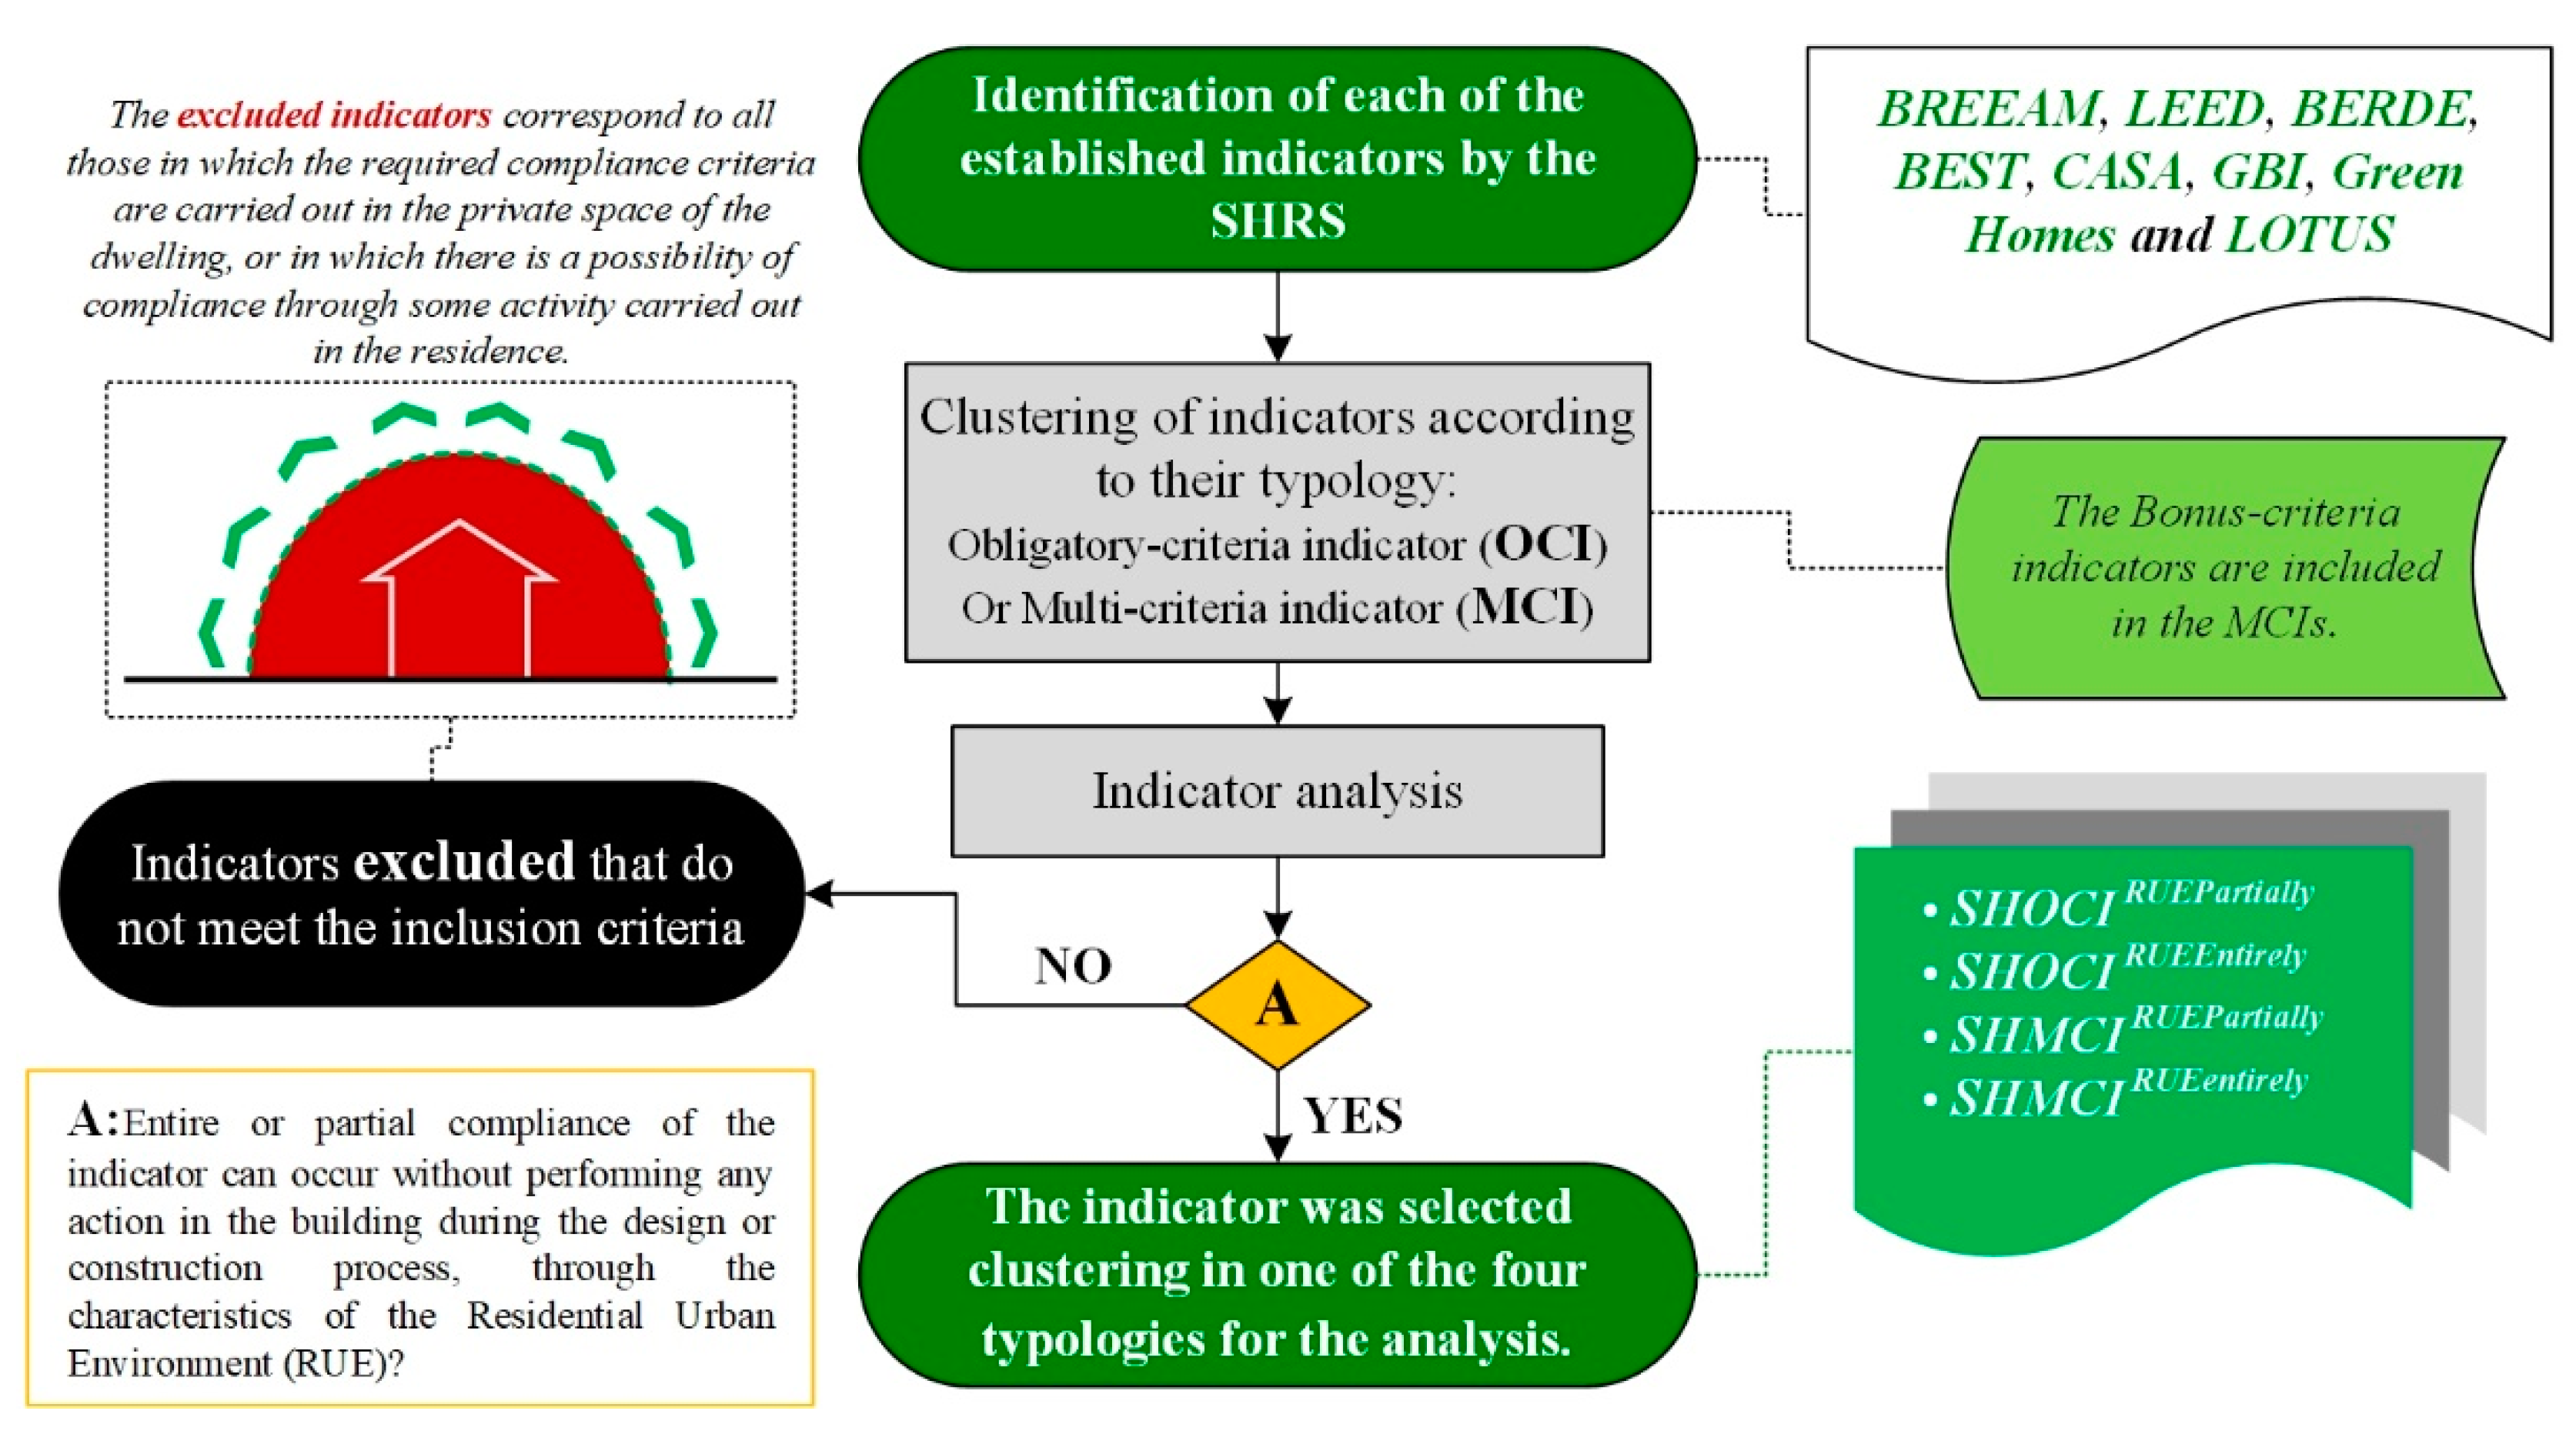
2.2. Selection of the Single-Family Housing Indicators That Focuses on the Residential Urban Environment
2.3. Obtainment of the Values of the SHIRUEs
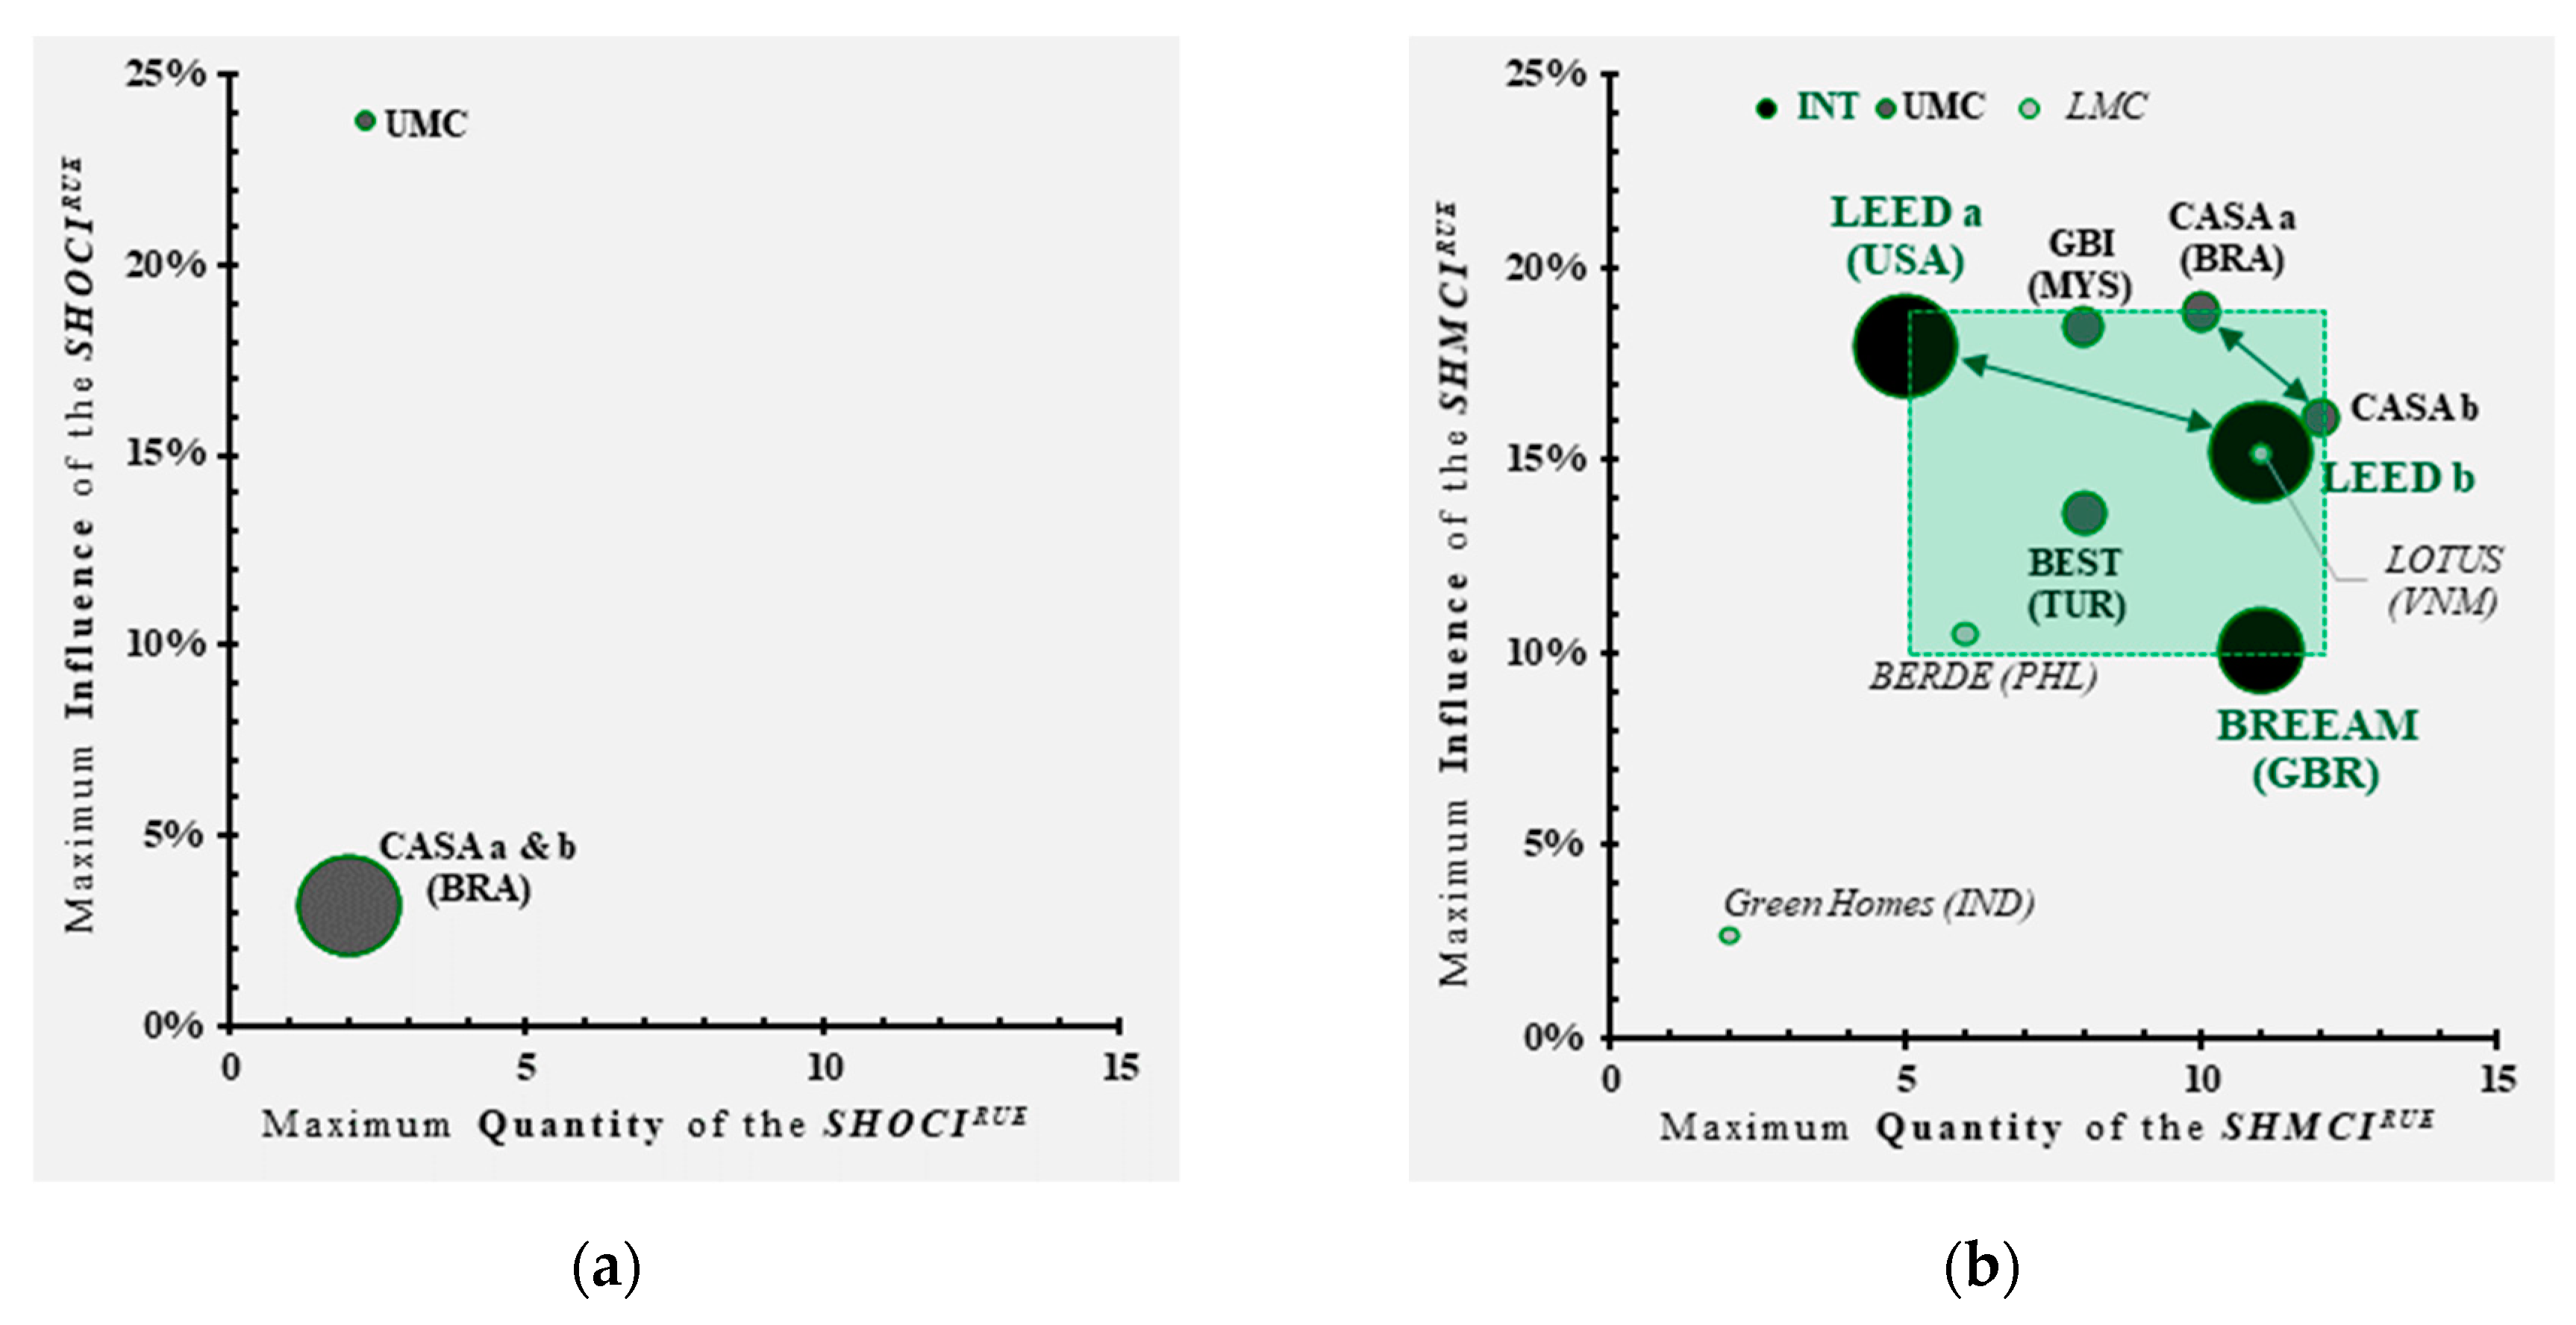
2.4. Comparative Analysis and Description of the SHIRUEs Identified
3. Results and Discussion
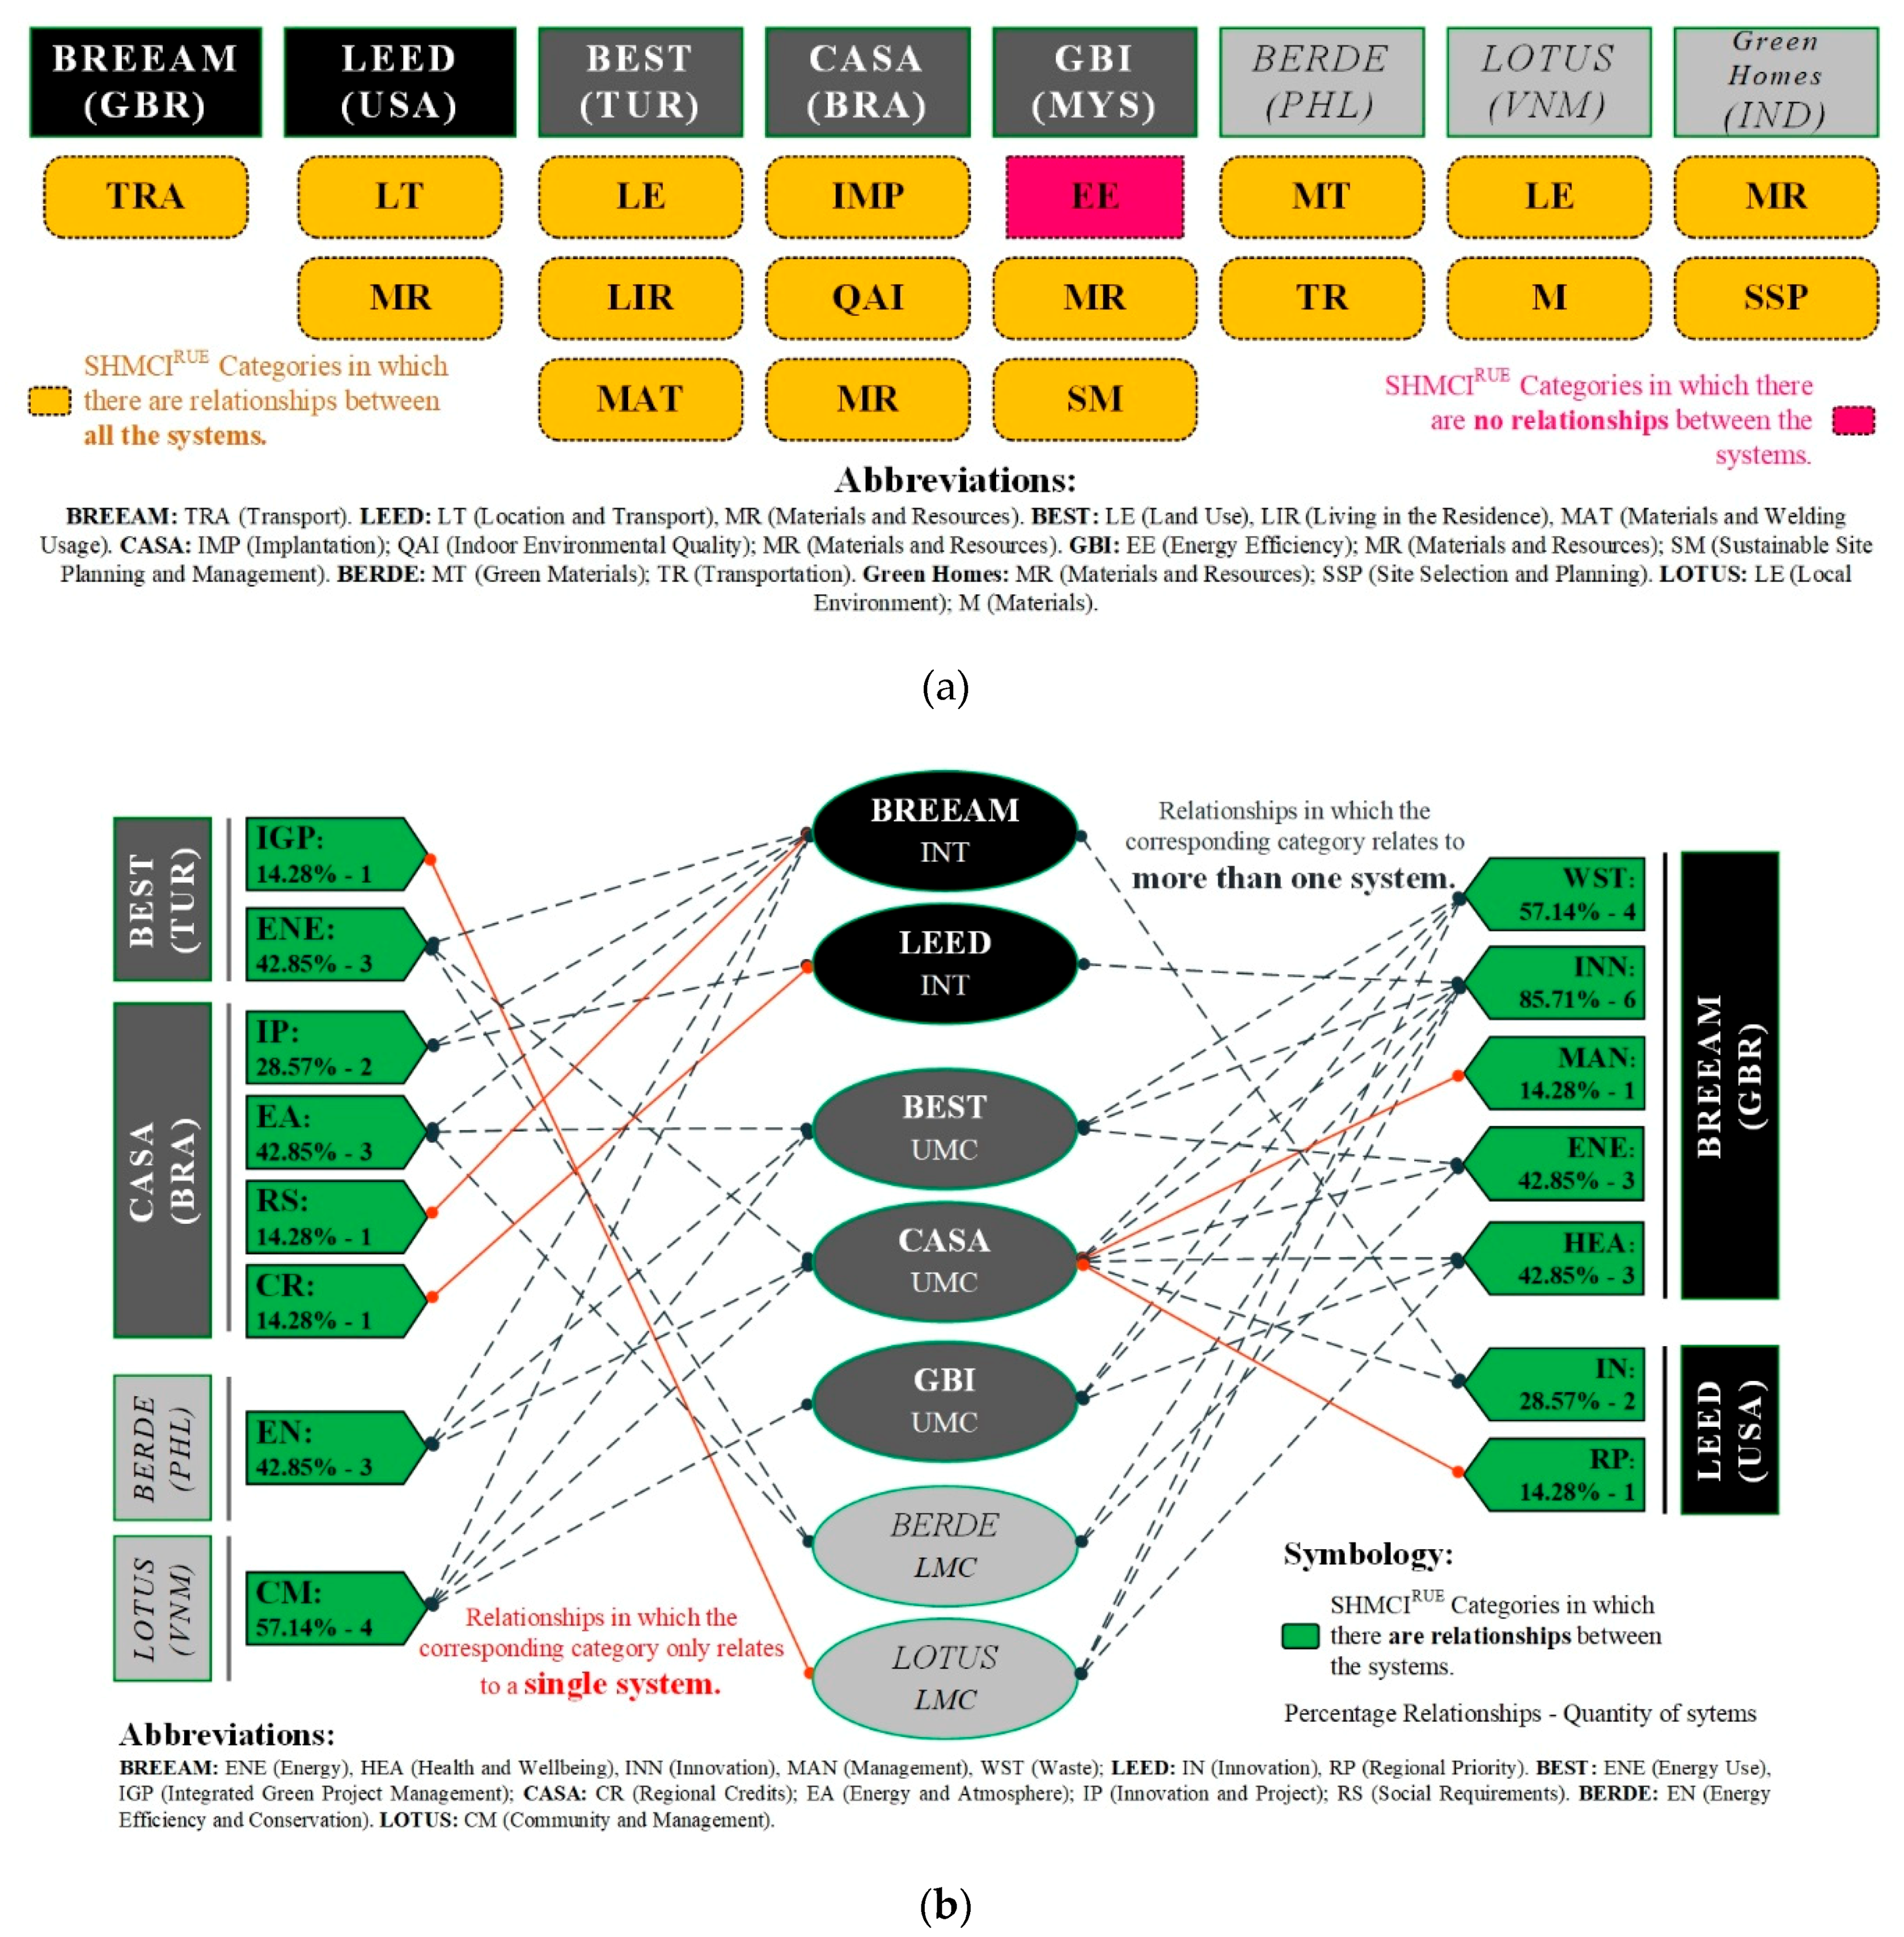
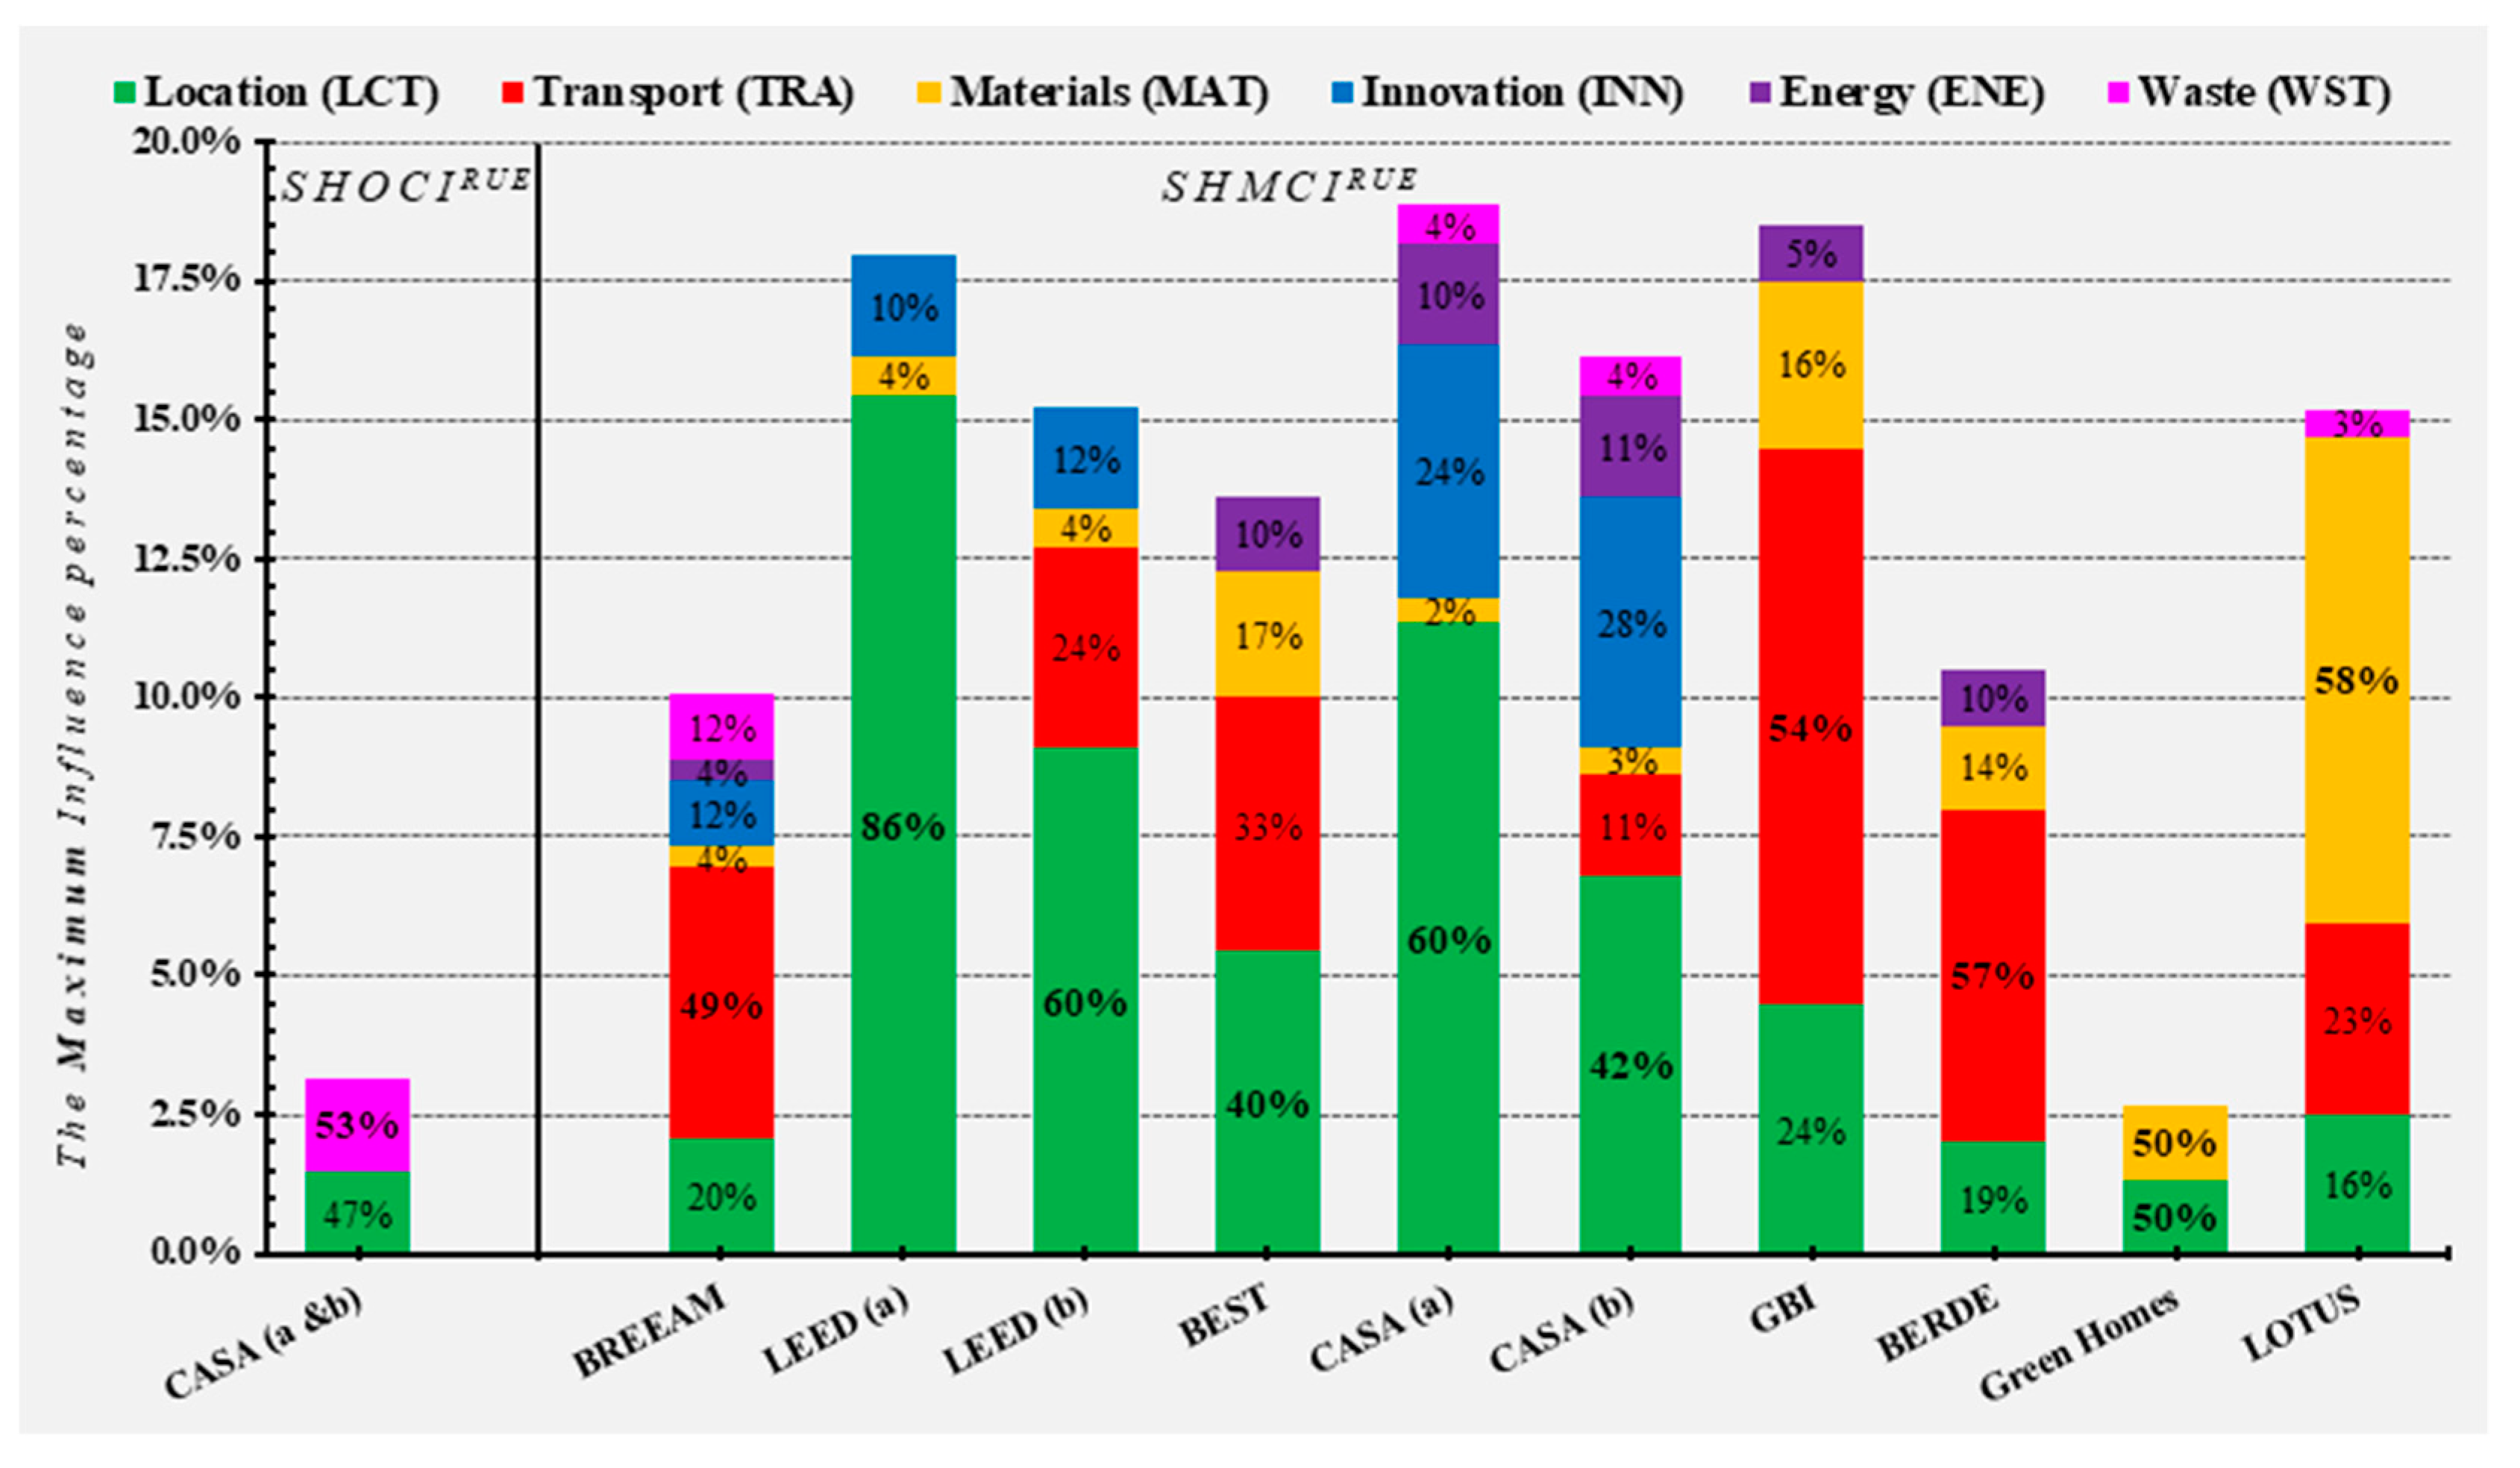
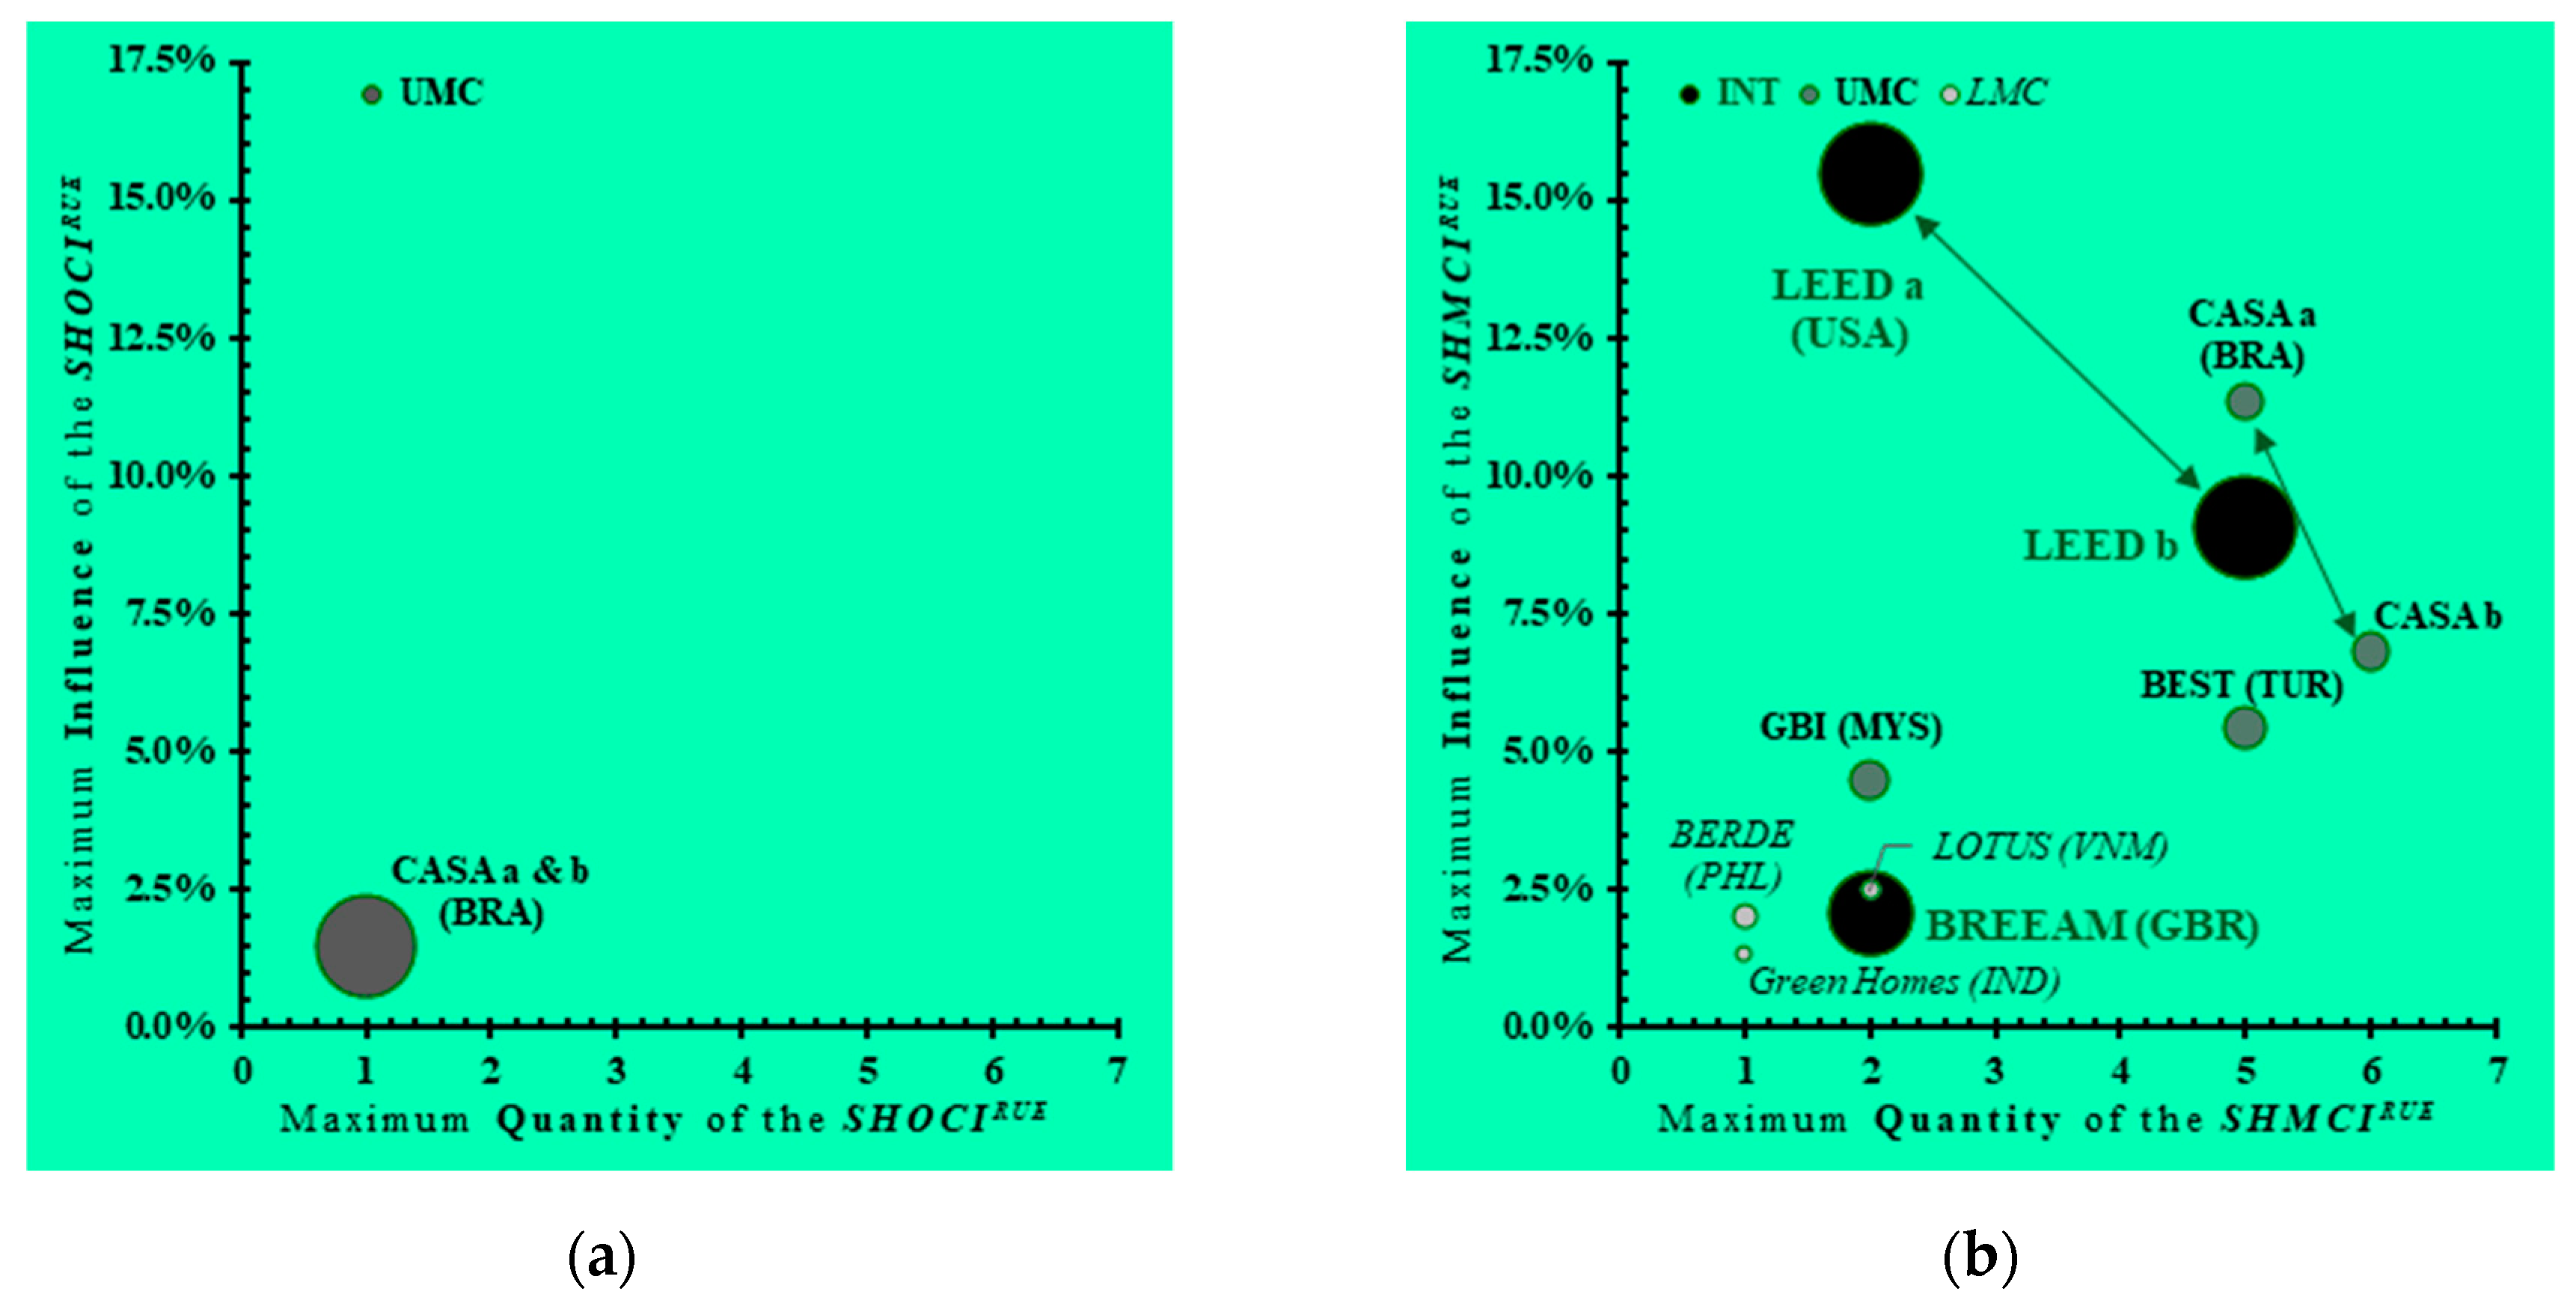
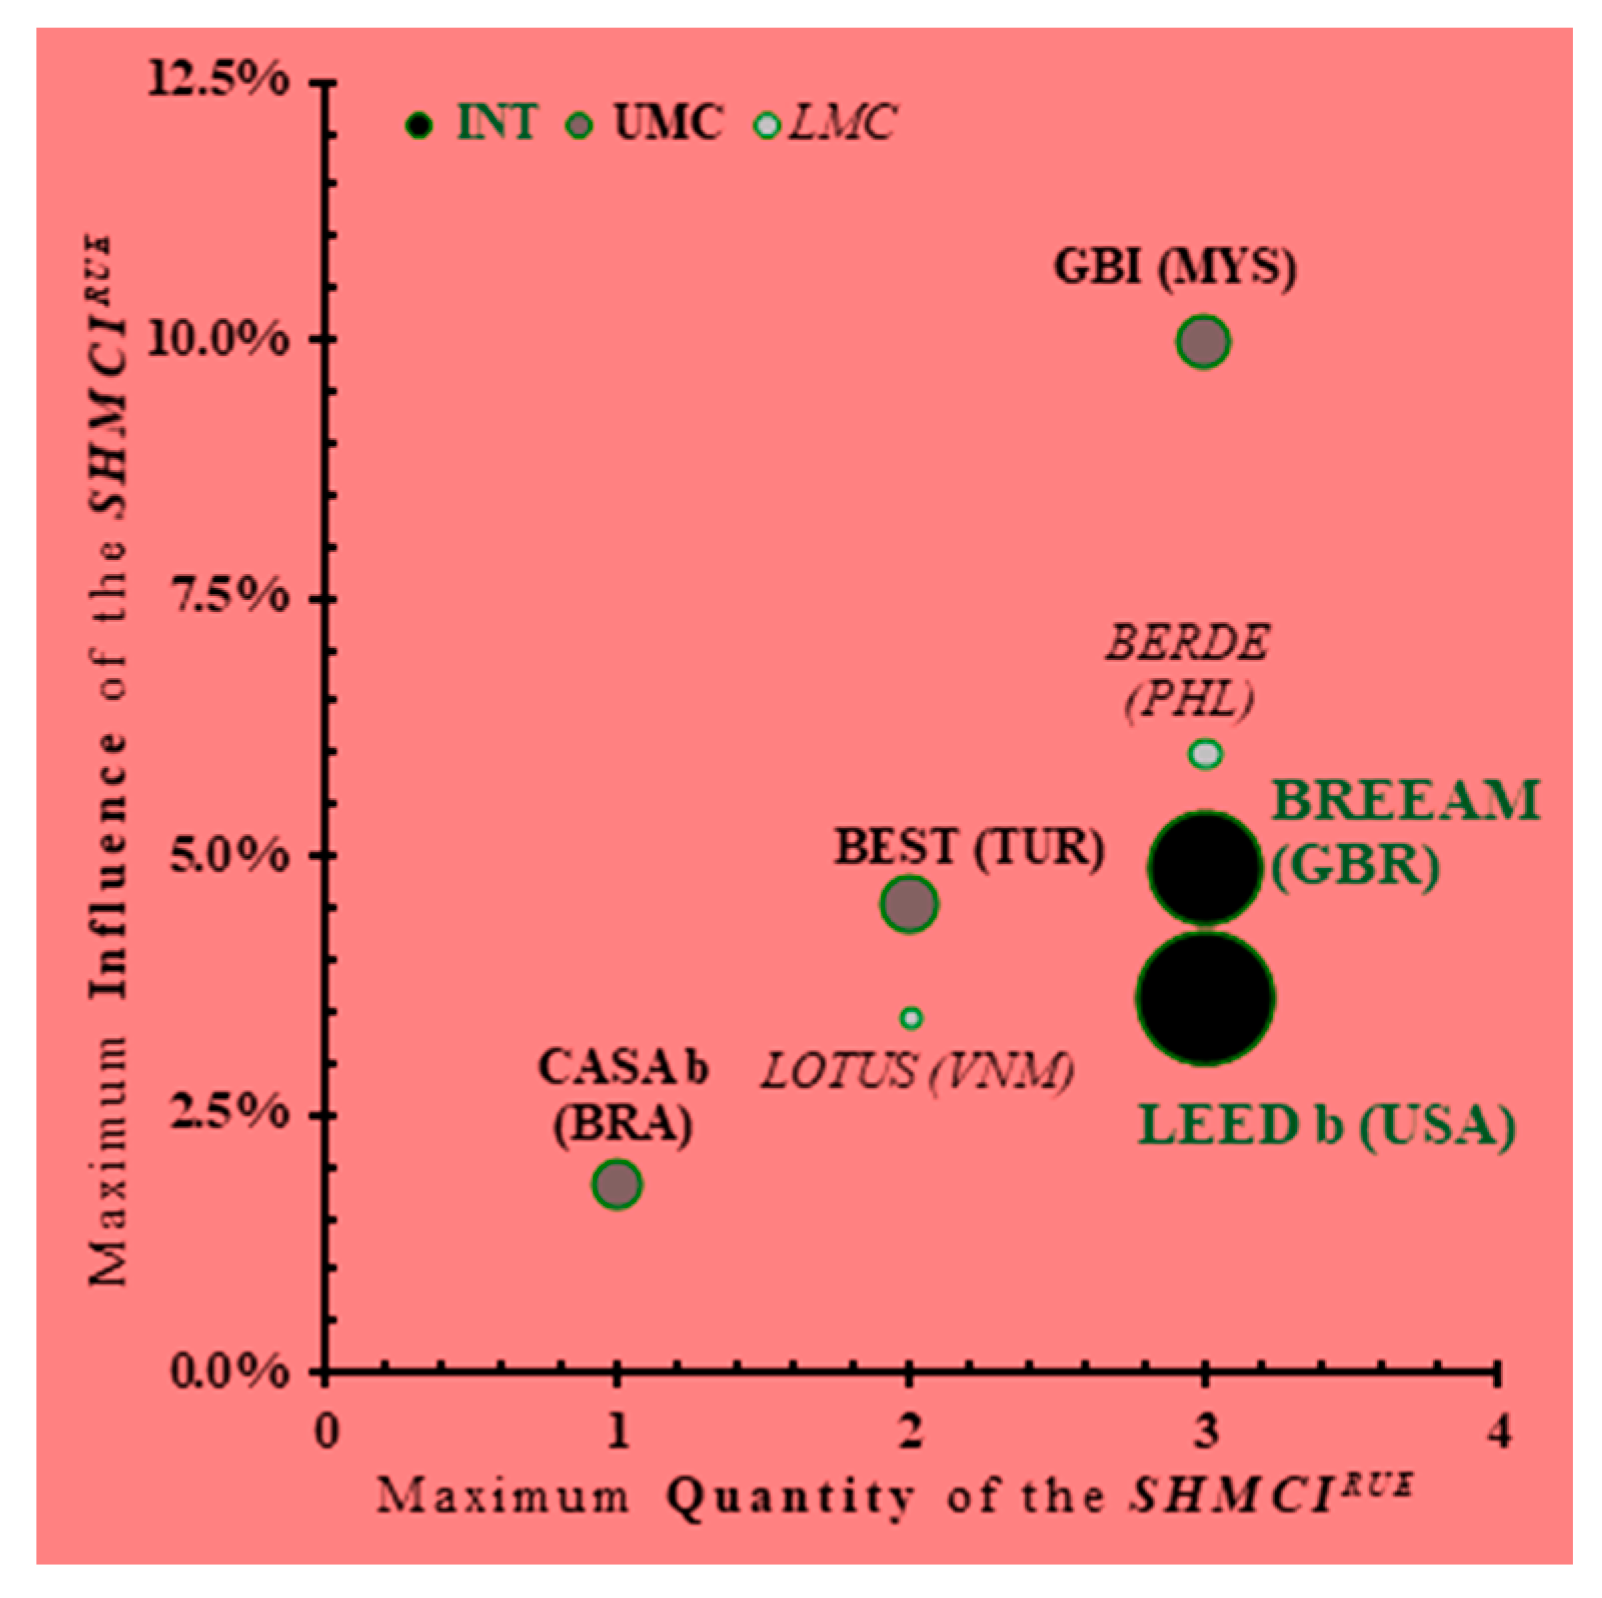
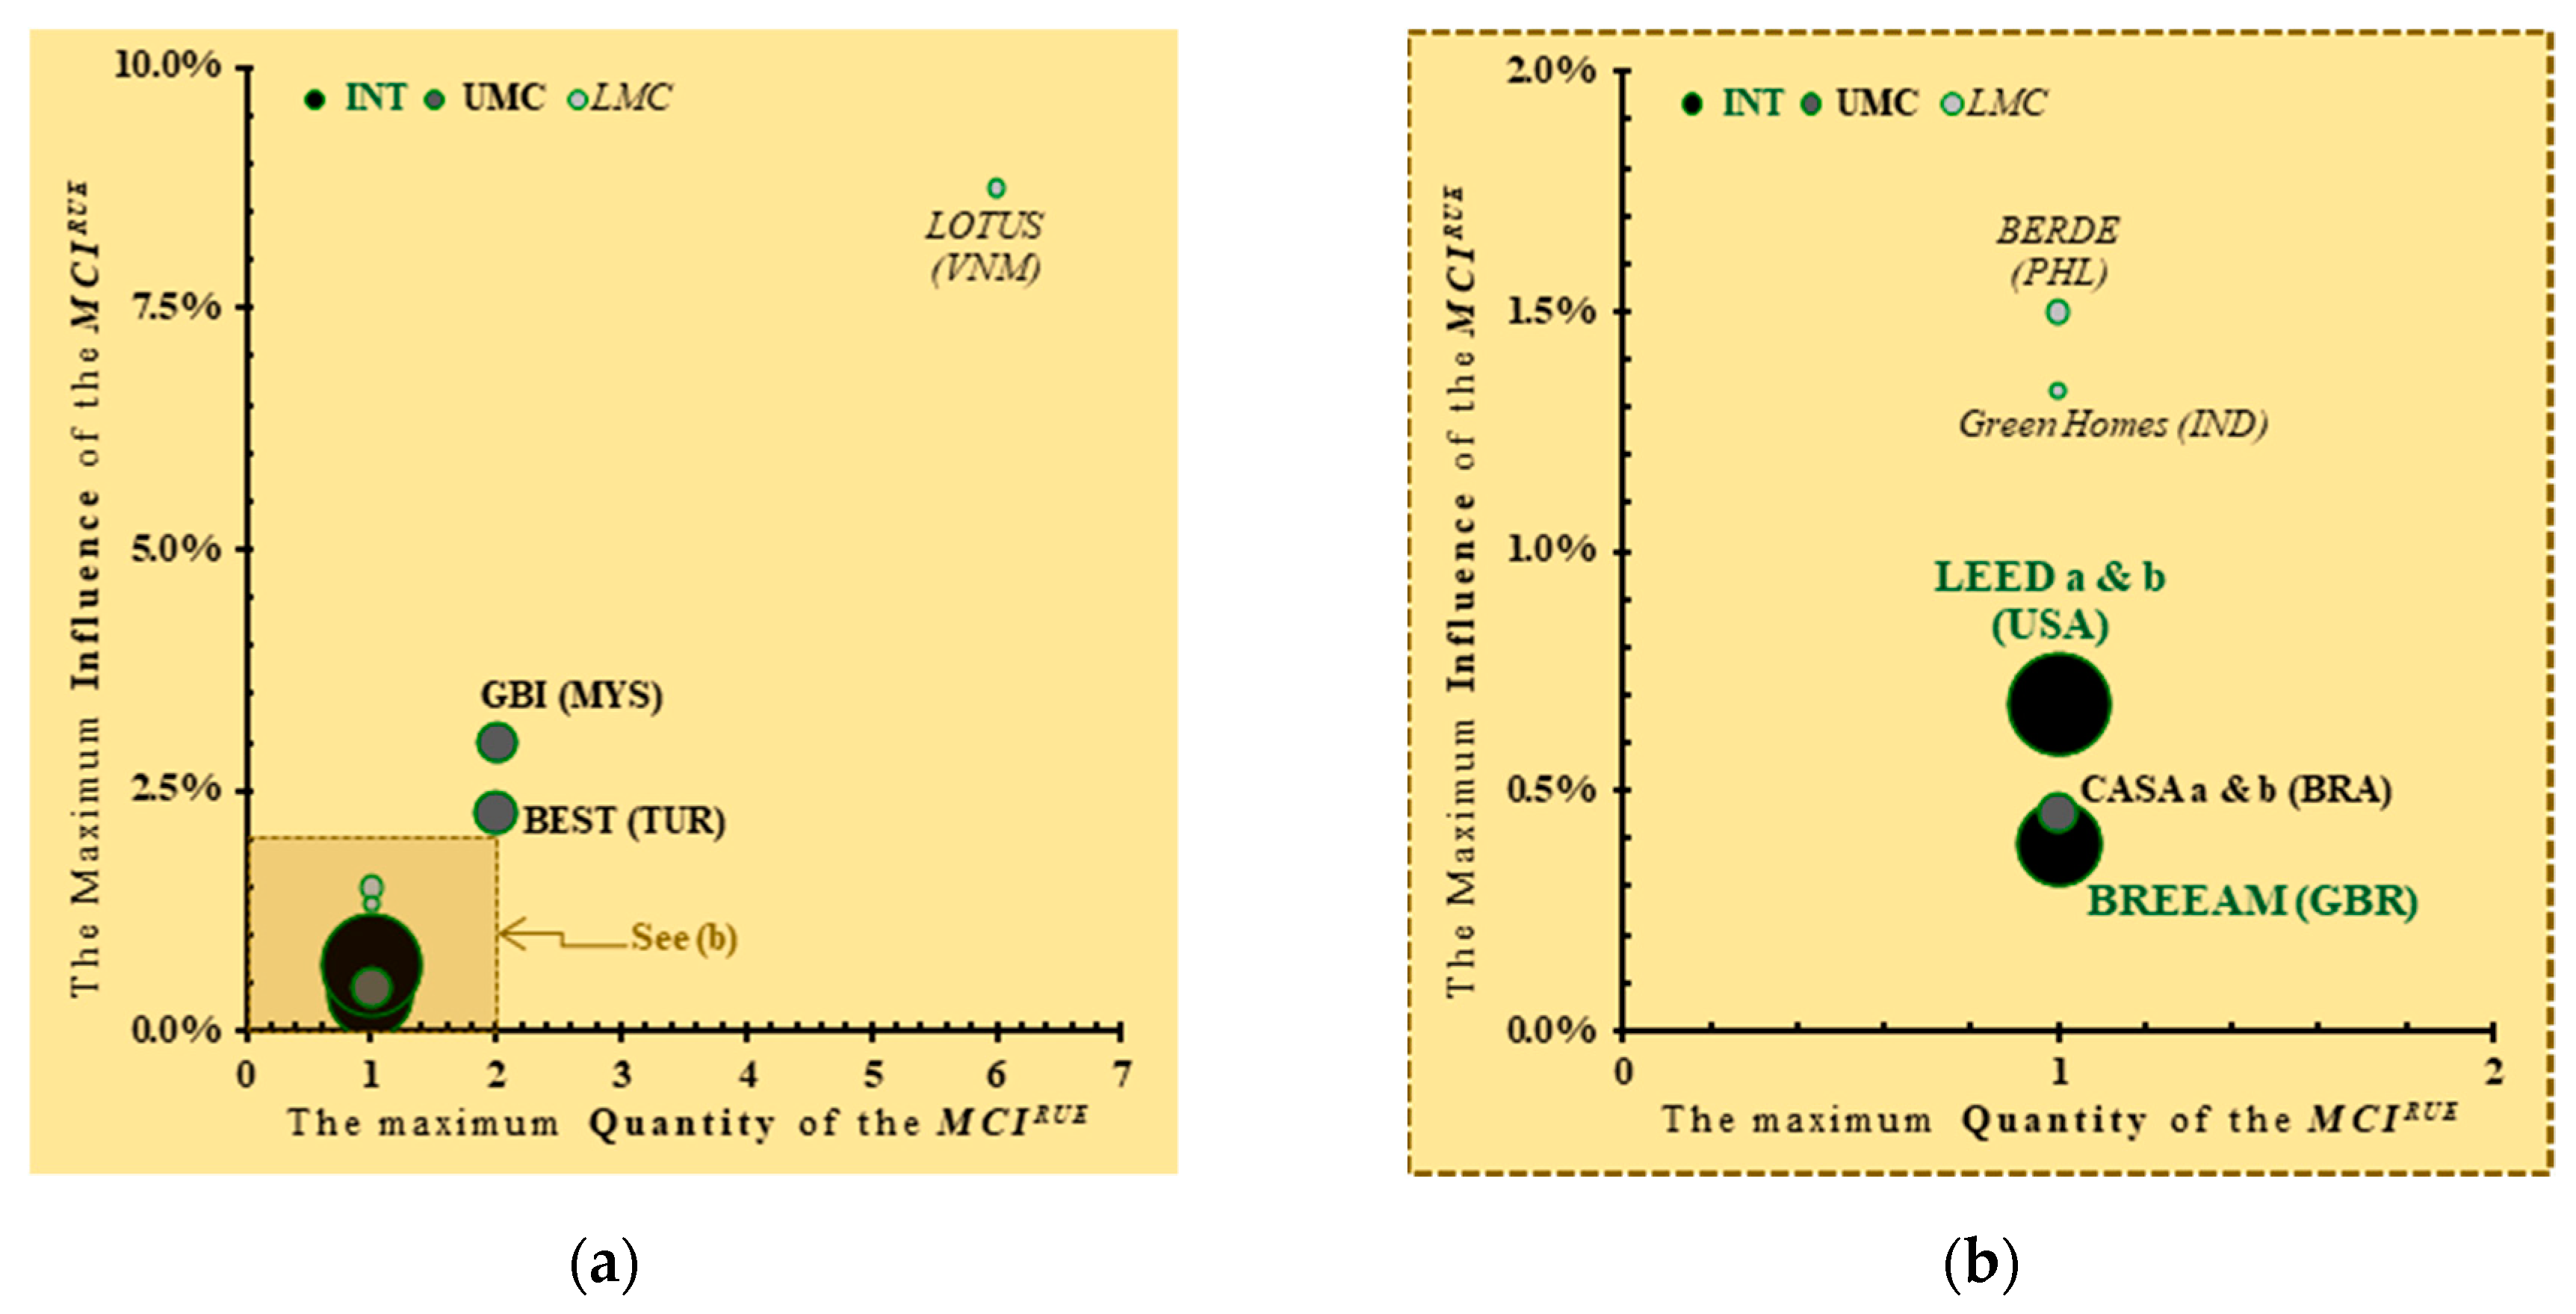
3.1. The RUE Recognized by the SHRSs: Their Influence and Relationships among the Schemes
3.2. The SHIRUEs Identified for Sustainable Cities in the Middle-Income Countries
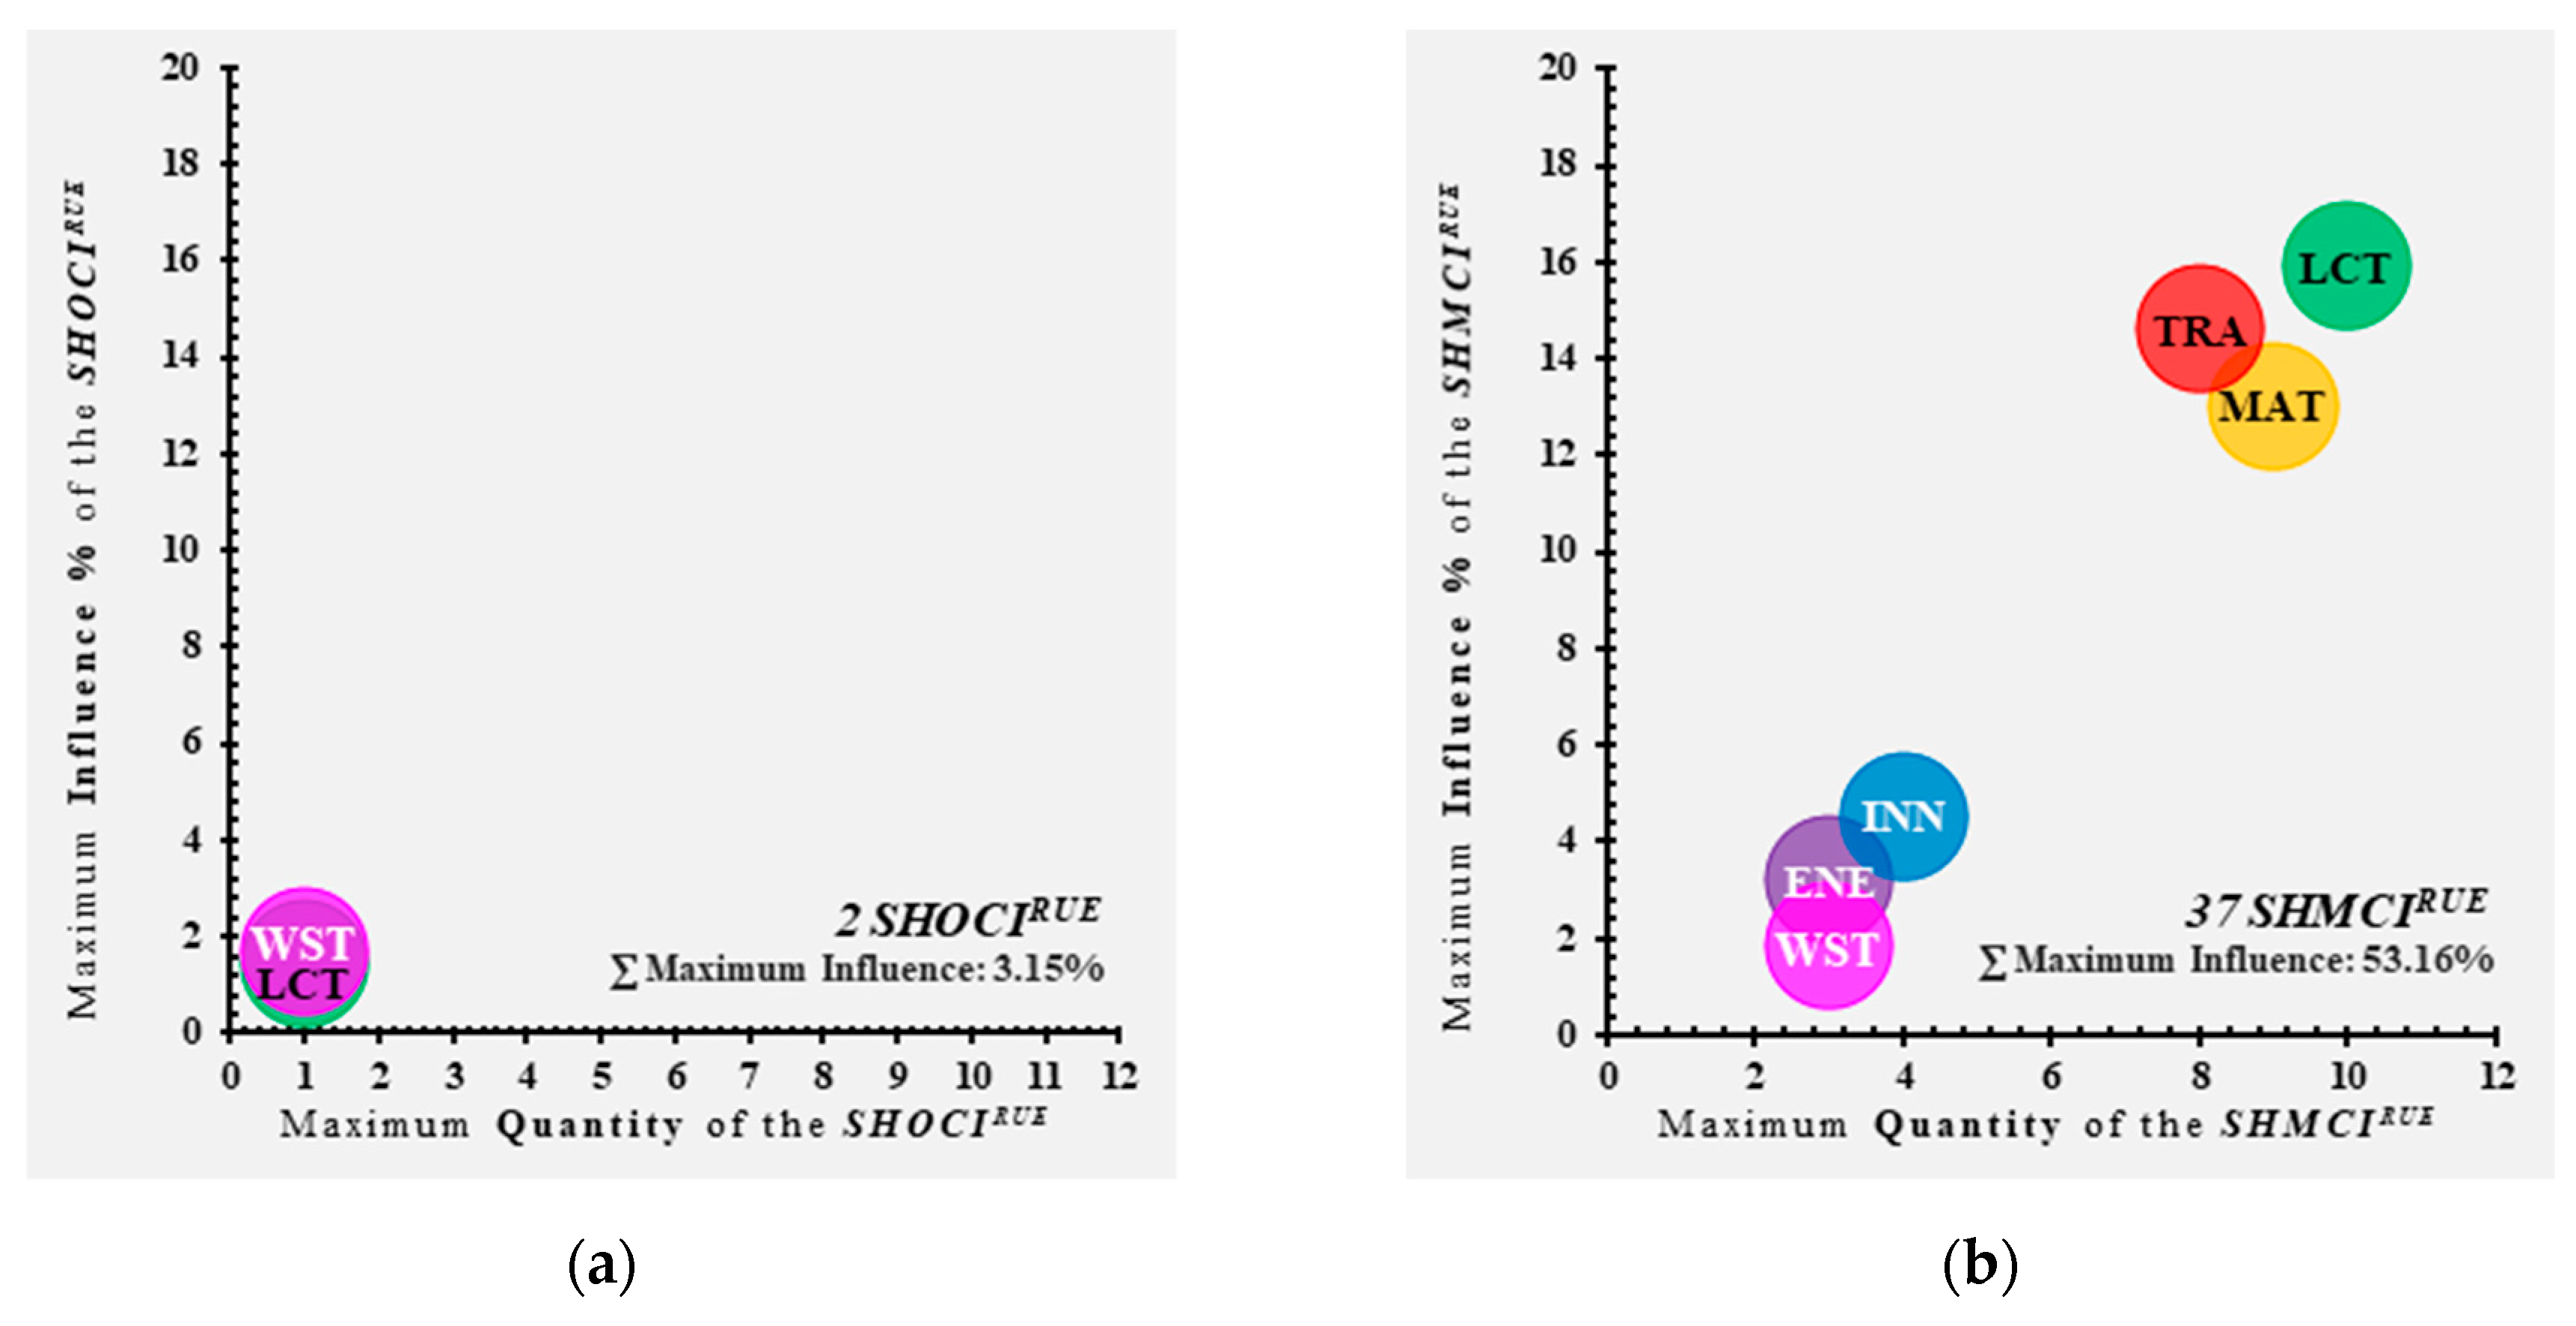
3.2.1. The SHOCIRUEs Identified for Sustainable Cities in the Middle-Income Countries
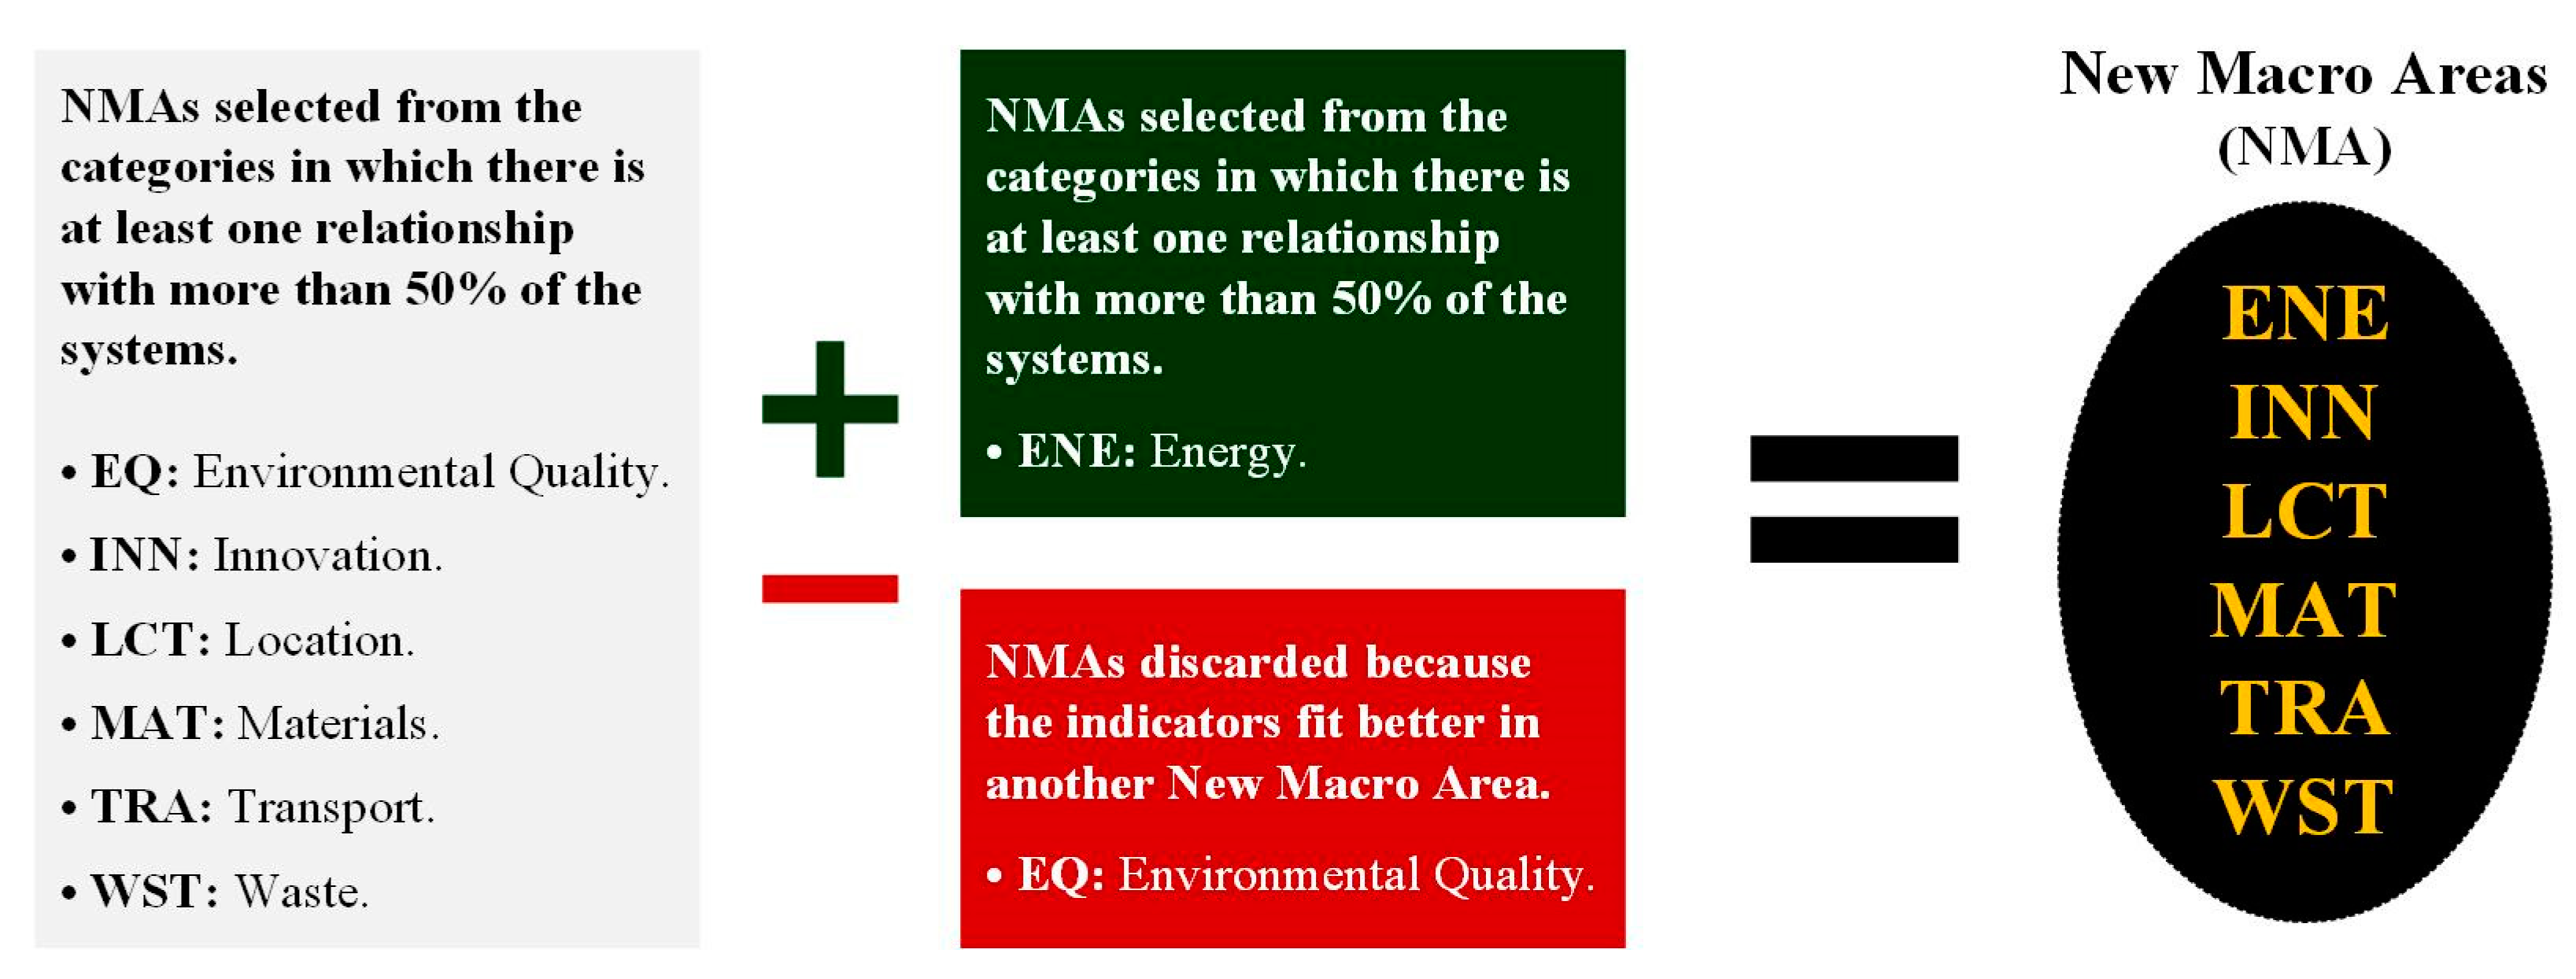
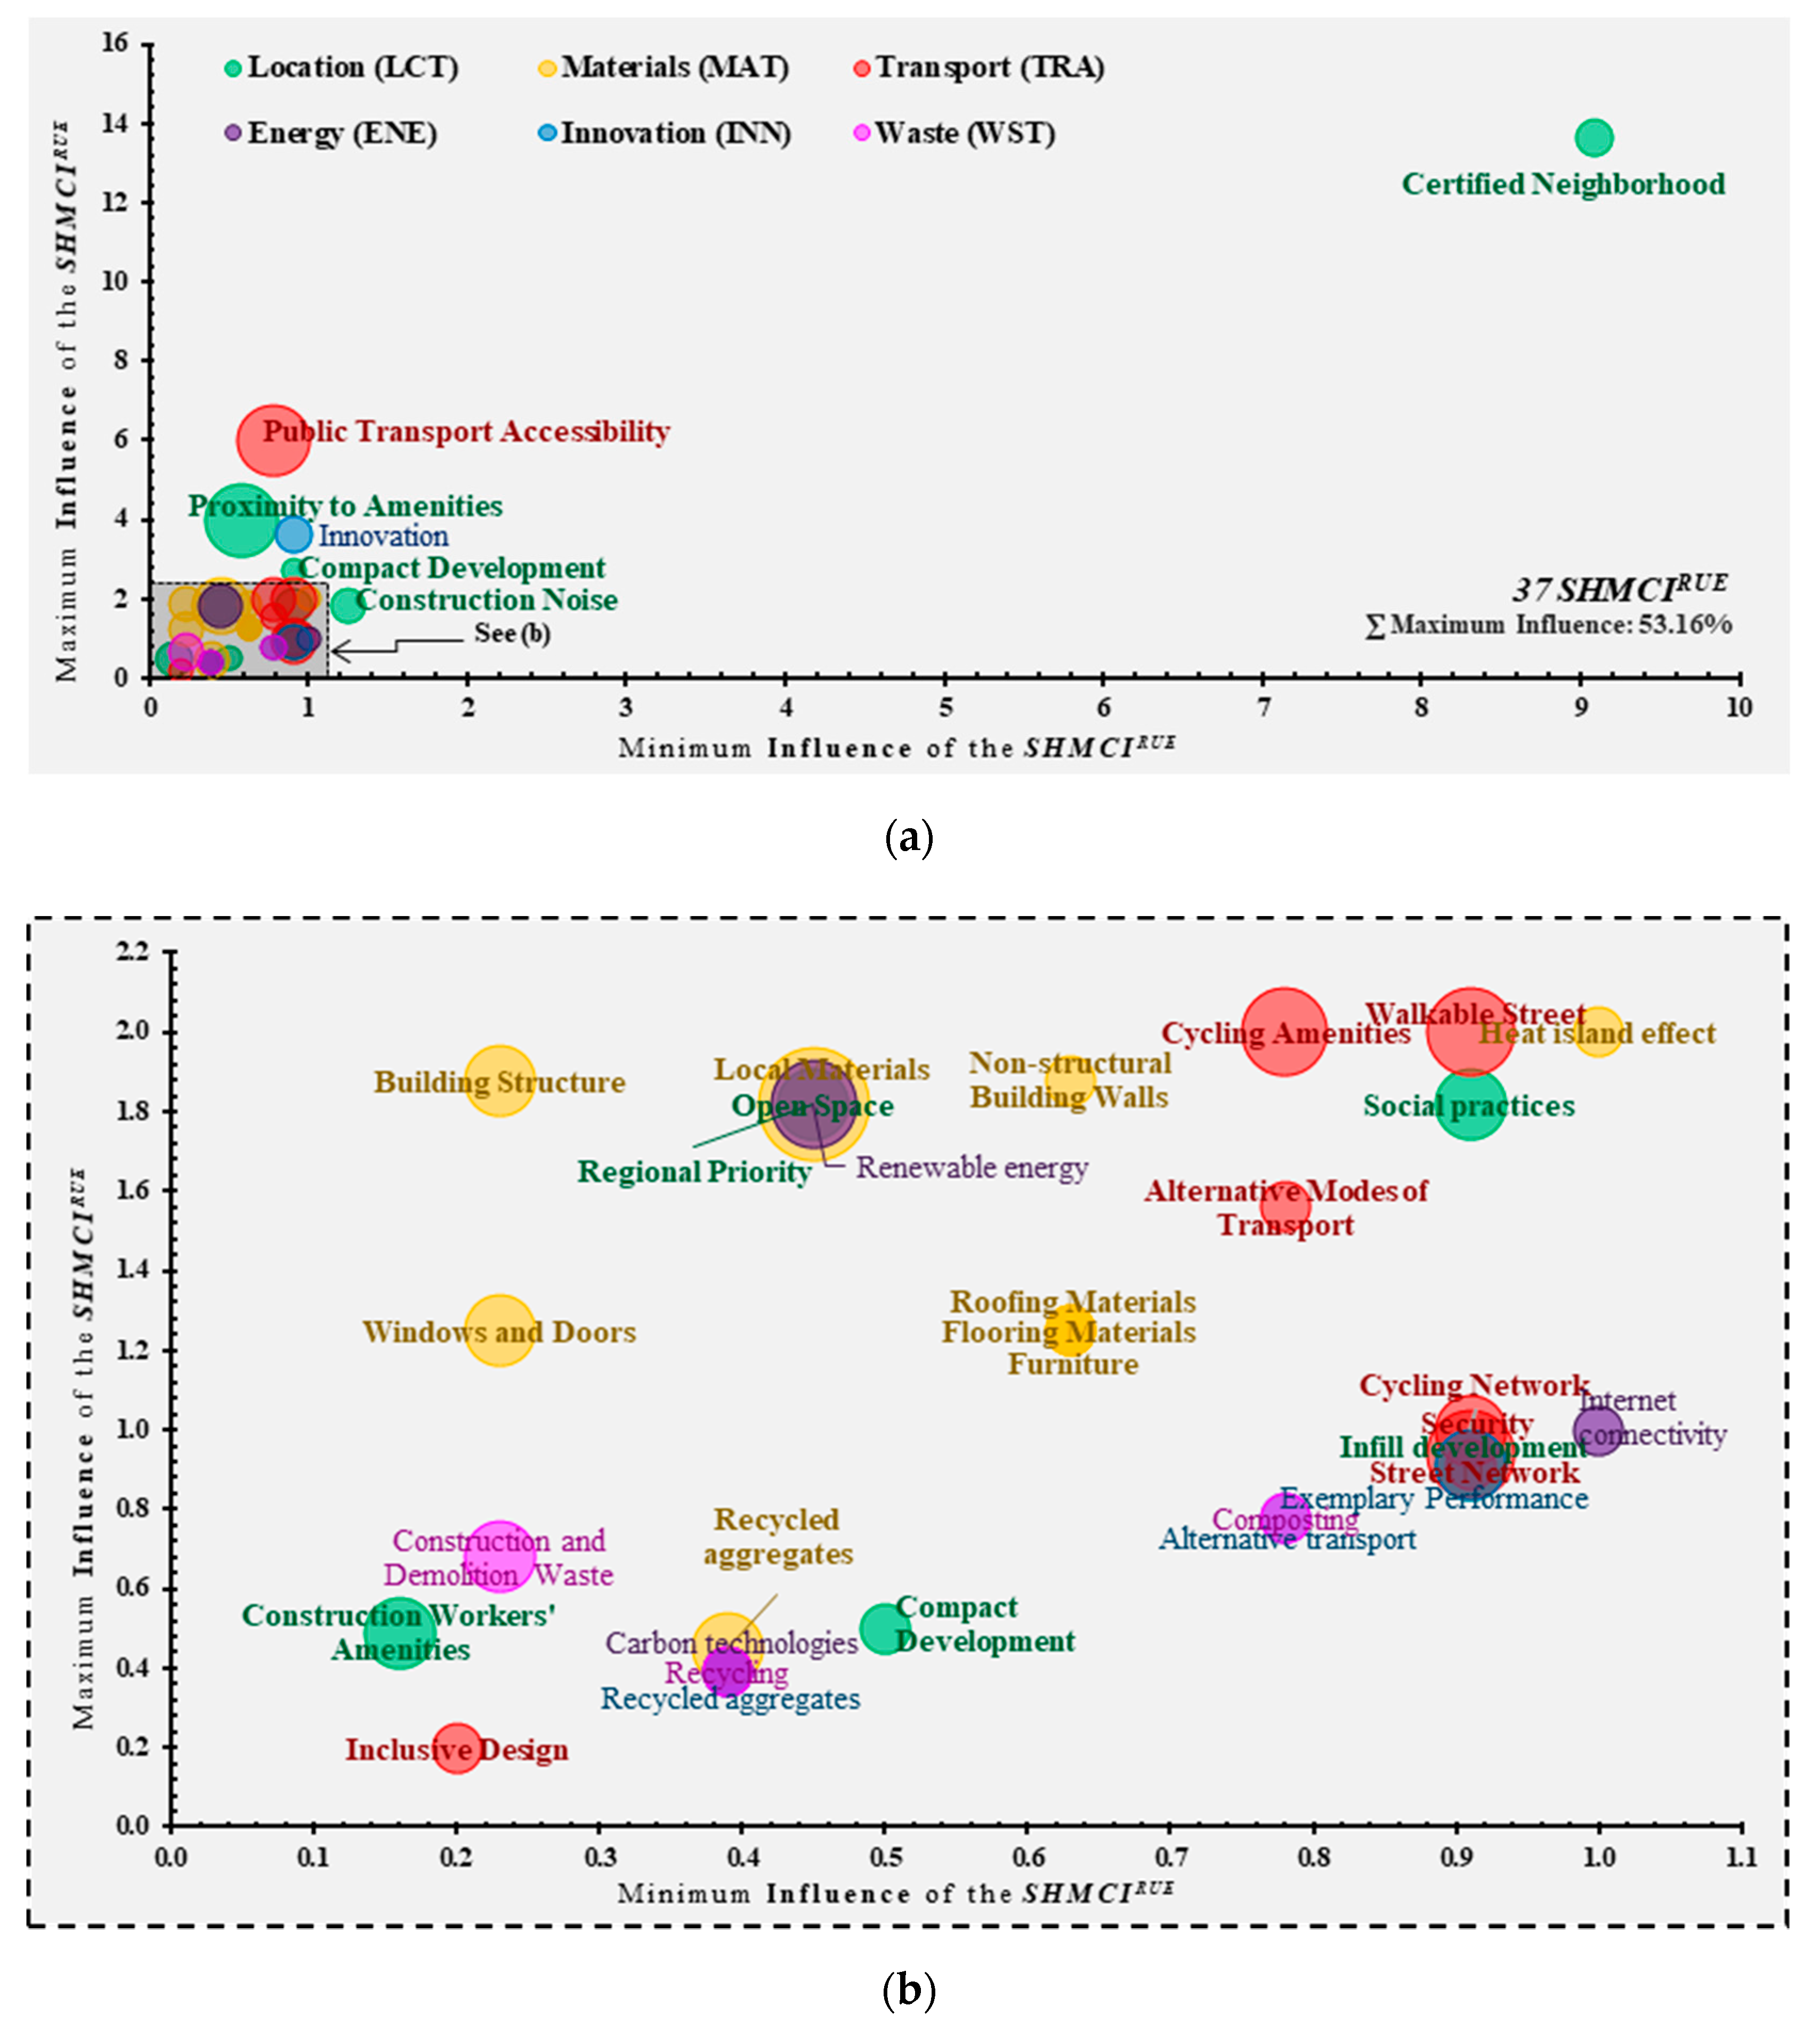
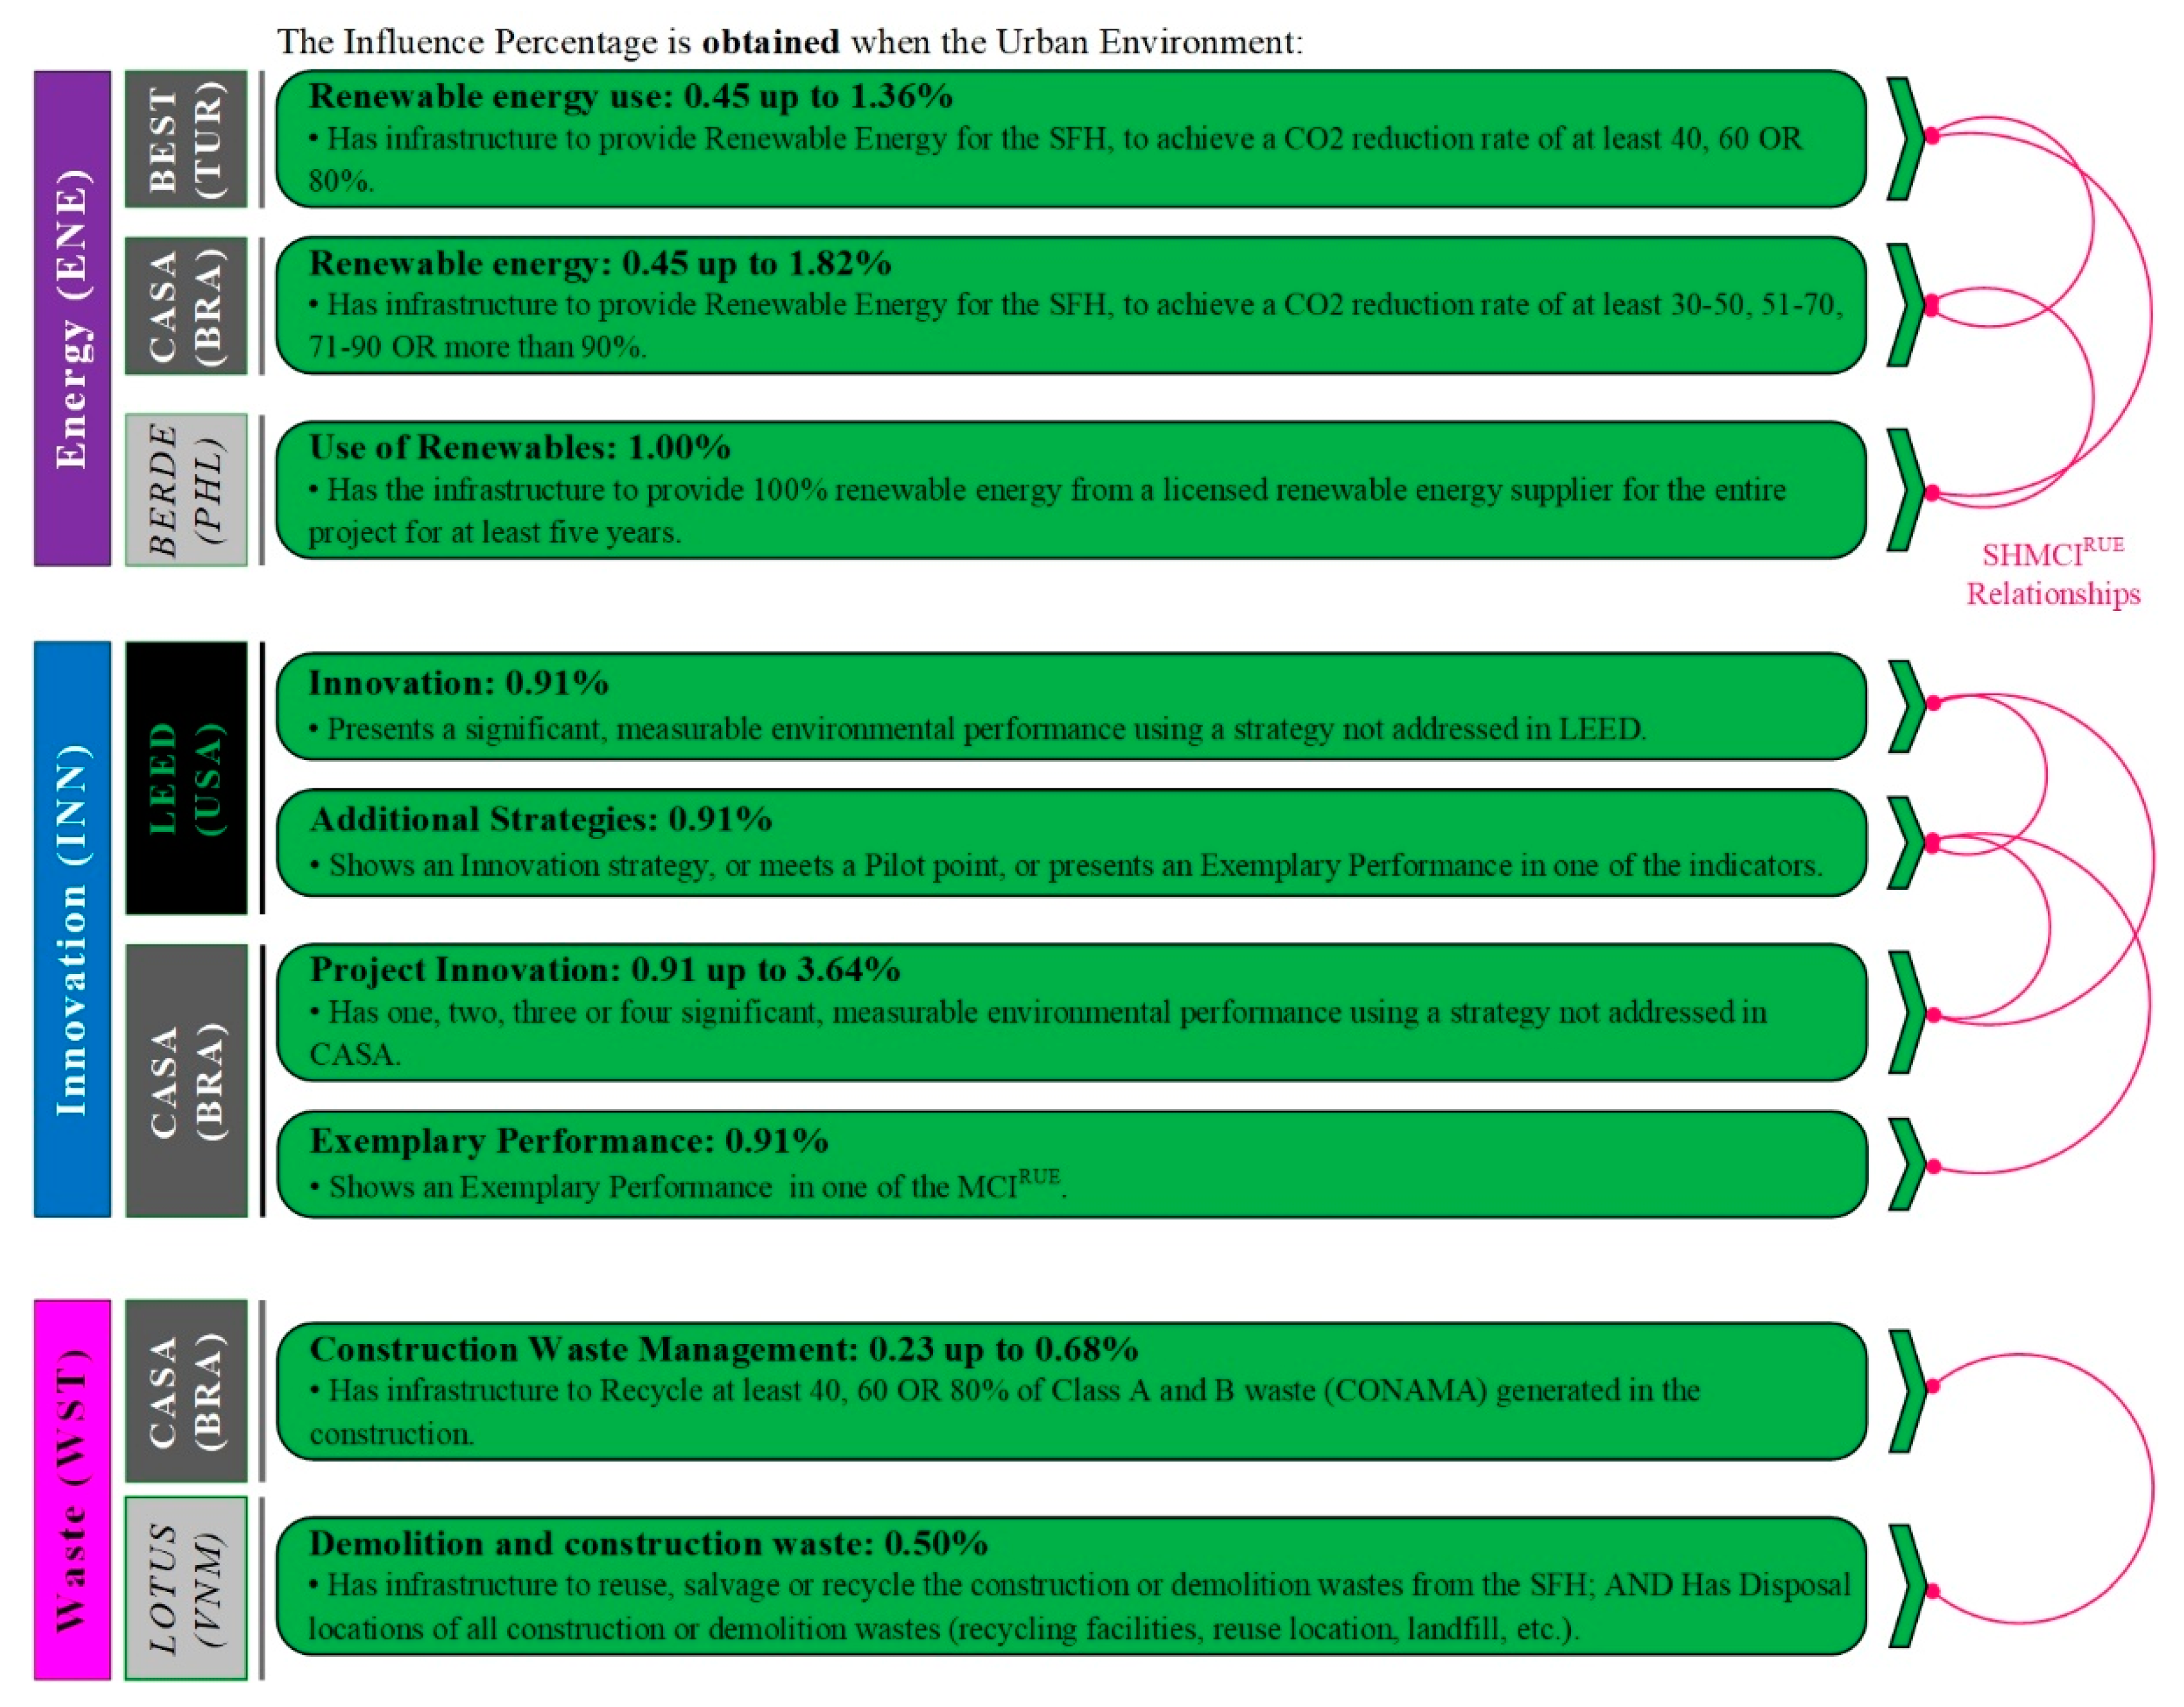
3.2.2. The SHMCIRUEs Identified for Sustainable Cities in the Middle-Income Countries
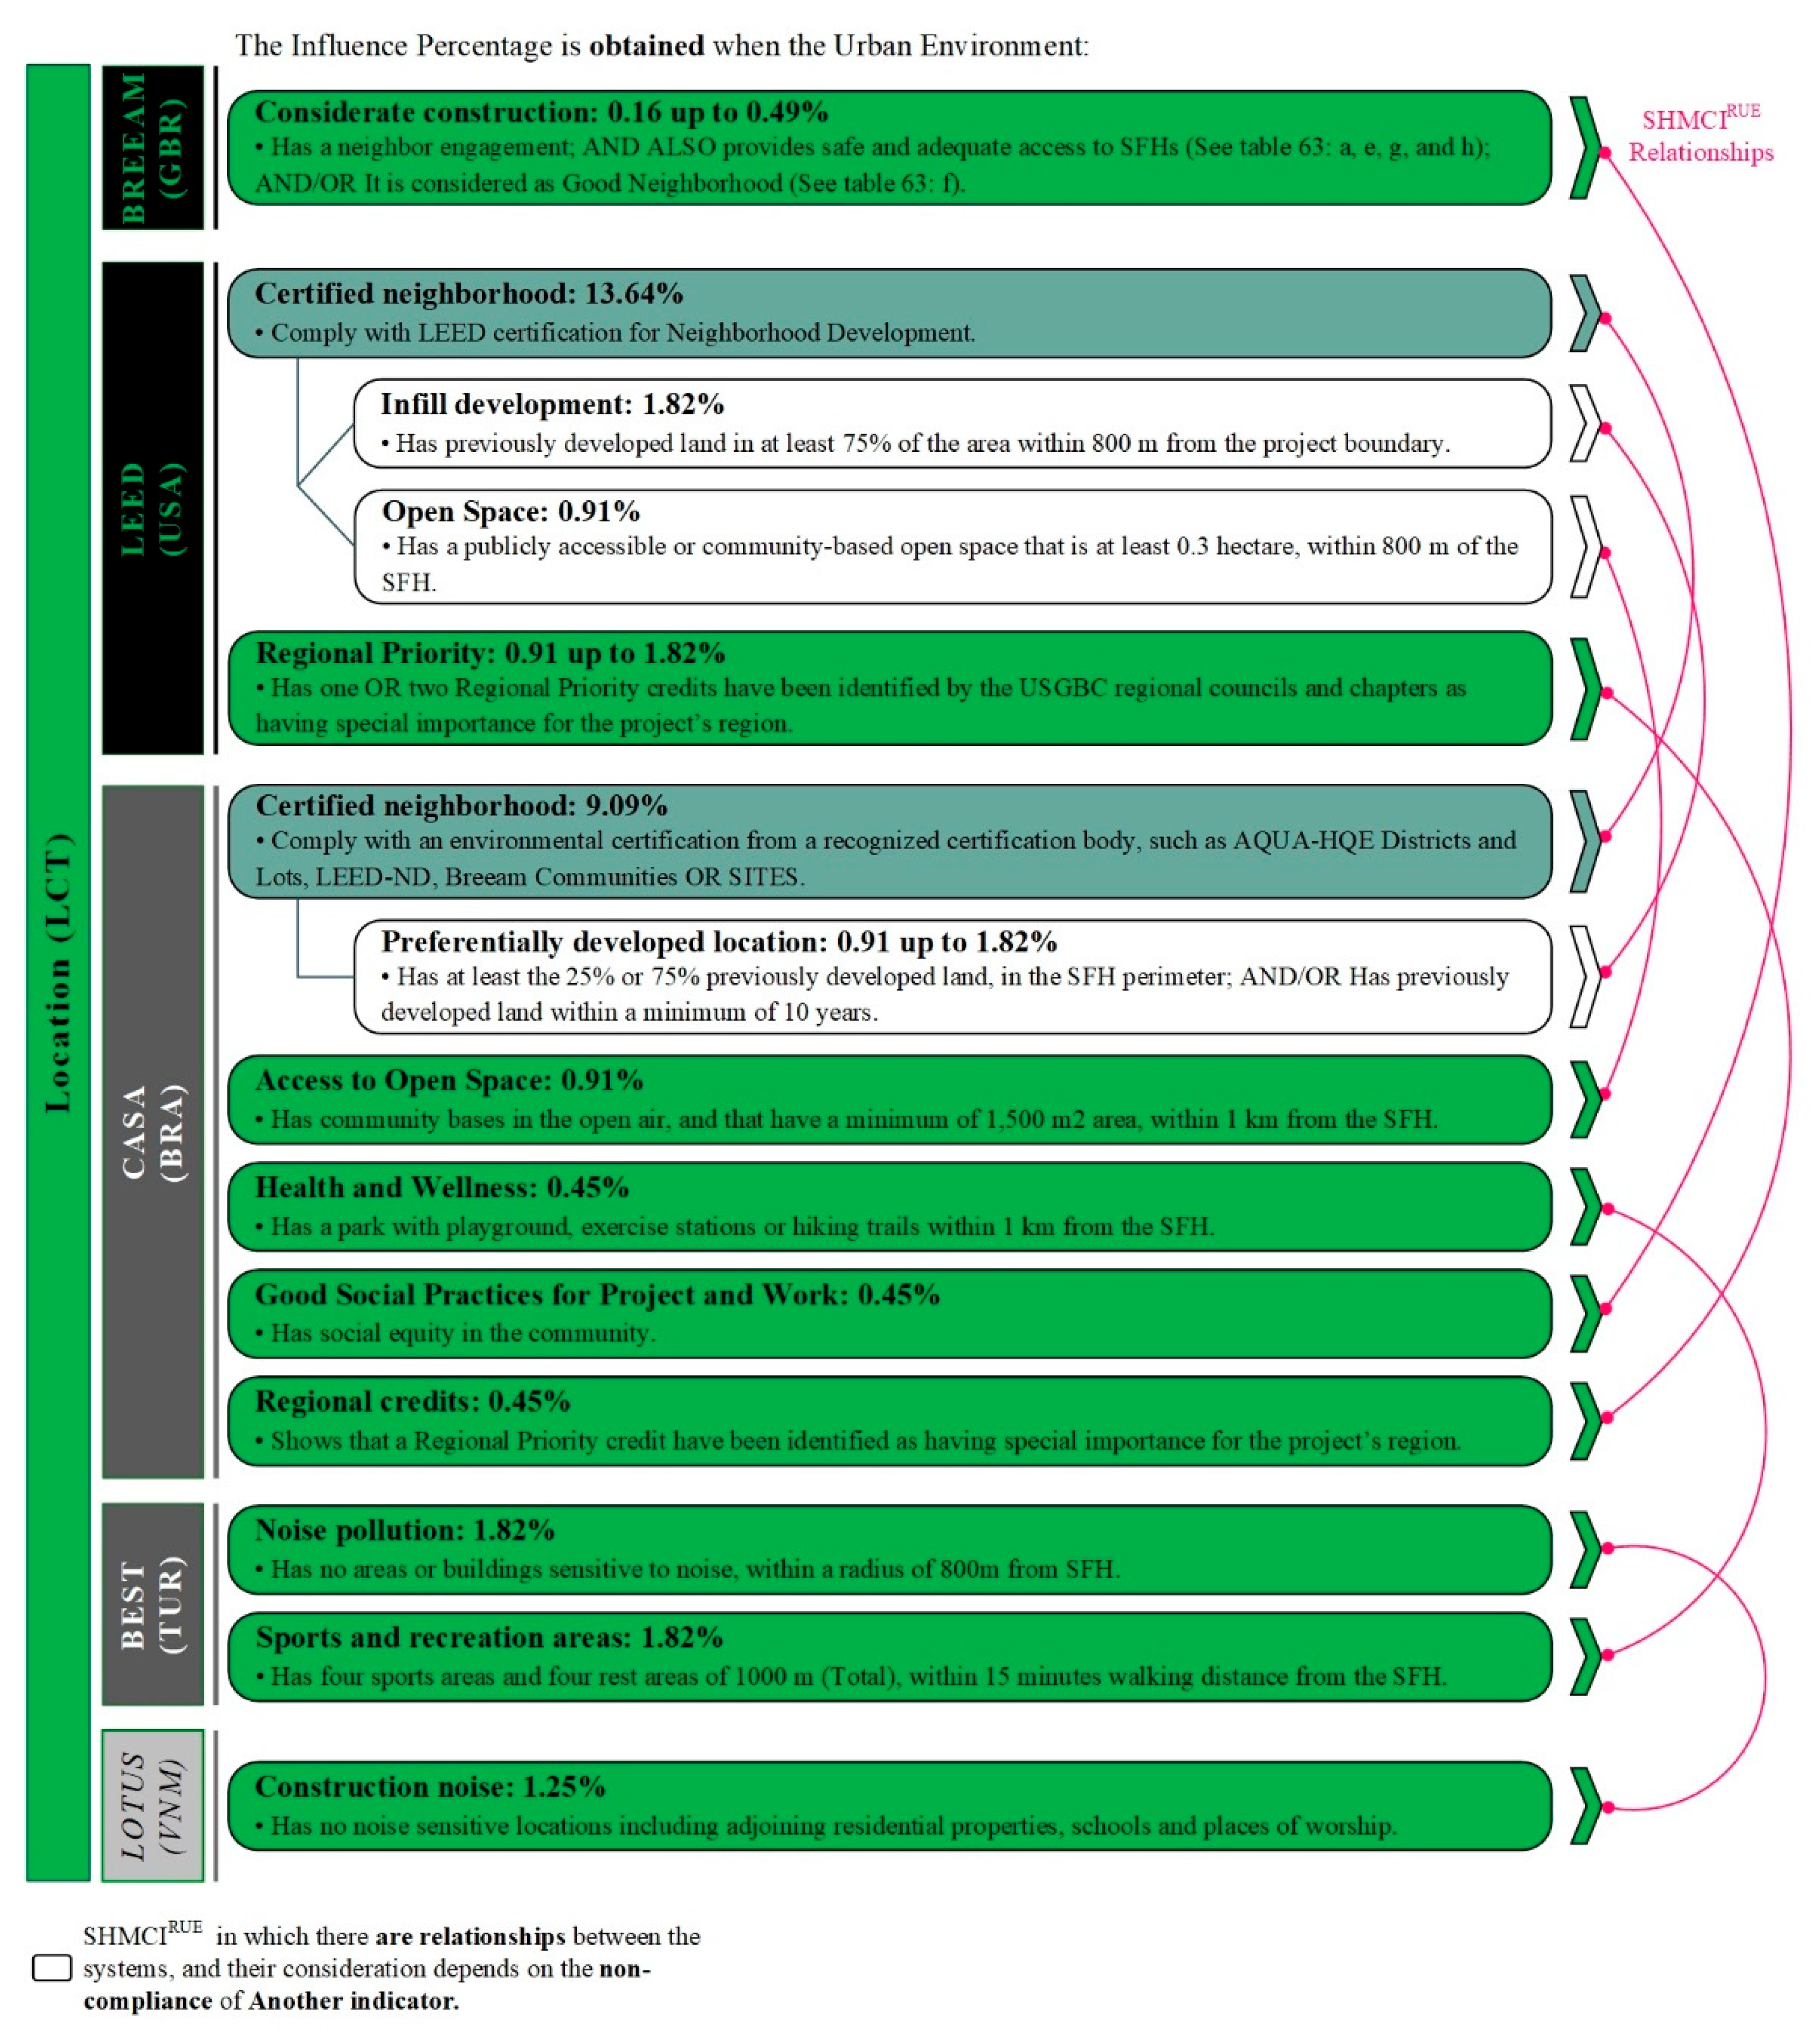
The SHMCIRUE: Certified Neighborhood
The SHMCIRUEs Considered by All SHRSs
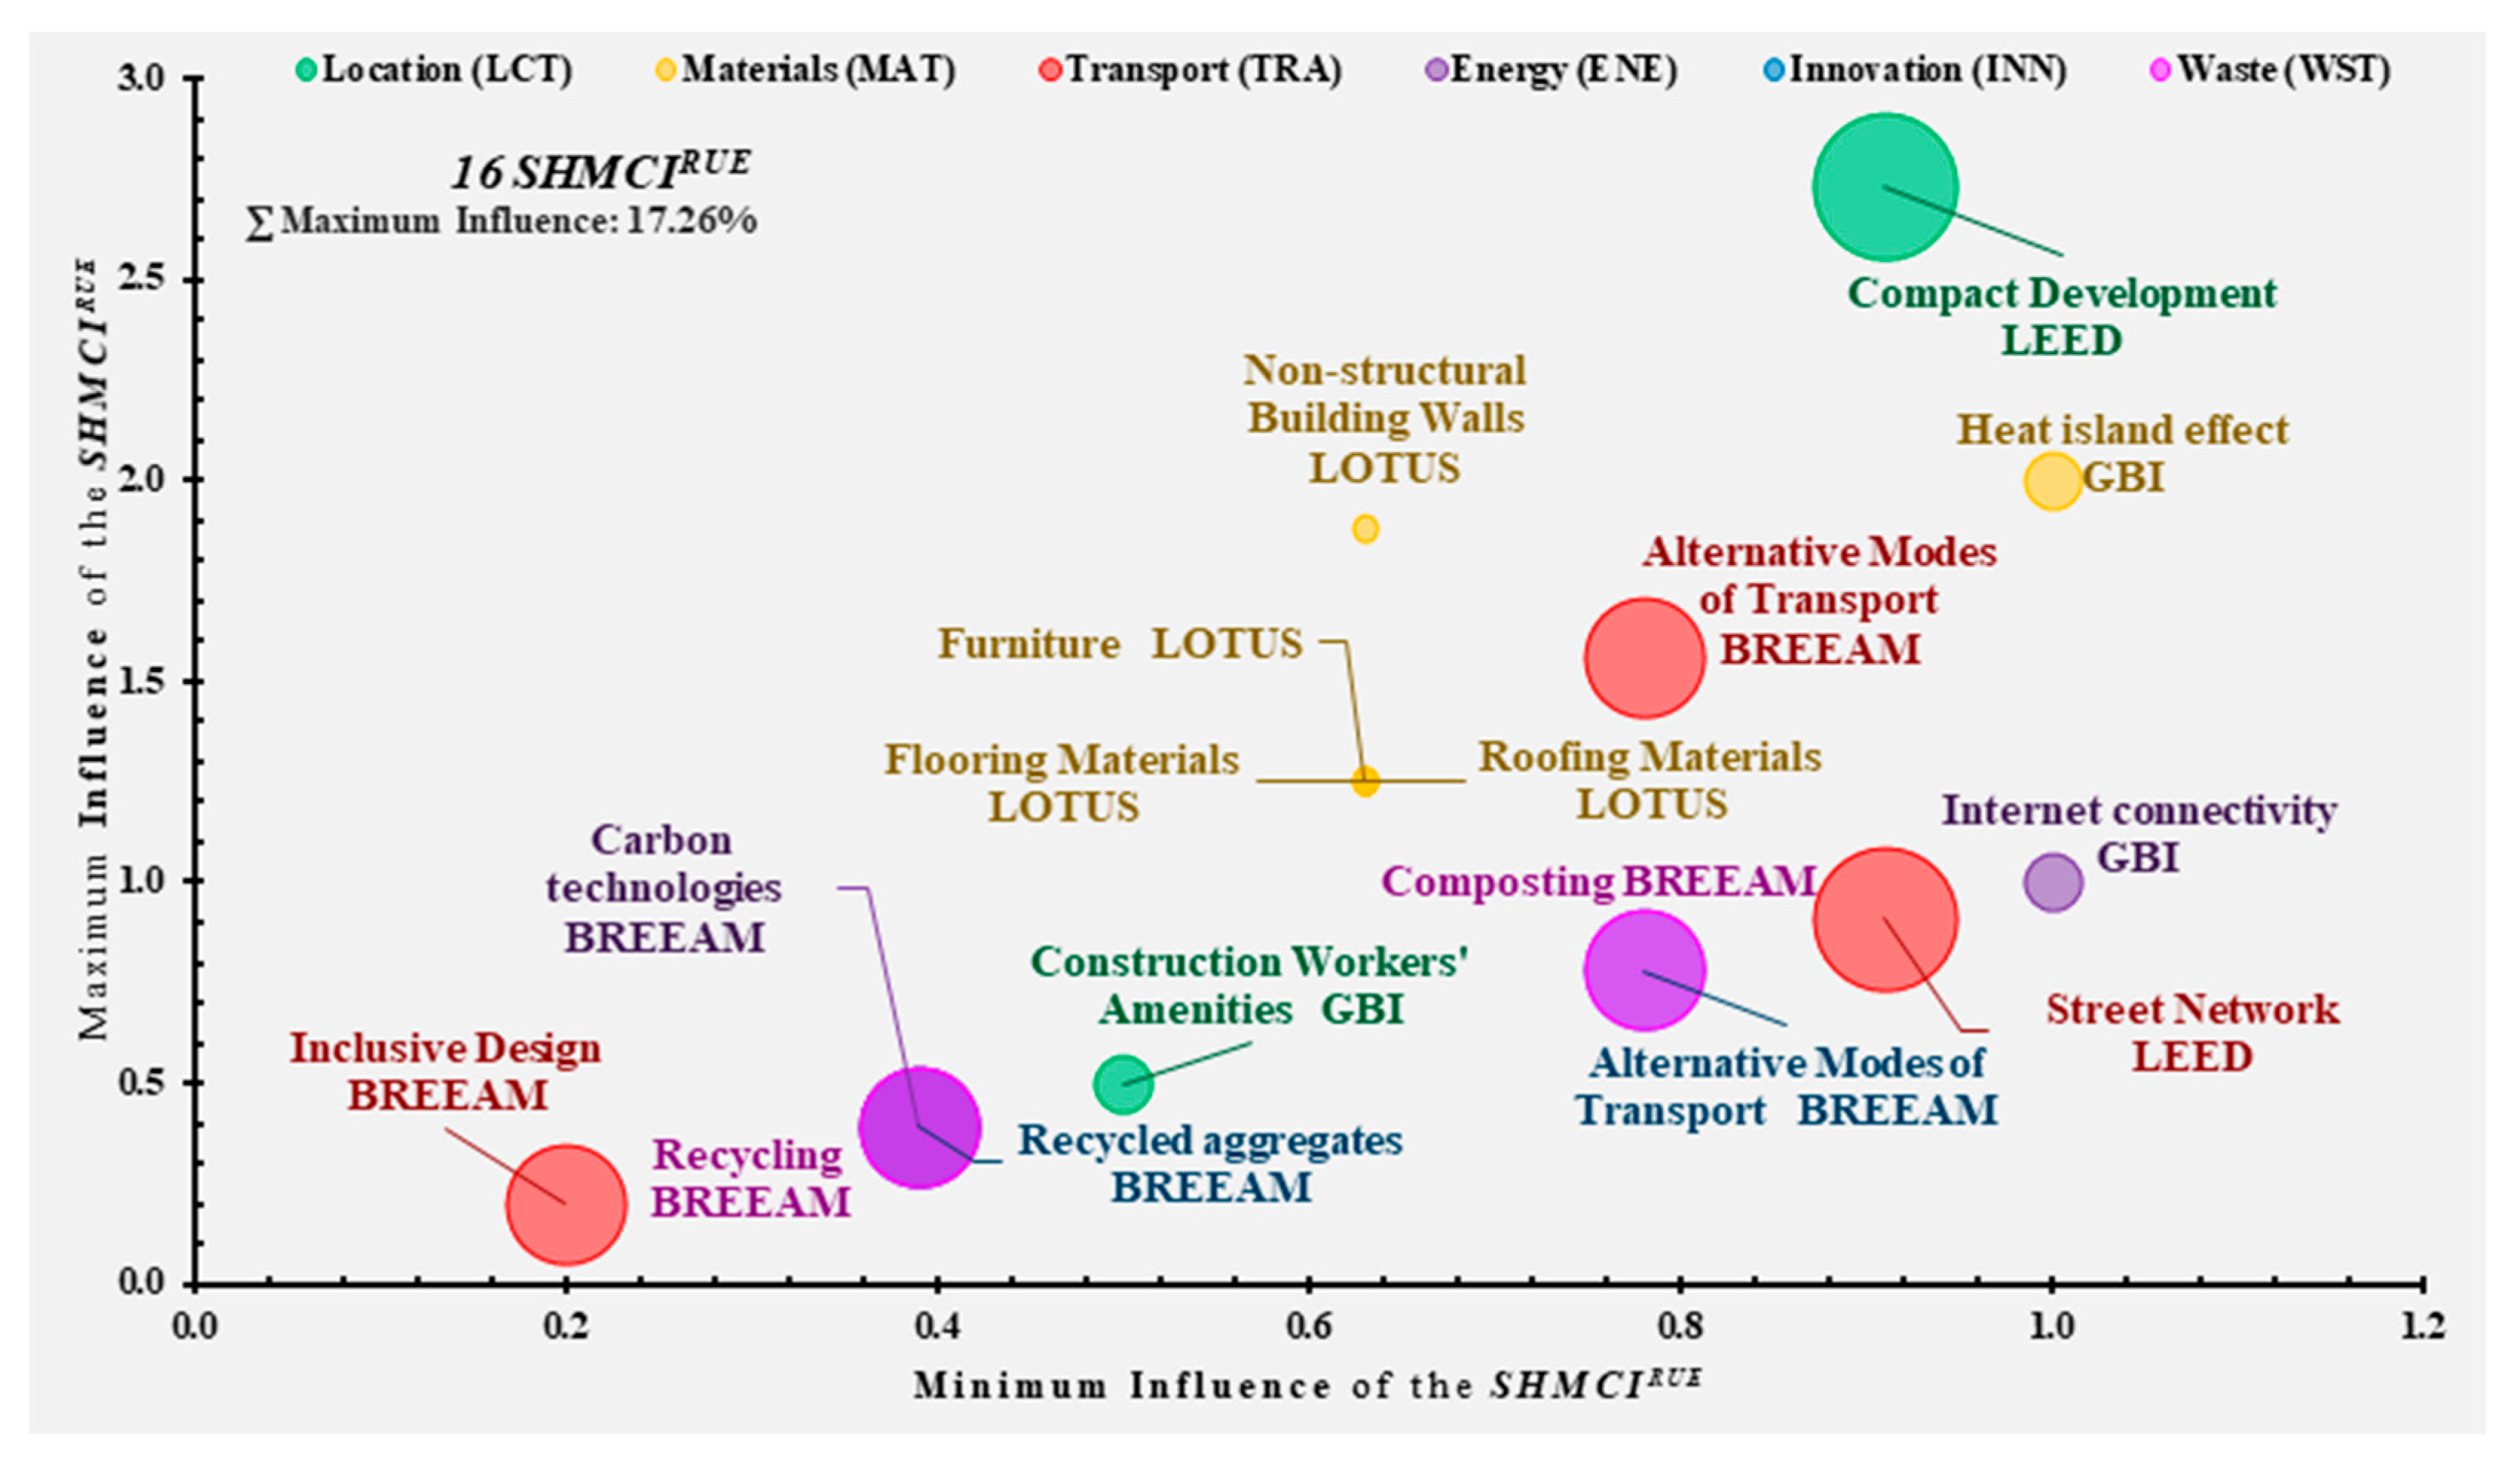
Exclusive SHMCIRUEs between the SHRSs
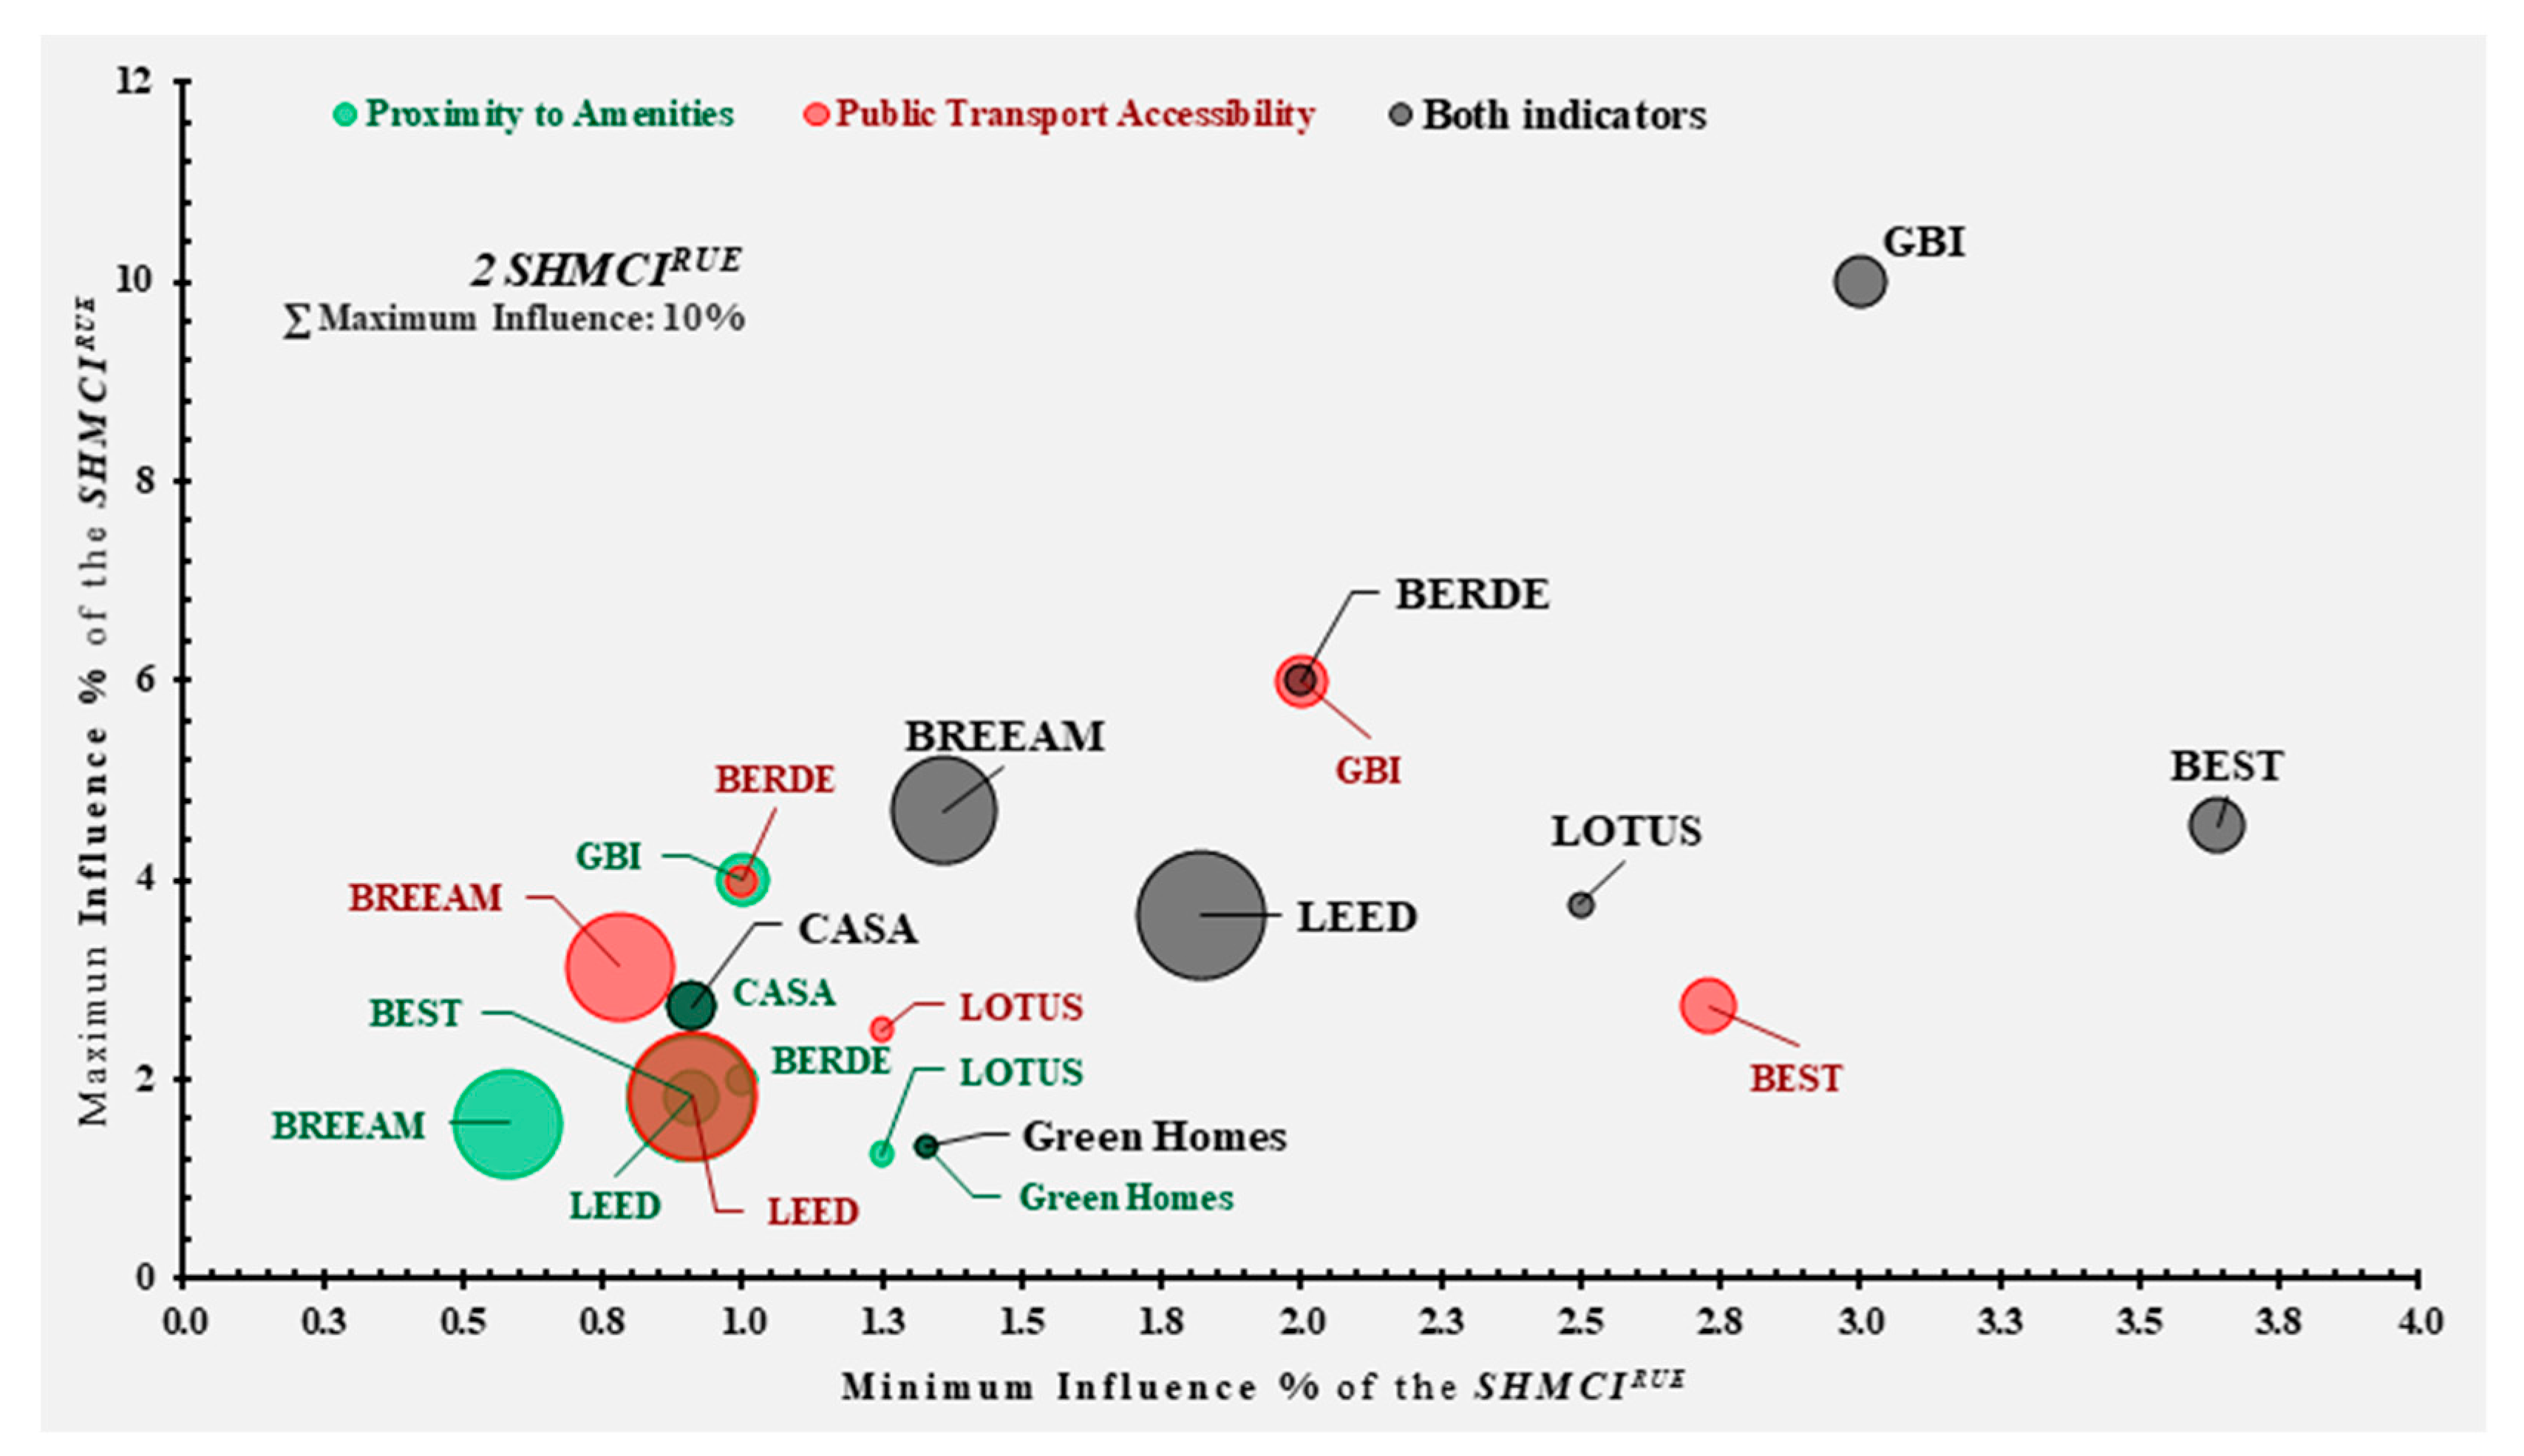
The SHMCIRUE Considered by Two SHRSs
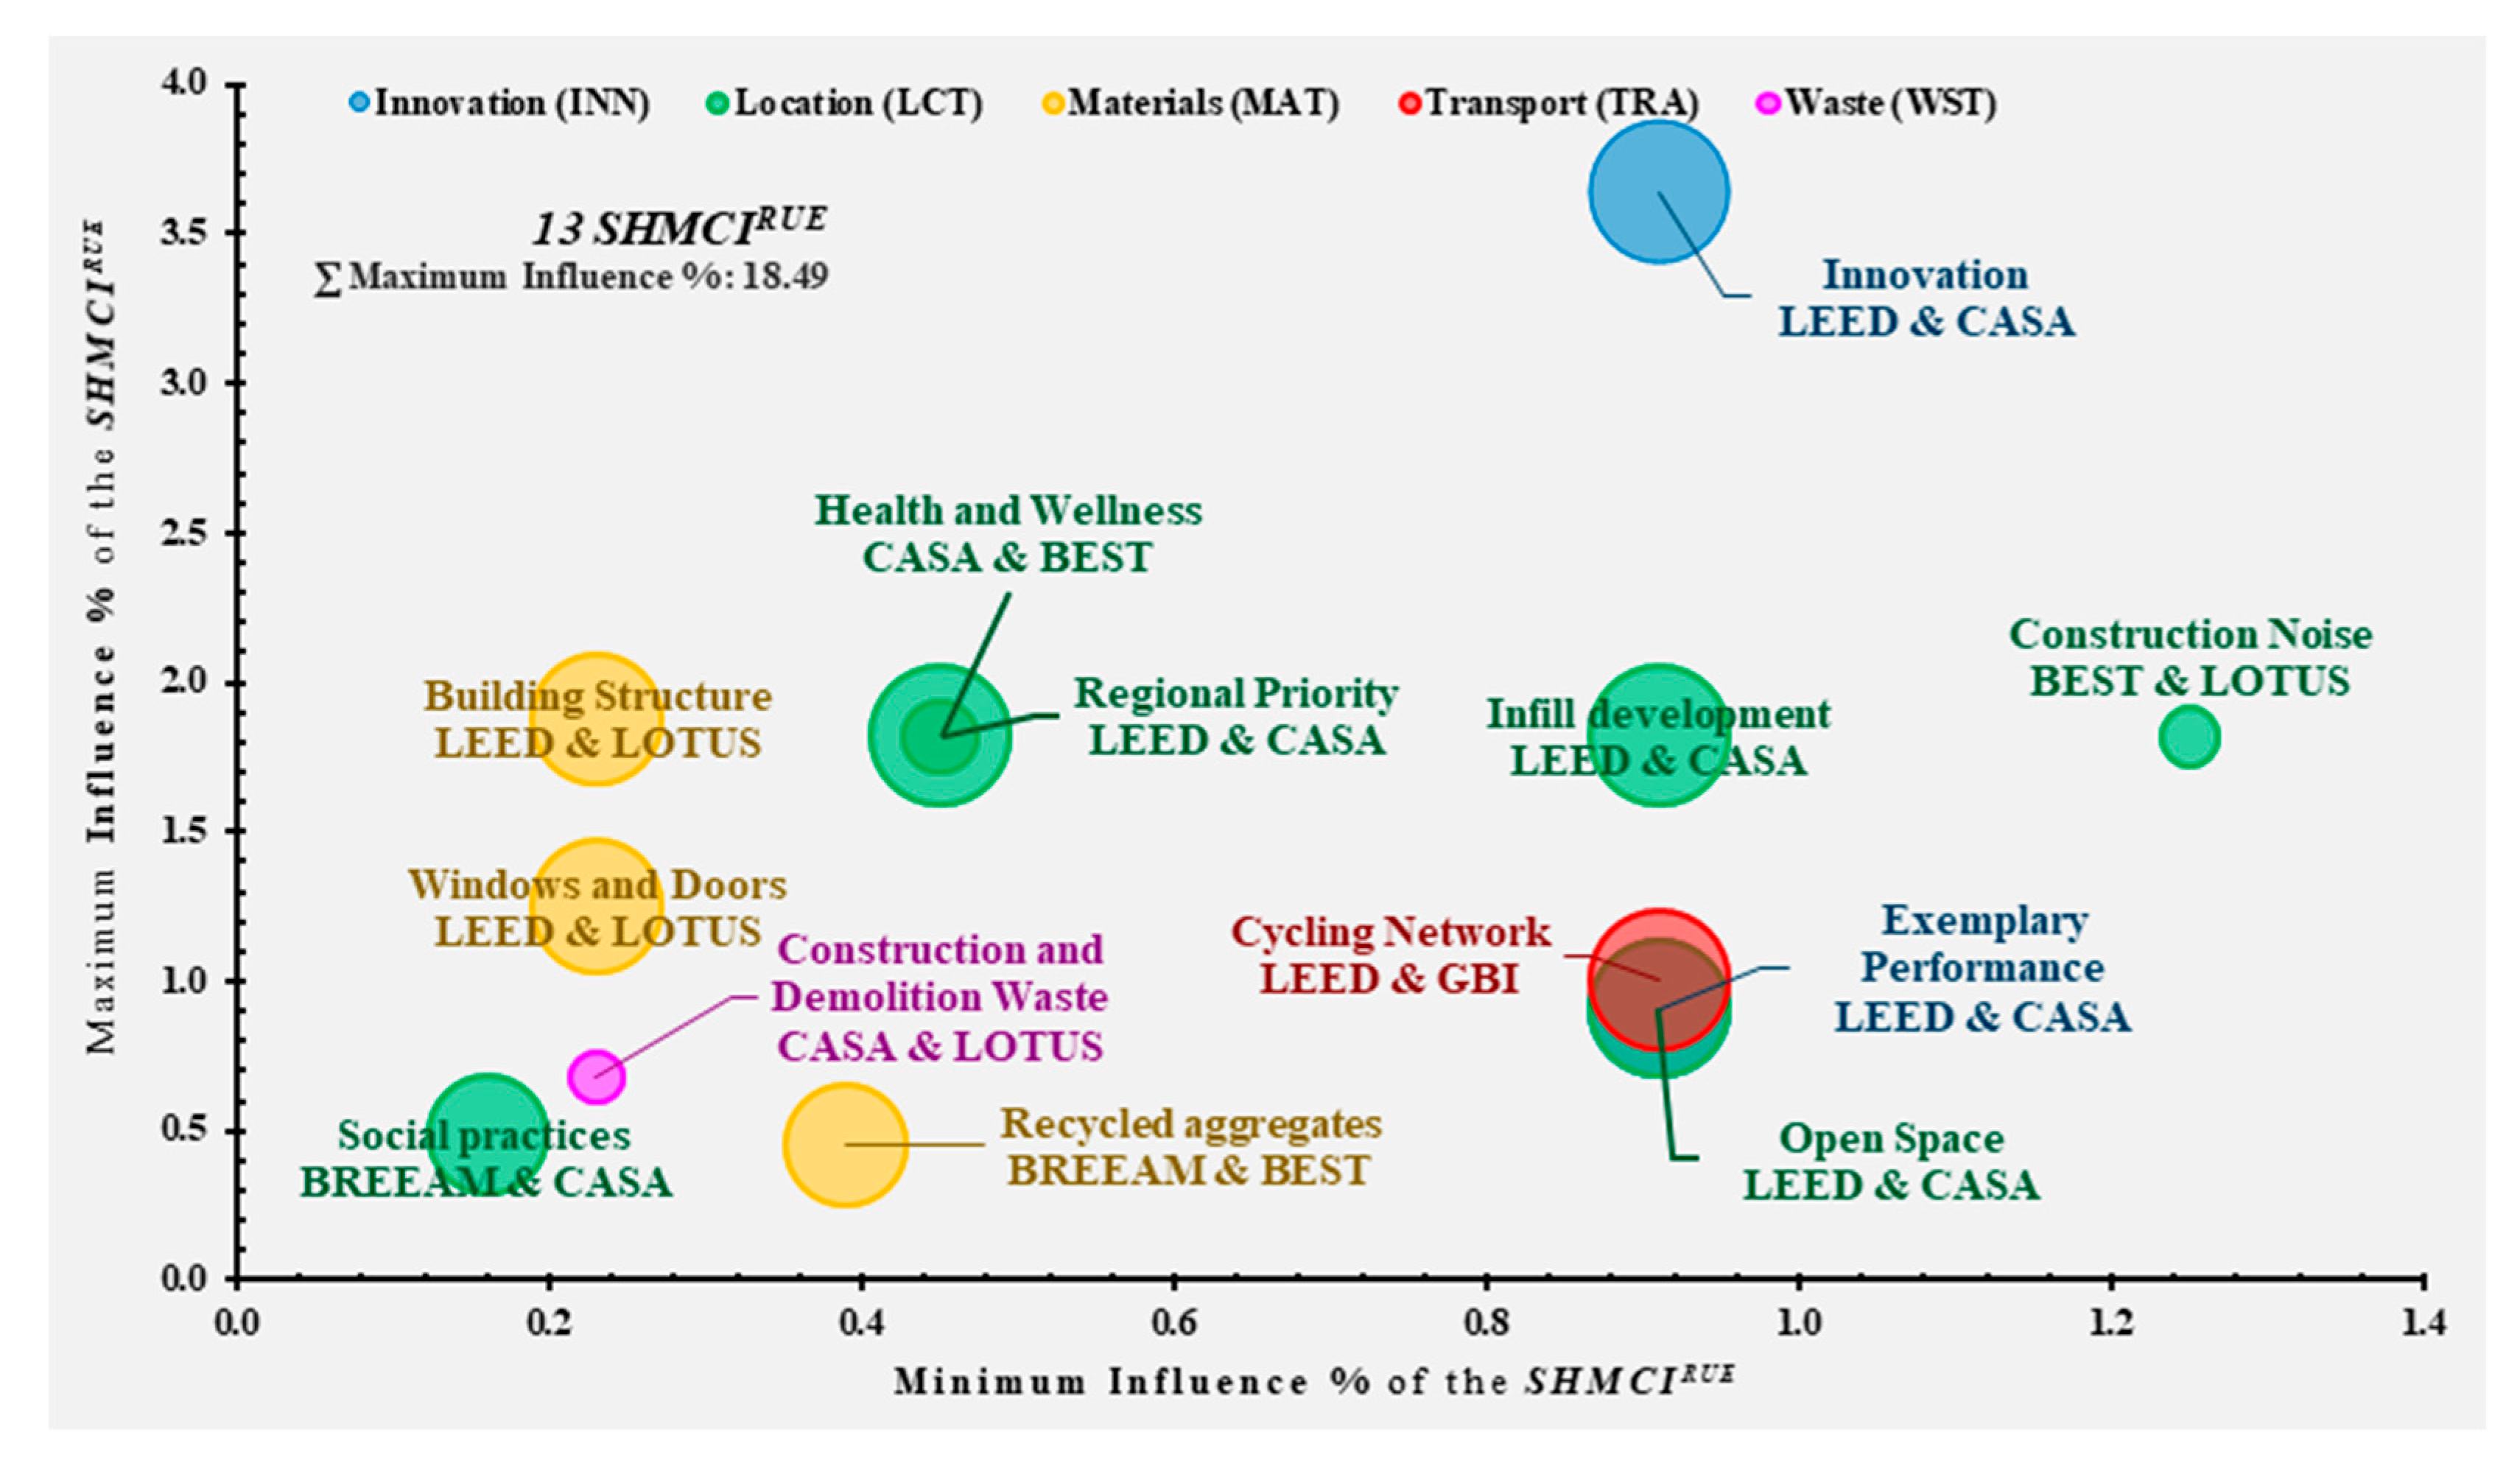
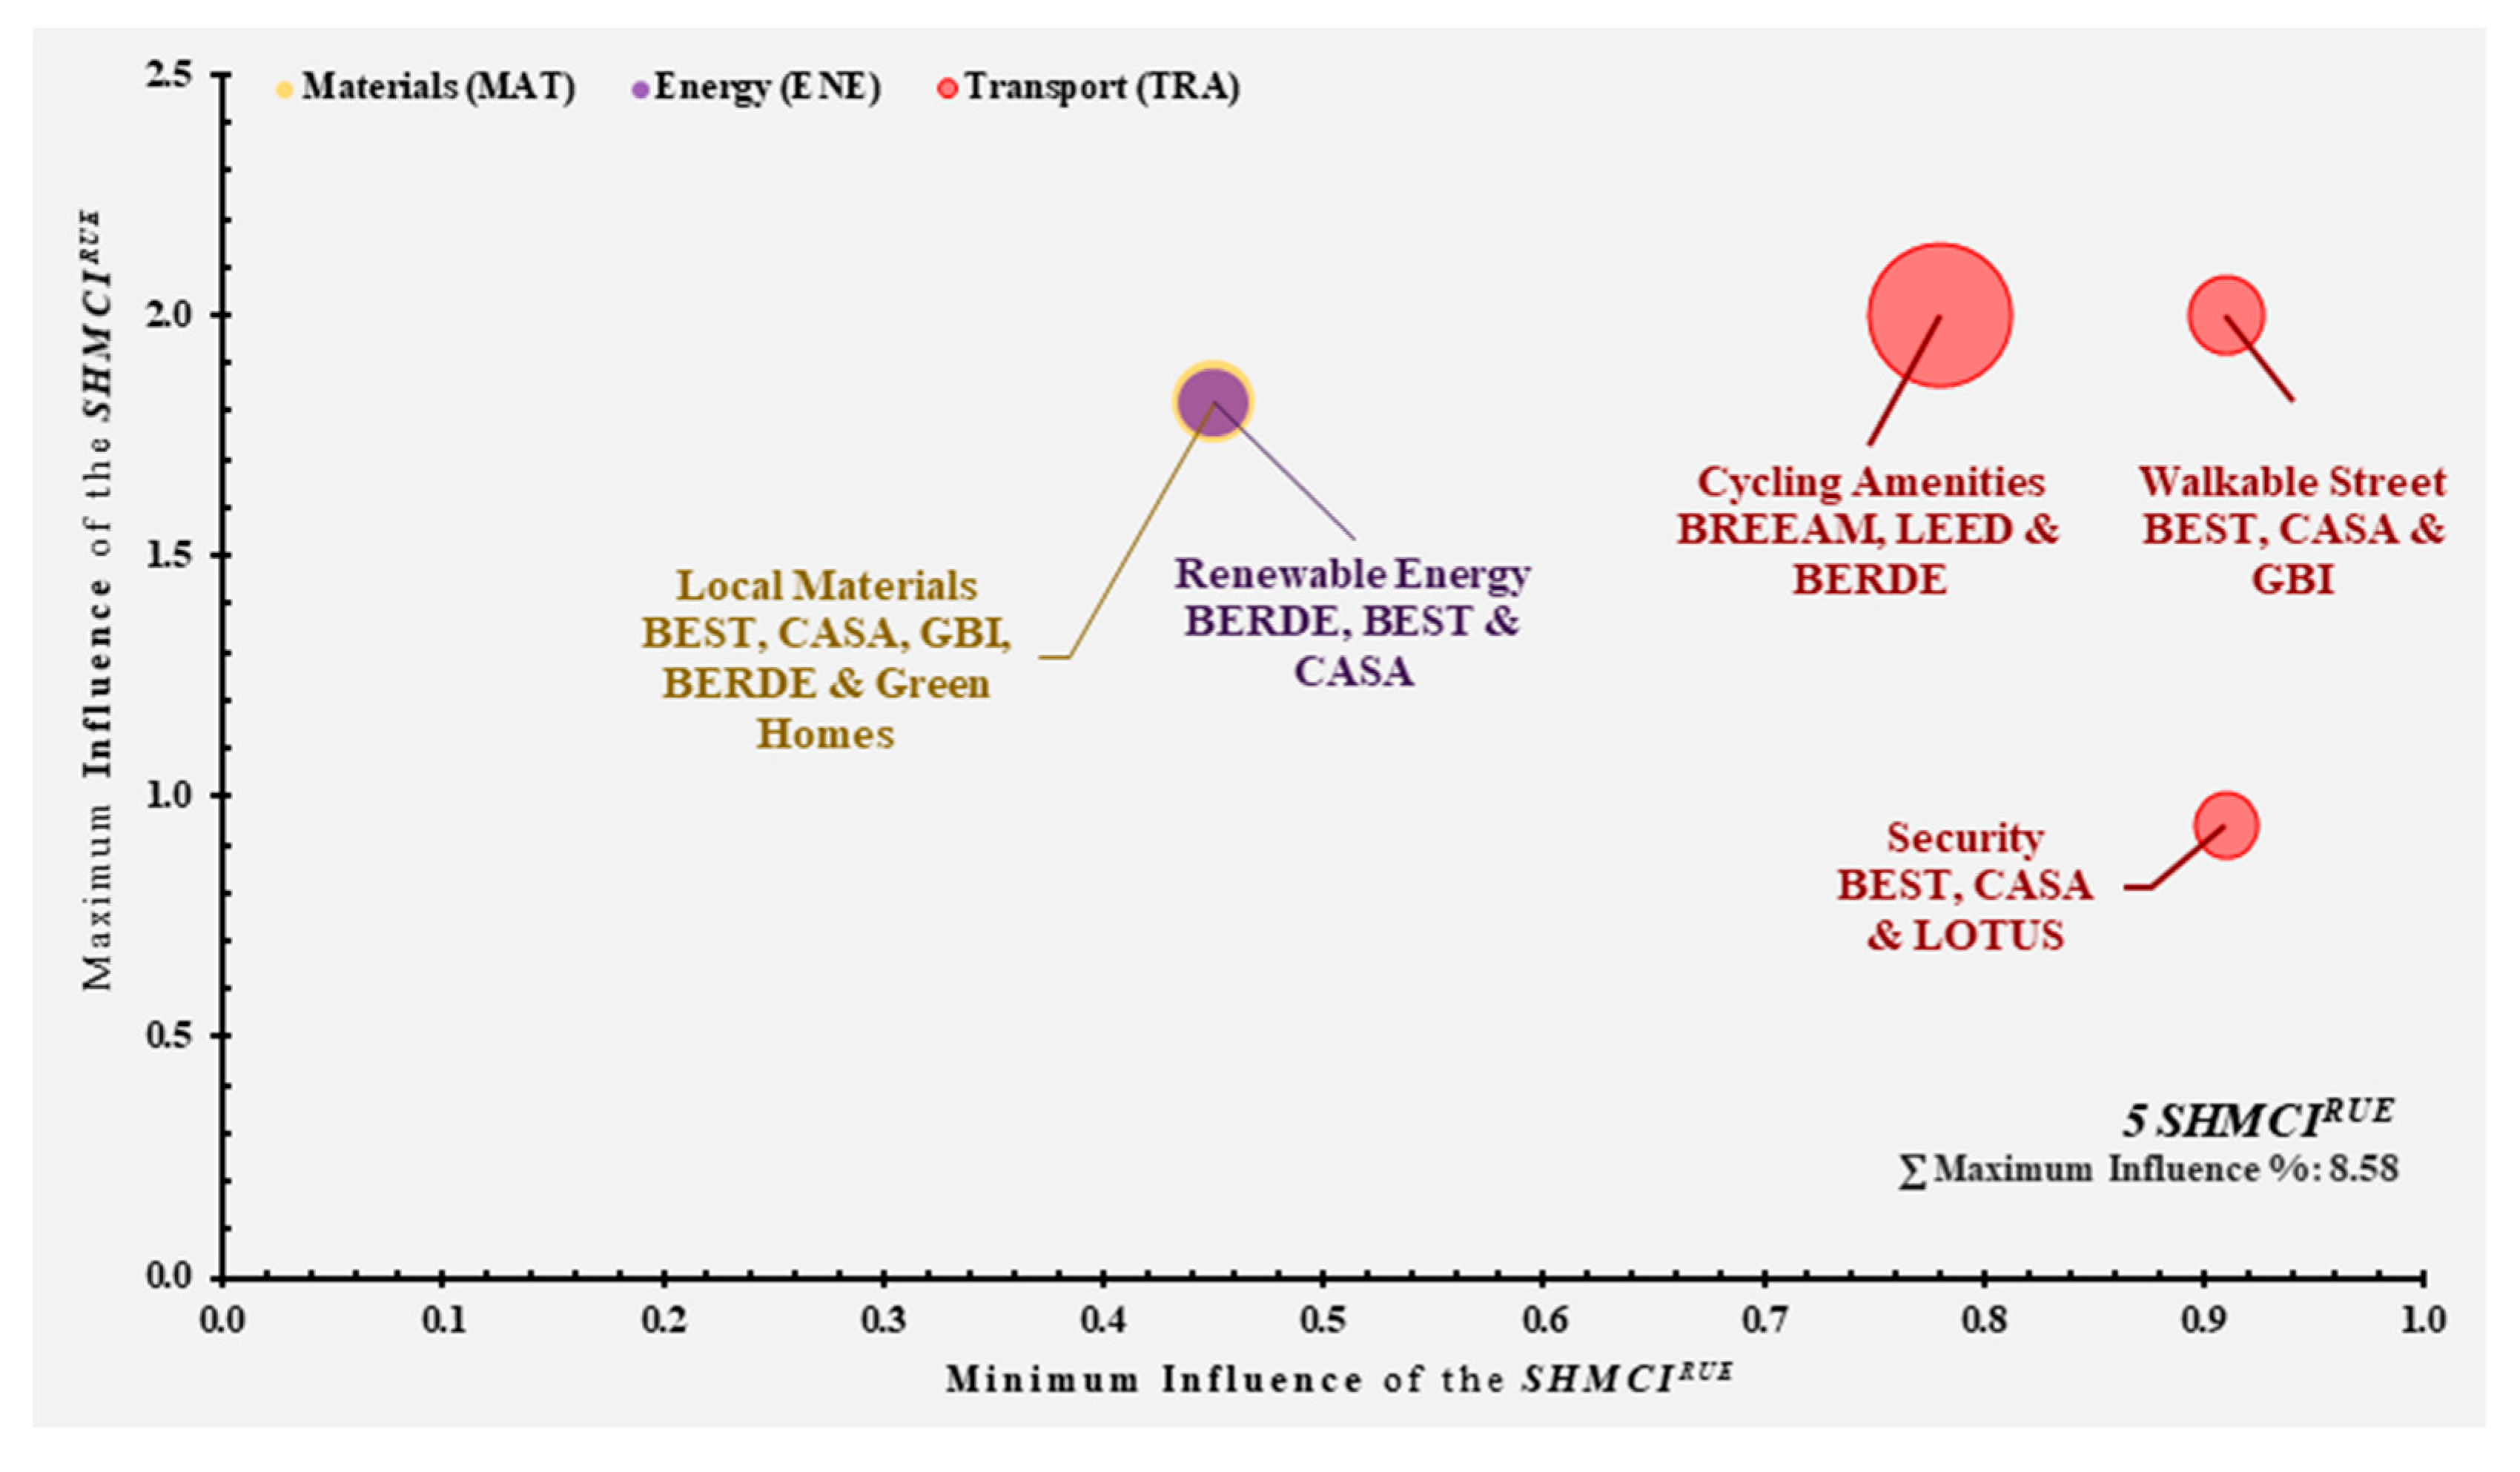
The SHMCIRUEs Considered by Three and Five SHRSs
4. Conclusions
Author Contributions
Funding
Acknowledgments
Conflicts of Interest
Abbreviations
| ENE | Energy |
| HIC | High-Income Country |
| INN | Innovation |
| LCT | Location |
| LMC | Lower-Middle-Income Country |
| MAT | Materials |
| MCI | Multi-Criteria Indicators |
| MIC | Middle-Income Country |
| NCP | Normalization Criteria Process |
| NMA | New Macro Area |
| OCI | Obligatory-Criteria Indicator |
| RUE | Residential Urban Environment |
| SFH | Single-Family Housing |
| SHIRUE | SFH Indicator that focuses on the RUE |
| SHMCIRUE | SFH Multi-Criteria Indicator that focuses on the RUE |
| SHOCIRUE | SFH Obligatory-Criteria Indicator that focuses on the RUE |
| SHRS | Single-Family Housing Rating System |
| TRA | Transport |
| UMC | Upper-Middle-Income Country |
| WST | Waste |
Appendix A


References
- United Nations. World Population Prospects: The 2017 Revision, Key Findings and Advance Tables; United Nations: New York, NY, USA, 2017. [Google Scholar]
- Wang, C.; Wang, Z.H. Projecting population growth as a dynamic measure of regional urban warming. Sustain. Cities Soc. 2017, 32, 357–365. [Google Scholar] [CrossRef] [Green Version]
- Mi, Z.; Guan, D.; Liu, Z.; Liu, J.; Viguié, V.; Fromer, N.; Wang, Y. Cities: The core of climate change mitigation. J. Clean. Prod. 2019, 207, 582–589. [Google Scholar] [CrossRef]
- Mahmoud, S.H.; Gan, T.Y. Long-term impact of rapid urbanization on urban climate and human thermal comfort in hot-arid environment. Build. Environ. 2018, 142, 83–100. [Google Scholar] [CrossRef]
- The World Bank. The International Monetary Fund Development Goals in an Era of Demographic Change. Available online: http://pubdocs.worldbank.org/en/503001444058224597/Global-Monitoring-Report-2015.pdf (accessed on 7 February 2018).
- Dizdaroglu, D. The role of indicator-based sustainability assessment in policy and the decision-making process: A review and outlook. Sustainability 2017, 9, 1018. [Google Scholar] [CrossRef]
- Haase, D.; Kabisch, S.; Haase, A.; Andersson, E.; Banzhaf, E.; Baró, F.; Brenck, M.; Fischer, L.K.; Frantzeskaki, N.; Kabisch, N.; et al. Greening cities—To be socially inclusive? About the alleged paradox of society and ecology in cities. Habitat Int. 2017, 64, 41–48. [Google Scholar] [CrossRef]
- Albertí, J.; Roca, M.; Brodhag, C.; Fullana-i-Palmer, P. Allocation and system boundary in life cycle assessments of cities. Habitat Int. 2019, 83, 41–54. [Google Scholar] [CrossRef]
- Balasbaneh, A.T.; Bin Marsono, A.K. Strategies for reducing greenhouse gas emissions from residential sector by proposing new building structures in hot and humid climatic conditions. Build. Environ. 2017, 124, 357–368. [Google Scholar] [CrossRef]
- Flood, J. Urban and Housing Indicators. Urban Stud. 1997, 34, 1635–1665. [Google Scholar] [CrossRef]
- Norouzian-Maleki, S.; Bell, S.; Hosseini, S.-B.; Faizi, M. Developing and testing a framework for the assessment of neighbourhood liveability in two contrasting countries: Iran and Estonia. Ecol. Indic. 2015, 48, 263–271. [Google Scholar] [CrossRef] [Green Version]
- Waitt, G.; Knobel, H. Embodied geographies of liveability and urban parks. Urban Stud. 2018, 55, 3151–3167. [Google Scholar] [CrossRef]
- Moulay, A.; Ujang, N.; Maulan, S.; Ismail, S. Understanding the process of parks’ attachment: Interrelation between place attachment, behavioural tendencies, and the use of public place. City Cult. Soc. 2018, 14, 28–36. [Google Scholar] [CrossRef]
- Mahmoudi, M.; Ahmad, F.; Abbasi, B. Livable streets: The effects of physical problems on the quality and livability of Kuala Lumpur streets. Cities 2015, 43, 104–114. [Google Scholar] [CrossRef]
- Villanueva, K.; Badland, H.; Hooper, P.; Koohsari, M.J.; Mavoa, S.; Davern, M.; Roberts, R.; Goldfeld, S.; Giles-Corti, B. Developing indicators of public open space to promote health and wellbeing in communities. Appl. Geogr. 2015, 57, 112–119. [Google Scholar] [CrossRef]
- Wilcox, J.A. The Home Purchase Sentiment Index: A New Housing Indicator. Bus. Econ. 2015, 50, 178–190. [Google Scholar] [CrossRef]
- Monzón, M.; López-Mesa, B. Buildings performance indicators to prioritise multi-family housing renovations. Sustain. Cities Soc. 2018, 38, 109–122. [Google Scholar] [CrossRef]
- Barreca, A.; Curto, R.; Rolando, D. Housing vulnerability and property prices: Spatial analyses in the Turin Real Estate Market. Sustainability 2018, 10, 3068. [Google Scholar] [CrossRef]
- Shama, Z.S.; Motlak, J.B. Indicators for Sustainable housing. IOP Conf. Ser. Mater. Sci. Eng. 2019, 518, 022009. [Google Scholar] [CrossRef]
- Morganti, M.; Pages-Ramon, A.; Coch, H. Buildingmass and Energy Demand in Conventional Housing Typologies of the Mediterranean City. Sustainability 2019, 11, 3540. [Google Scholar] [CrossRef]
- Llera-Sastresa, E.; Scarpellini, S.; Rivera-Torres, P.; Aranda, J.; Zabalza-Bribián, I.; Aranda-Usón, A. Energy vulnerability composite index in social housing, from a household energy poverty perspective. Sustainability 2017, 9, 691. [Google Scholar] [CrossRef]
- Siqueira-Gay, J.; Gallardo, A.L.C.F.; Giannotti, M. Integrating socio-environmental spatial information to support housing plans. Cities 2019, 91, 106–115. [Google Scholar] [CrossRef]
- Kajikawa, Y.; Inoue, T.; Goh, T.N. Analysis of building environment assessment frameworks and their implications for sustainability indicators. Sustain. Sci. 2011, 6, 233–246. [Google Scholar] [CrossRef]
- Mattoni, B.; Guattari, C.; Evangelisti, L.; Bisegna, F.; Gori, P.; Asdrubali, F. Critical review and methodological approach to evaluate the differences among international green building rating tools. Renew. Sustain. Energy Rev. 2018, 82, 950–960. [Google Scholar] [CrossRef]
- Bernardi, E.; Carlucci, S.; Cornaro, C.; Bohne, R.A. An analysis of the most adopted rating systems for assessing the environmental impact of buildings. Sustainability 2017, 9, 1226. [Google Scholar] [CrossRef]
- Suzer, O. Analyzing the compliance and correlation of LEED and BREEAM by conducting a criteria-based comparative analysis and evaluating dual-certified projects. Build. Environ. 2019, 147, 158–170. [Google Scholar] [CrossRef]
- Li, J.; Huang, X.; Kwan, M.P.; Yang, H.; Chuai, X. The effect of urbanization on carbon dioxide emissions efficiency in the Yangtze River Delta, China. J. Clean. Prod. 2018, 188, 38–48. [Google Scholar] [CrossRef]
- Zarghami, E.; Azemati, H.; Fatourehchi, D.; Karamloo, M. Customizing well-known sustainability assessment tools for Iranian residential buildings using Fuzzy Analytic Hierarchy Process. Build. Environ. 2018, 128, 107–128. [Google Scholar] [CrossRef]
- Díaz-López, C.; Carpio, M.; Martín-Morales, M.; Zamorano, M. A comparative analysis of sustainable building assessment methods. Sustain. Cities Soc. 2019, 49, 101611. [Google Scholar] [CrossRef]
- Gou, Z.; Xie, X. Evolving green building: Triple bottom line or regenerative design? J. Clean. Prod. 2017, 153, 600–607. [Google Scholar] [CrossRef]
- Jato-Espino, D.; Yiwo, E.; Rodriguez-Hernandez, J.; Canteras-Jordana, J.C. Design and application of a Sustainable Urban Surface Rating System (SURSIST). Ecol. Indic. 2018, 93, 1253–1263. [Google Scholar] [CrossRef]
- Li, Y.; Chen, X.; Wang, X.; Xu, Y.; Chen, P.H. A review of studies on green building assessment methods by comparative analysis. Energy Build. 2017, 146, 152–159. [Google Scholar] [CrossRef]
- Chen, X.; Yang, H.; Lu, L. A comprehensive review on passive design approaches in green building rating tools. Renew. Sustain. Energy Rev. 2015, 50, 1425–1436. [Google Scholar] [CrossRef]
- Huo, X.; Yu, A.T.W.; Wu, Z. A comparative analysis of site planning and design among green building rating tools. J. Clean. Prod. 2017, 147, 352–359. [Google Scholar] [CrossRef]
- Park, J.; Yoon, J.; Kim, K.H. Critical review of the material criteria of building sustainability assessment tools. Sustainability 2017, 9, 186. [Google Scholar] [CrossRef]
- Stankovic, B.; Kostic, A.; Popovic, M.J. Analysis and comparison of lighting design criteria in green building certification systems -Guidelines for application in Serbian building practice. Energy Sustain. Dev. 2014, 19, 56–65. [Google Scholar] [CrossRef]
- Wu, Z.; Shen, L.; Yu, A.T.W.; Zhang, X. A comparative analysis of waste management requirements between five green building rating systems for new residential buildings. J. Clean. Prod. 2016, 112, 895–902. [Google Scholar] [CrossRef]
- Abu Bakar, N.N.; Hassan, M.Y.; Abdullah, H.; Rahman, H.A.; Abdullah, M.P.; Hussin, F.; Bandi, M. Energy efficiency index as an indicator for measuring building energy performance: A review. Renew. Sustain. Energy Rev. 2015, 44, 1–11. [Google Scholar] [CrossRef]
- Michael, F.L.; Noor, Z.Z.; Figueroa, M.J. Review of urban sustainability indicators assessment—Case study between Asian countries. Habitat Int. 2014, 44, 491–500. [Google Scholar] [CrossRef]
- Shen, L.Y.; Jorge Ochoa, J.; Shah, M.N.; Zhang, X. The application of urban sustainability indicators—A comparison between various practices. Habitat Int. 2011, 35, 17–29. [Google Scholar] [CrossRef]
- Pupphachai, U.; Zuidema, C. Sustainability indicators: A tool to generate learning and adaptation in sustainable urban development. Ecol. Indic. 2017, 72, 784–793. [Google Scholar] [CrossRef]
- UN-Habitat. Habitat III Issue Papers; United Nations: New York, NY, USA, 2017. [Google Scholar]
- Andrić, I.; Le Corre, O.; Lacarrière, B.; Ferrão, P.; Al-Ghamdi, S.G. Initial approximation of the implications for architecture due to climate change. Adv. Build. Energy Res. 2019. [Google Scholar] [CrossRef]
- Roshan, G.R.; Oji, R.; Attia, S. Projecting the impact of climate change on design recommendations for residential buildings in Iran. Build. Environ. 2019, 155, 283–297. [Google Scholar] [CrossRef] [Green Version]
- Bahadure, S.; Kotharkar, R. Framework for measuring sustainability of neighbourhoods in Nagpur, India. Build. Environ. 2018, 127, 86–97. [Google Scholar] [CrossRef]
- Nguyen, T.T.P.; Zhu, D.; Le, N.P. Factors influencing waste separation intention of residential households in a developing country: Evidence from Hanoi, Vietnam. Habitat Int. 2015, 48, 169–176. [Google Scholar] [CrossRef]
- Cáceres Seguel, C.; Ahumada Villaroel, G. Evaluación de brechas de equipamiento urbano entre barrios de Viña del Mar, Chile: Una metodología para la identificación de desiertos urbanos. Investig. Geogr. 2018. [Google Scholar] [CrossRef]
- Arimah, B.C. Housing-sector performance in global perspective: A cross-city investigation. Urban Stud. 2000, 37, 2551–2579. [Google Scholar] [CrossRef]
- Rodríguez Serrano, A.Á.; Porras Álvarez, S. Life cycle assessment in building: A case study on the energy and emissions impact related to the choice of housing typologies and construction process in Spain. Sustainability 2016, 8, 287. [Google Scholar] [CrossRef]
- Wang, N.; Phelan, P.E.; Gonzalez, J.; Harris, C.; Henze, G.P.; Hutchinson, R.; Langevin, J.; Lazarus, M.A.; Nelson, B.; Pyke, C.; et al. Ten questions concerning future buildings beyond zero energy and carbon neutrality. Build. Environ. 2017, 119, 169–182. [Google Scholar] [CrossRef] [Green Version]
- Soares, N.; Bastos, J.; Dias Pereira, L.; Soares, A.; Amaral, A.R.; Asadi, E.; Rodrigues, E.; Lamas, F.B.; Monteiro, H.; Lopes, M.A.R.; et al. A review on current advances in the energy and environmental performance of buildings towards a more sustainable built environment. Renew. Sustain. Energy Rev. 2017, 77, 845–860. [Google Scholar] [CrossRef]
- Pisello, A.L.; Taylor, J.E.; Xu, X.; Cotana, F. Inter-building effect: Simulating the impact of a network of buildings on the accuracy of building energy performance predictions. Build. Environ. 2012, 58, 37–45. [Google Scholar] [CrossRef]
- Soust-Verdaguer, B.; Llatas, C.; García-Martínez, A. Simplification in life cycle assessment of single-family houses: A review of recent developments. Build. Environ. 2016, 103, 215–227. [Google Scholar] [CrossRef] [Green Version]
- Enteria, N.; Cuartero, O. A Review of the Recent Development of the Philippine Household Tech-nologies and Energy Consumption. Recent Pat. Eng. 2017, 11, 35–48. [Google Scholar] [CrossRef]
- Lavagna, M.; Baldassarri, C.; Campioli, A.; Giorgi, S.; Dalla Valle, A.; Castellani, V.; Sala, S. Benchmarks for environmental impact of housing in Europe: Definition of archetypes and LCA of the residential building stock. Build. Environ. 2018, 145, 260–275. [Google Scholar] [CrossRef]
- UN-Habitat. Urbanization and Development: Emerging Futures; UN-Habitat: Nairobi, Kenya, 2016. [Google Scholar]
- The World Bank. 3 Big Ideas to Achieve Sustainable Cities and Communities. Available online: http://www.worldbank.org/en/news/immersive-story/2018/01/31/3-big-ideas-to-achieve-sustainable-cities-and-communities (accessed on 1 January 2019).
- United Nations. World Urbanization Prospects: The 2018 Revision; United Nations: New York, NY, USA, 2018. [Google Scholar]
- Papargyropoulou, E.; Padfield, R.; Harrison, O.; Preece, C. The rise of sustainability services for the built environment in Malaysia. Sustain. Cities Soc. 2012, 5, 44–51. [Google Scholar] [CrossRef]
- Saldaña-Márquez, H.; Gómez-Soberón, J.M.; Arredondo-Rea, S.P.; Gámez-García, D.C.; Corral-Higuera, R. Sustainable social housing: The comparison of the Mexican funding program for housing solutions and building sustainability rating systems. Build. Environ. 2018, 133, 103–122. [Google Scholar] [CrossRef]
- WorldGBC Rating Tools. Available online: http://www.worldgbc.org/rating-tools (accessed on 11 February 2019).
- Seinre, E.; Kurnitski, J.; Voll, H. Building sustainability objective assessment in Estonian context and a comparative evaluation with LEED and BREEAM. Build. Environ. 2014, 82, 110–120. [Google Scholar] [CrossRef]
- Ferreira, J.; Pinheiro, M.D.; De Brito, J. Portuguese sustainable construction assessment tools benchmarked with BREEAM and LEED: An energy analysis. Energy Build. 2014, 69, 451–463. [Google Scholar] [CrossRef]
- Mohammed Usman, A.; Abdullah, K. Comparative Study on the Malaysian Sustainable Building Rating Systems. Int. J. Integr. Eng. 2018, 10, 69–77. [Google Scholar] [CrossRef]
- Shafiei, M.W.M.; Abadi, H.; Osman, W.N. The indicators of green buildings for Malaysian property development industry. Int. J. Appl. Eng. Res. 2017, 12, 2182–2189. [Google Scholar]
- PHILGBC BERDE GBRS—New Construction. V2.2.0. Available online: http://docs.berdeonline.org/userguide/v2.0.0/berde-nc/#copyright (accessed on 1 September 2018).
- Global, B. BREEAM International New Construction 2016; Technical Manual SD233 2.0: Watford, UK, 2017. [Google Scholar]
- ÇEDBİK. Çedbik-Konut Sertifika Kilavuzu. Yeni konutlar V.1; ÇEDBİK: Istanbul, Turkey, 2018. [Google Scholar]
- USGBC. LEED V4 for Homes Design and Construction; USGBC: Washington, DC, USA, 2013. [Google Scholar]
- GBC BRASIL. Certificação GBC Brasil Casa; GBC BRASIL: Sao Paulo, Brazil, 2017. [Google Scholar]
- GSB. GBI Residential New Construction (RNC) Design Reference Guide and Submission Format. V 3.1; GSB: Kuala Lumpur, Malaysia, 2014. [Google Scholar]
- IGBC. IGBC Green Homes Rating System V 2.0; IGBC: Hyderabad, India, 2012. [Google Scholar]
- VGBC. LOTUS Homes V1. Technical Manual; VGBC: Hanoi, Vietnam, 2017. [Google Scholar]
- IGBC. IGBC Green Homes Rating System—V 2.0 First Addendum; IGBC: Hyderabad, India, 2014. [Google Scholar]
- IGBC. IGBC Green Homes Rating System—V 2.0 Second Addendum; IGBC: Hyderabad, India, 2016. [Google Scholar]
- Ameen, R.F.M.; Mourshed, M.; Li, H. A critical review of environmental assessment tools for sustainable urban design. Environ. Impact Assess. Rev. 2015, 55, 110–125. [Google Scholar] [CrossRef]
- Fastofski, D.C.; González, M.A.S.; Kern, A.P. Sustainability analysis of housing developments through the Brazilian environmental rating system Selo Casa Azul. Habitat Int. 2017, 67, 44–53. [Google Scholar] [CrossRef]
- De Boeck, L.; Verbeke, S.; Audenaert, A.; De Mesmaeker, L. Improving the energy performance of residential buildings: A literature review. Renew. Sustain. Energy Rev. 2015, 52, 960–975. [Google Scholar] [CrossRef]
- Illankoon, I.M.C.S.; Tam, V.W.Y.; Le, K.N.; Shen, L. Key credit criteria among international green building rating tools. J. Clean. Prod. 2017, 164, 209–220. [Google Scholar] [CrossRef]
- Asdrubali, F.; Baldinelli, G.; Bianchi, F.; Sambuco, S. A comparison between environmental sustainability rating systems LEED and ITACA for residential buildings. Build. Environ. 2015, 86, 98–108. [Google Scholar] [CrossRef]
- The World Bank Data GNI per Capita, Atlas Method (Current US$). Available online: https://data.worldbank.org/indicator/NY.GNP.PCAP.CD?locations=GB-US-PH-IN-VN-TR-BR-MY (accessed on 24 February 2019).
- Shan, M.; Hwang, B. Green building rating systems: Global reviews of practices and research efforts. Sustain. Cities Soc. 2018, 39, 172–180. [Google Scholar] [CrossRef]
- Zarghami, E.; Fatourehchi, D.; Karamloo, M. Establishing a region-based rating system for multi-family residential buildings in Iran: A holistic approach to sustainability. Sustain. Cities Soc. 2019, 50, 101631. [Google Scholar] [CrossRef]
- Hoslett, J.; Massara, T.M.; Malamis, S.; Ahmad, D.; van den Boogaert, I.; Katsou, E.; Ahmad, B.; Ghazal, H.; Simons, S.; Wrobel, L.; et al. Surface water filtration using granular media and membranes: A review. Sci. Total Environ. 2018, 639, 1268–1282. [Google Scholar] [CrossRef]
- Narain, V.; Singh, A.K. Replacement or displacement? Periurbanisation and changing water access in the Kumaon Himalaya, India. Land Use Policy 2019, 82, 130–137. [Google Scholar] [CrossRef]
- Vilčeková, S.; Selecká, I.; Burdová, E.K.; Mečiarová, L. Interlinked sustainability aspects of low-rise residential family house development in Slovakia. Sustainability 2018, 10, 3966. [Google Scholar] [CrossRef]
- Komeily, A.; Srinivasan, R.S. A need for balanced approach to neighborhood sustainability assessments: A critical review and analysis. Sustain. Cities Soc. 2015, 18, 32–43. [Google Scholar] [CrossRef]
- Charoenkit, S.; Kumar, S. Environmental sustainability assessment tools for low carbon and climate resilient low income housing settlements. Renew. Sustain. Energy Rev. 2014, 38, 509–525. [Google Scholar] [CrossRef]
- Abdellatif, M.; Al-Shamma’a, A. Review of sustainability in buildings. Sustain. Cities Soc. 2015, 14, 171–177. [Google Scholar] [CrossRef]
- Cabrera-Barona, P. Influence of Urban Multi-Criteria Deprivation and Spatial Accessibility to Healthcare on Self-Reported Health. Urban Sci. 2017, 1, 11. [Google Scholar] [CrossRef]
- Mugion, R.G.; Toni, M.; Raharjo, H.; Di Pietro, L.; Sebathu, S.P. Does the service quality of urban public transport enhance sustainable mobility? J. Clean. Prod. 2018, 174, 1566–1587. [Google Scholar] [CrossRef]
- Hodson, M.; Geels, F.W.; McMeekin, A. Reconfiguring urban sustainability transitions, analysing multiplicity. Sustainability 2017, 9, 299. [Google Scholar] [CrossRef]
- Dall’O’, G.; Galante, A.; Sanna, N.; Miller, K. On the integration of leadership in energy and environmental design (LEED) ND protocol with the energy planning and management tools in Italy: Strengths and weaknesses. Energies 2013, 6, 5990–6015. [Google Scholar] [CrossRef]
- Gámez-García, D.C.; Saldaña-Márquez, H.; Gómez-Soberón, J.M.; Corral-Higuera, R.; Arredondo-Rea, S.P. Life Cycle Assessment of residential streets from the perspective of favoring the human scale and reducing motorized traffic flow. From cradle to handover approach. Sustain. Cities Soc. 2019, 44, 332–342. [Google Scholar] [CrossRef]
- Kang, C.D. Spatial access to pedestrians and retail sales in Seoul. Korea. Habitat Int. 2016, 57, 110–120. [Google Scholar] [CrossRef]


| SHRS | Version–Year | Country–Income Level | Adoption | Scoring: Rating System |
|---|---|---|---|---|
| BREEAM | SD233 2.0–2016 A | United Kingdom (GBR)–HIC | International | % Score: Pass (≥ 30), Good (≥ 45), Very good (≥ 55), Excellent (≥ 70), Outstanding (≥ 85). |
| LEED | V4 BD+C–2013 | United States (USA)–HIC | International | Points: Certified (40–49), Silver (50–59), Gold (60–79), Platinum (80+). |
| BEST | 1.0–2018 | Turkey (TUR)–UMC | National | Points: Approved (45–64), Good (65–79), Very good (80–99), Excellent (100). |
| CASA | CASA–2017 | Brazil (BRA)–UMC | National | Points: Certified (40–49), Silver (50–59), Gold (60–79), Platinum (80+). |
| GBI | RNC 3.1–2014 | Malaysia (MYS)–UMC | National | Points: Certified (50–65), Silver (66–75), Gold (76–85), Platinum (86+). |
| BERDE | NC 2.2.0–2018 | Philippines (PHL)–LMC | National | Stars: 1 Star (51–60 points), 2 Star (61–70 points), 3 Star (71–80 points), 4 Star (81–90 points), 5 Star (91+ points). |
| Green Homes | 2.0–2012 B | India (IND)–LMC | National | Points: Certified (38–44), Silver (45–51), Gold (52–59), Platinum (60–75). |
| LOTUS | Homes V1–2017 | Vietnam (VNM)–LMC | National | Points: Certified (32–43), Silver (44–51), Gold (52–59), Platinum (60+). |
| SHRS | Special Considerations |
|---|---|
| BREEAM | BREEAM allows the weights of each category to differ regarding the location of the home in which the certification is to be made. Therefore, to obtain a quantitative analysis with the least possible bias, all the WCIs were obtained using Equation (3). On the other hand, the OCIs vary according to the rating level desired; however, for this analysis, those required for a “pass” level were addressed. In addition, the SHMCIRUEs indicated in the innovation category were considered to be independent of the categories to which they refer to respect the weight that should correspond to them. |
| LEED | The point floors were discarded. |
| BERDE | The four OCIs presented by this tool are located in the categories of management (MN), and use of land and ecology (LE). In the MN category, the OCIs were located in the commitment to sharing resource data, and compliance with building and environmental laws, regulations, and mandatory standards. The other two OCIs were located in the LE category: distinct and clear boundaries, and initial site assessment. Finally, each OCI was considered with a value of 0.25. |
| BEST | The available points in Table 1 (see Reference [68]) were considered to obtain the maximum values granted by the SHRS for each indicator. |
| LOTUS | The categories of innovation (INN) and best practice credits (BPC) were discarded, both in the OCIs and in the MCIs, because the tool does not consider a specific weight for this category. |
| SHRS | Adoption | SHOCIRUEpartially | SHMCIRUEpartially | SHMCIRUEentirely | |||
|---|---|---|---|---|---|---|---|
| Qty. | % * | Qty. | % * | Qty. | % * | ||
| BREEAM | International | - | - | 6 | 2.25 | 5 | 7.81 |
| LEED (a) | - | - | 1 | 0.68 | 4 | 17.27 | |
| LEED (b) | - | - | 1 | 0.68 | 10 | 14.55 | |
| BEST | National in a UMC | - | - | 3 | 3.64 | 5 | 10.00 |
| CASA (a) | 2 | 3.15 | 6 | 4.32 | 4 | 14.55 | |
| CASA (b) | 2 | 3.15 | 6 | 4.32 | 6 | 11.82 | |
| GBI | - | - | 2 | 1.50 | 6 | 17.00 | |
| BERDE | National in an LMC | - | - | 2 | 2.50 | 4 | 8.00 |
| Green Homes | - | - | 1 | 1.33 | 1 | 1.33 | |
| LOTUS | - | - | 8 | 10.19 | 3 | 5.00 | |
| Indicator | Influence (%) | The Influence Percentage Is Obtained When the Urban Environment: |
|---|---|---|
| 1. Water Systems | 1.47 | Has an infrastructure network from which the house can be fed (sewage treatment and water supply network). |
| 2. Waste Management | 1.68 | Has market agents that act in the reception of waste and waste transporters that comply with the operational requirements established in laws and regulations. |
| Considered by: | Influence (%) | The Influence Percentage Is Obtained When the Urban Environment: |
|---|---|---|
| LEED | 13.64 | Complies with LEED certification for neighborhood development. |
| CASA | 9.09 | Complies with an environmental certification from a recognized certification body, such as AQUA-HQE Districts and Lots, LEED-ND, BREEAM Communities or SITES. |
| Considered by: | Influence (%) | The Influence Percentage Is Obtained When the Urban Environment: |
|---|---|---|
| BREEAM | 0.78–3.13 | Has a public transport accessibility index (AI) for the assessed SFH ≥ 0.5, 1, 2, or 4. |
| LEED | 0.91–1.82 | Has a bus or streetcar stop within 400 m walking distance from the SFH or bus rapid transit stops, light or heavy rail stations, or ferry terminals within 800 m walking distance. With a transit service that meets the minimum daily transit service for projects with multiple transit types; weekday trips = 72, 144, or 360; weekend trips = 40, 108, or 216; or minimum daily transit service for projects with commuter rail or ferry service only: weekday trips = 24, 40, or 60. |
| BEST | 2.73 | Has a public transportation point within 500 m from the SFH. |
| GBI | 2.00–6.00 | Has public transport stop with one route within 500 m from the SFH; and/or has public transport interchange with same mode of transport with more than one route, within 750 m from the SFH; and/or has a public transport interchange with more than one mode of transport (e.g., bus, monorail, train, ferry, etc.), within 1 km from the SFH. |
| BERDE | 1.00–4.00 | Has one or two public transport services: existing or currently planned funded commuter rail or light rail within 500 m walking distance; a bus stop for at least two public, campus, or private bus lines within 500 m walking distance; stop for at least two Asian utility vehicle (AUV) or public utility vehicle (PUV) routes within 250 m walking distance; shuttle service provided for the users from the SFH to any public transportation stops or stations; and/or has one or two appropriate transport amenities, which may include: covered walkways connecting the building entrances to transport waiting areas, covered waiting areas for public utility vehicle (PUV), terminals for PUVs and Asian utility vehicles (AUVs), and stations for public transportation routes accessible to the users of the project. |
| LOTUS | 1.25–2.50 | Has a mass transit services within 400 or 800 m from the SFH. |
| Considered by: | Influence (%) | The Influence Percentage Is Obtained When the Urban Environment: |
|---|---|---|
| BREEAM | 0.58–1.56 | Provides at least four amenities in a proximity of 500 m from the SFH; and/or provides at least seven amenities in a proximity of 1000 m to the SFH. |
| LEED | 0.91–1.82 | Has 4–7, 8–11, or more than 12 uses within an 800 m walking distance from the building entrance. |
| BEST | 0.91–1.82 | Has at least four or eight facilities within a 500 m walking distance. |
| CASA | 0.91–2.73 | Has 4, 7, or 11 basic community resources within 500 m; and/or has 7, 11, or 14 basic community resources within 1 km; and/or has transport services with at least 30, 60, or 125 trips per day of the week within 1 km from the SFH. |
| GBI | 1.00–4.00 | Has three or six amenities within 750 m from the SFH; and/or has another three or six different amenities within 750 m from the SFH. |
| BERDE | 1.00–2.00 | Has 5–9 or 10 key establishments, within a 250-meter radius from the SFH. |
| Green Homes | 1.33 | Has at least five basic house-hold amenities within a walking distance of 1 km from the SFH. |
| LOTUS | 1.25 | Has at least five different types of basic services within a 0.5 km radius from the SFH. |
| Indicator | NMA: Influence (%) | The Influence Percentage Is Obtained When the Urban Environment: |
|---|---|---|
| 1. Carbon Technologies | ENE: 0.39 | Has the infrastructure to provide low- or zero-carbon energy sources for the SFH. |
| 2. Internet Connectivity | ENE: 1.00 | Has infrastructure with access to internet service. |
| 3. Alternative Modes of Transport | INN: 0.78 | Has two of the following options or alternative modes of transport: communal car-club, electric recharging stations, or cycle storage spaces. |
| 4. Recycled Aggregates | INN: 0.39 | Has the infrastructure for transporting recycled or secondary aggregate, with a distance lower than 30 km by road transport to the housing unit. |
| 5. Compact Development | LCT: 0.91–2.73 | Has a DU/hectare of buildable land ≥ 17, 30, or 50. |
| 6. Construction Workers’ Amenities | LCT: 0.50 | Has accommodation for construction workers and has adequate health and hygiene facilities for workers. |
| 7. Heat Island Effect | MAT: 1.00–2.00 | Provides any combination of the following strategies for 50% or 75% of the site hardscape (including sidewalks, courtyards, plazas, and parking lots): shade (within 5 years of occupancy), and/or paving materials with a solar reflectance index (SRI) of at least 29, and/or an open grid pavement system. |
| 8. Non-Structural Building Walls | MAT: 0.63–1.88 | Has infrastructure to extract, harvest, and manufacture 40%, 60%, or 80% of the non-structural walls of the SFH. |
| 9. Flooring Materials | MAT: 0.63–1.25 | Has infrastructure to extract, harvest, and manufacture 40% or 80% of flooring materials of the SFH. |
| 10. Roofing Materials | MAT: 0.63–1.25 | Has infrastructure to extract, harvest and manufacture 40% or 80% of roofing materials of the SFH. |
| 11. Furniture | MAT: 0.63–1.25 | Has infrastructure to extract, harvest, and manufacture 25% or 50% of all furniture items of the SFH. |
| 12. Inclusive Design | TRA: 0.20 | Has communal or shared parking with spaces with a width of 3300 mm and maintains the distance from the public parking space to the dwelling entrance of ??? as a minimum, and is level or gently sloping. |
| 13. Street Network | TRA: 0.91 | Has high intersection density, defined as an area whose existing streets and sidewalks create at least 90 intersections per square kilometer. |
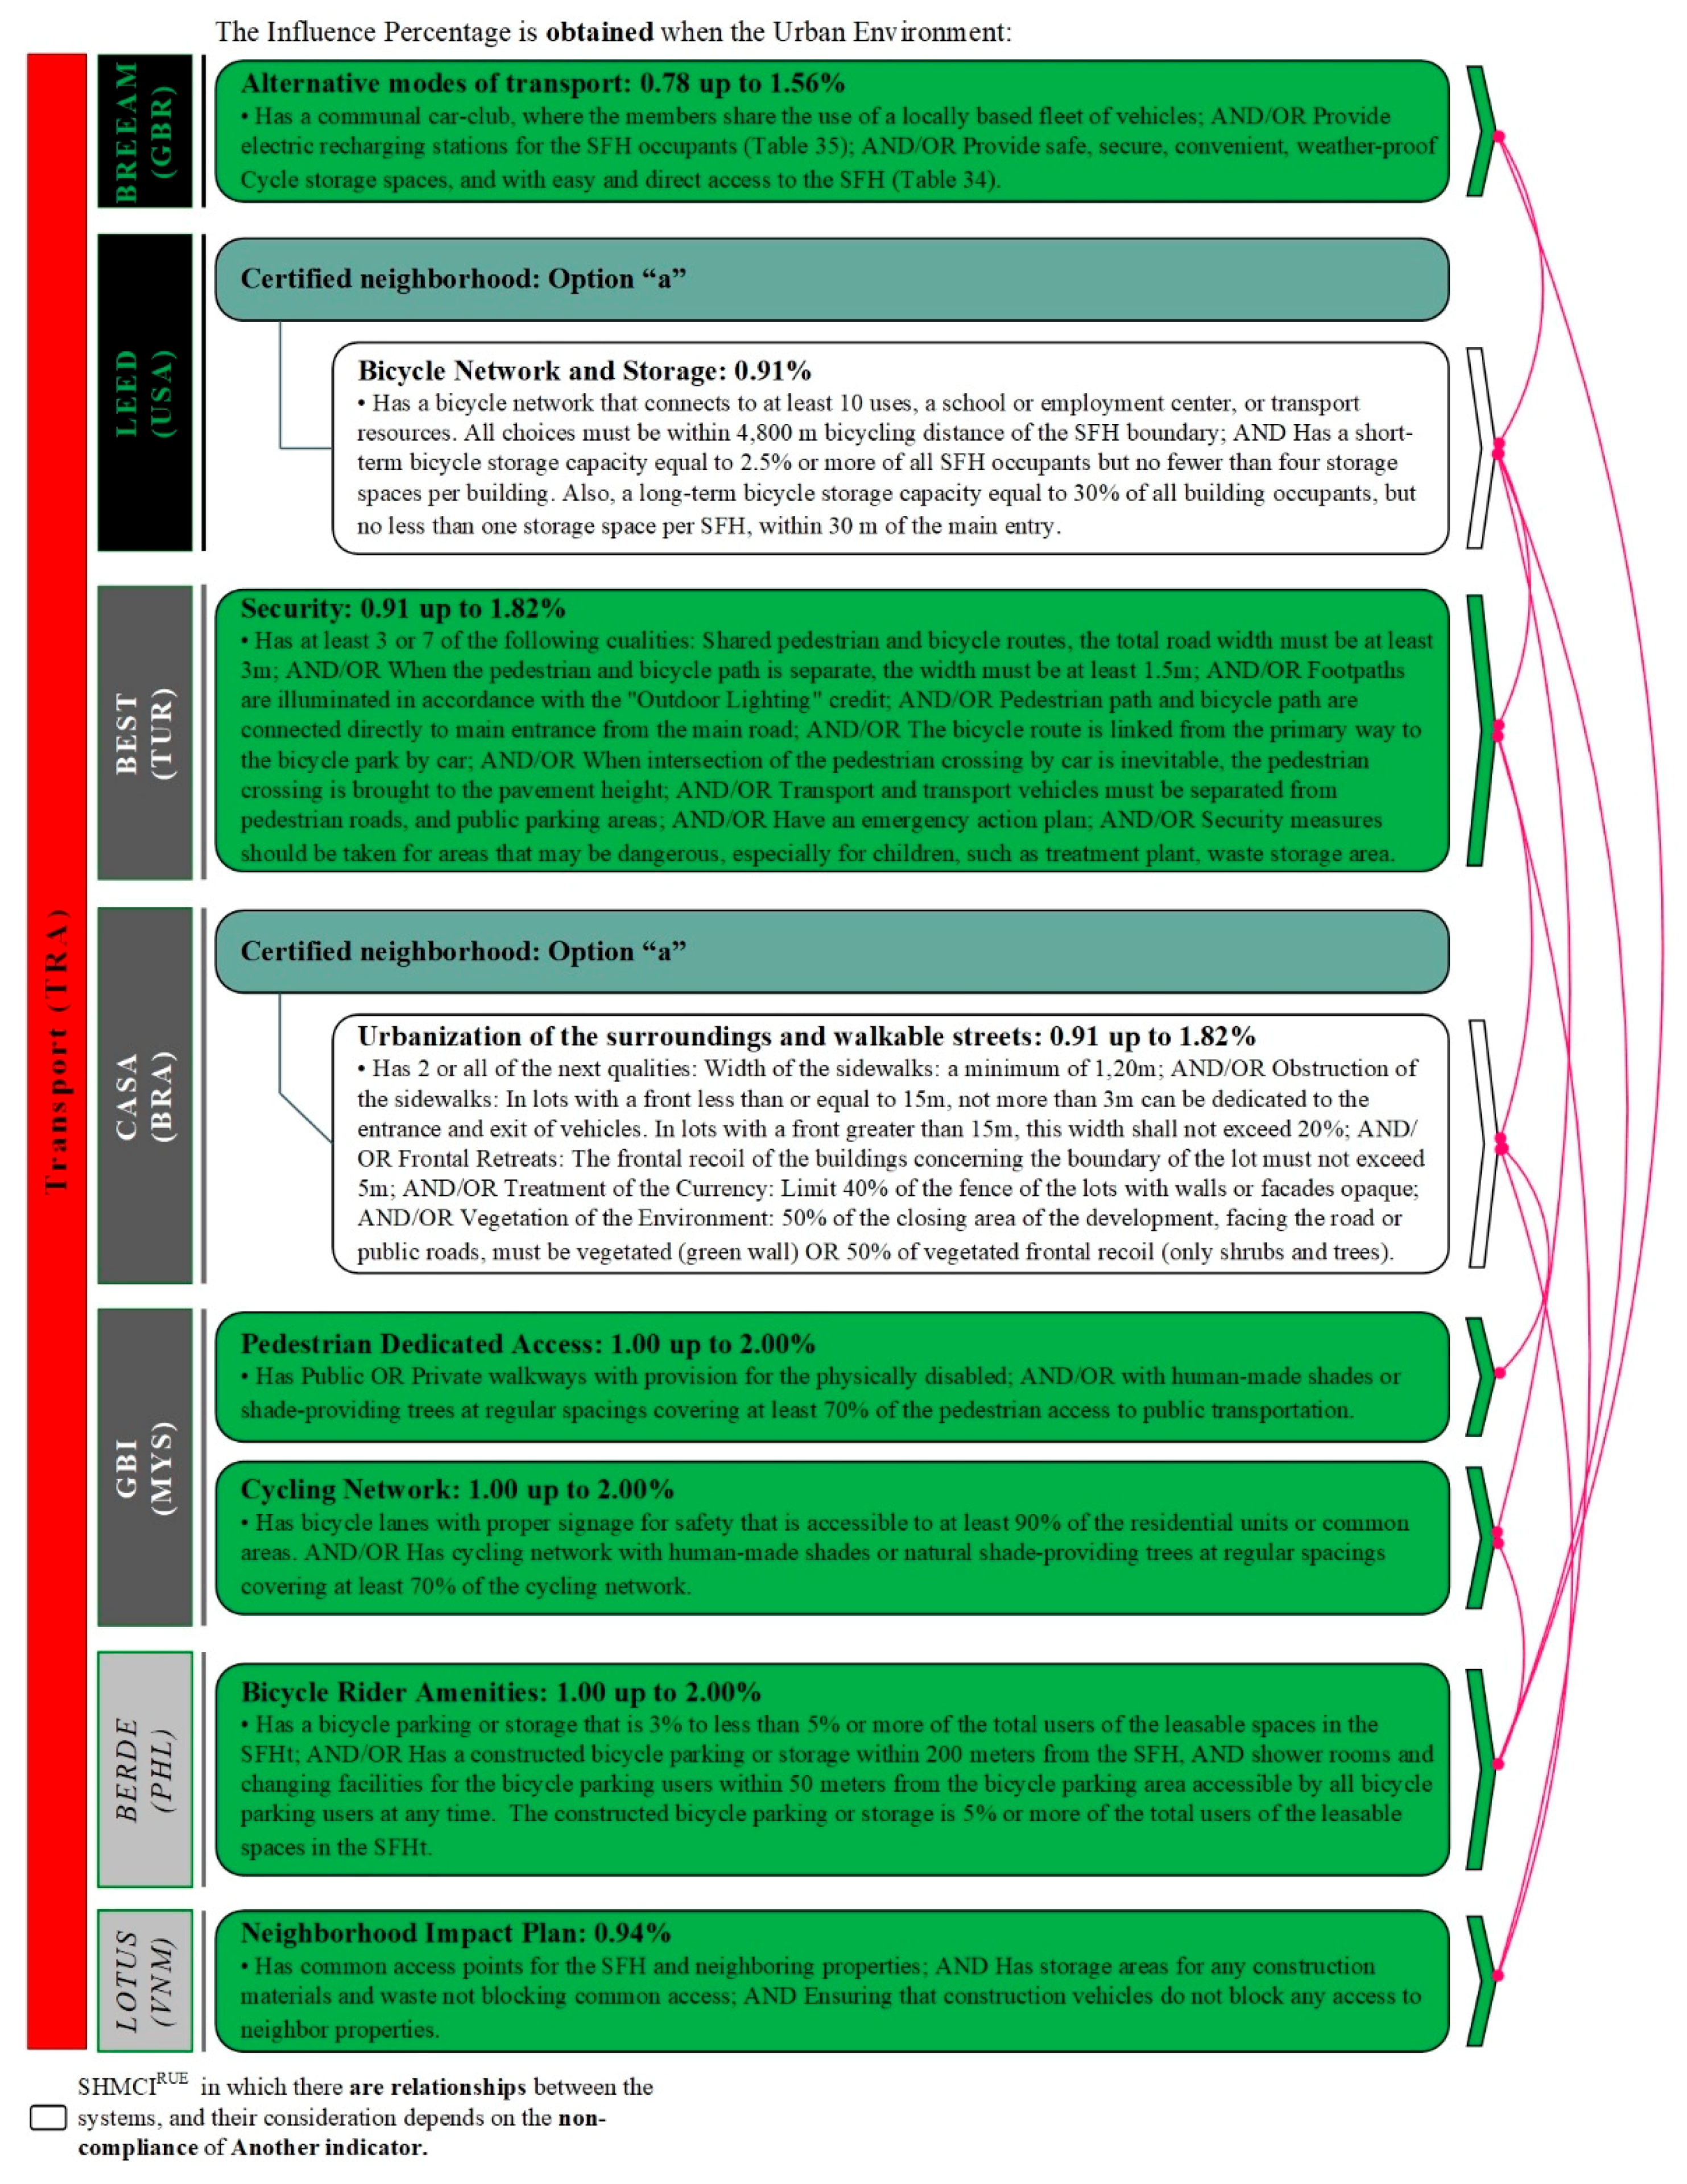
| 14. Alternative Modes of Transport | TRA: 0.78–1.56 | Has a communal-car club, where the members share the use of a locally based fleet of vehicles, and/or provides electric recharging stations for the SFH occupants (Table 35 in [67]). |
| 15. Composting | WST: 0.78 | Has an accessible local communal or community composting service, run by either a local authority or a private organization; or has a management plan, which is in place to ensure food or green waste is appropriately removed and delivered to an alternative composting facility; or has a local authority, private organization, or green/kitchen waste collection system. |
| 16. Recycling | WST: 0.39 | Has an established recyclable waste collection scheme. |
| Indicator | Considered by: Influence (%) | Variations | Most Rigorous |
|---|---|---|---|
| 1. Innovation | LEED: 0.91, CASA: 0.91–3.64 | 1 | LEED and CASA |
| 2. Exemplary Performance | LEED: 0.91, CASA: 0.91 | 1 | LEED and CASA |
| 3. Social Practices | BREEAM: 0.16–0.49, CASA: 0.16–0.45 | 2 | BREEAM |
| 4. Infill Development | LEED: 1.82, CASA: 0.91–1.82 | 2 | LEED |
| 5. Open Space | LEED: 0.91, CASA: 0.91 | 2 | LEED |
| 6. Regional Priority | LEED: 0.91–1.82, CASA: 0.45 | 2 | LEED |
| 7. Construction Noise | BEST: 1.82, LOTUS: 1.25 | 2 | LOTUS |
| 8. Health and Wellness | CASA: 0.45, BEST: 1.82 | 2 | BEST |
| 9. Recycled Aggregates | BREEAM: 0.39, BEST: 0.45 | 2 | BEST |
| 10. Building Structure | LEED: 0.23–0.68, LOTUS: 0.63–1.88 | 2 | LOTUS |
| 11. Windows and Doors | LEED: 0.23–0.68, LOTUS: 0.63–1.25 | 2 | LOTUS |
| 12. Cycling Network | LEED: 0.91, GBI: 1.00–2.00 | 2 | LEED |
| 13. Construction and Demolition Waste | CASA: 0.23–0.68, LOTUS: 0.50 | 2 | CASA |
| Indicator | Considered by: Influence (%) | Variations | Most Rigorous | Least Rigorous |
|---|---|---|---|---|
| 1. Renewable Energy | BEST: 0.45–1.36, CASA: 0.45–1.82, BERDE: 1.00 | 2 | BEST and CASA | BERDE |
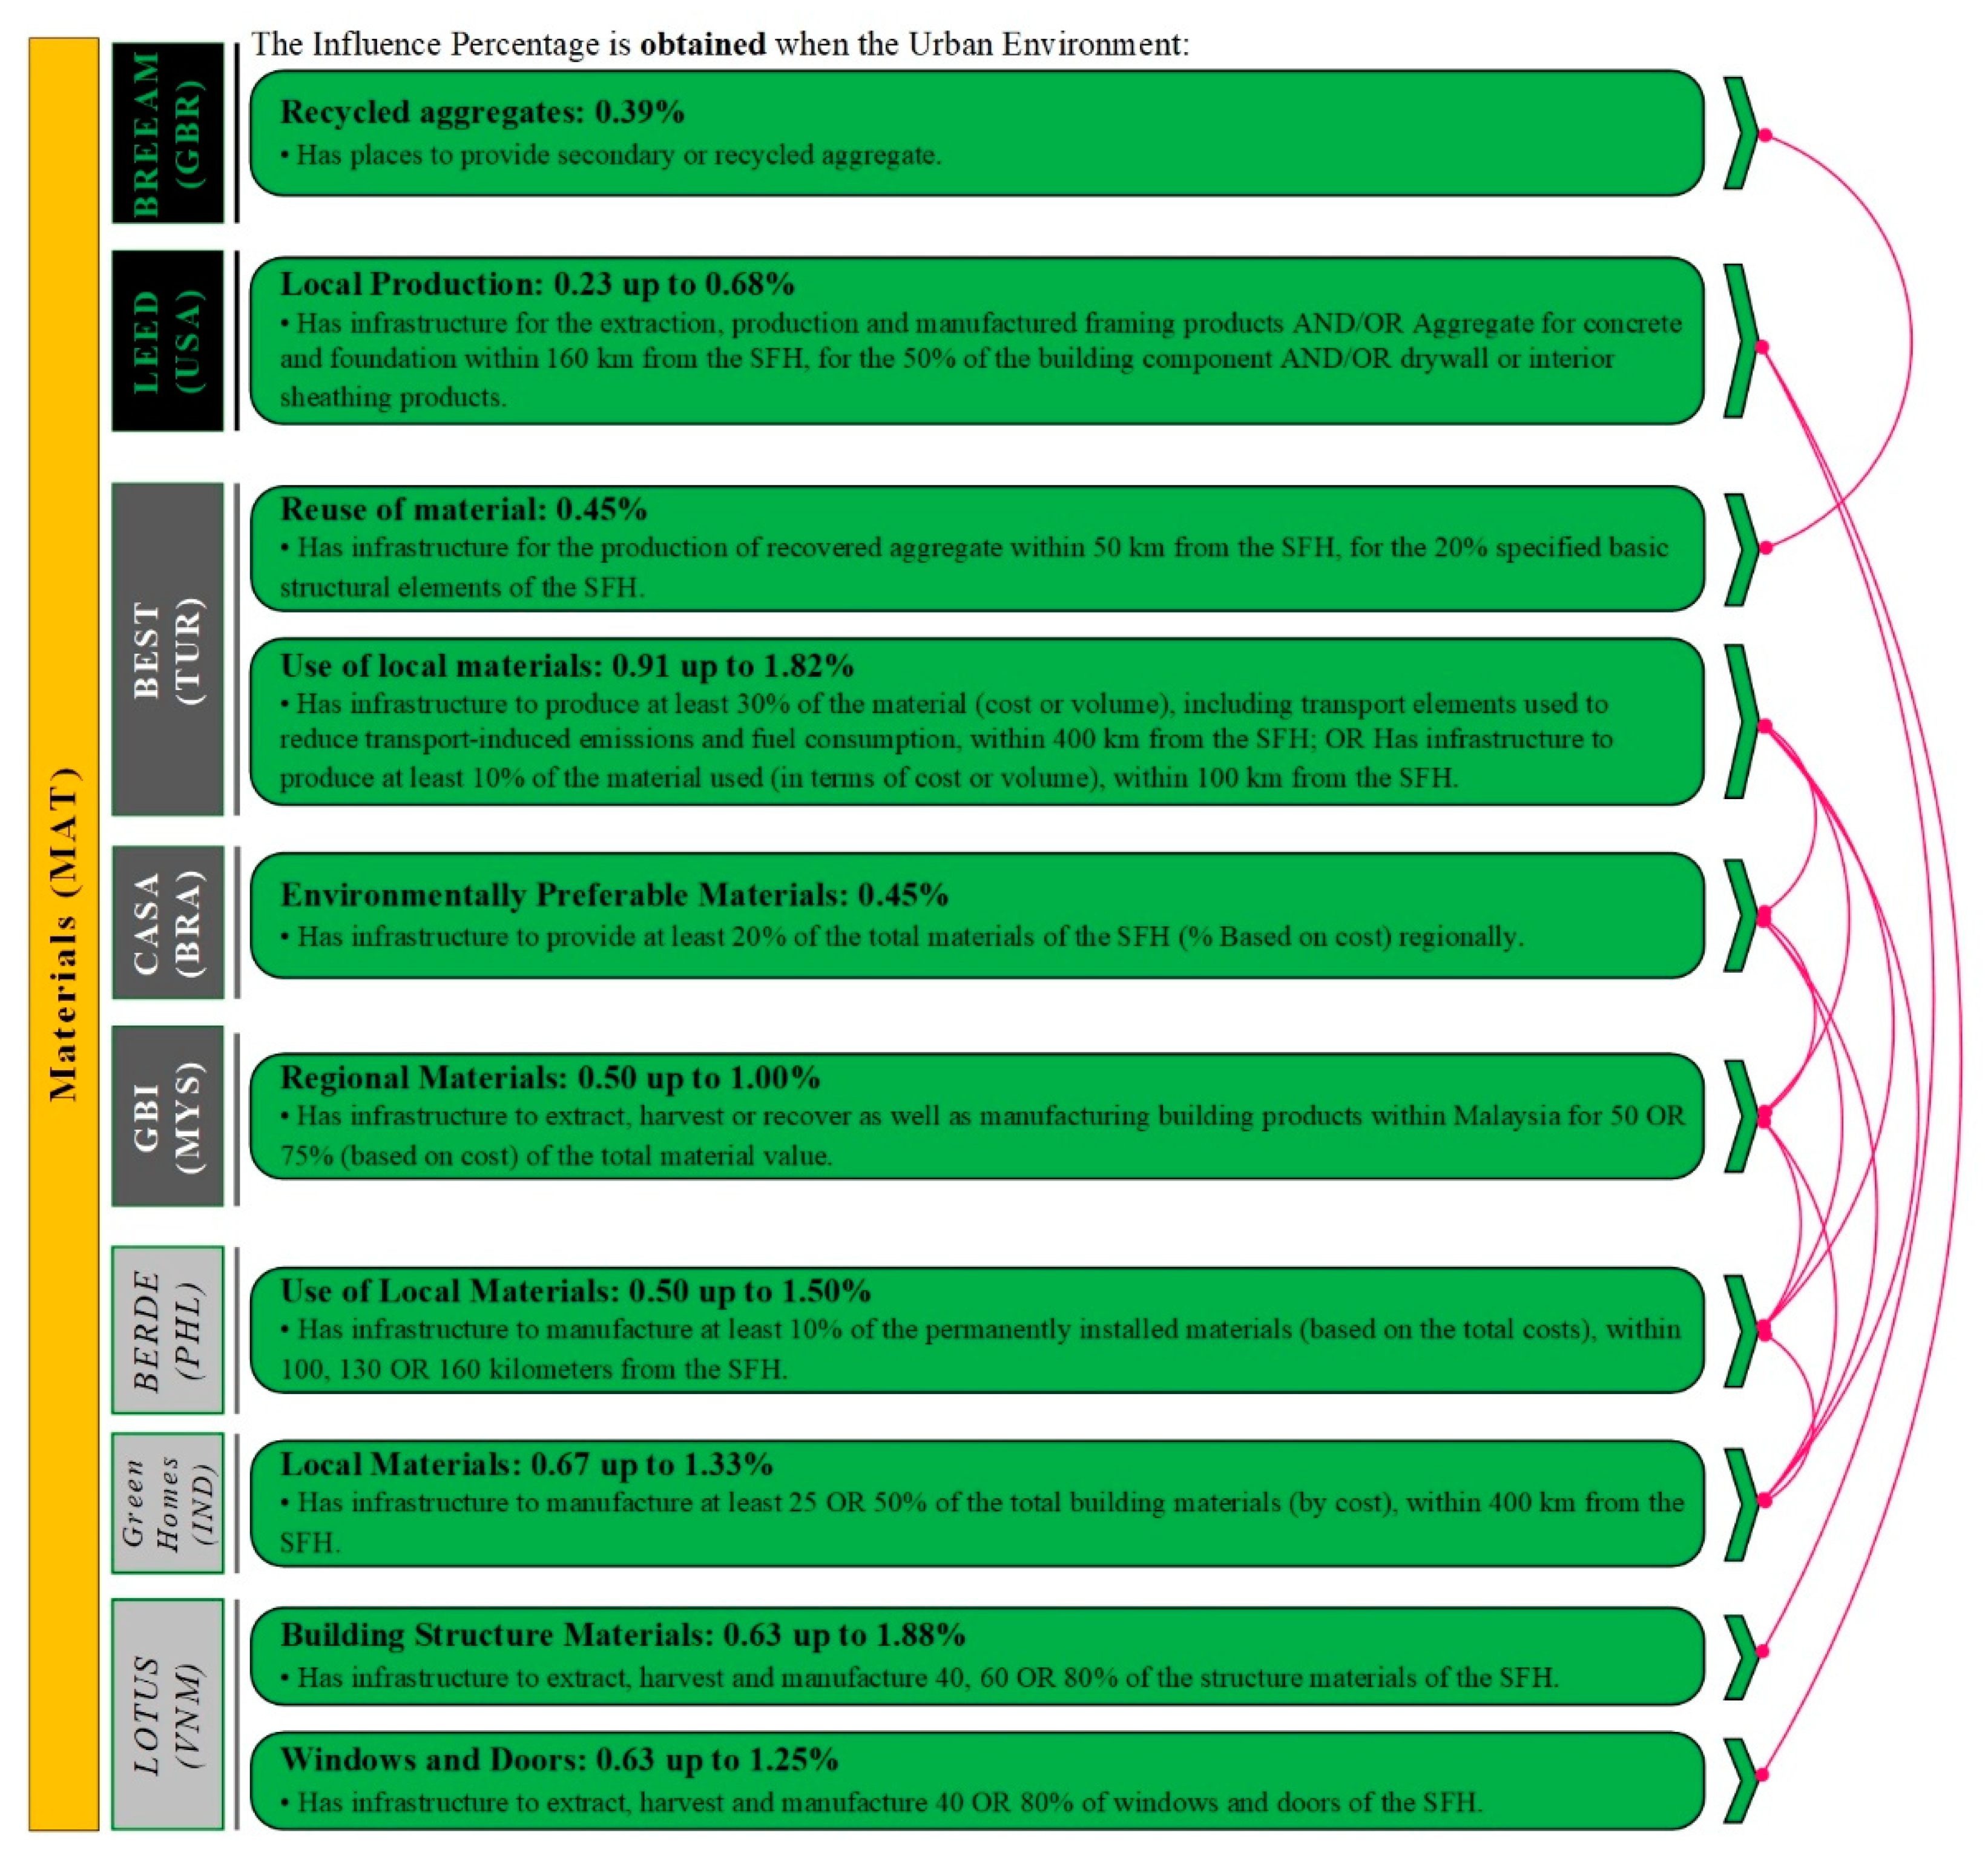
| 2. Local Materials | BEST: 0.91–1.82, CASA: 0.45%, GBI: 0.50–1.00, BERDE: 0.50–1.50, Green Homes: 0.67–1.33 | 5 | BEST | Green Homes |
| 3. Cycling Amenities | BREEAM: 0.78–1.56, LEED: 0.91, BERDE: 1.00–2.00 | 2 | BERDE | BREEAM |
| 4. Security | BEST: 0.91-1.82, CASA: 0.91–1.82, LOTUS: 0.94 | 2 | BEST | CASA |
| 5. Walkable Street | BEST: 0.91, CASA: 0.91–1.82, GBI: 1.00–2.00 | 2 | LEED | CASA |
© 2019 by the authors. Licensee MDPI, Basel, Switzerland. This article is an open access article distributed under the terms and conditions of the Creative Commons Attribution (CC BY) license (http://creativecommons.org/licenses/by/4.0/).
Share and Cite
Saldaña-Márquez, H.; Gámez-García, D.C.; Gómez-Soberón, J.M.; Arredondo-Rea, S.P.; Corral-Higuera, R.; Gómez-Soberón, M.C. Housing Indicators for Sustainable Cities in Middle-Income Countries through the Residential Urban Environment Recognized Using Single-Family Housing Rating Systems. Sustainability 2019, 11, 4276. https://0-doi-org.brum.beds.ac.uk/10.3390/su11164276
Saldaña-Márquez H, Gámez-García DC, Gómez-Soberón JM, Arredondo-Rea SP, Corral-Higuera R, Gómez-Soberón MC. Housing Indicators for Sustainable Cities in Middle-Income Countries through the Residential Urban Environment Recognized Using Single-Family Housing Rating Systems. Sustainability. 2019; 11(16):4276. https://0-doi-org.brum.beds.ac.uk/10.3390/su11164276
Chicago/Turabian StyleSaldaña-Márquez, Héctor, Diana C. Gámez-García, José M. Gómez-Soberón, Susana P. Arredondo-Rea, Ramón Corral-Higuera, and María C. Gómez-Soberón. 2019. "Housing Indicators for Sustainable Cities in Middle-Income Countries through the Residential Urban Environment Recognized Using Single-Family Housing Rating Systems" Sustainability 11, no. 16: 4276. https://0-doi-org.brum.beds.ac.uk/10.3390/su11164276