Article

Uptake of Climate-Smart Agricultural Technologies and Practices: Actual and Potential Adoption Rates in the Climate-Smart Village Site of Mali

by
Mathieu Ouédraogo
*,
Prosper Houessionon
,
Robert B. Zougmoré
and
Samuel Tetteh Partey
The CGIAR Program on Climate Change, Agriculture and Food Security (CCAFS), International Crops Research Institute for the Semi-Arid Tropics (ICRISAT), West & Central Africa Regional Office, BP 320 Bamako, Mali
*
Author to whom correspondence should be addressed.
Sustainability 2019, 11(17), 4710; https://0-doi-org.brum.beds.ac.uk/10.3390/su11174710
Submission received: 12 July 2019 / Revised: 5 August 2019 / Accepted: 7 August 2019 / Published: 29 August 2019
(This article belongs to the Section Sustainable Agriculture)

Abstract

:
Understanding the level of adoption of Climate-Smart Agriculture (CSA) technologies and practices and its drivers is needed to spur large-scale uptake of CSA in West Africa. This paper used the Average Treatment Effect framework to derive consistent parametric estimators of the potential adoption rates of eight CSA technologies and practices in the Climate-Smart Village (CSV) site of Mali. A total of 300 household heads were randomly selected within the CSV site for data collection. Results showed significant differences in the observed and potential adoption rates of the CSA technologies and practices (drought tolerant crop varieties, micro-dosing, organic manure, intercropping, contour farming, farmer managed natural regeneration, agroforestry and climate information service). The most adopted technology was the organic manure (89%) while the least adopted was the intercropping (21%). The observed adoption rate varied from 39% to 77% according to the CSA options while the potential adoption rates of the technologies and practices ranged from 55% to 81%. This implies an adoption gap of 2% to 16% due to the incomplete diffusion (lack of awareness) of CSA technologies and practices which must be addressed by carrying out more actions to disseminate these technologies in the CSV. Results showed that education, number of workers in the household, access to subsidies, and training have a positive effect on the adoption of most of the CSA technologies and practices. The adoption of drought tolerant varieties and micro-dosing are positively correlated with access to subsidies and training. The study suggests that efforts should be focused concomitantly on the diffusion of CSA options as well as the lifting of their adoption barriers.

1. Introduction

Climate change impacts on food security and livelihoods are already alarming and affecting millions of smallholder farmers in sub-Saharan Africa [1]. With increased frequency and severity of droughts, extreme heat conditions and over dependence on rainfed agriculture, there is a growing agricultural productivity crisis, dwindling household food availability and the economic prosperity of countries whose national economies are dependent on agriculture [2]. Considering that climate change impacts are felt differently within regions, context-specific adaptation measures are required to reduce risks and build adaptive capacity of smallholder farmers [2]. In semi-arid West-Africa, the multiple stressors of agricultural development in the region (including soil fertility depletion, land tenure, limited infrastructure and markets etc.) and high vulnerability to climate change has challenged the quest to use agriculture as a viable avenue for meeting the Sustainable Development Goals’ zero hunger and poverty reduction targets [3].
In recent years, climate-smart agriculture (CSA) has been embraced as a unique opportunity for simultaneously achieving food security, climate change adaptation and mitigation goals [4]. While the concept is still being investigated, many agricultural practices underpinning CSA have been profiled and tested. In the last eight years, the CGIAR Research Program on Climate Change, Agriculture and Food Security (CCAFS) has been addressing the need for proven and effective CSA options using its Climate-Smart Village (CSV) approach. The CSV approach enables ground-breaking research on agricultural technologies and practices to define their potential to deliver on the food security, adaptation and mitigation goals of CSA. Based on the principles of participatory action research, the CSV approach enables farmers to pick practices and technologies that meet their local specific needs and allows drawing lessons on agricultural technologies and practices to inform policy decisions from local to global levels [5]. The paper by Aggarwal et al [5] provides a comprehensive overview of the CCAFS CSV approach.
In Mali, the CSV approach has since 2011 been used to test and validate many CSA technologies and practices (including drought tolerant crop varieties, micro-dosing, organic manure, intercropping, contour farming, farmer managed natural regeneration, agroforestry and climate information services) with the participation of farmers. Several authors have reported successful results of CSA technologies tested and their implications for local food security [6,7,8,9] and income [10]. This notwithstanding, there is limited information on the uptake and adoption of CSA practices and technologies. In sub-Saharan Africa, adoption of agricultural technologies and practices are thought to be constrained by multiple factors [11,12]. Therefore, to enable large scale adoption, it is imperative to understand the influential factors of technology adoption.
Most studies aiming to assess the uptake of new technologies or programs have done so using the classical approach by simply computing the percentage of adopters from survey samples [11,12]. However, this approach suffers from either “non-awareness” or “selection” bias. Consequently, the estimates of population adoption rates generated from the classical approach are generally biased and inconsistent, even when they are based on a randomly selected sample [13]. In a bid to solve this problem, Diagne [13] used the average treatment effect (ATE) framework of modern evaluation theory [14,15,16] to estimate the potential adoption rate of rice varieties when the population’s awareness of the technology is total. As the concept of CSA is relatively new [4], the exposure of farmers to its technologies and practices may be incomplete. When a technology is new and the target population has not been fully exposed to it, the observed rate of adoption (calculated as the proportion of the sample that has adopted the technology) is a biased estimate of true potential adoption rate of the population [13,17] due to the existence of a "non-exposure" bias. This situation requires the use of the ATE framework to derive consistent parametric estimators of the adoption rates of CSA technologies and practices.
In this paper, we used this approach to estimate the actual and potential adoption, the associated adoption gaps and the drivers of awareness and adoption of CSA technologies and practices in the CSV site of Mali.

2. Materials and Methods

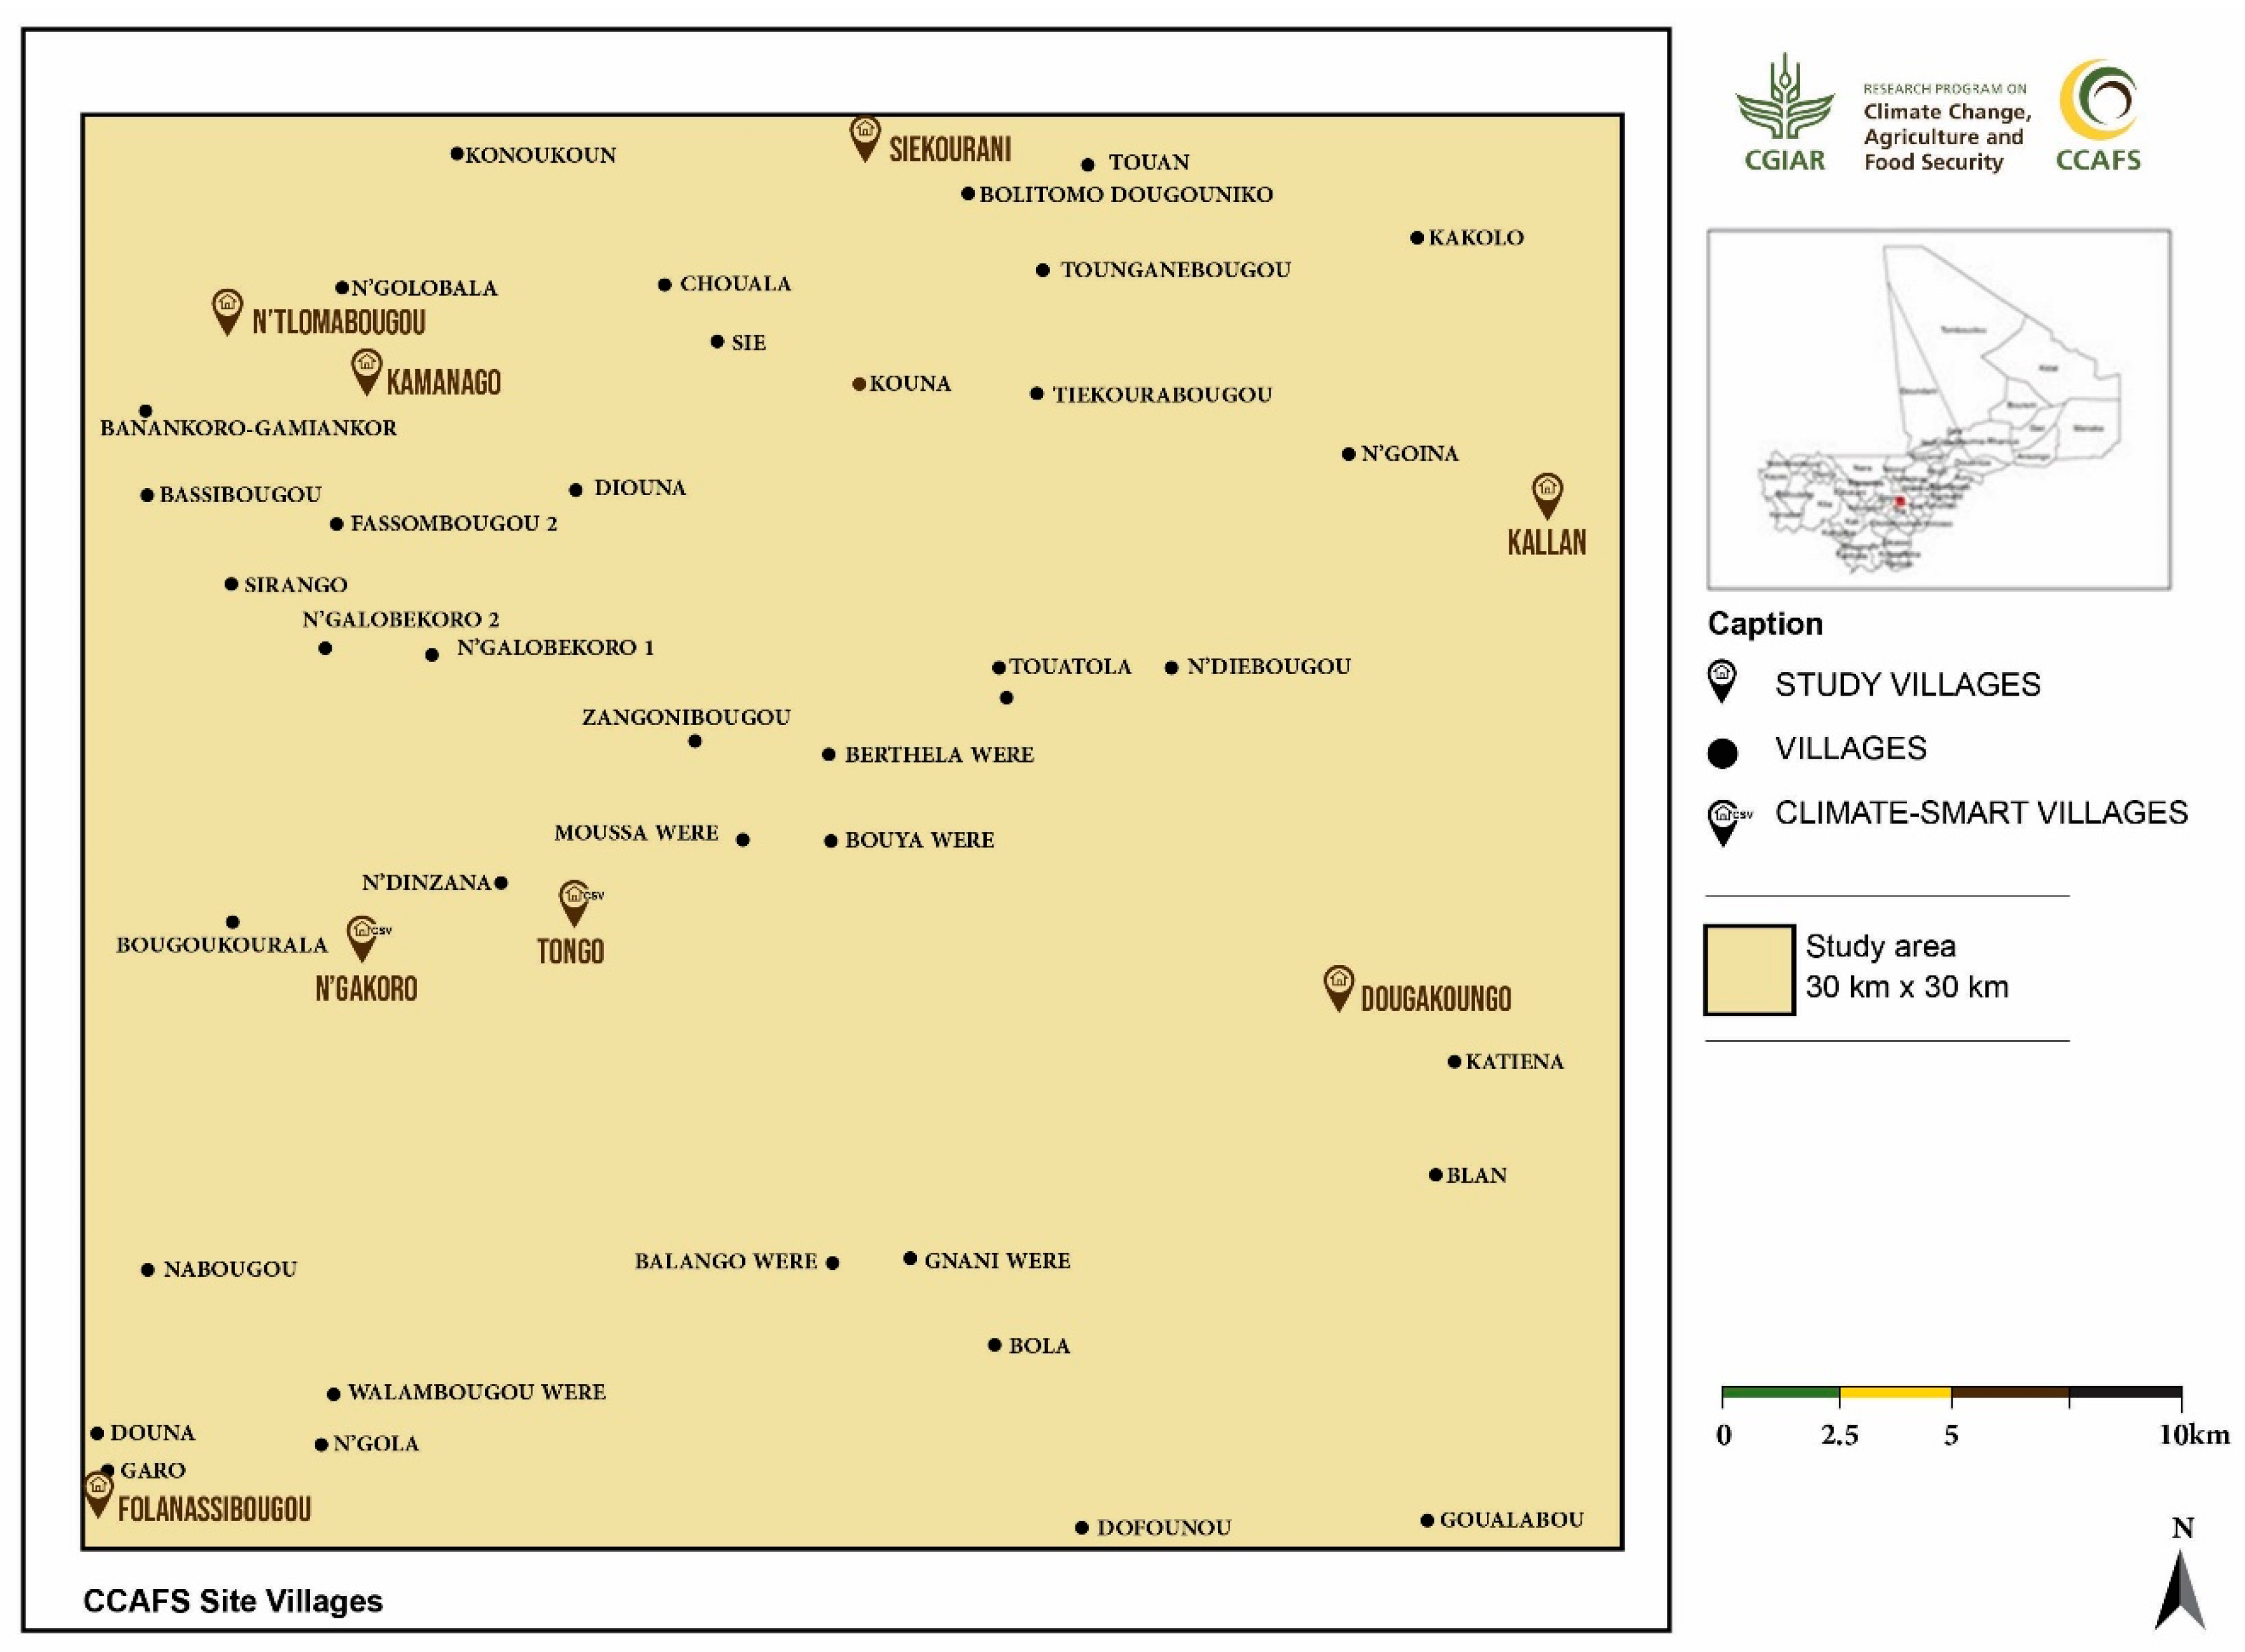
2.1. Study Area and Data

The study was carried out in the Segou region of Mali, within the Climate-Smart Village (CSV) site of Cinzana, a rectangular 30 by 30 km block covering 48 villages and established by the CGIAR Research Program on Climate Change, Agriculture and Food Security (CCAFS). Located between 13°53’N and 13°14’N latitude and 5°63’W–6°15’W longitude (https://ccafs.cgiar.org/mali), Cinzana belongs to the Sahelian agro-ecological zone of Mali. Rainfall is uni-modal, from May to October, with an average of 680 mm total rainfall per annum. Low temperatures occur in December through February (18°C monthly average low), and high temperatures occur in April and May (40°C monthly average high) [7]. Millet and sorghum are the most staple cereals produced in the study area while groundnut, cowpea and sesame are cultivated as major cash crops [18]. The agricultural system is rainfed with one cropping season a year. The study focused on eight villages within the CSV site - Folanassibougou, N’Tlomabougou, Tongo, Siekourani, Kamanago, Dougakoungo, N’Gakoro and Kallan (Figure 1). These villages were selected based on the distances from each other to make the data more representative of the entire CSV site of Cinzana [19].
Data were collected in 2016 through household interviews using a structured questionnaire to record information on socio-economic characteristics of farmers, farming activities and characteristics as well as the levels of awareness and adoption of technologies and their sources, advantages of and constraints to using CSA technologies and practices. 300 households were randomly selected, of which 60 were from the two CSVs and 30 from each of the six other surrounding villages within the 30 x 30 km block (CSV site). This weighting gives opportunity to conduct deeper analysis at the CSV level.

2.2. Theoretical Framework for Adoption Assessment

The study used the Average Treatment Effect (ATE) estimation method [16,20], which allows a coherent estimation of the potential adoption rate of the population [16,20]. This is in fact the adoption rate when all individuals in the population are exposed to the technology. These authors indicate that the ATE measures the effect of an average treatment on individual basis chosen randomly in the population, which exactly corresponds to the potential adoption rates of the population when individuals are exposed to the treatment. This methodology is most appropriate for this study due to the selection bias and the non-exposure bias [21,22,23]. The bias results from the fact that farmers who are not exposed to CSA technologies and practices cannot adopt them, though they would do if they had learned of these innovations. Also, the determinants of the effects of exposure cannot be estimated consistently from simple probit, logit or tobit models without controlling the non-exposure bias. In our study, ''treatment'' refers to the exposure of farmers to CSA practices (with the knowledge as proxy). With the ATE method, it is possible to assess the Average Treatment Effect on the treated (ATE1) as well as the Average Treatment Effect on the untreated (ATE0). ATE1 andATE0 correspond to the adoption rate in the exposed subpopulation and the potential adoption rate in the non-exposed subpopulation, respectively. the sub-population of farmers who did not receive the treatment. The estimation of the ATE undoubtedly requires control of whether or not access to information on CSA technologies and practices is used and the use of other variables such as socio- economic and demographic variables and institutional variables. This leads to the following conditional adoption probability:
P r o b ( y i = 1 | w i = 1 ) = E ( y i | w i * > 0 )
With
y i the decision to adopt or reject the CSA technologies or practices, taking the value 1 when the farmer adopts and 0 if otherwise.
w i is a binary variable with the value 1 if the farmer is aware of the CSA practices and 0 if not.
Equation (2) is used to consistently estimate the rates and determinants of adoption of CSA practices by specifying the linear model [24]:
E ( y | x , w = μ + τ w + α x + ζ w ( x i x ¯ )
Where:
x i is the set of socio-economic variables affecting the adoption of a CSA technology or practice x ¯ their respective average;
μ , ζ and α are the parameters to be estimated. τ accurately represents the rate of adoption within the ATE population.
ATE parameters can be estimated using several alternatives: parametric, nonparametric and semi parametric [16]. In this study, we used the parametric estimation procedure described by [20]. The parametric estimation of ATE is based on the following equations that identify the ATE ( x ) based on the conditional independence hypothesis [20].
A T E ( x ) = E ( y 1 / x )     = E ( y / x ,   w = 1 )       = g ( x , β )
Where:
g is a known function (eventually non-linear) of vectors of the covariants x ; β an unknown parameter that can be estimated from the standard least squares (LS) and the estimation of maximum likelihood (MLE) using observations ( y i , x i ) from the sub-sample of exposed farmers ( w   =   1 ) only; with y as the dependent variable and x the vector of the explanatory variables. The variable w is an indicator of the exposure to CSA’s practices, where w i = 1 represents the exposure of the individual i and w 0 = 0 otherwise.
With an estimated parameter β ^ , the predicted values are calculated for all the observations i in the sample (including the observations in the non-exposed subsample), and ATE, ATE and ATE0 are estimated by taking the average of the predicted g ( x i , β ^ )   i = 1 , ,   n across the full sample (for ATE) and respective subsamples (for ATE1 and ATE0) by [21].
A T ^ E = 1 n i = 1 n g ( x i , β ^ ) A T ^ E 1 = 1 n e i = 1 n w i g ( x i , β ^ ) A T ^ E 0 = 1 n n e i = 1 n ( 1 w i ) g ( x i , β ^ )
The effects of the determinants of adoption as measured by the K marginal effects of the K-dimensional vector of covariates x at a given point x ¯ are estimated as:
E ( y 1 | x ¯ ) x k = g ( x ¯ , β ^ ) x k         k = 1 , , K
where x k is the k-th component of x.
Using the parametric regression-based estimator above, we can estimate the population adoption gap ( G A ^ P = J E ^ A A T ^ E ) and the population selection bias ( P S ^ B = A T ^ E 1 A T ^ E ) parameters where J E ^ A = 1 n i = 1 n y i .

2.3. Empirical Model

Several studies have tried to identify the most influential factors for the adoption of sustainable agricultural practices [18,25,26,27,28,29]. These are categorized into household characteristics, farm characteristics, technical knowledge and institutional characteristics. The household characteristics include gender, age, education level, household size, off-farm activities and farming experience. The farm characteristics include land size, farming purpose, number of cash crops, livestock, and animal traction. The technical knowledge and institutional characteristics include extension service, access to credit and subsidy, and membership in farmer groups.
Table 1 presents the explanatory variables and hypotheses about their expected effects on the awareness and adoption of CSA technologies and practices.

3. Results

3.1. Socio-economic Characteristics of Households

Table 2 analyses the household and farm characteristics, and the technical knowledge of farmers. The sample comprised 11% of migrants as household heads. The average size of households was 17 with six (6) persons making the labor force. The average age of respondents was 51 years with 26 years of farming experiences. On average, 98% of respondents were men while 69% were farmers who received an education. About 72% of farmers were members of farmers’ organization while 20% and 30% respondents had access to credit and subsidies respectively. In addition to agriculture, about 36% of respondents earned income from off-farm activities.
The land owned by households totaled on average, 11 hectares (ha) while on average 9 ha were cropped. 14% of farmers practice subsistence agriculture, with on average, two (2) cash crops grown in the farms. About 98% of respondents own livestock including cattle, goat, sheep, chicken and Guinea fowl. At least each farmer was equipped with a plough and cart in his farm. About 68% of households have cattle drawn. The survey revealed that 75% of households attended trainings in agricultural production while 42% benefited from public extension services. The training topic included the use of crop varieties, soil fertility management and use of climate information. Mobile phone and radio were the tools used for agricultural information, with 76% and 90% of respondents having a radio and a phone, respectively.

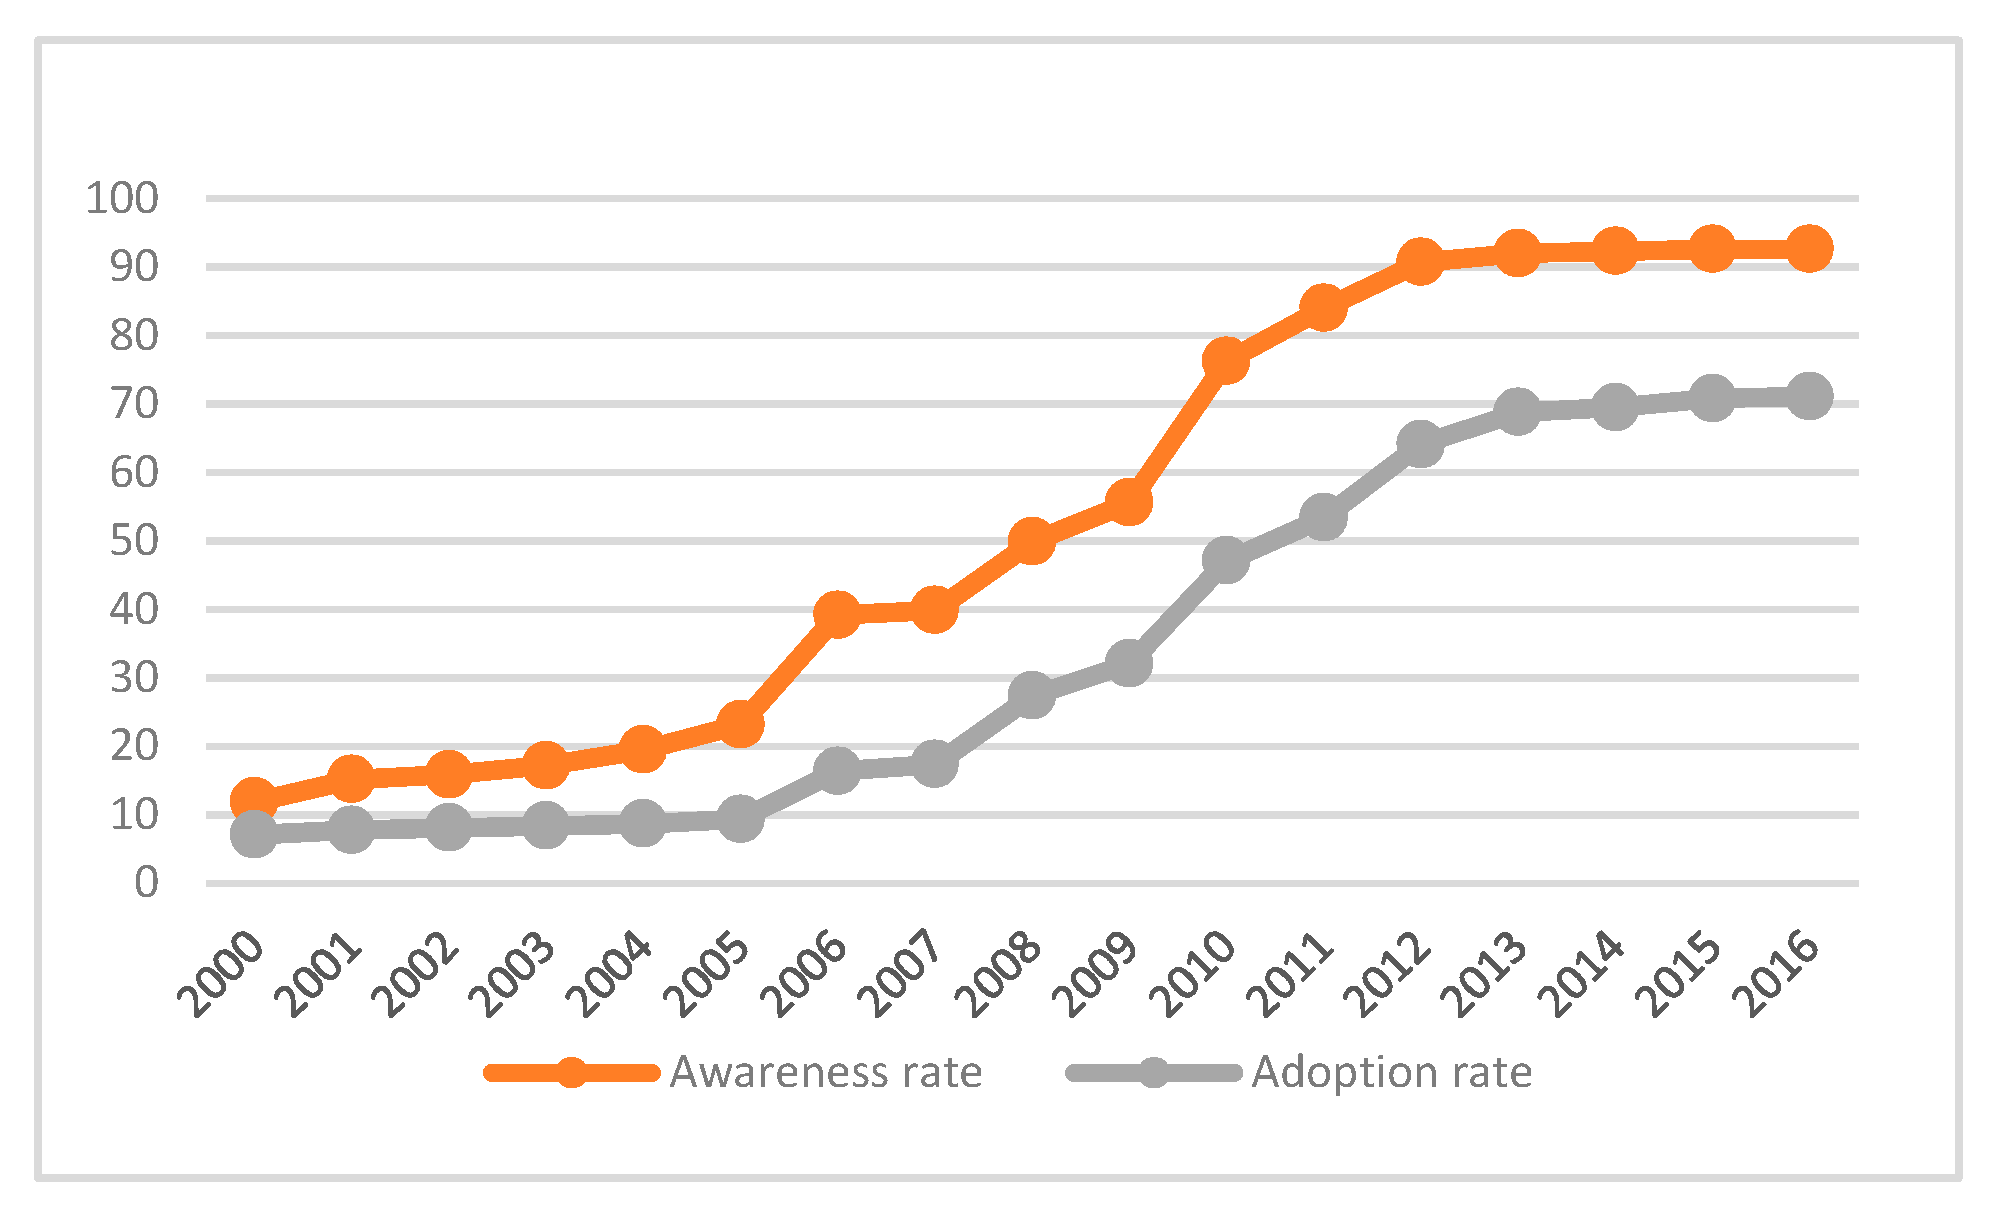
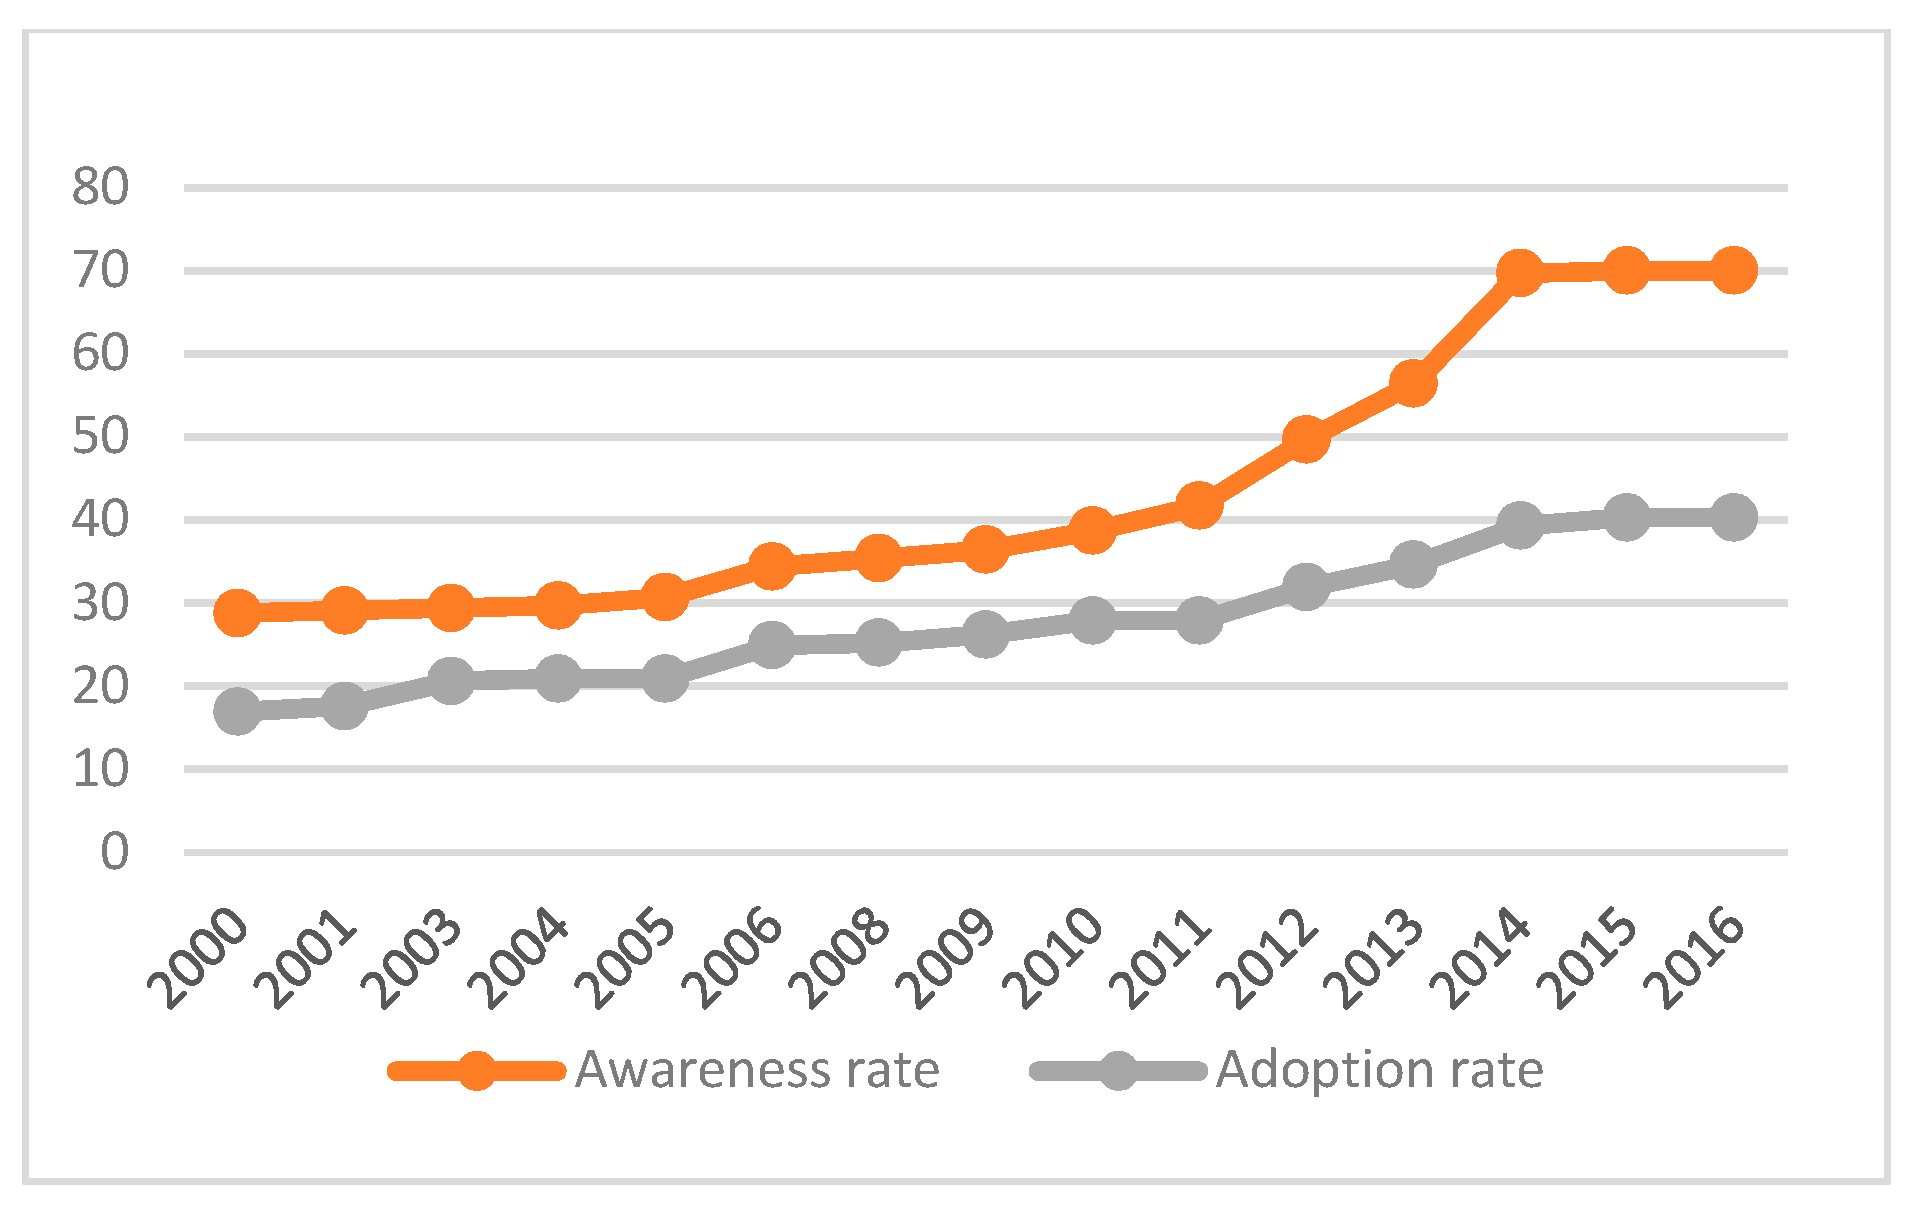
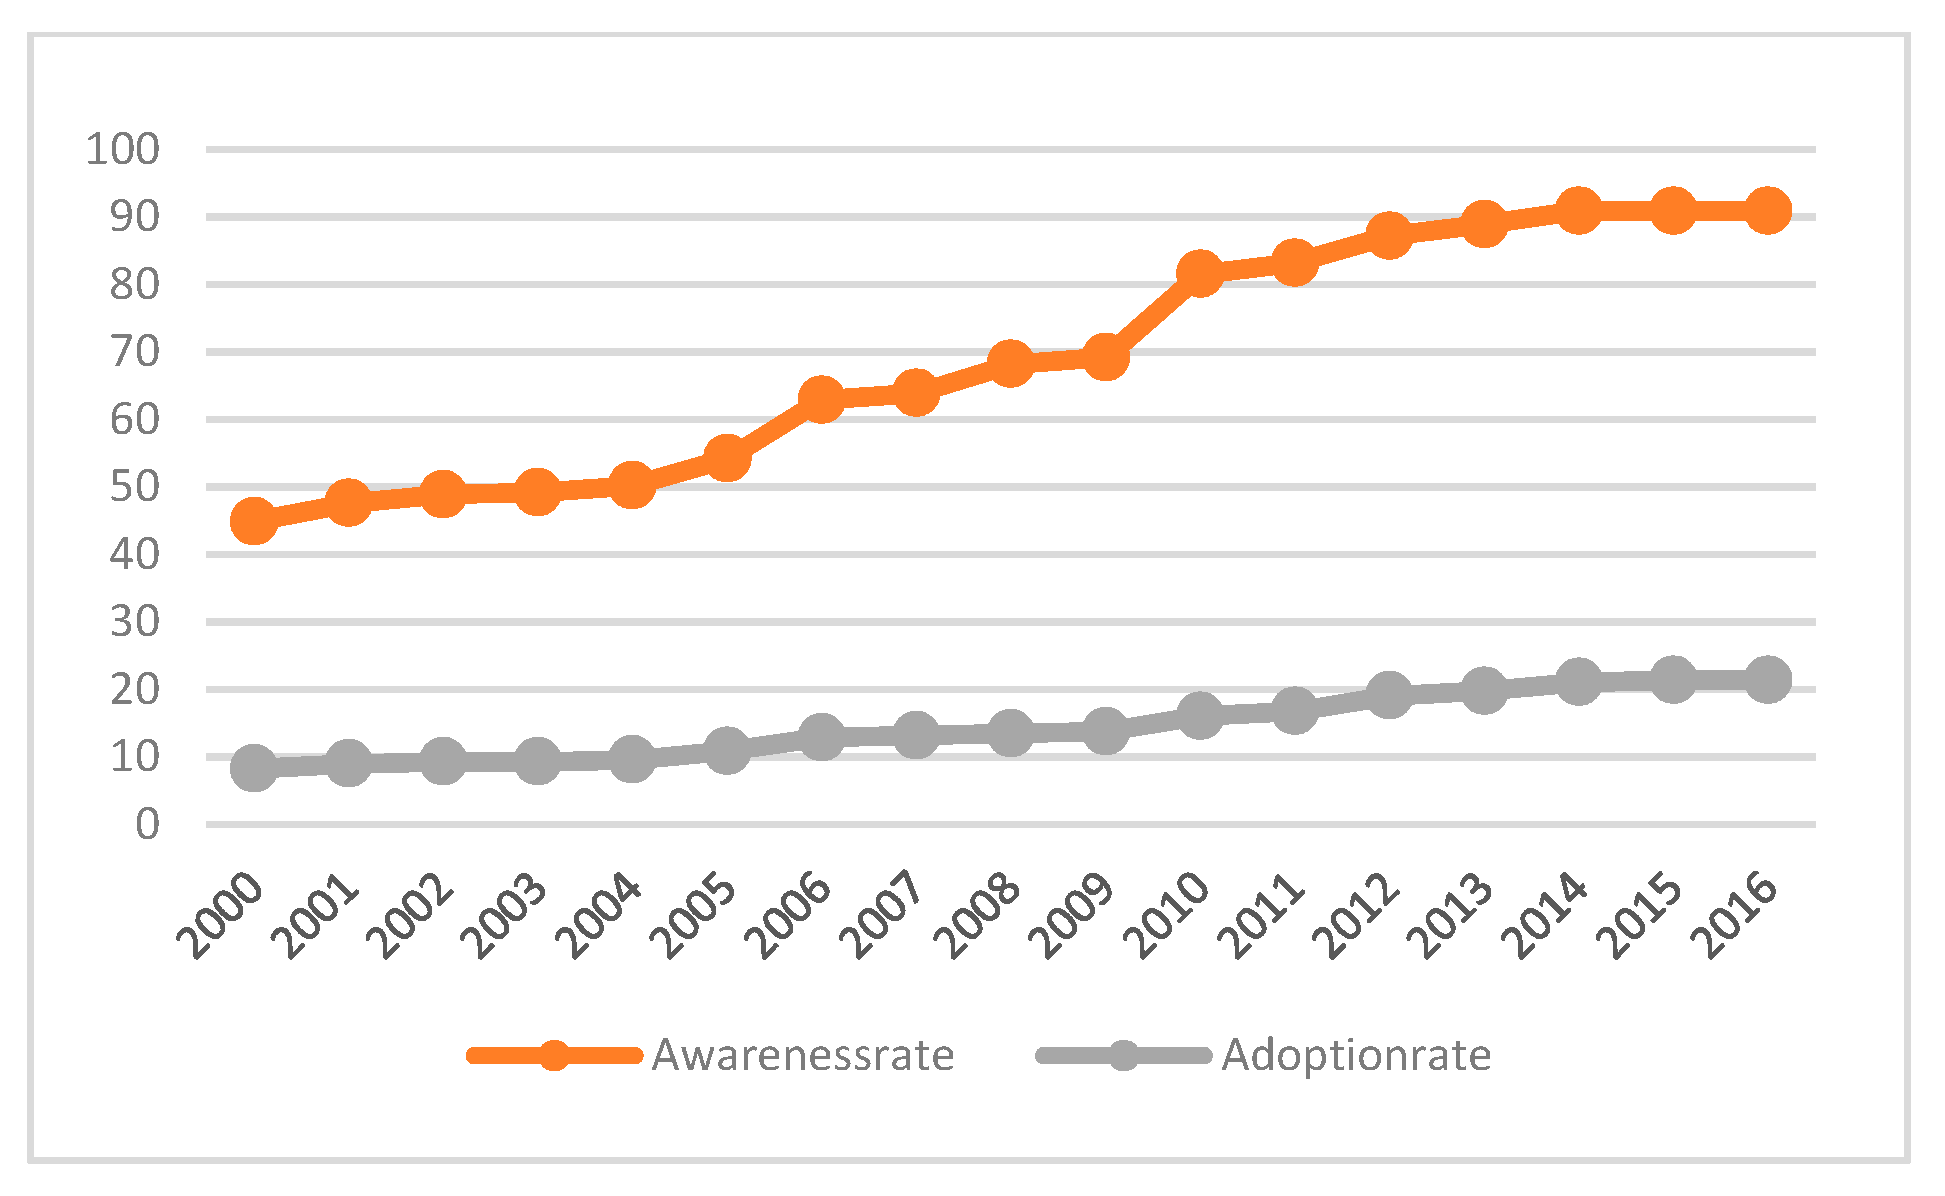
3.2. Awareness and Utilization of CSA Technologies and Practices in the CSV Site of Cinzana

The awareness and adoption rates of the CSA options increased from 2000 to 2016 (Figure 2, Figure 3, Figure 4, Figure 5, Figure 6, Figure 7, Figure 8 and Figure 9). During these 15 years, it was evident that awareness and adoption rates of CSA technologies and practices increased in Cinzana. This increase is important since CCAFS interventions in the study area began in 2011. The increase in awareness and adoption imply that CCAFS CSV approach contributed to improving the awareness and the adoption of CSA technologies and practices in the area. For example, the use of organic manure saw spreading from 41.2% to 99.6% while the dissemination rate of improved variety increased from 32.9% to 95.6%. The dissemination rate of intercropping and farmer managed natural regeneration (FMNR) increased from 72.9% to 94.3% and 68.9% to 94.3% respectively. Moreover, increased rates were observed for practices such as micro-dosing (44.9% to 90.9%), agroforestry (27.5% to 86.5%), climate information services and contour farming (28.8% to 70.00%). The adoption rates rose from 34.3% to 89.3% over 15 years for organic manure (Figure 3) which is the highest rate observed among the CSA practices. Intercropping was adopted 21.2% more (Figure 5), FMNR 30% more and micro dosing 61.1% more. Adoption rates of improved variety, climate information services and contour farming increased by 49%, 54% and 23% respectively.
The results showed that, while most farmers are aware of many CSA practices and innovations, only a small number of the farmers are adopting the practices. For example, about 87% of farmers are aware of agroforestry practice, but only 21.40% adopted this practice in 2015 in CSV site of Cinzana.

3.3. Perceveid Reasons and Constraints to Adopting CSA Technologies and Practices

Varying reasons were cited for the adoption of CSA options. However, majority of the farmers interviewed cited improved productivity as the major reason for adopting a CSA option. As reported in Table 3, improvement in productivity is the adoption driver for improved variety (by 57% of farmers), organic manure (41%), micro-dosing (45%), and intercropping (37%). Climate information services is adopted by farmers (81% of respondents) to reduce the risk of crop losses. Moreover, 54% farmers used contour farming for soil moisture retention. By adopting intercropping and using drought tolerant crop varieties, some respondents reported increased income. In addition, 78% and 90% farmers adopted FMNR for improved access to non-timber forest products and fodder for livestock feeding respectively.
Major constraints associated with the use of CSA options are the inappropriateness of practices, the lack of information about the CSA option, limited technical capacity to handle the CSA options and the illiteracy of farmers. Table 4 shows that 39% of respondents thought that the FMNR was not suitable following. About 36%, 35%, 31% and 20% reported the same for improved variety, intercropping, micro-dosing and organic manure respectively. The illiteracy of farmers coupled with the lack of technical capacity are also part of constraints that respondents faced in adopting a CSA practice. Some respondents also raised up the issue of information dissemination on the CSA practices.

3.4. Determinants of Awareness of CSA Practices

Table 5 shows the determinants of awareness of CSA practices. Variables such as education, extension service, experience in farming, training in agricultural production and owning a radio were statistically significant (p ≤ 0.05) to explain the awareness of CSA options in the Climate-Smart Village site.
Farmers with formal education are more likely to be aware of the CSA technologies and practices. Formal education increases the probability of awareness to drought tolerant improved variety, intercropping system and FMNR practice by 4%, 8% and 5% respectively. Farmers in contact with extension services are more likely to be aware of drought tolerant improved variety and micro-dosing practices. The probability of being aware of drought tolerant improved variety and micro-dosing practices increased by 6% and 8% through contact with extension services. Experienced farmers and those owning lands are more likely to be aware of drought tolerant improved variety and climate information services.

3.5. Actual and Potential Adoption of CSA Technologies and Practices

The ATE probit estimation was conducted for 8 CSA technologies and practices. The results were found consistent for 6 CSA options including drought tolerant improved variety, micro-dosing, intercropping, contour farming, Farm managed natural regeneration (FMNR) and Climate Information Services (CIS). The results showed that a high proportion (more than 70%) of farmers in the Climate-Smart Village were aware of CSA technologies and practices (Table 6). The estimated adoption rates varied from 39 to 77% according to the CSA option. The potential adoption rates ranged from 55 to 81% according to the CSA options. The difference between the observed and the potential adoption rates lead to an adoption gaps varying from 2% to 16%. Contour farming and climate information services recorded the higher adoption gap of 16% and 7.7% respectively.

3.6. Determinants of Adoption of CSA Practices

Table 7 indicates that the adoption of drought tolerant varieties and micro-dosing are positively associated with access to subsidies, training on choice of variety, training on climate information services and use of animal traction. These four factors increased the probability of adopting tolerant improved varieties by 13%, 15%, 11% and 24% respectively. The likelihood of adopting micro-dosing is increased by 20.00%, 14.00% and 14.00% with access to subsidies, training on climate information service and use of animal traction respectively. The use of animal traction and training have a positive effect on the practice of intercropping while the number of workers in the household has a negative effect on this practice. The practice of contour ridging is negatively associated with education and training in CIS and positively associated with having a phone. The practice of FMNR is negatively associated with access to subsidy and owning a phone and positively associated with education and the number of workers in the household. The probability of using climate information service increases with access to training in CIS, access to subsidies, and experience in farming which increased its probability of adoption by 20.00%, 14.00%, 20.00% and 0.40% respectively. However, education and animal traction had a negative effect on the use of CIS and contour farming.

4. Discussion

The results of the study raised two areas of discussion including adoption gap and factors that are currently affecting the awareness and adoption of CSA practices and technologies within the CSV.

4.1. Awareness and Adoption of CSA Practices and Technologies: Adoption Gap

The findings of the study illustrate that there is an adoption gap for CSA technologies and practices in Cinzana at two levels. The first level gap refers to the difference between awareness and adoption rates and the second level is related to the difference between the actual and the potential adoption rates. The study showed a continuous increase in the awareness of CSA practices and the adoption rates accordingly. While most farmers are aware of many CSA technologies and practices, only a small number of the farmers are adopting the practices. This is in line with the theory of diffusion and adoption of innovations [30] recognizing that there may be a lag between the time when farmers first hear about an innovation and the time, they adopt it. Diffusion is considered to begin at a point in time when an innovation is ready for use while adoption refers to the stage in which a technology is selected for use by an individual or an organization [30]. The adoption decision is preceded by a period of awareness and learning. The diffusion rates estimated were high for the CSA practices and technologies (i.e. drought tolerant improved variety, micro-dosing, intercropping, contour farming farm managed natural regeneration and climate information services) in the CSV of Mali. The increasing rate of diffusion of some of these practices and technologies may result from their indigenous dimension but also from the efforts at disseminating CSA practices by CCAFS and others stakeholders in the region to address climate change issue. Indeed, lack of awareness and knowledge on agricultural practices has been shown to hamper their adoption [31].
In terms of adoption rates, the results showed high actual adoption rates of CSA practices and technologies such as intercropping, FMNR, micro-dosing, drought tolerant improved variety and climate information services. This may result in the fact that CSA practices and technologies are potential source of yield increasing as well as adaptation and mitigation.
By estimating the potential and joint exposure adoption rates, the gaps to adoption were estimated as well. This gap to adoption of CSA technologies varies from 2 to 16% according the CSA technologies and practices. Considering the adoption gap is fundamental in adoption studies, especially when the technology studied is relatively new [13]. This is relevant for the CSA technologies and practices as the concept is relatively new [4]. The adoption gap informs on what direction the efforts should be put to ensure an uptake of CSA technologies and practices. As pointed out by [23], a high potential population adoption rate that is masked by a low level of awareness points to the need to put more effort into extension to make the technology known and available to the larger population. On the other hand, if the potential population adoption rate is low, further extension effort to disseminate the technology may not warrant its adoption.
Regarding the reasons for adopting CSA technologies and practices, respondents pointed out the productivity improvement, the ability to increase income as well as improvement of soil moisture in long term. Indeed, farmers perceiving soil infertility as a problem are more likely to adopt sustainable soil fertility-enhancing practices [32]. As such, the estimated actual adoption rates of intercropping, farm managed natural regeneration (FMNR) and micro-dosing were 77%, 71% and 70% respectively. In line with [33], since intercropping is more a traditional practice, it is quite obvious that its adoption rate was high among others because of less scope of confusion about how it performs. The high adoption rate of these practices can be attributed to the fact that crop yield increases with the adoption of intercropping, micro dosing and FMNR practices which in long run can better contribute to food security [6,34,35]. In semi-arid crop production where there is a potential treat of more frequent climate extremes, intercropping is an important crop production strategy for smallholder farmers for productivity improvements per unit of land [36]. Previous studies reveal that intercrop systems provide benefits such as complementary use of resource niches in term of the different rooting behavior of crops [37] and better system protection again pests and diseases [38]. FMNR was perceived by respondents as fodder for livestock feeding but according to [6], water and nutrients use efficiency and crop production diversification may result in an effective and well-managed of trees on farms. In addition, micro-dosing is recognized as sufficient nutrients source especially on poor soils and degraded lands [39]. Our results indicate that actual adoption rate of climate information services was 64%; which is consistent with [40] that farmers adopt some risk reduction technologies among which agro-advisories practices.
Despite the various benefits of CSA practices and technologies, there exists a gap between awareness and actual adoption rate, with percentage of farmers who have actually adopted being lower than the one being aware. This is consistent with previous studies [41,42] revealing that a large gap between awareness and current use of a single practice occurs as result of constraints to CSA adoption. This situation requires a deep investigation to understand the limiting factors of adoption of CSA technologies and practices in Cinzana.

4.2. Drivers of Awareness and Adoption of CSA Practices and Technologies

To understand the drivers of adoption of CSA technologies and practices in Mali CSV, the study examined first the perception of farmers on the advantages of and constraints to the adoption CSA options. Then we used a regression model to identify the key determinants of the adoption of CSA technologies and practices. According to the consumer demand theory, the demand for a product is significantly affected by the consumer's perceptions of the product's attributes. At a given point in time, the decision to adopt, reject or defer decision is postulated to be influenced by the belief derived from the knowledge and perception about the technology at that point in time. In this study, farmers perceived the ability of the CSA option to increase productivity and income, to reduce the risk of the crop as main advantages for using CSA technologies and practices. However, they perceived literacy and the low technical capacity of farmers as main constraints to handle CSA technologies and practice. The lack of information and the inappropriateness of some technologies/ practices account for other constraints to CSA technologies and practices adoption. The perception of farmers on technologies and practices advantages and constraints rely on the characteristics of the potential users (literacy and low technical capacity of famers), but also on the actions and features of the suppliers of the new technology (inappropriateness of the technology) [43], as well as on the interactions between users and suppliers and on the regulatory environment (lack of information about the technology).
The regression model showed that education, number of workers in household, access to inputs subsidies and credits, animal traction and trainings were playing a significant role in the adoption of CSA technologies and practices in Mali. Access to input subsidies affects the adoption of drought tolerant varieties, micro-dosing of fertilizer, and the use of CIS positively. Likewise, the animal traction has a positive effect on the adoption of drought tolerant varieties, micro-dosing of fertilizer and intercropping. Access to credit has a positive effect on the use of CIS. Trainings in CIS has a positive effect on the adoption of drought tolerant varieties, micro-dosing of fertilizer and CIS. Likewise training on choice of variety has affecting the use of drought tolerant varieties and intercropping positively.
Among factors likely to hamper the adoption of CSA practices, there are socio-economic characteristics of farmers, bio-physical environment of site, and the attributes of technologies as it is new [44,45,46]. Discussing on reasons for the low adoption rates of CSA practices, [47] pointed out factors such as: lack of skills, high costs of implementing the practice, labor-intensive, unavailability of inputs and climatic constraints were likely to constraint adoption.
However, consistent with previous studies [25,47] education and farmer experience are important in explaining awareness and adoption of the CSA practices within the CSV of Mali. Indeed, more educated farmers were more likely to be aware of drought tolerant improved variety, intercropping and farmer managed natural regeneration. But in term of adoption, more educated were 26.00% more likely to adopt FMNR while they were 19.00% and 17.00% less likely to adopt contour farming and use of climate information services practices respectively. This is a surprising result as increasing education was expected to increase the respondent’s awareness, leading definitely to increase adoption of such practices as in the study of [25]; who found that high education levels improve the knowledge of exposure to adopt. The findings show that a one-year increase in farmers’ experience reveals a 0.4% more likelihood of awareness of climate information services as well as 0.4% more likelihood to adopt climate information services. This implies that more experienced farmers can understand and identify changes related to farming practices more easily. The findings are in accordance with [48] study in Tanzania, who indicated that farmers with more years of farming experience were more likely to adopt agricultural technologies when compared with those who had fewer years of farming experience. The positive and significant sign of the coefficient for active members on the adoption of some CSA practices aligns with several previous studies [26,49]. Indeed, the coefficient for active members was positive and significant on the adoption of contour farming and farm managed natural regeneration, suggesting that a larger active member size is associated with a high probability to adopt these practices. Unexpectedly, the coefficient for active member was significantly negative in the intercropping equation whereas there is no effect on the adoption of any of other practices. Such a finding, even though there is no evidence, corroborates somehow to the facts that contour farming and farm managed natural regeneration may be more labor-intensive compares to intercropping. Active member size use as a proxy for family labor may influence positively or negatively technology adoption [50] but according to [51], a large active member in the household may become reluctant about providing labor required in the running of the technology, as well as it may provide adequate labor required as most of the technologies are labor intensive.
Interestingly, our findings are consistent with the assumption that agricultural training positively influences adoption of agricultural technology [32,52,53]. Accordingly, we found that training on the choice of variety significantly and positively influenced the adoption of drought tolerant improved variety and intercropping while training on climate information service influenced significantly and positively the adoption of climate information services. It implies that specific training provides insightful knowledge on the use of the technology. Regarding access to subsidy and credit, the results revealed that in our sample, benefiting from subsidy significantly increase the probability for adoption of some practices whereas there is no impact on others. Indeed, farmers with access to subsidy were 13.00% and 20.00% more likely than those without subsidy access to adopt practices such as drought tolerant improved variety and micro-dosing. Interestingly, farmers with access to credit are 20.00% likely to adopt climate information services. These findings are consistent with the common understanding that CSA practices require a high initial investment [32]. Consequently, benefiting from subsidy and credit may facilitate and provide farmers with affordable cost of inputs and therefore to invest in inputs associated with the practices. For instance, a previous study of [53] revealed that subsidies have been used at a large scale to promote use of inorganic fertilizer and improved seeds in Malawi.
However, we found that possession of animal traction was positively correlated with the adoption of drought tolerant improved variety, micro-dosing and intercropping whereas farmers holding animal traction were 14.00% less likely to adopt the climate information service. It was argued that access to animal traction improves efficiency and diversification in agriculture, saves costs and resources (labour, energy) by improving the scale of farming operations and timeliness [54]. This implies that possession of animal traction may dissuade farmers practicing climate information services.

5. Conclusions

From a policy perspective, understanding the determinants of technology adoption could help design dissemination strategies at local-, national-, and regional level. Indeed, the climate-smart village (CSV) approach aims to scale up and out the promising options of agricultural practices and technologies tested for dealing with climatic variability and climate change in agriculture. To draw out comprehensive understanding for policy makers from local to global levels, we adopted a parametric approach to provide insights on how farmer’s awareness of CSA practices and technologies are linked with actual and potential adoption rates of CSA practices within the CSV of Cinzana in Mali. The study provided a finer knowledge of the characteristics and drivers of CSA practices awareness and adoption within the CSV, and should allow policy makers and NGOs to design efficient strategies for scaling up.
We found that adoption rates of CSA practices and technologies is widespread within the CSV, as result of high awareness of CSA practices and technologies within the CSV. Indeed, apart from contour farming with low adoption rate (39%) resulting in the relatively low awareness rate (70.30%), all the practices recorded at least 60% of adoption rate with around 85% of awareness rate. Our findings underscore the knowledge-intensive, and illustrate that awareness, experience in farming and attending trainings on CSA practices have positive effects on adoption decisions of several practices, mostly those requiring technical knowledge such as drought tolerant variety, intercropping, micro-dosing and climate information services. These results highlight the need to target the awareness of CSA practices and provide farmers with specific training on CSA practices. The positive correlation between education and the adoption of CSA suggests that investment in rural public education could accelerate the dissemination of agricultural practices. Knowledge-intensive could be considered as vehicle of knowledge transfer through dedicated training and capacity building programs aiming to enhance the technical knowledge of these technologies. The positive effect of training on CSA options adoption shows that efforts should be focused on farmers’ capacity building through trainings on CSA technologies and practices.
In other hand, farmers with access to subsidy and credit are more likely to adopt CSA practices implying that policy maker should establish incentives measures towards the intensification of CSA use. The positive effect of credit, input subsidies and equipment on adoption of CSA technologies and practices mean that efforts should be done by the decision makers and development implementers to improve farmers’ access to farm inputs. This could be done through the traditional subsidies of inputs (seeds and fertilizer) and equipment but also through connecting farmers with input suppliers via new type of partnerships (such as contracting farming, value chain, innovation platforms, etc.). For example, many contractual arrangements involve considerable production support in addition to the supply of basic inputs such as seed and fertilizer. Farmers can use the contract agreement as collateral to arrange credit with a commercial bank in order to fund inputs.
Furthermore, our findings confirm the labor-intensive nature of some practices, particularly with regard to the adoption of contour farming and farmer managed natural regeneration by households with more active members. It is, however, necessary to encourage the adoption of CSA practices or other labor-intensive practices by providing farmers with adequate technical support and materials to best handle the labor issue related to adoption.

Author Contributions

M.O. and R.B.Z. conceived and designed the study; M.O. and S.T.P. performed the data collection (surveys); M.O. and P.H. analyzed the data; M.O., P.H., S.T.P. and R.B.Z. wrote the paper. All authors read, amended the earlier drafts, and approved the final manuscript.

Funding

This research received no external funding.

Acknowledgments

This work was implemented as part of the CGIAR Research Program on Climate Change, Agriculture and Food Security (CCAFS), led by the International Center for Tropical Agriculture (CIAT). We acknowledge the CGIAR Trust Fund, Australia (ACIAR), Ireland (Irish Aid), Netherlands (Ministry of Foreign Affairs), New Zealand, Switzerland (SDC), The UK Government (UK Aid), USA (USAID), The European Union (EU) for funding the program and the International Fund for Agricultural Development (IFAD) for its technical support to CCAFS.

Conflicts of Interest

The authors declare no conflict of interest.

References

  1. FAO. The State of Food and Agriculture. Food and Agriculture Organization of the United Nations, 2016. Available online: http://www.fao.org/3/a-i6030e.pdf (accessed on 10 April 2019).
  2. Altieri, M.A.; Nicholls, C.I. The adaptation and mitigation potential of traditional agriculture in a changing climate. Clim. Chang. 2017, 140, 33–45. [Google Scholar] [CrossRef]
  3. Jalloh, A.; Nelson, G.C.; Thomas, T.S.; Zougmoré, R.B.; Roy-Macauley, H. (Eds.) West African Agriculture and Climate Change: A Comprehensive Analysis; International Food Policy Research Institute: Washington, DC, USA, 2013. [Google Scholar]
  4. FAO. Climate-Smart Agriculture Sourcebook 2013; Food and Agriculture Organization of the United Nations: Rome, Italy, 2013. [Google Scholar]
  5. Aggarwal, P.K.; Jarvis, A.; Campbell, M.B.; Zougmoré, B.R.; Khatri-Chhetri, A.; Vermeulen, J.S.; Loboguerrero, A.; Sebastian, S.L.; Kinyangi, J.; Bonilla-Findji, O.; et al. The climate-smart village approach: Framework of an integrative strategy for scaling up adaptation options in agriculture. Ecol. Soc. 2018, 23, 14. [Google Scholar] [CrossRef]
  6. Sileshi, G.W.; Akinnifesi, F.K.; Ajayi, O.C.; Muys, B. Integration of legume trees in maize-based cropping systems improves rain use efficiency and yield stability under rain-fed agriculture. Agric. Water Manag. 2011, 98, 1364–1372. [Google Scholar] [CrossRef]
  7. Traore, K.; Sidibe, D.K.; Coulibaly, H.; Bayala, J. Optimizing yield of improved varieties of millet and sorghum under highly variable rainfall conditions using contour ridges in Cinzana, Mali. Agric. Food Secur. 2017, 6, 11. [Google Scholar] [CrossRef]
  8. Bayala, J.; Zougmoré, R.; Ky-Dembele, C.; Bationo, B.A.; Buah, S.; Sanogo, D.; Somda, J.; Tougiani, A.; Traoré, K.; Kalinganire, A. Towards developing scalable climate-smart village models: Approach and lessons learnt from pilot research in West Africa. In ICRAF Occasional Paper No. 25; World Agroforestry Centre: Nairobi, Kenya, 2016. [Google Scholar]
  9. Sanou, J.; Bationo, A.B.; Barry, S.; Nabie, D.L.; Bayala, J.; Zougmore, R. Combining soil fertilization, cropping systems and improved varieties to minimize climate risks on farming productivity in northern region of Burkina Faso. Agric. Food Secur. 2016, 5, 20. [Google Scholar] [CrossRef] [Green Version]
  10. Andrieu, N.; Sogoba, B.; Zougmore, R.; Howland, F.; Samake, O.; Bonilla-Findji, O.; Lizarazo, M.; Nowak, A.; Dembele, C.; Corner-Dolloff, C. Prioritizing investments for climate-smart agriculture: Lessons learned from Mali. Agric. Syst. 2017, 154, 13–24. [Google Scholar] [CrossRef] [Green Version]
  11. Tiamiyu, A.S.; Ugalahi, B.U.; Eze, N.J.; Shittu, A.M. Adoption of climate smart agricultural practices and farmers’ willingness to accept incentives in Nigeria. IJAER 2018, 4, 198–205. [Google Scholar]
  12. Maguza-Tembo, F.; Abdi-Khalil, E.; Mangisoni, J.; Mkwambisi, D. Does Adoption of Climate Smart Agriculture (CSA) Technologies Reduce Household Vulnerability to Poverty? J. Econ. Sustain. Dev. 2016, 7, 125–130. [Google Scholar]
  13. Diagne, A. Technological change in smallholder agriculture: Bridging the adoption gap by understanding its source. AfJARE 2010, 5, 261–286. [Google Scholar]
  14. Angrist, J.D.; Imbens, G.W. Two-stage least squares estimation of average causal effects in models with variable treatment intensity. J. Am. Stat. Assoc. 1995, 90, 431–442. [Google Scholar] [CrossRef]
  15. Heckman, J.J.; Vytlacil, E. Structural equations, treatment effects, and econometric policy evaluation 1. Econometrica 2005, 73, 669–738. [Google Scholar] [CrossRef]
  16. Imbens, G.W.; Wooldridge, J.M. Recent developments in the econometrics of program evaluation. J. Econ. Lit. 2009, 47, 5–86. [Google Scholar] [CrossRef]
  17. Ouédraogo, M.; Dakouo, D. Evaluation de l'adoption des variétés de riz NERICA dans l’Ouest du Burkina Faso. Afr. J. Agric. Resour. Econ.-AfJARE 2017, 12, 1–16. [Google Scholar]
  18. Ouédraogo, M.; Zougmoré, R.; Moussa, A.S.; Partey, S.T.; Thornton, P.K.; Kristjanson, P.; Diakité, L. Markets and climate are driving rapid change in farming practices in Savannah West Africa. Reg. Environ. Chang. 2017, 17, 437–449. [Google Scholar] [CrossRef]
  19. CCAFS. 2011. Available online: https://ccafs.cgiar.org/ (accessed on 01 July 2019).
  20. Diagne, A.; Demont, M. Taking a new look at empirical models of adoption: Average treatment effect estimation of adoption rates and their determinants. Agric. Econ. 2007, 37, 201–210. [Google Scholar] [CrossRef]
  21. Dandedjrohoun, L.; Diagne, A.; Biaou, G.; N’cho, S.; Midingoyi, K.S. Determinants of diffusion and adoption of improved technology for rice parboiling in Benin. Rev. Agric. Environ. Stud. 2012, 93, 171–191. [Google Scholar]
  22. Heckman, J. Randomization and social program evaluation as an instrumental variable. Rev. Econ. Stat. 1996, 77, 336–341. [Google Scholar] [CrossRef]
  23. Diagne, A. The diffusion and adoption of NERICA rice varieties in Côte d’Ivoire. Dev. Econ. 2006, 44, 208–231. [Google Scholar] [CrossRef]
  24. Wooldridge, J. Econometric Analysis of Cross Section and Panel Data; The MIT Press: Cambridge, MA, USA, 2002. [Google Scholar]
  25. Mensah, E.J. Land tenure regimes and land conservation in the African drylands: The case of northern Ghana. J. Land Use Sci. 2015, 10, 129–149. [Google Scholar] [CrossRef]
  26. Abdulai, A.; Huffman, W. The adoption and impact of soil and water conservation technology: An endogenous switching regression application. Land Econ. 2014, 90, 26–43. [Google Scholar] [CrossRef]
  27. Makate, C.; Wang, R.; Makate, M.; Mango, N. Crop diversification and livelihoods of smallholder farmers in Zimbabwe: Adaptive management for environmental change. SpringerPlus 2016, 5, 1135. [Google Scholar] [CrossRef] [PubMed]
  28. Fouladbash, L.; Currie, W.S. Agroforestry in Liberia: Household practices, perceptions and livelihood benefits. Agrofor. Syst. 2015, 89, 247–266. [Google Scholar] [CrossRef]
  29. Nigussie, Z.; Tsunekawa, A.; Haregeweyn, N.; Adgo, E.; Nohmi, M.; Tsubo, M.; Abele, S. Factors influencing small-scale farmers’ adoption of sustainable land management technologies in north-western Ethiopia. Land Use Policy 2017, 67, 57–64. [Google Scholar] [CrossRef]
  30. Rogers, E.M. Diffusion of Innovations, 5th ed.; Free Press: New York, NY, USA, 2003. [Google Scholar]
  31. Giller, K.E.; Witter, E.; Corbeels, M.; Tittonell, P. Conservation agriculture and smallholder farming in Africa: The heretics’ view. Field Crops Res. 2009, 114, 23–34. [Google Scholar] [CrossRef]
  32. Kpadonou, R.A.B.; Owiyo, T.; Barbier, B.; Denton, F.; Rutabingwa, F.; Kiema, A. Advancing climate-smart-agriculture in developing drylands: Joint analysis of the adoption of multiple on-farm soil and water conservation technologies in West African Sahel. Land Use Policy 2017, 61, 196–207. [Google Scholar] [CrossRef]
  33. Ward, P.S.; Bell, A.R.; Droppelmann, K.; Benton, T.G. Early adoption of conservation agriculture practices: Understanding partial compliance in programs with multiple adoption decisions. Land Use Policy 2018, 70, 27–37. [Google Scholar] [CrossRef]
  34. Quinion, A.; Chirwa, P.W.; Akinnifesi, F.K.; Ajayi, O.C. Do agroforestry technologies improve the livelihoods of the resource poor farmers? Evidence from Kasungu and Machinga districts of Malawi. Agrofor. Syst. 2010, 80, 457–465. [Google Scholar] [CrossRef]
  35. Fallah, S.; Rostaei, M.; Lorigooini, Z.; Surki, A.A. Chemical compositions of essential oil and antioxidant activity of dragonhead (Dracocephalum moldavica) in sole crop and dragonhead-soybean (Glycine max) intercropping system under organic manure and chemical fertilizers. Ind. Crops Prod. 2018, 115, 158–165. [Google Scholar] [CrossRef]
  36. Nelson, W.C.D.; Hoffmann, M.P.; Vadez, V.; Roetter, R.P.; Whitbread, A.M. Testing pearl millet and cowpea intercropping systems under high temperatures. Field Crops Res. 2018, 217, 150–166. [Google Scholar] [CrossRef] [Green Version]
  37. Schröder, D.; Köpke, U. Faba bean (Vicia faba L.) intercropped with oil crops—A strategy to enhance rooting density and to optimize nitrogen use and grain production? Field Crops Res. 2012, 135, 74–81. [Google Scholar]
  38. Corre-Hellou, G.; Dibet, A.; Hauggaard-Nielsen, H.; Crozat, Y.; Gooding, M.; Ambus, P.; Ensen, E.S. The competitive ability of pea—Barley intercrops against weeds and the interactions with crop productivity and soil N availability. Field Crops Res. 2011, 122, 264–272. [Google Scholar] [CrossRef]
  39. Murendo, C.; Wollni, M. Ex-post Impact Assessment of Fertilizer Microdosing as a Climate-Smart Technology in Sub-Saharan Africa; CCAFS: Frederiksberg, Denmark, 2015. [Google Scholar]
  40. Khatri-Chhetri, A.; Aggarwal, P.K.; Joshi, P.K.; Vyas, S. Farmers’ prioritization of climate-smart agriculture (CSA) technologies. Agric. Syst. 2017, 151, 184–191. [Google Scholar] [CrossRef]
  41. Palanisami, K.; Kumar, D.S.; Malik, R.P.S.; Raman, S.; Kar, G.; Monhan, K. Managing water management research: Analysis of four decades of research and outreach programmes in India. Econ. Political Rev. 2015, 26–27, 33–43. [Google Scholar]
  42. Mwongera, C.; Shikuku, K.M.; Twyman, J.; Läderach, P.; Ampaire, E.; Van Asten, P.; Winowiecki, L.A. Climate smart agriculture rapid appraisal (CSA-RA): A tool for prioritizing context-specific climate smart agriculture technologies. Agric. Syst. 2017, 151, 192–203. [Google Scholar] [CrossRef]
  43. Hall, B.; Khan, B. Adoption of New Technology. In New Economy Handboo; Jones, D.C., Ed.; Elsevier Science: Amsterdam, The Netherlands, 2003. [Google Scholar]
  44. Campbell, J.; Cheong, S.; McCormick, M.; Pulwarty, S.; Supratid, R.S.; Ziervogel, G. Managing the risks from climate extremes at the local level. Managing the Risks of Extreme Events and Disasters to Advance Climate Change Adaptation. In A Special Report of Working Groups I and II of the IPCC; Cambridge University Press: Cambridge, UK; New York, NY, USA, 2012. [Google Scholar]
  45. Below, T.B.; Mutabazi, K.D.; Kirschke, D.; Franke, C.; Sieber, S.; Siebert, R.; Tscherning, K. Can farmers’ adaptation to climate change be explained by socio-economic household-level variables? Glob. Environ. Chang. 2012, 22, 223–235. [Google Scholar] [CrossRef]
  46. Deressa, T.T.; Hassan, R.M.; Ringler, C. Perception of and adaptation to climate change by farmers in the Nile basin of Ethiopia. J. Agric. Sci. 2011, 149, 23–31. [Google Scholar] [CrossRef]
  47. Nkomoki, W.; Bavorová, M.; Banout, J. Adoption of sustainable agricultural practices and food security threats: Effects of land tenure in Zambia. Land Use Policy 2018, 78, 532–538. [Google Scholar] [CrossRef]
  48. Faße, A.; Grote, U. The economic relevance of sustainable agroforestry practices—An empirical analysis from Tanzania. Ecol. Econ. 2013, 94, 86–96. [Google Scholar] [CrossRef]
  49. Kassie, M.; Teklewold, H.; Jaleta, M.; Marenya, P.; Erenstein, O. Understanding the adoption of a portfolio of sustainable intensification practices in eastern and southern Africa. Land Use Policy 2015, 42, 400–411. [Google Scholar] [CrossRef]
  50. Kagoya, S.; Paudel, K.P.; Daniel, N.L. Awareness and Adoption of Soil and Water Conservation Technologies in a Developing Country: A Case of Nabajuzi Watershed in Central Uganda. Environ. Manag. 2018, 61, 188–196. [Google Scholar] [CrossRef]
  51. Amsalu, A.; De Graaff, J. Determinants of adoption and continued use of stone terraces for soil and water conservation in an Ethiopian highland watershed. Ecol. Econ. 2007, 61, 294–302. [Google Scholar] [CrossRef]
  52. Bayard, B.; Jolly, C.M.; Shannon, D.A. The economics of adoption and management of alley cropping in Haiti. J. Environ. Manag. 2007, 84, 62–70. [Google Scholar] [CrossRef] [PubMed]
  53. Holden, S.T.; Fisher, M.; Katengeza, S.P.; Thierfelder, C. Can lead farmers reveal the adoption potential of conservation agriculture? The case of Malawi. Land Use Policy 2018, 76, 113–123. [Google Scholar] [CrossRef]
  54. Gauchan, D.; Shrestha, S. Agricultural and Rural Mechanisation in Nepal: Status, Issues and Options for Future; Institute for Inclusive Finance and Development (InM): Dhaka, Bangladesh, 2017. [Google Scholar]
Figure 1. Study site location.
Sustainability 11 04710 g001
Figure 2. Drought tolerant varieties.
Sustainability 11 04710 g002
Figure 3. Organic manure.
Sustainability 11 04710 g003
Figure 4. Micro-dosing.
Sustainability 11 04710 g004
Figure 5. Intercropping.
Sustainability 11 04710 g005
Figure 6. Contour farming.
Sustainability 11 04710 g006
Figure 7. Farmer managed natural regeneration.
Sustainability 11 04710 g007
Figure 8. Agroforestry.
Sustainability 11 04710 g008
Figure 9. Climate information service.
Sustainability 11 04710 g009
Table 1. Definitions of explanatory variables for the awareness and adoption of Climate-Smart Agriculture (CSA) technologies and practices.
VariablesDescriptionExpected Sign
EducationDummy = 1 if household head attended formal schooling+
Extension serviceDummy = 1 if household has contact with public extension services +
Experience in farmingNumber of years in farming+
Training on agricultural systemDummy = 1 if household head attended any training in agricultural production+
Owning a radioDummy = 1 if a household member owns a radio +
Number of workers in householdNumber of persons in the household able to work in farm+/-
Access to creditDummy = 1 if the household has access to credit+
Access to subsidyDummy = 1 if the household has access to subsidies+
Total land sizeTotal size of landholding in hectares +
Animal tractionDummy = 1 if the household head holds a couple of traction cattle with a plough or cart+
Training on choice of varietiesDummy = 1 if the household head attended a specific training in choice of varieties+
Training on Climate information serviceDummy = 1 if the household head attended a specific training in Use of Climate information+
Off-farm activitiesDummy = 1 if the household has off-farm activities+
Owning a phoneDummy = 1 if a household member owns a mobile phone+
Table 2. Socio-economics characteristics of respondents.
VariablesMean Std. Dev.MinMax
Household (HH) characteristics
Age of the HH head (year)51.6113.341887
Gender male of HH head0.980.1401
Education of HH0.070.2601
Number of persons in the HH 17.1914.561105
Number of workers in HH6.856.40140
Household’s status (migrant)0.110.3201
Member of Farmers’ Organization0.720.4401
Number of years in farming (experience)25.6914.76360
Access to credit0.200.4001
Access to subsidies0.30.4501
Off-farm activities0.360.4801
Farm characteristics
Farm seize (ha) 10.789.751100
Land size under cultivation (ha) 9.457.21140
Subsistence farm0.140.3501
Number of cash crops2.081.0605
Livestock animals holding0.970.1601
Oxen holding4.337.55050
Traction cattle 2.962.78030
Small ruminant holding13.2615.100120
Poultry16.4023.920210
Plough1.341.1507
Cart1.381.40020
Animal traction0.680.4601
Institution and technical knowledge
Extension service0.420.4901
Training on agricultural system0.750.4301
Choice of varieties0.560.4901
Soil fertility management0.150.3601
Climate information service0.420.4901
Radio set0.760.4201
Mobile phone0.900.3001
N = 300 farmers.
Table 3. Reasons for adopting CSA options (in %).
Drought Tolerant VarietyOrganic ManureMicro-DosingIntercroppingContour FarmingAgroforestryFMNRCIS
Improve productivity57.0141.6245.0137.6016.583.705.7716.86
Improve soil fertility/moisture3.3539.8018.5217.7154.557.412.361.18
Reduces the risk of crop losses16.4610.915.981.3619.252.220.261.18
Increase income22.266.265.1337.872.147.411.570.39
Low inputs/labor cost0.911.4125.362.727.490.740.000.39
Access to forest product/fodder0.000.000.002.720.0078.5290.030.00
N = 300 farmers.
Table 4. Constraints to adoption of CSA technologies and practices.
Drought Tolerant VarietyOrganic ManureMicro-DosingInter CroppingContour FarmingAgroforestryFMNRCIS
Illiteracy of farmers16.009.3410.7710.4719.399.988.8733.24
Limited technical capacity26.6040.6624.1224.6126.0615.919.8315.29
Lack of information about the technology/practice 16.2025.6825.769.1629.0921.1417.2738.24
Unappropriated technology/practice36.0020.6231.3835.0816.3619.2439.098.82
Limited funds5.001.756.793.934.249.501.923.53
Land insufficiency0.000.000.000.000.3012.355.040.00
Lack of water0.000.580.230.260.0011.1612.230.00
No specific constraint0.201.360.9416.494.550.715.760.88
N = 300 farmers.
Table 5. Marginal effect from probit estimation of determinants of awareness of CSA practices.
Drought Tolerant VarietyMicro-DosingintercroppingContour RidgingFMNRCIS
Education
(1 = yes, 0 = otherwise)
0.04 *
(0.03)
0.03
(0.03)
0.08 **
(0.033)
−0.02
(0.06)
0.05 *
(0.03)
0.01
(0.04)
Extension service
(1 = yes, 0 = otherwise)
0.06 ***
(0.02)
0.08 ***
(0.03)
0.004
(0.01)
0.01
(0.06)
0.002
(0.02)
−0.003
(0.04)
Year of experience
in farming
−0.0003
(0.0005)
0.0003
(0.0009)
−0.003
(0.0003)
0.001
(0.002)
−0.0004
(0.0007)
0.004 ***
(0.001)
Training in agriculture production (1 = yes, 0 = otherwise)−0.02
(0.01)
−0.01
(0.03)
0.08 ***
(0.42)
0.17 **
(0.08)
−0.03
(0.02)
−0.01
(0.04)
Owning a radio
(1 = yes, 0 = otherwise)
0.05 **
(0.30)
0.04
(0.04)
−0.01
(0.008)
0.07
(0.06)
−0.02
(0.02)
0.09 *
(0.05)
Constant1.07 ***
(0.36)
0.91
(0.33)
1.10 **
(0.43)
0.01
(0.24)
2.03 ***
(0.47)
0.37
(0.28)
Log likelihood−47.33−73.06−41.14−176.94−56.19−115.79
LR chi218.49 ***11.17 **42.64 ***10.92 **6.7211.40 **
Df555555
Pseudo R20.16340.070.34130.0290.050.05
Number of observations: 300; Robust standard error in parentheses (); *** Significant at 1%, ** significant at 5% and * significant at 10%.
Table 6. Average Treatment Effect (ATE) parametric (Probit) estimation of population adoption rates.
Drought Tolerant VarietyMicro-DosingInter-CroppingContour FarmingFMNRCIS
Proportion of exposed farmers0.95 ***
(0.01)
0.93 ***
(0.02)
0.946 ***
(0.012)
0.703 ***
(0.026)
0.95 ***
(0.012)
0.86 ***
(0.020)
ATE (Potential Adoption Rate)0.685 ***
(0.03)
0.758 ***
(0.02)
0.813 ***
(0.02)
0.552 ***
(0.03)
0.749 ***
(0.02)
0.714 ***
(0.03)
ATE1 (Adoption rate among exposed)0.689 ***
(0.03)
0.762 ***
(0.02)
0.820 ***
(0.02)
0.555 ***
(0.031)
0.754 ***
(0.02)
0.741 ***
(0.02)
ATE0 (Adoption rate among non-exposed)0.616 ***
(0.04)
0.706 ***
(0.03)
0.683 ***
(0.07)
0.543 ***
(0.037)
0.648 ***
(0.04)
0.552 ***
(0.041)
JEA (joint exposure and adoption rate)0.656 ***
(0.02)
0.706 ***
(0.02)
0.776 ***
(0.02)
0.390 ***
(0.02)
0.717 ***
(0.02)
0.637 ***
(0.02)
Adoption gap
(GAP = JEA – ATE)
−0.028 ***
(0.002)
−0.051 ***
(0.002)
−0.036 ***
(0.003)
−0.161***
(0.01)
−0.032 ***
(0.002)
−0.077 ***
(0.006)
Population selection bias (PSB = ATE1-ATE)0.003 **
(0.002)
0.004 ***
(0.001)
0.0073 ***
(0.003)
0.003 ***
(0.006)
0.005 ***
(0.002)
0.026 ***
(0.003)
Robust standard error in parentheses (); *** Significant at 1% and ** significant at 5%
Table 7. Marginal effect from probit estimation of determinants of adoption of CSA practices.
Drought
Tolerant
Variety
Micro-
Dosing
Inter-
Cropping
Contour
Farming
FMNRCIS
Education 0.03
(0.06)
−0.07
(0.05)
0.06
(0.05)
−0.19 **
(0.08)
0.26 ***
(0.06)
−0.17 ***
(0.05)
Number of workers
in household
0.005
(0.01)
0.001
(0.004)
−0.01 ***
(0.004)
0.004
(0.006)
0.02 ***
(0.007)
0.004
(0.005)
Year of experience in farming0.001
(0.002)
−0.0004
(0.001)
0.002
(0.002)
−0.005 *
(0.003)
−0.0004
(0.001)
0.004 **
(0.002)
Total land size0.0003
(0.003)
−0.0001
(0.003)
0.003
(0.003)
−0.001
(0.005)
−0.0001
(0.004)
0.003
(0.004)
Access to credit−0.11
(0.08)
−0.07
(0.07)
0.02
(0.06)
−0.02
(0.10)
0.04
(0.06)
0.20 ***
(0.04)
Access to subsidy 0.13 **
(0.06)
0.20 ***
(0.04)
0.001
(0.05)
−0.04
(0.08)
−0.16 **
(0.07)
0.14 ***
(0.06)
Animal traction 0.15 **
(0.06)
0.14 **
(0.05)
0.11 **
(0.05)
0.13
(0.08)
−0.01
(0.05)
−0.14 ***
(0.05)
Training on choice of variety0.11 *
(0.05)
0.05
(0.05)
0.08 *
(0.05)
0.12
(0.07)
−0.005
(0.05)
−0.02
(0.05)
Training on CIS 0.24 ***
(0.06)
0.14 **
(0.06)
0.06
(0.05)
−0.21 **
(0.08)
−0.10
(0.06)
0.20 ***
(0.06)
Number of off-activities0.06
(0.05)
0.03
(0.05)
0.02
(0.04)
−0.07
(0.07)
0.06
(0.05)
0.03
(0.05)
Holding a phone 0.11
(0.10)
0.02
(0.08)
0.09
(0.08)
0.24 **
(0.12)
−0.17 ***
(0.05)
−0.04
(0.08)
Constant−0.90 **
(0.38)
0.066
(0.39)
−0.170
(0.389)
0.12
(0.44)
0.738
(0.43)
0.54
(0.47)
Number of observations286278284211285258
Log likelihood−054.70−033.40−021.35−027.46−038.63−013.86
LR chi245.26 ***37.91 ***24.67 ** 35.06 ***40.49 ***65.69 ***
Df111111111111
Pseudo R20.130.120.100.120.130.22
Robust standard error in parentheses (); *** Significant at 1%, ** significant at 5% and * significant at 10%.

