Article

Scenario Analysis on Energy Consumption and CO2 Emissions Reduction Potential in Building Heating Sector at Community Level

1
School of Municipal and Environmental Engineering, Shenyang Jianzhu University, Shenyang 110168, Liaoning, China
2
State Grid Liaoning Electric Power Company Limited Economic Research Institute, Shenyang 110168, Liaoning, China
3
Shaanxi Country Garden Real Estate Co. Ltd, Xi’an 727400, Shaanxi, China
*
Author to whom correspondence should be addressed.
Sustainability 2019, 11(19), 5392; https://0-doi-org.brum.beds.ac.uk/10.3390/su11195392
Submission received: 30 August 2019 / Revised: 19 September 2019 / Accepted: 26 September 2019 / Published: 29 September 2019

Abstract

:
Energy consumption and carbon emissions of building heating are increasing rapidly. Taking Liaobin coastal economic zone as an example, two scenarios are built to analyze the potential of energy consumption and CO2 emissions reduction from the aspects of laws, regulations, policies and planning. The baseline scenario refers to the traditional way of energy planning and the community energy planning scenario seeks to apply community energy planning within the zone. Energy consumption and CO2 emission are forecast in two scenarios with the driving factors including GDP growth, changes in population size, energy structure adjustment, energy technology progress, and increase of energy efficiency. To improve accuracy of future GDP and population data prediction, an ARIMA (Autoregressive Integrated Moving Average model) (1,1,1) model is introduced into GDP prediction and a logistics model is introduced into population prediction. Results show that compared with the baseline scenario, energy consumption levels in the community energy planning scenario are reduced by 140% and CO2 emission levels are reduced by 45%; the short-term and long-term driving factors are analyzed. Policy implications are given for energy conservation and environmental protection.

1. Introduction

In recent years, owing to rapid development of science and technology in the world, many serious environmental problems have appeared, such as environmental pollution, energy shortages and global climate change [1,2,3,4]. As such, energy-saving and carbon dioxide emission reduction have become major topics of conversation worldwide [5,6,7]. Although it is the most populous nation in the world, China’s per capita share of resources is below the global average. Therefore, the country’s energy shortage problem is more serious than that of other countries. In 2016, before the Paris Agreement came into effect, the Chinese government put forward the 13th Five-Year Plan of Work on Controlling Greenhouse Gas Emissions. These targets specify that China’s carbon dioxide emissions will peak around 2030 and peak as soon as possible and are incorporated into medium-term and long-term planning of national economic and social development as obligatory. To be specific, by 2020, carbon dioxide emissions per unit of GDP will be reduced by 18% compared with 2015, total carbon emissions will be effectively controlled, and typical regions’ carbon dioxide emissions peaking first is supported [8,9]. Consequently, carbon dioxide emission has become an inflexible constraint in community energy planning [10].
At present, some foreign research institutions have developed specialized models to improve the scientific nature and accuracy of environmental impact assessments in community energy planning, such as CGE (Computable General Equilibrium), AIM (Asia-Pacific Integrated Model), MARKAL (Market and Allocation) and LEAP (Long-range Energy Alternatives Planning System) [11,12,13], and the comparison of major energy models are shown in Table 1.
CGE, a top-down model, is often used to simulate and constrain the quantitative relationship between macroeconomic development and sectoral activity levels. However, it is difficult to apply to systematic changes, which have important impacts on the quantity and quality of economic growth in China. AIM and MARKAL, which are bottom-up models, use scattered data to describe supply techniques in detail and emphasize changes in energy consumption. Among them, AIM focuses on the choosing of energy technology and MARKAL focuses on studying the law of market distribution, whose driver is market demand [16]. This paper focus on the energy conservation and carbon dioxide emissions potential of the building sector. Specifically, its aim is to simulate the change of energy demand and the reduction of carbon dioxide emission caused by the implementation of different energy and environmental technologies. Therefore, this paper needs an energy measurement model with sector as the research unit, that has the function of scenario analysis and simulation and can forecast energy demand and conduct environmental impact assessment. Based on the above analysis, the LEAP model is chosen in this paper.
The LEAP model, widely applied at home and abroad, is a scenario analysis model of econometrics, energy, and environment, developed at the Stockholm Environment Institute. Many scholars use LEAP at the national level. In 2007, Limmeechokchai et al. built a LEAP model for improved cooking stoves and small biogas digesters in Thailand’s rural areas and analyzed their potential for energy conservation and carbon dioxide emission reduction [17]. In 2008, Cai et al. used LEAP model to analyze the carbon dioxide emission reduction potential of China’s five largest carbon emission departments [18]. In 2011, Wang et al. analyzed the policies to encourage investing in energy efficiency and renewable energy in the context of the latest developments of energy production, energy consumption and energy strategic planning and policies in China with a LEAP model [19]. In 2014, Zhou et al. used a LEAP model to assess the impact of energy efficiency policies of Chinese government and to evaluate the reduced energy demand and emissions [20]. In 2015, Kuldna et al. reported on the SEA process of the national energy plan with reflections on where and how the LEAP model was used for knowledge brokerage on emissions modelling between researchers and policy developers [21]. In 2017, Vincent et al. applied a scenario-based analysis to explore the impact of different energy policies for the Nigerian energy system using a LEAP model [22]. In 2018, Saba et al. modeled and analyzed existing energy power projects and China–Pakistan Economic Corridor (CPEC) energy projects’ performances using a LEAP model, which is beneficial to the forecasting of the role of CPEC energy projects in order to meet the high electrical energy demand expected in the future [23]. At the provincial level, Lin et al. developed a LEAP model to analyze the future trends of energy demand and greenhouse gas (GHG) emissions in Xiamen city, and the results showed that the clean energy substitution measure was the most effective in terms of energy saving and GHG emissions mitigation, and that the industrial sector had the largest abatement potential in Xiamen in 2010 [24]. Guo et al. presented a system analysis approach on carbon emission reduction at the urban level, and the prospective carbon emissions of Shanghai in 2010 and 2020 were estimated based on scenario analysis [25]. Huang et al. built the Taiwan LEAP model to compare future energy demand and supply patterns as well as greenhouse gas emissions, for several alternative scenarios of energy policy and energy sector evolution [26]. Different fields include energy consumption in the transportation field, environmental impacts of industry, energy conservation and environmental impacts of construction and power. In the transportation sector, Dhakal and Pradhan constructed a LEAP model of urban traffic and evaluated its potential for energy conservation and carbon dioxide emission reduction [27]. Ahanchian et al. assessed the present situation of energy demand and emission of air pollutants from the road transportation sector in the Philippines along with the future forecasting of the environmental impacts from transportation sector using a LEAP model [28]. Shabbir analyzed factors which were driving forces behind the pattern of energy study and influenced energy utilization and the resulting level of emissions in Rawalpindi and Islamabad’s transport sector by using a LEAP model [29]. In the industrial sector, Ates explored the energy efficiency and carbon dioxide emission reduction potential of the iron and steel industry in Turkey with the assistance of the LEAP model [30]. In the building sector, Malla analyzed the patterns of household energy use and associated air pollutant emissions in Nepal in different scenarios, and policy advice was given for the government [31]. Xu et al. developed a LEAP Henan model to assess the energy demand and environmental effect on the residential sector of Henan province, China, in different scenarios [32]. In the power sector, Shin et al. evaluated the environmental and economic impacts of garbage power plants in South Korea using their constructed LEAP model [33]. Zhang et al. built a LEAP model based on the Chinese electricity industry’s policy of energy conservation and carbon dioxide emission reduction under different scenarios and analyzed the impacts of such scenarios on overall energy demand and external cost [34].
In general, the number of studies in this field is large, but most have focused on one or a few sectors whose research dimensions are generally large. In contrast, there has been little research into energy conservation and carbon dioxide emission reduction in the building sector at the community level [35], especially in the new zone. Linear models are widely used in forecasting future population, GDP and building size, but are inaccurate. The community in this paper refers to industrial parks, science and technology parks, residential communities, social blocks, urban development zones, small towns, etc. This community is not at an urban scale, nor can it reach the inter-city scale. The building in this paper refers to the BE (built environment), which can meet the use functions of human residence, work and activities. Its energy consumption demand mainly includes heating, cooling and power. The energy in this paper mainly represents the primary energy conversion mode (heat) and the converted secondary energy supply (heating) and terminal consumption. The research object of this paper is energy system rather than energy equipment. In the link of energy production–conversion–consumption, energy conversion and energy consumption are the key points of community building energy planning. Community building energy planning is to make a long-term plan for the energy system and energy consumption of community buildings according to the energy demand and energy supply of community buildings in combination with urban development planning during community construction.
To reduce the energy consumption and CO2 emission in building heating sector at the community level, community energy planning of Liaobin coastal economic zone was put forward and scenario analysis was introduced in forecasting energy consumption and CO2 emission of a new zone with a LEAP model. The method of community energy planning and CO2 emission reduction using the LEAP model is introduced here to simulate the influence of different scenarios of community energy consumption and CO2 emissions. To improve accuracy of future GDP and population data prediction, an ARIMA (1,1,1) model is introduced into GDP prediction and a logistics model is introduced into population prediction. To update LEAP’s database, carbon emission coefficients of raw coal and natural gas that fit China’s environment were calculated. A clean-type combined heat and power (CHP) system with a new principle of fixing power based on heat is put forward. This is illustrated by the case of the Liaobin coastal economic zone in Panjin, China.

2. Materials and Methods

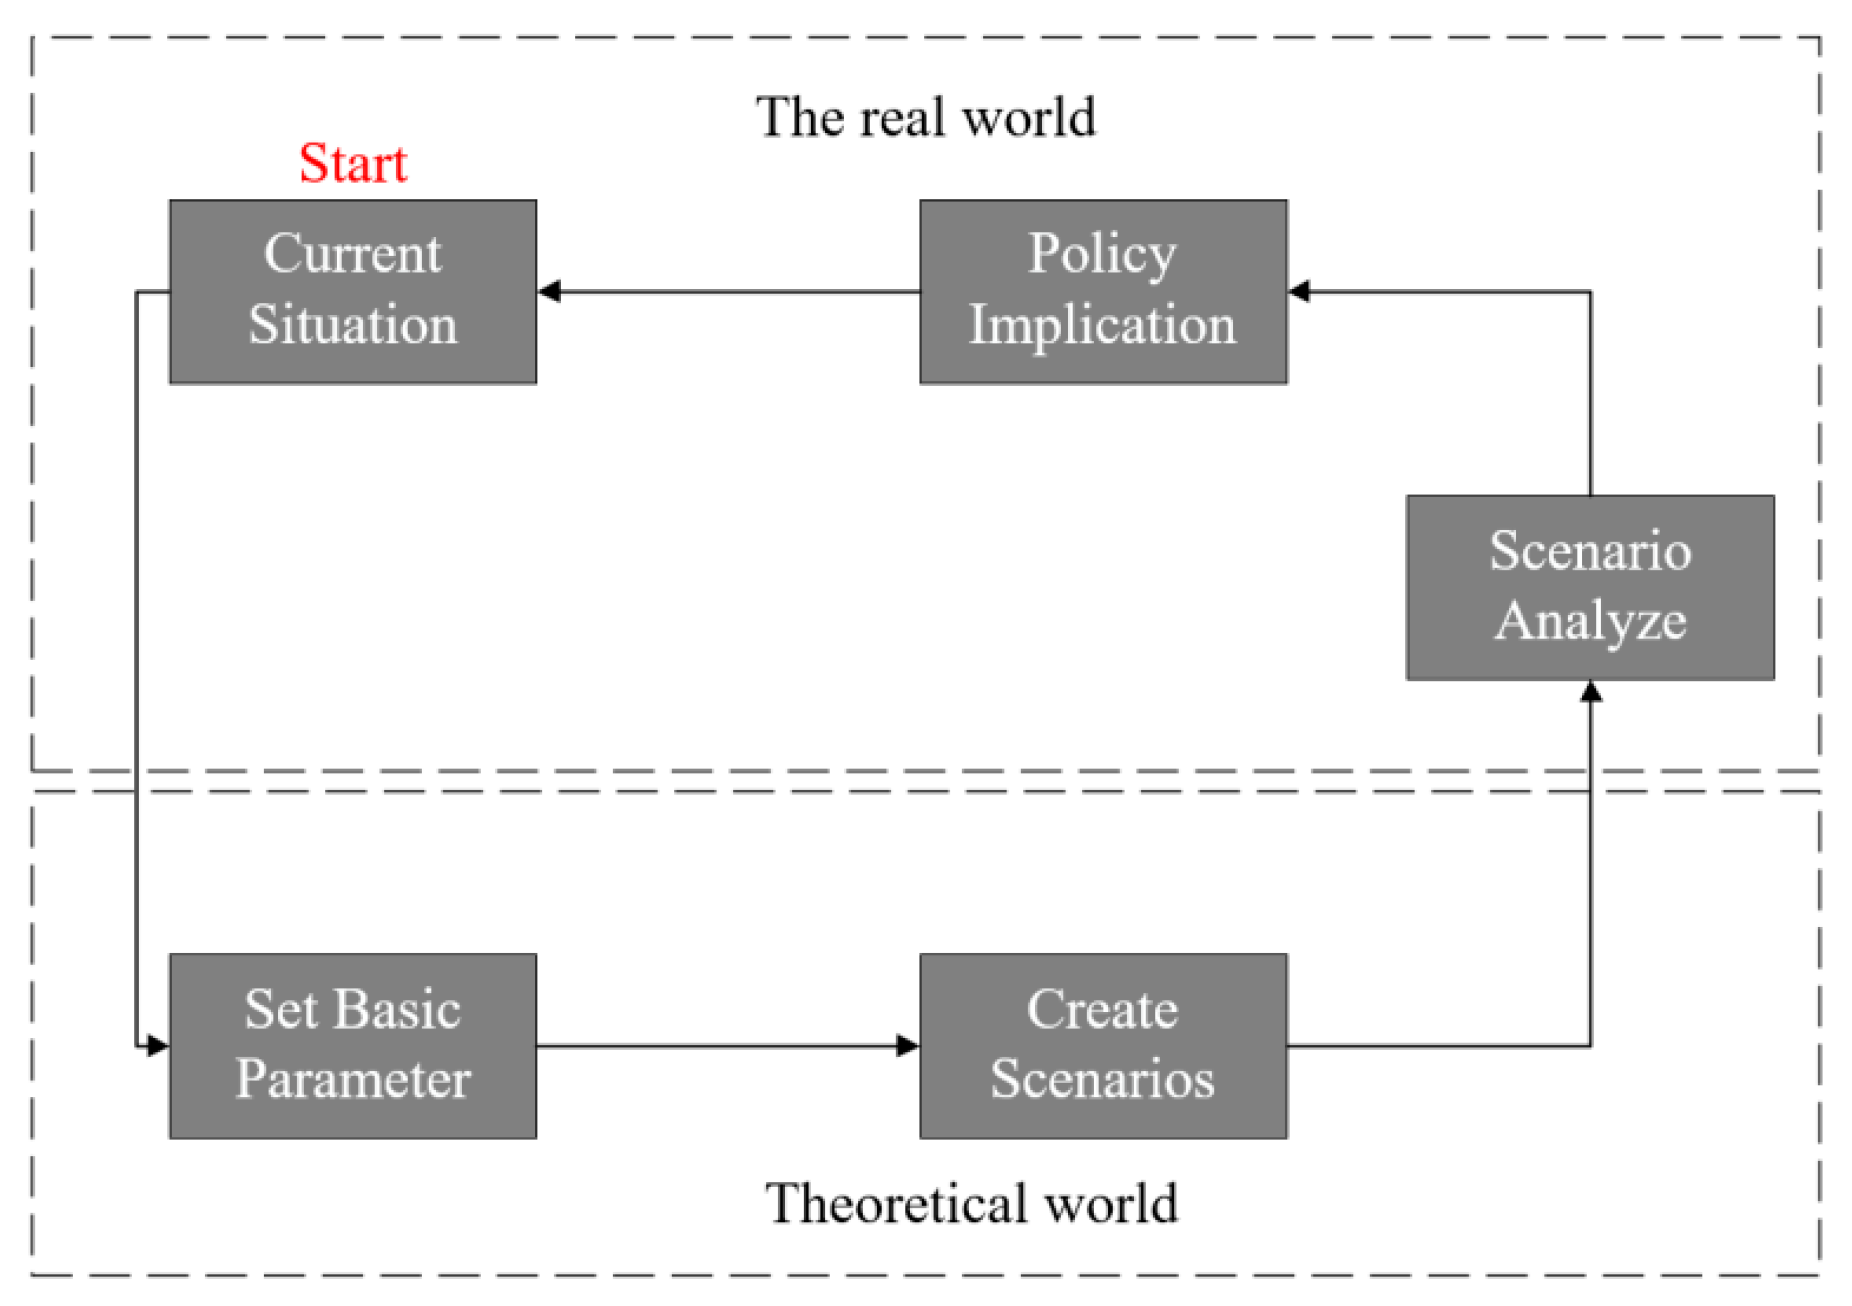
2.1. Scenario Analysis

Scenario analysis is based on speculation to describe the possible future state of the organization’s environment and to form a comprehensive forecast from some related individual prediction sets. The whole process of scenario analysis is to identify the external factors that influence the development of the research subject, to simulate various cross scenario analysis and to forecast various possible prospects that may occur in the external factors. To be specific, the scenario analysis in this paper was carried out according to the following steps based on the research practice, as shown in Figure 1.
Firstly, we analyzed the research background and determined the research objectives and methods. Secondly, the current situation of energy consumption and environment in Liaobin coastal economic zone was analyzed. Thirdly, we identified and determined the key factors affecting energy consumption and environment of this zone, predicted the future development trends of population and economy of this zone through logistic and ARIMA models, and completed the basic parameter setting of the LEAP model. Then, established a baseline scenario and community energy planning scenarios. Finally, we analyzed the results of scenarios and made development policy recommendations. The parameters quantified in this study included macroeconomic parameters (population, GDP, income level, building area) that have important influences on energy consumption and equipment efficiency levels that affect energy consumption.

2.2. LEAP Model

The LEAP model was chosen in this study, the reasons for which are analyzed in the previous section. The LEAP model sets modules of demand, transformation, environmental impact and resources. LEAP predicts the future energy demand according to the actual situation of the research object. To achieve the balance between demand and transformation, the model starts from primary energy, simulates the transformation process of energy, and calculates whether the local resources are self-sufficient, or what the energy import and export will be. The model also relies on an established environmental database (TED) to predict the environmental impact of a given energy scenario and to calculate its costs in terms of resources, transformation, utilization, etc. Energy demand, coordination of supply and demand, and environmental impact assessment of the community were analyzed by the LEAP model according to the order of resources, transformation, and demand. According to energy demand in current planning and the forecasting of social and economic development in future planning, energy consumption patterns of various development situations can be designed by the model according to different energy application technologies. This provides reference information of community energy planning impacts on the environment. The LEAP model structure is shown in Figure 2.

2.3. DeST Model

DeST, a software platform for building environment and HVAC system simulation, was used to calculate the dynamic heating and cooling load of community buildings in this study. The mathematical model of building energy consumption used in DeST is [37]:
c p a ρ a V a d t a d τ = j = 1 n A j h i n [ t j ( τ ) t a ( τ ) ] + q c o v + q f + q v e n t + q h v a c
where c p a ρ a V a —the heat capacity of the air in a room, J/K. A j —the area of j interior surface of the room wall, m2. h i n —the convective heat transfer coefficient between the inner surface and the air, W/(m2⋅°C). q c o v —the transfer of heat from an indoor heat source to the air by convection, W. q f —heat release from interior furniture, W. q v e n t —heat transfer from ventilation between adjacent rooms, W. q h v a c —heat delivered from the HVAC systems, W.
The one-dimensional heat conduction equation, where heat conduction parallel to the direction of the wall surface is ignored, is:
c p ρ t τ = t τ ( K t x )
where t —the temperature inside the wall, °C. c p —heat capacity of wall material at constant pressure, J/(kg⋅K). ρ —wall density, kg/m3.   τ —time. K —heat conductivity coefficient, W/(m⋅K). x —thickness, m.
The boundary condition of the inner surface of the wall is:
K t x | x = l = h i n ( t a t ) + q r + j h r , j ( t j t ) + q r , i n .
The boundary condition of the outer surface of the wall is:
K t x | x = 0 = h o u t ( t 0 t ) + q r , 0 + h r , o u t ( t e n v t )
where l —thickness of the wall, m. h i n and h o u t —convective heat transfer coefficient of interior and exterior surface of wall and indoor air, W/(m2⋅K). t a —the indoor temperature, °C. q r —the amount of radiation absorbed by the inner surface, W/m2. h r , j —the long wave radiative heat transfer coefficient between this surface and the other, W/(m2⋅K). t j —temperature of j floor of the wall, °C. q r , i n —heat transferred by radiation from indoor heat sources to this surface, W/m2. t 0 —outdoor temperature, °C. h r , o u t —the long wave radiative heat transfer coefficient between exterior surface and outdoors, W/(m2⋅K). t e n v —the combined temperature of this surface, °C.

2.4. Logistic Model

Population growth will inevitably increase residents’ living energy demand. However, China is slowly forming an aging society, and population aging is the main feature of Panjin society. One of the most important features of an aging society in industrialized countries is the increasing number of and shrinking size of families. According to the previous empirical analysis, energy use per capita of a larger family is significantly lower than that of a smaller family. Therefore, the energy consumption of Panjin will increase and energy demand structure and energy quality will have higher requirements.
Mathematical and statistical methods in population prediction system are used by the academic circle, such as logistic, gray GM ( 1 , 1 ) and Leslie models. Logistics reflects the growth of the total population to a certain extent, but its limitations are relatively large. For example, it excludes the possibility of population reduction and the reasons for limiting population fertility. The logistic model is more accurate in short-term prediction. The computation for population in the study was via the logistic population-retarded growth model. According to the logistic model, population growth is restricted by environmental factors, such as natural resources and environmental conditions, so the total population cannot exceed a maximum capacity [38].

2.5. ARIMA Model

The economic module plays an important role in LEAP model’s forecasting of energy demand and carbon dioxide emission reduction. In previous research, most scholars used development planning policies or similar regional experiences to forecast the future GDP trend, which is relatively simple and inaccurate. In this study, an ARIMA model was introduced to forecast regional future GDP.
An ARIMA model is a kind of econometric model, which is widely used to predict the data evolution in the next step by deeply analyzing the connection caused by historical factors between data. For example, it is used in economics to predict GDP. To meet the requirements of the ARIMA model, EVIEWS software was used to analyze the seasonal factors and stationarity data, and it was found that it was greatly affected by historical factors, no seasonal analysis was needed, and it could be predicted by changing the difference [39].

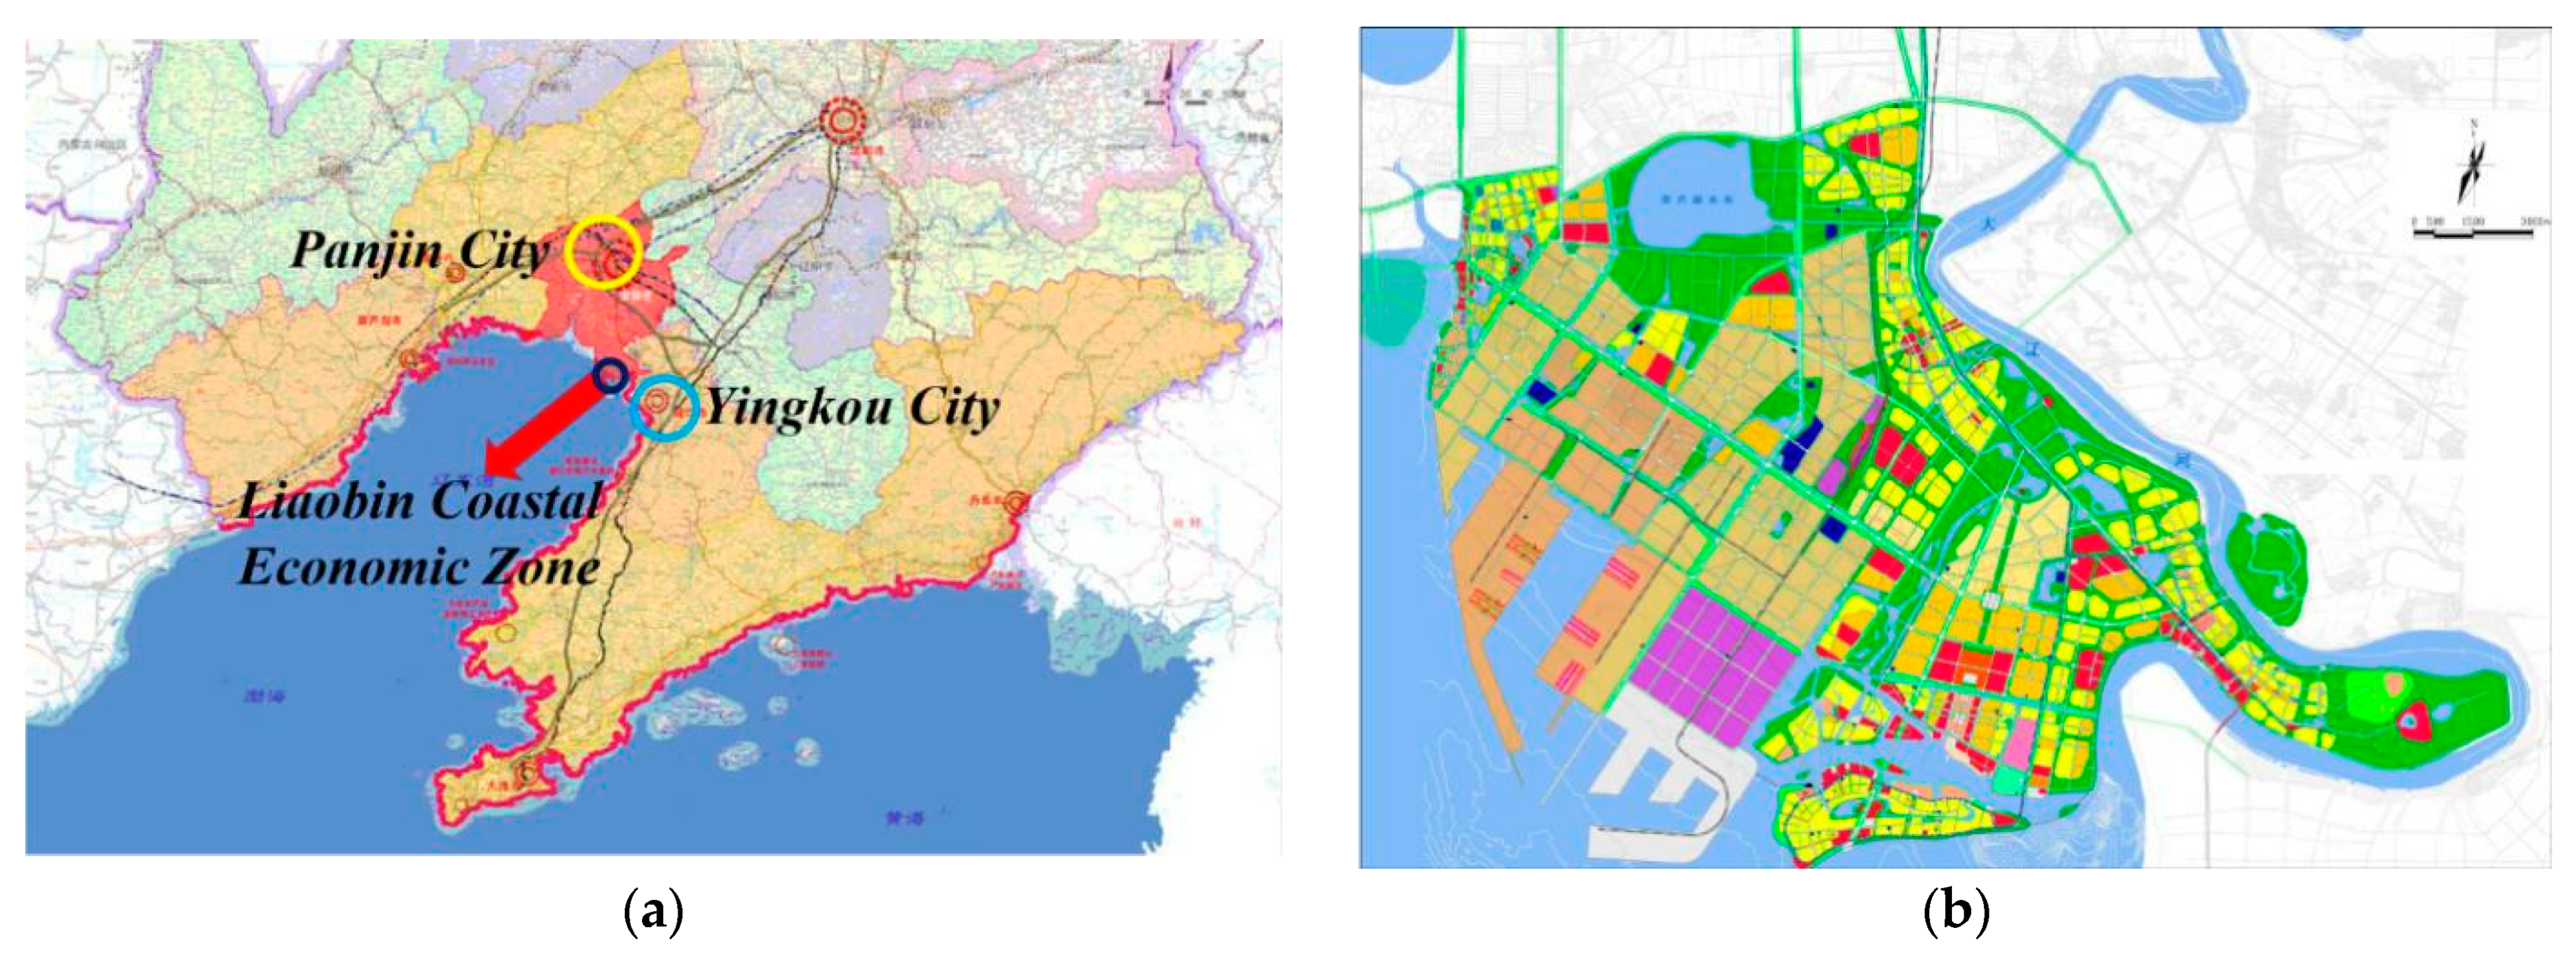
3. Case Study in Liaobin Coastal Economic Zone

3.1. The Current Situation

Liaobin coastal economic zone, established in 5 December 2005, is one of the important development areas of Liaoning province and is a national development strategic area. The “Twelfth Five-Year Plan” of Panjin advanced a goal to make Liaobin coastal economic zone a national economic zone. It is an important strategy to construct the Liaobin zone, where the development priorities of Liaoning Province and city of Panjin are oriented to the sea, as is shown in Figure 3a. Liaobin zone has become the pilot area of Panjin’s development and a demonstration area of scientific development, reform and innovation. The development areas of this economic zone include the former Liaobin economic zone, Rongxing Korean village, and Erjiegou town, with a total planning area of 306 square kilometers. The overall planning of the zone is shown in Figure 3b. It is located between the cities of Panjin and Yingkou, so it has attributes common to the two cities, thereby linking them. Ecological resources and the development potential of this area are much greater than the central city.
After participating in the urban planning of Liaobin, we found that the current situation of energy planning in Liaobin is as follows: (1) Project selection and determination of location are done with consideration of economic benefits (e.g., land price and market foreground), and are even determined by decision-makers in many cases; (2) Planning of urban power, heating and gas supply are not considered overall, which often results in large loads. (3) A vicious circle formed by making supply meet consumer demand causes serious problems, such as waste of resources and unreasonable energy use. (4) Requirements in most building energy conservation planning do not exceed national standards. (5) Renewable energy and unused energy are rarely utilized. Since there is no effective energy planning in China’s urban planning system, problems of energy systems in cities cannot be solved completely using microcosmic technology. Based on the above problems, the author applied the integrated resource planning method to the community energy planning of this zone. To study the impact of this method on the environment, the energy and environment system model (LEAP-Liaobin) has been analyzed and established.

3.2. Different Layers of the Model

Two modules, demand and environmental implication, are chosen in LEAP-Liaobin model according to the needs of the scenario analysis. According to the characteristics of Liaobin coastal economic zone, the building sector is further divided into residential building sector, commercial building sector, office building sector and hotel building sector (as shown in Figure 4).
The driving factors of demand and environmental implication modules mainly include the aspects of socio-economic development and energy. Specifically, in terms of the socio-economic aspect, macroscopic factors, such as economic development level, urbanization rate, population and people’s living standard, affect energy demand through affecting energy consumption patterns. In terms of the energy aspect, the driving factors include energy supply structure, energy utilization technology, energy policy, environmental protection policy, etc., which affect the energy demand through optimization of energy structure, the improvement of energy utilization technology and environmental standards.

3.3. Scenario Design

Future energy consumption and air pollution emission scenarios of the Liaobin coastal economic zone are mainly based on the following assumptions. First, electrification and gas use will increase in the future, as will the proportion of clean and high-quality energy (such as electricity and gas). The efficiency of energy utilization will also increase. China’s building energy conservation is based on the building energy consumption from 1980 to 1981, and the energy efficiency can be improved by 30% per step based on the previous stage. In particular, the first stage is 30% energy saving, the second stage is 50% energy saving and the third stage is 65% energy saving. Second, prevention and control of various pollutants produced during fossil fuel use will be strengthened, and the emission intensity of air pollutants and greenhouse gases will be reduced. Based on the two assumptions above, the following two scenarios are addressed.

3.3.1. Baseline Scenario

The baseline scenario refers to the traditional way of energy planning and does not allow any further policies or measures of energy conservation and emission. The standard of 50% energy saving in the second stage should be strictly implemented in the design of new buildings. The traditional building load index method is used to calculate community building load, and demand-side energy-saving measures are not increased. According to the use property of the buildings, the following heating indexes are given, the heating index of residential building is 45 W/m2 and the heating index of public building is 55 W/m2. Traditional district heating systems are used.

3.3.2. Community Energy Planning Scenario

In this scenario, policy intervention measure is set up to increase the promotion of clean energy and exceed the Liaoning CO2 emission target, which is that carbon emissions in 2020 should be 18% lower than in 2015. The integrated resource planning method of the electricity department is used in community energy planning of Liaobin coastal economic zone. High-quality energy, such as solar, geothermal, natural gas and electrical energy, are widely used in buildings, which are alternative energy sources to coal. A simplified method of typical buildings was put forward in building dynamic load forecasting, which is a demand-side energy-saving measure. To be specific, firstly, the buildings in the zone are classified according to their functions. Then the typical buildings of different types are selected to build the typical building model. By dynamic load prediction, the hourly load distribution of all types of buildings and the whole zone can be obtained. We analyzed energy supply and resource conditions in the Liaobin coastal economic zone and dynamic heating loads of the zone, considering factors such as energy supply reliability, benefits of energy conservation and emission reduction, and efficiency of energy use. Based on this, we propose a distributed co-generation energy system.
The two scenarios above are mainly set up from an energy perspective. The main difference between them is that supply side method is used in the baseline scenario and demand side method is used in the community energy planning scenario. Considering data availability, the study period was from 2010 to 2030, and the base year of the model was 2010. The key assumptions for the two scenarios are shown in Table 2.

3.4. Scenario Design of Driving Factors

The macro drivers in this study’s scenario analysis are GDP growth and changes in population size. The main impact of GDP growth is the increase in floor area of public service buildings, which increases heating and cooling load, energy system capacity and quantity, and carbon emission intensity. Population growth has increased the demand for energy for residential buildings and will be an important driver of energy consumption and carbon emissions at community level. Macro driving factors also include urbanization and the population aging rate, which are not examined in this paper. The research object in this paper is mainly within the scope of cities, excluding rural areas, therefore, urbanization rate has little impact on the research in this paper. Aging rate has a great impact on energy demand and carbon emission of medical and health buildings, which have not been considered in this paper.
The micro drivers in this study’s scenario analysis are energy structure adjustment, energy technology progress, and increase of energy efficiency. The emission coefficients of different energy vary greatly, so the adjustment of energy structure has a significant impact on emission reduction. Policies about energy restructuring and energy technology progress are relatively easy to implement at a community level. Building cooling and heating account for a large proportion of energy consumption at the community level, and because the energy system and energy structure are relatively simple, energy technology progress and increase of energy efficiency have great impacts on the energy consumption of community buildings. Furthermore, the drivers underlying the recent growth of the sectors of commercial and office affairs are unrelated to building energy consumption at a community level.

3.4.1. Socio-Economic Factors

According to data of the Panjin statistical bureau, in 2010, the energy consumption per unit GDP was greater than the national average. Based on comprehensive analysis of the development condition of Liaobin coastal economic zone and the domestic and international development environment, we established two phases of development goals, as shown in Table 3. By 2030, the GDP of the zone will reach 27 billion yuan, equivalent to four times the GDP in 2009. GDP per capita will reach 434,670 yuan.
Based on the analysis and simulation calculation of GDP and RGDP data of Panjin by the ARIMA (1,1,1) model, the GDP and RGDP of Liaobin are calculated. According to the national bureau of statistics data and Panjin statistical yearbook 2018, the GDP data of Panjin city from 1990 to 2018 are obtained. The data show an upward trend, which can be predicted according to ARIMA model and time series algorithm. Firstly, EVIEWS software was used to draw the scatter diagram of Panjin’s GDP data from 1990 to 2018, and the original time series diagram is shown in Figure 5a. From Figure 5a, we can see intuitively that this time series has an obvious trend, so it can be preliminarily judged that this series is a non-stationary series, and the ADF unit root test on the sample data is further proved. To stationary handle the non-stationary sequence, we first processed the data sequence logarithmically, and then used first-order difference to obtain the stationary time series. The stationary sequence is shown in Figure 5b. The results of ADF root test on this data are shown in Figure 5c. The autocorrelation function graph and partial autocorrelation function graph were made for the stationary data, and the results were shown in Figure 5d. According to AIC criterion and DW test, the model is ARIMA (1,1,1).
The least squares estimation result of the model was via:
X t = 470.9179 + 0.964976 X t 1 + 0.468145 a t 1 .
As shown in Figure 6, the calculated RGDP from 2019 to 2030 is nearly 7%, which is in accord with the Panjin 13th five-year plan of industrial development. In this model, GDP is introduced as the exogenous variable.

3.4.2. Demographic Factor

Population size is a major driver of future energy demand. The growth rate of newly introduced talents is 4–6 times of the growth rate of natural urban population. The new talent introduction policy is the main reason for the huge increase in population. According to the above analysis and referring to the population situation of the zone from 2010 to 2018 (as shown in Figure 7), the population and population growth rate is calculated by logistic modeling.
The Liaobin logistic population-retarded growth model is:
{ d x d t = r x ( 1 x x m ) x ( 0 ) = x 0 ,
x ( t ) = x m 1 + ( x m x 0 1 ) e n ,
where x ( t ) —population in year t ; x m —maximum population; x 0 —population in base year and r —natural population growth rate.
As a result, the population will reach 62,116 in 2030, and the population growth rate from 2019 to 2030 is nearly 2.1‰, which is in accord with Panjin 13th five-year plan of population development. It is noteworthy, as shown in Figure 7, that the population growth rate of 2014 increases rapidly at a rate of 81.94%, the reason for which is that the new talent introduction policy and the zone construction accelerated.

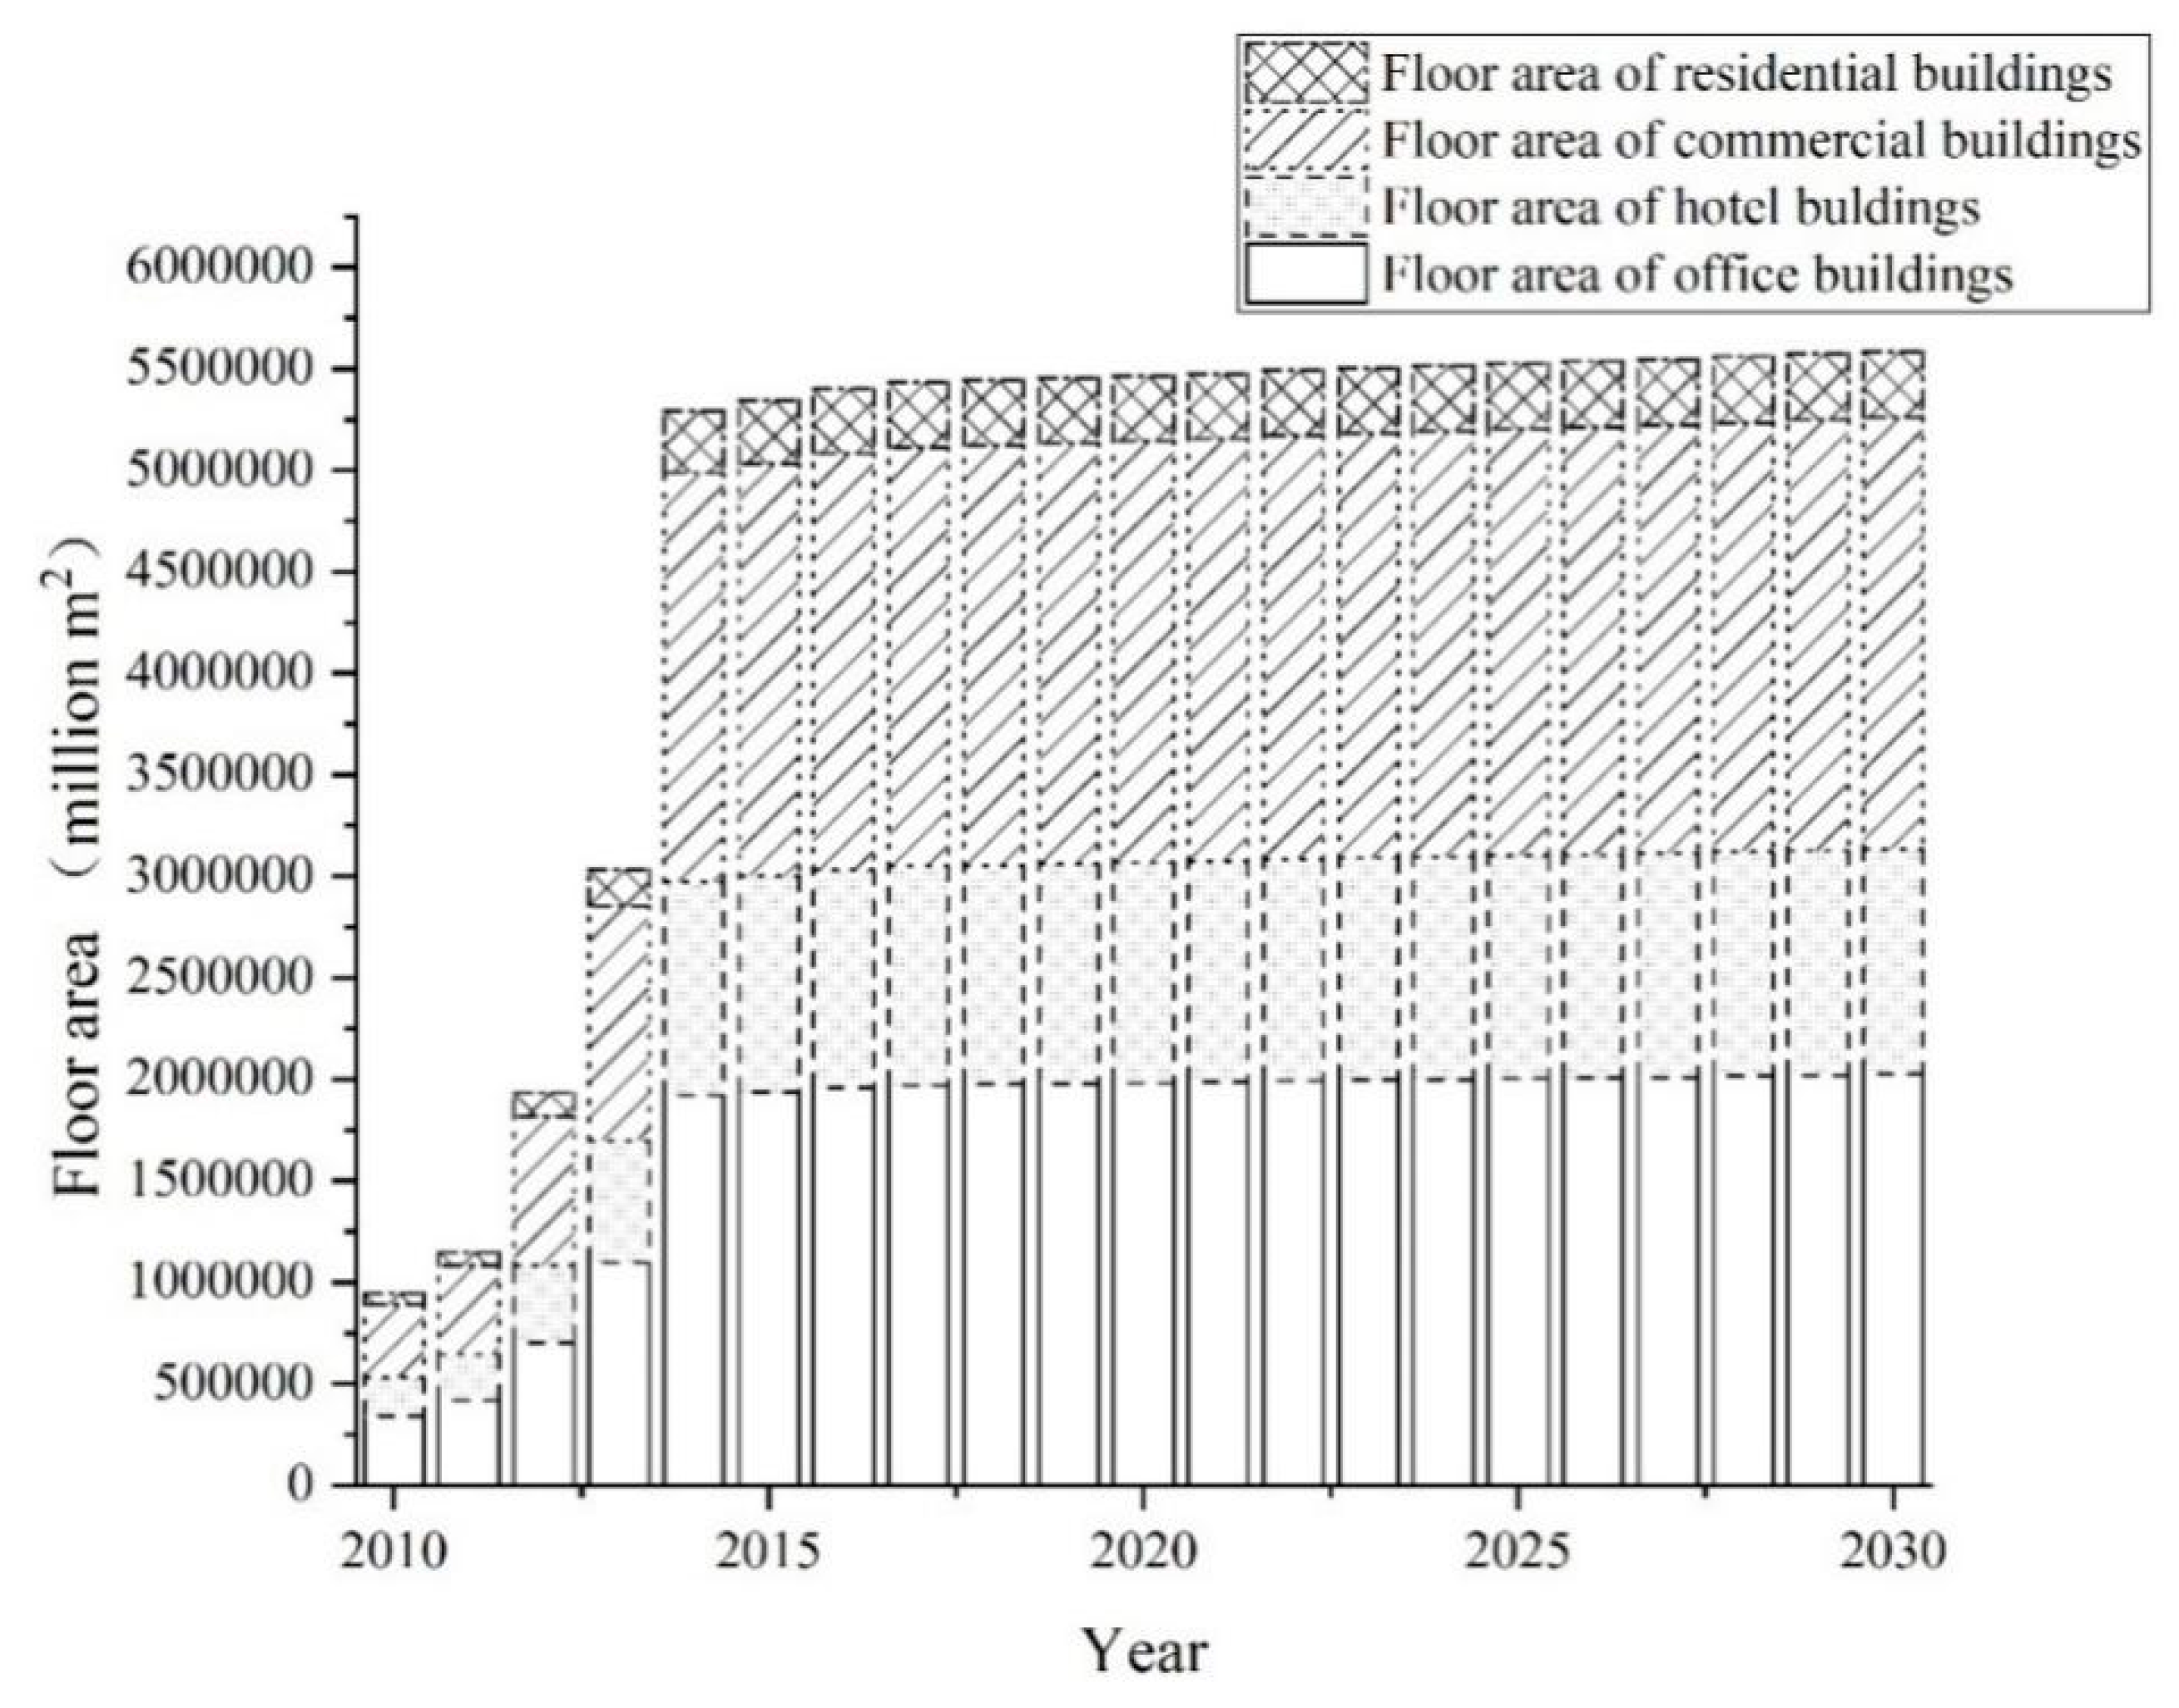
3.4.3. Architecture Factor

⬤ Floor Area
The computation for floor area in the study was via:
A n = A p n × M n ,
A p n = A p 0 × n ( 1 + U i ) ,
where A n —floor area in year n, A p n —per capita floor area in year n, M n —the size of the population in year n, A p 0 —per capita floor area in base year and U i —per capita floor area increase rate in year i.
The per capita floor area is a sign of regional economic development level. According to the analysis of the building situation in the zone from 2010 to 2018, the per capita floor area of the zone was set in a scenario (as shown in Figure 8). As a result, the gross floor area will reach 5,590,456 m2 in 2030.
⬤ Building Load
Building load is an important index that produces an effect on building energy supply strategy and equipment selection. In the baseline scenario, traditional building load index method is used to calculate community building load. All the planned buildings in the zone are energy-saving buildings. Heating indexes are set up according to the building types, which are 45 W/m2 for residential buildings and 55 W/m2 for public buildings.
In the community energy planning scenario, in order to solve the problem of building dynamic load forecasting in planning stages of the zone, such as a large construction progress gradient and different types of building load characteristics, a simplified method of a typical building, as shown in Figure 9, is put forward in this study. Through the inspection and evaluation of all buildings in the zone and referring to existing codes and building energy conservation requirements, the building performance was defined and boundary conditions such as envelope structure and climatic conditions were set.
Building types are divided into residential building, mall, hotel and office building. Typical building models of these types (as shown in Figure 10) are built and analyzed with DeST software, and each typical building’s simulation results are shown in Table 4. The results were summarized to obtain the dynamic load distribution of each region in the zone, each type of building and the whole zone. As is shown in Figure 11, the maximum annual hourly dynamic load of community buildings in zone is 569,180 kW, which occurred on January 6 with the total heating load of 59,356,800 kW·h on that day. The maximum value of cooling load is 376,900 kW, which appeared on August 13 with a total cooling load of 4,485,480 kW·h. As a result, the load index is equivalent to the energy saving standard of the third stage.
⬤ Energy Centers
According to the results of dynamic load prediction, two energy centers are planned in the zone. The total cooling and heating loads of the first energy center are 221.8 MW and 222.8 MW, respectively. The total cooling and heating loads of the second energy center are 224.5 MW and 355 MW, respectively.

3.5. Scenario Design of Energy Systems

3.5.1. Baseline Scenario

In the baseline scenario, traditional energy sources, such as coal, are used in district heating systems and coal-fired boilers with high thermal efficiency are used, whose thermal efficiency is nearly 85%.

3.5.2. Community Energy Planning Scenario

⬤ Heat Source
Heat pump technology, who improves the grade of natural free energy, becomes one of the most important low-carbon technologies. Ground water-source heat pumps (GWHP) technology takes groundwater as the heat source to provide heating and cooling. Consuming a small amount of electric energy, the low-grade heat that cannot be directly used can be extracted from the groundwater and turned into the high-grade energy that can be directly used. GWHP is widely used and mature in China, especially in Liaoning province. The former text showed that the potential of geothermal resources in the zone is 8.2 × 10¹⁸ J which is equivalent to 2.8 × 10⁸ tons of standard coal. Therefore, GWHP is considered as the main heat source of community energy system.
⬤ Combined Heat and Power (CHP) System with the New Principle of Fixing Power Based on Heat
CHP can recycle the heat discharged in the process of power generation and deliver it to users through the heat grid, thus greatly improving the primary energy efficiency. In large cities of northern China, CHP plants are designed for urban heating, which are based on the user’s heat consumption. This is in accord with the previous principle of fixing heat based on power. The power generated by CHP plants, which are not the main power plants in StateGrid, is only a supplement to the large power grid. The power system is connected to the power grid in two ways: off-grid and on-grid. According to the provisions of China’s power sector, users can only generate their own power for their own use, which is off-grid. If they need to be on-grid, they need to accept unified dispatching and bidding on-grid. Because the power generated by CHP does not have an advantage in “bidding on-grid”, most CHP plants focused on heating. David MacKey [40] compared the efficiency of CHP and separated heat and power (SHP) systems. For CHP, the most efficient primary heating technology is the condensing boiler, with an efficiency of 90%, while the most efficient primary power supply technology of SHP is the natural gas combined cycle, with an efficiency of over 50%. All CHP technologies, which are shown as scatter points in Figure 12, are in the middle of the figure, and tend to be less power efficient if more heating efficient. The thermal efficiency of all CHP technologies can only reach about 80% under the premise of full use of heat and power, which is lower than that of the condensing boiler. Therefore, if the distributed CHP system is only used as the heating and cooling source of the building, the value of CHP system is obviously reduced.
Traditionally, the main attention was paid to the utilization of heat, not the generated power. Under the condition that distributed power cannot be on-grid and the price parity between power and natural gas is very low, the power use of CHP should be paid more attention, to achieve the highest energy efficiency and economic benefits. In summary, the new principle of fixing power based on heat should be understood as determining the power demand of electric-driven heat pumps by heating demand and combining CHP with heat pumps to achieve the maximum energy efficiency.
⬤ Energy System
In the two planned energy centers, the energy system is a clean cogeneration system that combines internal combustion engines, GWHPs and absorption heat pumps (AHPs). The new principle of fixing power based on heat, which is mentioned above is applied in the energy system.
The latest high-efficiency AHPs and GWHPs are used as the cooling and heating equipment in the energy centers. Specifically, the prime movers are internal combustion engines fueled by natural gas, all the electricity generated by which is used to drive the GWHPs for cooling and heating. To achieve maximum energy efficiency, AHPs are used to absorb the heat waste heat in the end of the internal combustion engine. The system diagram and energy efficiency of the system are shown in Figure 13, and the final total energy efficiency is approximately 200%, which exceeds the comprehensive thermal efficiency of the GWHP with higher efficiency under the average power supply efficiency of the traditional natural gas combined cycle power plant in China, as shown in Figure 14.

3.6. Energy Demand and CO2 Emission Calculation

The energy demand calculation principle of LEAP is as follows. We assume m types of energy and n industry sectors. The energy demand of various industries is determined by the level of economic activity and energy intensity at the unit level of economic activity. CO2 emissions are determined by the energy demand and coefficient of carbon emissions. The equations are as follows:
E i t = j = 1 n A j t E i j t ,
E j t = i = 1 n A j t E i j t ,
C = i j A j t E i j t f i j ,
where E i t —total consumption of i energy at t time; E j t —comprehensive energy consumption of j department at t time; C —carbon dioxide emissions; A j t —activity level of j department at t time, which is often expressed as department of production or product output; E i j t —energy consumption intensity of j department at the unit activity level at t time and f i j —coefficient of carbon emissions of energy in j department, as shown in Table 5.
However, few studies have tried to calculate carbon emission coefficients that fit China’s environment. Using the emission coefficient based on energy value given by IPCC (the data are collected and analyzed from various countries), the mass coefficient of carbon emission based on unit mass of fuel is calculated according to the fuel calorific value of China. Raw coal and natural gas are considered in this research.
According to characteristics of energy supply and terminal energy consumption in the Liaobin coastal economic zone, we divided the terminal energy demand department of the model into three energy-use segments, namely, the building industry, commercial, and resident living. The energy carrier in this model was coal, electricity, gas, natural gas, and others. The computation for thermal power plants in the study was via:
H = c f 1 ( e e ) f 2 ,
where c —coal burning in the thermal power plant, t. e and e —total generating capacity and self-use power quantity, respectively, kW·h. f 1 and f 2 —coal and power converted into standard coal coefficient, whose values are 0.7143 kgce/kg and 0.1229 kgce/kg, respectively.

4. Results and Discussion

4.1. Energy Consumption

The prediction of energy demand in the zone is shown in Table 6. As shown in Figure 15, by 2030, energy demand of the zone in the baseline scenario will be 1.1 × 10⁶ MW·h, an increase of 9.15 × 10⁵ MW·h when compared to 2010. Total energy demand from 2010 to 2030 is 1.98 × 10⁷ MW·h. We see clearly that energy demand of all types of buildings increased rapidly from 2010 to 2015, and then the increasing trend tended to slow from 2016 to 2030. Energy demand of commercial buildings takes the largest proportion of the zone, the cumulative demand of which is 7.6 × 10⁶ MW·h. The cumulative energy demand of residential buildings is 9.5 × 10⁵ MW·h, which takes the minimum proportion.
Figure 16 is a histogram of energy demand of the community energy planning scenario over the period 2010 to 2030. The growth trend of energy demand of this scenario term was similar to the previous one. From 2010 to 2015, energy demand increased rapidly and then the increasing trend slowed down. By 2030, energy demand of the zone in the community energy planning scenario will be 4.6 × 10⁵ MW·h, an increase of 3.82 × 10⁵ MW·h when compared to 2010. Total energy demand from 2010 to 2030 is 8.26 × 10⁶ MW·h. Energy demand of commercial buildings takes the largest proportion of the zone, the cumulative demand of which is 3.57 × 10⁶ MW·h. The cumulative energy demand of residential buildings is 3.93 × 10⁵ MW·h, which takes the minimum proportion.
Energy demand in buildings of the zone grows rapidly from 2010 to 2015, but the trend slows down in the medium term and reaches a plateau by 2015. The main driving factor of energy demand in buildings of the zone is that energy growth will be largely dominated by energy efficiency improvement, rather than overall increases in floor area. Growth in floor area is limited by the zone population. While the economic factor plays an important role in the growth of energy demand, growth in floor area will by no means keep up with growth in value added GDP, as is clearly shown in Figure 6, Figure 7 and Figure 8.
In Figure 17, the bar chart compares the primary energy consumption of the two scenarios from 2010 to 2030. The primary energy consumption of community energy planning scenario is 4.8 × 10³ tce in 2010, while the number is 1.7 × 10⁴ tce in the baseline scenario. The primary energy consumption of community energy planning scenario is 2.8 × 10⁴ tce in 2030, while the number is 1.5 × 10⁵ tce in the baseline scenario. The community energy planning scenario reduces primary energy consumption by 1.2 × 10⁵ tce in 2030 compared to the baseline scenario, and the cumulative reduction is 2.3 × 10⁶ tce from 2010 to 2030. The single most important driving factor of increasing energy consumption could be seen in architecture sector in the short term. However, aggressive policies, measures and technology improvement in energy efficiency and building construction will play a more important role in the reduction of energy consumption in the long-run.

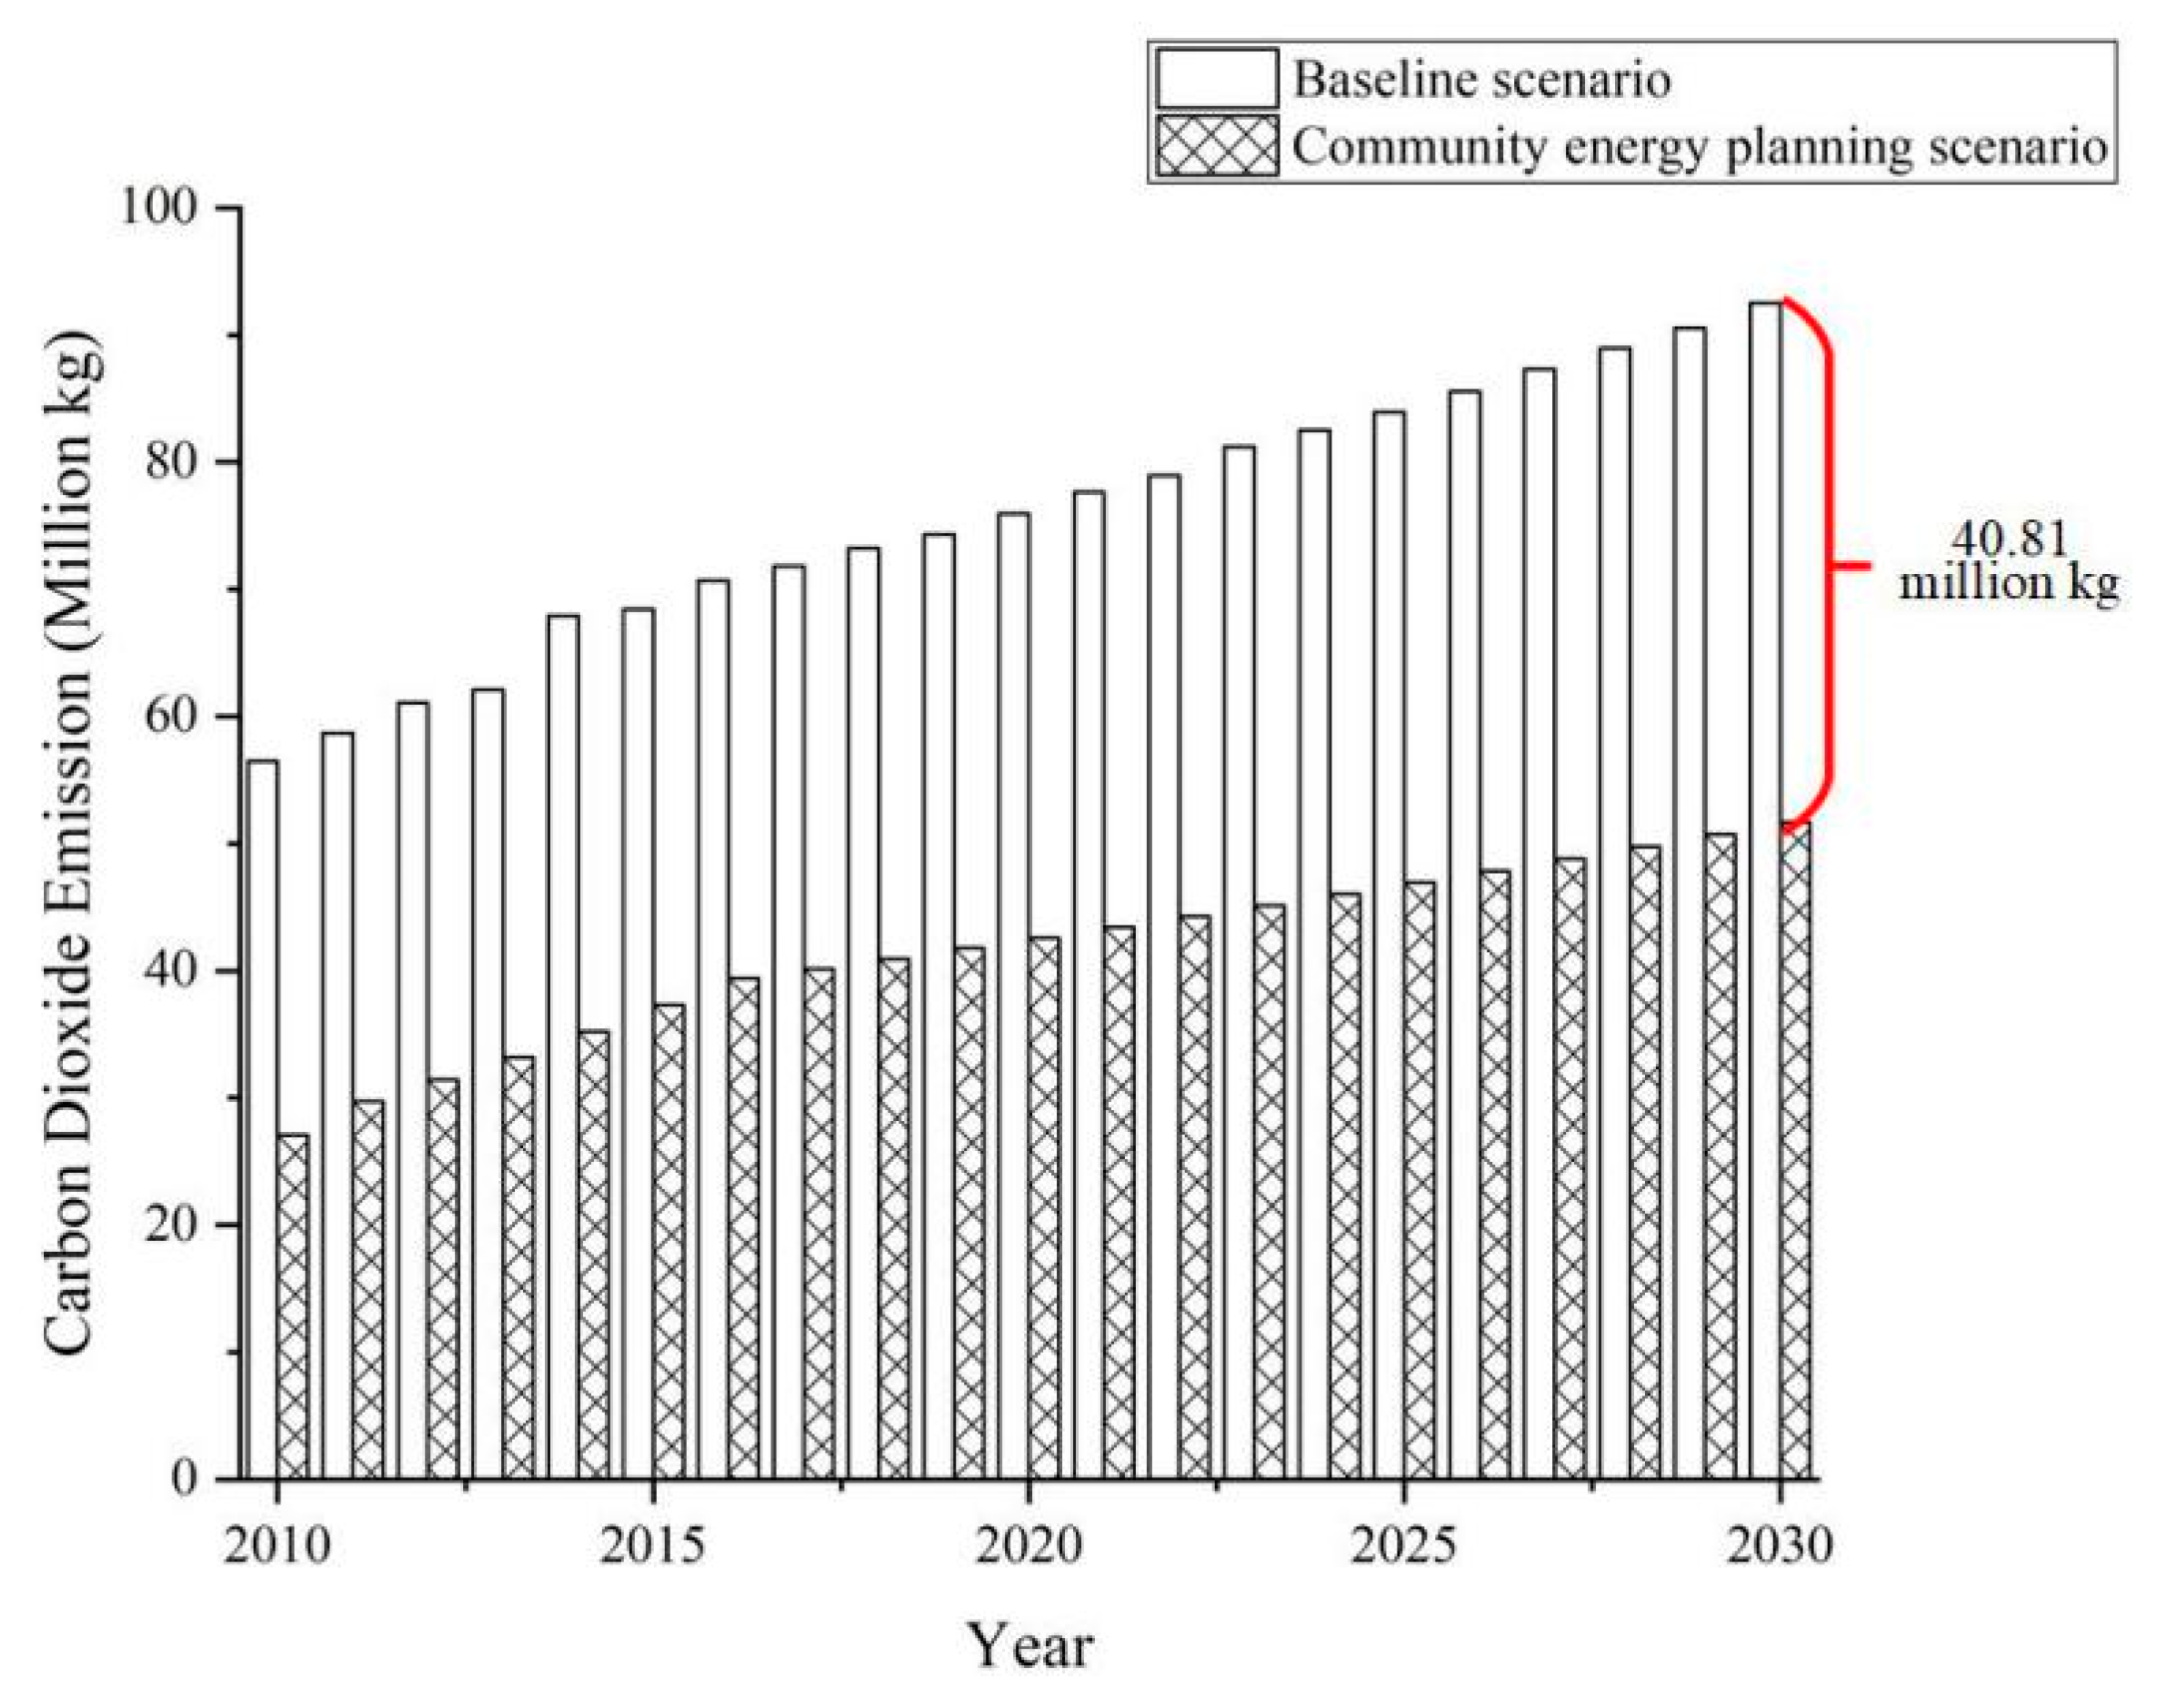
4.2. Carbon Dioxide Emission

In the baseline scenario, the predictions of carbon equivalent change are as follows. As is shown in Table 7, by 2030, CO2 emissions of the zone will be 9.252 × 10⁴ t, an increase of 3.602 × 10⁴ t when compared to 2010. Total CO2 emissions from 2010 to 2030 are 1.59 × 10⁶ t.
CO2 emissions data in the community energy planning scenario from 2010 to 2015 were obtained by field testing and calculation. In the community energy planning scenario, the predictions of carbon equivalent change are as follows. As shown in Table 7, by 2030, CO2 emissions of the zone will be 5.17 × 10⁴ t, an increase of 2.47 × 10⁴ t when compared to 2010. Total CO2 emissions from 2010 to 2030 are 8.73 × 10⁵ t. Compared with the baseline scenario, CO2 emissions of the community energy planning scenario are reduced 4.08 × 104 t by 2030, total CO2 emissions from 2010 to 2030 are decreased by 7.17 × 10⁵ t, and emission levels are reduced by 45%, which exceeds Liaoning CO2 emission target.
Figure 18 is a histogram of variations of CO2 emissions over the period 2010 to 2030. We see clearly that carbon emissions in both scenarios increased rapidly from 2010 to 2015, when the economic zone was under construction. Thus, the main driver of this increase was community construction. From the chart, we can see that CO2 emissions of both the baseline scenario and the community energy planning scenario raised steeply in 2014, which follow the population increase. However, CO2 emissions of community energy planning scenario increased relatively slower than baseline scenario, which means that population is a key factor influencing CO2 emissions in the short-term and that the effect of population on the community energy planning scenario is weaker than that observed in the baseline scenario. However, the main long-term driver of CO2 emission increase is energy structure, rather than GDP growth, changes in population size, industrial structure adjustment, energy technology progress, and increase of energy efficiency. As shown in Figure 18, the CO2 emission of the baseline scenario increases more quickly than that of community energy planning scenario.
Obviously, the method of community energy planning, including energy potential analysis and energy-saving potential analysis on the demand side, plus community energy system planning, helps realize energy conservation and emissions reduction in the Liaobin coastal economic zone.

4.3. Policy Implication

4.3.1. Improve the Policy, Standard and Identification of Energy Conservation and Environmental Protection

As the load index of the community energy planning scenario is equivalent to the energy saving standard of the third stage, and the standard of 50% energy saving in the second stage is implemented in the baseline scenario, stricter energy efficiency standards could help reduce carbon dioxide emissions. In terms of the government, policy, standard and identification of energy conservation and environmental protection should be improved, for example, to improve the thermal performance requirements of windows and building envelope. In terms of the residents, the awareness of conservation and environmental protection should be enhanced, and the concept of public participation and common governance of community residents should be increased. Furthermore, reasonable energy consumption behavior should be advocated. Therefore, sustainable neighborhood units will be created.

4.3.2. Adjust Energy Structure, Use Clean Energy

It can be seen from the scenario analysis that CO2 emissions are different in the two scenarios due to the change of energy type structure. High-quality energy sources such as natural gas have a competitive disadvantage on price compared with coal, and the heating price of natural gas is higher than that of coal. Hence, policies, subsidies or other incentives should be used to stimulate the energy supplier to use natural gas. Furthermore, clean energy technology, such as ground source heat pump, solar hot water and solar heating, should also be encouraged. Under the same building energy consumption, if the proportion of clean energy is higher, the carbon emission will be lower. At the same time, the regulations for the development of new energy should be formulated according to the specific energy situation in the Liaobin coastal economic zone.

5. Conclusions

As China’s energy shortage problem is more serious than that of other countries and considering that China promised that its carbon dioxide emissions will peak around 2030 and peak as soon as possible, fundamental challenges are presented such as socio-economic, demographic and energy rapid growth that will drive up energy demand and CO2 emissions without changes in energy efficiency and energy supply structure. This study thus evaluated how community energy planning can maintain a community’s development trajectory and reduce energy consumption in the building heating sector by assessing the role of energy efficiency as well as structural change in potential CO2 emissions abatement policies.
Technical aspects of using the LEAP model for CO2 emission prediction in community energy planning were analyzed, and a case in the Liaobin coastal economic zone was studied. LEAP was used to predict energy use and CO2 emissions in four energy-use departments, i.e., residential building, mall, hotel and office building. This was based on baseline and community energy planning scenarios.
In the scenario analysis, three driving factors, namely socio-economic, demographic and architecture factors, were analyzed. In socio-economic and demographic factors, in order to improve accuracy of future GDP and population data prediction, an ARIMA (1,1,1) model was introduced into GDP prediction and a logistics model was introduced into population prediction. In the architecture factor, in order to simplify the calculation of dynamic load and improve the accuracy of calculation, a simplified method of a typical building was put forward in this study.
The baseline scenario refers to the traditional way of energy planning. In the community energy planning scenario, the potential of community energy was analyzed, and the results show the great application potential of natural gas and geothermal resources. The characteristics of dynamic heating and cooling loads of all the buildings were analyzed and two regional energy centers were planned to be built. To solve the difficulty in low thermal efficiency in power acquisition and bidding on-grid of a CHP system with the traditional principle of fixing power based on heat, a clean-type CHP system with a new principle is put forward, whose primary energy efficiency is approximately 200%.
The total energy demand of the community building heating sector is 1.98 × 10⁷ MW·h in the baseline scenario and 8.26 × 10⁶ MW·h in the community energy planning scenario. The main driving factor of energy demand in buildings of the zone was energy efficiency improvement. The community energy planning scenario reduces primary energy consumption by 1.2 × 10⁵ tce in 2030 compared to the baseline scenario, and the cumulative reduction is 2.3 × 10⁶ tce from 2010 to 2030. The driving factor is in the architecture sector in the short term, and in the policies sector, such as aggressive policies, measures and technology improvement in energy efficiency and building, in the long-run. In the community energy planning scenario, CO2 emissions will be 5.17 × 10⁴ t. In the baseline scenario, CO2 emissions of the zone will be 9.252 × 104 t by 2030. Compared with the baseline scenario, total CO2 emissions from 2010 to 2030 decrease by 7.17 × 10⁵ t, and emission levels are reduced by 45%. The driving factors of CO2 emissions are energy structure in long-term and population in short-term.
According to the driving factors of energy consumption and CO2 emissions, policy implication of energy efficiency and emission reduction can be summarized into two categories: improve the policy, standard and identification of energy conservation and environmental protection; adjust energy structure, use clean energy.
In conclusion, community energy planning of the Liaobin coastal economic zone provides a theoretical basis and technical road-map for future application of such planning in a cold region of China.

Author Contributions

G.F. and C.T. proposed the innovative points and conceives the study. C.T. wrote the paper. S.L. and F.X. revised the paper.

Acknowledgments

The research work is supported by National Key R & D Program of China (2017YFB0604000).

Conflicts of Interest

The authors declare no conflict of interest.

References

  1. Li, F.; Zhang, J.D.; Liu, C.Y.; Xiao, M.; Wu, Z. Distribution, bioavailability and probabilistic integrated ecological risk assessment of heavy metals in sediments from Honghu Lake, China. Process Saf. Environ. Prot. 2018, 116, 169–179. [Google Scholar] [CrossRef]
  2. Li, F.; Zhang, J.D.; Liu, W.; Liu, J.; Huang, J.; Zeng, G. An exploration of an integrated stochastic-fuzzy pollution assessment for heavy metals in urban topsoil based on metal enrichment and bioaccessibility. Sci. Total Environ. 2018, 644, 649–660. [Google Scholar] [CrossRef] [PubMed]
  3. Guo, J.Y.; Jiang, S.L.; Pang, Y.J. Rice straw biochar modified by aluminum chloride enhances the dewatering of the sludge from municipal sewage treatment plant. Sci. Total Environ. 2019, 654, 338–344. [Google Scholar] [CrossRef] [PubMed]
  4. Guo, J.Y.; Chen, C.; Jiang, S.L.; Zhou, Y.L. Feasibility and mechanism of combined conditioning with coagulant and flocculant to enhance sludge dewatering. ACS Sustain. Chem. Eng. 2018, 6, 10758–10765. [Google Scholar] [CrossRef]
  5. Zeng, J.; Liu, Y.; Feiock, R.; Li, F. The impacts of China’s provincial energy policies on major air pollutants: A spatial econometric analysis. Energy Policy 2019, 132, 392–403. [Google Scholar] [CrossRef]
  6. Solomon, S.; Plattner, G.K.; Knutti, R.; Friedlingstein, P. Irreversible climate change due to carbon dioxide emissions. Proc. Natl. Acad. Sci. USA 2009, 106, 1704–1709. [Google Scholar] [CrossRef] [PubMed] [Green Version]
  7. Roger, P.J.; Wigley, T.; Green, C. Dangerous assumptions. Nature 2008, 452, 531–532. [Google Scholar]
  8. Center for Climate and Energy Solutions. Outcomes of the UN Climate Change Conference in Paris. Available online: http://www.c2es.org/docUploads/cop-21-paris-summary-12-2015-final.pdf (accessed on 10 December 2015).
  9. The Sate Council. The 13th Five-Year Plan of Work on Controlling Greenhouse Gas Emissions. Available online: http://www.gov.cn/zhengce/content/2016-11/04/content_5128619.htm (accessed on 4 November 2016).
  10. Quadrelli, R.; Peterson, S. The energy-climate challenge: Recent trends in CO2 emissions from fuel combustion. Energy Policy 2007, 35, 5938–5952. [Google Scholar] [CrossRef]
  11. Koroneos, C.; Zairis, N.; Charaklias, P.; Moussiopoulos, N. Optimization of energy production system in the Dodecanese Islands. Renew. Energy 2005, 30, 195–210. [Google Scholar] [CrossRef]
  12. Jonathan, R.G.; Koomey, G. Using energy scenarios to explore alternative energy pathways in California. Energy Policy 2005, 33, 1117–1142. [Google Scholar]
  13. Dagoumas, A.S.; Barker, T.S. Pathways to a low-carbon economy for the UK with the macro-econometric E3MG model. Energy Policy 2010, 38, 3067–3077. [Google Scholar] [CrossRef]
  14. Toshihiko, N. Energy-economic models and the environment. Prog. Energy Combust. Sci. 2004, 30, 417–475. [Google Scholar]
  15. Wei, Y.M.; Wu, G.; Liu, L.C.; Fan, Y. Progress in modeling for energy-economy-environment complex system and it’s applications. Chin. J. Manag. 2005, 2, 159–170. [Google Scholar]
  16. Liu, H.W.; Gallagher, K.S. Catalyzing strategic transformation to a low-carbon economy: ACCS road map for China. Energy Policy 2010, 38, 59–74. [Google Scholar] [CrossRef]
  17. Limmeechokchai, B.; Chawana, S. Sustainable energy development strategies in the rural Thailand: The case of the improved cooking stove and the small biogas digester. Renew. Sustain. Energy Rev. 2007, 11, 818–837. [Google Scholar] [CrossRef]
  18. Cai, W.J.; Wang, C.; Chen, J.N.; Wang, K.; Zhang, Y.; Li, X.D. Comparison of CO2 emission scenarios and mitigation opportunities in China’s five sectors in 2020. Energy Policy 2008, 36, 1181–1194. [Google Scholar] [CrossRef]
  19. Wang, Y.J.; Gu, A.; Zhang, A.L. Recent development of energy supply and demand in China, and energy sector prospects through 2030. Energy Policy 2011, 39, 6745–6759. [Google Scholar] [CrossRef]
  20. Zhou, N.; Fridley, D.; Khanna, N.Z.; Ke, J.; McNeil, M.; Levine, M. China’s energy and emissions outlook to 2050: Perspectives from bottom-up energy end-use model. Energy Policy 2014, 53, 51–62. [Google Scholar] [CrossRef]
  21. Kuldna, P.; Peterson, K.; Kuhi-Thalfeldt, R. Knowledge brokering on emissions modelling in Strategic Environmental Assessment of Estonian energy policy with special reference to the LEAP model. Environ. Impact Assess. Rev. 2015, 54, 55–60. [Google Scholar] [CrossRef]
  22. Vincent, E.N.; Comfort, E.C.; Panchakshara, M.G.; Emodi, A.S.A. Energy policy for low carbon development in Nigeria: A LEAP model application. Renew. Sustain. Energy Rev. 2017, 68 Pt 1, 247–261. [Google Scholar]
  23. Saba, E.; Muhammad, A.; Asif, K.M.; Ashfaq, B. Modeling and analysis of CPEC energy power projects using LEAP model. In Proceedings of the 2018 International Conference on Computing, Mathematics and Engineering Technologies (iCoMET), Sukkur, Pakistan, 3–4 March 2018. [Google Scholar]
  24. Lin, J.Y.; Cao, B.; Cui, S.; Wang, W.; Bai, X. Evaluating the effectiveness of urban energy conservation and GHG mitigation measures: The case of Xiamen city, China. Energy Policy 2010, 38, 5123–5132. [Google Scholar] [CrossRef]
  25. Guo, R.; Cao, X.J.; Yang, X.Y.; Li, Y.; Jiang, D.; Li, F. The strategy of energy-related carbon emission reduction in Shanghai. Energy Policy 2010, 38, 633–638. [Google Scholar]
  26. Huang, Y.; Jeffrey, B.Y.; Peng, C.Y. The long-term forecast of Taiwan’s energy supply and demand: LEAP model application. Energy Policy 2011, 39, 6790–6803. [Google Scholar] [CrossRef]
  27. Dhakal, S. Implications of transportation policies on energy and environment in Kathmandu Valley, Nepal. Energy Policy 2003, 31, 1493–1507. [Google Scholar] [CrossRef]
  28. Ahanchain, M.; Biona, J.B. Monitoring transportation, air pollution and energy demand in the Philippines using leap. In Proceedings of the ASME 2011 International Mechanical Engineering Congress and Exposition, Denver, CO, USA, 11–17 November 2011; Volume 4, p. 361. [Google Scholar]
  29. Shabbir, R.; Ahmad, S.S. Monitoring urban transport air pollution and energy demand in Rawalpindi and Islamabad using leap model. Energy 2010, 35, 2323–2332. [Google Scholar] [CrossRef]
  30. Ates, S.A. Energy efficiency and CO2 mitigation potential of the Turkish iron and steel industry using the LEAP (long-range energy alternatives planning) system. Energy 2015, 90, 417–428. [Google Scholar] [CrossRef]
  31. Malla, S. Household energy consumption patterns and its environmental implications: Assessment of energy access and poverty in Nepal. Energy Policy 2013, 61, 990–1002. [Google Scholar] [CrossRef]
  32. Xu, G.Y.; Qin, W.F.; Ti, S.G.; Xu, Y.C. Energy and environmental scenario analysis for residential sector based on LEAP. Appl. Mech. Mater. 2011, 130–134, 3133–3138. [Google Scholar] [CrossRef]
  33. Shin, H.C.; Park, J.W.; Kim, H.S.; Shin, E.S. Environmental and economic assessment of landfill gas electricity generation in Korea using LEAP model. Energy Policy 2005, 33, 1261–1270. [Google Scholar] [CrossRef]
  34. Zhang, Q.Y.; Tian, W.L.; Wei, Y.M.; Chen, Y.X. External costs from electricity generation of China up to 2030 in energy and abatement scenarios. Energy Policy 2007, 35, 4295–4304. [Google Scholar] [CrossRef]
  35. Li, D.; Wang, R.S.; Zhou, C.B. LEAP based comprehensive scenario analysis of emergy evaluation on urban residential area. J. Univ. Chin. Acad. Sci. 2009, 26, 72–82. [Google Scholar]
  36. Bin, C.; Lin, J.L.; Cui, S.H.; Tang, L.N. Scenario analysis of reduction potentials of energy demand and GHG emissions based on LEAP model in Xiamen City. Acta Ecol. 2010, 30, 3358–3367. [Google Scholar]
  37. Yan, D.; Xie, X.N.; Song, F.T.; Jiang, Y. Building environment design simulation software DeST(1): An overview of developments and information of building simulation and DeST. Heat. Vent. Air Cond. 2004, 34, 48–56. [Google Scholar]
  38. Wang, J.C.; Guo, Z.G. Logistic Regression Models: Methods and Application; Higher Education Press: Beijing, China, 2001; pp. 145–177. [Google Scholar]
  39. Tsay, R.S. Analysis of Financial Time Series, 3rd ed.; Wiley: Hoboken, NJ, USA, 2010; pp. 29–107. [Google Scholar]
  40. MacKay, D. Sustainable Energy—Without Hot Air; UIT Cambridge: Cambridge, UK, 2009; pp. 140–154. [Google Scholar]
  41. Feng, G.H.; Tian, C.; Liu, J.Y.; Wang, B.L. Energy system planning of commercial and service core area of Liaobin coastal economic zone. Build. Energy Effic. 2014, 42, 27–30. [Google Scholar]
  42. National Bureau of Statistics. China Energy Statistical Yearbook 2017; China Statistics Press: Beijing, China, 2017; Volume 10, pp. 453–456.
  43. Eggleston, S.; Buendia, L.; Miwa, K.; Ngara, T.; Tanabe, K. 2006 IPCC Guidelines for National Greenhouse Gas Inventories: Volume 2 Energy; IPCC: Yokohama, Japan, 2006; pp. 104–106. [Google Scholar]
Figure 1. Scenario analysis steps.
Sustainability 11 05392 g001
Figure 2. Long-range Energy Alternatives Planning System (LEAP) model [36].
Sustainability 11 05392 g002
Figure 3. (a) The location of Liaobin Coastal Economic Zone. (b) Overall planning of Liaobin Coastal Economic Zone.
Sustainability 11 05392 g003
Figure 4. LEAP-Liaobin tree.
Sustainability 11 05392 g004
Figure 5. (a) The scatter diagram of Panjin’s GDP data from 1990 to 2018. (b) The data graph of the original GDP data after taking logarithm and first-order difference. (c) The ADF unit root test results after the stationary original GDP data. (d) The autocorrelation function graph and partial autocorrelation function graph of the stationary data.
Sustainability 11 05392 g005
Figure 6. Economic development model.
Sustainability 11 05392 g006
Figure 7. Population development model.
Sustainability 11 05392 g007
Figure 8. Architecture development model.
Sustainability 11 05392 g008
Figure 9. Simplified method of a typical building.
Sustainability 11 05392 g009
Figure 10. Typical building models.
Sustainability 11 05392 g010
Figure 11. (a) Dynamic heating load of community buildings. (b) Dynamic cooling load of community buildings.
Sustainability 11 05392 g011
Figure 12. Comparison of energy efficiency between combined heat and power systems and separated heat and power systems.
Sustainability 11 05392 g012
Figure 13. System diagram and energy efficiency in energy center.
Sustainability 11 05392 g013
Figure 14. Heating efficiency of ground water-source heat pumps (GWHP) in traditional power supply mode [41].
Sustainability 11 05392 g014
Figure 15. Energy demand of different buildings in the baseline scenario.
Sustainability 11 05392 g015
Figure 16. Energy demand of different buildings in the community energy planning scenario.
Sustainability 11 05392 g016
Figure 17. Primary energy consumption of the two scenarios.
Sustainability 11 05392 g017
Figure 18. CO2 emissions change.
Sustainability 11 05392 g018
Table 1. Comparison of major energy models [14,15].
MethodologyFunctionThe Advantages and DisadvantagesTypical ModelsResearch and Development Organization
Top-Down ModelEconometrics, General equilibrium theory, Linear programming theoryEnergy macroeconomic analysis and energy policy planningThe adoption of economic methods is convenient to provide economic analysis. The technology cannot be described in detail to reflect the feasible technology accepted by the market. A large number of data are used to predict, the potential of technological progress is underestimated, and the influence of technological progress on the economy cannot be controlled.CGENorway
3Es-Model (Macroeconomic, Energy and Environment Sub-model)NUT (Nagaoka University of Technology)/Japan
MarcoIIASA (International Institute for Applied Systems Analysis)
GEM-E3 (Groundings Enterprises Markets model-Energy Economic Environment)NTUA (National Technical University of Athens)/EU
Bottom-Up ModelLinear programming theory, Nonlinear programming theory, Multi-objective programming theory, System dynamics approach, Input–output methodEnergy technology selection strategy, environmental impact analysis of energy technologies, forecast of energy supply and demand, cost analysis of energy technologies and energy policy analysisUsing the process method, not good at economic analysis, has a detailed description of the technology. Overestimates the potential of technological progress. Using the scattered data to describe the supply technology in detail but emphasizing the change of energy consumption. Directly evaluating the cost of technology selection if the relationship between the energy sector and other sectors is negligible.MARKALETSAP (Energy Technology Systems Analysis Program)/IEA (International Energy Agency)
MESSAGE (Model for Energy Supply Strategy Alternatives and their General Environmental Impact)IIASA
EFOM (Energy Flow Optimization Model)EU
MEDEE (Model Demand Energy Europe)IEPE (the Institute of Energy Policy and Economic)/France
ERIS (Energy Research and Investment Strategy)PSI (the Paul Scherrer Institute) NTUA and IIASA
LEAPSEI (STOCKHOLM Environment Institute)/Sweden
AIMNIES (National Institute for Environment Studies)/Japan
Mixed Energy ModelLinear programming theory, Nonlinear programming theory, Mixed integer programming, EconometricsEnvironmental impact analysis of energy technologies, forecast of energy supply and demand, cost analysis of energy technologies and energy policy analysisThe advantages of the above two models are integrated, and the technology selection is fully considered. The cost, again considering the effect of price elasticity, is of the entire energy system. Simulation and analysis. Facilitates more detailed energy economics analysis. The model is complex, and it is a large system that simulates a real energy system.NEMS (the National Energy Modeling Systems)EIA (Energy Information Administration)/DOE (Department of Energy) of America
IIASA-WECE3 (the IIASA-WECES Energy Economic Environment Model)IIASA and WEC (World Energy Council)
PRIMES (Price Inducing Model of the Energy System)JOULE/EU
POLES (Prospective Outlook on Long-term Energy Systems)JOULE/EU
MIDAS (Multi-national integrated Demand and Supply)JOULE/EU
Table 2. Key assumptions for scenarios.
Policy DriverDemand Side DriverSupply Side Driver
Baseline ScenarioNo further policies or measures of energy conservation and emission, the standard of 50% energy saving in the second stage should be strictly implemented in the design of new buildings.The building load index method (heating index of residential building is 45 W/m2 and heating index of public building is 55 W/m2) is used to calculate heating load, demand-side energy-saving measures are not increased.Traditional energy sources, such as coal, are used in district heating systems and coal-fired boilers with high thermal efficiency are used, whose thermal efficiency is nearly 85%.
Community Energy Planning ScenarioNational and local green building standards and building energy efficiency standards revision, increase the stringency of residential building, commercial building and public institution code, strengthen the heating equipment efficiency standards, encourage heat pump installation.The potential of all local renewable and unused energy is considered. Simplified method of typical building is put forward in building dynamic load forecasting. Energy supply reliability, benefits of energy conservation and emission reduction, and efficiency of energy use are considered.A clean-type co-generation system that combines the gas internal combustion engine, heat pumps, and absorption heat pumps, whose total efficiency is ~200%.
Table 3. Economic and social development data in 2030 for Liaobin coastal economic zone.
IndicatorsUnit2030
The
economic
development
GDPCNY (billion yuan)27
Population (New migrants)People62,116
GDP per unit capitaCNY434,670
Registered urban unemployment rate%0.04
Disposable income of urban residentsCNY80,000
Research and development fundsCNY (billion yuan)8.1
Research and development funds/GDP%3
The
industry
structure
The first industryCNY (billion yuan)5.4
The second industryCNY (billion yuan)129.6
The third industryCNY (billion yuan)135
The first industry/GDP%2
The second industry/GDP%48
The third industry/GDP%50
The added value of the third industry per capitaCNY150,000
Open
Strategy of
leading
industry
chains
Equipment manufacturing industryCNY (billion yuan)39
Chemical industryCNY (billion yuan)45.4
Modern service industryCNY (billion yuan)40.5
New and high technology industryCNY (billion yuan)13
Logistics industryCNY (billion yuan)32.5
Modern fisheryCNY (billion yuan)5
Import and export goods tradeCNY (billion yuan)75.6
Import and export services tradeCNY (billion yuan)32.4
Foreign trade dependency%0.4
Foreign direct investmentUSD (billion dollar)6.6
Domestic investmentCNY (billion yuan)61.4
Table 4. Each typical building’s simulation results.
ItemsUnitsOffice BuildingHotelMallResidential Building
Air conditioning areasm212,699.906995.2913,323.822038.60
Load statisticsAnnual maximum heating loadkW1222.80645.121631.03205.40
Annual maximum cooling loadkW1214.48694.261765.3197.16
Annual cumulative heating loadkW·h938,268.64565,659.801,249,286.99137,360.57
Annual cumulative cooling loadkW·h1,021,743.79671,364.131,081,600.2534,634.00
Annual cumulative humidifying quantitykg388,661.83290,576.56547,832.027936.43
The area of the load indicatorAnnual maximum heating load indicatorW/m296.2892.22122.41100.75
Annual maximum cooling load indicatorW/m295.6399.25132.4947.66
Annual cumulative heating indicatorkW·h/m273.8880.8693.7667.38
Annual cumulative cooling indicatorkW·h/m280.4595.9781.1816.99
Seasonal load indicatorHeating indicator of the heating seasonW/m219.8021.2424.6418.07
Cooling indicator of the air conditioning seasonW/m225.5828.9029.906.82
Table 5. Coefficients of carbon dioxide emission.
EnergyAverage LHV (Lower Heating Value) [42]Carbon Dioxide Emission Coefficient Based on Energy Value (IPCC 2006) [43]Carbon Dioxide Emission Coefficient Based on Unit Mass
Raw coal20,908 KJ/Kg94,600 KgCO2/TJ1.978 KgCO2/Kg
Natural gas38,931 KJ/m364,200 KgCO2/TJ2.499 KgCO2/m3
Table 6. Energy demand in the two scenarios.
YearEnergy Demand in Baseline Scenario (MW·h)Energy Demand in Community Energy Planning Scenario (MW·h)
Office BuildingsHotel BuildingsCommercial BuildingsResidential BuildingsOffice BuildingsHotel BuildingsCommercial BuildingsResidential Buildings
201068,353.2437,435.7771,711.978975.1925,335.8315,186.9233,733.263708.29
201183,096.6545,510.4587,179.8310,911.0930,800.6218,462.6541,009.334508.15
2012139,750.5076,538.67146,617.5018,350.0751,799.9431,050.1568,968.777581.73
2013219,064.30119,977.30229,828.6028,764.4581,198.4248,672.32108,111.2011,884.65
2014382,845.70209,677.30401,657.9050,269.93141,905.7085,061.74188,939.6020,770.10
2015386,276.10211,556.00405,256.8050,720.36143,177.2085,823.91190,632.5020,956.20
2016390,400.10213,814.70409,583.5051,261.87144,705.8086,740.20192,667.8021,179.94
2017392,645.70215,044.60411,939.4051,556.73145,538.2087,239.13193,776.0021,301.77
2018393,391.70215,453.10412,722.1051,654.68145,814.7087,404.88194,144.2021,342.24
2019394,178.50215,884.10413,547.5051,757.99146,106.3087,579.69194,532.5021,384.92
2020394,927.50216,294.20414,333.3051,856.33146,383.9087,746.09194,902.1021,425.56
2021395,835.80216,791.70415,286.3051,975.60146,720.6087,947.91195,350.4021,474.84
2022397,023.30217,442.10416,532.1052,131.53147,160.8088,211.75195,936.4021,539.26
2023397,857.00217,898.70417,406.8052,241.01147,469.8088,397.00196,347.9021,584.49
2024398,811.90218,421.70418,408.6052,366.38147,823.7088,609.15196,819.1021,636.29
2025399,489.90218,793.00419,119.9052,455.41148,075.0088,759.79197,153.7021,673.08
2026400,248.90219,208.70419,916.2052,555.07148,356.4088,928.43197,528.3021,714.26
2027400,969.40219,603.30420,672.1052,649.67148,623.4089,088.50197,883.9021,753.34
2028401,851.50220,086.40421,597.6052,765.50148,950.4089,284.50198,319.2021,801.20
2029402,815.90220,614.60422,609.4052,892.14149,307.9089,498.78198,795.2021,853.52
2030403,661.80221,077.90423,496.9053,003.21149,621.4089,686.73199,212.7021,899.41
Table 7. CO2 emissions.
Year20102011201220132014201520162017201820192020
Carbon emission of baseline scenario
(million kg)
56.5058.7061.1062.1067.9068.4070.7071.8073.2174.3275.92
Carbon emission of community energy planning scenario
(million kg)
27.0629.7531.4533.1735.2037.3439.4040.1740.9641.7642.58
Year2021202220232024202520262027202820292030
Carbon emission
(million kg)
77.6278.9381.2082.5183.9285.5887.3188.9890.5392.52
Carbon emission of community energy planning scenario
(million kg)
43.4244.2745.1446.0246.9247.8448.7849.7450.7151.71

