A Framework for Measuring Urban Sustainability in an Emerging Region: The City of Duhok as a Case Study


1
School of Planning, Design, and Construction, Michigan State University, East Lansing, MI 48824, USA
2
Department of Economics, College of Economics and Administration, Nawroz University, Duhok 42001, Kurdistan Region, Iraq
*
Author to whom correspondence should be addressed.
Sustainability 2019, 11(19), 5402; https://0-doi-org.brum.beds.ac.uk/10.3390/su11195402
Submission received: 26 June 2019
/
Revised: 24 September 2019
/
Accepted: 25 September 2019
/
Published: 29 September 2019
Abstract
:The City of Duhok in Iraq, as one of the Kurdistan Region’s (KR) main cities, is concerned about sustainability but lacks the measures to guide urban policies. This study bridges this gap and offers an example of the use of urban sustainability indicators in an emerging region that experiences rapid urbanization and growth. The substantial objective of this study was to develop a functional framework of indicators to assess and measure urban sustainability for the city after KR’s declaration of autonomy in 1991 until 2010. That is, we limited our investigation to examining previous research, which decisively contains the approach to “measuring urban sustainability”. The study followed a three-step approach to examine urban sustainability as an integration of a few other relevant studies. The study concluded with two facts: First, the lack of progress on urban sustainability in the first decades resulted from the destabilized era that left the city administratively fragmented. Second, the political and economic watershed led to steady progress towards urban sustainability post-2005. The study highlights nine urban sustainability indicators, from a total of 39 indicators, that played an important role in navigating the general trend of urban sustainability in the city and how they can be used to promote future sustainable practices.
1. Introduction
Urbanization and urban growth are the contemporary phenomena in urban settings. Cities and their environment, as Power noted, are constantly changing due to the dramatic increase in urban populations [1]. While 30% of the world’s population was living in urban areas in the 1950s, recently around 54% live in urban areas, and that is projected to increase to 66% in 2050 [2,3]. More specifically, the cities in the developing world are expected to absorb 95% of urban growth by 2030 [4]. Consequently, cities around the world are increasingly recognizing the need to pursue a sustainability agenda to address the effects of urbanization and urban growth [5]. However, sustainability goals cannot be achieved without local communities, governments, and citizens cooperating to meet the major challenges of sustainability [6].
One way to incorporate the concerns of sustainability into local planning programs is to develop and use urban sustainability indicators (USI) [4,7,8]. As noted in the literature, sustainability assessment frameworks such as USI are needed to monitor progress toward achieving sustainability goals and provide a basis for assessing whether policies, plans, and programs have the desired effects [8,9]. Consequently, the performance of urban dynamics in cities could be gauged by using USIs that characterize the environmental, economic, and social performance of cities.
In developing countries that experience rapid growth and change, in particular, there is an increasing need for an investigation that traces the impact of urban change on sustainability through time to provide valuable information needed for sustainable urban progress [10,11]. Many cities, regions, and countries adapt and use USIs to monitor progress toward achieving sustainability goals, but these cases tend to be in the developed world, with few measures explicitly designed for developing countries (see [2,12,13,14,15,16,17,18,19]). The Kurdistan Region (KR) of northern Iraq, for example, is concerned about sustainability but lacks the measures to guide such policies. One of its main cities, Duhok, offers an example of the use of USI in an emerging region that experiences rapid urbanization and growth. Duhok is primarily a Kurdish city of over 400,000 people located in northern Iraq, and in some ways shows its resilience to past challenges, yet it faces political, economic, and environmental threats to its growth and quality of life [20,21,22].
Objectives and Research Questions
The objective of this study was to develop a functional framework of indicators to assess and measure urban sustainability for Duhok City after KR’s declaration of autonomy in 1991. Furthermore, the study addressed several fundamental issues for sustainability measures in the city. As such, this paper addresses the following research questions:
- What kind of urban sustainability progress has the city achieved?
- How is urban growth affecting the sustainability in Duhok City? In other words, what are the key factors that influence the pattern of urban sustainability, and how can they be used to promote future sustainable practices?
The approach adopted was to assess previous urban plans and policies that were drawn by the city’s local government and decision-makers. As such, this paper underlines the appropriate urban policies which the city’s authorities, urban planners, and decision-makers could use to make Duhok City more sustainable. Embracing the proposed policies would conserve and enhance local resources, safeguard human health and the environment, maintain a healthy and diverse economy, and improve the livability and quality of life for all of the city’s residents.
2. Materials and Methods
To develop an urban sustainability indicators framework for Duhok City, existing systems were reviewed, but, as they were created for developed countries, it was necessary to refine the USIs for use in a development context and make an initial distinction between the desired goals for sustainability.
2.1. Review of Literature
The concept of sustainable development grew rapidly after 1987, when the World Commission on Environment and Development (WCED) published “Our Common Future” or the “Brundtland Report”. The report defines sustainable development (SD) as, “development that meets the needs of the present without compromising the ability of future generations to meet their own needs” [23] (p. 43). According to this definition, SD has three essential components (triple bottom line): the environment, including protection of ecosystems and natural resources; the economic, including economic vitality and growth; and equity, including issues of equity and social wellbeing [4,8,24]. In the urban context, however, the definition tends to be more explicit. The United Nations Human Settlements Programme (UN-Habitat) defines urban sustainable development (USD) as:
“Sustainable development of human settlements combines economic development, social development, and environmental protection, with full respect for all human rights and fundamental freedoms, including the right to development, and offers a means of achieving a world of greater stability and peace, built on an ethical and spiritual vision. Democracy, respect for human rights, transparent, representative and accountable government and administration in all sectors of society, as well as effective participation by civil society, are indispensable foundations for the realization of sustainable development.”[2] (p. 1178).
The above definition of urban sustainability emphasizes the indispensable role that cities play in environmental, social, and economic wellbeing. Thus, this paper argues that cities play a crucial role as well in responding to urban sustainability challenges. That is, cities are expected to respond to the urbanization and urban growth phenomena, and climate change thresholds.
2.2. The Objectives of Urban Sustainability
As some researchers point out, after a decade of announcing Brundtland’s definition, over eighty different definitions of sustainability were already in the sustainability literature, reflecting the variation of sustainability objectives in general [25,26]. Four principles of sustainable development were derived from the Brundtland Report, which was the fundamental approach to advance global sustainability [27]. The principles are as follows.
- The elimination of poverty, especially in the Third Word, is necessary not just on humanitarian grounds but as an environmental issue.
- The First World must reduce its consumption of resources and production of wastes.
- Global cooperation on environmental issues is no longer a soft option.
- Change toward sustainability can occur only with community-based approaches that take local cultures seriously.
In 1995, the European Environment Agency adopted five urban sustainability goals to pursue [28]. These goals are:
- Minimize the consumption of space and natural resources;
- Rationalize and efficiently manage urban flows.
- Protect the health of the urban population.
- Ensure equal access to resources and services.
- Maintain cultural and social diversity.
The primary notion of urban sustainability for the 21st century was “think global, act local” [29]. Local community-based efforts tend to put more emphasis on the participation of urban citizens [30]. The recent reports of urban sustainability progress from different scales showed links between local actions and global interest in pursuing more advanced urban sustainability [25]. As such, the recent objectives of urban sustainability at the local-level have shifted to maintaining the mechanism of human well-being and ecosystem services [2,31,32,33,34]. The recent trend of the mainstream of urban sustainability research focuses on the interchangeable relationship between well-being and total capital; sustainability and well-being increase as the total capital of the system increases [35]. Wu argued that the relationship between ecosystem services and society are an essential component of urban sustainability [34]. That is, conceptualization of urban sustainability based on cities culture, values, and unique urban ecosystem services are the recent trend that urban sustainability studies seem to focus on [2,25,31,34].
Overall, the overall objectives focus on the enhancement of deep-rooted human well-being by ensuring the existence of a coherent triple bottom line of sustainability [2,31]. These objectives are:
- Sufficiently reduce the consumption of natural resources and environmental damages.
- Ensure democracy and equity between intra/inter generation.
- Maximize resource use efficiency.
2.3. The Significance of Indicator-Based Sustainability Assessment
Sustainability assessment tools have been mushrooming through the development of research on sustainability. They help to assimilate into the necessary policies that respond to urgent conditions and bridge the past and present plans for future development goals [8,36]. Waas et al. [4] elucidated that a sustainability assessment is any process that aims to:
- (a)
- Contribute to a better understanding of the meaning of sustainability and its contextual interpretation (interpretation challenge).
- (b)
- Integrate sustainability issues into decision-making by identifying and assessing (past and or future) sustainability impacts (information-structuring challenge).
- (c)
- Foster sustainability objectives (influence challenge).
Sustainability indicators are one of the fundamental apparatuses of sustainability assessment that assist in acknowledging the up-to-date development situation and conceding whether sustainability objectives are being met [8,9]. Fiksel et al. defined a sustainability indicator as “a measurable aspect of environmental, economic, or social systems that is useful for monitoring changes in system characteristics relevant to the continuation of human and environmental well-being” [37] (p. 6). As such, measurable sustainability indicators are desired since city planners, managers, and policymakers employ them in the decision-making process to help them gauge the socio-economic and environmental impact of urban development [7,13,19].
Sustainability indicators can measure two dimensions, namely sustainability attributes such as socio-economic (equity, health, education, housing, and population) or environmental attributes (land, biodiversity, atmosphere, and freshwater), and include frameworks such as the Driving force–Pressure–State–Impact–Response (DPSIR) indicators [4,38].
The DPSIR indicator framework, which is expanded by the European Environment Agency based on the OECD’s sustainability indicator framework, is considered the most widely adopted framework to provide a holistic socio-economic and environmental analysis [8] (see [39,40] for more details about DPSIR). Through the use of sustainability frameworks, many researchers have been investigating to what extent cities are approaching sustainability [2,12,13,14,15,16,17,18,19].
In sum, cities are increasingly concerned with developing sustainability assessment tools for gauging performance and progress towards urban sustainability. Sustainability indicators are essential tools to pursue the trend of sustainability in cities. Developing an indicator-based sustainability assessment provides accurate information about the performance towards sustainability in an urban context.
2.4. Weak and Strong Sustainability
The notion of weak and strong sustainability as the two main approaches to sustainable development comes from the Brundtland Report [41]. On the one hand, weak sustainability deals with maintaining a combined substitutable stock of all capitals: natural, human, and social capitals. This means natural capital has the same importance as other capitals [42]. As such, this approach is perfectly substitutable for natural capital and human and social capitals [43].
On the other hand, strong sustainability does not allow substitution among capitals. It gives an essential position to natural capital, which is non-substitutable as any conversion of natural capital to other forms is unacceptable [35,42,44]. That is, if the overall capital does not decline as a result of conserving natural and ecosystem stocks, strong sustainability is achieved [43,45].
In other words, sustainability and well-being increase as the total capital within the system (in this case, a city) increases [45]; however, cities have negative impacts on environmental capital [44]. The bottom line here is that the purpose of weak sustainability is to increase the stock of total capital; however, ecological systems are non-substitutable [35,44]. Therefore, measuring strong sustainability in an urban context can be convoluted because of the actual lack of specific forms of natural capital in the boundaries of urban areas, but it is still crucial to consider natural capital in measuring sustainability [35].
Although tremendous efforts to measure sustainability have been mushrooming, there is a lack of measures in emerging regions. This study bridges the gap in the literature of urban sustainability science and provides an example of a region that experiences new democracy, rapid urbanization, and growth.
2.5. The Case Study Area and Its Sustainability Objectives
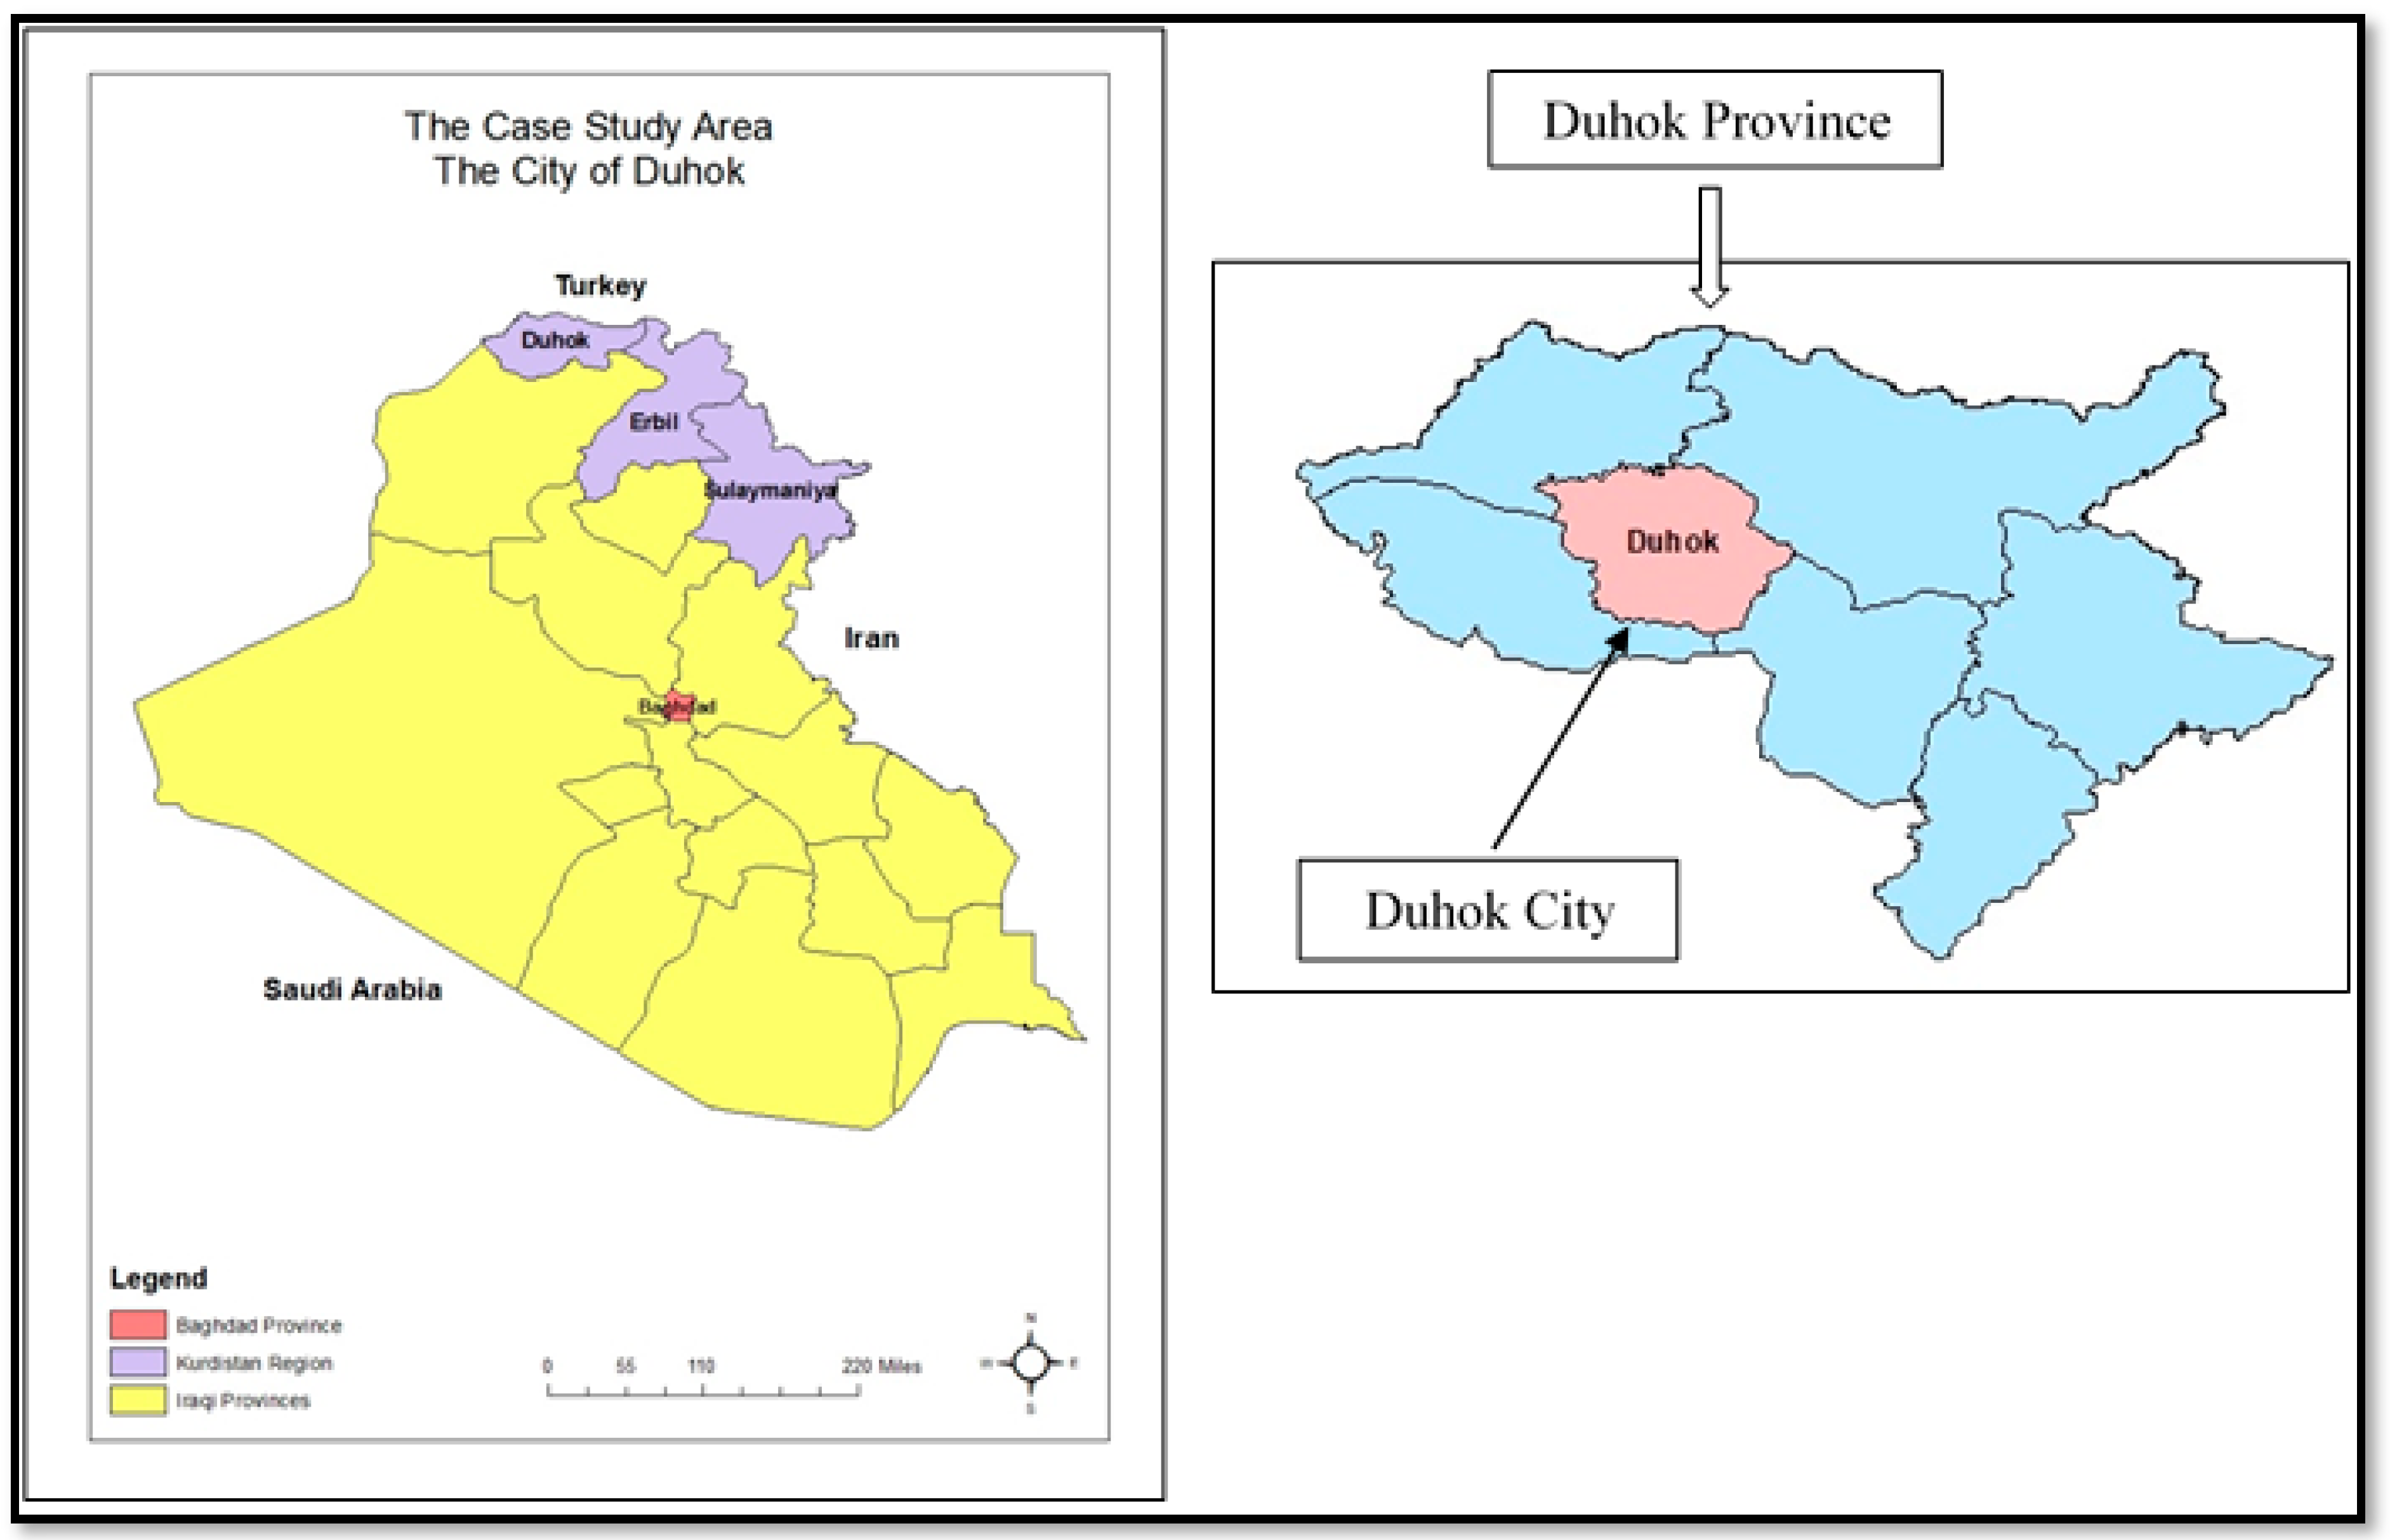
Duhok City (Figure 1) is at the center of Duhok Province in the autonomous Kurdistan Region in Iraq and was built in 1887 during the Ottoman caliphate [21,46]. The city spans over 36 square miles [47] and occupies the valley between the two mountains to the north and south, Bekhair and Zaiwa, respectively [48]. It also is Iraq’s northern gateway to trade with Turkey and Europe in general. As such, the city has a strategic location that gives an important economic role for the Iraqi Kurdistan Region [21,48,49,50,51]. More importantly, it has a diverse cultural fabric, both ethnic and religious, and the majority of the population are Kurds, with minority groups of Assyrians, Chaldeans, Arabs, and Armenians [49,51].
Duhok City is a valuable case because it has been continuously experiencing dramatic urban growth resulting in serious environmental and economic challenges [21,47]. The rapid urban growth is due mainly to migration from other parts of Iraq (conflict refugees) seeking a stable environment [20,52]. The population increased from 5621 inhabitants in 1947 to more than 300,000 inhabitants in 2014 (see Table 1 and Table 2) with subsequent impacts on the environment and social wellbeing [21,22].
The city of Duhok is noted as a mid-sized town, but, due to the pressure of population growth, it should be classified as a highly-urbanized city [21,22,48]. The population growth has been increasing by 6.4–6.8% per year over the past few years [53]. The demographic growth in the metropolitan area of the city has been projected to increase from 325,000 to 605,000 inhabitants between 2007 and 2032 [53].
As denoted by some researchers, the city has witnessed rapid expansion in the urban areas; nevertheless, such rapid expansions have occurred between what the city’s authorities plan for and the status quo. The urban expansion proceeded largely in an east–west direction with most development occurring between 1973 and 1984 as well as between 1986 and 1994 and in particular after 2006 [21,22,47,49]. For example, the urban area of the city was dramatically increased from 10.25 ha in 1923 to 224.58 ha in 1977, and then from 535.83 ha in 1987 to 2794.6 ha in 2007 [53]. According to Raswol [22], the area of urban land increased by 79.8% between 2004 and 2014. Table 1 provides the urban growth changes from 1947 to 2014 periodically [22] (p. 335).
Such phenomena have dire consequences on many sectors in the city. For example, the city government has limited ability to address the economic and social needs of the people. In addition, it faces air and water pollution [3,54]. Worse, as climate change impacts the city, a very harsh drought affected people’s lives in the city and its surrounding area [3,54]. The supply of fundamental social needs such as drinking water, electricity, and affordable housing has been the base of intense social struggle in the city. For instance, Duhok has not had a stable power supply since 1990. It always has outages, and many households have diesel operated generators, which leads to great atmospheric pollution in the city [53]. According to Duhok’s Environment Protection Department, Duhok City has been more toxic than ever due to the 2000 registered power generators [55]. In addition, Eklund and Seaquist showed that there is a significant decline in rainy season in the city due to the changes in climatic conditions [56]. During the hydrological years 2006–2009, the accumulated rainfall dropped to almost 50% below the 2000–2010 total average of 368 mm [57].
Duhok’s 2032 Master Plan has a set of goals, objectives, and strategies that together describe the path towards Duhok 2032 as a result of extensive participation among Duhok’s residents and public official collaboration. Through this Master Plan, the City of Duhok has endorsed these principles of SD [53].
- Urban development in the city intends to take a balanced approach based on economic vitality, social equity, environmental preservation, and respect for the needs of future generations.
- Urban planning and development decisions will be made in a way that encourages citizen involvement and respects the results of public consultations.
- Duhok must provide a pleasant environment and diverse urban experiences to its citizens and visitors.
- Adopt principles of universal accessibility by which all residents have access to all of the City’s public facilities and spaces, as well as buildings both public and private.
- To improve the quality of life of the city’s residents, the master plan supports an ensemble of measures linked to the quality of dwellings, public facilities, nature areas, and the environment.
- Reinforce the linkage between the various areas of urban activity to avoid urban sprawl due to the dramatic projected demographic growth between 2007 and 2032.
- Improve the cost-effectiveness of urban infrastructure and reduce the cost of the city’s related maintenance and rehabilitation costs.
- Improve the quality of architecture and urban landscape to orient the culture of the city toward better urban design.
3. Methodology to Develop the Urban Sustainability Framework for Duhok City
The approach and model to be considered for measuring urban sustainability has long been debated as there is no prominent index by which we may reach a state of consensus on the methodologies which should be adopted in this emerging region. Thus, we limited our investigation to examining previous research which decisively contains the approach to “measuring urban sustainability”, and follow a similar approach [2,8,12,13,14,15,16,17,18,19]. This study consisted of three main steps of analysis by which the urban sustainability framework of the city of Duhok was created.
3.1. Step 1: Adopt DPSIR
Based on the triple bottom line of SD, the proposed framework that measures urban sustainability in Duhok City deals with a variety of aspects of cities such as environment, economic, and social. The present study considered the most common uses of the DPSIR to elevate the usefulness of USIs by comprehensively reviewing several leading international examples (e.g., [2,8,12,13,14,15,16,17,18,19]).
The study assimilated the main urban sustainability themes and indicators adopted by the reviewed studies and employed the DPSIR concept for Duhok City simultaneously. For the study system such as in Duhok City, “Driving force” indicators define the needs of Duhok City people such as creating more jobs and enhancing the city’s infrastructure. The “Pressure” indicators highlight the consequences of meeting such needs. For instance, air pollution is one of the main concerns that Duhok people consider. The “State” indicators reveal a descriptive analysis of the pressure indicators such as the rapid urbanization rate in Duhok City. The “Impacts” indicators explain what would happen if the city’s authorities take no action to overcome the pressure indicators. For example, the city was expected to experience a shortage in housing supply if the city’s decision-makers proposed no further investment initiatives. The “Response” indicators identify the planning implementation, urban policies, and regulations the city’s authorities had taken or could take, such as the planning regulations the city adopted to fight urban sprawl.
As a foundation for an indicator that could be used for Duhok City’s urban sustainability framework, Table 3 presents a categorization of the pool of 140 USIs collected throughout the reviewed studies. The study implemented the DPSIR framework to determine which categories among those that shaped the 140 USIs should be kept, merged, or eliminated. For example, the Environment and Public Health category in Table 4 was derived from merging two categories in Table 3. However, the Natural Resources and Resources Conversation categories listed in Table 3 were dropped as they do not constitute the city’s 2032 vision. In other words, the City’s Master Plan does not mention or endorse principles of SD that have the notion of natural resources preservation.
To determine what indicators could be adopted from the case studies the study reviewed or must be derived (do not exist in the reviewed case studies), the study followed the rigorous criteria shown in Step 2.
3.2. Step 2: Finalize the List of Urban Sustainability Indicators
To finalize the USI framework to be used to measure and assess urban sustainability in the city of Duhok, three fundamental criteria were employed simultaneously:
- City’s vision to pursue sustainable development and community leaders’ perspective;
- SMART characteristics; and,
- Data availability.
The final list consists of nine comprehensive urban sustainability categories that measure 39 indicators. Table 4 illustrates the proposed and implemented framework that measures urban sustainability in Duhok City.
The first criterion to be applied to the proposed framework included the city’s vision to pursue SD and experts’ perspective. The City’s Master Plan 2032 vison to pursue SD was used as a benchmark to apply the DPSIR. It reveals seven fundamental long-term objectives that reflect the aspirations toward SD [21]. These long-term sustainability objectives are mentioned in the case study and its sustainability objectives section. The City’s Master Plan 2032 was done through a collaboration between a foreign consultant company and the Directorate of urban planning in Duhok governorate, Ministry of Municipalities and Tourism, Kurdistan Regional Government, Iraq. Local consultants, specialist, and the city’s residents participated in intensive focus groups, questionnaires, and surveys to represent the perspective of the City’s people and reduce the influence of international perspectives. Four technical reports were presented to the focus groups, respectively, by which SWOT (Strengths, Weaknesses, Opportunities and Threats) and scenarios were provided to show the progress towards the final draft of the master plan.
Simultaneously, various experts, represented by the local authorities and decision-makers, were consulted to address the comprehensive dimensions of the selected indicators from their perspective. Thirty-seven professionals, local authorities, and decision-makers were interviewed by employing a snowball sampling technique. Below are the locations where the 37 participants were selected.
- The Directorate of Electricity in Duhok Governorate;
- The Directorate of Health in Duhok Governorate;
- The Directorate of Education in Duhok Governorate;
- The Directorate of Water and Sewage in Duhok Governorate;
- The Directorate of Environment and Water in Duhok Governorate;
- The Directorate of Municipalities in Duhok Governorate;
- The Directorate of Urban Planning in Duhok Governorate;
- Duhok Governorate Council;
- Spatial planning Department at the University of Duhok;
- The Directorate of NGO’s in Duhok Governorate; and,
- Duhok’s Local Library.
Employing the sustainability objectives and pursuing the experts’ perspective assisted this study to fulfill community-based bottom-up and top-down approaches, which are strongly recommended to develop any potential urban sustainability framework [2,4,13,44].
The second criterion involved considering the comprehensive characteristics of USIs. Each indicator of the final 39 has SMART (Specific, Measurable, Achievable, Relevant, and Time-related) characteristics [19]. The study selected only representative, reliable, feasible, and measurable indicators to reflect the dynamics of urban systems in the city of Duhok. For instance, as shown in Table 3, 10 indicators could be used to measure the capital of Environment. The study used just four indicators, as shown in Table 4. Those four indicators have specific and measurable goals for the city of Duhok. In addition, they are relevant to the city’s 2032 vision according to the local authorities’ perspective.
Finally, data availability, validity, and reliability [24,57] were considered as a criterion for selecting the final pool of 39 indicators. A challenge in the development of the urban sustainability framework for Duhok City was the wide variation in the availability of data on all urban sustainability aspects, but specifically the public health and environment aspects.
3.3. Step 2: Data Collection, Measuring, and Statistical Analyses
This study used available data for the period 1990–2010. The proposed urban sustainability framework was operationalized using data from various local and national censuses of the Republic of Iraq as well as international censuses (see Appendix A).
The selected indicators were measured in different units such as hectare, persons, percentage, g/m2/month, etc. that required normalization. The approach adopted was to construct a z-score for each indicator using the following formula [57]:
where Zx is the z-score for Xi value of the observation, µx is the mean value of each indicator, and σx is the standard deviation of the indicators. The z-score was calculated for the 39 indicators by using the IBM SPSS Statistics 24. Principle Component Analysis (PCA) was then used to do the following:
- Test the significance of the USIs framework of the study area.
- Explore the factors that influence the pattern of urban sustainability in Duhok City, and how they can be used to promote future sustainable practices.
As shown in Table 4, the final urban sustainability framework to measure and assess urban sustainability in Duhok City was determined by finding the average of the urban sustainability categories (see Equation (2)): Environmental and Public Health (EPH); Transportation (T); Economic and Urban Development (EUD); Land Use and Open Space (LUOS); Population Demography and Household (PDH); Housing (H); Education and Community (EC); Health and Community (HC); and Community and Civic Engagement (CCE).
Urban sustainability in the City of Duhok was measured as follows:
where (i) is the year when the data were collected for each category. Each category was measured by using a certain set of indicators. For example, as stated in Equation (3), the EPH was measured by four indicators: air quality, volume of air pollution per 10,000 inhabitants, waste generation per 10,000 inhabitants, and energy consumption per household.
USi = 1/9 (EPHi + Ti + EUDi + LUOSi + PDHi + Hi + ECi + HCi + CCEi)
Hence, the association among the indicators were determined by DPSIR, as mentioned above, thus Equation (3) shows that specific indicators are supposed to decline to achieve positive progress toward urban sustainability. For example, to achieve progress toward sustainability, the level of air pollution in the city must decrease. See Table 4 for more details about the remaining categories.
EPH = Air quality − volume of air pollution per 10,000 inhabitants − waste
generation per 10,000 inhabitants − energy consumption per household
generation per 10,000 inhabitants − energy consumption per household
4. Results
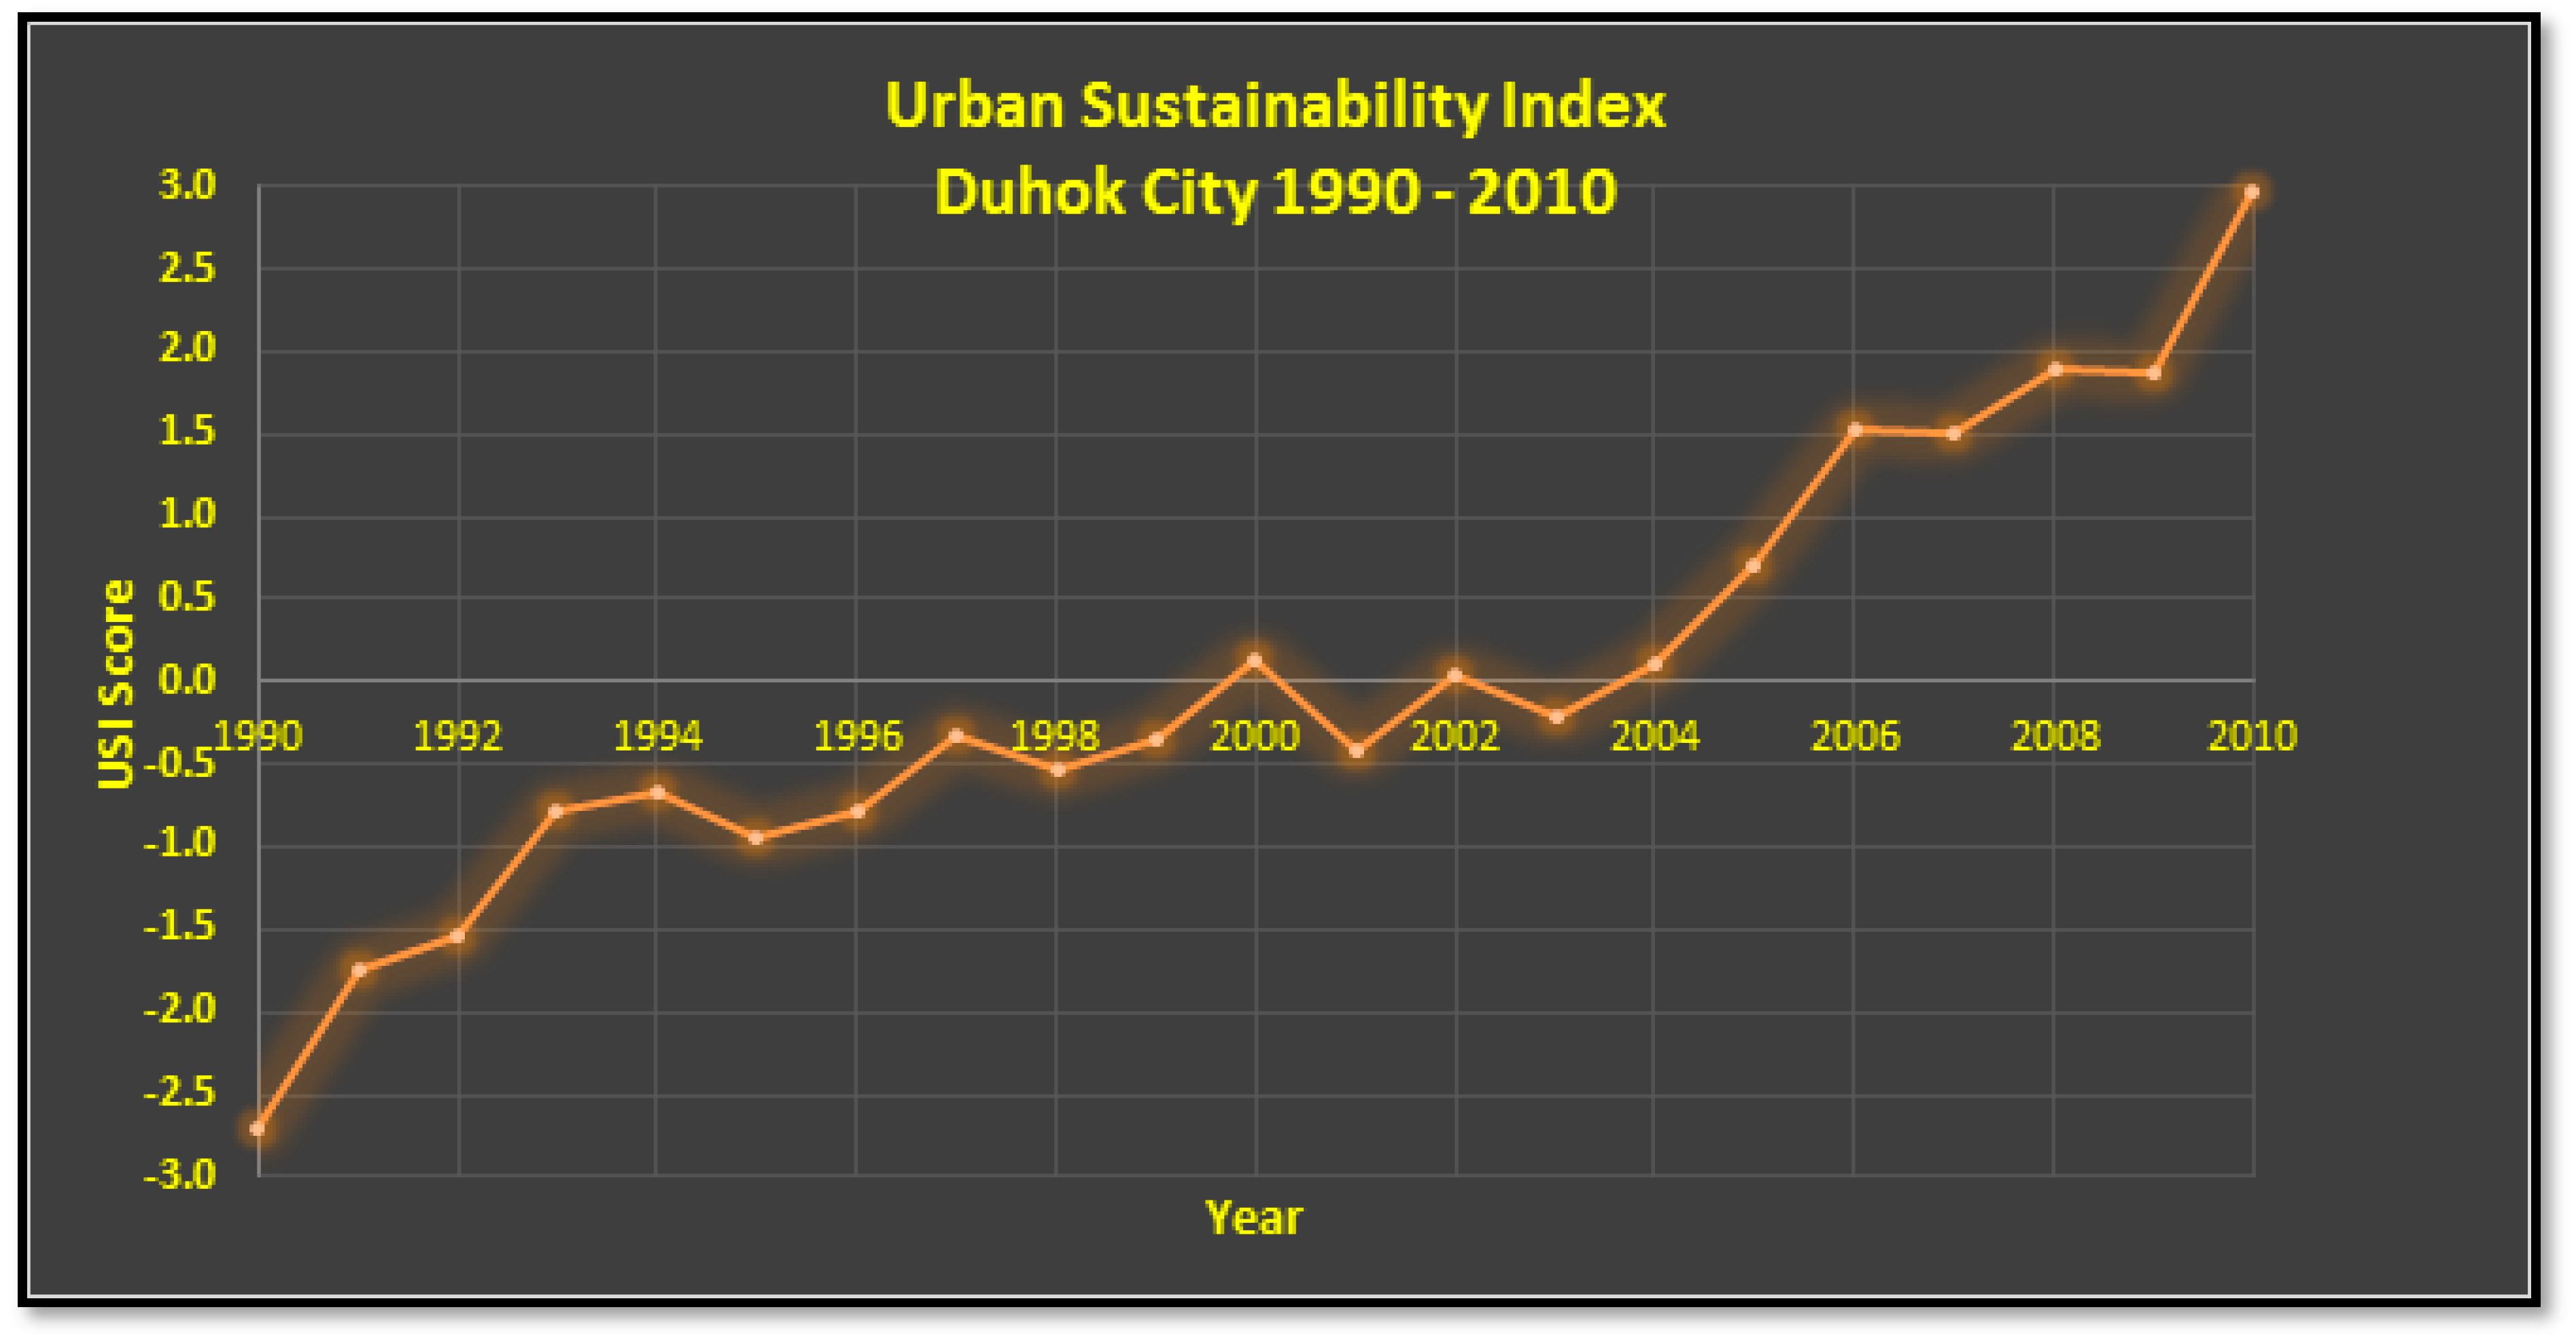
The present study adopted an urban sustainability framework to assess and measure sustainability in Duhok City after the declaration of autonomy in 1991. As such, an equal weighting of 39 USIs was used to measure and assess the progress on urban sustainability in the city from post-declaration of autonomy until 2010. After applying the 39 indicators to the city, an overall urban sustainability composite index (Figure 2) showed the trend of urban sustainability progress with two distinct outcomes.
No urban sustainability progress was demonstrated during the first decade of the autonomous declaration, yet, in the second decade, there was steady progress toward urban sustainability. On the one hand, the urban sustainability index score showed there was no urban sustainability progress (negative score) during the time between 1991 and 1999. Nevertheless, it was improving over those ten years to record the first positive score in 2000. However, the index then dropped to the negative path (non-sustainability) between 2001 and 2004. On the other hand, the progressive activities toward urban sustainability launched post-2005 demonstrate that people in the city of Duhok started to meet their fundamental needs, as measured by the indicators. Since then, the urban sustainability index of Duhok reached the positive benchmark stating that the city has begun a new trend towards sustainability.
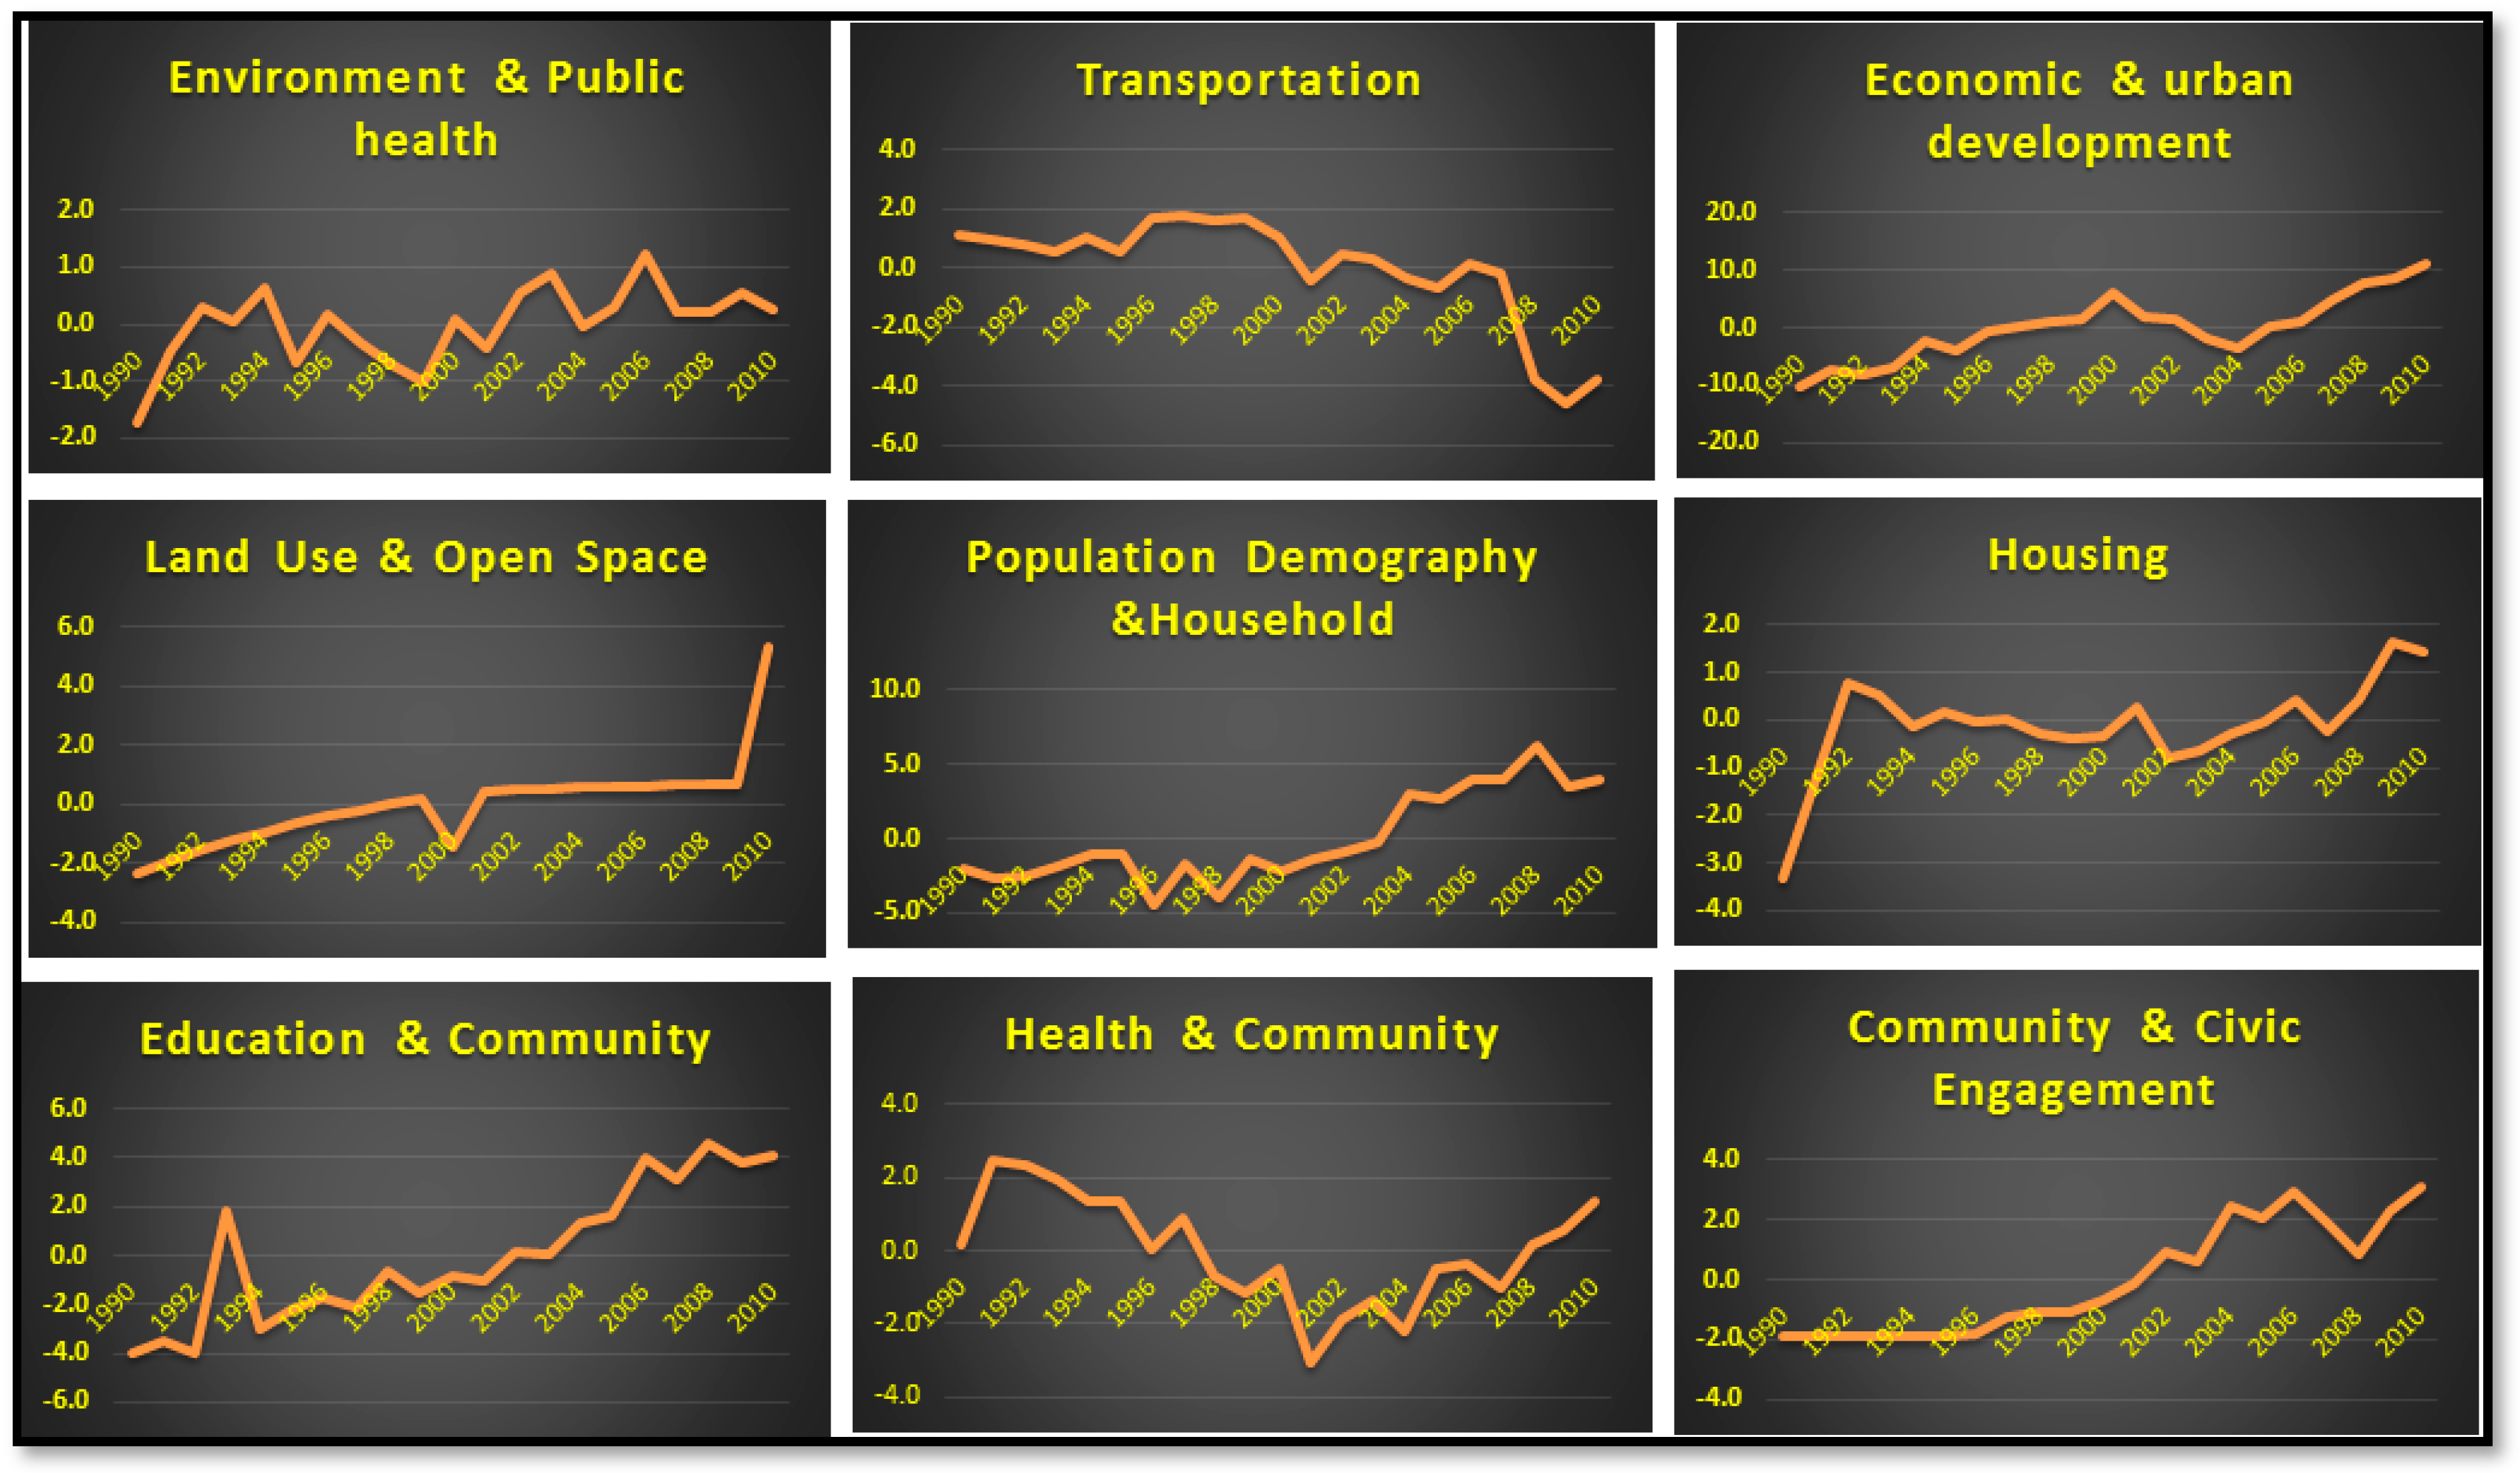
As mentioned above, sustainability and well-being are significantly related [35]. Consequently, a satisfaction of human needs and improving quality of life were achieved under the condition of ecosystem [43], with the capital growth indicating the system is achieving progress toward sustainability [43,45]. These sustainability measures have shown progress toward improved urban conditions: transportation; economic development; land use and open space; housing; education and community; and community and civic engagement (see Figure 3). In contrast, three sustainability dimensions—environment and public health, population demography and household, health, and community—have shown negative progress towards urban sustainability over the two decades. Table 5 offers a simplified understanding of Figure 3. For instance, when the stock of environment and public health increases over the two decades, this indicates negative progress towards sustainability due to the fact that the averages of waste generation and energy consumption in the city were increased. In addition, air quality and pollution were getting worse.
PCA was used to identify the factors that influence the pattern of urban sustainability trend with the two distinct outcomes. The factor analysis of 39 USI extracted seven factors that account for about 90% of the total variance of the dataset. Table 5 summarizes the influence, positive and negative, of each of the 39 indicators on the urban sustainability trend in the City of Duhok during the two decades of the study period. The first factor accounts for 48.1% of total variance (see Table 5). The loadings are positively strong (above 0.5) for thirteen indicators, while two indicators reflect a negatively strong influence on urban sustainability (below −0.5). The second factor accounts for 14.5% of total variance, and the loadings are positively strong for ten indicators, while five negatively strong indicators are shown for this factor. The third factor accounts for 8.8% of total variance, and the loadings are positively strong for six indicators, while one indicator indicates a negative influence on urban sustainability. Finally, while there is no strong negative influence for the fourth, fifth, sixth, and seventh factors that, respectively, account for 5.882%, 4.525%, 4.136%, and 2.748% of total variance, nine indicators show strong positive influence.
5. Discussion
The lack of progress on urban sustainability in the first decade resulted from the destabilized era that left Duhok City administratively fragmented, and the political trajectory defective [20,58]. In 1991, under United Nations Security Council Resolution 688, the Iraqi army forcefully evacuated the three primarily Kurdish governorates: Erbil, the current capital of Iraqi KR, Sulaymaniya, and Duhok [20,59]. After 1991, for the first time, the Kurds of Iraq have had full control over the three provinces. The coalition government (KRG) is the first democratic structure in the region, activated when the Kurdistan Democratic Party (KDP) and the Patriotic Union of Kurdistan (PUK) conducted elections, recognized by international monitors as relatively free and fair [60], for a regional parliament and presidency [59]. However, similar to the rest of Iraq, KR suffered hardship under UN sanctions imposed on Iraq after it invaded Kuwait in August 1990 [61]. Hardship continued during the mid-1990s, when KR was torn by a civil war between the dominant political parties, KDP and PUK [59]. Consequently, political turmoil generated severe economic hardship in the city and KR in general. Duhok’s economy was fully destroyed and it lost its role as a catalyst for development [54,58]. Thus, the city was a victim of decades of internal and external conflicts that constrained its growth.
The years of 1998 and 2003, respectively, represent political and economic development watersheds in KR [58] that led to the steady progress towards urban sustainability in Duhok City post-2005. First, in 1998, both KDP and PUK made a peaceful agreement to end the conflict [20]. Simultaneously, the UN and Iraqi government signed the Oil for Food (OFF) agreement, which KRG earmarked for 13% of the OFF budget [30,58]. Second, post-2003, KR has been increasing its fiscal income from the federal government, which increased during 2005–2013 from about $2.5 billion to $13 billion [20,58]. Thus, KRG had the resources for regional plans promoting multidimensional development [20,61]. During this period, the region became “the new democratic experiment” after successfully conducting two regional campaigns in 2005 and 2009, respectively [59]. Duhok, as one of KR’s main cities, was promoting its ambitious agenda for economic and community development.
As mentioned above, this study addressed two research questions. These questions were quite relevant in terms of what kind of urban sustainability progress the city has achieved and how its urban growth affects the sustainability in the city. In other words: What are the key factors that influence the pattern of urban sustainability, and how can they be used to promote future sustainable practices? Overall, the implemented urban sustainability framework in Duhok City focuses on measuring weak sustainability. This notion has been supported by this study since the employed framework assesses the environmental, economic, and social dimensions of sustainability without intentionally leaning on natural and ecological capital [35,44]. Apparently, Duhok City dynamics were not successfully able to maintain and enhance its ecological and environmental capital during the period of rapid urban growth in the past two decades. Figure 3 shows that the environmental capital dramatically increased in its consumption of relevant indicators, which in turn indicates negative progress on urban sustainability, from 1990 to 2010. The study realized that, while rapid growth enhanced socio-economic capitals, the city’s authorities failed to maintain the quality of air, the amount of waste generation, and energy consumption. In the sense of capital stock, while many sustainability dimensions were simultaneously recovering from the consequences of internal and external conflicts, the steady growth on the city’s stock of transportation, economic, land use, housing, education, and community engagement could not conserve the city’s environmental conditions.
As such, the city’s rapid growth has led to strong sustainability issues (ecological and environment capital issues) which give rise to a deep concern regardless of the potential consequences and impacts of the steady urban growth on the environment and ecosystem of the city. Correspondingly, two decades of urban growth in Duhok City had come out very strongly in favor of weak sustainability.
In addition, the study investigated the main reasons that promote positive progress towards sustainability. In other words: Does the local government’s planning and policy achieve such progress, or it had occurred since post-2005 as a reaction to the organic growth of the city? After 2003, political and economic stability has enriched the city of Duhok by allowing it to pursue significant steps toward enhancing the process of economic development and growth. As such, the city has witnessed rapid urban and population growth, improving infrastructure, providing secured business and investment opportunities, and improving living conditions [20,21,22,47]. Economic and political conditions attracted migrants from all over Iraq to KR, in general, and Duhok, in particular, to pursue business opportunities and investment in a region more secure than Iraq [20,48,61]. The consequences of this multi-dimensional growth in the absence of urban planning and policies led to many problems. Before 2003, the city grew organically due to the absence of land use management and policy [49]. In 2009, however, the city finished the first comprehensive master plan that formulates a general outline of the city’s vision and mission toward a more sustainable city by 2032 [1,21]. Neither this master plan nor the city authorities, however, explored the needed urban policies and planning to achieve sustainability goals [21]. Therefore, this study highlights the factors that influence the pattern of urban sustainability and how they can be used to promote future sustainable practices in the next section.
6. Conclusions and Policy Implementations
The study highlights the key factors that influence the pattern of urban sustainability and how they can be used to promote future sustainable practices. Overall, of 39 USIs, nine played an important role in navigating the general trend of urban sustainability in the city of Duhok. Four of the nine indicators had relatively stable influences on urban sustainability trend:
- No of NGOs per 10,000 inhabitants;
- Percentage of urban population;
- Percentage of green open space; and
- General air quality.
Duhok City authorities, urban planners, and urban policymakers are advised to pay full attention to these indicators to promote a sustainable Duhok City.
Conversely, the population density indicator had a negative influence on urban sustainability. Surprisingly, two of the nine indicators played interchangeably different roles to shape the general trend of sustainability in Duhok City. The indicator of the number of hospitals per 100,000 inhabitants had a positive influence, but the shortage of hospital numbers had a negative influence. Such a shift generally had a negative impact on urban sustainability. However, the rezoning permits issued indicator played the inverse role shifting from a negative to positive influence on urban sustainability (see Table 5).
In terms of urban policy recommendations for Duhok City, this study recommends five urban policies to be considered for promoting future sustainable practices. First, increased levels of community civic engagement, measured by the number of NGOs per 10,000 inhabitants, is necessary to improve urban sustainability. As democracy is one of the indispensable foundations for the realization of sustainable development [2], Duhok City has, since 1991, produced many NGOs that work the local government to address people’s needs and issues. Indeed, the city’s local government is advised to support more NGOs in partnership with the local government bodies to address community issues and enhance governance.
Second, with the city’s policy of welcoming migrants from different parts of Iraq, there is a significant benefit for socio-economic urban sustainability. The percentage of urban population plays a pivotal role in shaping progress toward significant urban sustainability although its increase leads to ecological and environmental issues. Post-2003, the Kurdistan Region of Iraq has witnessed voluntary internal movements, such as economic migration due to several reasons such as job opportunities and cheaper housing [52]. In this respect, the local government in Duhok is encouraged to balance its migration policy and preserve its ecological system.
Third, since environmental protection is one essential premise of SD, the city should implement strategies to protect the city’s environment and ecosystem. Two indicators, air quality and percentage of green open space, played a significant role in shaping urban sustainability. Although there were negative impacts on the environment and ecosystem, enhancing air quality and increasing green open space supported the vision of sustainable Duhok by 2032. Thus, the city needs to recognize the benefits of green design and increase the area of green space to reduce the pollution that, in turn, improves air quality.
Fourth, population density plays a negative influence on the urban sustainability trend of the city. Having said that, and during the two decades of the study, the variations and unbalanced distribution in population density promoted an unsustainable city. As mentioned above, Duhok is a compact city, but such a model may have a negative impact on environmental and social urban sustainability. As such, a compact development strategy may not be promoting sustainability for Duhok City. These findings support existing theory and research about compact city development strategies outside Europe and United States [62].
Ultimately, the trend of urban sustainability can be improved by pursuing rezoning processes in the city. The findings show that increasing the rate of rezoning promotes better land use either for mixed-use or commercial uses. One challenge for the government is to increase hospital space. The number of hospitals per 100,000 inhabitants, unfortunately, leads the city toward unsustainable path. As such, an urgent policy by the stakeholders is needed to address the adverse effects of urban growth on the health sector.
The developed USI framework is not only applicable to Duhok City, but any city in KR or Iraq can successfully adopt it. This framework provides profound insights into the simultaneous cause of negative and positive progress towards urban sustainability. Moreover, it highlights what urban policy and planning implementations the stakeholders may need to consider to enhance urban sustainability in the city. Practically, the city development goals can be achieved by adopting bottom-up planning, decentralization, and public participation [63,64]. These urban planning strategies can be covered by further investigating in numerous comparative case studies. In other words, the role of political stability, government effectiveness, and planning regulations quality in achieving significant progress towards urban sustainability is the basis of further research.
Although the study has reached its goals, we are still aware of two inevitable limitations. First, this paper measures one city’s sustainability in an emerging region due to the lack of data availability and accountability. Thus, future research could undertake a comparison among various emerging cities. Second, the 39 indicators used in the framework may not cover all of the city’s triple bottom line aspects. That is, more indicators are needed for further studies.
Author Contributions
A.H. was responsible for the data collection and analysis, and writing-original draft, while Z.K.-K. was responsible for the methodology and Case Study Administration
Funding
This research received no external funding
Acknowledgments
The authors would like to thank the anonymous reviewers for their helpful feedback to elevate the quality of this paper. We are grateful to the local government of Duhok City for providing intensive data to complete this work. We also extend our gratitude to Mark Wilson at Michigan State University for his valuable inputs and feedback. Lastly, we are thankful to Abdelwehab A. Alwehab from Urban and Regional Planning Center for Post Graduate Studies at University of Baghdad for his consultation on the layout of the framework of the indicators to measure Duhok’s urban sustainability.
Conflicts of Interest
The authors declare no conflict of interest.
Appendix A

Table A1.
List of dataset resources.
| Official Statistics (Published Dataset) |
|
|
|
|
|
|
| Local Statistics Report (Unpublished Dataset) |
|
|
|
|
|
|
|
|
|
|
References
- Power, A. The Changing Face of Cities. Presented as Part of the UNEP-WCMC Environment on the Edge 2006–2007 Series Lecturers. Available online: http://sea.unep-wcmc.org/resources/PDFs/EOTEII/SECTIONS/4_Power.pdf (accessed on 26 June 2019).
- Huang, L.; Wu, J.; Yan, L. Defining and Measuring Urban Sustainability: A Review of Indicators. Landsc. Ecol. 2015, 30, 1175–1193. [Google Scholar] [CrossRef]
- Nations, U. World Urbanization Prospects: The 2014 Revision, Highlights. Department of Economic and Social Affairs; Population Division, United Nations: New York, NY, USA, 2014. [Google Scholar]
- Waas, T.; Hugé, J.; Block, T.; Wright, T.; Benitez-Capistros, F.; Verbruggen, A. Sustainability Assessment and Indicators: Tools in a Decision-Making Strategy for Sustainable Development. Sustainability 2014, 6, 5512–5534. [Google Scholar] [CrossRef] [Green Version]
- Hodson, M.; Marvin, S. Can Cities Shape Socio-Technical Transitions and How Would We Know If They Were? Res. Policy 2010, 39, 477–485. [Google Scholar] [CrossRef]
- Basiago, A.D. Economic, Social, and Environmental Sustainability in Development Theory and Urban Planning Practice. Environmentalist 1998, 19, 145–161. [Google Scholar] [CrossRef]
- Science for Environment Policy (2018) Indicators for Sustainable Cities. In-depth Report 12. Produced for the European Commission DG Environment by the Science Communication Unit, UWE, Bristol. Available online: http://ec.europa.eu/science-environment-policy (accessed on 26 June 2019). [CrossRef]
- Yigitcanlar, T.; Dur, F.; Dizdaroglu, D. Towards Prosperous Sustainable Cities: A Multiscalar Urban Sustainability Assessment Approach. Habitat Int. 2015, 45, 36–46. [Google Scholar] [CrossRef]
- Yigitcanlar, T.; Teriman, S. Rethinking Sustainable Urban Development: Towards an Integrated Planning and Development Process. Int. J. Environ. Sci. Technol. 2015, 12, 341–352. [Google Scholar] [CrossRef]
- Barredo, J.I.; Demicheli, L. Urban Sustainability in Developing Countries’ Megacities: Modelling and Predicting Future Urban Growth in Lagos. Cities 2003, 20, 297–310. [Google Scholar] [CrossRef]
- Drakakis-Smith, D. Third World Cities: Sustainable Urban Development II—Population, Labour and Poverty. Urban Stud. 1996, 33, 673–701. [Google Scholar] [CrossRef]
- Hasan, M.N.; Adnan, A.H. Sustainable Development Indicator Initiatives in Malaysia: Novel Approaches and Viable Frameworks (Unpublished); Institue for Environment and Development, Universiti Kebangsaan Malaysia: Kuala Lumpur, Malaysia, 2001. [Google Scholar]
- Hernández-Moreno, S.; De Hoyos-Martínez, J. Indicators of Urban Sustainability in Mexico. Theor. Empir. Res. Urban Manag. 2010, 7, 46–60. [Google Scholar]
- Karlenzig, W.; Marquardt, F.; White, P.; Yaseen, R.; Young, R. How Green Is Your City? The SustainLane US City Rankings; New Society Publishers: New York, NY, USA, 2007. [Google Scholar]
- Lombardi, P.; Brandon, P. The Multimodal System Approach to Sustainability Planning Evaluation. Sustain. Urban Dev. Environ. Assess. Methods 2007, 2, 47. [Google Scholar]
- Parris, T.M.; Kates, R.W. Characterizing and Measuring Sustainable Development. Annu. Rev. Environ. Res. 2003, 28, 559–586. [Google Scholar] [CrossRef]
- Riposa, G. Reinventing Paradise: Santa Monica’s Sustainable City Program. Public Adm. Q. 2004, 28, 222–251. [Google Scholar]
- Sustainable Seattle. The Sustainable Seattle 1993: Indicators of Sustainable Community: A Report of Citizens on Long-Term Trends in Our Community; Sustainable Seattle, c/o Metrocenter YMCA: Seattle, WA, USA, 1993. [Google Scholar]
- Shen, L.-Y.; Ochoa, J.J.; Shah, M.N.; Zhang, X. The Application of Urban Sustainability Indicators–A Comparison between Various Practices. Habitat Int. 2011, 35, 17–29. [Google Scholar] [CrossRef]
- Natali, D. The Kurdistan Region of Iraq: Stabilizer or Spoiler? Georget. J. Int. Aff. 2013, 14, 71–79. [Google Scholar]
- Omer, W.M. The Effect of UGM on the Implementation of City Master Plan Duhok City as Case Study. ZANCO J. Pure Appl. Sci. 2016, 28, s332–s341. [Google Scholar]
- Raswol, L.M. Form & Structure of Urban Housing in Duhok City. Acad. J. Nawroz Univ. 2017, 6, 95–100. [Google Scholar]
- Brundtland, G.H. Our Common Future: Report of the World Commission on Environment and Development; United Nations Commission 4300; United Nations Commission: New York, NY, USA, 1987. [Google Scholar] [CrossRef]
- Organisation for Economic Co-operation and Development. Towards Sustainable Development: Indicators to Measure Progress: Proceedings of the OECD Rome Conference (Oecd Proceedings); Organization for Economic: Paris, France, 2002. [Google Scholar]
- Vojnovic, I. Urban Sustainability: Research, Politics, Policy and Practice. Cities 2014, 41, S30–S44. [Google Scholar] [CrossRef]
- Hardoy, J.E.; Satterthwaite, D. Environmental Problems of Third World Cities: A Global Issue Ignored? Public Adm. Dev. 1991, 11, 341–361. [Google Scholar] [CrossRef]
- Newman, P.W.G. Sustainability and Cities: Extending the Metabolism Model. Landsc. Urban Plan. 1999, 44, 219–226. [Google Scholar] [CrossRef]
- Stanners, D.; Bourdeau, P. Europe’s Environment: The Dobris Assessment. In Europe’s Environment: The Dobrís Assessment; Office for Official Publication of the European Communities: Luxembourg, 1995. [Google Scholar]
- Vojnovic, I. Urban Sustainability: A Global Perspective; Michigan State University Press: East Lansing, MI, USA, 2012. [Google Scholar]
- Munier, N. Handbook on Urban Sustainability; Springer: Berlin, Germany, 2006. [Google Scholar]
- Wu, J. Urban Sustainability: An Inevitable Goal of Landscape Research. Landsc. Ecol. 2010, 25, 1–4. [Google Scholar] [CrossRef]
- Elmqvist, T.; Fragkias, M.; Goodness, J.; Güneralp, B.; Marcotullio, P.J.; McDonald, R.I.; Parnell, S.; Schewenius, M.; Sendstad, M.; Seto, K.C.; et al. Urbanization, Biodiversity and Ecosystem Services: Challenges and Opportunities: A Global Assessment; Springer: New York, NY, USA, 2013. [Google Scholar]
- Nassauer, J.I.; Wu, J.G.; Xiang, W.-N. Actionable Urban Ecology in China and the World: Integrating Ecology and Planning for Sustainable Cities. Landsc. Urban Plan. 2014, 125, 207–208. [Google Scholar] [CrossRef]
- Wu, J. Urban Ecology and Sustainability: The State-of-the-Science and Future Directions. Landsc. Urban Plan. 2014, 125, 209–221. [Google Scholar] [CrossRef]
- Wilson, M.C.; Wu, J. The Problems of Weak Sustainability and Associated Indicators. Int. J Sustain. Dev. World Ecol. 2017, 24, 44–51. [Google Scholar] [CrossRef]
- Hardi, P.; Hardi, P.; Barg, S.; Hodge, T.; Pinter, L. Measuring Sustainable Development: Review of Current Practice; Industry Canada: Ottawa, QC, Canada, 1997. [Google Scholar]
- Fiksel, J.R.; Eason, T.; Frederickson, H. A Framework for Sustainability Indicators at EPA; Citeseer: Forest Grove, OR, USA, 2013. [Google Scholar]
- Singh, R.K.; Murty, H.R.; Gupta, S.K.; Dikshit, A.K. An Overview of Sustainability Assessment Methodologies. Ecol. Indic. 2012, 15, 281–299. [Google Scholar] [CrossRef]
- Niemeijer, D.; de Groot, R.S. Framing Environmental Indicators: Moving from Causal Chains to Causal Networks. Environ. Dev. Sustain. 2008, 10, 89–106. [Google Scholar] [CrossRef]
- Segnestam, L.; Aguilera Klink, F.; Winograd, M.; Farrow, A.; Eade, J.; Canter, L.W.; Reid, W.V.; McNeely, J.A.; Tunstall, D.B.; Bryant, D.A.; et al. Indicators of Environment and Sustainable Development: Theories and Practical Experience; World Bank: Washington, DC, USA, 2003. [Google Scholar]
- Heal, G. Reflections—Defining and Measuring Sustainability. Rev. Environ. Econ. Policy 2012, 6, 147–163. [Google Scholar] [CrossRef]
- Nourry, M. Measuring Sustainable Development: Some Empirical Evidence for France from Eight Alternative Indicators. Ecol. Econ. 2008, 67, 441–456. [Google Scholar] [CrossRef]
- Ayres, R.; Van den Berrgh, J.; Gowdy, J. Strong versus Weak Sustainability. Environ. Ethics 2001, 23, 155–168. [Google Scholar] [CrossRef]
- Mori, K.; Christodoulou, A. Review of Sustainability Indices and Indicators: Towards a New City Sustainability Index (CSI). Environ. Impact Assess. Rev. 2012, 32, 94–106. [Google Scholar] [CrossRef]
- Pearce, D.W.; Atkinson, G.D.; Dubourg, W.R. The Economics of Sustainable Development. Annu. Rev. Energy Environ. 1994, 19, 457–474. [Google Scholar] [CrossRef]
- Kurdistan Board of Investment. Investment Guide Kurdistan Region-Iraq. Available online: http://www.kurdistaninvestment.org/docs/InvestmentGuideEnglish.pdf (accessed on 11 February 2017).
- Mohammed, A.O. Evaluation of Multi-Storey Housing Projects in the Context of Sustainability/The City of Duhok. Ph.D. Thesis, University of Duhok, Duhok, Iraq, 2013. [Google Scholar]
- Mustafa, Y.; Ali, R.; Saleh, R. Monitoring and Evaluating Land Cover Change in the Duhok City, Kurdistan Region-Iraq, by Using Remote Sensing and GIS. Int. J. Eng. Invent. 2012, 1, 28–33. [Google Scholar]
- Mohammed, H.; Ali, M. Monitoring and Prediction of Urban Growth Using GIS Techniques: A Case Study of Dohuk City Kurdistan Region of Iraq. Int. J. Sci. Eng. Res. 2014, 5, 1480–1488. [Google Scholar]
- Othman, H.A. The Role of Investment Law in Housing Construction in Duhok City, Kurdistan Region. IISTE 2014, 4, 95–105. [Google Scholar]
- Taha, D.A. Analysis and Evaluation for The Reality of Secondary Schools in Duhok City Using Planning Criteria. Ph.D. Thesis, University of Duhok, Duhok, Iraq, 2012. [Google Scholar]
- Eklund, L. Migration Patterns in Duhok Governorate, Iraq, 2000–2010. Open Geogr. J. 2012, 5, 48–58. [Google Scholar] [CrossRef]
- Kurdistan Regional Government Ministry of Municipalities, Municipality of Duhok. Master Plan of Duhok and Urban Development. Directorate of Dohuk Urban Planning; KRG: Duhok, Iraq, 2009. [Google Scholar]
- UNHCR. Governorate Assessment Report—Dahuk. 2007. Available online: http://www.refworld.org/pdfid/471f4c9ba.pdf (accessed on 7 July 2017).
- Kurdistan Officials Warn of Alarming Levels of Air Pollution in Duhok. Available online: https://www.kurdistan24.net/en/news/34c679d8-bf5e-4dd9-adaf-06bd755b6094 (accessed on 29 August 2019).
- Ibrahim, G.R.F.; Rasul, A.; Ali Hamid, A.; Ali, Z.F.; Dewana, A.A. Suitable site selection for rainwater harvesting and storage case study using Dohuk Governorate. Water 2019, 11, 864. [Google Scholar] [CrossRef]
- Joint Research Centre-European Commission. Handbook on Constructing Composite Indicators: Methodology and User Guide; OECD Publishing: Paris, France, 2008. [Google Scholar]
- Leezenberg, M. Politics, Economy, and Ideology in Iraqi Kurdistan since 2003: Enduring Trends and Novel Challenges. Arab Stud. J. 2015, 23, 154–183. [Google Scholar]
- Voller, Y. Countering Violence against Women in Iraqi Kurdistan: State-Building and Transnational Advocacy. Int. J. Middle East Stud. 2014, 46, 351–372. [Google Scholar] [CrossRef]
- Meadowcroft, M. Kurdistan Elections for Iraqi Kurdish National Assembly and Leader of the Kurdistan Liberation Movement; Monitoring Report; Electoral Reform Consultancy Services: London, UK, 1992. [Google Scholar]
- Noori, N.N. The Failure of Economic Reform in the Kurdistan Region of Iraq (1921–2015): The Vicious Circle of Uncivic Traditions, Resource Curse, and Centralization. Br. J. Middle East. Stud. 2018, 45, 156–175. [Google Scholar] [CrossRef]
- Dempsey, N.; Brown, C.; Bramley, G. The Key to Sustainable Urban Development in UK Cities? The Influence of Density on Social Sustainability. Prog. Plan. 2012, 77, 89–141. [Google Scholar] [CrossRef]
- Agrawal, A.; Gibson, C.C. Enchantment and Disenchantment: The Role of Community in Natural Resource Conservation. World Dev. 1999, 27, 629–649. [Google Scholar] [CrossRef]
- Klooster, D. Green Development: Environment and Sustainability in the Third World; Taylor & Francis: New York, NY, USA, 2003. [Google Scholar]
Figure 1.
The case study site. Created by the authors.

Figure 2.
Urban sustainability index of Duhok City, KRG 1991–2010.

Figure 3.
Urban sustainability index by categories of Duhok City, KRG 1990–2010.

Table 1.
Urban area growth rate of Duhok City during 1947–2014.
| Year | 1947 | 1977 | 1990 | 2003 | 2008 | 2014 |
|---|---|---|---|---|---|---|
| Urban Area (Hectare) | 76.9 | 1058.7 | 853 | 2173.7 | 4096.5 | 10763.2 |
| Urban Growth Rate % | 90.99 | 19.43 | 51.3 | 46.94 | 61.94 |
Source: Adopted from [22] (p. 335). The authors converted the original table from km2 to ha.
Table 2.
Population growth rate of Duhok City during 1947–2014.
| Year | 1947–1957 | 1957–1967 | 1967–1977 | 1977–1987 | 1987–1997 | 1997–2007 | 2007–2014 |
|---|---|---|---|---|---|---|---|
| Population Growth Rate Percent | 3.17 | 6.37 | 15.27 | 23.57 | 34.57 | 52.07 | 55.47 |
Table 3.
Initial set of indicators reviewed by category.
| Categories | No. of Indicators | Categories | No. of Indicators |
|---|---|---|---|
| Environment | 10 | Housing | 6 |
| Environment and Public health | 9 | Housing and Education | 7 |
| Transportation | 15 | Natural Resources | 5 |
| Changing our mode of transportation | 1 | Resources Conservation | 6 |
| Economy | 15 | Youth and Education | 2 |
| Economic Development | 11 | Children and Education | 3 |
| Land Use | 4 | ||
| Land Use/Mobility | 5 | Community education and Civic participation | 7 |
| Open Space and Land Use | 5 | Education and Community | 7 |
| Land Use in Urban Area | 1 | Health and Community | 4 |
| Population and household | 4 | Safety and Health | 5 |
| Demography | 5 | Personal Health and well-being | 3 |
Table 4.
Urban sustainability framework of the City of Duhok.
| Category/Indicator | Calculation | Notes |
|---|---|---|
| Environment and Public Health | ||
| General air quality | 1. Annual Average Rainfall (mm) | More is better |
| 2. Yearly-Average dust fall (g/m2/year) | Less is better | |
| Volume of air pollution per 10,000 inhabitants | (Number of new cars registered in the city/Total population) × 10,000 | Less is better |
| Waste generation per 10,000 inhabitants | (Amount of waste generation (kg per capita/year) × 10,000 | Less is better |
| Energy consumption per household | Amount of electric power consumption (MW-h per year)/Total household | Less is better |
| Transportation | ||
| Car ownership rate | (Total number of registered cars/Total population) | Less is better |
| Traffic system safety per 10,000 inhabitants | (Injuries in road traffic accidents/Total population) × 10,000 | Less is better |
| Economic and Urban Development | ||
| Employment rate | The number employed/Labor force | More is better |
| Unemployment rate | The number of unemployed/Labor force | Less is better |
| Rate of capital investment projects | (Number of capital investment projects in the city/Total capital investment projects in the province) | More is better |
| New buildings permit issued rate | Number of new building permits issued/Total permits | Has two tails |
| Rezoning permits issued rate | Number of rezoning building permits issued/Total permits | More is better |
| Building renovation permits issued rate | Number of renovation building permits issued/Total permits | More is better |
| Mixed-use property permits issued rate | Number of mixed-use property permits issued/Total permits | More is better |
| Manufacturers permit issued rate | Manufacturers permits issued/Total permits | Has two tails |
| Hotels and motels permit issued rate | Number of hotels and motels issued permits/Total permits | More is better |
| Land Use and Open Space | ||
| Percentage of residential areas | (Area of residential land/Total area) × 100 | Less is better |
| Percentage of commercial areas | (Area of commercial/Total area) × 100 | Less is better |
| Percentage of public services areas | (Area of public services/Total area) × 100 | More is better |
| Percentage of industrial areas | (Area of industrial/Total area) × 100 | Has two tails |
| Percentage of tourist facility areas | (Area of tourist facility areas/Total area) × 100 | More is better |
| Percentage of transportation areas | (Area of transportation/Total area) × 100 | More is better |
| Percentage of green open space | (Area of cemetery and green area/Total area) × 100 | More is better |
| Population Demography and Household | ||
| Population growth | Total population change per year during 1990–2000 | Less is better |
| Population density | Total population/Total area (Hec) | Less is better |
| Average household size | Total population/Total households | More is better |
| Percentage of urban population | Total population in urban area/Total population | Has two tails |
| Housing | ||
| Rate of new housing permits | (Number of new housing units permits issued/Total permits) × 100 | More is better |
| Rate of permits issued for new construction of new apartments | (Number of apartment housing permits/Total permits) × 100 | More is better |
| Housing investment projects per 100,000 inhabitants | (Number of housing investment projects/Total population) × 100,000 | More is better |
| Education and Community | ||
| Rate of new schools | (Number of new schools/total past schools) × 100 | More is better |
| Quality in education | No. of students per teacher = (Number of Students/Number of teachers) | Less is better |
| Equity in education | No. of students per classroom = (Number of students/Number of classroom) | Less is better |
| Level of educational Attainment | Number of college completion adults/Total population | More is better |
| Health and Community | ||
| Number of hospitals per 100,000 inhabitants | (Number of hospitals/total population) × 100,000 | More is better |
| General health status per 100,000 inhabitants | (Number of registered patients in the hospitals/total population) × 100,000 | Less is better |
| Number of medical staffs per 100,000 inhabitants | (Number physicians/total population) × 100,000 | More is better |
| Infant mortality rate per 100,000 live birth | (Number of infants’ mortality less than one year/Total births) × 100,000 | Less is better |
| Community and Civic Engagement | ||
| Number of NGOs per 10,000 inhabitants | (Number of NGOs/total population) × 10,000 | More is better |
| Annual library visits per capita | (Total annual library visits/Total Population) | More is better |
Table 5.
Indicator influenced on urban sustainability trend, 1991–2010.
| Factor | Percentage of Variance | Positively Strong Indicator Influence | Factor Loadings | Negatively Strong Indicator Influence | Factor Loadings |
|---|---|---|---|---|---|
| 1 | 48.1% | Energy consumption per household | 0.947 | Quality in school | −0.755 |
| Unemployment rate | 0.937 | Population density | −0.665 | ||
| Housing investment projects per 100,000 inhabitants | 0.937 | ||||
| Level of educational Attainment | 0.843 | ||||
| Employment rate | 0.843 | ||||
| Waste generation per 10,000 inhabitants | 0.826 | ||||
| Number of NGOs per 10,000 inhabitants | 0.823 | ||||
| Number of medical staffs per 100,000 inhabitants | 0.812 | ||||
| Percentage of urban population | 0.797 | ||||
| Percentage of green open space | 0.775 | ||||
| New buildings permit issues rate | 0.794 | ||||
| Infant mortality rate per 100,000 live birth | 0.734 | ||||
| Number of hospitals per 100,000 inhabitants | 0.638 | ||||
| 2 | 14.5% | Number of NGOs per 10,000 inhabitants | 0.534 | Population density | −0.520 |
| Percentage of urban population | 0.526 | Equity in school | −0.853 | ||
| Percentage of green open space | 0.560 | Percentage of transportation areas | −0.846 | ||
| Car ownership rate | 0.902 | Number of hospitals per 100,000 inhabitants | −0.827 | ||
| Percentage of commercial areas | 0.873 | Rezoning permits issued rate | −0.542 | ||
| Annual library visits rate per capita | 0.867 | ||||
| Percentage of industrial areas | 0.691 | ||||
| Hotels and motels permit issues rate | 0.640 | ||||
| Rate of capital investment projects | 0.546 | ||||
| General air quality | 0.531 | ||||
| 3 | 8.8% | Volume of air pollution per 10,000 inhabitants | 0.854 | Traffic system safety per 10,000 inhabitants | −0.813 |
| General health status per 100,000 inhabitants | 0.659 | ||||
| Mixed-use property permits issued rate | 0.623 | ||||
| Percentage of public services areas | 0.620 | ||||
| Rate of new housing permits | 0.593 | ||||
| Percentage of tourist facility areas | 0.523 | ||||
| 4 | 5.9% | Building renovation permits issued rate | 0.805 | None | |
| Population growth rate | 0.729 | ||||
| Average household size | 0.580 | ||||
| 5 | 4.5% | Manufacturers permits issued rate | 0.787 | None | |
| Rezoning permits issued rate | 0.761 | ||||
| Percentage of residential areas | 0.627 | ||||
| 6 | 4.1% | Rate of new housing permits | 0.719 | None | |
| General air quality | 0.704 | ||||
| 7 | 2.8% | Rate of new school | 0.877 | None |
© 2019 by the authors. Licensee MDPI, Basel, Switzerland. This article is an open access article distributed under the terms and conditions of the Creative Commons Attribution (CC BY) license (http://creativecommons.org/licenses/by/4.0/).
Share and Cite
MDPI and ACS Style
Hassan, A.; Kotval-K, Z. A Framework for Measuring Urban Sustainability in an Emerging Region: The City of Duhok as a Case Study. Sustainability 2019, 11, 5402. https://0-doi-org.brum.beds.ac.uk/10.3390/su11195402
AMA Style
Hassan A, Kotval-K Z. A Framework for Measuring Urban Sustainability in an Emerging Region: The City of Duhok as a Case Study. Sustainability. 2019; 11(19):5402. https://0-doi-org.brum.beds.ac.uk/10.3390/su11195402
Chicago/Turabian StyleHassan, Azad, and Zeenat Kotval-K. 2019. "A Framework for Measuring Urban Sustainability in an Emerging Region: The City of Duhok as a Case Study" Sustainability 11, no. 19: 5402. https://0-doi-org.brum.beds.ac.uk/10.3390/su11195402
Note that from the first issue of 2016, this journal uses article numbers instead of page numbers. See further details here.