Article

Exploring the Topological Characteristics of Complex Public Transportation Networks: Focus on Variations in Both Single and Integrated Systems in the Seoul Metropolitan Area

Department of Transportation Engineering, University of Seoul, Seoul 02504, Korea
*
Author to whom correspondence should be addressed.
Sustainability 2019, 11(19), 5404; https://0-doi-org.brum.beds.ac.uk/10.3390/su11195404
Submission received: 3 September 2019 / Revised: 23 September 2019 / Accepted: 26 September 2019 / Published: 29 September 2019
(This article belongs to the Special Issue Sustainability Issues in Public Transport)

Abstract

:
Many cities have integrated their public transportation modes to provide increased accessibility and reduced commute times. However, current transport network topology studies have focused on unimodal networks. Therefore, it is of significant interest for policymakers to examine the topology of integrated public transportation networks and to assess strategies for improving them. The objective of this study was to discuss a comprehensive analysis of an integrated public transportation network using graph theory, compare its characteristics to unimodal networks, and draw insights for improving their performance. Results demonstrate pertinent information concerning the structural composition of the Seoul Metropolitan Area’s (SMA) public transportation network. Despite the integration, the spatial configuration of the network was found to have low fault tolerance. However, the highly agglomerated community structure validated the robustness of integrated networks. Network centrality measures confirmed that integration improves connectivity and spatial accessibility to suburbs within the city. The study found that the SMA’s current public transportation network possesses structural defects that need to be addressed to improve its resilience and performance. Based on the outcomes of this study, the strategic creation or relocation of stations, and the construction of more links, is imperative for the enhancement of mobility.

1. Introduction

Urban public transportation plays a significant role in the growth and sustainable development of cities by reducing congestion and improving the livability of citizens. Policymakers and researchers are encouraging the transition from personal vehicles to public transportation since it is difficult to change the built environment that has already been composed in an urban area. To cater for the ever-increasing ridership demand, governments aim at increasing the efficiency of public transit operations by focusing on service optimization, planning, and station infrastructure improvements [1].
One key challenge for the proper management of the current public transportation networks in cities is the identification of “central stations” and making appropriate adjustments to their spatial configurations where necessary to improve their connectivity and robustness to disruption in times of disasters. A typical approach to the problem mentioned above requires a deeper understanding of the structure and characteristics of urban transportation networks.
Researchers in the transportation field have employed heuristic algorithms and graph-based measures, especially network centrality indicators, as they reflect the importance of stations in urban transit networks [2,3]. These graph-based measures employ statistical mechanics and physics to locate “central stations” in spatial networks such as bus and subway networks [4]. Moreover, the idea of scale-free and small-world networks have been applied to bus networks [5,6] and metro networks [7] to study connectivity and resilience for a more effective system.
Ever since the inception of graph-based measures, it has been widely applied to visualize and investigate complex networks in many other study areas; for example, in epidemiology for studying the transmission of infections [8], for controlling the spread of information in social networks [9], and for analyzing transportation networks [3,4,5,6,7]. In the intelligent transportation system domain where technologies are employed to control and improve the management of transportation systems [10], complex network topology was employed to study vehicular sensing networks (VSN) in a smart city setting. As these systems are becoming popular due to the increasing need for vehicle-to-vehicle and vehicle-to-infrastructure communication, the complex network analysis helped to identify the relationship between pairs of nodes communicating with each other for the perfect design of VSN’s. By collecting and sharing information with policymakers, VSN technology allows for increased efficiency in terms of traffic management [11].
Currently, most cities operate connected public transportation systems, which comprise several modes of transport that function simultaneously and complement each other. In general, the network integration may be achieved operationally, physically, or through fares, and it allows commuters to use the entire public transportation system independently of transport modes and schedules [12]. Furthermore, the stations (or bus stops) in integrated urban public transportation systems are expected to have higher centralities, since it has proved to present riders with easy accessibility, transfers from one mode to another, and travel time savings [13,14,15,16]. Apart from making trips more efficient for passengers, integrated public transportation systems are believed to reduce operating costs and increase revenue generation [17]. A significant example where integrating public transportation systems impacted transit ridership is the case of Seoul in South Korea, where concurrently operating both bus and subway systems allowed for the provision of discounted transfers between both modes which led to a significant rise in public transit ridership [18].
Due to the critical role of integrated systems in the modern society, the concept has been revered across the globe as a significant approach to realizing improved transportation services for creating sustainable cities; nevertheless, integrating the systems is associated with complexities that make urban public transportation networks practically challenging to examine. The network complexity problem arises, as they consist of an enormously large number of stations (or bus stops) and links. Although integrated urban public transportation systems have been identified to possess a lot of desirable features, there is currently limited research that employs graph-based measures to analyze them systematically and compare their spatial structures with that of unimodal networks. Due to this, there is a significant gap in research from the angle of understanding the topological properties and performance of complex integrated public transportation systems. As these systems have become necessary for the increase in ridership, they must be analyzed in order to provide insights for further modifications where necessary.
This paper analyzes the public transportation network in the Seoul Metropolitan Area (SMA), using specific network topology measures. We analyzed three distinct networks; bus network, subway network, and an integrated network of bus and subway based on graph theory. In general, public transportation systems are made up of a set of links with stations (or bus stops) distributed across the network, and several links between stations (or bus stops) combine to form routes. The choices of network topology measures were set so that different aspects of the network could be adequately studied. To analyze the size of the networks, network properties such as the number of nodes, links, and the network diameter of each network were estimated. For the analysis of each network’s connectivity, we included network topology measures such as clustering coefficient, average path length, and degree of connectivity. Network centrality measures, namely betweenness centrality, closeness centrality, eigenvector centrality, and eccentricity centrality were applied to identify important stations or bus stops in the networks. The study then proceeded to examine whether the networks possess any unique features required for efficient operations.
In summary, the primary purposes of this study were to:
  • Construct and compare changes in network indicators across unimodal networks of subway and bus, in conjunction with an integrated network of both bus and subway, using link distances as weights.
  • Analyze if the networks being studied show small-world and scale-free features, which are indicators of network resilience.
The approach provides insights into the topological characteristics of integrated public transportation networks. It can be used as a basis for making meaningful recommendations, which can be adopted by authorities for making proactive plans and improving the performance of transportation systems.
The remainder of this paper is organized as follows. Section 2 presents a review of related literature showing the application of network topology in the field of transportation. The third section provides a case study about the public transportation system in SMA. In Section 4, we describe the methodological framework used in this research, together with the results of the network analyses. Section 5 presents the discussion of results and the final section summarizes the findings of the study.

2. Literature Review

2.1. Application of Graph Theory in the Public Transportation Field

Graph theory is an essential area in mathematics that is used in structural models. The concept of graph theory can be traced back to the Seven Bridges of Konigsberg problem, which was solved by the great Swiss mathematician Leonhard Euler in 1735. The historical bridge problem involved finding only one path across seven bridges that stretched over a branched river and making sure that the path does not cross a bridge twice. Euler’s proof only showed the physical arrangements of the seven bridges and concluded that there would be no way to find the trail in question. His proof became the first theorem in graph theory. It laid the foundation of graph theory and created the idea of topology. Mathematically, a graph is used to show the relationship between an object and other objects using points and lines between them [19]. One main advantage for its application lies in its capability of simplifying complex scenarios and modeling numerous complex interactions within systems. The structural arrangement of objects helps to simplify problems and allows the engineer to make modifications to the existing graph for enhancement of services. Ever since its conception, graph theory has been widely applied in engineering fields including transportation engineering for analyzing public transportation systems, in sociology for exploring diffusion mechanisms, and in biology for tracking the spread of diseases.
Studies on public transportation systems in cities have been an active area of interest for practitioners. Mostly, they are geared towards realizing a sustainable transport system which has been defined as one that “satisfies the current transport and mobility needs without compromising the ability of future generations” [14,20]. Researchers are continually focusing on ways of reducing the use of private cars by making public transportation a cheaper and a more competitive alternative. One of the critical elements that has been considered in understanding transport networks is network topology measures, which stems from graph theory. Hong [21] describes network topology as the physical arrangement or interconnection of elements of a network such as nodes and links. It has been the most efficient way of extracting, referencing geographic information, and visualizing networks of transport systems in a computer [22]. Also, it has been successfully applied to physical, biological, and information systems to understand and identify critical nodes in complex networks and those that need readjustments [23,24,25,26].
From the literature, complex network analysis in graph theory has been defined as a science that explains the connection and interaction existing between elements of a system. Transportation systems are similar to complex networks. Hence, the idea was easily adapted to determine the implications of network structure and its properties on urban transportation [14,27,28,29].
After its introduction, many indicators such as network centrality measures, network diameter, and connectivity were developed to quantify transport systems. Significant studies conducted close to the end of the last century identified two important properties, small-world and scale-free properties, which opened up a new paradigm of complex transit networks [30]. By these studies, a network is considered to have small-world properties if it satisfies two conditions. First, its average path length should be similar to the average path length of an equivalent random network of the same number of stations (or bus stops). Secondly, its average clustering coefficient should be significantly higher than the average clustering coefficient of an equivalent random network. On the other hand, a network exhibits scale-free property if its degree distribution follows the power law. Thus, in such a network, the degree distribution reduces more gradually compared to the exponential distribution, giving a chance for the existence of hubs with large degrees [31,32]. Transport networks with these properties have desirable features such as being able to handle congestion and being robust to random attacks; hence, they have been recommended for urban transit networks. Researchers describe robustness or resilience of a network as its ability to resist disruptions, and how fast it returns to the state of equilibrium after a disruption [7,33].
The critical position of a public transportation facility in a network, which also shows the importance of the station (or bus stops), is determined using network centrality measures [2,3]. Measures of network topology such as node degree, betweenness centrality, closeness centrality, and eigenvector centrality are commonly used in identifying central nodes in complex transportation networks. Chen et al. [25] pointed out that each centrality measure addressed a specific need. The degree of centrality accounts for the direct connections to a node, closeness centrality measures the average distance from one node to all other, the betweenness centrality considers how often a node occurs on the shortest paths between nodes in the network, and the eigenvector centrality measures the importance of a node based on its links with other central nodes [14]. Scheurer et al. [34] demonstrated that in places with high geographic centrality, public transportation performed better.
Although the methods above are very efficient and well-accepted, dozens of new centrality measures have been developed based on specific conditions and assumptions [35,36,37]. Among such studies was one conducted by Du et al. [38], who proposed a new method of identifying central stations (or bus stops) in complex networks based on a technique for order performance by similarity to ideal solution (TOPSIS). This approach was applied to four real networks and its performance was measured using a susceptible-infected (SI) model. The researchers identified that their method outperformed betweenness centrality and eigenvector centrality, but degree centrality and closeness centrality proved to be more superior.
Derrible [39] acknowledged that centrality is at the core of public transportation in cities. He analyzed transport systems in 28 metro systems worldwide using network centrality measures to identify global patterns in terms of variations in network centrality when compared with network size. Betweenness centrality was found to increase persistently with the size of the network. It was also determined that the node betweenness declined in a power-law pattern when compared with the size of the network. On examining individual stations (or bus stops), the researcher identified highly central facilities that could be used to reallot passengers in the network to reduce the stress from crowded nodes in the network. Soh et al. [27] also studied the bus and rail network in Singapore using network topology and showed that centralities of stations changed considering traffic flows during weekends and weekdays.
The influence of network topology on accessibility was also studied as it is also a fundamental concept in transportation planning. Spatial accessibility, which describes the ‘ease’ of reaching opportunities for activities and services, has been a critical consideration in the provision of transport services [40]. In public transportation planning, accessibility studies have been treated with much importance because they depicts how easy transit riders can get to and depart the service. Caschili and Montis [41] analyzed the accessibility patterns of commuters by regressing accessibility measures on network centrality measures. Network centrality was found to have a strong positive correlation with accessibility. Thus, the researchers concluded that increasing the centrality of transit systems tends to increase accessibility. More specifically, Rubulotta et al. [42] noted that a zone is highly accessible if it is well connected with others. They also identified that closeness centrality had a positive correlation with accessibility. Well-connectedness of a network achieved by integrating modes of transport was also found to have a positive impact on accessibility [13]. These studies all point to the fact that integrating public transportation systems is imperative as it increases accessibility to transit facilities and other services.
In addition to the advantages, integrated public transportation systems have been proven to reduce total travel time [15] provide convenient and efficient transfer systems, as in the case of Seoul [16]; and above all curtail the desire to use private cars. Dash [43] identified that the sustainability of urban cities is crucial for development and noted that an efficient public transportation system could be achieved by integrating the networks of various modes of public transportation. Given these reasons, there have been several calls for developing integrated public transportation systems. Time is an essential factor when it comes to urban transportation, hence making transport systems more efficient by harmonizing them will provide easy and efficient management and operation of transport systems, which will help increase service quality [18].
Previous research has dealt with measures for identifying central stations in complex urban transportation networks. Some analysts also pointed to the importance of adopting integrated and harmonized transport networks as they are associated with increased centrality and accessibility. Nonetheless, extensive research conducted on station centrality revealed that most authors mainly focused on unimodal transport networks. Used in this article, unimodal transport networks refers to nonintegrated public transportation networks of either bus, subway, or bicycles. Table 1 below shows relevant studies in the transportation field that applied network topology measures to unimodal transport networks.

2.2. Contribution to the Literature

As seen from the subsection above, there are limited studies that focused on applying network graph theory to analyze integrated public transportation networks systematically. Since public transportation networks are mostly integrated, employing graph-based measures to examine their size and connectedness is essential. In this study, we bridged the gap in the literature by representing the bus, subway, and the integrated network of bus and subway in the SMA using graphs; then we applied the knowledge of network theory to analyze them. Examining all the bus and subway lines currently in operation in the SMA makes our study more realistic, since it incorporates a larger share of the public transportation system.
Another contribution to the literature is the comparison of network indicators across three networks in the SMA, namely, the bus network, subway network, and the integrated bus and subway network. The study will also focus on identifying if the three networks exhibit small-world or scale-free properties. The implications in each case would be discussed after that. The findings of this research will provide insights that can be used by transport planners when upgrading the current public transportation system or building new ones.

3. Case Study: The Public Transportation System in the Seoul Metropolitan Area

The administrative capital of South Korea is Seoul. With a total land area of 605 km², Seoul serves as home to approximately 10.19 million people. Together, Incheon, which has one of the busiest airports in the world, and Gyeonggi province are immediate neighbors of Seoul. The three provinces are combined to form the SMA. Gyeonggi province and Incheon have a population of 12.10 million and 2.84 million, respectively, and a combined land area of 11,164 km². Both cities depend extensively on Seoul for their socioeconomic activities. This situation causes an increase in daily traffic and rural–urban drift. Notwithstanding Seoul’s limitations, much research has focused on developing the city and its public transportation systems to support the growing demand. Thus, the capital city experienced tremendous growth over the years, and part of its economic progress can be attributed to its efficient transport system [58].
In the mid-1990s, bus rapid transit reforms were introduced to reduce the delays experienced by transit riders due to severe traffic congestion challenges. The reforms provided dedicated curbside bus lanes, which sought to improve the service, but these failed due to the competition between individual bus operators. It led to bus ridership falling from 30% in 1996 to 26% in 2002 and an increase in subway ridership from 29% in 1996 to 35% in 2002. The Seoul Metropolitan Government, later in the early 2000s, introduced a quasi-public transportation organization that reinforced the rules governing public transportation in the country. This system focused on achieving a harmonized transport system, and an increased public transportation ridership [59].
Currently, Seoul alone is supported a large public transportation network consisting of nine subway lines, which cover a total service distance of 331.6 km, and an efficient bus system which comprises 8090 bus stations with bus stops spread across the study area [60]. The bus and subway systems complement each other and public transportation riders have the chance to transfer between modes while they enjoy discounted fares when they use the T-money card, which is a transit smart card developed by the Korea Smart Card Co., Ltd. [16]. The smart card has continued to be the primary payment method employed by the public transportation system. It allows for riders to tap their card upon entering the bus, taxi, or subway station and once more upon alighting or exiting the station. The managers of the transport system can collect the data, which contain the trajectories (origin to destination) of the individual riders. The provision of seamless transfers between the same or different modes, together with transfer discounts, made public transportation more attractive and induced higher ridership. The GIS-based map in Figure 1 below shows the complete distribution of nodes (stations and bus stops) in SMA and Seoul.

4. Network Analysis of Public Transportation Networks in the SMA

4.1. Data Preprocessing and Graph Generation

The aim of our research was to analyze the individual bus and subway networks, together with the integrated bus and subway network, in Seoul that extend to the SMA. By employing the knowledge of network topology, which stems from graph-based methods, we concentrated on generating a weighted graph of n nodes and e links represented as G = ( N , E ) , such that the set of nodes is N = { N k ,   k = 1 , 2 , , n } and the set of links is E = { E m ,   E m = ( N k , N l ) ;   N k , N l N   and   m = 1 , 2 , , e } . Hence, if E m is a link in the network with indicator number m , N l and N k represent its destination and origin nodes, respectively. In this study, nodes are referred to as stations (or bus stops), and links are the connections between each pair of nodes.
To achieve the aim of our study, we collected data of all possible pairs of origin stations ( k ) and destination stations ( l ) of the bus and subway networks in the SMA as described above with the aid of the various transportation maps and Smart Card data, which show the list of stations and links in the SMA’s public transportation network. For the data, we focused on the entire subway network in Seoul, including subway lines that serve the other provinces in the SMA from Seoul. For the bus network, we concentrated on bus lines in the bus network that are connected to the SMA from Seoul. There are a few isolated bus networks operating in the satellite cities within the provinces surrounding Seoul (Gyeonggi-do province and Incheon). However, since they are not connected to the main bus network in Seoul, they have a very insignificant effect and were not considered in this study. We developed an n × n adjacency matrix of G as A = [ a k l ] , such that a k l = 1 if there is a connection between the k th ( N k ) station and the l th station ( N l ), and a k l = 0 otherwise. The adjacency matrix with entries { a k l } was used to describe how the N k and N l nodes are connected in the network graph G . From this matrix, we obtained the edge E list for the graph generation.
It is important to note that this study was focused on investigating the physical structure of networks and not the movement of people. Hence, we applied a weight matrix W = [ w k l ] , which denotes the inversed physical distances from each pair of nodes N k and N l . Using the edge list obtained from the adjacency matrix, we finally generated the three graphs of subway, bus, and the integrated bus and subway networks, as shown in Figure 2.

4.2. Network Indicators

Network indicators consist of a wide range of metrics that capture connectivity, accessibility, and centrality of nodes [61], such as stations or bus stops. We studied the basic network properties, such as the number of stations and links, and applied complex metrics, for instance, eigenvector centrality and clustering coefficient, to the bus, subway, and the integrated bus and subway networks. The summary statistics for the network indicators are shown in Table 2.

4.2.1. Basic Network Properties

Before we could identify the features of a network, it was essential to determine fundamental properties relating to its size. In this study, information about the size of all the networks is described in terms of the number of stations and links in them. As shown in Table 2, the integrated network is significantly the largest among the three networks as it has the highest number of stations and links. The bus network follows in the second place, and then the subway network. The observation suggests that the integrated network provides higher accessibility to destinations, owing to the high number of routes and connections created as a result of combining both bus and subway networks.
We compared the network diameter ( δ ) of the three networks. Network diameter is a measure of the longest graph distance that exists between any two nodes in a network. It is obtained by finding the maximum distance of the shortest paths between the stations in the network. This is expressed mathematically as
δ = max i j { l ( i , j ) }
where l ( i , j ) is the number of links in the shortest path from station i to station j .
We noticed that the subway network’s diameter was the lowest. The observation is understandable as the size of the subway network is the smallest among the three networks, considering that it has the lowest number of stations ( N S u b w a y = 602 ;   N B u s = 12 , 271 ;   N I n t e g r a t e d = 12 , 873 ). A more striking point to note is that, even though the integrated network is larger than the bus network, its diameter is significantly smaller than that of the bus network’s diameter. It indicates that integrating the subway and bus network significantly reduces the travel distance within the network, even though it is much more extensive.
Another vital network property that is based on the relationship between the elements of a network (stations and links) is the degree of connectivity ( γ ). The connectivity indicator is very useful to transport planners and practitioners as it estimates how easy it is to travel from one station to another in a network based on the level of connectivity. We measured the degree of connectivity using the gamma index calculated as the ratio of the actual number of links over the maximum number of links in the network [31]:
γ = E E m a x = E 3 ( N 2 )
where E is the number of links and N is the number of stations in the transportation network.
We observed that the degree of connectedness was highest in the subway network ( γ S u b w a y = 0.8 ). On the other hand, the integrated network, which was larger than the bus network, had the second-highest degree of connectedness ( γ I n t e g r a t e d = 0.5 ). Based on the results of the underlying basic network properties displayed in Table 2, we infer that it is more beneficial to travel using the integrated public transportation network as it services a larger coverage area and provides more effortless movement between stations compared to the bus network.

4.2.2. Average Path Length and Clustering Coefficient

The average path length ( l ) for all the networks analyzed in this study was calculated to determine the average number of links traversed along the shortest paths of all possible pairs of stations within the network. This relationship is formally stated as
l = 1 N ( N 1 ) i j d i j
where l is the average path length, N is the number of nodes in the network, and d i j is the length of the shortest path between stations i and j .
We identified that the average path length of the subway network was the lowest due to its small size. The integrated network, which is somewhat broader among the three, had the second lowest average path length. An important point to note is that, even though the integrated network is larger than the bus network, the integrated network showed a significantly smaller diameter and average path length. The average path distance in the bus network is 1.5 times longer than that of the integrated network. It signifies that using the integrated network is much advantageous as the travel distance between the farthest stations is lesser even though its network is much larger.
The measure of cohesiveness or intraconnectivity among neighbors of a node i (nodes connected by a single link), described as its clustering coefficient, was also determined [61]. If a node N i has k i neighbors, then its clustering coefficient, C i , is expressed as
C i = 2 E i k i ( k i 1 )
where E i is the number of links between node i’s neighbors and the normalization factor k i ( k i 1 ) 2 is the maximum number of links that could exist among its neighbors. For network comparisons, the overall level of clustering within the network was further determined by averaging C i over all the nodes in the network, C = i N C i N .
The range of clustering coefficients for individual stations in both subway and integrated networks were within the interval C i [ 0 , 1 ] , whereas that of the bus network was C i [ 0 , 0.5 ] because of the normalization factor in the formula. Overall, it is essential to note that the average clustering coefficient of the integrated network was higher compared to the other networks, indicating the presence of a higher number of tightly knitted groups within the integrated network.
Both the average path length ( l ) and average clustering coefficient ( C ) of a network play critical roles in identifying “small-worldness” properties of a network. Researchers in the transportation field have noted small-world networks as those that show high connectivity and high capability of linking communities more efficiently (short characteristic path length), while being less redundant. In terms of infrastructural resilience, one significant advantage of investigating this property is to analyze how fault-tolerant and structurally robust a transport network can be in times of disruptions [7]. To check the presence of the small-world phenomenon in our networks, we compared their average clustering coefficient and average path length to similar Erdos–Renyi (E–R) random networks constructed using the same number of stations in each target network, as proposed in the literature [7,32,56,62].
As described in Table 3 below, we found that, apart from the average clustering coefficient of the integrated network, those of the subway and bus networks were lesser than their corresponding values from their equivalent E–R random networks. However, the average path lengths of all the E–R random networks were orders of magnitudes lower than in their corresponding real networks. From the comparisons, we conclude that none of the three networks show characteristics of small-world networks. The results show that the networks are not fault-tolerant in terms of connectivity and cannot maintain connectivity between stations in case of disruptions. Chopra et al. [7] reached similar conclusions as they discovered that the London metro network was not a real-world network.
Furthermore, we analyzed the node degree distributions of the individual networks to identify whether or not they are scale-free. Node degree distributions help in understanding the structure of complex networks. In scale-free networks, the degree distributions (the probability that a station has k degrees) follow a power law, p ( k ) k λ   for   k   and   k > k m i n , which suggests that stations with a higher number of connections have a strong influence on their networks’ structure and dynamics. Such distributions are characterized by a more gradual fall, which is different compared to the exponential distribution. The scale parameter λ shows how the tail of the distribution of p ( k ) falls. It mostly lies within the range 2 < λ < 3 (scale-free regime); however, it could be λ > 3 [7]. Networks with these properties are free of any characteristic scale, implying that they maintain the same underlying structure, even as the network grows [63].
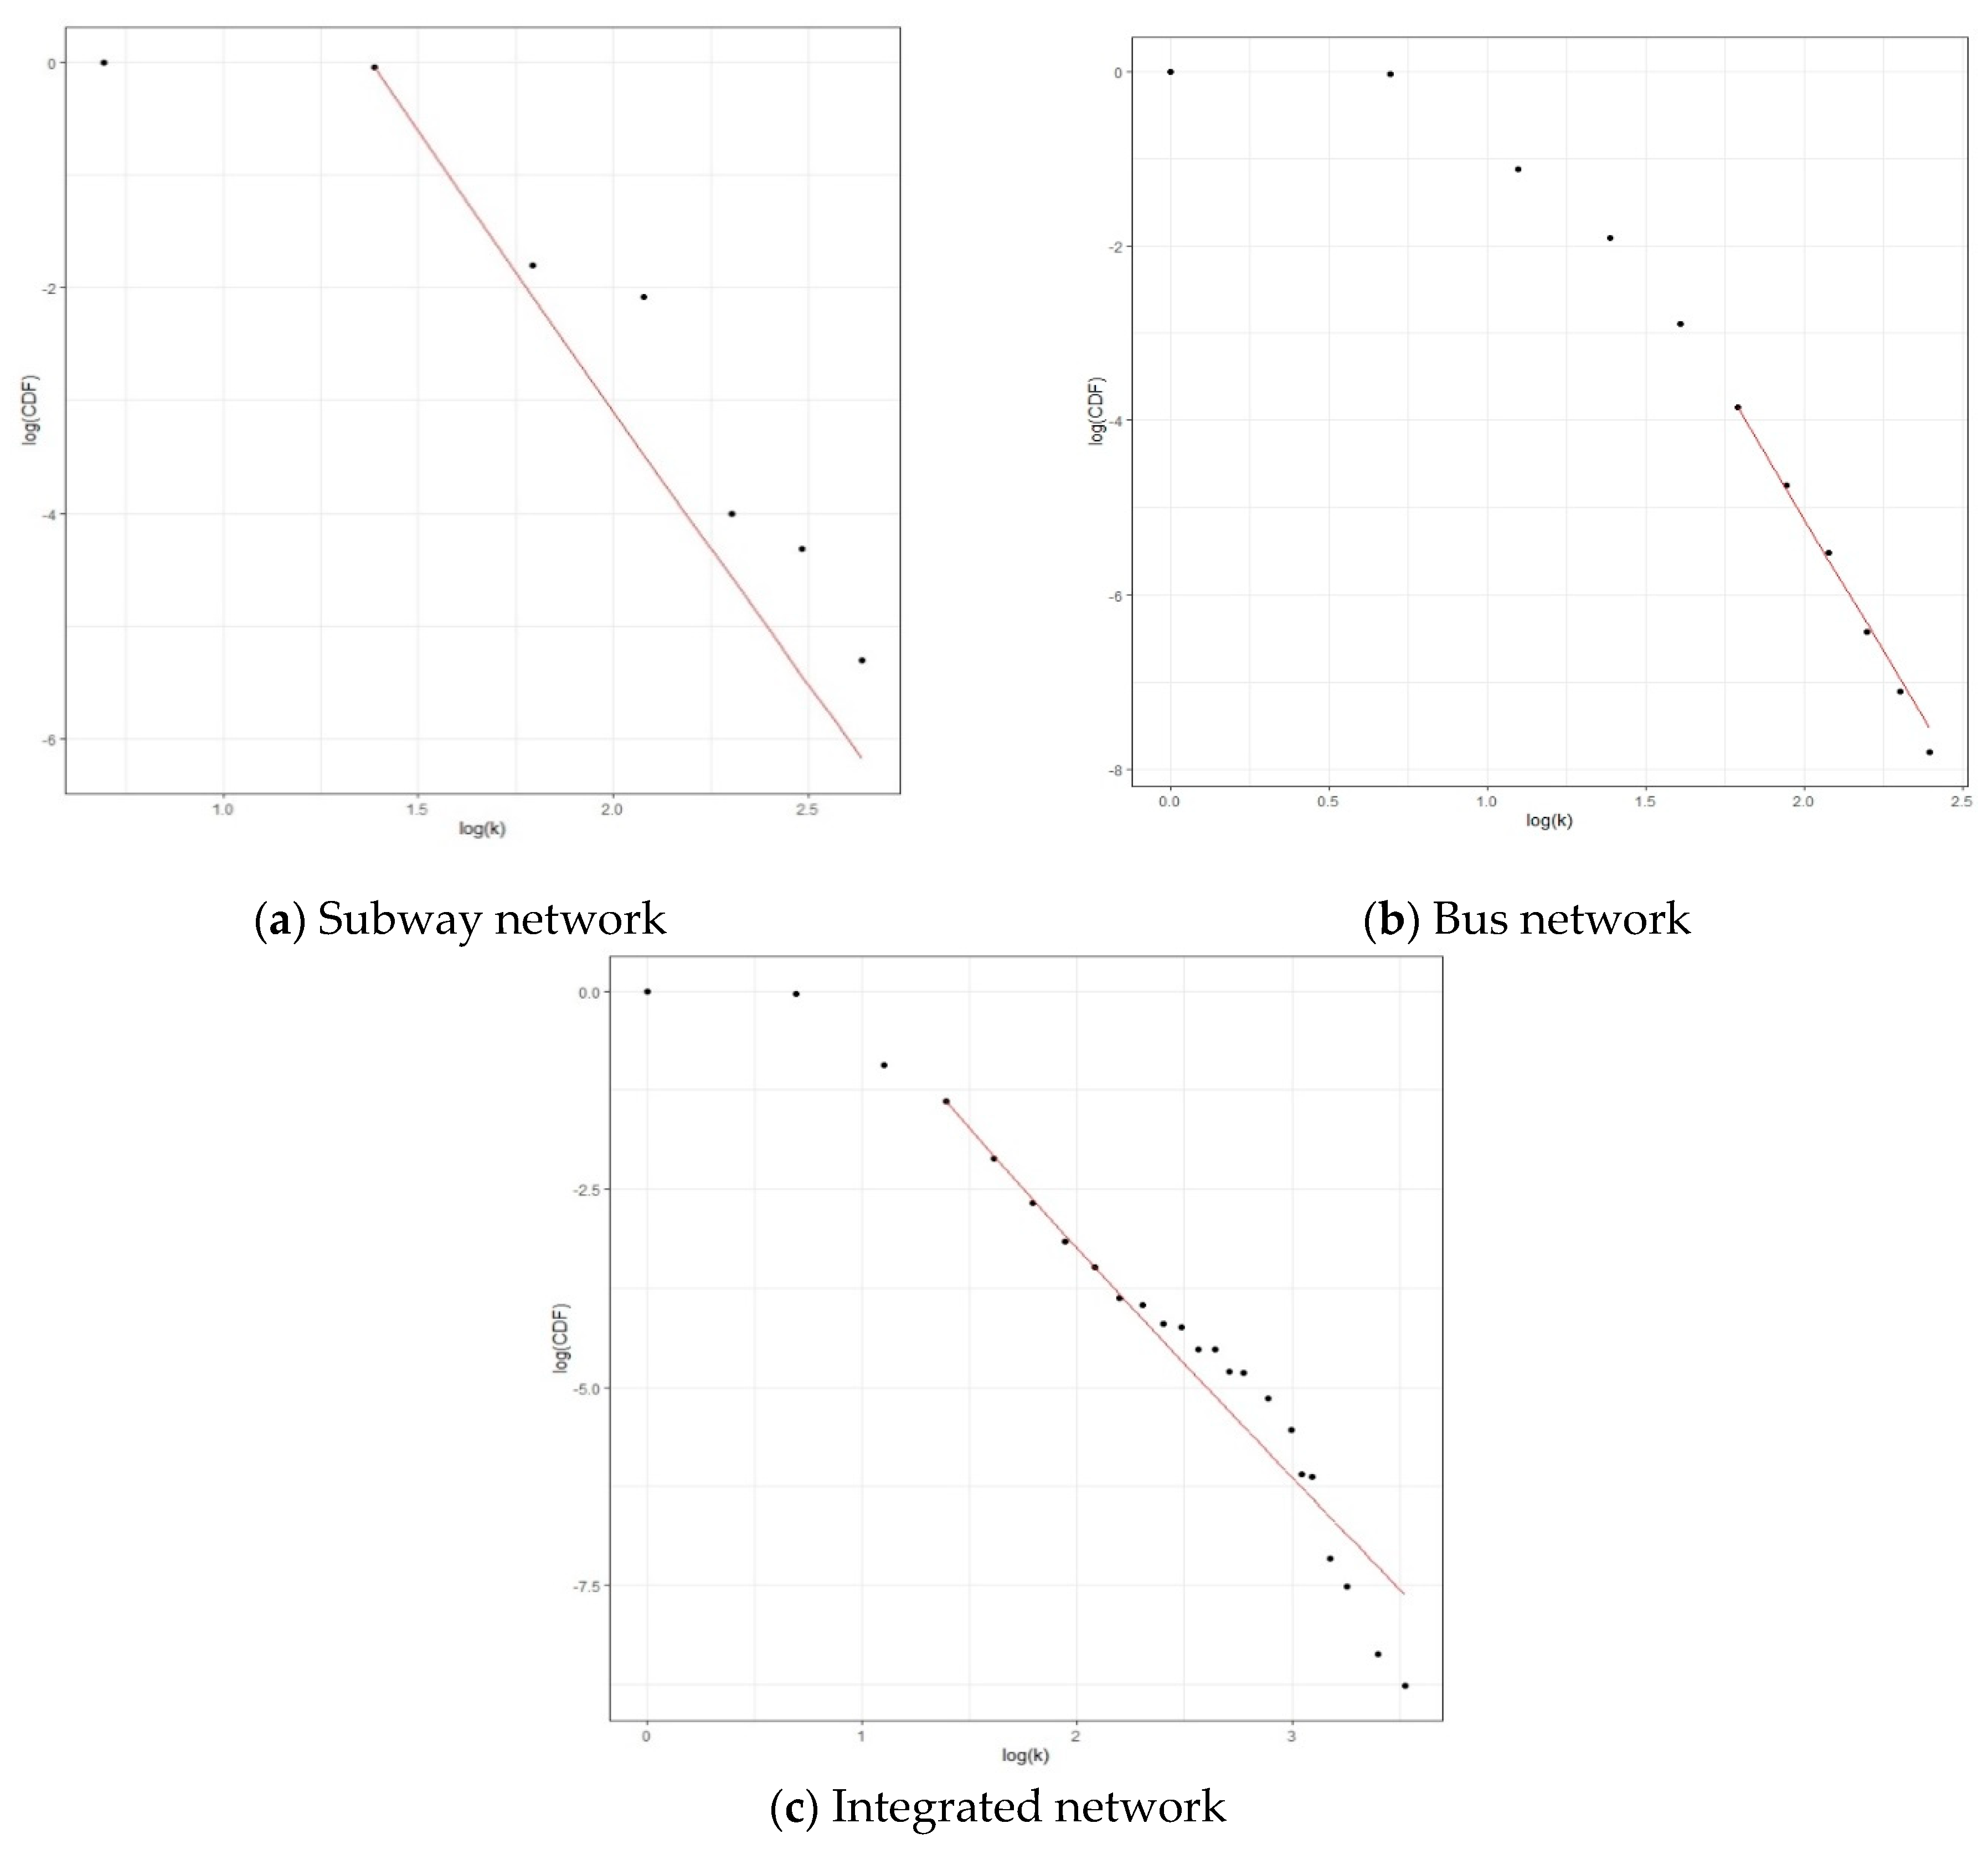
The study of scale-free networks can help us determine how resilient or robust a network is, and to identify and control important hubs [33]. We analyzed the probability distribution of station degrees by plotting them on a double logarithmic scale. We employed maximum likelihood estimation and goodness of fit tests (Kolmogorov–Smirnoff tests) to determine the parameter λ and to test how well the data fit the power law distribution, respectively. The hypothesis that data follow the power law distribution is plausible if p-value > 0.10 .
By fitting our data to the power law distribution shown in Figure 3, we determined that only the bus networks’ dataset followed the power law distribution since its p-value was 0.1298 (p-value   > 0.10 ). Hence, the probability of finding a station with k connections is proportional to k 6.75 , illustrating that the bus network has excessively high-degree stations (hubs). The observation suggests that it is more robust to network breakdowns; however, a significant drawback is that it is more vulnerable to attacks compared to the subway and integrated networks. The results for the scale-free detection and the graphs for the power law distribution of the subway, bus, and integrated networks are shown in Table 4 and Figure 3 below.

4.2.3. Community Detection within the Networks in the SMA

In order to analyze the community structure of the networks and identify cascading impacts resulting from disruptions, we analyzed the various communities that exist within each network using the idea of modularity in graph theory. Modularity is used to determine the strength of the segregation of a network into communities [64]. It could be explained as the proportion of links that fall within the given community minus the expected proportion if links were randomly spread. The equation for modularity, M is given as;
M = i = 1 k ( e i i a i 2 )
where e i i is the proportion of ends of links that are attached to the stations in a community i , a i is the proportion of ends of links that are attached to stations in community i , and M [ 1 , 1 ] . High modularity reflects that there are more links in the community than was expected by chance. M > 0 (positive) if the number of links within the community exceeds the expected number of edges of that community.
In transport networks, the communities identified show the different transit operation zones [5]. A transport network with high modularity is preferred as its communities have dense connections between stations within the same community, but have sparse connections between stations in different communities. This results in more efficient passenger flow within each community with high modularity compared to passenger flows between communities. As such, transport planners use this information to identify patterns of vulnerability and to improve the resilience of networks.
We employed a community detection algorithm known as the Louvain algorithm, first published by Blondel et al. [65], due to its ease of implementation. The algorithm is a greedy optimization technique that consists of two phases. The first phase involves searching and grouping of nodes based on the gains of modularity that result when a node i is moved from one community and placed in another community. The first phase stops when no node can be moved to any other community to improve the modularity. The gain in modularity is achieved by relocating a node i into a new community C and it is computed by the formula below:
Δ Q = [ i n + 2 k i , i n 2 m ( t o t + k i 2 m ) 2 ] [ i n 2 m ( t o t 2 m ) 2 ( k i 2 m ) 2 ]
where m represents the total sum of link weights in the network, k i is the sum of weights of links incident to node i , k i , i n represents the sum of weights belonging to links connecting node i and other nodes in the new community C , tot denotes the sum of weights belonging to links that are incident to nodes in the new community C , and in is the sum of weights of links in the new community C . The second phase involves the building of a new network such that the nodes are the communities. The steps described above are iterated until a maximum modularity for each community is achieved such that no further improvement can be obtained.
The community detection results displayed in Table 2 show the presence of communities spread across the various networks. As many as 63 communities were identified in the bus network, whereas 59 and 23 communities were detected in the integrated and subway networks, respectively. In general, the modularities for communities across all networks examined in this study are highly dense as their modularity values are almost 1 ( M s u b w a y = 0.891 ,   M b u s = 0.937 ,   M i n t e g r a t e d = 0.933 ) . The communities in the bus and integrated networks were identified to be almost equal and highly dense compared to the subway network.
From the results, we observe that the communities in the bus and integrated networks are closely connected, suggesting a faster rate of movement and increased accessibility, which is preferred in transport networks. In terms of the impacts of disruptions, they are robust against breakdowns due to the high connectivity. As such, if a link is disrupted, passengers could be rerouted through adjacent links in the community to their final destinations. In that way, traffic flows within communities would not be significantly affected.

4.2.4. Degree Assortativity

Since considering only the degree centrality does not provide enough information about a network, degree assortativity was developed to analyze the structure, dynamic behavior, and robustness of a network. More specifically, it measures how nodes within a network are attached to other nodes of the same characteristics (homophily). This metric is often quantified as a correlation between two nodes in a network, denoted as a scalar value, ρ [ 1 , 1 ] , and can be computed using the formula
ρ = c i j i k i ( c i 1 2 ( j i + k i ) ) 2 c i 1 2 ( j i 2 + k i 2 ) ( c i 1 2 ( j i + k i ) ) 2
where c = 1 E , E is the number of edges, and j i   and   k i are the degrees of the nodes at the edges of link i . A network is degree assortative if high-degree nodes are attached to other high-degree nodes ( ρ = 1 ), and it is disassortative otherwise ( ρ = 0 ).
In network analysis, assortativity is used to identify a network whose nodes have a high chance of being connected to other nodes of a similar degree. Hence, an assortative network is one in which stations with higher degrees are connected with other stations of higher degrees, and those of lower degrees are connected with stations of lower degrees. If the assortativity indicator of a network is above 0, it is considered assortative. In contrast, a disassortative network is one whose computed indicator is below 0. A non-assortative network has assortativity of 0, meaning any node can randomly connect with other nodes of any degree [31,66]. A failure of a high-degree station in public transportation networks will not have much negative impact since other high degree stations are still connected to other high degree stations [67].
From the results displayed in Table 2, all the networks are slightly degree assortative, which shows that there exists a significantly small chance that fractions of stations will randomly connect with stations of the same degree. Among the three networks, the bus network is the most assortative ( a = 0.39 ) . The integrated network follows closely ( a = 0.36 ) , while the subway network had the least assortativity ( a = 0.07 ) . However, an examination of the networks indicates that they might be vulnerable to disruptions since a very high proportion of stations are linked to very few other stations (they have very low degrees). In the bus network, 64% of the stations are connected to just two stations, whereas 58% of stations in the integrated network have degrees of 2. In the much smaller subway network, 79% and 5% of stations have degrees of 4 and 2, respectively.

4.2.5. Centrality and Connectivity in the Public Transportation Networks in the SMA

Many researchers have studied the centrality of stations in transport networks as it shows the value of stations in networks. Some studies have described node centrality as either “important” or “influential” nodes in a network [2,27,31]. In this study, we identified central stations in all of the three networks based on commonly used centrality measures such as degree centrality, betweenness centrality, closeness centrality, eigenvector centrality, and eccentricity centrality.
The degree of a node is the most basic and straightforward centrality measure. It reflects the number of links that are directly connected to a station i in the network [31]. Hence, the higher the degree of a station, the higher its connectivity and the more accessible it is. This translates into the stations capacity to increase the chance of receiving many passenger flows. Also, the average degree of a network shows, on average, how connected each node in the network is. Transport authorities are interested in this metric as it shows how accessible the nodes in a transport network are. For a given station i , with a i j as its indicator variable in the n × n adjacency matrix (which shows a k l = 1 if a connection exists between nodes i and j ) , the station degree d i and its network-wide average degree d are given as
d i = i N a i j
d = 1 N i N d i .
The nodes in the subway network had a minimum degree of 2 and a maximum degree of 14. Both the bus and integrated networks had a minimum degree of 1 each, and maximum degrees of 11 and 34, respectively. On comparing the three networks, the integrated network had the highest maximum degree of 34, which is a result of the integration of both bus and subway networks. Overall, the subway network had the highest average degree of 4.6. Both the bus and integrated networks also had high average degrees of 2.5 and 3.0, respectively. Since the stations in the integrated network show high degrees, we can infer that it is more connected and has higher access to various destinations in the network.
In this paper, we used a weighted network, where each link has a weight expressed in terms of the inversed distance between two stations connected by a common link. Hence, in order to identify the effect of distances and connections on station importance (in terms of degree), the weighted degree or station strength was analyzed by summing the weights of the links incident to the station in question [27,30,68,69,70,71]. For station i , its weighted degree s i = l N a i j w i j is a measure of how strong and directly connected it is in a network. The networks’ average weighted degree was also determined for comparison of the three networks using the formula;
s = 1 N i N s i .
A station with a higher weighted degree denotes one with high proximity. Due to its importance, it is expected to have high passenger flow volume. We observed a positive relationship between the average weighted degree measure and network size. We identified that the average weighted degree value of the integrated network was the highest and the subway network had the lowest. Hence, on average, the links in the integrated network are much shorter compared to those in the bus network. This observation shows that stations in the integrated network can offer the easy movement of people in terms of accessibility since they are more connected and closer to each other [27].
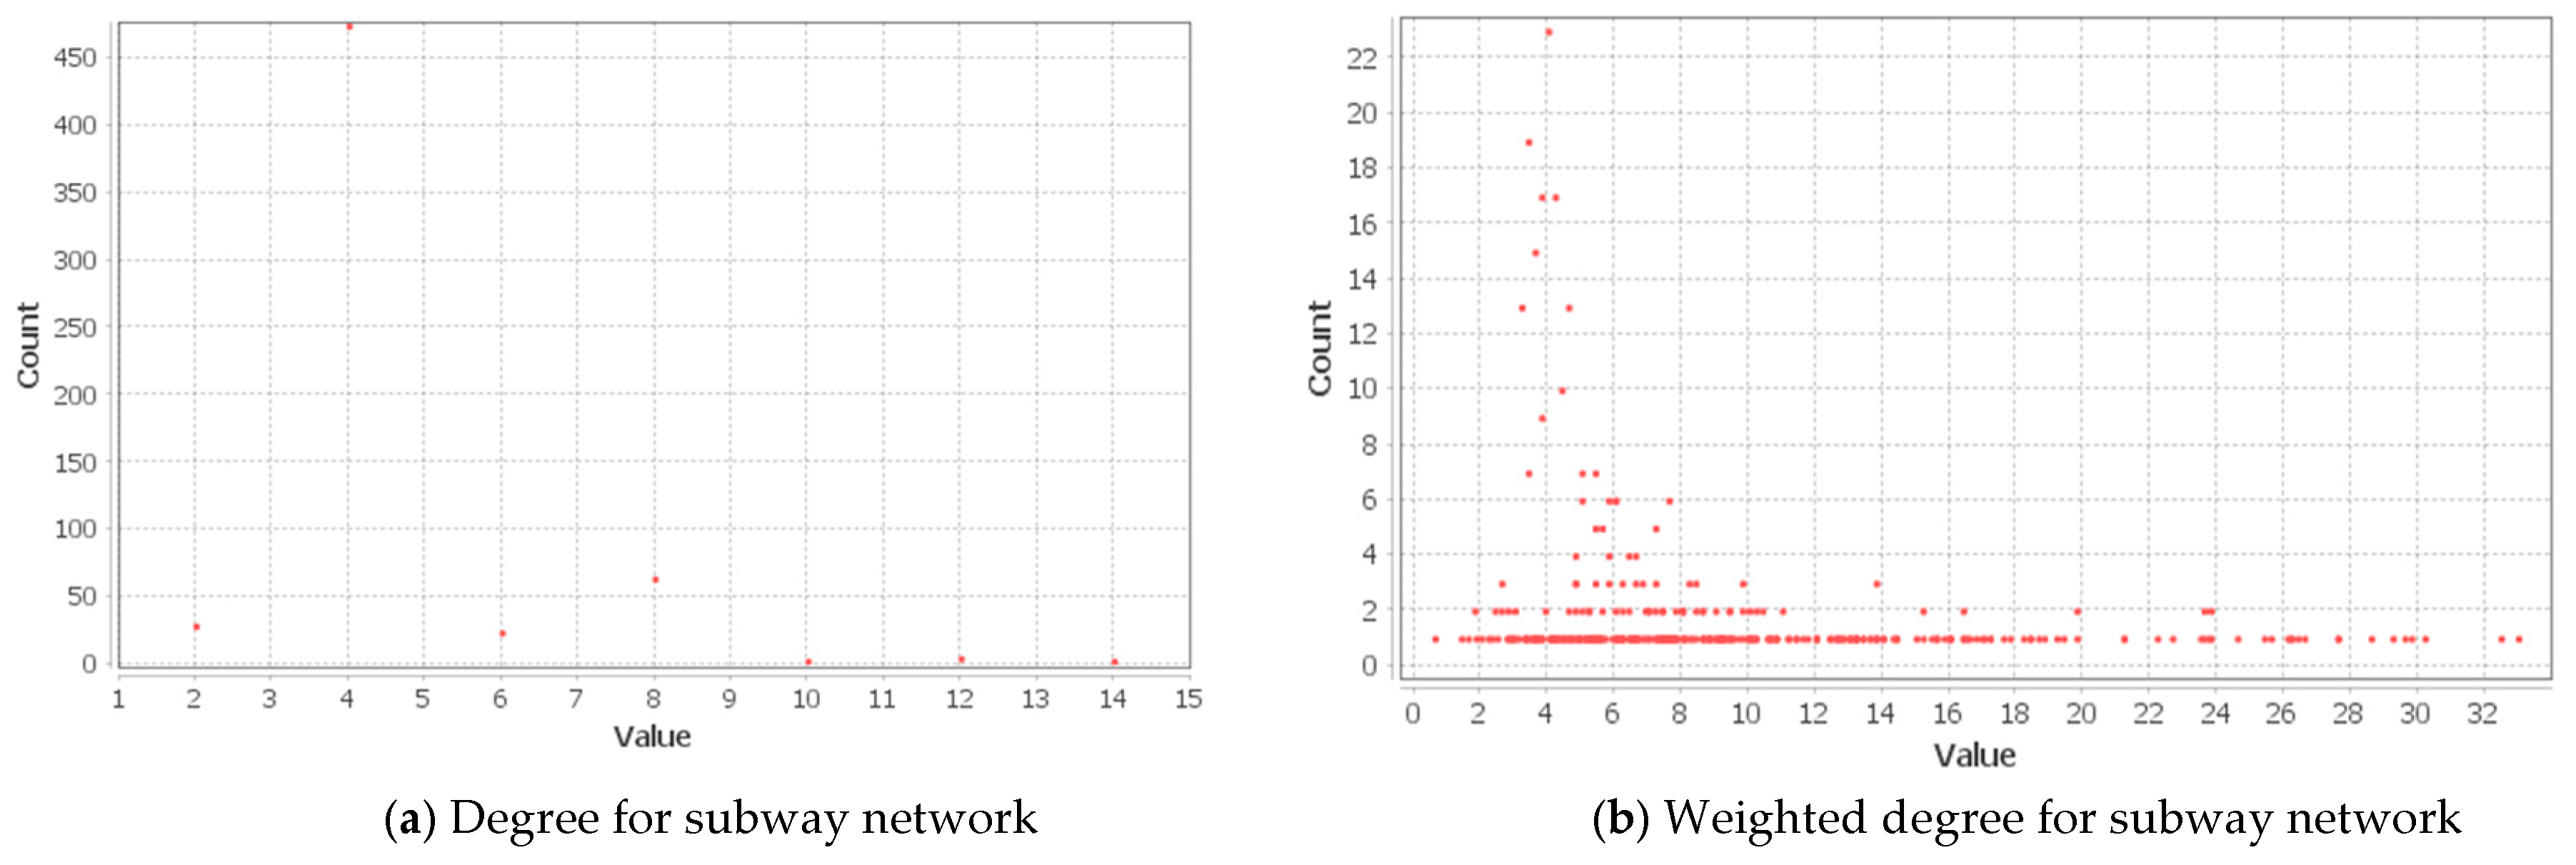
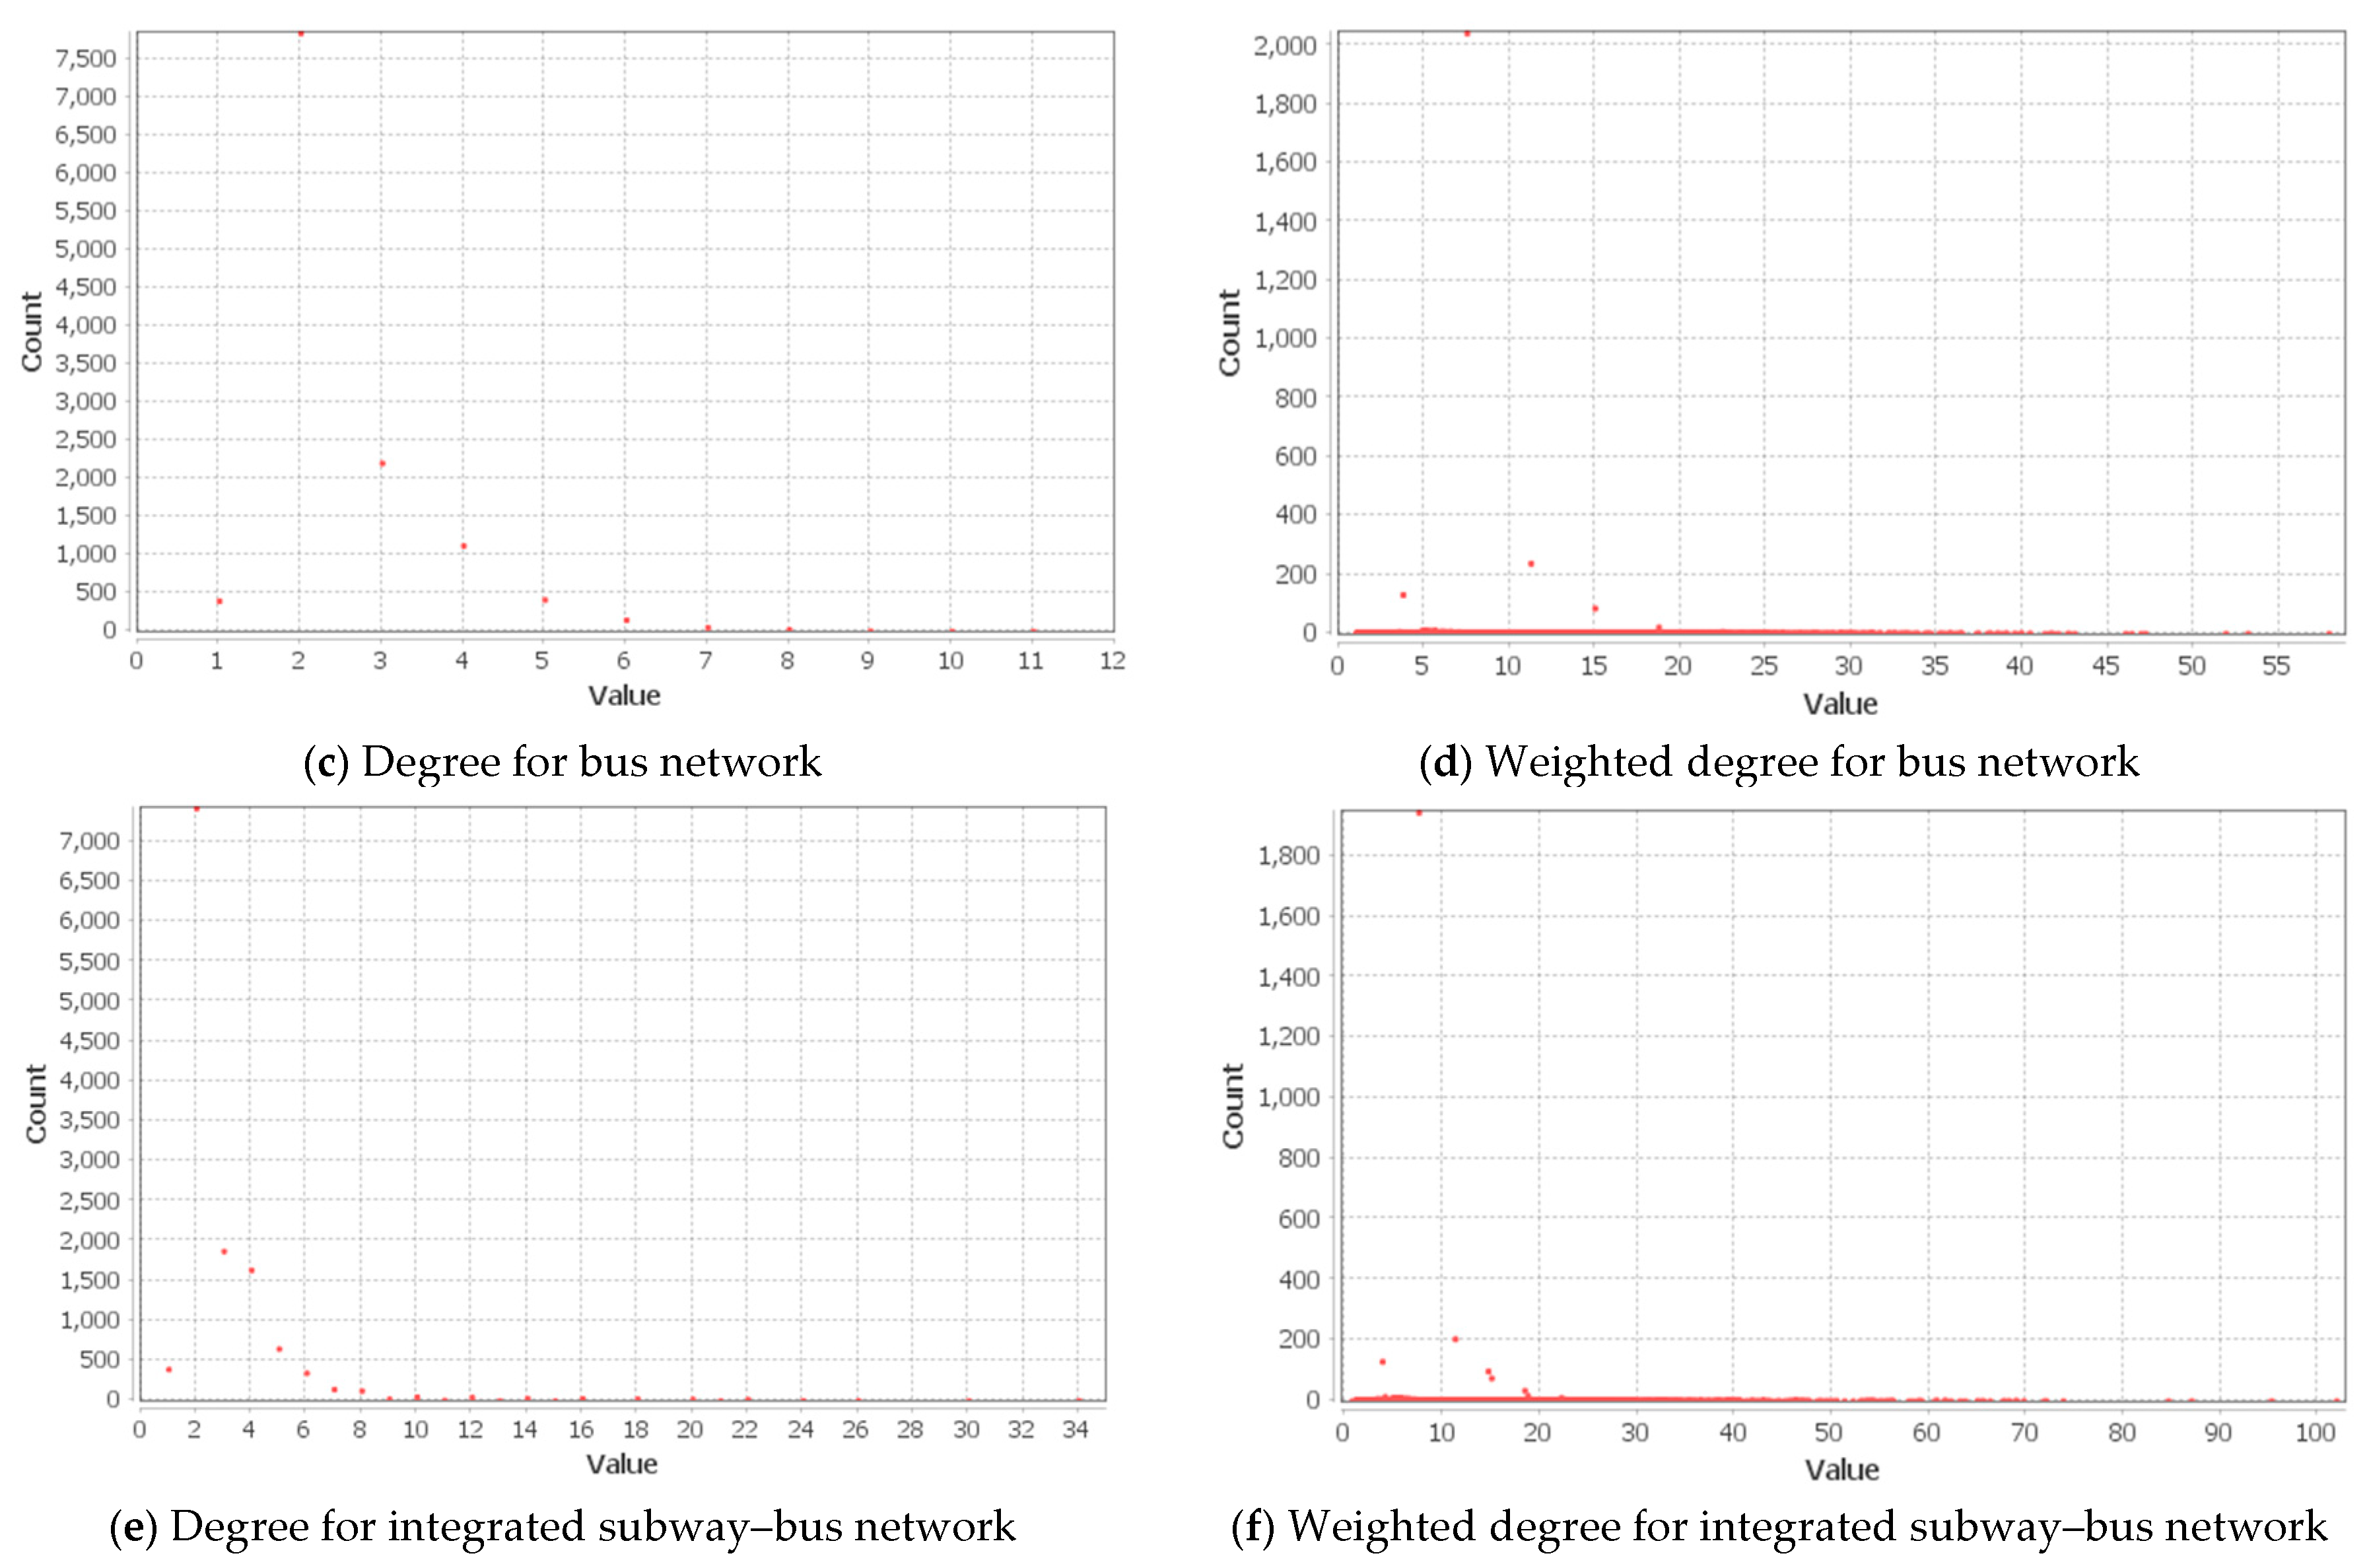
We further analyzed the degree measure by plotting and comparing the graphs of the frequency of all stations’ degrees in the three networks. The plots in Figure 4 show that both bus and integrated networks’ graphs are right skewed with modes of three. The subway network’s degree distribution, on the other hand, shows a mode of four, with few stations having high degrees due to its small size. It also shows that most of the subway stations have low degree values. The highest occurring degree value in both networks is two. However, due to the large network size, the degree distribution of the integrated network had the most extended tail, signifying a high chance of finding hubs (excessively high-degree stations) within the network. The graphs of the frequency of stations’ weighted degrees in all three networks are right-skewed, with most stations appearing to have weighted degree values from 0 to 20. The highest occurring weighted degree in the subway network is 3.8, and both bus and integrated networks have a weighted degree mode of 7.48. Similar trends were observed in the graphs for the degree values. Fewer stations having higher weighted degrees in integrated networks show that few stations have very high proximity. This observation affirms that integrating the networks will improve accessibility. The degree and weighted degree distributions of the subway, bus, and integrated networks are visualized in Figure 4.
The betweenness centrality measure shows how many times a station comes in between the shortest paths of stations within a network. Betweenness centrality C B for a station i on shortest paths connecting nodes l and m is defined as follows;
C B ( i ) = l < m g l m ( i ) g l m ( N 1 ) ( N 2 )
where g l m is the total number of shortest paths connecting nodes l and m , and g l m ( i ) is the number of these paths that go through station i . The numerator should be as high as possible to achieve a high betweenness centrality.
A public transportation facility with the highest centrality is an active player that serves as an important transfer point or connector to many regions within the transport network. Many flows will have to go through this station in order to reach other locations in the network. To make comparisons between networks with different sizes, we used the normalized form of the betweenness centrality [40]. From Table 5 below, the network with the lowest average betweenness centrality is the integrated network ( C B = 0.002 ) , and the system with the highest average betweenness centrality is the subway network ( C B = 0.032 ) . The bus network comes in between with an average betweenness of 0.003. The results show that the average betweenness centrality of stations in the SMA’s public transportation network decreases with increasing network size.
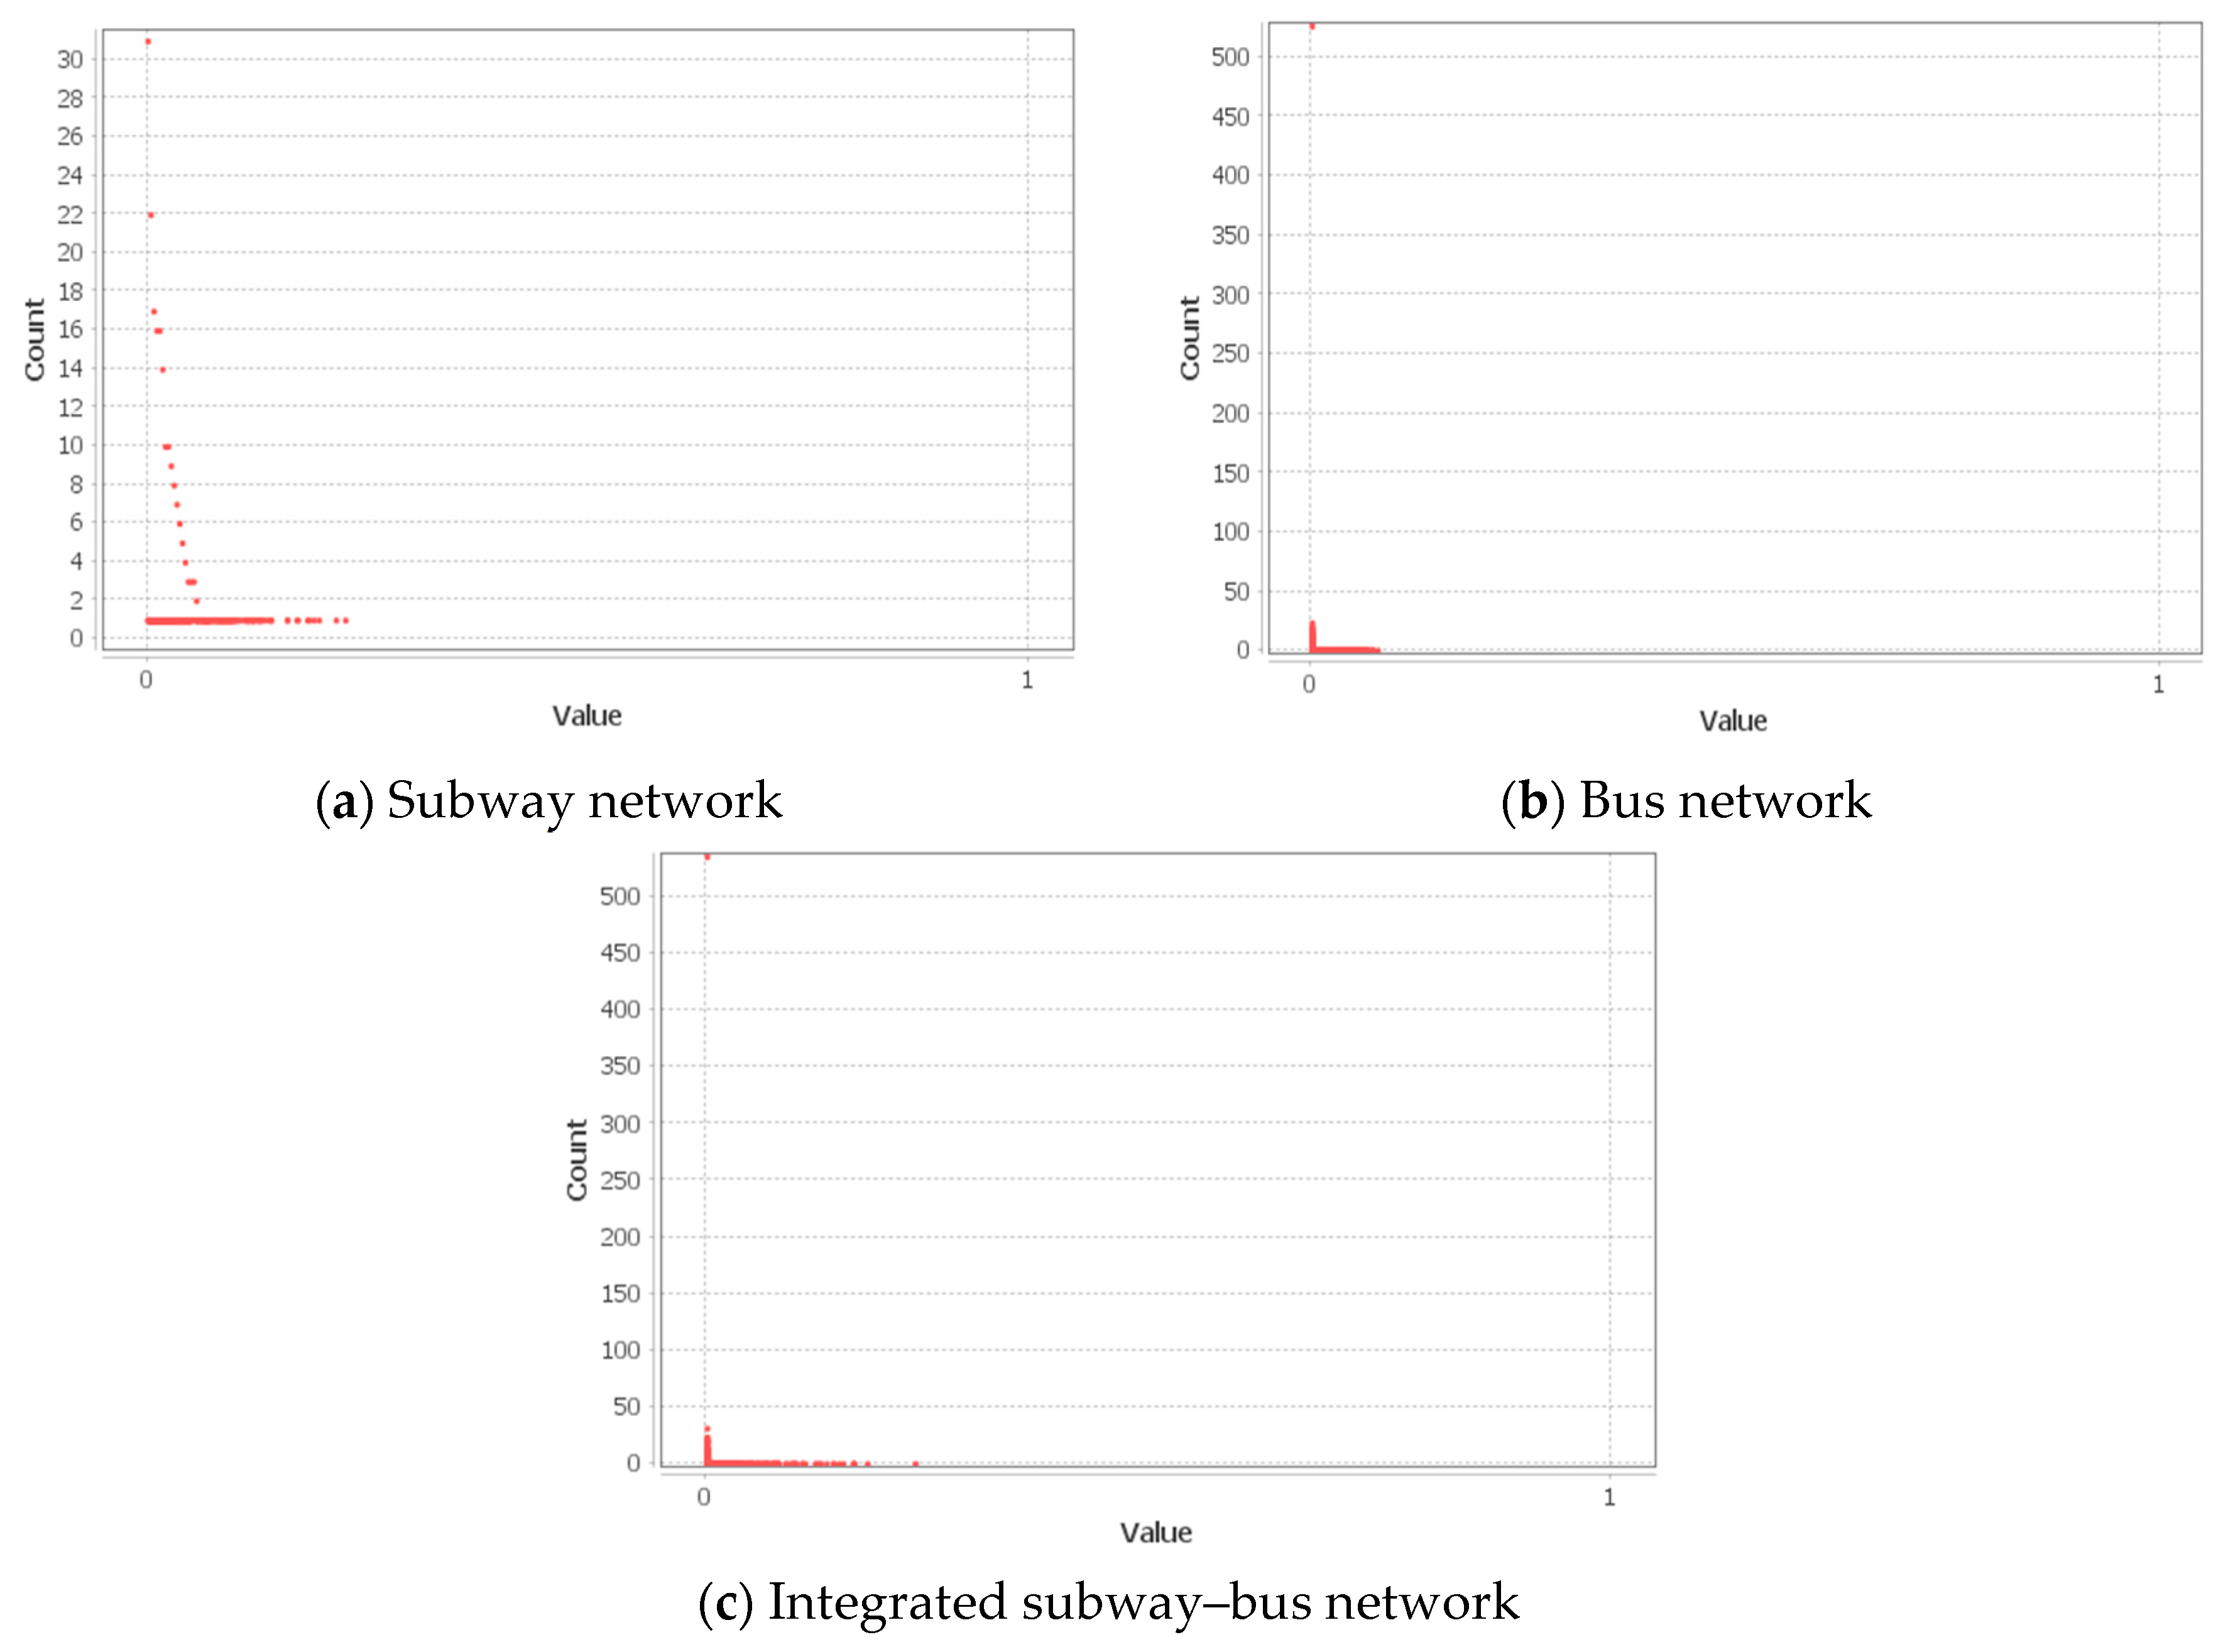
The distribution of the station betweenness centralities in the subway network, as seen in Figure 5, shows that many stations in the subway network have betweenness centrality of zero and there is a steep drop towards the right (right-skewed). In the bus and integrated networks, the points are clustered in the vicinity of the origin. Also, the subway network has 34% of its stations having a betweenness greater than the total average betweenness centrality, 23% of stations in the bus network had betweenness centralities higher than the average, and 17% of the stations in the integrated network have betweenness higher than the average. Since, on average, the betweenness centrality of the subway is higher than both bus and integrated networks, we can conclude that its stations are strategically placed and connect several regions in the network more effectively. Figure 5 below shows the betweenness centrality distributions for the subway, bus, and integrated networks.
The average distance from a given starting node i to all other nodes, known as closeness centrality C C , is defined by the equation:
C C ( i ) = ( N 1 ) l [ d i j ] 1
where d i j is the shortest distance between nodes i and j , and N is the number of stations in the network. Closeness centrality describes how easy and fast a station can be reached in terms of speed and frequency compared to other stations in a transport network. The idea is that the higher the closeness centrality of a station, the closer it is to other nodes and it takes the least number of steps to reach them.
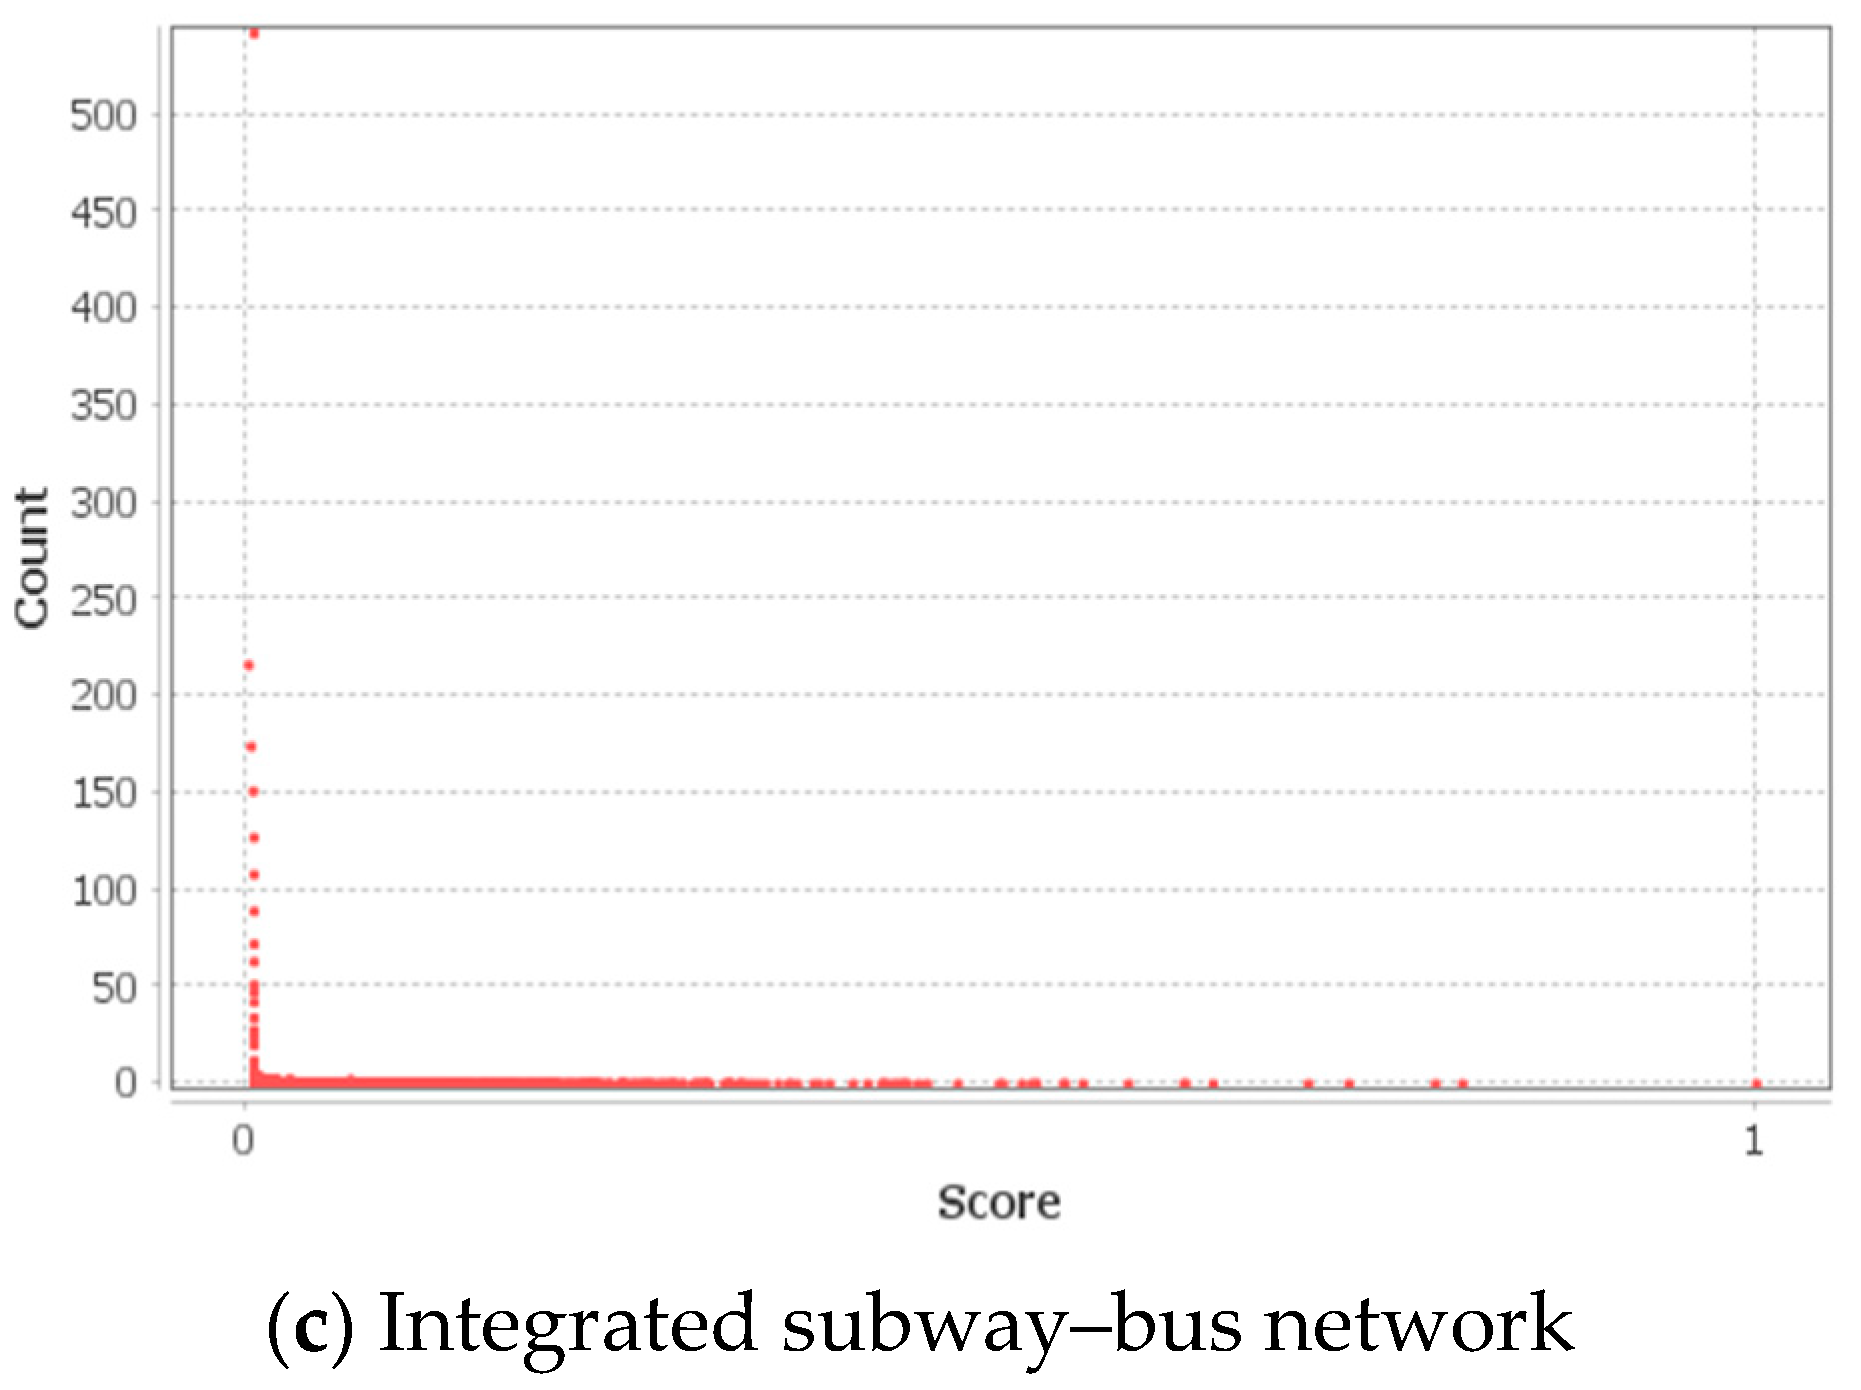
Normalized closeness centrality values in Table 5 above show that the integrated network has the highest average closeness centrality ( C C = 0.073 ) , followed by the bus network ( C C = 0.066 ) in the second place, and finally the subway network ( C C = 0.052 ) 
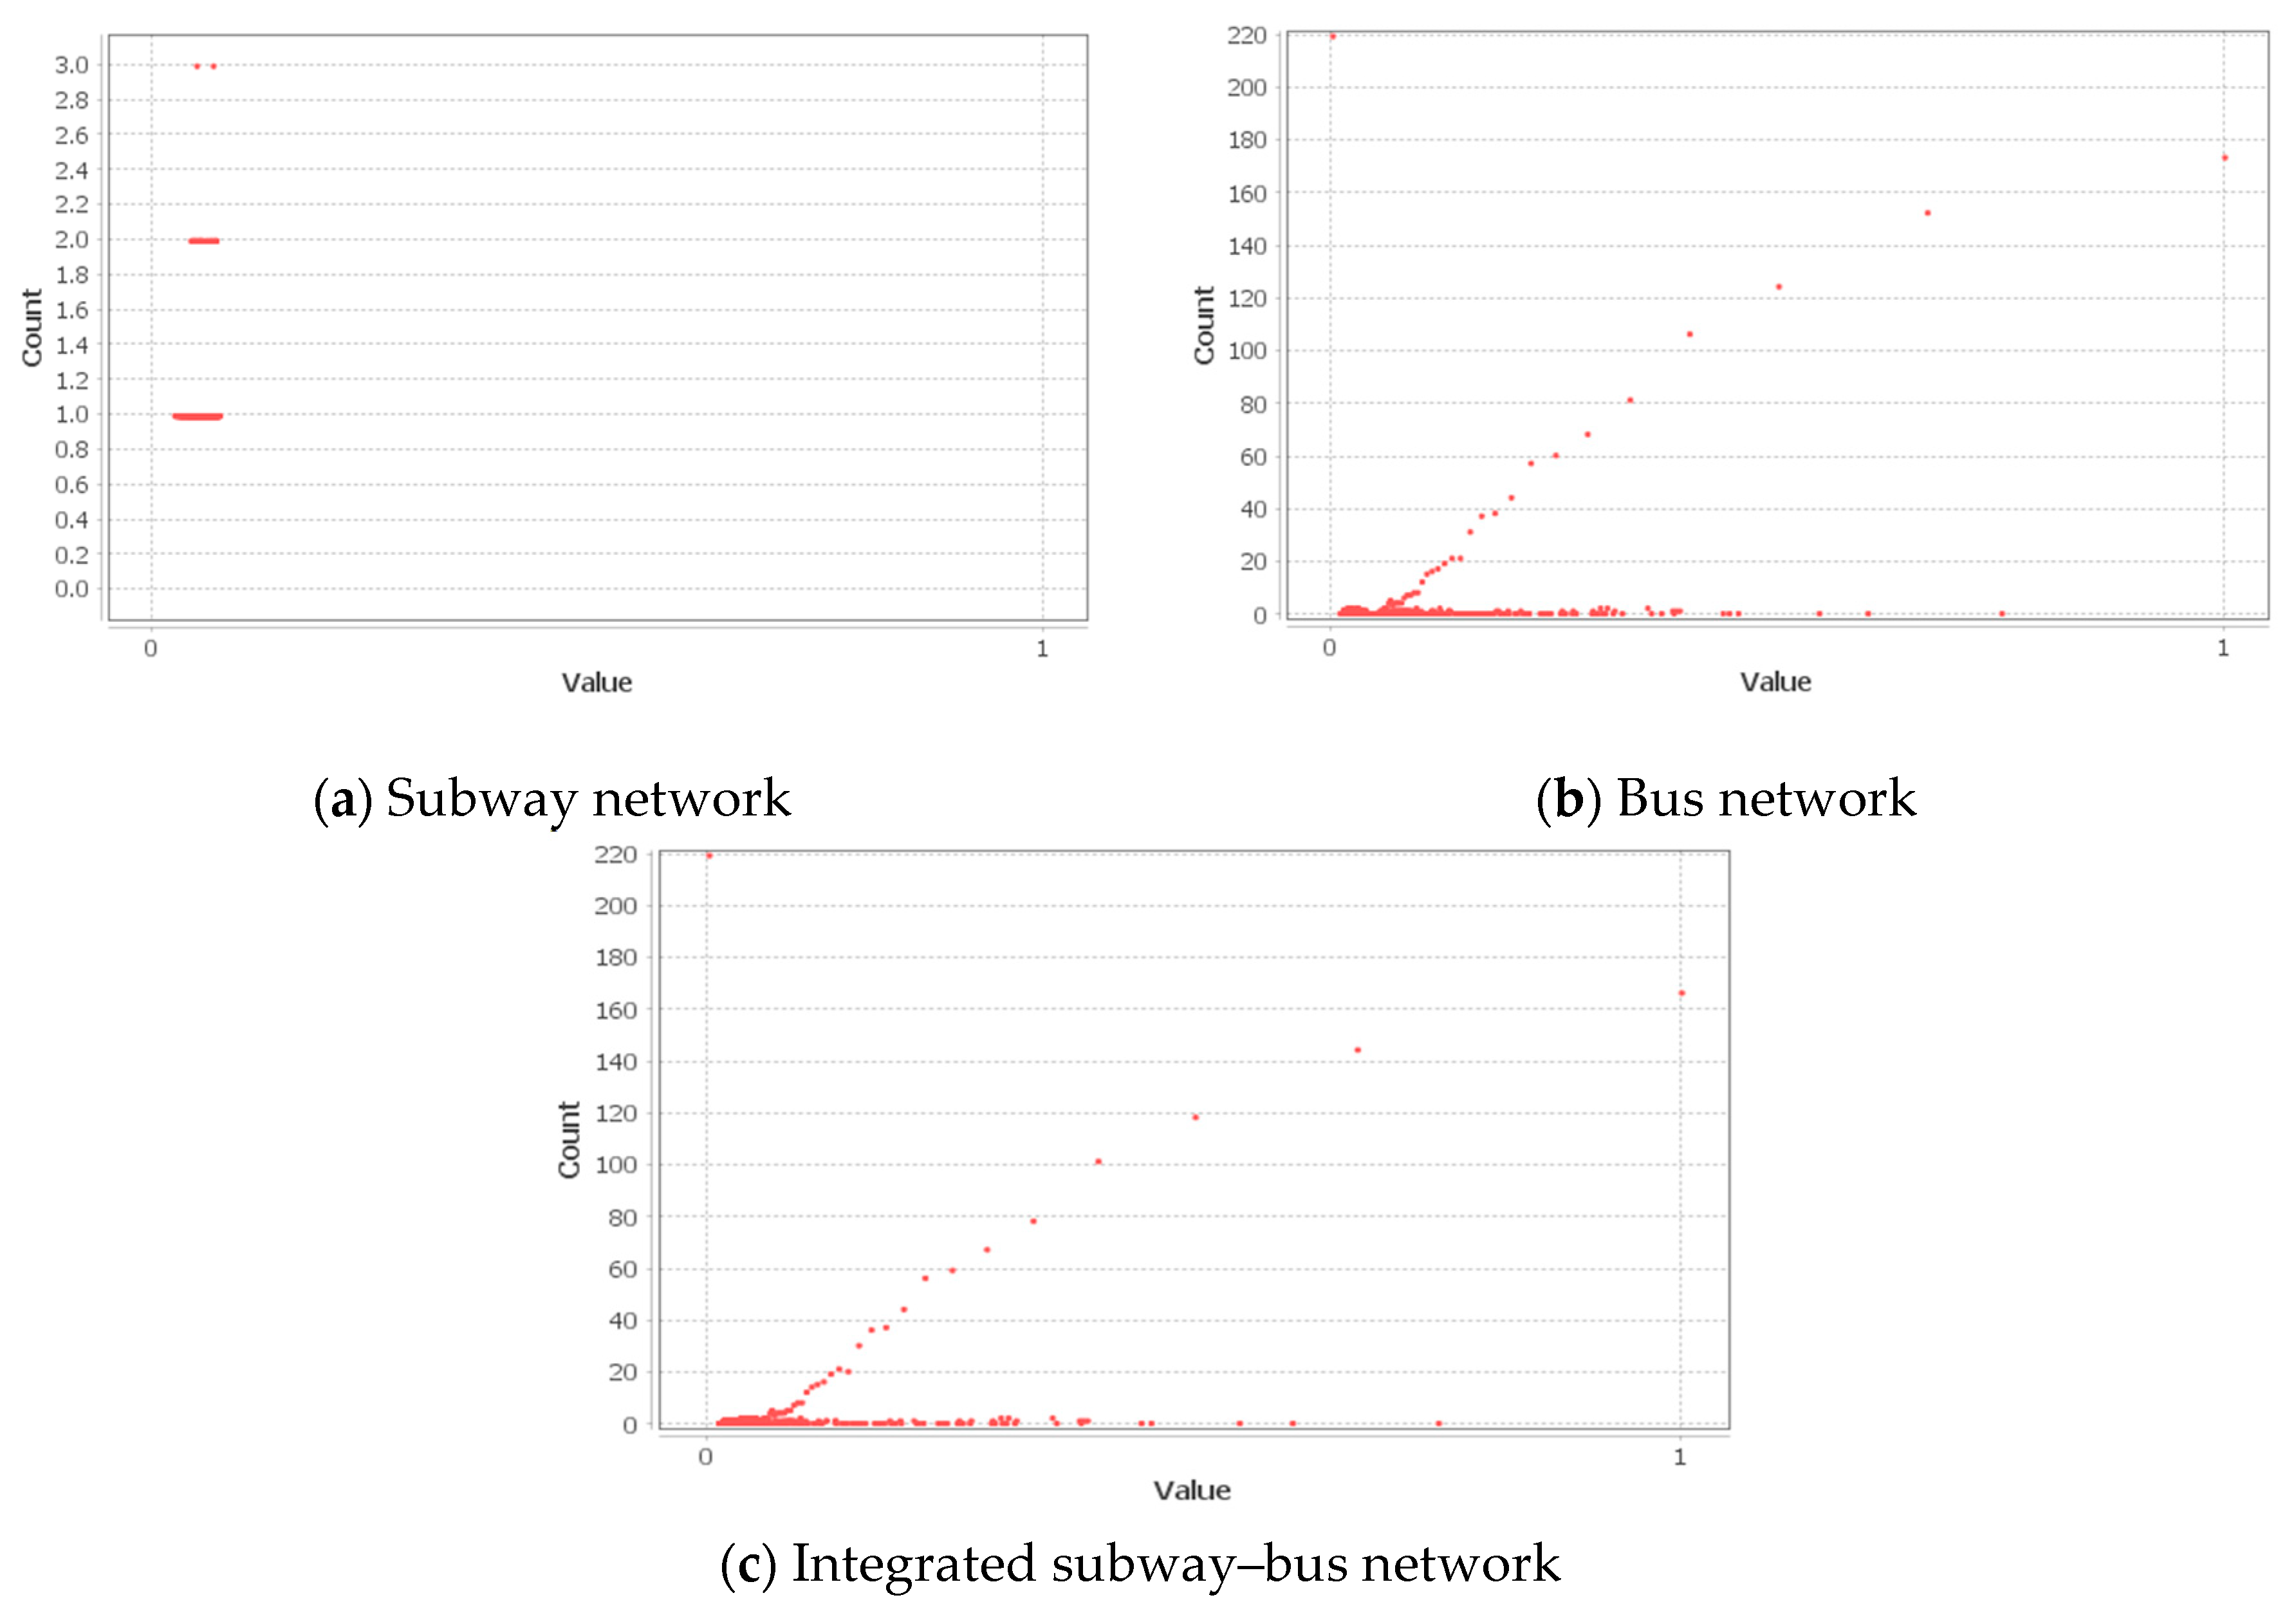
. A glance at the distribution of closeness centrality of stations visualized in Figure 6 also presents interesting observations.
The points in the subway networks distribution are dispersed away from the origin with a mode of 0.048, and many stations have very low closeness centralities. The most common closeness centrality value in both the bus and integrated networks is zero (0), showing a right-skewed distribution with their centrality values tapering slowly downwards, depicting that many stations have higher closeness centralities. The proportion of stations in the subway network with a closeness centrality score higher than the average is 49%. That of the bus and integrated networks are 12% and 10%, respectively.
Overall, the average closeness centrality metric trends of the three networks clearly illustrate that the average closeness centrality of stations in the SMA increases with network size. The observations show that movement from one station to another is easier and faster in the bus and integrated networks. Again, this shows that the structure of the subway network is improved to offer faster movements when it is combined with the bus network. Hence, employing integrated networks is imperative for making public transportation usage more time saving, efficient, and accessible. Graphs for closeness centrality distributions for the three networks are shown in Figure 6.
The eccentricity of a station e G captures the maximum distance between it and the farthest station from it, and the inverse of the eccentricity of a station is its eccentricity centrality metric [44]. Formally, if i is a station in a connected network G , and d ( i , j ) is the shortest path between stations i and j , then the eccentricity of station i , e G ( i ) is given as
e G ( i ) = m a x { d ( i , j ) } .
The reciprocal of eccentricity e G ( i ) of station i is its eccentricity centrality E G ( i ) :
E G ( i ) = 1 e G ( i ) .
As closeness centrality indicates how close a station is to all other stations in the transport network, eccentricity centrality shows how close the farthest station is away from a given station in a network. Thus, a station with a high eccentricity measure is a long way away from the farthest station from it, and a station with a high eccentricity centrality assumes high station proximity (very accessible). The eccentricity centrality values in Table 5 show that, on average, the maximum distances between the subway stations are short, making them very reachable. The integrated network follows in the second place, showing that integrating both bus and subway networks improves the accessibility of stations in the subway network.
We observed that there are several centrality measures that show the importance of stations by either the quantity of links incident on it (degree centrality), the sum of weights of the links incident on it (weighted degree or strength centrality), or based on the paths in the network (betweenness, closeness, and eccentricity centralities). Besides these measures, we consider the eigenvector centrality, whose underlying principle is based on the “quality” of its connections and not only the number of its adjacent stations [27,72]. As such, a station that is connected to a highly central station is more important than another station that is connected to a less important station.
For a graph G = ( N ,   E ) with k ,   l N and adjacency matrix A = ( a k l ) , the relative centrality score of station k can be formally expressed as the positive multiple of the sum of adjacent centralities:
C k = 1 λ l = 1 n a k l C l
where λ is the constant. By using matrix algebra, the above equation satisfies the eigenvector equation A C k = λ C l . C k is an eigenvector of λ if A C k is a scalar multiple of C k . As there are multiple eigenvectors, the value of C k that corresponds to the largest value of λ is the eigenvector centrality measure.
Again, as we want to compare centralities across different networks, we normalized the eigenvalue centrality values. From Table 5 above, a trend similar to that of the average betweenness centrality is observed in the case of the average eigenvector centrality. The average eigenvector centrality gradually decreased with the size of the network. Considering the subway network, which has 602 stations, the average eigenvector centrality measure was 0.11, followed by the bus network ( N = 12,271 ) , which had an average eigenvector centrality measure of 0.03. The integrated network, with the largest number of stations ( N = 12,873 ) , had the lowest eigenvalue centrality value of 0.02.
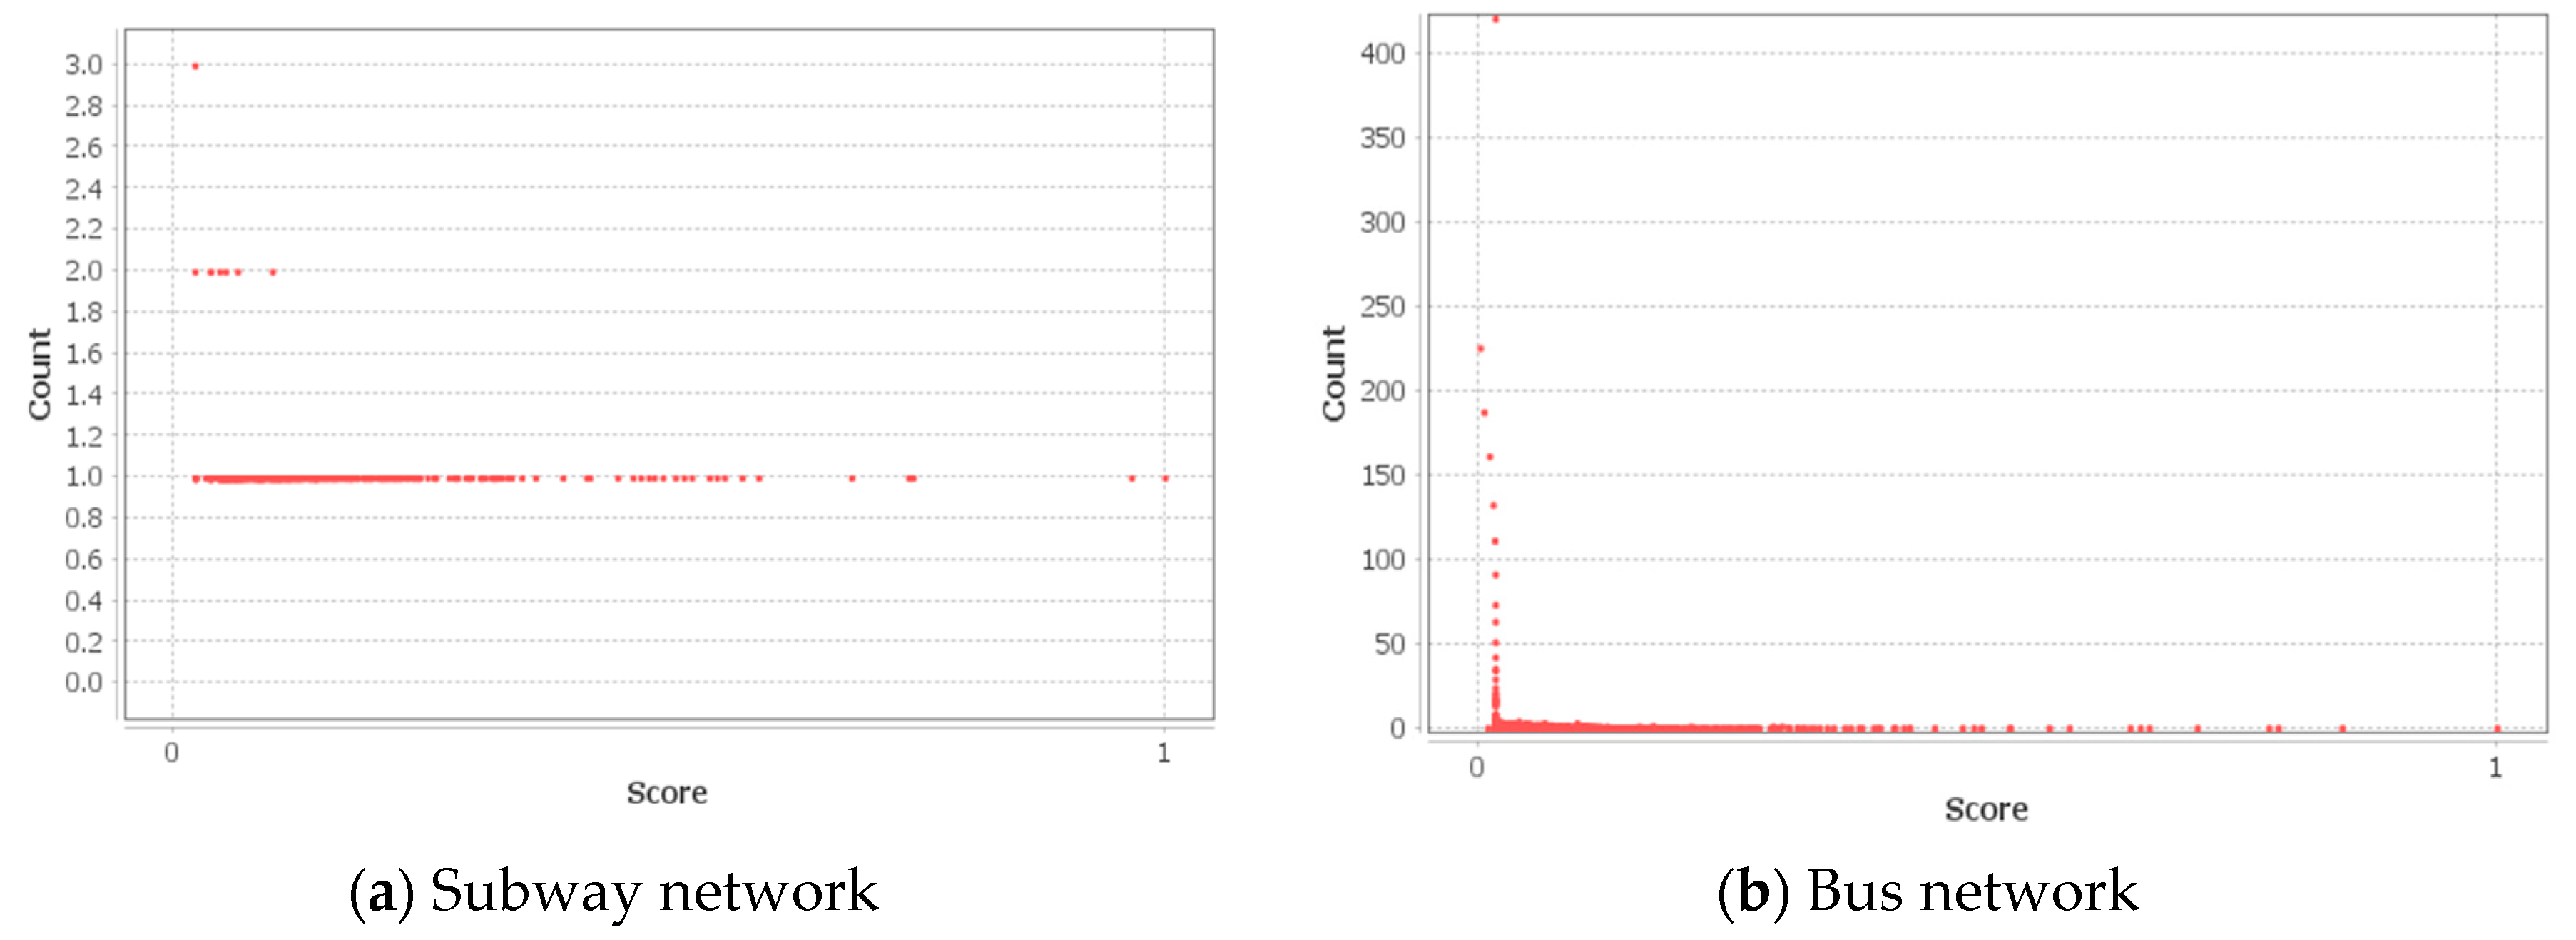
We proceeded with further analysis and noted that more than 70% of the stations in all the networks had eigenvector centralities less than their average values ( subway = 0.111 ,   bus = 0.035 ,   integrated = 0.019 ). That means less than 30% of stations in the networks were connected to highly central nodes. The eigenvector centrality distributions in the integrated network show that many stations clustered around the origin (mode = 0.003), meaning there are many stations connected with less important stations. A similar trend is observed in the bus network; however, the points seem a little bit more dispersed away from the origin (mode = 0.014). The eigenvector centrality distribution in the subway network shows that a high proportion of the stations in the subway network had higher centrality values (mode = 0.019). Figure 7 shows graphs of eigenvector centrality distributions of the subway, bus, and integrated networks.
From Table 6, we observed that on average, even though the bus network is bigger compared the subway network, the degree, weighted degree, and eigenvector centrality values for nodes that provide intermodal connections (bus to subway or subway to bus integrated networks) were higher compared to nodes with only bus to bus connections. Unlike the bus network, the much smaller subway network consists of many transfer stations, such that commuters can use other subway lines to reach their destination. The other metrics (closeness centrality and betweenness centrality were comparable. Hence, we can infer that the bus station importance (based on degree, weighted degree, and eigenvector centrality) increases to a larger extent when it is integrated with the subway network, since it benefits from the subway network’s abundant transfer opportunities. This result shows that connecting bus stops with subway stations further increases accessibility.
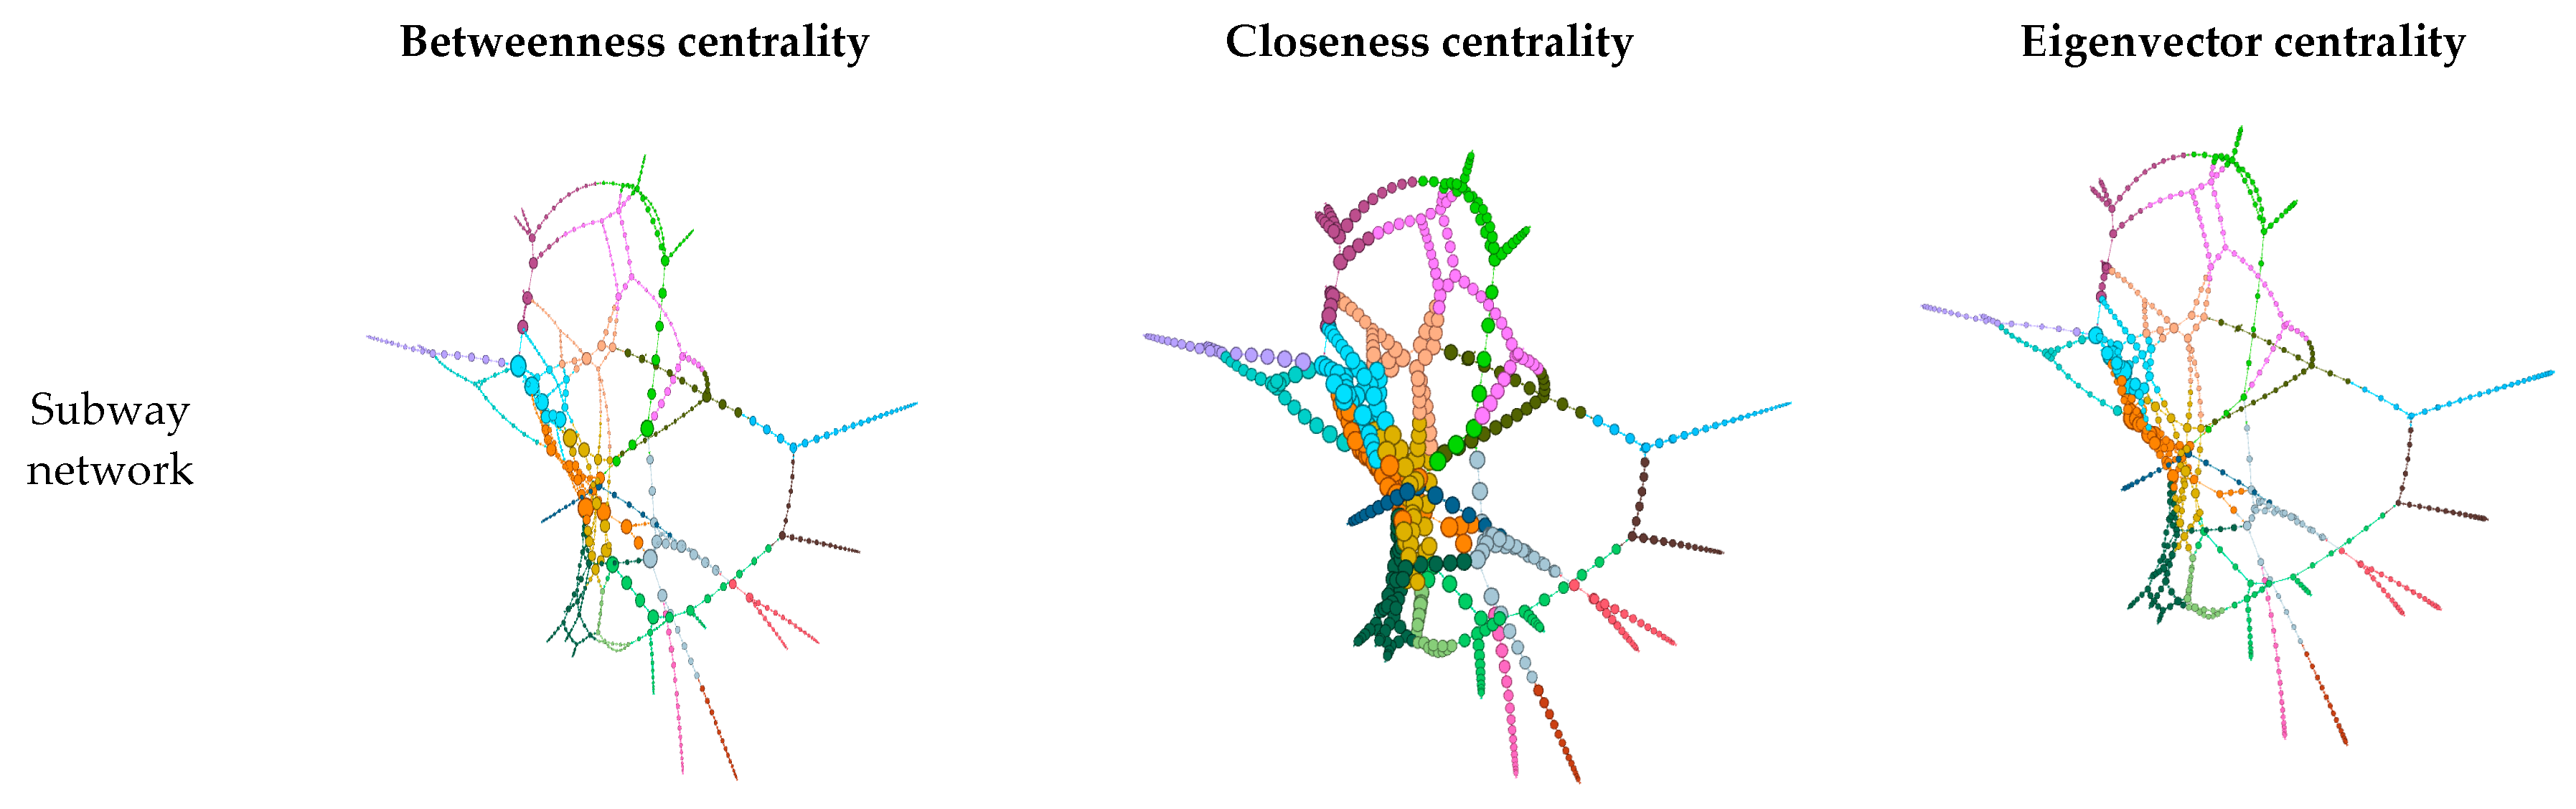
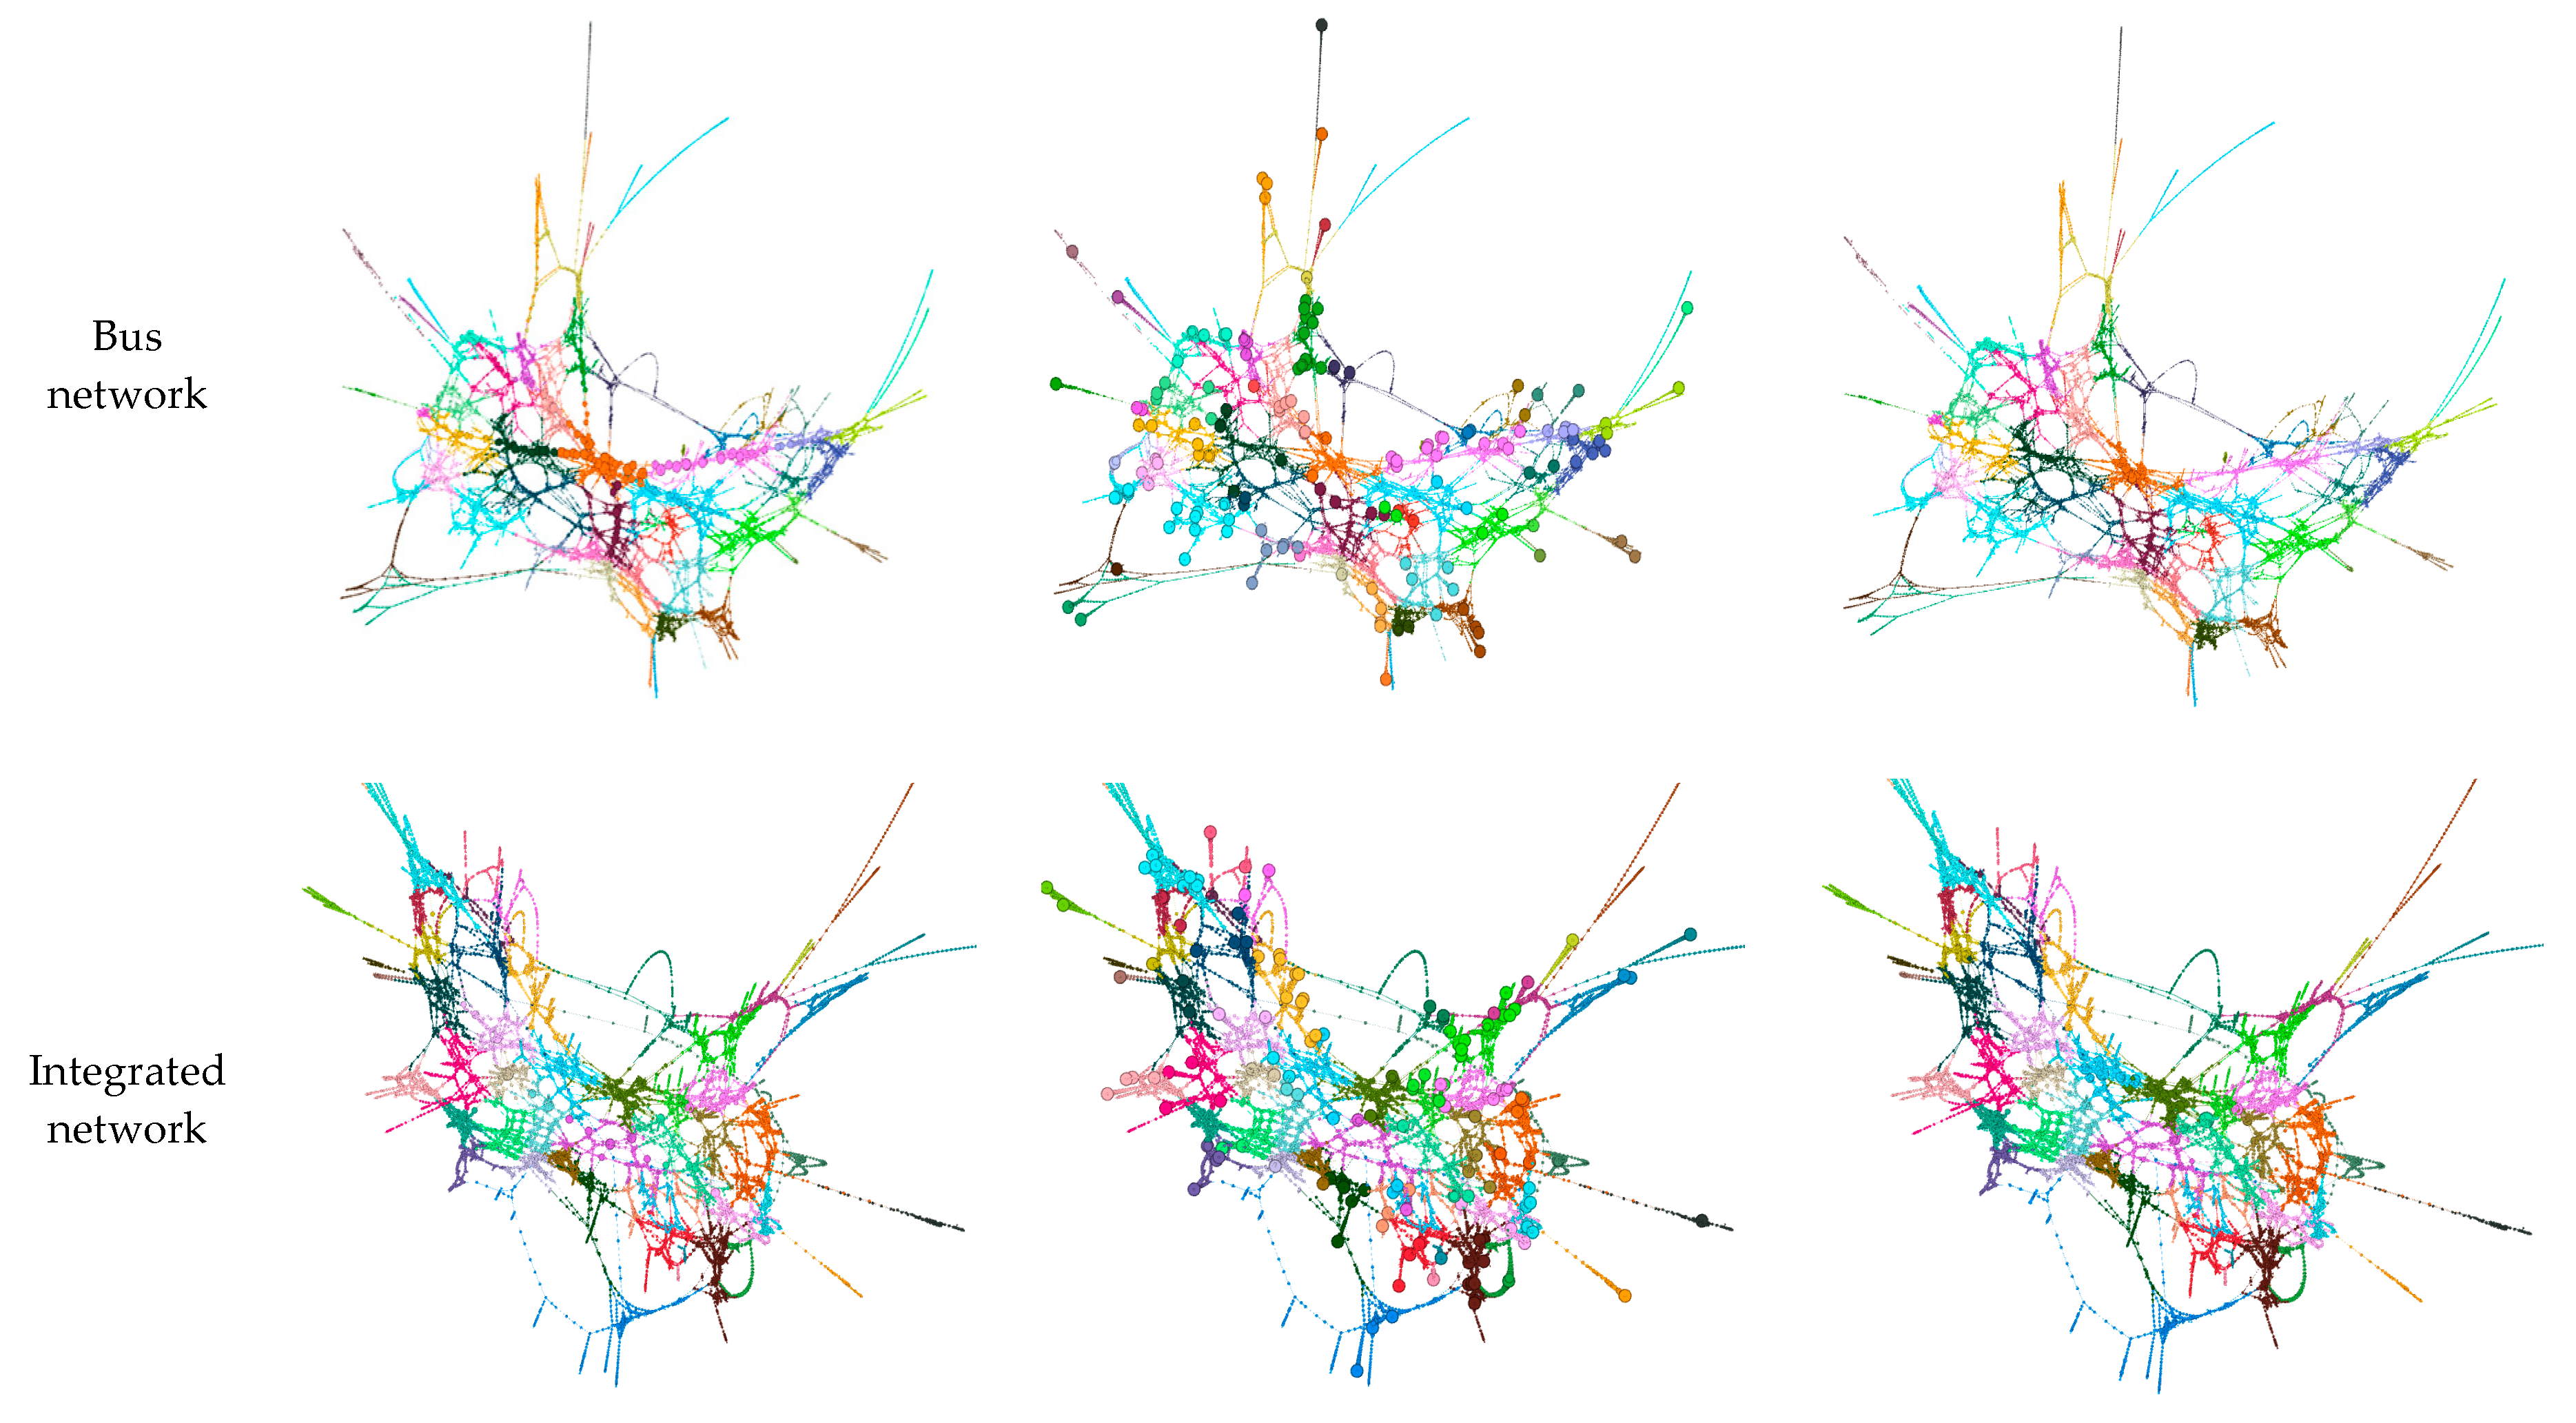
To show the spatial distribution of stations, the station centrality measures for the three network types studied in this research are plotted together with the community detection results in Figure 8. The colors represent the various communities in the network where the service providers mostly operate and the magnitude of the centrality measure can be seen in terms of the size of the stations. The larger the size of the station, the higher its centrality.

5. Discussion of Results

In this study, we applied graph-based measures to synthesize information on the public transportation networks in the SMA comprehensively. With this approach, we have examined both station-level properties and network-wide properties to determine how best the networks can be adjusted in order to increase their performance in terms of accessibility and resilience.
The large size of the integrated public transportation network and a diameter lower than that of the bus network signifies higher service coverage and accessibility to destinations owing to the high number of stations and connections created as a result of combining both bus and subway networks. Our findings were in line with previous research, which applied methods other than network topology. They mentioned that integrating networks increases connectivity and creates a more efficient public transportation system as it reduces travel time, provides for transfers between different transit modes, and provides high accessibility to various destinations [13,15,18,43].
Topological analysis of the networks indicates that the integrated network had the highest average local clustering coefficient, followed by the bus network. The result indicates that the stations in the integrated network are more clustered compared to the bus and subway networks. Hence, public transportation facilities are closely knitted together in integrated networks, which results in increased accessibility. The average path length of the subway network was the lowest (20.3035) due to its small size, however, the integrated network, which is the largest network, had an average path length that was almost as low as that of the subway network (28.1692). Unlike what we expected, further analysis proved that the public transportation networks in the SMA are not small-world networks; hence, they are less fault-tolerant and structurally not very robust to disruptions, as in the case of the London metro system [7].
In addition, we analyzed the scale-free properties of the networks (power law). Results showed that the degree distributions of only the bus network data followed the power law, implying that the bus network has few high-degree stations and hence will maintain its structure even when the network grows. The bus network could be more robust compared to the other transit networks considered in this study. However, it is worth noting that robust networks are more vulnerable to attacks.
When designing public transportation infrastructure, transport engineers may decide to consider certain constraints and tradeoffs between efficiency in terms of performance, economic gains, and transit resilience. As such, even though it is ideal to have public transportation networks exhibit small-world properties in terms of high clustering and low path lengths, it may not always be the case. Comparable insights can be drawn from the results obtained from the degree assortativity measure. As the stations in the networks are slightly assortative, low degree stations tend to pair with other low degree stations, making the networks less resilient.
Analysis of the degree of connectedness and modularity pointed to the fact that the integrated network has the highest zonal accessibility compared to the other networks studied in this paper. From our results, we identified that the degree of connectedness in the much larger integrated network was greater than the bus network and had dense connections within its communities. With higher nodal connections, coupled with a larger network, traveling within the integrated network would be relatively easier compared to the bus network. Our results are similar to those in the study conducted by Rubulotta et al. [42], which proved that high zonal accessibility could be achieved in well-connected networks.
Furthermore, analysis involving the centrality measures depicted that the integrated network is highly connected, accessible, and more robust. From the results of the degree, weighted degree, closeness, and eccentricity centralities, we identified the presence of highly connected hubs with higher proximity to other hubs in the integrated network compared to the others. However, the downside of the integrated network is that a few of the hubs are not strategically placed to achieve high betweenness and few of them are connected with other important hubs compared to the bus and subway networks. Analysis of the average centrality values indicates a decreasing relationship with network size, which is not in line with the study conducted by Derrible [39]. We can infer from the results that it is more convenient and easier to reach other stations when traveling in the integrated network compared to the bus network.

6. Conclusions and Future Work

To understand the network complexities associated with these urban transport systems, we analyzed topographical structures of public transportation networks commonly found in cities, namely subway, bus, and integrated transit networks, by employing graph-based methods. While previous studies predominantly focused on unimodal networks of either bus or subway, this study concentrated on performing an in-depth examination of the topological properties of an integrated urban public transportation network and compared its structure to those of the unimodal networks from which it was formed.
The result of this study provides new perspectives considering integrated public transportation systems, which can be resourceful for attaining efficient mobility in cities. In summary, our analysis directs us to arrive at the following conclusions;
  • Both bus and subway networks in the SMA have no small-world characteristics and even after integrating them, the resulting network did not show a small-world property. Also, only the bus network is a scale-free network, indicating the presence of highly connected hubs.
  • The average path length, the clustering coefficient, and the degree of connectivity of nodes (subway stations or bus stops) reflected the intensity of interconnectivity and improved accessibility within the integrated public transportation network.
  • The outcomes of the degree centrality, weighted degree centrality, closeness centrality, and eccentricity centrality show that, on average, the nodes (subway stations or bus stops) within the integrated network are easily reachable. The average betweenness and eigenvector centralities decreased with network size, meaning fewer public transportation nodes are seen to have high centrality values. Hence, averagely, the stations in the subway network were strategically located in the network and effectively linked several nodes together.
  • From the average network centrality values, we identified that the subway network has a high effect on network integration, which highlights the need to connect bus stops with subway stations to obtain the full benefits of public transportation network integration.
The findings of this study offer evidence to show that the spatial structures of unimodal urban public transportation networks are further improved when they are integrated. The SMA’s public transportation network designers focused on increasing accessibility and interconnectedness of the networks by integrating them; however, it also shows low robustness to disruptions. It is imperative to consider the resilience of the public transportation system as South Korea is prone to disasters that may occur due to either typhoons, earthquakes, or tsunamis [72]. These natural occurrences, together with planned network attacks, may lead to roadblocks and render some bus and or subway stations unusable.
For a city with a highly established urban and unique organization like that of the SMA, which already has many public transportation facilities in the integrated network, policymakers and transportation planners should concentrate on allocating funds and other resources to strategically positioning nodes and creating more links within the public transportation network. Restructuring and optimizing urban public transportation networks improves the attractiveness of the system and increases patronage. Besides, optimizing the urban networks reduces the average path length and increases the average betweenness and eigenvector centralities of the nodes (subway stations or bus stops) in the integrated network. It will make the network more resilient to disruptions and more well-connected to the stations on the periphery of the network [73].
Our proposed analysis framework offers a means for understanding the public transportation system in SMA, and to justify the need to identify strategies for increasing the system resilience by making it more fault tolerant. A key limitation to this study is that dynamic topology analysis of the networks was not estimated since daily ridership information of every link was not measured. Future studies will consider studying the functional vulnerability analysis of link and public transportation facility failures of the integrated system to provide further insights into the overall resilience of the network during planned or targeted link or node attacks. It would also be interesting to include passenger travel variables to study the dynamical properties of the integrated network. Such analyses would be critical to transportation planners as it will help them identify critical links in the urban network, whose disruption will profoundly affect public transportation operations.
Finally, given that integrated public transportation networks have become a global trend since improved public transport has proved to be a viable alternative for private cars in most countries [12], we believe that it can be a universal solution. However, for future studies, we plan to investigate the hypothesis that integration causes no ineffectiveness in transportation systems to come to a scientifically acceptable conclusion as to whether public transportation network integration is a universal solution or not.

Author Contributions

Conceptualization, J.H.; methodology, J.H. and R.T.; software, J.H. and R.T.; validation, S.L.; formal analysis, J.H. and R.T.; data curation, J.H.; writing—original draft preparation, J.H. and R.T.; writing—review and editing, D.P. and S.L.; visualization, R.T.; supervision, D.P.; funding acquisition, J.H.

Funding

This work was supported by the National Research Foundation of Korea (NRF) grant funded by the Korean government (MSIT) (No. 2017R1C1B2010175).

Conflicts of Interest

The authors declare that there are no conflict of interest regarding the publication of this paper.

References

  1. Sutton, J.C. GIS applications in transit planning and operations: A review of current practice, effective applications and challenges in the USA. Transp. Plan. Technol. 2005, 28, 237–250. [Google Scholar] [CrossRef]
  2. Batool, K.; Niazi, M.A. Towards a methodology for validation of centrality measures in complex networks. PLoS ONE 2014, 9, e90283. [Google Scholar] [CrossRef] [PubMed]
  3. Yu, W.; Chen, J.; Yan, X. Space‒time evolution analysis of the Nanjing metro network based on a complex network. Sustainability 2019, 11, 523. [Google Scholar] [CrossRef]
  4. de Bona, A.A.; Fonseca, K.V.O.; Rosa, M.O.; Lüders, R.; Delgado, M.R.B.S. Analysis of public bus transportation of a Brazilian city based on the theory of complex networks using the P-Space. Math. Probl. Eng. 2016, 2016, 3898762. [Google Scholar] [CrossRef]
  5. Chatterjee, A.; Manohar, M.; Ramadurai, G. Statistical analysis of bus networks in India. PLoS ONE 2016, 11, e0168478. [Google Scholar] [CrossRef] [PubMed]
  6. Shanmukhappa, T.; Ho, I.W.H.; Tse, C.K. Bus transport network in Hong Kong: Scale-free or not? In Proceedings of the International Symposium on Nonlinear Theory and Its Applications, Yugawara, Japan, 27–30 November 2016.
  7. Chopra, S.S.; Dillon, T.; Bilec, M.M.; Khanna, V. A network-based framework for assessing infrastructure resilience: A case study of the London metro system. J. R. Soc. Interface 2016, 13, 20160113. [Google Scholar] [CrossRef] [PubMed]
  8. Bell, D.C.; Atkinson, J.S.; Carlson, J.W. Centrality measures for disease transmission networks. Soc. Netw. 1999, 21, 1–21. [Google Scholar] [CrossRef]
  9. Landherr, A.; Friedl, B.; Heidemann, J. A critical review of centrality measures in social networks. Bus. Inf. Syst. Eng. 2010, 2, 371–385. [Google Scholar] [CrossRef]
  10. Veres, P.; Bányai, T.; Illés, B. Intelligent transportation systems to support production logistics. In Vehicle and Automotive Engineering; Jarmai, K., Bollo, B., Eds.; Springer: Cham, Switzerland, 2017; pp. 245–256. [Google Scholar]
  11. Wang, J.; Jiang, C.; Zhang, K.; Quek, T.Q.; Ren, Y.; Hanzo, L. Vehicular sensing networks in a smart city: Principles, technologies and applications. IEEE Wirel. Commun. 2017, 25, 122–132. [Google Scholar] [CrossRef]
  12. Errampalli, M.; Patil, K.S.; Prasad, C.S.R.K. Evaluation of integration between public transportation modes by developing sustainability index for Indian cities. Case Stud. Transp. Policy 2018. [Google Scholar] [CrossRef]
  13. Geurs, K.T.; La Paix, L.; van Weperen, S. A multi-modal network approach to model public transport accessibility impacts of bicycle-train integration policies. Eur. Transp. Res. Rev. 2016, 8, 25. [Google Scholar] [CrossRef] [Green Version]
  14. Shi, J.; Wen, S.; Zhao, X.; Wu, G. Sustainable development of urban rail transit networks: A vulnerability perspective. Sustainability 2019, 11, 1335. [Google Scholar] [CrossRef]
  15. Aziz, A.; Nawaz, M.S.; Nadeem, M.; Afzal, L. Examining suitability of the integrated public transport system: A case study of Lahore. Transp. Res. Part A Policy Pract. 2018, 117, 13–25. [Google Scholar] [CrossRef]
  16. One Card Fits All: Integrated Public Transport Fare System. Available online: https://www.seoulsolution.kr/en/content/one-card-fits-all-integrated-public-transport-fare-system (accessed on 25 August 2019).
  17. Integrated Public Transport Systems Make Travel Easier and More Affordable. Available online: http://www.worldbank.org/en/news/press-release/2015/04/07/integrated-public-transport-systems-make-travel-easier-and-more-affordable (accessed on 17 June 2019).
  18. Pucher, J.; Park, H.; Kim, M.H.; Song, J. Public transport reforms in Seoul: Innovations motivated by funding crisis. J. Public Transp. 2005, 8, 41–62. [Google Scholar] [CrossRef]
  19. Zahedi, Z.; Mawengkang, H.; Masri, M.; Ramon, H.; Putri, Y.M. Mathematical fallacies and applications of graph theory in electrical engineering. In Journal of Physics: Conference Series; IOP Publishing: Bristol, UK, 2019; Volume 1255. [Google Scholar]
  20. Black, W.R. Sustainable transportation: A US perspective. J. Transp. Geogr. 1996, 4, 151–159. [Google Scholar] [CrossRef]
  21. Hong, J.Y. Spatio-Temporal Models Incorporating Network Topology Measures for Pedestrian Exposure Estimation. Ph.D. Thesis, The Pennsylvania State University, State College, PA, USA, 2015. [Google Scholar]
  22. Lin, J.; Ban, Y. Complex network topology of transportation systems. Transp. Rev. 2013, 33, 658–685. [Google Scholar] [CrossRef]
  23. Bae, J.; Kim, S. Identifying and ranking influential spreaders in complex networks by neighborhood coreness. Physica A 2014, 395, 549–559. [Google Scholar] [CrossRef]
  24. Liu, J.G.; Ren, Z.M.; Guo, Q. Ranking the spreading influence in complex networks. Physica A 2013, 392, 4154–4159. [Google Scholar] [CrossRef] [Green Version]
  25. Chen, D.; Lü, L.; Shang, M.S.; Zhang, Y.C.; Zhou, T. Identifying influential nodes in complex networks. Physica A 2012, 391, 1777–1787. [Google Scholar] [CrossRef] [Green Version]
  26. Kitsak, M.; Gallos, L.K.; Havlin, S.; Liljeros, F.; Muchnik, L.; Stanley, H.E.; Makse, H.A. Identification of influential spreaders in complex networks. Nat. Phys. 2010, 6, 888–893. [Google Scholar] [CrossRef] [Green Version]
  27. Soh, H.; Lim, S.; Zhang, T.; Fu, X.; Lee, G.K.K.; Hung, T.G.G.; Di, P.; Prakasam, S.; Wong, L. Weighted complex network analysis of travel routes on the Singapore public transportation system. Physica A 2010, 389, 5852–5863. [Google Scholar] [CrossRef]
  28. Zhang, X.; Li, W.; Deng, J.; Wang, T. Research on Hub node identification of the public transport network of Guilin based on complex network theory. In CICTP 2014: Safe, Smart, and Sustainable Multimodal Transportation Systems; Ma, J., Pan, D., Huang, H., Yin, Y., Eds.; American Society of Civil Engineers: Reston, VA, USA, 2014; pp. 1302–1309. [Google Scholar]
  29. Mishra, S.; Welch, T.F.; Jha, M.K. Performance indicators for public transit connectivity in multi-modal transportation networks. Transp. Res. A Policy Pract. 2012, 46, 1066–1085. [Google Scholar] [CrossRef]
  30. Zhang, L.; Lu, J.; Fu, B.B.; Li, S.B. Dynamics analysis for the hour-scale based time-varying characteristic of topology complexity in a weighted urban rail transit network. Physica A 2019, 527, 121280. [Google Scholar] [CrossRef]
  31. Rommel, J. Topological Analysis of the Evolution of Public Transport Networks. Master’s Thesis, KTH Royal Institute of Technology, Stockholm, Sweden, 2014. [Google Scholar]
  32. Humphries, M.D.; Gurney, K. Network ‘small-world-ness’: A quantitative method for determining canonical network equivalence. PLoS ONE 2008, 3, e0002051. [Google Scholar] [CrossRef]
  33. Wu, J.; Gao, Z.; Sun, H.; Huang, H. Urban transit system as a scale-free network. Mod. Phys. Lett. B 2004, 18, 1043–1049. [Google Scholar] [CrossRef]
  34. Scheurer, J.; Porta, S. Centrality and connectivity in public transport networks and their significance for transport sustainability in cities. In World Planning Schools Congress, Global Planning Association Education Network; GPEAN: Rio de Janeiro, Brazil, 2006. [Google Scholar]
  35. Tsiotas, D.; Polyzos, S. Introducing a new centrality measure from the transportation network analysis in Greece. Ann. Oper. Res. 2015, 227, 93–117. [Google Scholar] [CrossRef]
  36. Cheng, Y.Y.; Lee, R.K.W.; Lim, E.P.; Zhu, F. Measuring centralities for transportation networks beyond structures. In Applications of Social Media and Social Network Analysis; Kazlenko, P., Chawla, N., Eds.; Springer International Publishing AG: Cham, Switzerland, 2015; pp. 23–39. [Google Scholar]
  37. Liu, J.; Xiong, Q.; Shi, W.; Shi, X.; Wang, K. Evaluating the importance of nodes in complex networks. Physica A 2016, 452, 209–219. [Google Scholar] [CrossRef] [Green Version]
  38. Du, Y.; Gao, C.; Hu, Y.; Mahadevan, S.; Deng, Y. A new method of identifying influential nodes in complex networks based on TOPSIS. Physica A 2014, 399, 57–69. [Google Scholar] [CrossRef]
  39. Derrible, S. Network centrality of metro systems. PLoS ONE 2012, 7, e40575. [Google Scholar] [CrossRef]
  40. Chen, A.; Yang, C.; Kongsomsaksakul, S.; Lee, M. Network-based accessibility measures for vulnerability analysis of degradable transportation networks. Netw. Spat. Econ. 2007, 7, 241–256. [Google Scholar] [CrossRef]
  41. Caschili, S.; de Montis, A. Accessibility and complex network analysis of the US commuting system. Cities 2013, 30, 4–17. [Google Scholar] [CrossRef]
  42. Rubulotta, E.; Ignaccolo, M.; Inturri, G.; Rofè, Y. Accessibility and centrality for sustainable mobility: Regional planning case study. J. Urban Plan. Dev. 2012, 139, 115–132. [Google Scholar] [CrossRef]
  43. Dash, S.P. BRT System: An approach for sustainable public transport system for Mangalore city. J. Civ. Eng. Environ. Technol. 2018, 4, 192–197. [Google Scholar]
  44. Cao, W.; Feng, X.; Zhang, H. The structural and spatial properties of the high-speed railway network in China: A complex network perspective. J. Rail Transp. Plan. Manag. 2019, 9, 46–56. [Google Scholar] [CrossRef]
  45. Lu, Q.C.; Lin, S. Vulnerability analysis of urban rail transit network within multi-modal. Sustainability 2019, 11, 2109. [Google Scholar] [CrossRef]
  46. Cats, O.; Krishnakumari, P.; Tundulyasaree, K. Rail network robustness: The role of rapid development and a polycentric structure in withstanding random and targeted attacks. In Proceedings of the Transportation Research Board 98th Annual Meeting, Washington, DC, USA, 13–17 January 2019. [Google Scholar]
  47. Jiang, R.; Lu, Q.C.; Peng, Z.R. A station-based rail transit network vulnerability measure. J. Transp. Geogr. 2018, 66, 10–18. [Google Scholar] [CrossRef]
  48. Shanmukhappa, T.; Ho, I.W.H.; Tse, C.K. Spatial analysis of bus transport networks using network theory. Physica A 2018, 502, 295–314. [Google Scholar] [CrossRef]
  49. Shi, Z.; Zhang, N.; Liu, Y.; Xu, W. Exploring spatiotemporal variation in hourly metro ridership at station level: The influence of built environment and topological structure. Sustainability 2018, 10, 4564. [Google Scholar] [CrossRef]
  50. Wu, X.; Dong, H.; Tse, C.K.; Ho, I.W.; Lau, F.C. Analysis of metro network performance from a complex network perspective. Physica A 2018, 492, 553–563. [Google Scholar] [CrossRef]
  51. Yang, Y.; He, Z.; Song, Z.; Fu, X.; Wang, J. Investigation on structural and spatial characteristics of taxi trip trajectory network in Xi’an, China. Physica A 2018, 506, 755–766. [Google Scholar] [CrossRef]
  52. Zhang, H. Structural analysis of bus networks using indicators of graph theory and complex network theory. Open Civ. Eng. J. 2017, 11. [Google Scholar] [CrossRef]
  53. Chatterjee, A. Studies on the structure and dynamics of urban bus networks in Indian cities. arXiv 2015, arXiv:1512.05909. [Google Scholar]
  54. Ding, R.; Ujang, N.; Hamid, H.B.; Wu, J. Complex network theory applied to the growth of Kuala Lumpur’s public urban rail transit network. PLoS ONE 2015, 10, e0139961. [Google Scholar] [CrossRef] [PubMed]
  55. King, D. Analytical Approaches to Investigating Transit Network Resilience. Ph.D. Thesis, University of Toronto, Toronto, ON, Canada, 2015. [Google Scholar]
  56. Mohmand, Y.T.; Wang, A. Complex network analysis of Pakistan railways. Discret. Dyn. Nat. Soc. 2014, 2014, 126261. [Google Scholar] [CrossRef]
  57. Liu, Y.; Tan, Y. Complexity modeling and stability analysis of urban subway network: Wuhan city case study. Procedia Soc. Behav. Sci. 2013, 96, 1611–1621. [Google Scholar] [CrossRef]
  58. Jang, S.; An, Y.; Yi, C.; Lee, S. Assessing the spatial equity of Seoul’s public transportation using the Gini coefficient based on its accessibility. Int. J. Urban Sci. 2017, 21, 91–107. [Google Scholar] [CrossRef]
  59. Cervero, R.; Kang, C.D. Bus rapid transit impacts on land uses and land values in Seoul, Korea. Transp. Policy 2011, 18, 102–116. [Google Scholar] [CrossRef] [Green Version]
  60. Seoul Open Data Plaza. Available online: https://data.seoul.go.kr/ (accessed on 20 July 2019).
  61. Hong, J.; Shankar, V.N.; Venkataraman, N. A spatially autoregressive and heteroskedastic space-time pedestrian exposure modeling framework with spatial lags and endogenous network topologies. Anal. Methods Accid. Res. 2016, 10, 26–46. [Google Scholar] [CrossRef]
  62. Telesford, Q.K.; Joyce, K.E.; Hayasaka, S.; Burdette, J.H.; Laurienti, P.J. The ubiquity of small-world networks. Brain Connect. 2011, 1, 367–375. [Google Scholar] [CrossRef]
  63. Wang, X.F.; Chen, G. Complex networks: Small-world, scale-free and beyond. IEEE Circuits Syst. Mag. 2003, 3, 6–20. [Google Scholar] [CrossRef] [Green Version]
  64. Ji, X.; Machiraju, R.; Ritter, A.; Yen, P.Y. Examining the distribution, modularity, and community structure in article networks for systematic reviews. In AMIA Annual Symposium Proceedings Archive; American Medical Informatics Association: Washington, DC, USA, 2015. [Google Scholar]
  65. Blondel, V.D.; Guillaume, J.L.; Lambiotte, R.; Lefebvre, E. Fast unfolding of communities in large networks. J. Stat. Mech. Theory Exp. 2008, 2008, P10008. [Google Scholar] [CrossRef] [Green Version]
  66. Thedchanamoorthy, G.; Piraveenan, M.; Kasthuriratna, D.; Senanayake, U. Node assortativity in complex networks: An alternative approach. Procedia Comput. Sci. 2014, 29, 2449–2461. [Google Scholar] [CrossRef]
  67. Noldus, R.; van Mieghem, P. Assortativity in complex networks. J. Complex Netw. 2015, 3, 507–542. [Google Scholar] [CrossRef] [Green Version]
  68. Armour, C.; Fried, E.I.; Deserno, M.K.; Tsai, J.; Pietrzak, R.H. A network analysis of DSM-5 posttraumatic stress disorder symptoms and correlates in US military veterans. J. Anxiety Disord. 2017, 45, 49–59. [Google Scholar] [CrossRef]
  69. Xu, Q.; Mao, B.H.; Bai, Y. Network structure of subway passenger flows. J. Stat. Mech. Theory Exp. 2016, 2016, 033404. [Google Scholar] [CrossRef] [Green Version]
  70. Krnc, M.; Sereni, J.S.; Škrekovski, R.; Yilma, Z.B. Eccentricity of networks with structural constraints. Discuss. Math. Graph Theory 2018. [Google Scholar] [CrossRef]
  71. Ruhnau, B. Eigenvector-centrality—A node-centrality? Soc. Netw. 2000, 22, 357–365. [Google Scholar] [CrossRef]
  72. Seoul, Republic of Korea Disaster Risk Management Profile. 2016. Available online: https://www.alnap.org/help-library/disaster-risk-management-profile-seoul-republic-of-korea (accessed on 12 August 2019).
  73. Wang, Y.; Deng, Y.; Ren, F.; Zhu, R.; Wang, P.; Du, T.; Du, Q. Analysing the spatial configuration of urban bus networks based on the geospatial network analysis method. Cities 2020, 96, 102406. [Google Scholar] [CrossRef]
Figure 1. GIS-based map of subway and bus stops in the Seoul Metropolitan Area (SMA) and Seoul.
Sustainability 11 05404 g001
Figure 2. Graphs of subway, bus, and the integrated bus and subway networks. (a) Subway network; (b) Bus network; (c) Integrated network.
Sustainability 11 05404 g002
Figure 3. Log–log cumulative distribution of station nodes for subway, bus, and integrated networks. (a) Subway network; (b) Bus network; (c) Integrated network.
Sustainability 11 05404 g003
Figure 4. Degree and weighted degree distributions of the subway, bus, and integrated networks. (a) Degree for subway network; (b) Weighted degree for subway network; (c) Degree for bus network; (d) Weighted degree for bus network; (e) Degree for integrated subway–bus network; (f) Weighted degree for integrated subway–bus network.
Sustainability 11 05404 g004aSustainability 11 05404 g004b
Figure 5. Betweenness centrality distributions of subway network, bus network, and integrated network. (a) Subway network; (b) Bus network; (c) Integrated subway–bus network.
Sustainability 11 05404 g005
Figure 6. Closeness centrality distributions of subway network, bus network, and integrated network. (a) Subway network; (b) Bus network; (c) Integrated subway–bus network.
Sustainability 11 05404 g006
Figure 7. Eigenvector centrality distributions of subway network, bus network, and integrated network. (a) Subway network; (b) Bus network; (c) Integrated subway–bus network.
Sustainability 11 05404 g007aSustainability 11 05404 g007b
Figure 8. Station centrality measures for the three network types and result for community detection.
Sustainability 11 05404 g008aSustainability 11 05404 g008b
Table 1. Summary of studies on unimodal transportation networks using network topology measures.
AuthorNetwork TypeNetwork Indicators
Cao et al., 2019 [44]High speed railwayDegree, strength, betweenness
Lu et al., 2019 [45]RailDegree, connectivity index
Yu et al., 2019 [3]MetroDegree, network density, network average distance, network clustering coefficient
Zhang et al., 2019 [30]RailStrength, clustering coefficient, average shortest path length
Cats et al., 2019 [46]RailDegree, betweenness
Jiang et al., 2018 [47]MetroCloseness
Shanmukhappa et al., 2018 [48]BusDegree, eigenvector, betweenness, hub and authority centrality, clustering coefficient, average shortest path length, small world network, efficiency
Shi et al., 2018 [49]MetroDegree, closeness
Wu et al., 2018 [50]MetroNode occupying probability (centrality)
Yang et al., 2018 [51]TaxiClustering coefficient, degree centrality, density,
Zhang, H., 2017 [52]BusDegree, modularity, correlation coefficient, efficiency, average shortest path, average transfer time
Chopra et al., 2016 [7]MetroClustering coefficient, characteristic path length, passenger strength, modularity, assortativity
Shanmukhappa et al., 2016 [6]BusDegree
Xu et al., 2016SubwayStation throughflow
Chatterjee, 2015 [53]BusBetweenness, closeness, clustering coefficient, average path length
Ding et al., 2015 [54]RailCloseness, betweenness, clustering coefficient, global efficiency, complexity of network growth
King, 2015 [55]SubwayBetweenness, degree, global efficiency, density, size, order
Mohmand et al., 2014 [56]RailwaysDegree, betweenness, closeness
Rommel, 2014 [31]RailDegree, betweenness, closeness
Liu and Tan, 2013 [57]SubwayDegree, clustering coefficient, average shortest path length
Derrible, 2012 [39]MetroBetweenness
Soh et al., 2010 [27]Bus, rail (nonintegrated)Strength, degree, degree–degree correlations, clustering coefficient, eigenvector,
Table 2. Summary statistics of network indicators utilized in this study.
Network IndicatorSubwayBusIntegrated Subway and Bus
Network-based measurements
Number of stations, N 60212,27112,873
Number of links, E 137115,54819,354
Network diameter, δ 66174149
Ave. clustering coefficient, C 0.0070.0160.028
Ave. path length, l 20.30443.63128.169
Assortativity, ρ 0.0680.3940.362
Degree of connectivity, γ 0.7620.4220.501
Modularity, M 0.8910.9370.933
Number of communities246359
Table 3. Results for small-world detection in the subway, bus, and integrated networks.
MethodCriteriaResult
1 C a v r e a l C a v r a n d 1Subway C a v r e a l = 0.007 ;   C a v r a n d = 0.019
Bus C a v r e a l = 0.016 ;   C a v r a n d = 0.020
Integrated C a v r e a l = 0.028 ;   C a v r a n d = 0.020
2 L a v r e a l L a v r a n d 2Subway L a v r e a l = 20.304 ;   L a v r a n d = 3.745
Bus L a v r e a l = 43.630 ;   L a v r a n d = 2.279
Integrated L a v r e a l = 28.169 ;   L a v r a n d = 2.264
1 C a v r e a l and C a v r a n d refer to the average clustering coefficient of the real networks (either subway, bus, or integrated networks) and the clustering coefficient of their equivalent E–R random networks, respectively. 2 L a v r e a l and L a v r a n d refer to the average path length of the real networks (either subway, bus, or integrated networks) and the average path length of their equivalent E–R random networks, respectively.
Table 4. Results for scale-free detection in the subway, bus, and integrated networks.
MeasuresSubway NetworkBus NetworkIntegrated Network
p-value0.00000.12980.0000
λ 15.59686.75073.7699
k m i n 464
1 λ refers to the parameter of the power law distribution p ( k ) k λ   for   k > k m i n   and k is the node degree of either subway, bus, or integrated, respectively, networks.
Table 5. Estimated network centrality measures.
Centrality MeasuresSubway NetworkBus NetworkIntegrated Network
Avg.Min.Max.Avg.MinMaxAvg.Min.Max.
Degree, d 4.5542.00014.0002.5341.00011.0003.0071.00034.000
Weighted degree, s 7.7470.60433.0008.8811.00057.89010.1800.604101.840
Betweenness centrality, C B 0.0320.0000.2240.0030.0000.0780.0020.0000.230
Closeness centrality, C C 0.0520.0230.0740.0660.0001.0000.0730.0001.000
Eigenvector centrality, C k 0.1110.0191.0000.0350.0001.0000.0190.0001.000
Eccentricity centrality,   E G 0.0220.0150.0290.0420.0001.0000.0400.0001.000
Eccentricity, e G 46.07835.00066.00097.4680.000174.00085.6630.000149.000
Table 6. Average centrality measures for stations or stops with different types of integration.
Integration TypeAverage Centrality Measures
DegreeWeighted DegreeCloseness CentralityBetweenness CentralityEigenvector Centrality
Subway–Bus5.3020.350.050.0010.09
Bus–bus2.739.590.070.0010.01
All stations3.0110.180.070.0020.01

