1. Introduction
For half a century Estonia, Latvia and Lithuania were known as small republics on the eastern coast of the Baltic Sea fully integrated into the economy of the Former Soviet Union (FSU), a huge country with a centrally planned economy. The national economies and the energy sectors in all three countries constructed through 1990 were inappropriate for the requirements of independent states taking into consideration the small size of each country and even of the Baltic region as well as the limited access to raw materials and energy resources [
1]. In the context of the analysis performed, the group of three countries is referred to by the term Baltic region.
Reintegration of the former Eastern Bloc countries into the global economy was followed by radical political transformations, disruption of their trade and economic relations with the FSU, certain turbulence in the economies, the energy sectors, economic recession, high inflation, etc. [
2]. Planning of the national economies and the energy sectors in the Baltic States was tightly integrated into common projections of the large FSU North-Western region. Therefore, reforms in their economies as well as institutional and technical structures were more radical, economic slump was longer, and the period of reforms was protracted. The economies in the Baltic countries began increasing since the mid-1990s but were negatively influenced again by the financial and economic crisis in Russia in 1998–1999. Only in early 2000s did economic growth become stable and strong.
One of the major primary foreign policy goals of the Baltic States was integration into the European Union (EU) and Western organisations. These expectations have been crucial for their economic and social development. In 2004, Estonia, Latvia and Lithuania became members of North Atlantic Treaty Organization (NATO) and the EU. Currently, all three countries are members of the Eurozone, the Organization for Economic Co-operation and Development (OECD) and other important European and world organisations. This membership was an important factor influencing greater economic and social security, better preconditions for sustainable development, greater financial stability and faster economic growth.
The most important factors stimulating high economic growth rates in early 2000s in the Baltic States were the opening of large markets in the developed countries and financial support coming from the EU, which was directed to the modernization of infrastructure and social development. Integration into the EU created favourable preconditions for the introduction of the legal basis of the EU regulatory and public administration system. Efficient use of EU membership has had very positive role seeking to reduce gradually social and economic differences between the Baltic States and the developed EU countries.
One of the major challenges was the closure of Ignalina nuclear power plant (INPP), which was foreseen as one of the Lithuanian obligations during the process of accession to the EU. This power plant was a dominating electricity generation source in Lithuania and even in the Baltic region. In 2009, INPP was closed and Lithuania became more dependent on electricity imports than ever before. Currently, about 70% of the country’s gross electricity consumption is covered by imports. Therefore various options of the Lithuanian energy sector development have been analysed on the national level and in the Baltic region [
3,
4,
5].
The envisaged closure of INNP was discussed also in the context of energy security because the Baltic region has been seen as an energy island [
6,
7,
8]. The infrastructure inherited from the FSU was playing a significant role in allowing Russia to abuse its gas monopoly in the Baltic region. The Baltic States were facing high dependence on gas supply by the Russian company Gazprom. To reduce this dependence on a single gas supplier liquefied natural gas (LNG) import terminal was built at Klaipeda port in 2014. Currently, the LNG terminal can serve as an alternative for the natural gas supply by pipeline from Russia to the Baltic region. In 2017, LNG for the first time was supplied to Klaipeda terminal from the USA by the company Cheniere Marketing International.
Another strategic goal of the Baltic States was a connection of their power systems with the networks of Western Europe and Scandinavian countries. Under the Baltic Energy Market Interconnection Plan (BEMIP), the interconnection line Lithuania–Poland and submarine cable Lithuania–Sweden were identified as priority projects [
6]. Construction of two submarine electricity cables between Estonia and Finland (in 2006 and 2014) and two powerful interconnections connecting Lithuania to Sweden and Poland (in 2015) opened new opportunities for all three countries. The Baltic states, in principle, have turned an isolated energy island into the Baltic energy ring.
After joining the EU, small societies with comparatively limited resources have had a willingness to contribute to global sustainable development by implementing national strategies and assuming sustainable development as a major ideology of long-term social development and covering the most general goals for social life [
9,
10,
11].
Obligations of the Baltic States assumed under international environmental conventions to implement the requirements set in the EU directives were confirmed in their national strategies, national development plans and other documents, for instance in [
12,
13,
14]. EU leadership in the world policy climate and the urgency of the global problems have encouraged the new member states from Central and Eastern Europe to revise their energy and environmental policies. The Baltic states identified their national indicative targets on the deployment of RES and enhancement of energy efficiency, which are required correspondingly by the 2009 Renewables Directive 2009/28/EC and the 2012 Energy Efficiency Directive 2012/27/EU [
15,
16].
Trends of economic growth in Latvia and specific features of the country’s sustainable development were presented in [
17,
18]. Analysis of sustainable development in compliance with EU policy, including trends in the economic growth, energy consumption and reduction of greenhouse gas (GHG) emissions in Lithuania was discussed in [
19,
20]. Possibilities for decoupling environmental impacts from economic growth in the new member states from Central and Eastern Europe were examined in [
21]. Detailed analysis of significant changes in the Lithuanian energy sector was presented in [
22,
23]. A broad spectrum of issues related to the deployment of renewable energy sources (RES), effectiveness of their support instruments and promotion policy measures was discussed in [
24,
25,
26]. Feasible barriers for the implementation of new technologies and the foreseen contribution into electricity generation, heating and cooling were presented in [
27,
28]. Options for RES integration into the regional energy development were examined in [
29].
Specific features of the energy systems, driving forces and factors stimulating or limiting the future deployment of RES as well as appropriate energy policy documents in the Baltic States were discussed in [
30]. A thorough overview of the energy policies and measures implemented in the Baltic States, aiming to support the use of RES, the increase of energy efficiency and sustainable energy development of Estonia, Latvia and Lithuania, was provided in [
31,
32]. An overview of the energy sectors and energy and climate-related targets in the Baltic countries as well as possibilities to reduce GHG emissions by 2020 are presented in [
33]. The Kaya identity analysis was applied in [
34] seeking to relate the GHG emissions to energy use, economic growth and population growth and to assess perspectives to implement the EU 20-20-20 targets in the Baltic States. Progress in electricity generation from RES in Estonia, Latvia and Lithuania towards the EU 2020 targets was identified and compared with trends in Finland and Sweden in [
35].
The EU leadership in the development of RES and the coordination of efforts seeking to mitigate climate change are very important factors stimulating the activity of many researchers and economists [
36,
37,
38,
39,
40] focused on: investigation of benefits of substituting fossil fuels by various forms of renewable energy; estimation of RES consumption trends in the EU countries, and the possibilities to achieve targets of Europe 2020 and to meet objectives of the Paris agreement; analysis of measures implemented in separate countries; and identification of best practices seeking to define corrections measures towards 2020 targets, etc. An interdisciplinary framework for the analysis of governing for sustainable energy system change is discussed in [
40]. The importance of justice in the context of global decarbonisation and the transition to a green economy is emphasized in [
41]. A definition of socio-energy systems, which can open up a larger range of energy policy goals, is discussed in [
42]. Analysis, presented in [
43], argues that existing demand-side responses are inadequate in seeking to achieve future carbon emissions reduction goals.
Many economic tools, energy policies and modern technologies could be applied to promote sustainable energy development and to reduce the atmospheric pollution and in particular GHG emissions in separate sectors of the economies and in power systems. The state-of-the-art of research in this area is provided in numerous studies. Analysis of the challenges and benefits in measuring and reducing GHG emissions in the craft brewery industry, which are investigated in [
44], has value for many industrial companies seeking to identify the main determinants of their carbon emissions and to implement the most relevant measures. Agriculture and in particular the livestock sector is another important contributor to the mitigation of GHG emissions in many countries. The relationship between emissions and farm management practices of commercial farms as well as a considerable potential to mitigate GHG emissions in Central Region of Argentina, is identified in [
45]. The transportation sector is responsible for a large share of GHG worldwide. To reduce the environmental impact of this sector, adequate energy policy measures are required. Based on research, presented in [
46], currently transportation demands in Korea cannot be met by existing electric vehicle technology and use of less polluting biofuel in place of petroleum-based gasoline or diesel fuel is recommended as a transitional solution.
Renewable energy could be developed actively and consistently by increasing the number of consumers using environmentally friendly technologies and involving local communities. Development of the smart grid capabilities and of microgrids is analyzed in numerous studies as a promising way to integrate RES effectively. Analysis presented in [
47] confirms that consumers can minimize energy costs and reduce the peak power by using the flexibility of the shiftable loads and by involving a residential microgrid. The performance of a stand-alone hybrid power system consisting of a wind generator and photovoltaic (PV) system and balanced by a fuel cell (FC) system is examined in [
48]. Results confirmed that such system can effectively extract the maximum power from wind and PV energy sources. Large-scale integration of PV and wind power plants into the power system brings technical challenges to power supply. A number of solutions to compensate for the variability in power generation from RES could be applied. In [
49] use of energy storage system based on vanadium redox battery as an effective technique is confirmed. An automatic reconfiguration of microgrids after the addition of new devices or change in the operation status of existing devices by using a multiagent system is considered in [
50]. An analysis and conclusions concerning trends related to demand response is provided in [
51].
An overall motivation for the analysis presented in this paper is both building the ground for future energy policy decisions in the Baltic States and spreading the experiences and the lessons learned to other countries. The paper provides an integrated analysis of the energy sector development during the period 2000–2016, trends in the economic growth and energy consumption in each country and for the first time in the Baltic region.
Both methodological and applied results describe the scientific novelty of the present research. An original methodology has been developed and used to perform an integrated comparative analysis of the economic growth, transformations in the energy sectors and environmental issues. This methodology allowed us not only to conduct quantitative and qualitative analysis on the sectoral level but also to reveal specific features of the energy sectors in each country and essential technological changes in their energy transformation sectors. Moreover, critical practical issues have been solved, the harmonisation of data from national statistics being a good case in point. This issue is fundamentally important seeking to enable true comparability of data across countries and by sectors of the economies as well as to summarise structural changes at the regional level. The integrated nature of the present research has certain advantages compared with a purely quantitative approach as it covers more factors and, thus, allows a better description of causality between energy consumption and economic growth. Consequently, this builds a clear ground to increase the quality of final energy demand forecasts.
From a policy-oriented point of view, detailed analysis of GHG emissions trends and emission intensity indicators has revealed a necessity to introduce new policy measures (in particular in the transport sector and agriculture) and to implement technological changes in the Estonian energy transformation sector.
The paper is organised as follows:
Section 2 presents the methodology used in this paper and sources of information invoked in the preparation of this review. Comparative analysis of the economic growth in each country and the main sectors is presented in
Section 3. Findings from an analysis of energy sector development and the analysis of changes in primary energy consumption as well as factors influencing tangible changes in each country and the Baltic region are presented in
Section 4.
Section 5 provides insights from an analysis of trends in final energy consumption by sectors of the national economies, by branches of the manufacturing and by energy carriers, including the role of RES in the Baltic region. Based on established long-term relationships between economic growth and final energy consumption, final energy demand is predicted and possibilities to meet national energy efficiency targets in each country are assessed in this section. Findings from analysis of GHG emissions trends and emission intensity indicators in the Baltic States are summarized in
Section 6.
Section 7 presents some concluding remarks.
2. Methodology
The information invoked in the preparation of this analysis was taken from Statistical Offices of Estonia, Latvia and Lithuania, the Eurostat database, publications of the International Energy Agency (IEA) and other appropriate statistical publications. Detailed data about economic development of the Baltic States (value added (VA) created in separate sectors and gross domestic product (GDP) for the national economies) was taken from their systems of national accounts. Aggregated indicators were taken from the Eurostat database and publications of the IEA. Chain-linked volumes with the reference year 2010 were used seeking to measure correctly changes in VA by kind of economic activities and GDP growth rates.
Comprehensive analysis of trends in primary energy production, supply and consumption in each country is based on data presented in the annual energy balances produced by the National Statistical Offices of Estonia, Latvia and Lithuania. The main principles of their preparation, concepts and definitions applicable across countries correspond to the requirements of the international statistics [
52,
53]. To reflect correctly changes in primary energy consumption, detailed data about each imported and local energy resource are recorded in existing databases of the Baltic states consistently starting with extraction (production) of particular energy resource, its imports, exports, use by international bunkers, changes in stocks, gross inland energy consumption, transformation of primary energy sources into other energy forms and ending by final energy consumption in sectors of the national economies.
Seeking to have the real background for comparative analysis of trends and proportions of energy consumption, flows of all fuels, electricity and heat should be expressed in energy units (petajoules (PJ), thousand tonnes of oil equivalent (ktoe), etc.). The usage of a common energy unit provides a possibility to perform detailed analysis of energy flows, applying basic principles and accounting rules concerning supply and the use of energy resources. Application of common principles is an essential condition to ensure the relevance of comparative analysis of energy consumption trends in the Baltic States.
The methods applied are: graphical analysis, comparative analysis, methods of descriptive statistics, and policy field analysis. Comparative indicators in each country were defined following the methodology, which is applied in the statistical publications of the IEA and Eurostat database. An econometric model was applied in forecasting of final energy demand. Using this approach final energy demand at the country level or in separate branches of the national economy are described as a function of the preceding energy consumption and the mutual relationships with factors influencing energy consumption trends. Experience has shown that the most important factors influencing future changes in final energy demand are the following: change of economic activity (GDP on the country level or value added created in the sector), income elasticity, increase of energy price, price elasticity, and additional energy-saving potential:
where
E is the final energy consumption in the sector in PJ or ktoe,
A the value added created in the sector in million EUR, P the price of energy resources in EUR/toe, C factor of expected energy saving, t the time, 0 the initial values corresponding to a base year, α the income elasticity, and ß the price elasticity.
Starting from actual energy consumption (for instance, observed in 2016), the development of the final energy demand can be modelled year by year assuming a behavioural reaction of the consumers in each sector on the projected income (value added in the sector) and price developments whose impacts on energy demand are calculated via corresponding income and price elasticities. Assessment of the additional energy saving could be derived from analysis of energy intensities trends presently observed in the Baltic countries. The accuracy and statistical validity of predictions can be improved by introducing additional variables. For instance, when forecasting final energy demand by energy forms, the fuel substitution factor should be considered [
54,
55].
3. Development of the National Economies
In early 1990s, sudden political upheaval was followed by deep and complicated reforms in the national economies of the Baltic states. The principal change of their economic systems, the loss of former market in the East, and a dramatic increase of prices for energy resources and raw materials at the beginning of the transition to a free-market economy were accompanied by the decline of GDP. The decline of the national economies in the Baltic states was striking and the period of economic slump was longer than in other Central and East European countries owing to many complicated transformations, the growth of the shadow economy, lack of experience implementing a policy for reforms and other reasons. In 1995, GDP in the Baltic States dropped dramatically: in Latvia to 56.7%, in Lithuania to 57.8% and in Estonia to 69.5% compared with their levels in 1990 [
56].
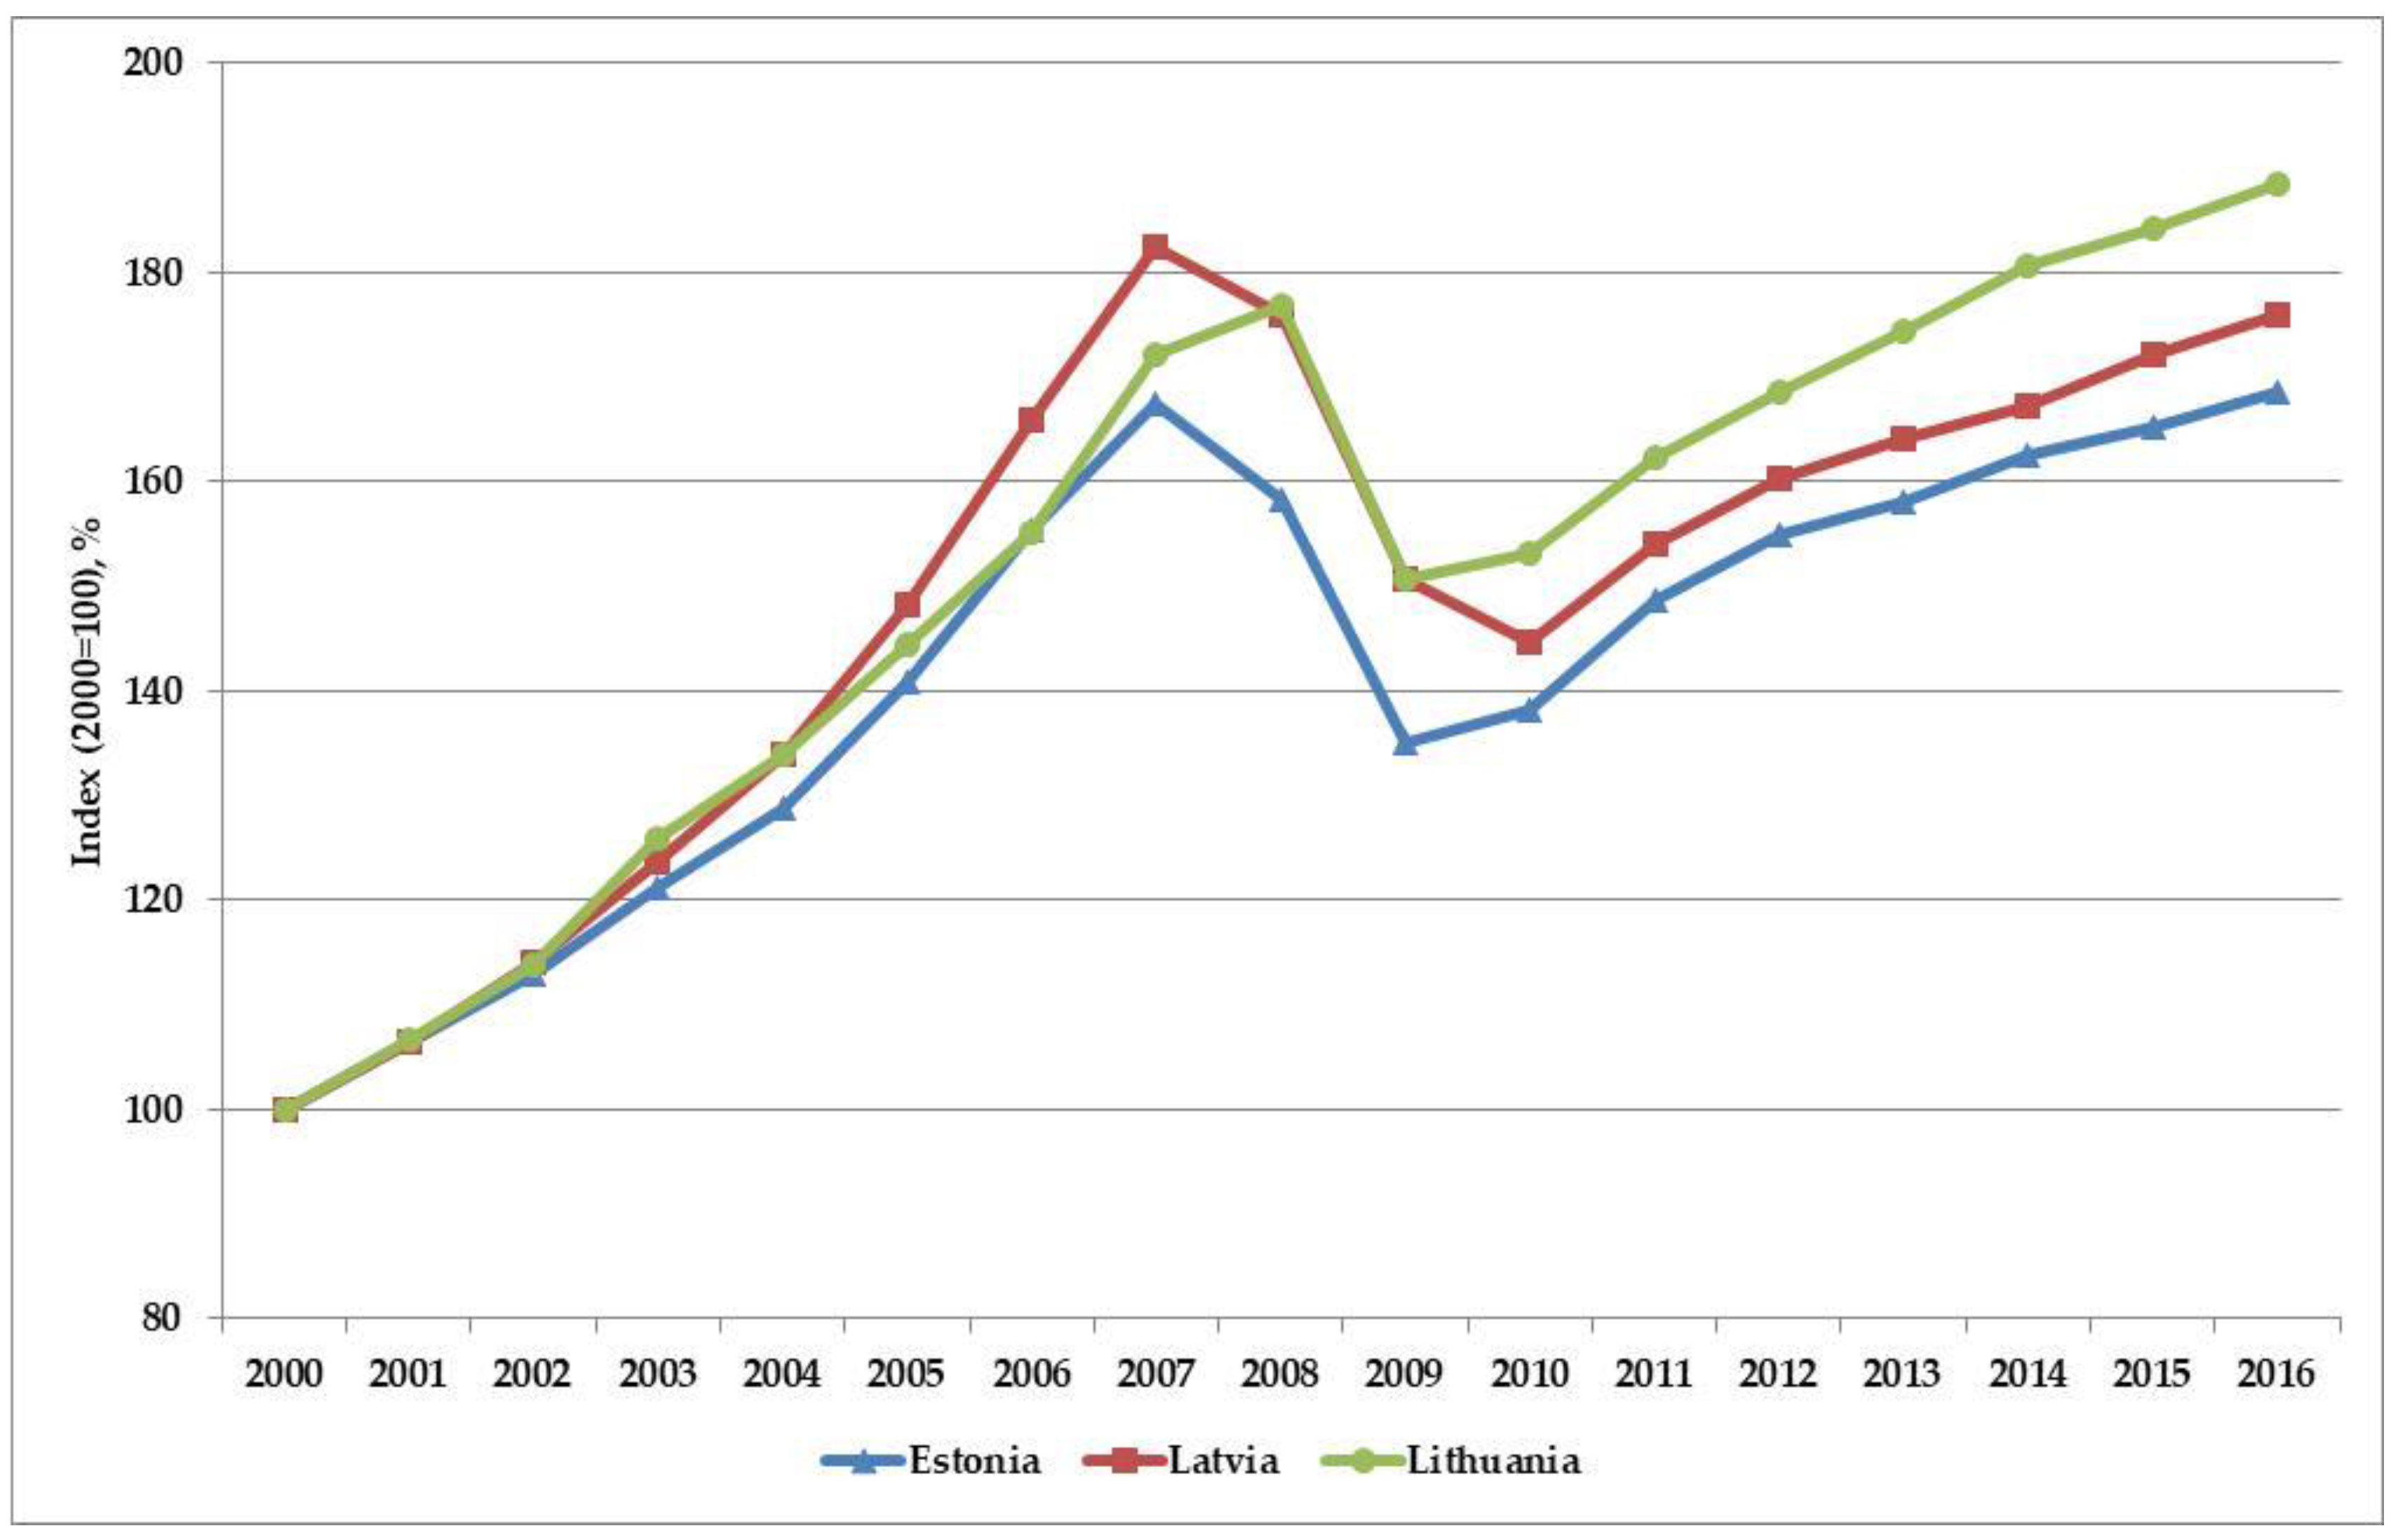
The harmonisation of legal, economic and technical standards in the Baltic states with best practices in the EU countries stimulated rapid economic growth, which was followed by many internal and external changes. Estonia, Latvia and Lithuania have achieved significant progress changing their legal and institutional structures, eliminating price distortions, attracting foreign investments and providing suitable conditions for the free flow of capital, promoting the establishment of efficient financial markets, etc. One of the most important factors stimulating fast economic development during this period was economic support from EU structural funds, international financial institutions, and various programmes. The national economies in the Baltic states were growing very fast during the period 2000–2007 (
Figure 1). Based on data presented in [
57,
58,
59], GDP in Latvia was increasing on average by 9.0%, in Lithuania by 8.1%, and in Estonia by 7.6% per annum.
In 2008, signs of the global economic recession were evident and GDP increased only in Lithuania by 2.6%, but decreased in Estonia by 5.4% and in Latvia by 3.5%. At least three important factors have had an influence on worsening of their national economies: 1) significant reduction in exports of many goods and decrease in turnover of domestic retail trade; 2) reduction of direct foreign investments and very low possibilities to get credits from banks; 3) special funds required to soften social problems during the period of recession were limited.
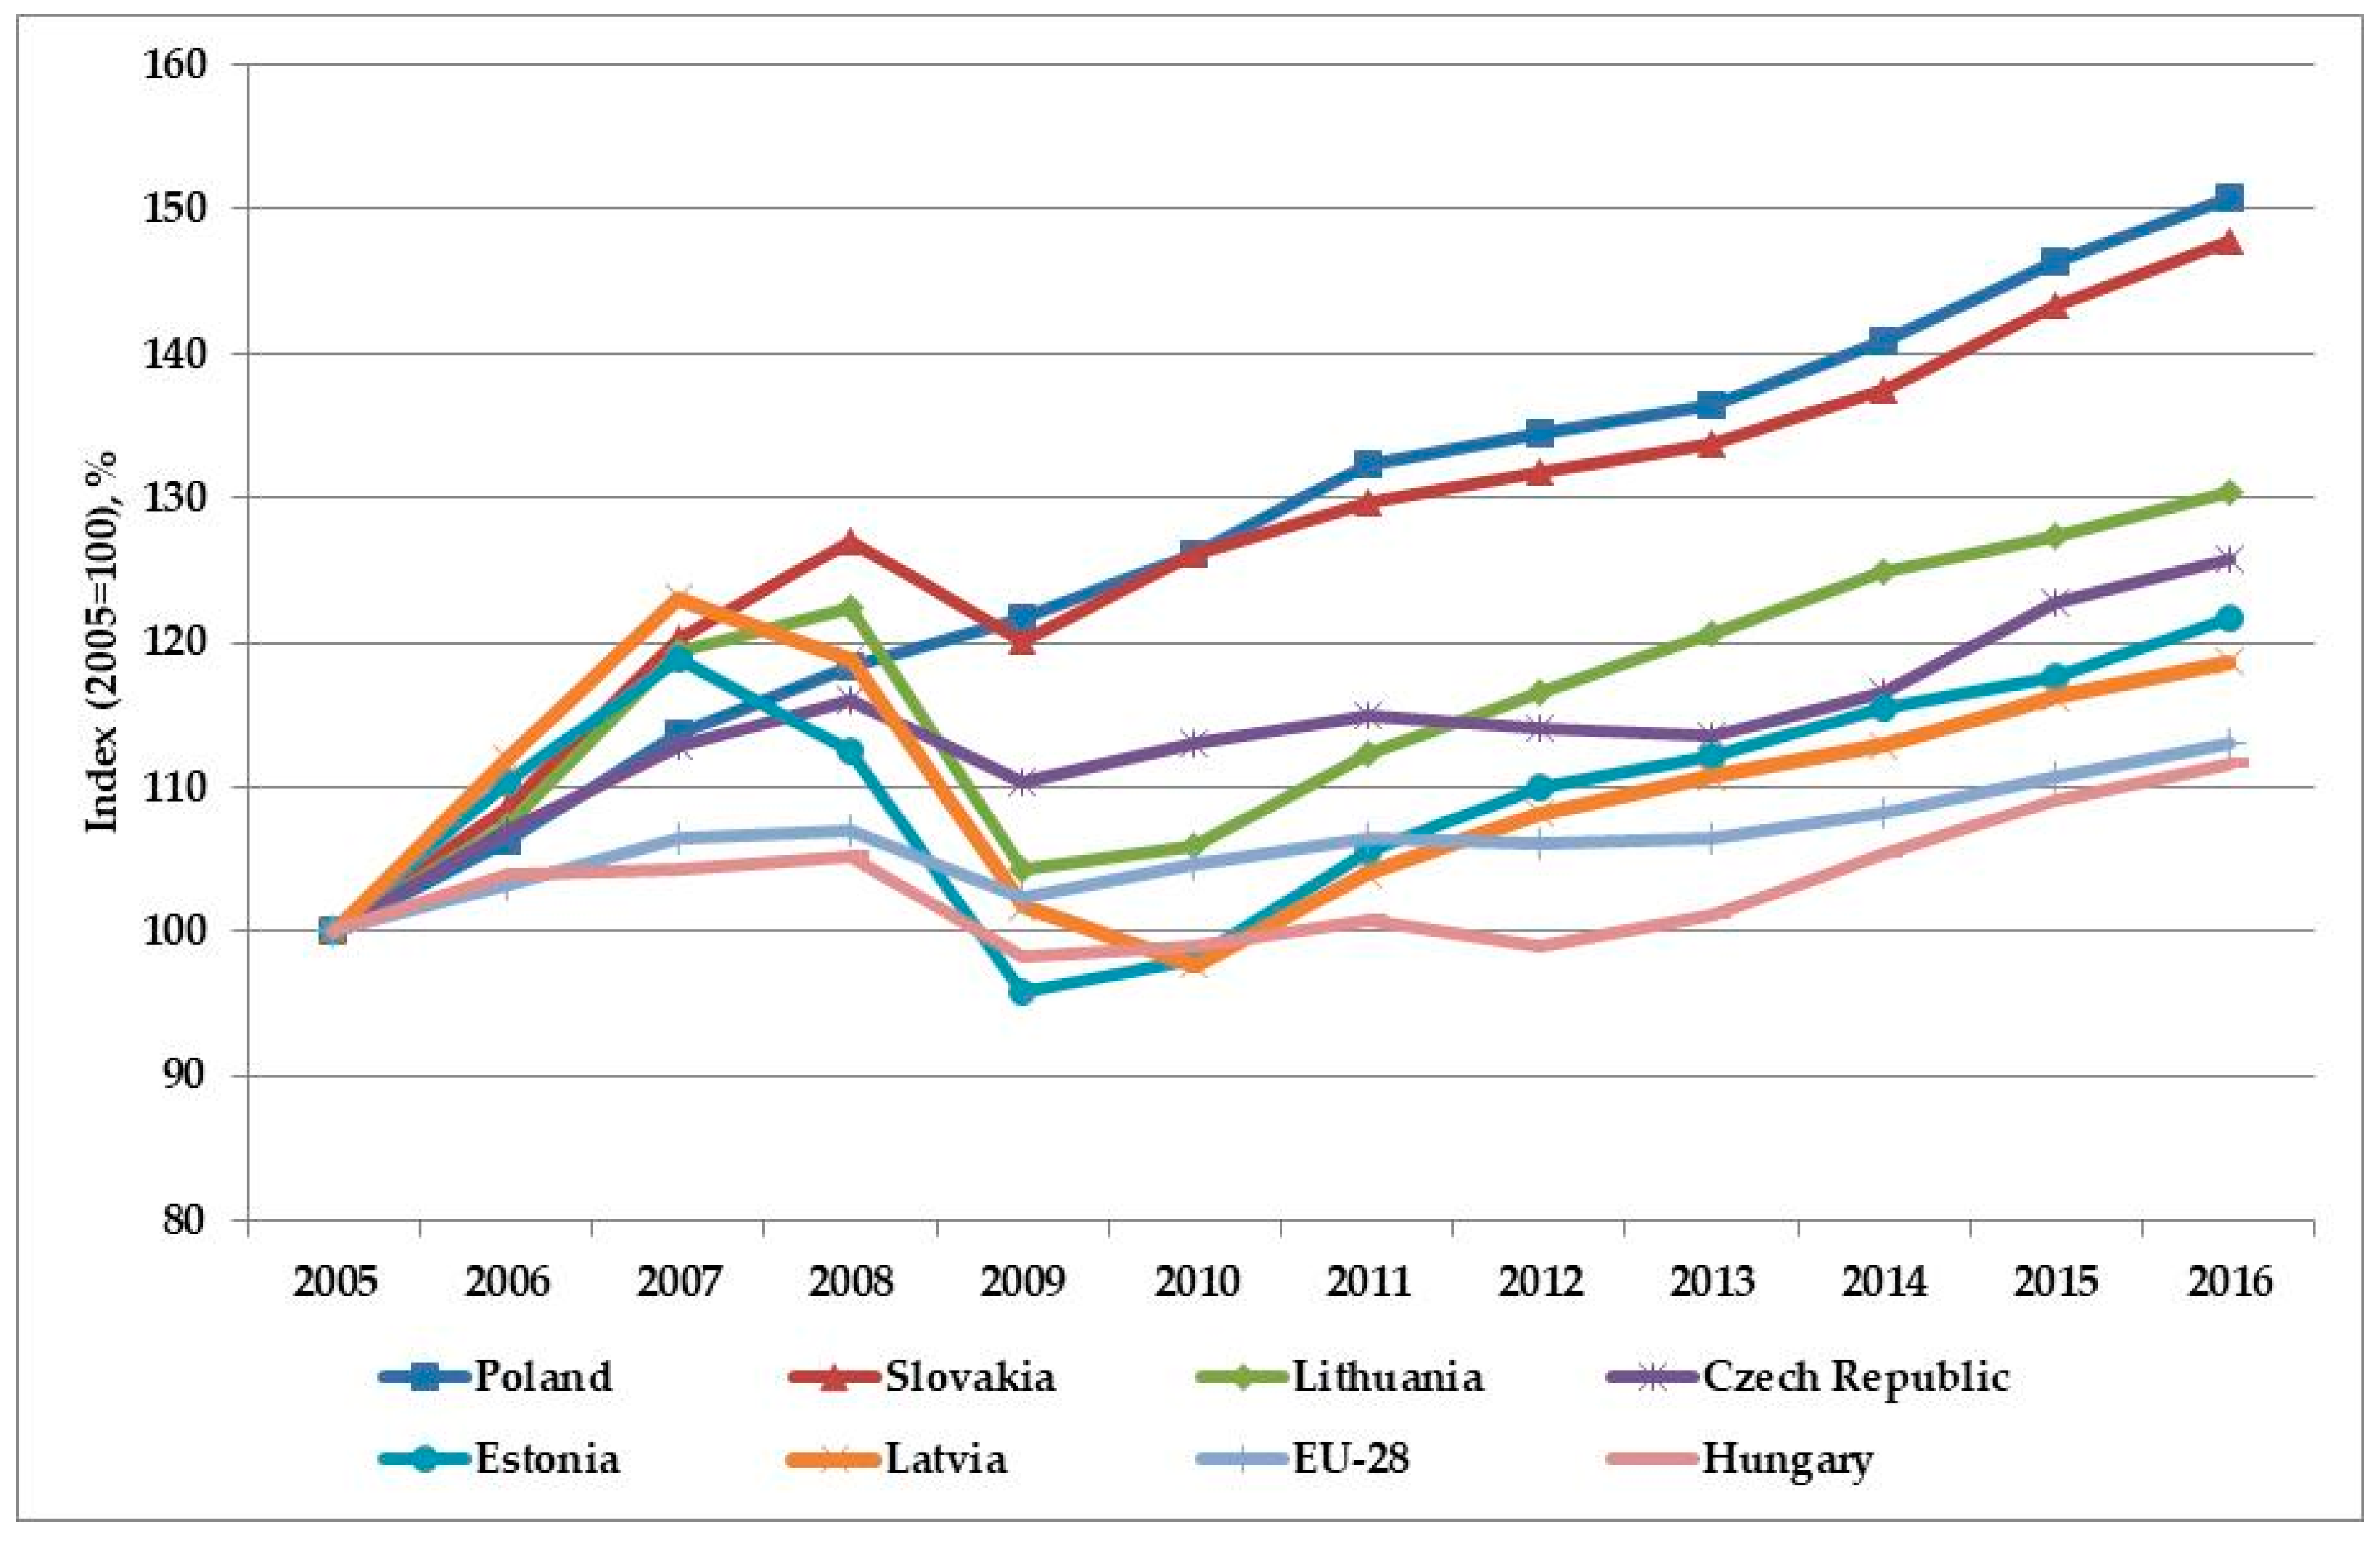
Possibilities to encourage export, to preserve the competitiveness of goods in the international markets, and to mitigate the impact of the global economic recession on economic development in the Baltic states were very limited. The reduction of income and increase of taxes have stipulated many long-lasting problems for business and social life, such as the default of loan payments, debts in payment for municipal and energy services, and a significant decrease in consumption. Thus, the negative impact of the global economic crisis on the national economies was more severe than was predicted by many experts. In 2009, GDP in Latvia decreased by 14.4%, in Estonia by 14.7% and in Lithuania by 14.8%. Compared with an average reduction of GDP in the EU-28 by 4.3%, one can point out that the Baltic states were severely affected by the impact of the global recession. This impact was more severe than in any other Central and East European country (
Figure 2). Based on the Eurostat database [
60], GDP in Slovenia decreased by 7.8%, in Croatia by 7.3%, in Hungary by 6.6%, in Romania by 5.9%, in Slovakia by 5.4%, in Czech Republic by 4.8% and in Bulgaria by 3.6%, but in Poland increased by 2.8%.
To create favourable preconditions for gradual recovering of the national economies, many measures were implemented by the governments: a radical reduction of expenses, promotion of exports, efforts directed to increase of the confidence at the international credit market, creation of the friendly environment for business activities, etc. During the period 2010–2016, GDP in Lithuania was growing on average by 3.5%, in Latvia by 3.3%, in Estonia by 3.4% per year. Compared with GDP growth rate of 1.3% per year in the EU-28, economic development in the Baltic region could be assessed as relatively fast. However, consequences of the economic crisis are still dire. In 2017, GDP at chain-linked volumes (the reference year 2010) exceeded the pre-crisis level in 2008 in Estonia by 13.5%, in Lithuania by 11.1%, in Latvia by 4.4%, and in the Baltic region by 9.6% [
61].
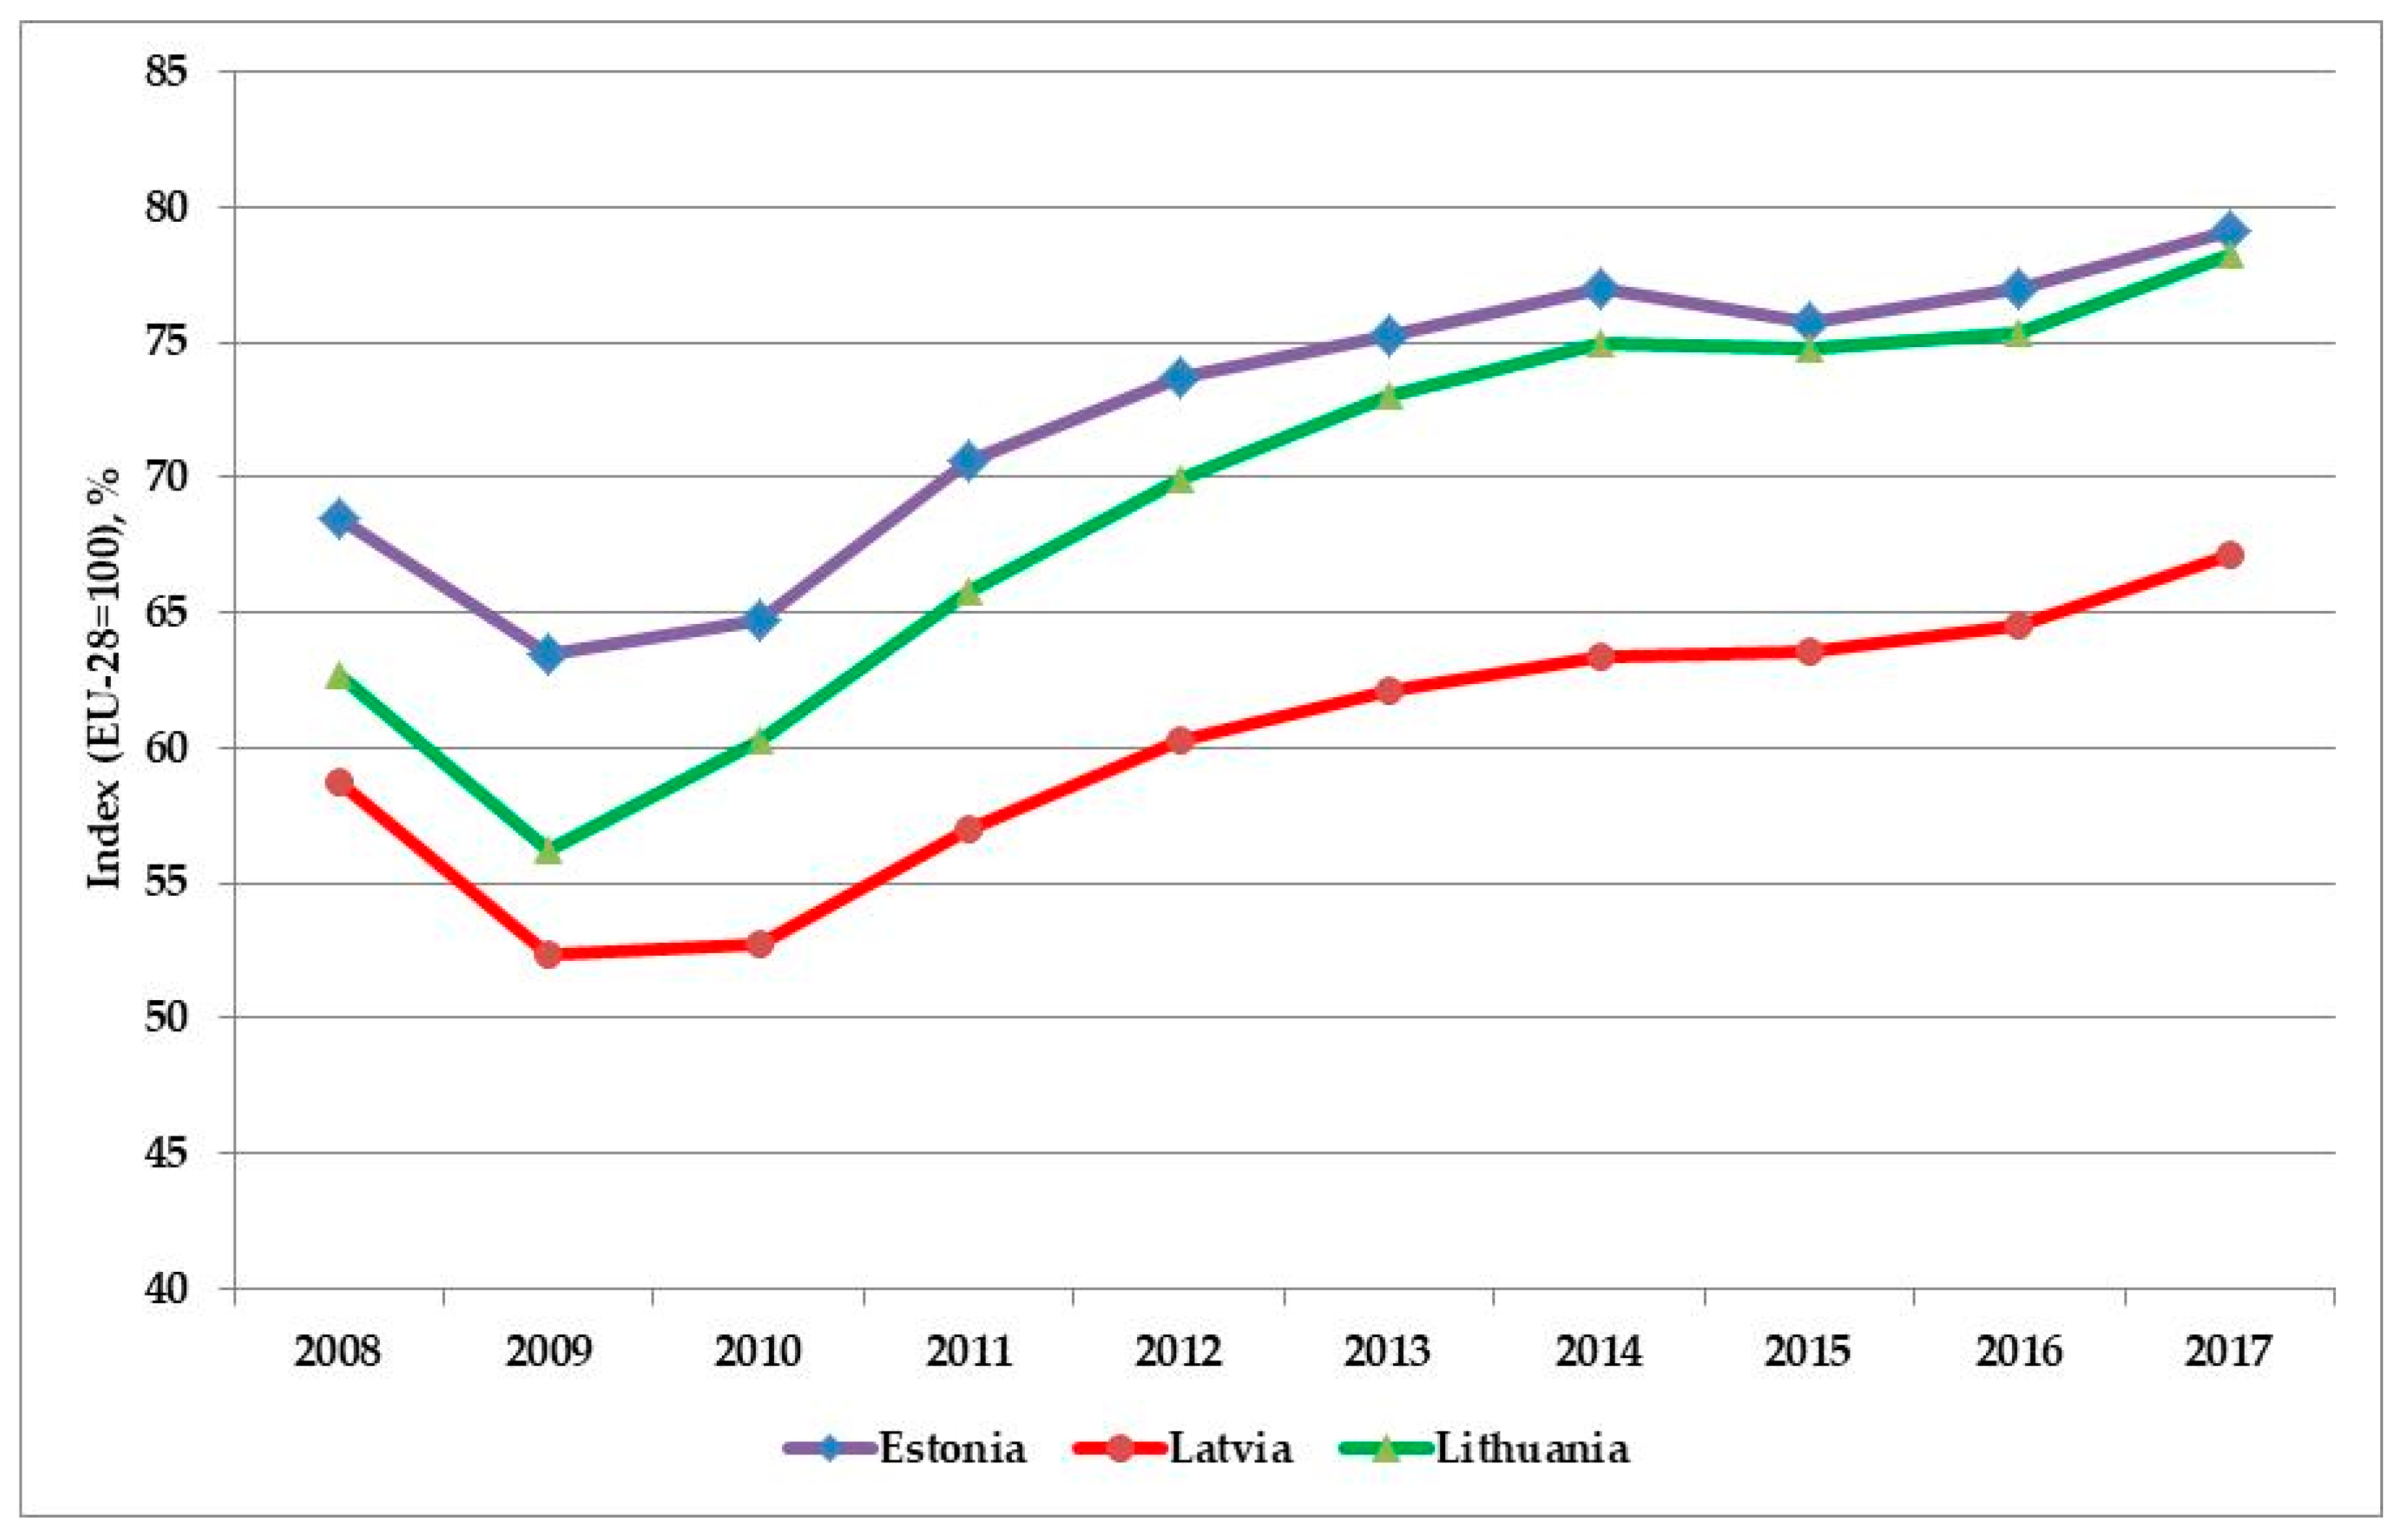
In 2016, despite impact of the deep economic recession, Estonian GDP exceeded the 2000 level by 68.6%; in Latvia it was higher by 75.8% and in Lithuania by 88.5% [
57,
58,
59]. The fast economic growth of the Baltic countries can create favourable preconditions seeking to approach gradually (as shown in
Figure 3) to an average level of economic development in the EU-28 countries measured as GDP per capita in purchasing power standards (PPS).
Based on indicators of the GDP growth index, development of the national economies over the period 2000–2016 in all three countries was rather similar. However, in-depth investigation has disclosed that growth of VA created in separate sectors was very different. Specific features of economic development in each country can be illustrated by trends of VA growth in 3 major sectors: the manufacturing sector, transportation and storage as well as commercial and public services. Faster development of these sectors is significant for development of the national economies and for future changes of final energy demand in each country.
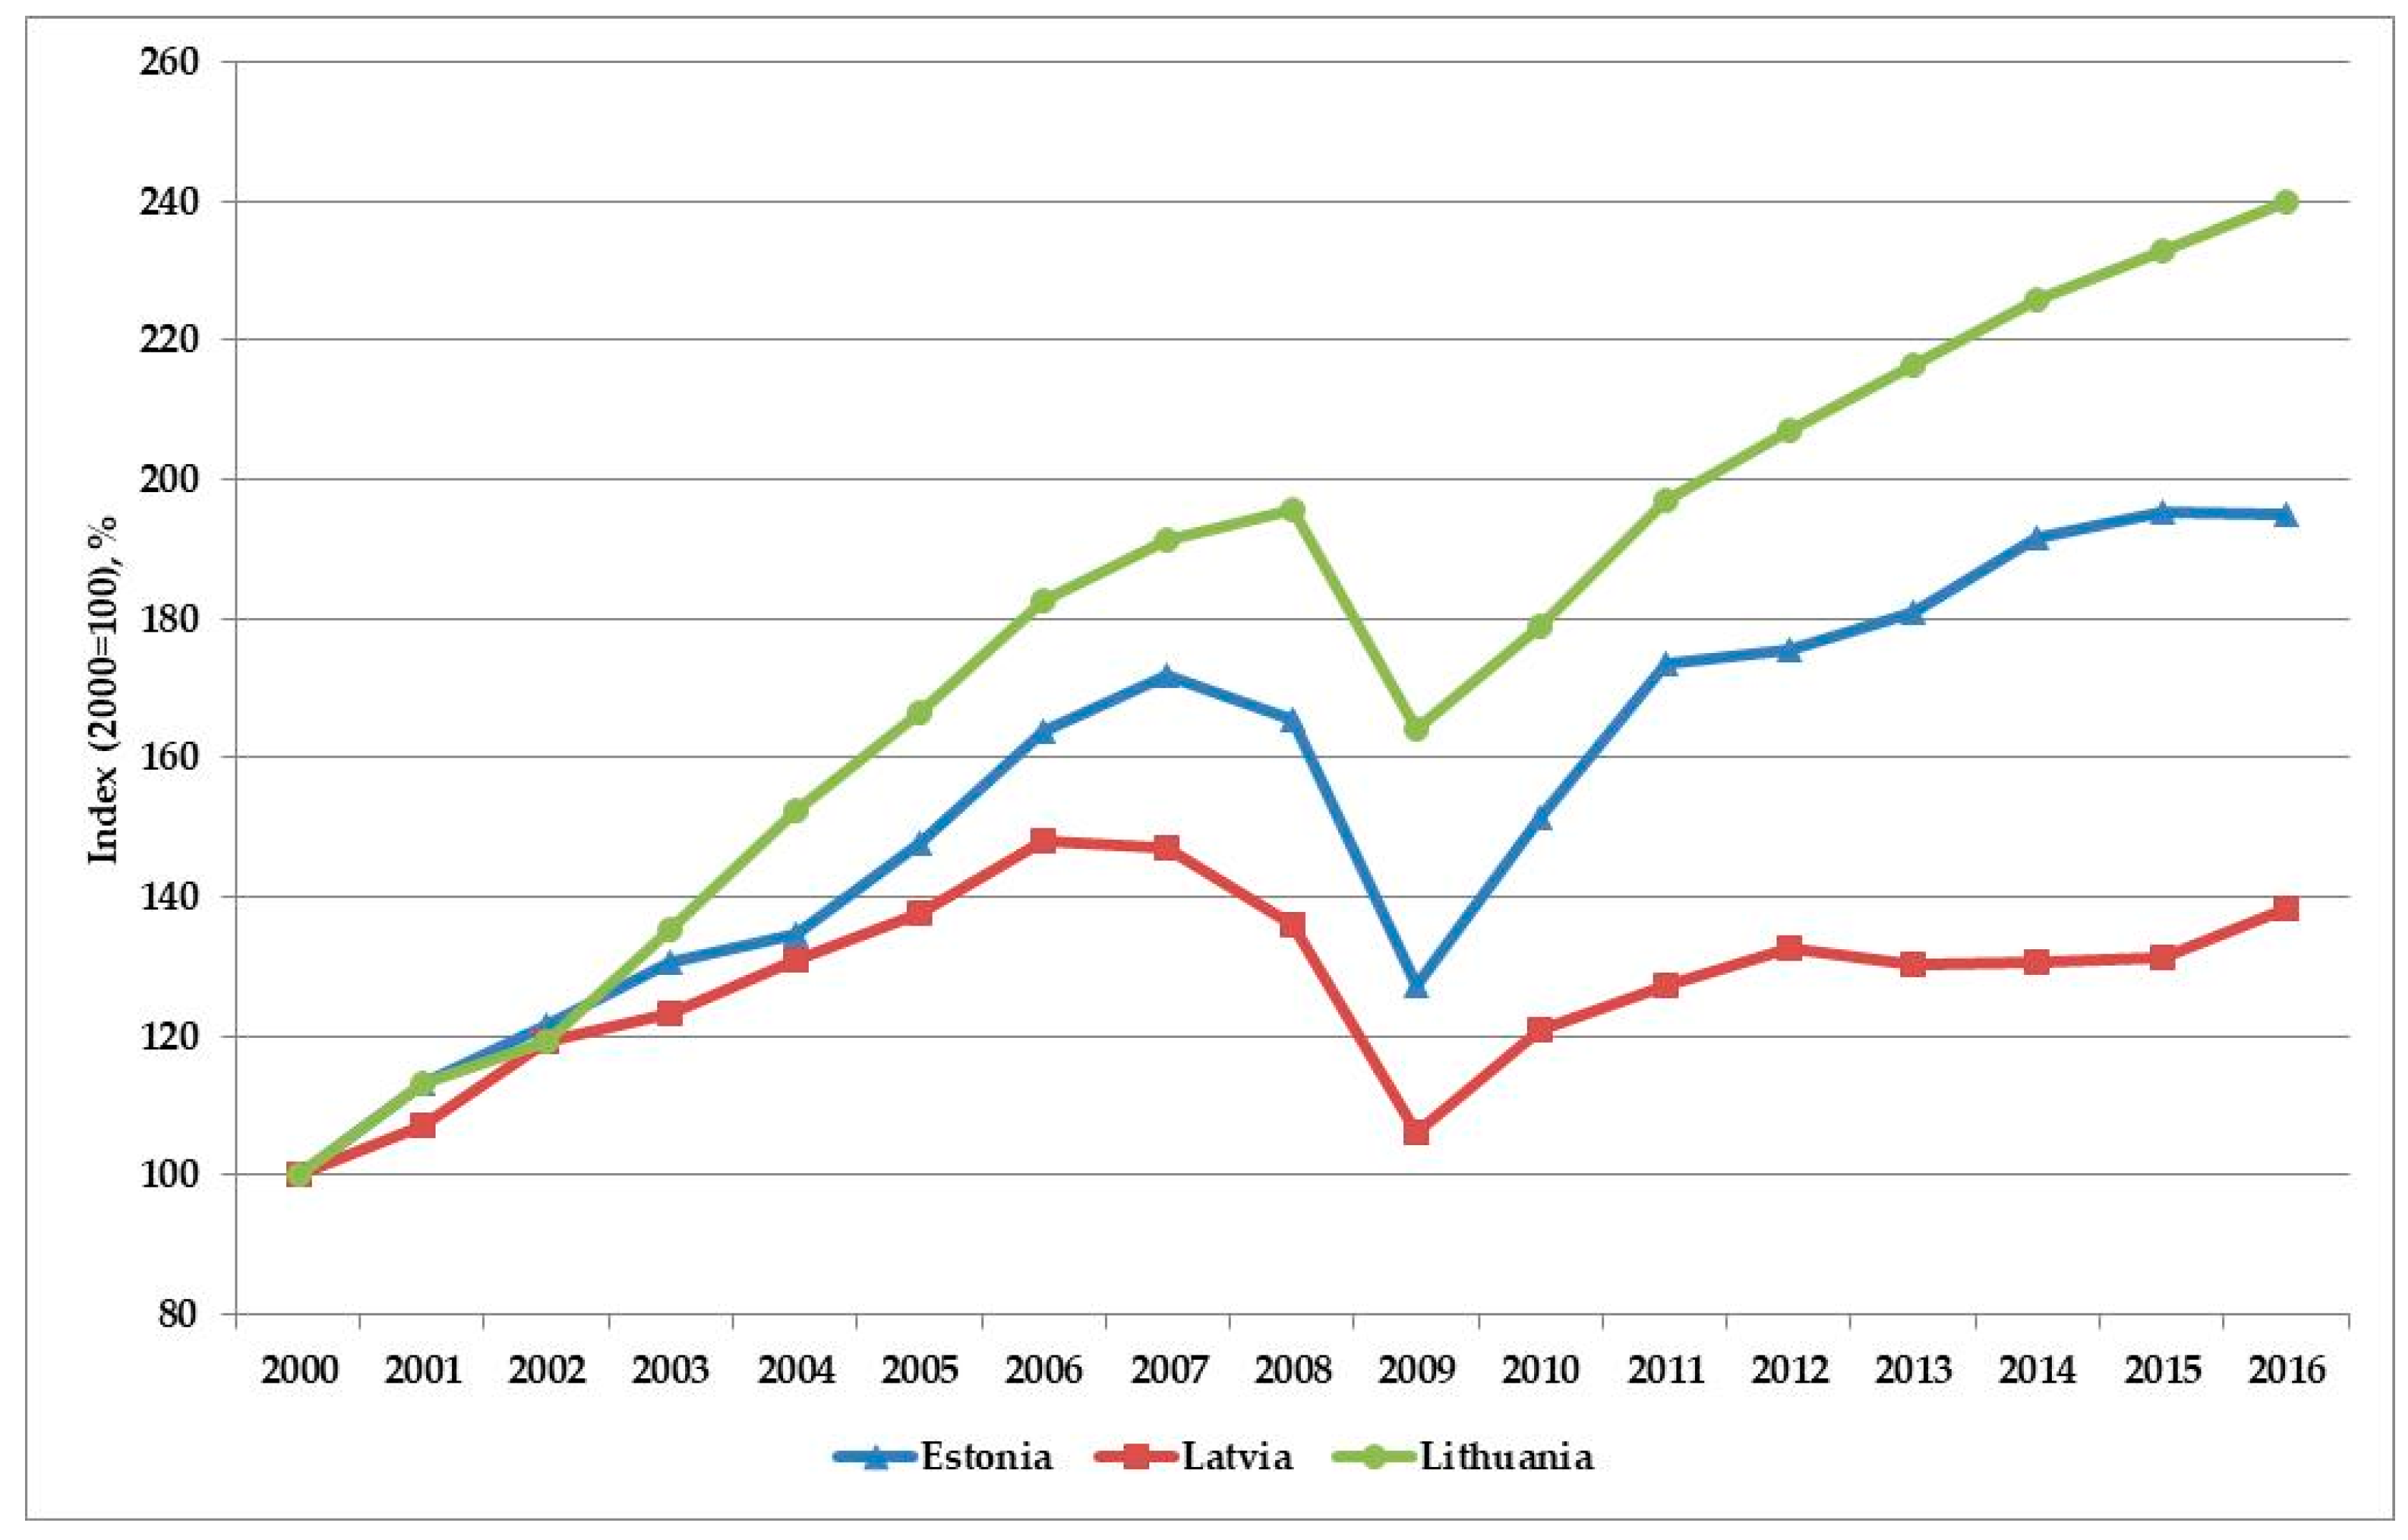
Value added in the manufacturing sector was increasing over this period in Estonia on average by 4.3%, in Latvia by 2.1% and in Lithuania by 5.6% per year. In 2016, despite the impact of the economic recession, the index of VA created in this sector was higher than the 2000 level in Estonia by 95.0%, in Latvia by 38.5%, and in Lithuania by 140.1% (
Figure 4).
Different trends were discovered in the growth of VA created in transportation and storage activity (
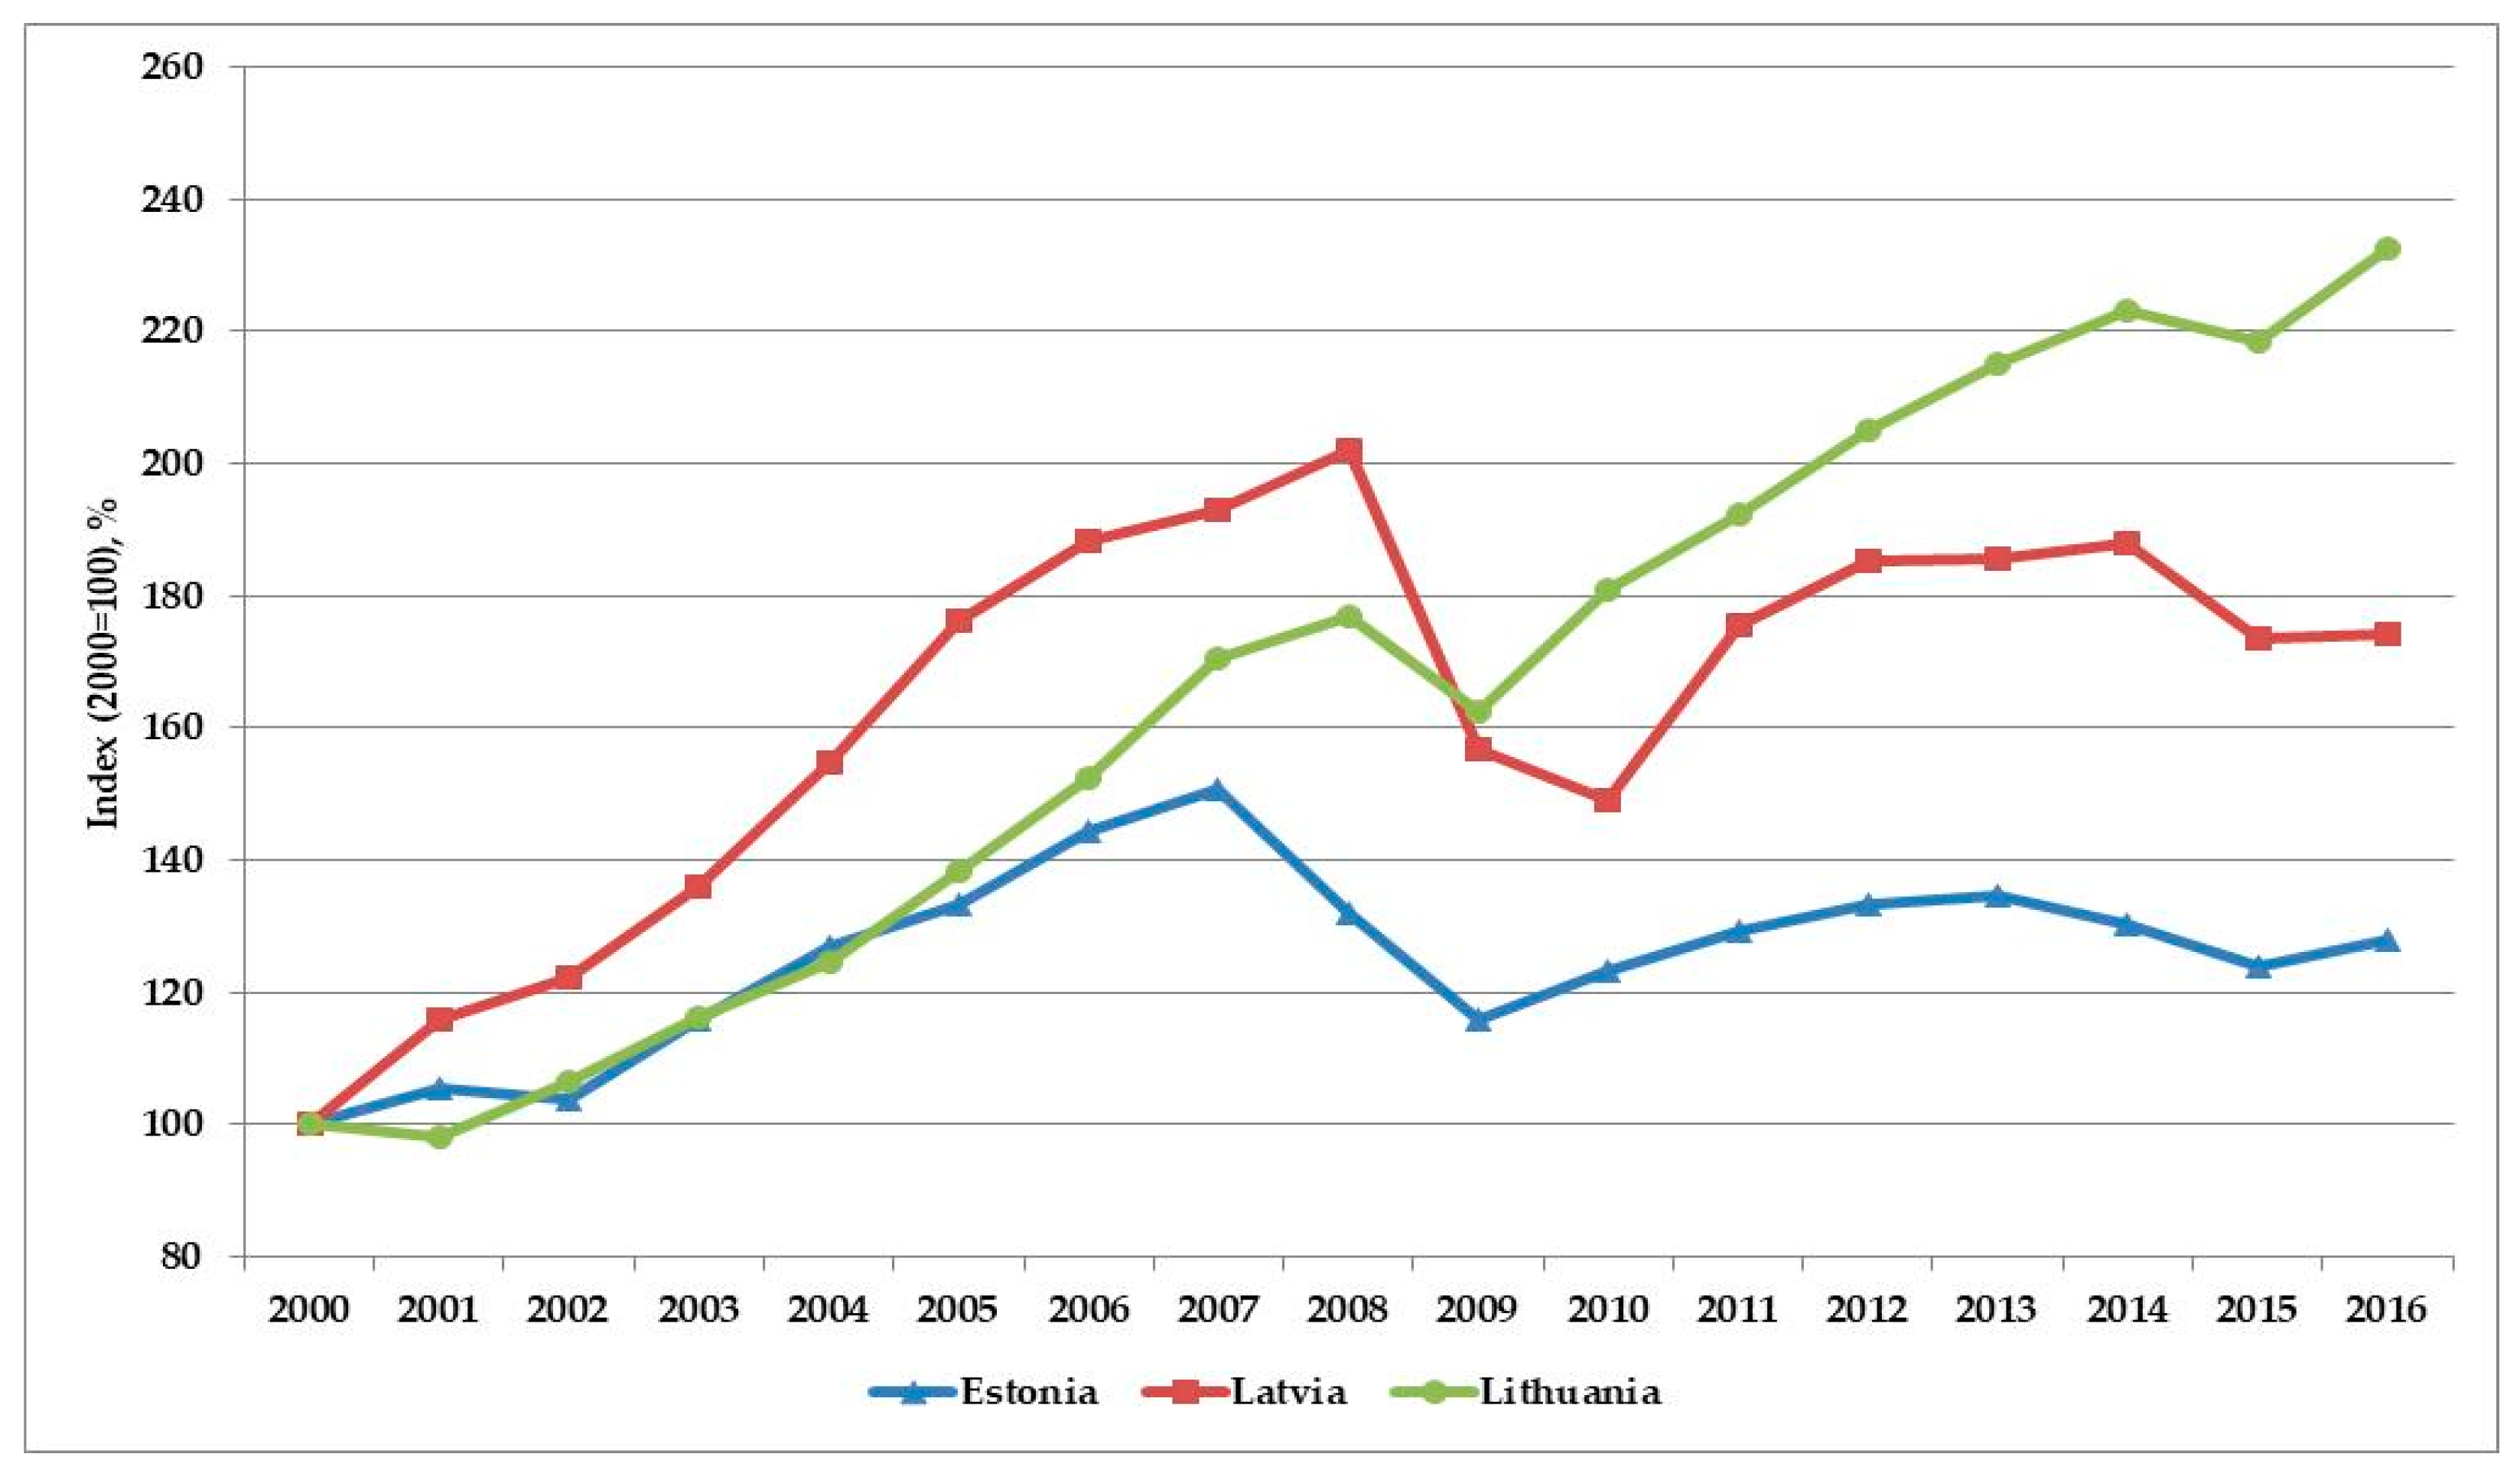
Figure 5). Large differences were caused by: a) specific geopolitical situation of each country; b) different actual contributions of this activity into gross value added (GVA); and c) the different roles of freight transportation. VA created in this activity in Lithuania was increasing over the period 2000–2016 on average by 5.4%, in Latvia by 3.5% and in Estonia by 1.6% per year. In 2016, VA growth index of this activity exceeded the 2000 level in Lithuania by 132.4%, in Latvia by 74.4%, and in Estonia by 28.1%.
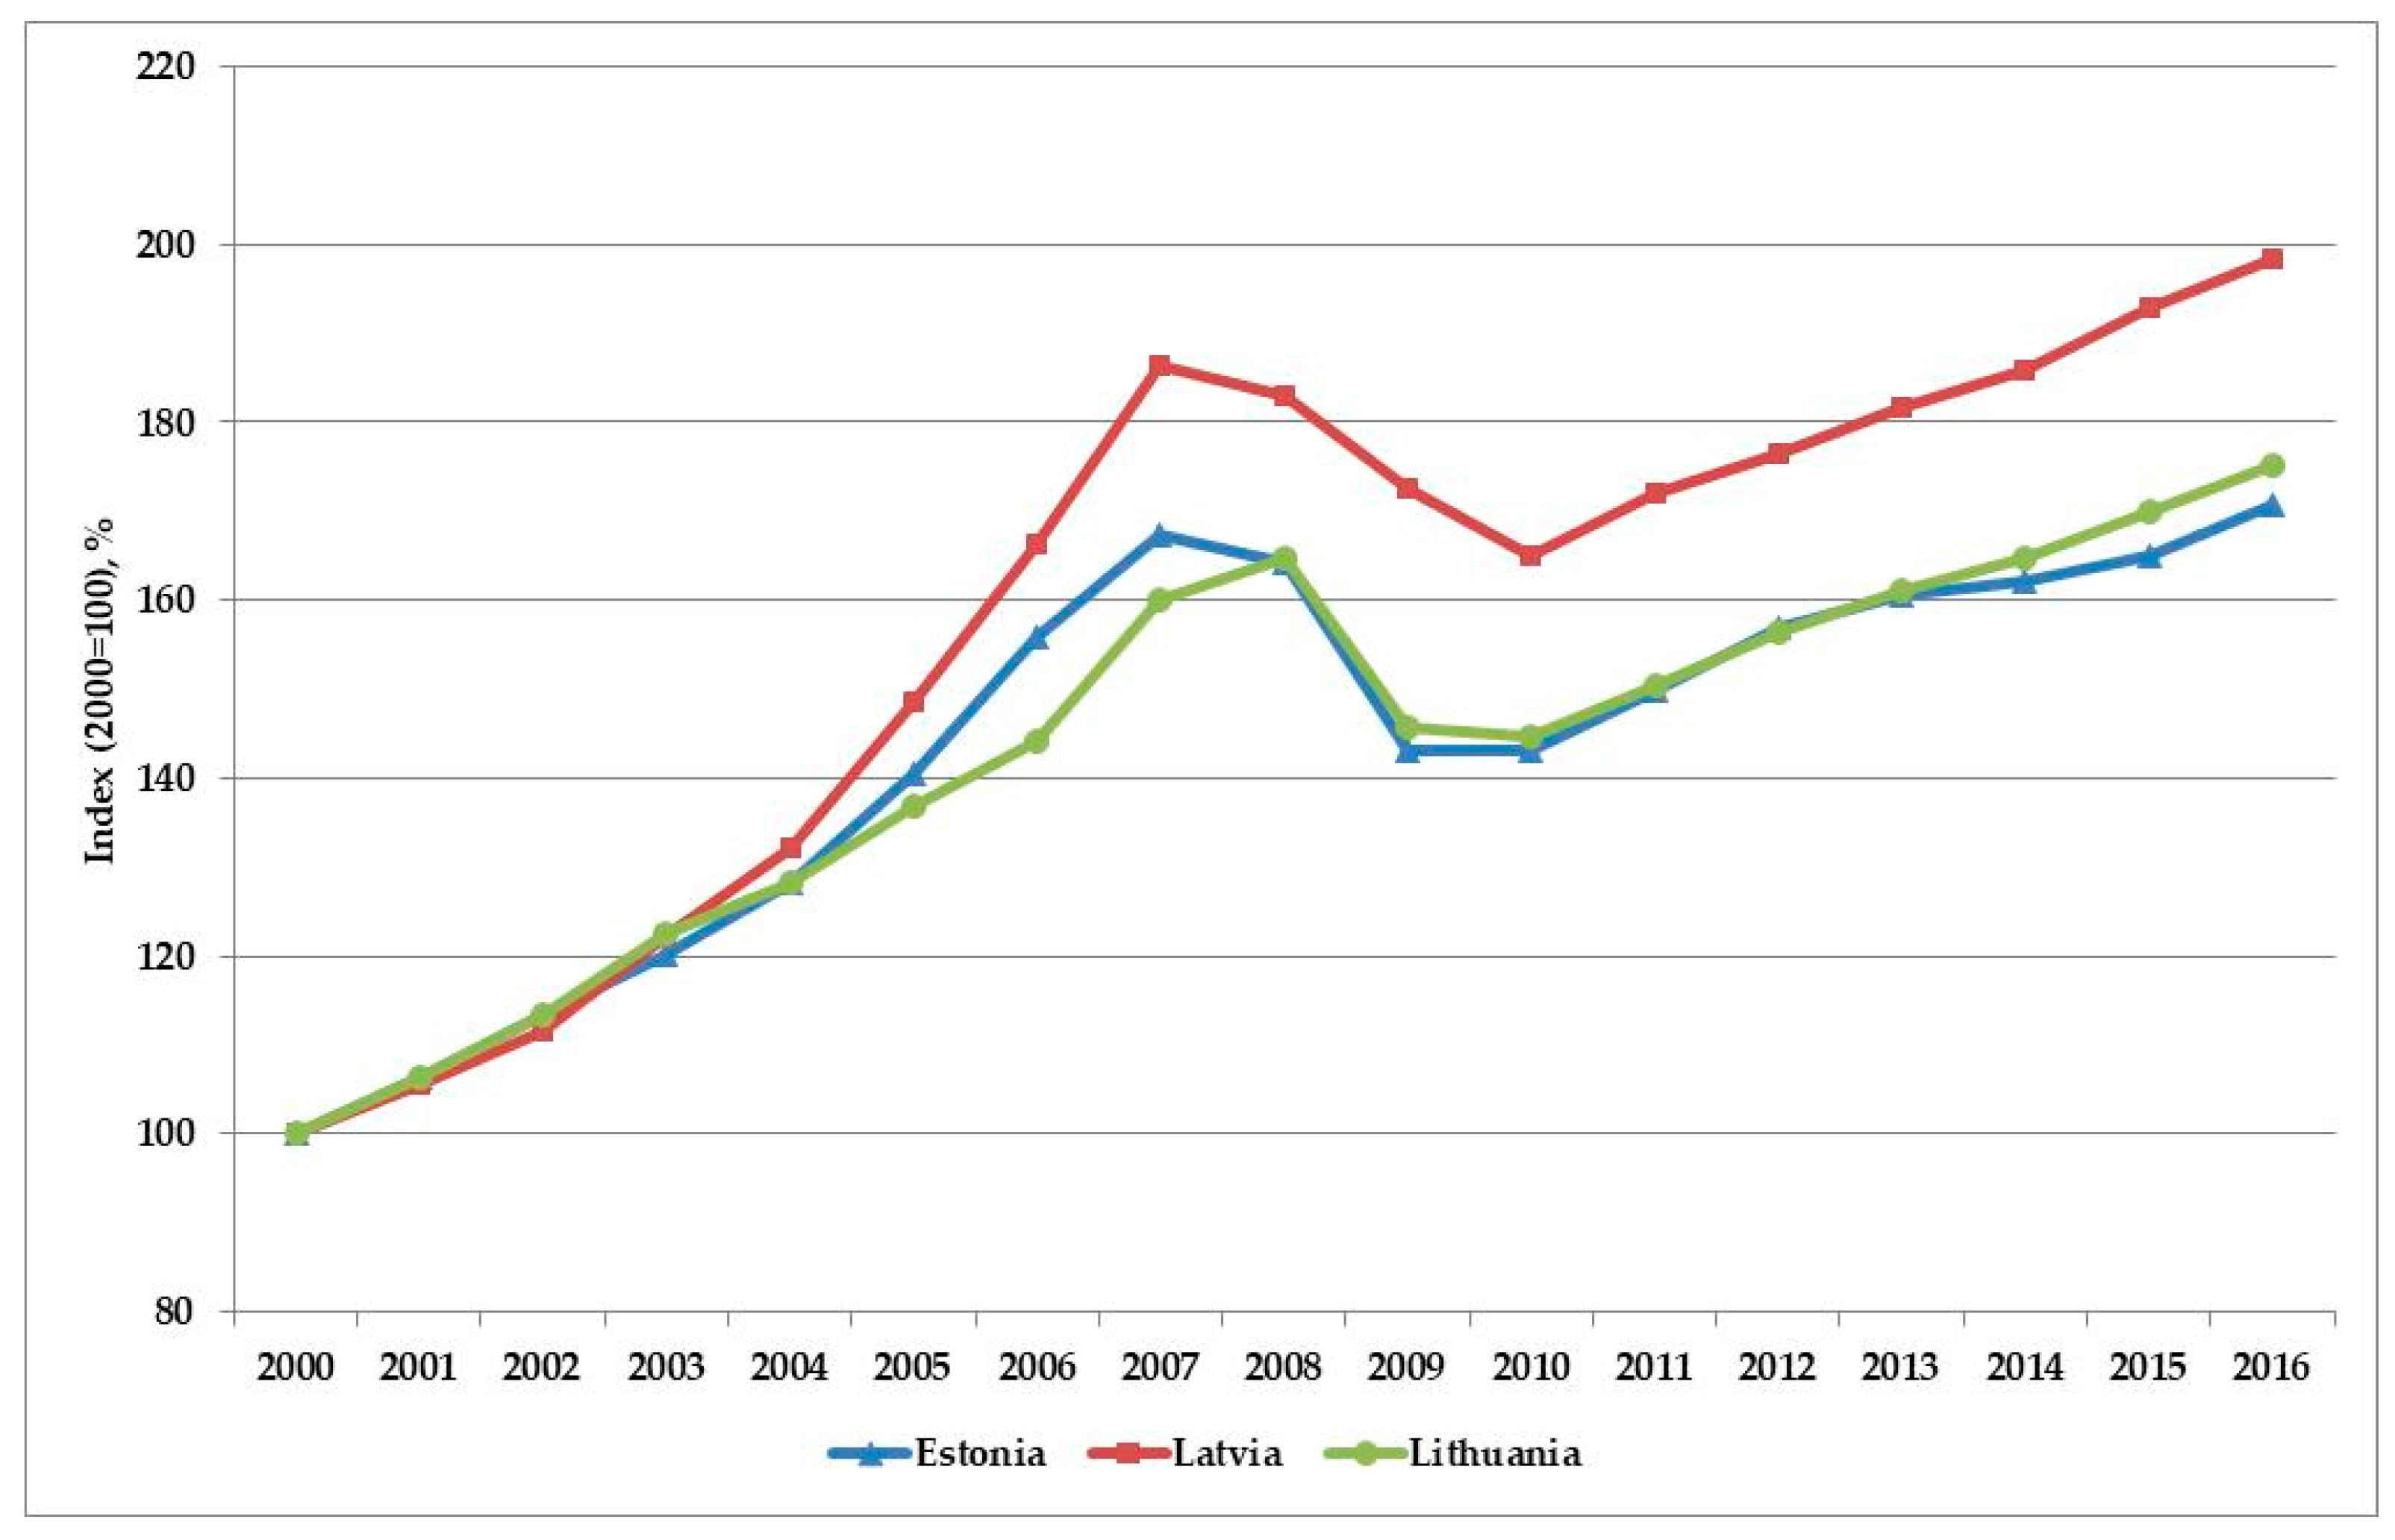
Total VA created in commercial and public services in Estonia and Lithuania was increasing over this period at quite a similar pace—in Estonia on average by 3.4% and in Lithuania by 3.6% per year. Development of this sector in Latvia was much faster and total VA was growing on average by 4.4% per year. One can see a tangible increase of VA growth index in all three countries—in 2016, it was higher than the 2000 level in Estonia by 70.6%, in Lithuania by 75.1%, and in Latvia by 98.3% (
Figure 6).
In-depth analysis of VA created in separate sectors has shown large changes in a structure of GDP by sectors. As one can see from data presented in
Table 1, the most substantial contribution into GVA in all three countries is coming from activities in commercial and public services but the share of this sector in the structure of GVA in each country is different. The role of this sector was increasing during the period 2000–2016 in Latvia, was comparatively stable in Estonia, and was decreasing in Lithuania. In 2016, the share of this sector in Latvia amounted to 62.7%, in Estonia to 59.8%, and in Lithuania to 54.7%.
It is important to point out that changes in the role of the industry sector are also different. The share of this sector was increasing over this period in Estonia and Lithuania but was decreasing in Latvia. In 2016, its share in Estonia amounted to 23.5%, in Lithuania to 23.6%, and in Latvia to 16.9%.
The share of transportation and storage activities increased in Lithuania, was comparatively stable in Latvia, but decreased in Estonia. In 2016, the role of this sector was very different—its share in Estonia amounted to 7.8%, in Latvia to 10.4%, and in Lithuania to 12.4%.
Activities in the construction sector and its shares in the GVA were growing very fast in all three Baltic countries over the period 2000–2007. After significant reduction of activities due to economic recession, the shares of this sector in the GVA are similar: in 2016, it amounted in Estonia to 6.0%, in Latvia to 5.3%, and in Lithuania to 6.1%. The growth of VA created in agriculture over the period 2000–2016 was moderate, and its share in the structure of the national economies is decreasing in all three countries.
4. Development of Primary Energy Supply and Consumption
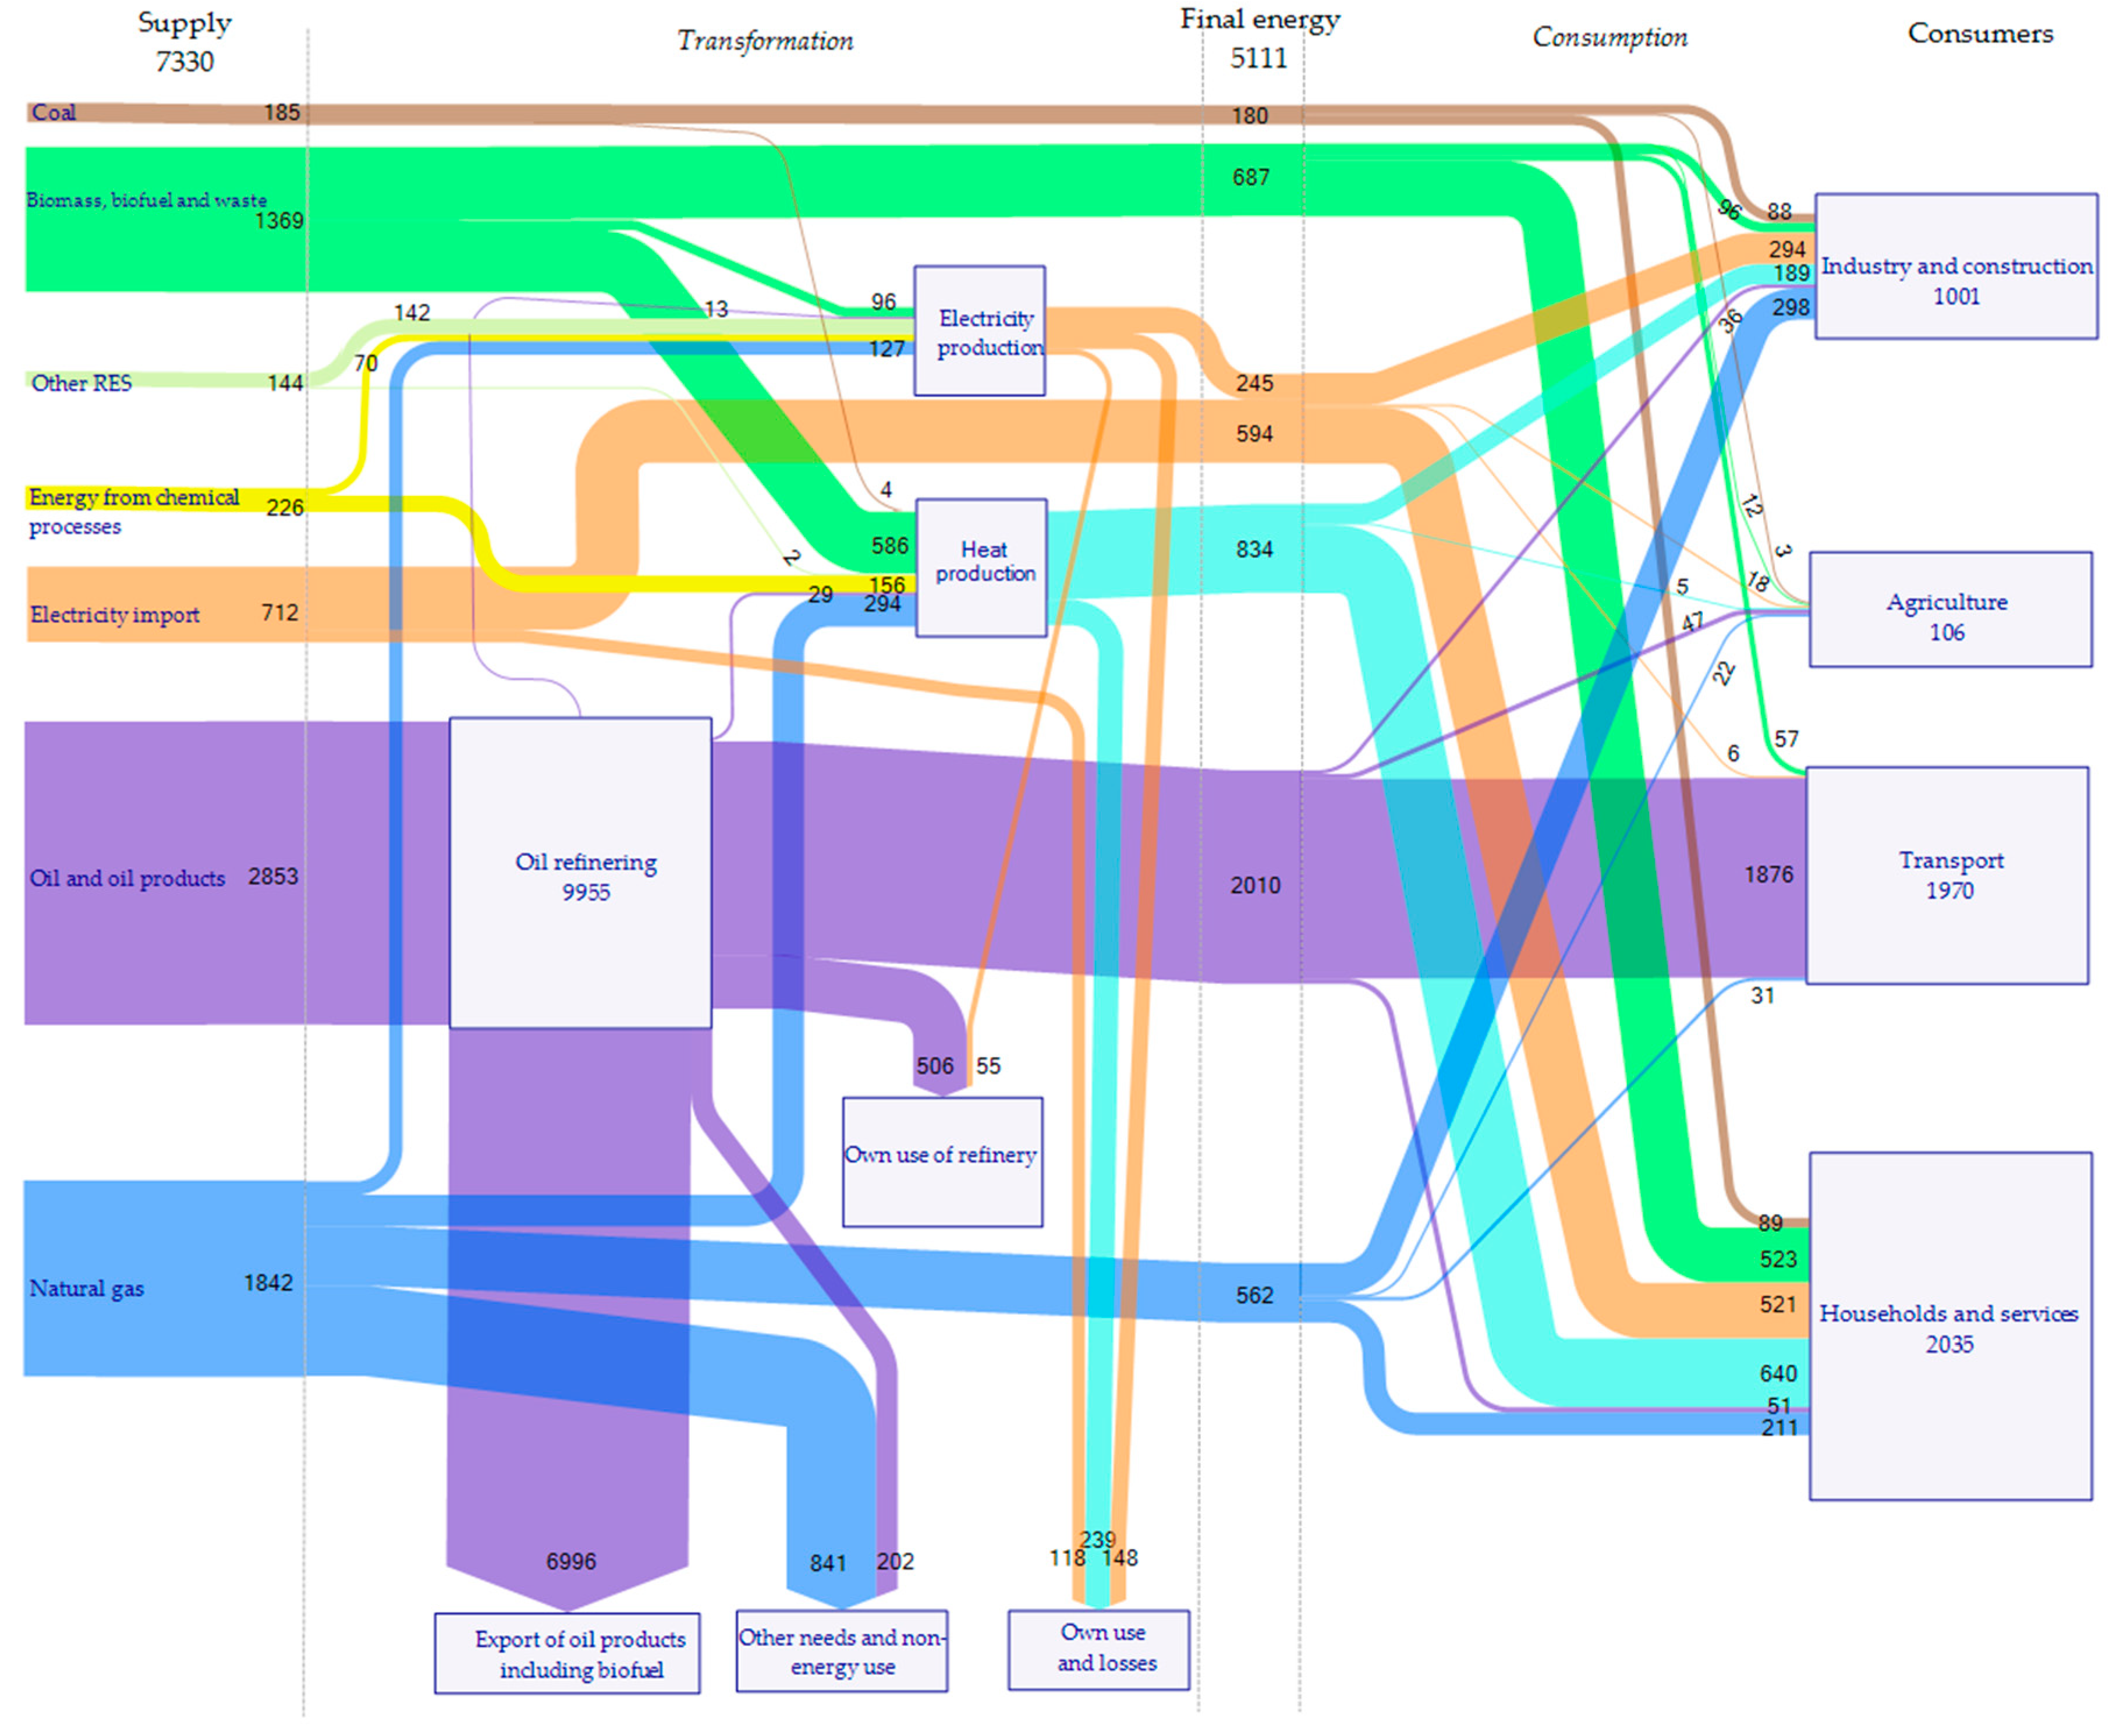
The total amount of primary energy supplied to Lithuania in 2016, its use in the energy transformation sector, and final energy consumption are demonstrated by a diagram of the main energy flows (
Figure 7). This chart was elaborated by authors of this review based on data of the country’s energy balance prepared by Statistics Lithuania [
63]. The amount of each energy resource at each chain of energy flow corresponds to the energetic value of physical energy flow expressed in a common unit, thousand tonnes of oil equivalent (ktoe). The width of each energy flow illustrates its contribution into the balance of gross inland energy consumption, use for generation of electricity and district heat, non-energy use, final energy consumption in sectors of the economy, etc. The exemption in this diagram is a flow of exported petroleum products, which is represented in different scale because the amount of exported petroleum products exceeds the volume of their consumption for all country’s needs by 2.5 times.
The main components of energy consumption by the main purposes in the Baltic states over the period 2008–2016 are presented in
Table 2. These components are determined applying the same principles of the energy balance construction in each country and are based on data of the National Statistical Offices [
63,
64,
65].
It is important to point out that component of non-energy use of fuels in energy statistics is presented differently: 1) in the energy balance of Estonia and Lithuania as a component of gross inland energy consumption; 2) in publications of the IEA as a separate component of total final consumption; and 3) in the energy balance of Latvia as a component of final energy consumption in sectors of the economy. The role of this component in the Baltic states is very different. In 2016, the share of non-energy use in gross inland energy consumption in Estonia was equal to 1.0%, in Latvia to 2.2%, and in Lithuania to 14.2%. Seeking to provide a true comparison of final energy consumption in sectors of the national economies and in particular to determine interrelationships between final energy consumption and economic activities, non-energy use is given in our analysis as a separate component of gross inland energy consumption.
Based on analysis of data representing the development of the energy balances in the Baltic states, specific features of their energy sectors are revealed. Firstly, the total primary energy requirement is dependent very much on the structure of the energy transformation sector, other components of energy use, and final energy consumption. In 2016, the ratio of final energy consumption and gross inland energy consumption was very different: in Estonia it was equal to 51.5%, in Latvia to 86.7%, and in Lithuania to 69.7%. The major reason of such large differences is lying in specific features of the power systems and the role of other components in the structure of gross inland energy consumption in each country.
Secondly, essential changes in volume of primary energy losses in the energy transformation sector should be stressed. These losses correspond to the difference of total primary energy consumed for conversion into other energy forms and the amount of produced secondary energy resources. Since 2010, due to the closure of INPP, losses in the energy transformation sector in Lithuania decreased sharply, but increased slightly in Estonia and Latvia. Volume of total energy transformation losses in the Baltic region decreased by 34.1%—from 4.18 Mtoe in 2008 to 2.76 Mtoe in 2016. Generation of the same amount of electricity by hydro or wind power plants requires three times less primary energy than by nuclear power plants because the primary energy equivalent of electricity from these renewable sources is calculated assuming 100% conversion efficiency while from nuclear fuel only 33%. Thus, growing energy generation from RES will stipulate further reduction of these losses.
An important specific feature of the Estonian energy transformation sector is large electricity generation (it exceeds internal electricity demand) in power plants fired by oil shale with comparatively low efficiency. Based on data presented in the Statistical Office of Estonia, overall efficiency of electricity and heat generation was fluctuating over the period 2008–2016 in a range of 45.5–52.5%. The efficiency of oil shale conversion into shale oil (heavy and light fractions) and shale oil gas was fluctuating over this period in a range of 52.8–69.8%. Thus, the share of energy losses in the Estonian energy transformation sector was fluctuating in a range of 35.4–43.5% in gross inland energy consumption.
Hydro power plants are dominating in the Latvian power system and the main power plants fired by natural gas are operated in combined heat and power mode. In addition, electricity import covers a comparatively large part of electricity demand. Thus, the share of primary energy losses in the country’s energy transformation sector is low; it was fluctuating over the period 2008–2016 in a range of 3.9–6.3%.
The most radical changes in volume of primary energy losses were observed in the Lithuanian energy transformation sector. These changes were caused by the closure of INPP, which was dominating electricity generation sources in Lithuania over two decades. In 2009, when this power plant was in operation, the share of energy losses in electricity and district heat generation was equal to 26% of the country’s gross inland energy consumption. In 2016, owing to the significant decrease of electricity generation at conventional power plants, increase of electricity and district heat generation from RES, and due to high contribution of electricity import the share of energy transformation, losses amounted to 3.8%.
Another important feature of the Lithuanian energy sector should be also stressed—its powerful power system and regional oil refinery were developed taking into consideration the needs of the large FSU North-Western region. Thus, the share of own use by the energy sector in gross inland energy consumption is still the highest in the Baltic region with 9.1–11.2%. This indicator in Estonia was fluctuating over the period 2008–2016 in a range of 3.9–5.8%, and in Latvia of 1.3–2.1%.
The energy transmission and distribution losses are comparatively low in all three countries and their share in gross inland energy consumption is fluctuating by about 3%.
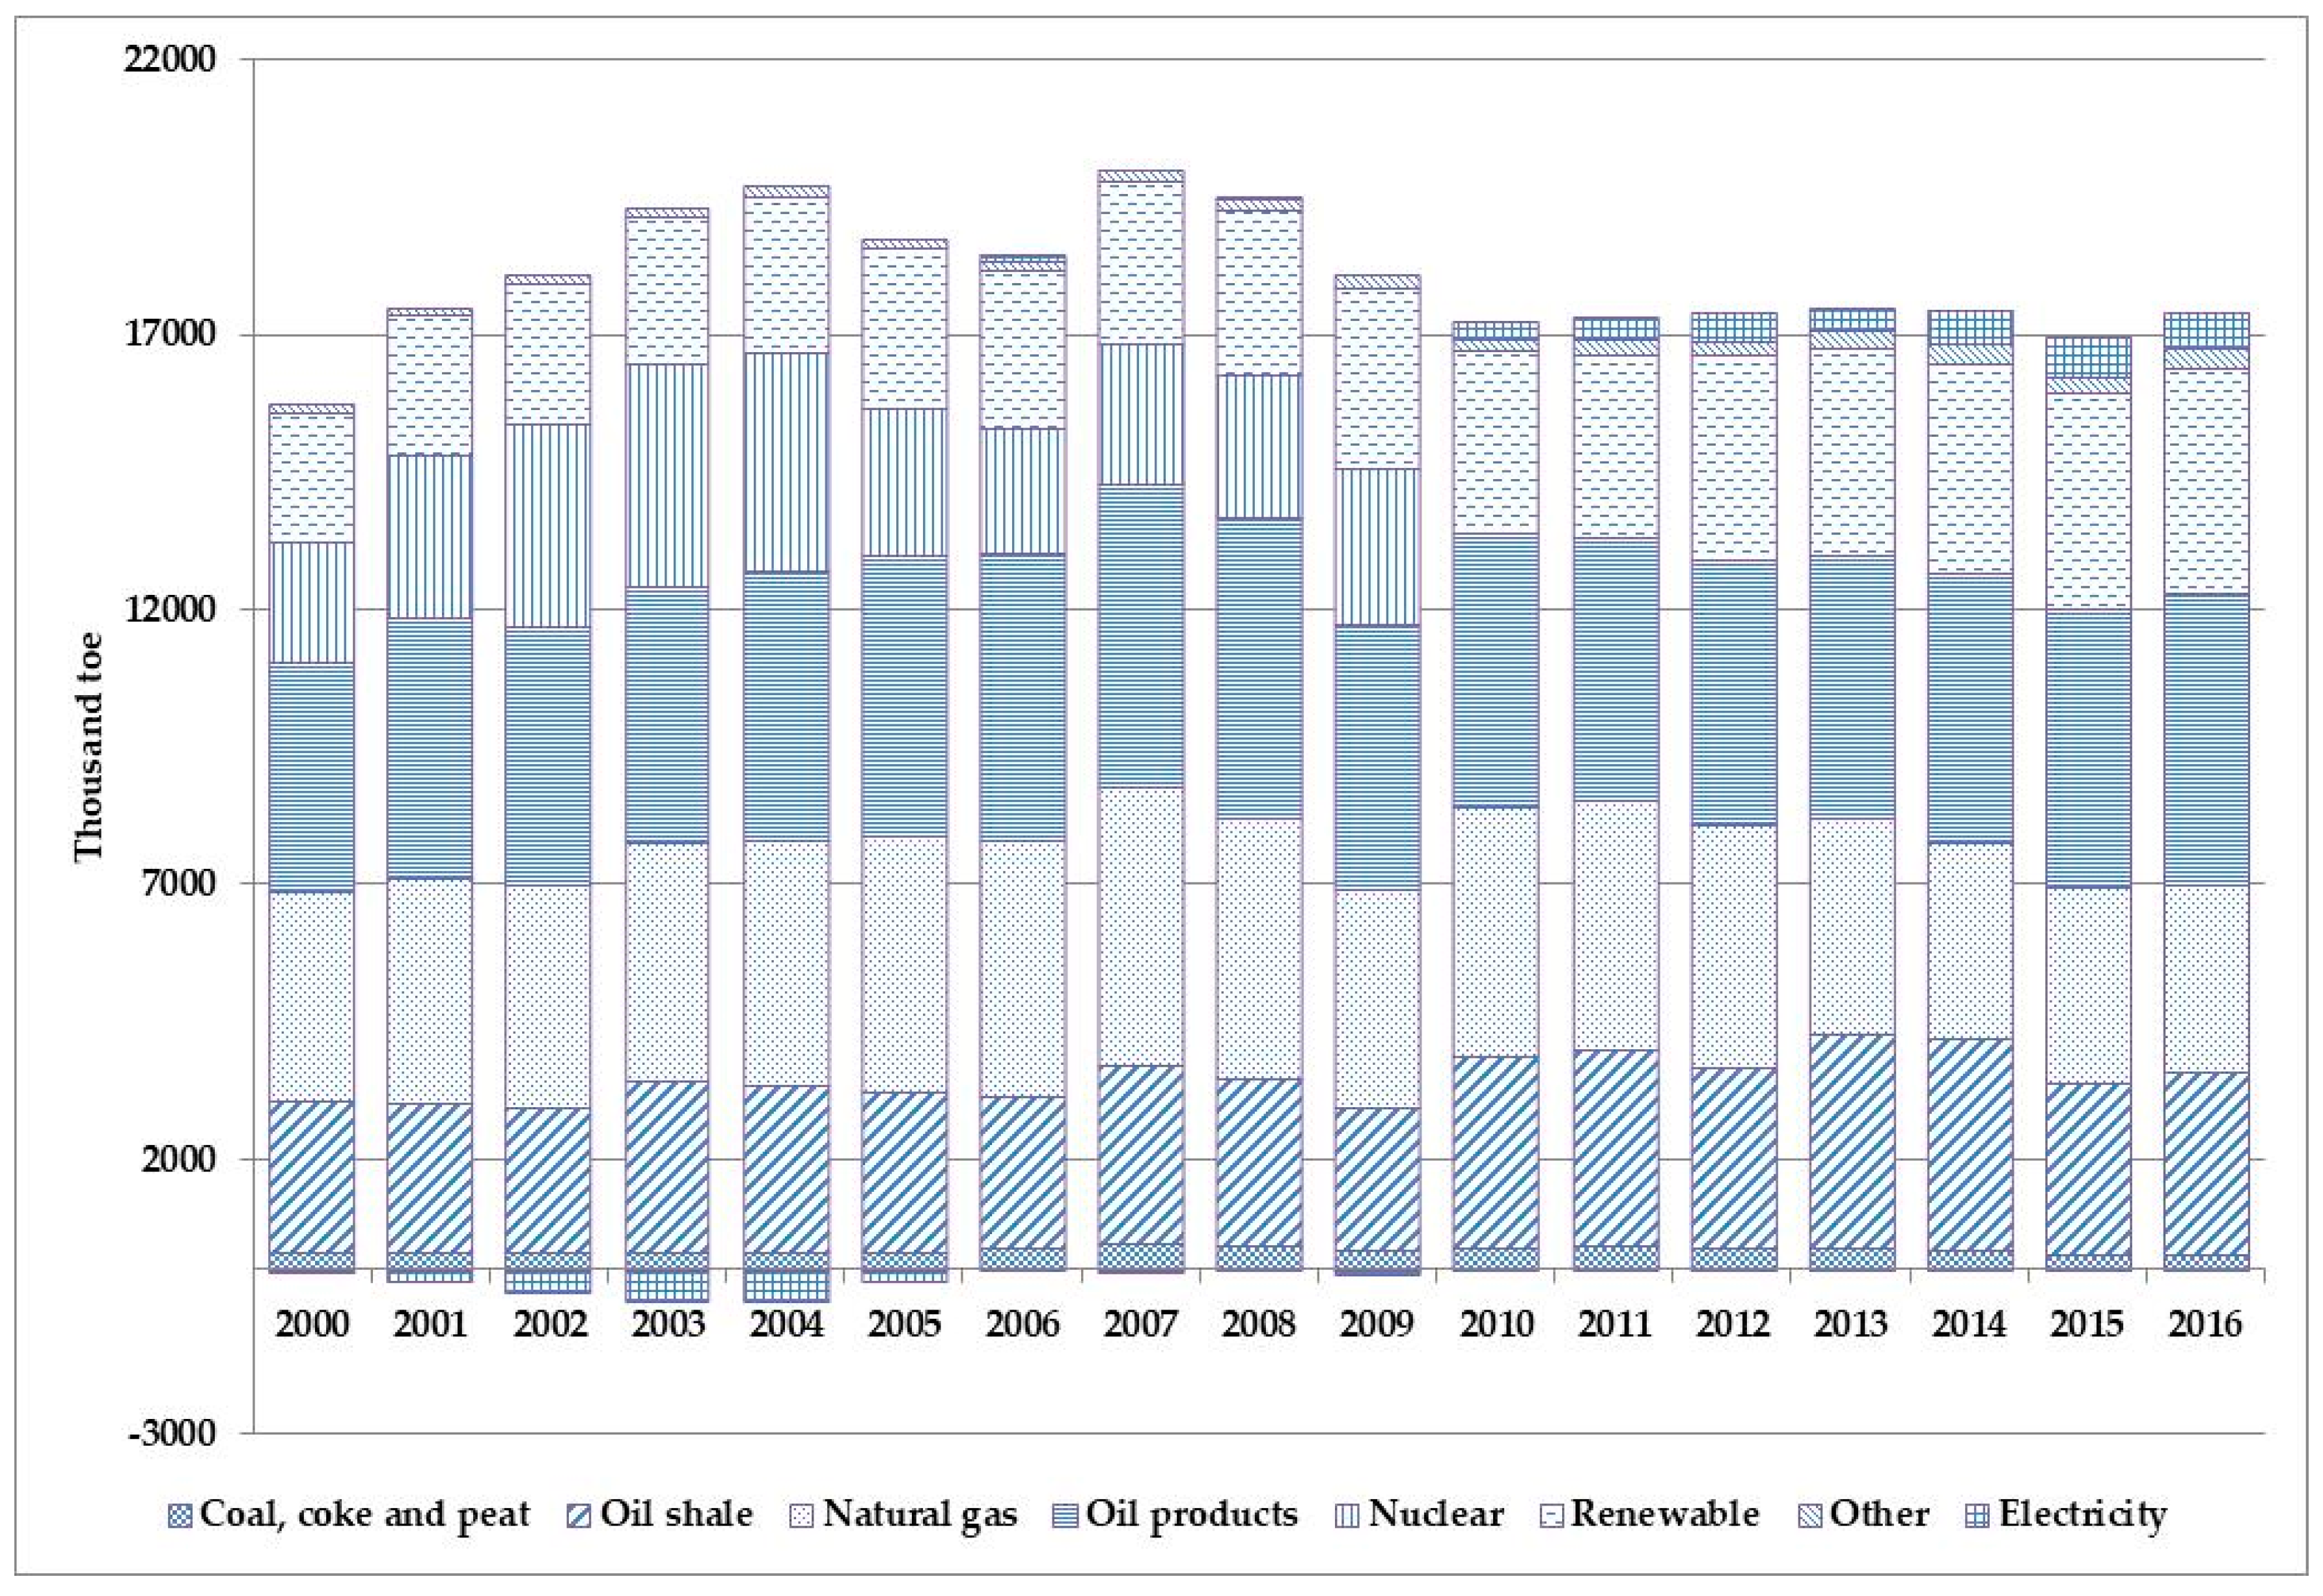
Based on data, presented in the Statistical Offices of Estonia, Latvia and Lithuania, the primary energy balance of the Baltic region for the first time was compiled by authors of this review. When analysing this balance one can see two different trends in gross inland energy consumption: 1) gradual growth over the period 2000–2007; and 2) a relatively stable amount of gross inland energy consumption since 2010 (
Figure 8).
Due to fast economic growth of the national economies gross inland energy consumption was increasing during the period 2000–2007 in all three countries—in Estonia on average by 2.8%, in Latvia by 3.2%, in Lithuania by 4.0%, and in the Baltic region by 3.5% per year. In 2009, owing to the impact of the economic recession, gross inland energy consumption decreased in Estonia by 10.8%, in Latvia by 3.8%, in Lithuania by 8.3%, and the Baltic region by 7.9%. In 2010, due to the closure of the INPP, gross inland energy consumption in Lithuania decreased by 18.9%, but it increased in Estonia by 16.4% and in Latvia by 2.9%. To cover the loss of the INPP, electricity generation from fossil fuels has increased in Estonian power plants by 47.7% and in Latvian thermal power plants by 48.3%. Variation of gross inland energy consumption in the Baltic region during the period 2010–2016 was caused mostly by changes in volumes of electricity generation at Estonian thermal power plants. For instance, reduction of their generation in 2015 by 19.5% stipulated a decrease of gross inland energy consumption in Estonia by 9.5% and in the Baltic region by 2.9%
Oil products are the most important fuels in the Baltic region—their share in gross inland energy consumption was fluctuating in a range of 24.8–30.6%. The role of natural gas is also significant—its share was fluctuating about 24.0% but was decreasing over the last few years and amounted to 19.4% in 2016.
The role of the nuclear—the cheapest imported fuel—was important during the period 2000–2009 in the Baltic region, and in particular in Lithuania. Its share in the Baltic region was fluctuating between the highest value of 21.3% in 2003 and the lowest value of 12.2% in 2006.
Consumption of oil shale is dependent very much on volumes of electricity generation in Estonia. Its share in primary energy balance of the Baltic region was fluctuating between the lowest value of 14.6% in 2009 and the highest value of 22.1% in 2013.
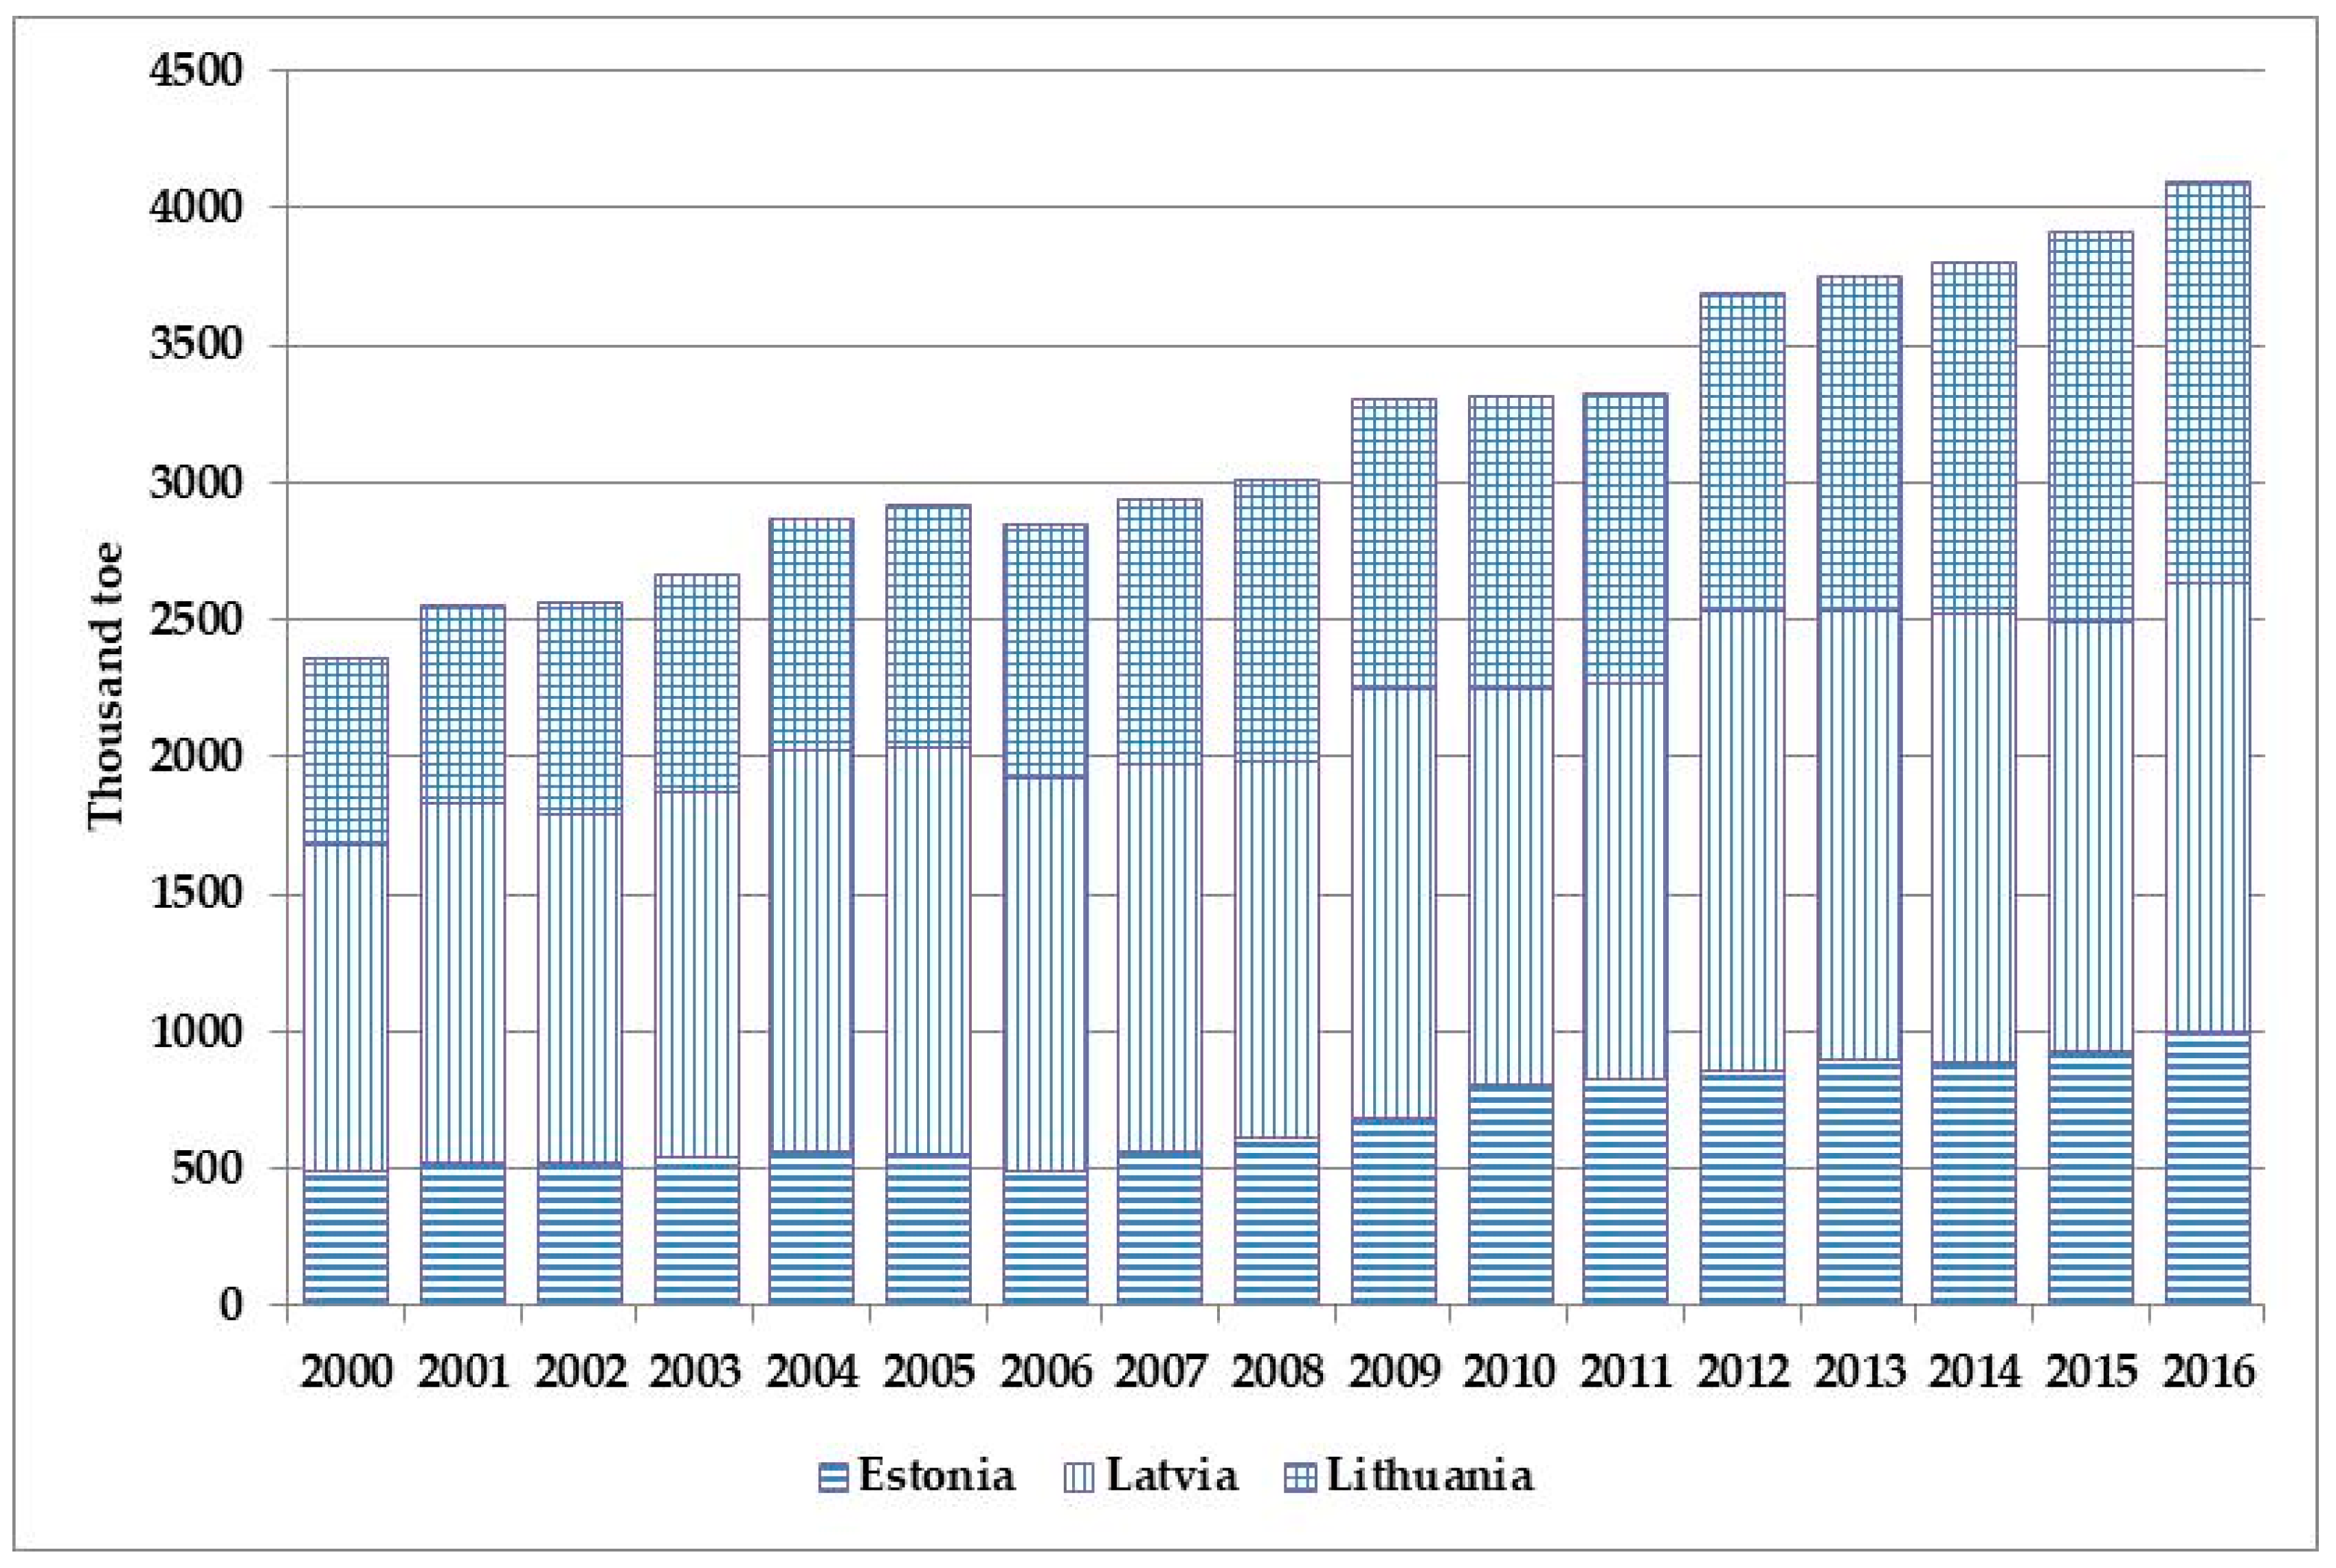
Energy policy of the EU oriented to mitigation of climate change is an essential factor stimulating the efforts of the Baltic states to increase consumption of RES—firewood, wood chips, wood waste, hydro-, wind and solar energy, biogas, bioethanol, biodiesel, etc. Due to implementation of modern technologies, their total consumption was growing fast during the period 2000–2016—in Latvia on average by 2.0%, in Estonia by 4.5%, in Lithuania by 4.9%, and in the Baltic region by 3.5% per year. It is important to point out that electricity generation by hydro and wind power plants in this analysis was not normalised taking into consideration that actual data demonstrate the real contribution from RES and changes year by year. Thus, one can see fluctuations, which are stipulated by variation in the snow and rainfall. These fluctuations are tangible in Latvia with high electricity generation by hydro power plants (
Figure 9). The total volume of energy from RES increased over this period in the Baltic region by 73.6%, and their share in gross inland energy consumption has increased from 15.1% in 2000 to 23.6% in 2016.
Currently, Estonia is net electricity exporter. Vice versa, Latvia is net electricity importer. Lithuania was net electricity exporter during the period 2000–2009. After the closure of the INPP, existing conventional Lithuanian power plants, including the modern combined cycle gas turbine unit, are not competitive in the Baltic electricity market. Since 2010, Lithuania has become an electricity importing country. The share of electricity import in gross inland energy consumption in the Baltic region was increasing gradually—from 1.8% in 2010 to 3.6% in 2016.
The role of coal, coke, peat, municipal waste and other local energy sources in the Baltic region is minor—in 2016, their total share in gross inland energy consumption amounted to 3.5%.
5. Trends in Final Energy Consumption
To have a correct comparative analysis of final energy consumption in the Baltic states and to summarise trends of final energy consumption on the regional level, harmonisation of data presented in National Statistical Offices was performed: 1) energy resources used in various activities as raw materials or materials, for instance oil bitumen used in construction, lubricants used in the transport sector, natural gas used for production of fertilisers, were subsumed in each country under the item “non-energy use”; 2) all fuels consumed by individual transport means were included into item “consumption in transport” (in the official energy balance of Estonia motor fuel used by private cars is included into final energy consumption in the residential sector); 3) the construction sector in all three countries is analysed as a separate sector (in Estonian and Latvian energy balance this sector is a component of the industry sector); and 4) agriculture and fishing are analysed as one sector (in Latvian and Lithuanian energy statistics as two separate components). Thus, data from national statistics have been harmonised seeking to enable true comparability of data across countries and by sectors of the economies as well as to summarise changes on the regional level.
5.1. Changes of Final Energy Consumption in Sectors of the National Economies
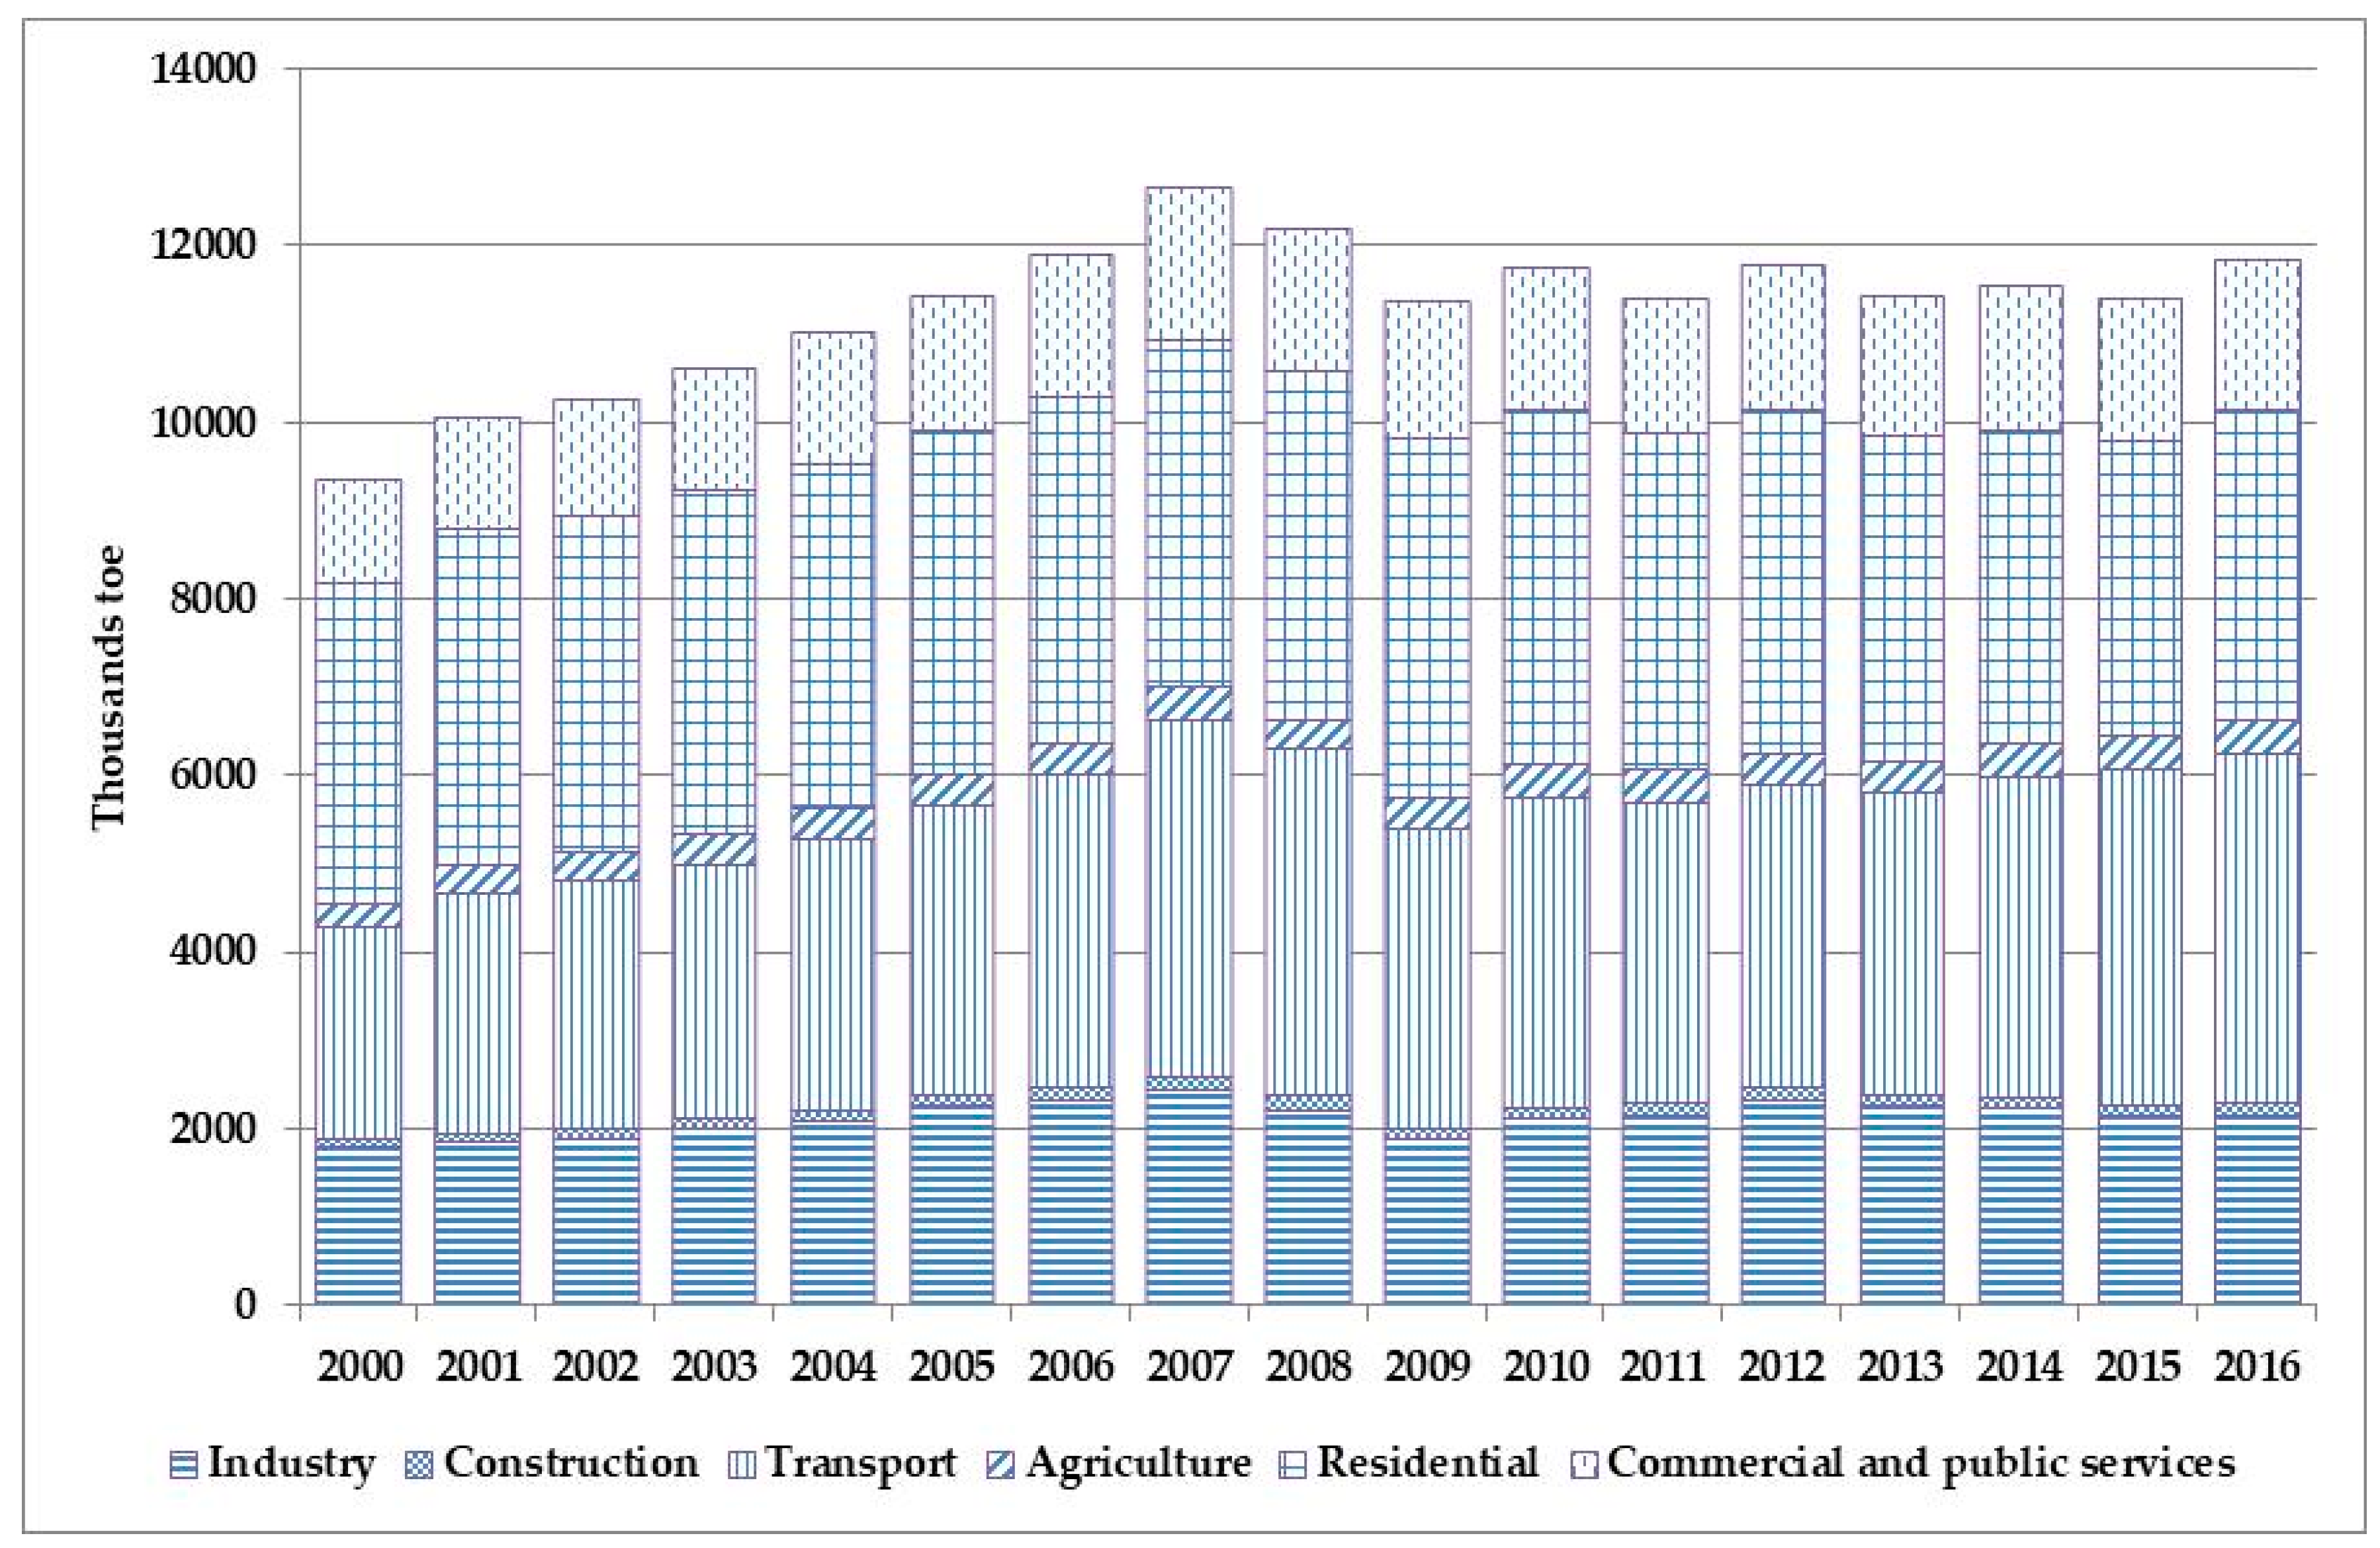
Important conclusions can be drawn based on analysis of final energy consumption trends in Estonia, Latvia and Lithuania. Firstly, fast development of their national economies was followed over the period 2000–2007 by a corresponding increase of final energy consumption in all sectors (
Figure 10). Total final energy consumption was increasing in Lithuania on average by 4.8%, in Latvia by 4.3%, in Estonia by 4.0%, and in the Baltic region by 4.4% per year.
Secondly, the very fast growth of final energy consumption in the transport sector should be stressed—in Latvia it was increasing over this period on average by 8.6%, in Lithuania by 8.3%, in Estonia by 5.9%, and in the Baltic region by 7.8% per year. The main reasons for such a trend were two factors—the continuous growth of activities in freight and passenger transportation as well as increasing mobility of the population.
Thirdly, the impact of the global economic recession on final energy consumption was significant. In 2008, economic activities and energy consumption started to decline in all three countries. In 2009, final energy consumption decreased in Lithuania by 9.5%, in Estonia by 7.8%, in Latvia by 2.8%, and in the Baltic region by 6.8% compared with the 2008 level.
Changes in final energy consumption in the Baltic region over the period 2010–2016 are minor. However, one can point out that trends of final energy consumption in separate sectors of the economy are rather different. In 2016, final energy consumption in the industry sector was higher by 2.6%, in construction by 14.6%, in the transport sector by 11.4%, in agriculture by 12.9%, and in commercial and public services by 3.7% compared with the 2010 level. Final energy consumption in the residential sector decreased over this period by 12.5% due to the refurbishment of living houses and modernisation of their heating systems. Energy consumption in the transport sector is growing continuously. Thus, strong energy policy interventions in this sector are required.
Harmonised data have been used seeking to perform analysis of structural changes in the Baltic countries. The main conclusion—development of less energy-intensive sectors was faster in all three countries. One can point out that the most important changes in a structure of the Estonian final energy consumption during the period 2000–2016 are the following: a) a decrease of the industry sector share from 21.7% to 17.0%; b) a significant decrease of the residential sector share from 39.6% to 31.9%; c) a moderate increase of the transport sector share from 24.7% to 27.9%; and d) a significant increase of the commercial and public services share from 10.2% to 16.8%.
Structural changes in the Latvian final energy consumption are the following: a) a small increase of the industry sector share from 17.1% to 18.7%; b) a significant decrease of the residential sector share from 40.7% to 29.9%; c) an increase of the transport sector share from 23.1% to 30.3%; and d) a small increase of the commercial and public services share from 14.5% to 15.6%.
Structural changes in the Lithuanian final energy consumption are demonstrated by: a) a small decrease of the industry sector share from 19.7% to 18.8%; b) a decrease of the residential sector share from 36.2% to 28.1%; c) a significant increase of the transport sector share from 28.0% to 38.5%; and d) a small decrease of the commercial and public services share from 12.3% to 11.8%.
5.2. Changes of Final Energy Consumption in the Manufacturing Sector
Changes in the structure of final energy consumption by branches of the manufacturing sector over the period 2000–2016 are tangible. Economic resources were directed to branches treated as significant in speeding up economic growth, developing industries with greater value added, increasing energy efficiency, using local and renewable energy sources. The certain decline of some traditional branches, such as the manufacture of textiles and leather, the manufacture of food products, and the manufacture of non-metallic mineral products, was caused by natural market forces. Specific features of changes could be stressed in each country (
Table 3).
Radical changes of final energy consumption in the manufacturing sector were observed in Latvia: a) the share of manufacture of metals decreased from 24.9% in 2000 to 0.3% in 2016; b) while the share of manufacture of wood and wood products increased sharply—from 15.0% to 62.3%.
A specific feature of final energy consumption in the Lithuanian manufacturing sector is the significant contribution from waste heat utilised at factories producing mineral fertilisers. Currently, more than 40% of final energy consumed for manufacture of chemicals and chemical products is covered by this local energy source. Thus, changes in the structure of final energy consumption in the Lithuanian manufacturing sector are affected by this feature: a) the share of manufacture of chemicals and chemical products increased from 21.7% to 36.4%; b) the share of other non-metallic mineral products decreased from 20.7% to 14.7%; c) the share of textile and leather decreased from 9.5% to 3.7%; and d) the share of manufacture of wood and wood products increased from 4.8% to 10.7%.
The most tangible changes in Estonia are the following: a) the share of manufacture of chemicals and chemical products decreased from 17.4% to 6.6%; b) the share of wood and wood products increased from 12.7% to 27.3%; and c) the share of paper and paper products increased from 5.7% to 17.7%.
5.3. Changes of Final Energy Consumption by Energy Forms
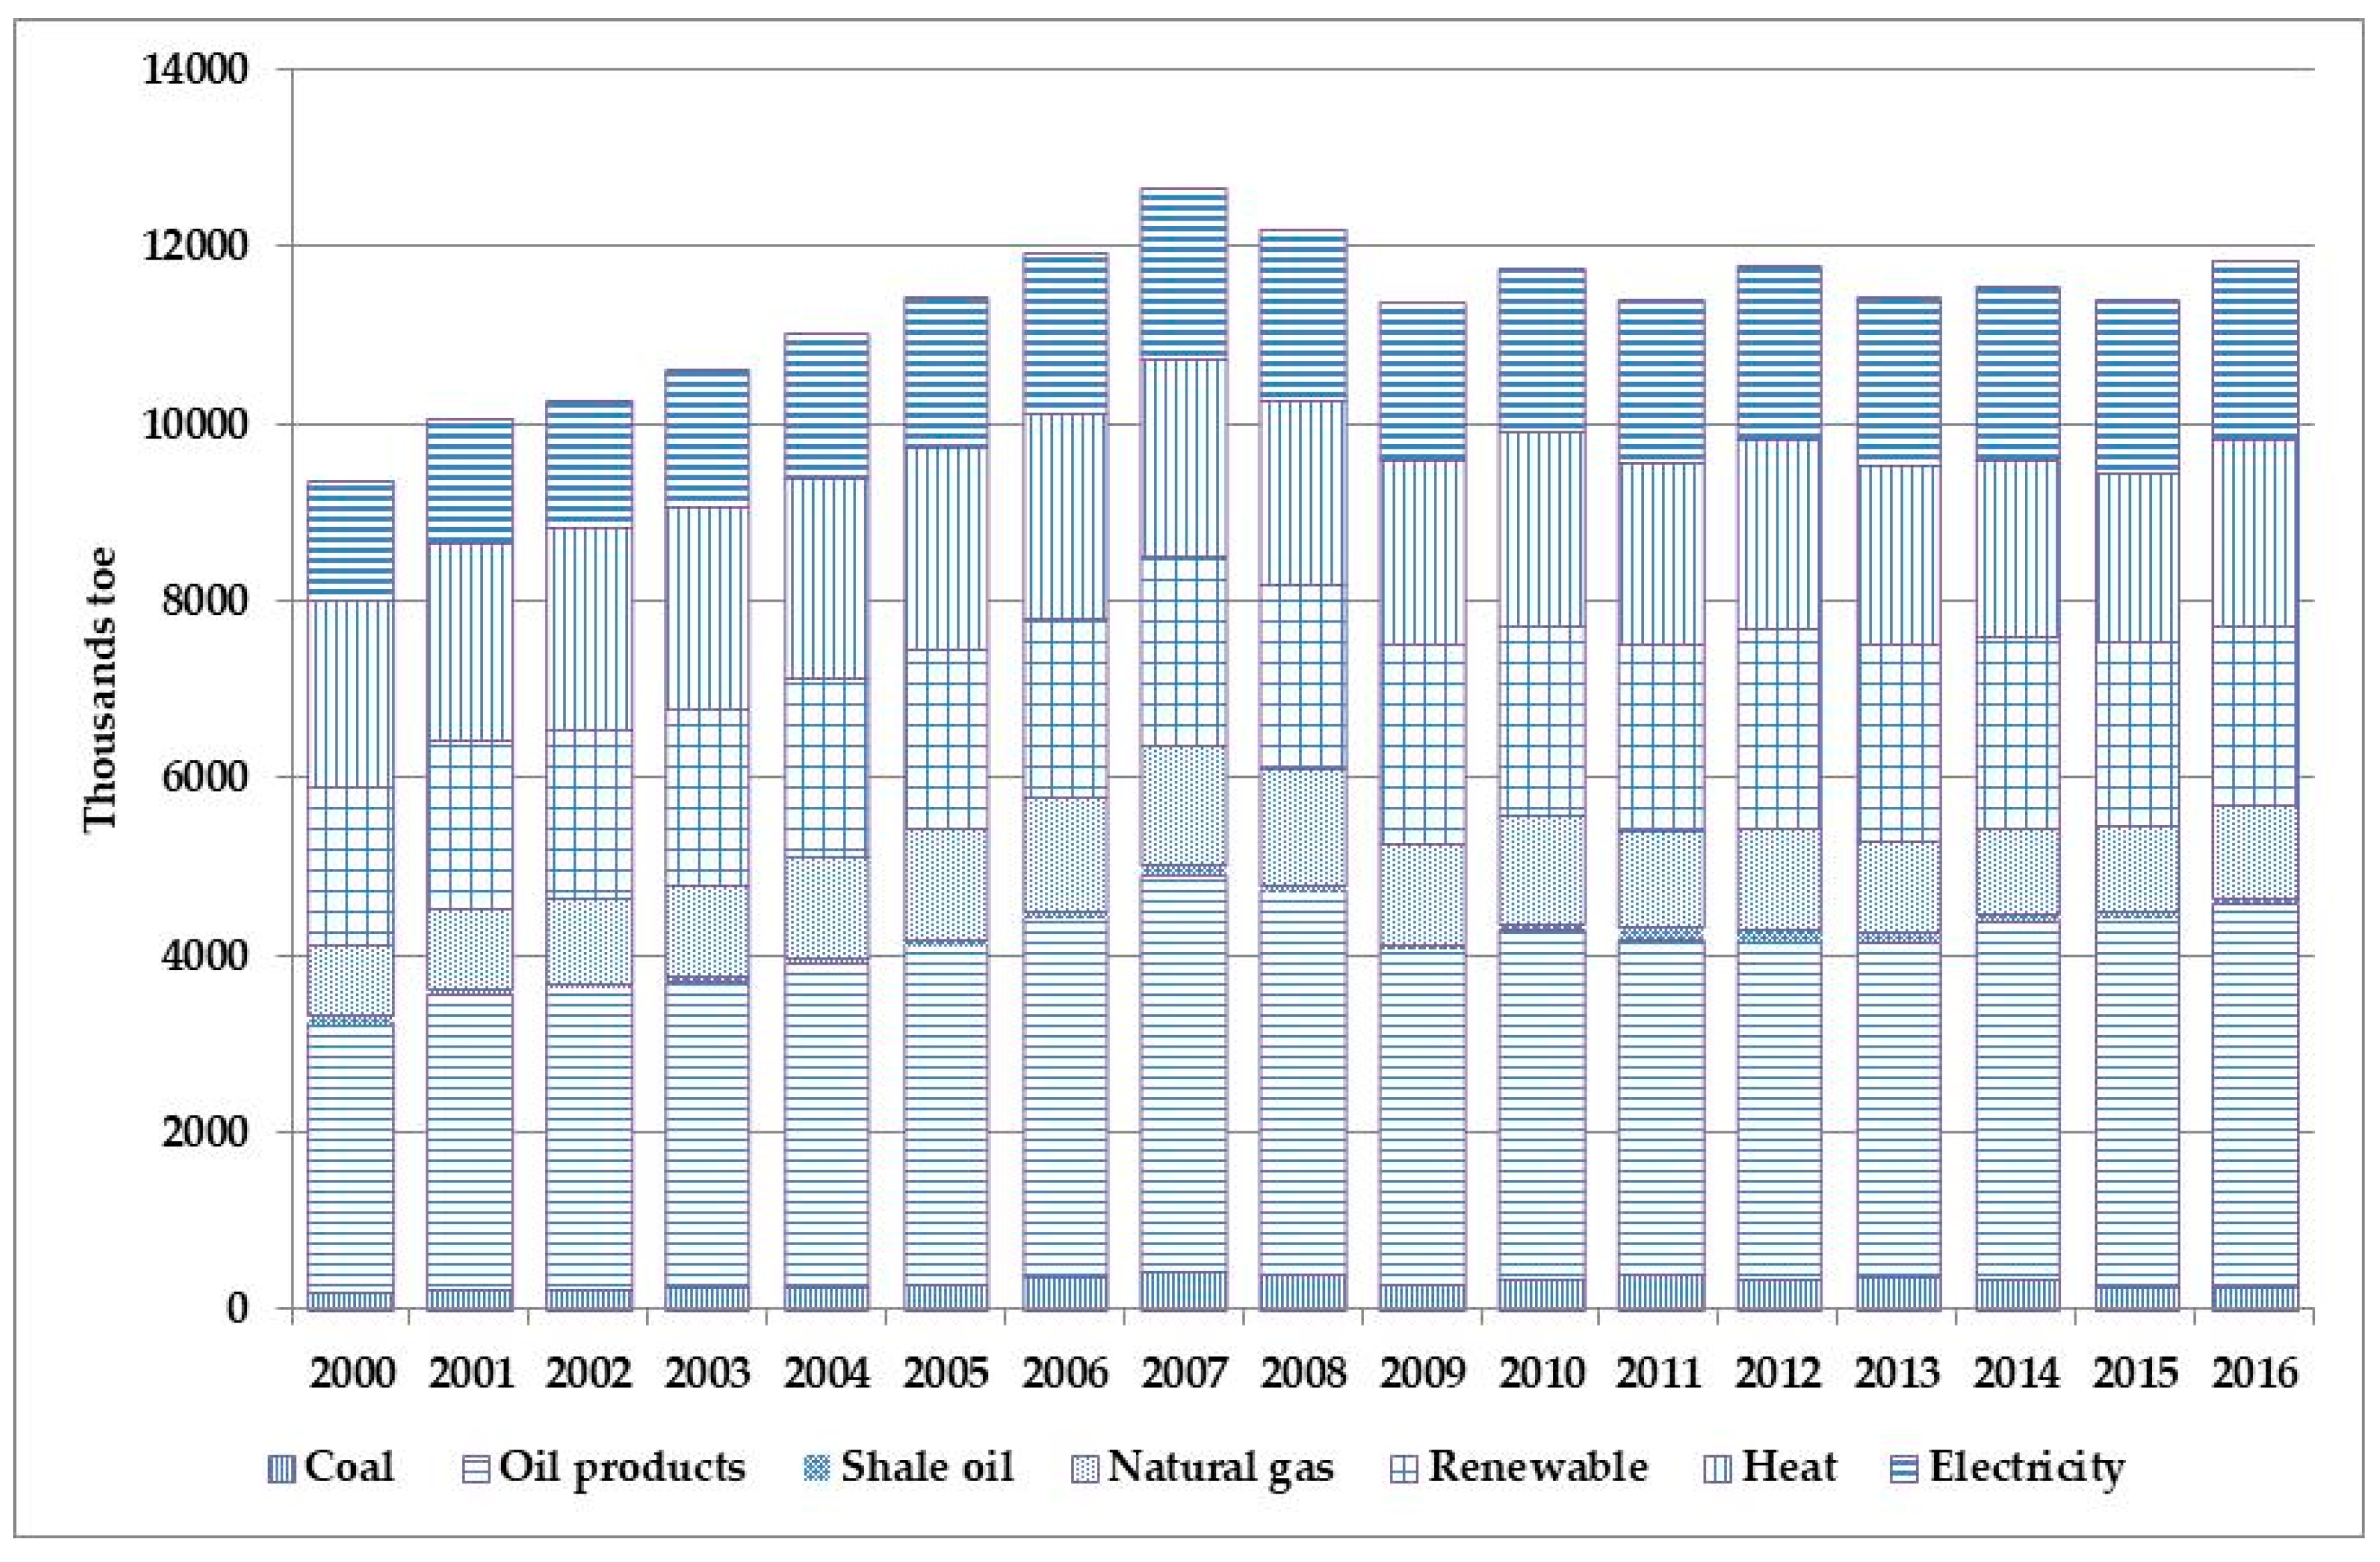
Trends in final energy consumption in the Baltic states by energy forms are shown in
Figure 11. Final consumption of oil products in the industry sector has decreased significantly—in 2016, it was in Lithuania by 83.5%, in Latvia by 76.8% and in Estonia by 19.7% less compared with the 2000 level. Despite this reduction, consumption of oil products was increasing over the period 2000–2016 in all three countries—in Estonia on average by 2.4%, in Latvia by 1.9%, in Lithuania by 2.5%, and in the Baltic region by 2.3% per year. This increase was stipulated mostly by the continuous growth of activities in the transport sector. In 2016, the share of this sector in final consumption of oil products was very high—in Estonia it amounted to 84.4%, in Latvia to 83.7% and in Lithuania to 93.3%. Consumption of oil products in agriculture increased slightly, and the share of agriculture in their final consumption is different: in 2016, in Estonia it amounted to 8.6%, in Latvia to 8.4%, and in Lithuania to 2.3% only.
Final consumption of natural gas, as the second important imported fuel, was increasing fast during the period 2000–2007 in all three countries—in Lithuania on average by 8.6%, in Estonia by 7.4%, in Latvia by 6.9%, and in the Baltic region by 7.3% per year. In 2009–2016, consumption of natural gas was decreasing in Latvia; but it was fluctuating with minor changes in Lithuania and Estonia. In 2016, the most significant share of natural gas in final energy consumption was observed in Lithuania with 11.0%; in Latvia it was equal to 8.5%, in Estonia to 5.2%, and in the Baltic region to 8.8%.
Direct final consumption of RES by end users is becoming more diverse in all three countries. Firewood is supplemented with wood briquette and pellets, wood waste, biogas, biodiesel, bioethanol, etc. The role of RES is important in final energy consumption of the Baltic states. In 2016, their share in Latvia was equal to 23.7%, in Estonia to 15.1%, in Lithuania to 13.4%, and in the Baltic region to 17.2%.
To stress trends in deployment of RES few important conclusions are drawn from the comparative analysis: a) consumption of RES over the last few years was increasing slowly in the industry and transport sectors; b) currently, fuelwood still has a dominating position in the balance of RES consumed by end users; in 2016, its share in Estonia was equal to 96.2%, in Latvia to 95.4%, and in Lithuania to 90.6%; c) the residential sector is still dominating in final consumption of fuelwood—in 2016, the share of this sector in Estonia was equal to 90,8%, in Lithuania to 77.9%, and in Latvia to 51.5%; d) fuelwood is used in the residential sector mostly for space heating and its consumption is fluctuating due to variation of climatic conditions; e) since 2009, consumption of fuelwood in the residential sector as well as in commercial and public services has been decreasing due to the refurbishment of buildings; f) an increase of fuelwood consumption in the industry sector could be expected in a future taking into consideration that its consumption in Latvia for the manufacture of wood and wood products in 2016 was three times higher compared with the 2008 level; g) a larger contribution into deployment of RES is expected from growing consumption of biofuels in the transport sector.
Consumption of district heat is decreasing slowly in all three countries. Nevertheless the role of this energy carrier is still important—in 2016, its share in final energy consumption in Latvia amounted to 15.2%, in Lithuania to 16.3%, in Estonia to 23.6%, and in the Baltic region to 17.7%. The contribution of the district heating sector into a reduction of GHG emissions should be stressed due to substitution of fossil fuels at power plants and heat plants by RES. For instance, the share of district heat generated from RES in Lithuania has increased from 2.5% in 2000 to 48.6% in 2016.
Final electricity consumption is growing continuously. Despite the negative impact of the global economic recession, it was increasing in Lithuania during the period 2000–2016 on average by 2.9%, in Latvia by 2.3%, in Estonia by 2.4%, and in Baltic the region by 2.6% per year. Electricity is becoming an increasingly important energy carrier in all sectors—in 2016, its share in final energy consumption in Latvia amounted to 14.6%, in Lithuania to 16.4%, in Estonia to 21.6%, and in the Baltic region to 17.1%. Growing generation of electricity and district heat from RES is a common trend in all three countries.
The total final consumption of fuels in sectors of the national economies was increasing over this period mostly due to growing consumption petroleum products in the transport sector. In 2016, the share of fuels in final energy consumption in Latvia was equal to 70.2%, in Lithuania to 67.3%, in Estonia to 54.8%, and in the Baltic region to 65.2%.
5.4. Relationships between Economic Growth and Energy Consumption
There are a large number of studies [
66,
67,
68,
69,
70,
71] focused on analysis of the relationship between energy consumption and economic growth in different countries or their groups, different time periods, using various methodologies, etc. The empirical results in many studies are diverse due to differences in methodologies applied for analysis, levels of energy consumption and economic situation, for instance in developed, developing, and emerging countries. In various studies the main four hypotheses were examined [
68]: the growth hypothesis, the conservation hypothesis, the feedback hypothesis, and the neutrality hypothesis. Despite the discrepancy in conclusions among researchers, such analysis of causality between energy consumption and the economic growth is still ongoing and important for implementation of suitable policy measures in economies and the energy sectors.
Analysis of long-run relationships between economic growth and final energy consumption in the Baltic countries during the period 2000–2016 has shown inelastic behaviour: energy consumption in the major economic sectors was increasing at a lower speed than corresponding economic activity. Despite the impact of the economic recession, long-run elasticities are higher than short-run elasticities because additional energy saving measures have been implemented during the period 2010–2016. A decreasing trend of final energy consumption in the residential sector in all three countries should be also stressed, and the income elasticity in this sector in Estonia was equal to 0.54, in Latvia to 1.12, and in Lithuania to 0.50. The largest differences in elasticity during the period 2010–2016 were revealed in the transport sector elasticity between final energy consumption and created value added in this sector in Latvia was equal to 0.23, in Estonia to 0.91, and in Lithuania to 0.96. Short-run elasticity in the industry sector in Latvia amounted to 0.32, in Estonia to 0.18, and in Lithuania to 0.25.
An econometric model [
54,
55] was applied in forecasting of final energy demand. The main assumptions in forecasting are the following: 1) the economic growth will persist in each country at the same pace, which was observed during the period 2010–2016, i.e. in Estonia by 3.0%, in Latvia by 2.8%, and in Lithuania by 3.5% per year; 2) the impact of possible structural changes in the economies over the period 2016–2020 was not taken into account; 3) long-run elasticities and short-run elasticities established in our analysis in each sector were applied in forecasting; 4) the impact of price elasticities was not taken into account because the reaction on price changes in the short-run is limited and varies for fuels and end users; 5) and an additional energy saving factor of 0.2 in all economic sectors and in all three countries was applied.
To reach the EU’s 20% energy efficiency target by 2020, the Baltic countries have set their own national indicative targets, which are presented in [
72]. A comparison of final energy demand projections and national targets is shown in
Table 4.
It can be concluded that Latvia has no problems in meeting obligations set under the Energy Efficiency Directive 2012/27/EU. Estonia is also on track in implementing its national energy efficiency target but additional energy saving measures should be implemented. The situation in Lithuania is the most challenging and the increase of final energy demand is predicted taking into consideration the continuous development of economic activities in the manufacturing and transport sectors. It should be stressed that national energy efficiency target for Lithuania is very ambitious and in-depth revision of possibilities to meet the country’s obligations is required.
6. Aspects of Sustainable Development
Sustainable development, as an integrated and balanced economic, social and environmental development, is the major ideology in the Baltic states. Such a policy was confirmed in many strategic documents and programmes in all three countries. Sustainable development can ensure a balance between the necessity to promote the economic growth, to improve the quality of life, and to comply with the obligations assumed under international environmental conventions and set in the EU environmental directives.
One of the primary objectives of sustainable development in Estonia, Latvia and Lithuania remains the same: to approach gradually to the average development level of the EU countries according to indicators of economic and social development taking into consideration specific features in each country, slightly different strategic priorities, and possibilities of a successful response to global challenges. Analysis of many targeted indicators shows some positive trends concerning sustainable development in the energy sector of the Baltic states. However, faster economic growth requires a corresponding increase of energy consumption. A comparatively large share of energy in the Baltic countries still comes from fossil fuels. Thus, a link between economic growth and GHG emissions is essential when seeking to contribute to achievements of the EU targets for the reduction of GHG emissions.
Based on detailed analysis of data presented in the national inventories [
65] the major source of GHG emissions is combustion of fossil fuels in the energy transformation sector and their direct use for various needs in branches of the national economies and activities in the energy sectors. In 2016, the share of GHG emissions from fuel combustion in total GHG emissions in Estonia was equal to 89.0%, in Latvia to 63.1%, and in Lithuania to 55.1%. Over the period 2000–2007 these emissions have increased in all three countries due to the growth of energy consumption. Over the period 2008–2016 GHG emissions have decreased in the manufacturing sector in Estonia by 52.0%, in Latvia by 45.2%, and in Lithuania by 20.0%, while emissions in the energy transformation sector have decreased in Latvia by 4.3% and in Lithuania by 38.5%. This decrease was stipulated by the reduction of fossil fuels consumption and their substitution by RES. Vice versa, a major part of electricity in Estonia is still generated from oil shale. Thus, despite certain fluctuations, caused by changes in volumes of electricity production, GHG emissions in the energy transformation sector in 2016 were 13.8% higher compared with the 2000 level. We may conclude that much higher penetration of RES into electricity and heat generation in Estonia should be implemented.
The growing volume of GHG emissions in the transport sector in all three countries is the major problem drawn from the analysis. Over the period 2000–2016, these emissions have increased in Estonia by 41.3%, in Latvia by 44.3%, and in Lithuania by 71.4%. Policy makers must pursue the faster deployment of biofuels, the greening of tax systems, and the implementation of other new policies.
Stronger efforts should be focused on the reduction of GHG emissions from industrial processes, activities in agriculture and waste management. Positive changes are defined in waste management—emissions in this sector in Estonia over the period 2000–2016 have decreased by 45.6%, in Lithuania by 35.2%, and in Latvia by 0.8%. Modernisation of technologies in the Lithuanian industry have cause a significant decrease of GHG emissions from industrial processes by 40.3% over the period 2008–2016. However, GHG emissions from activities in agriculture are still increasing in all three countries.
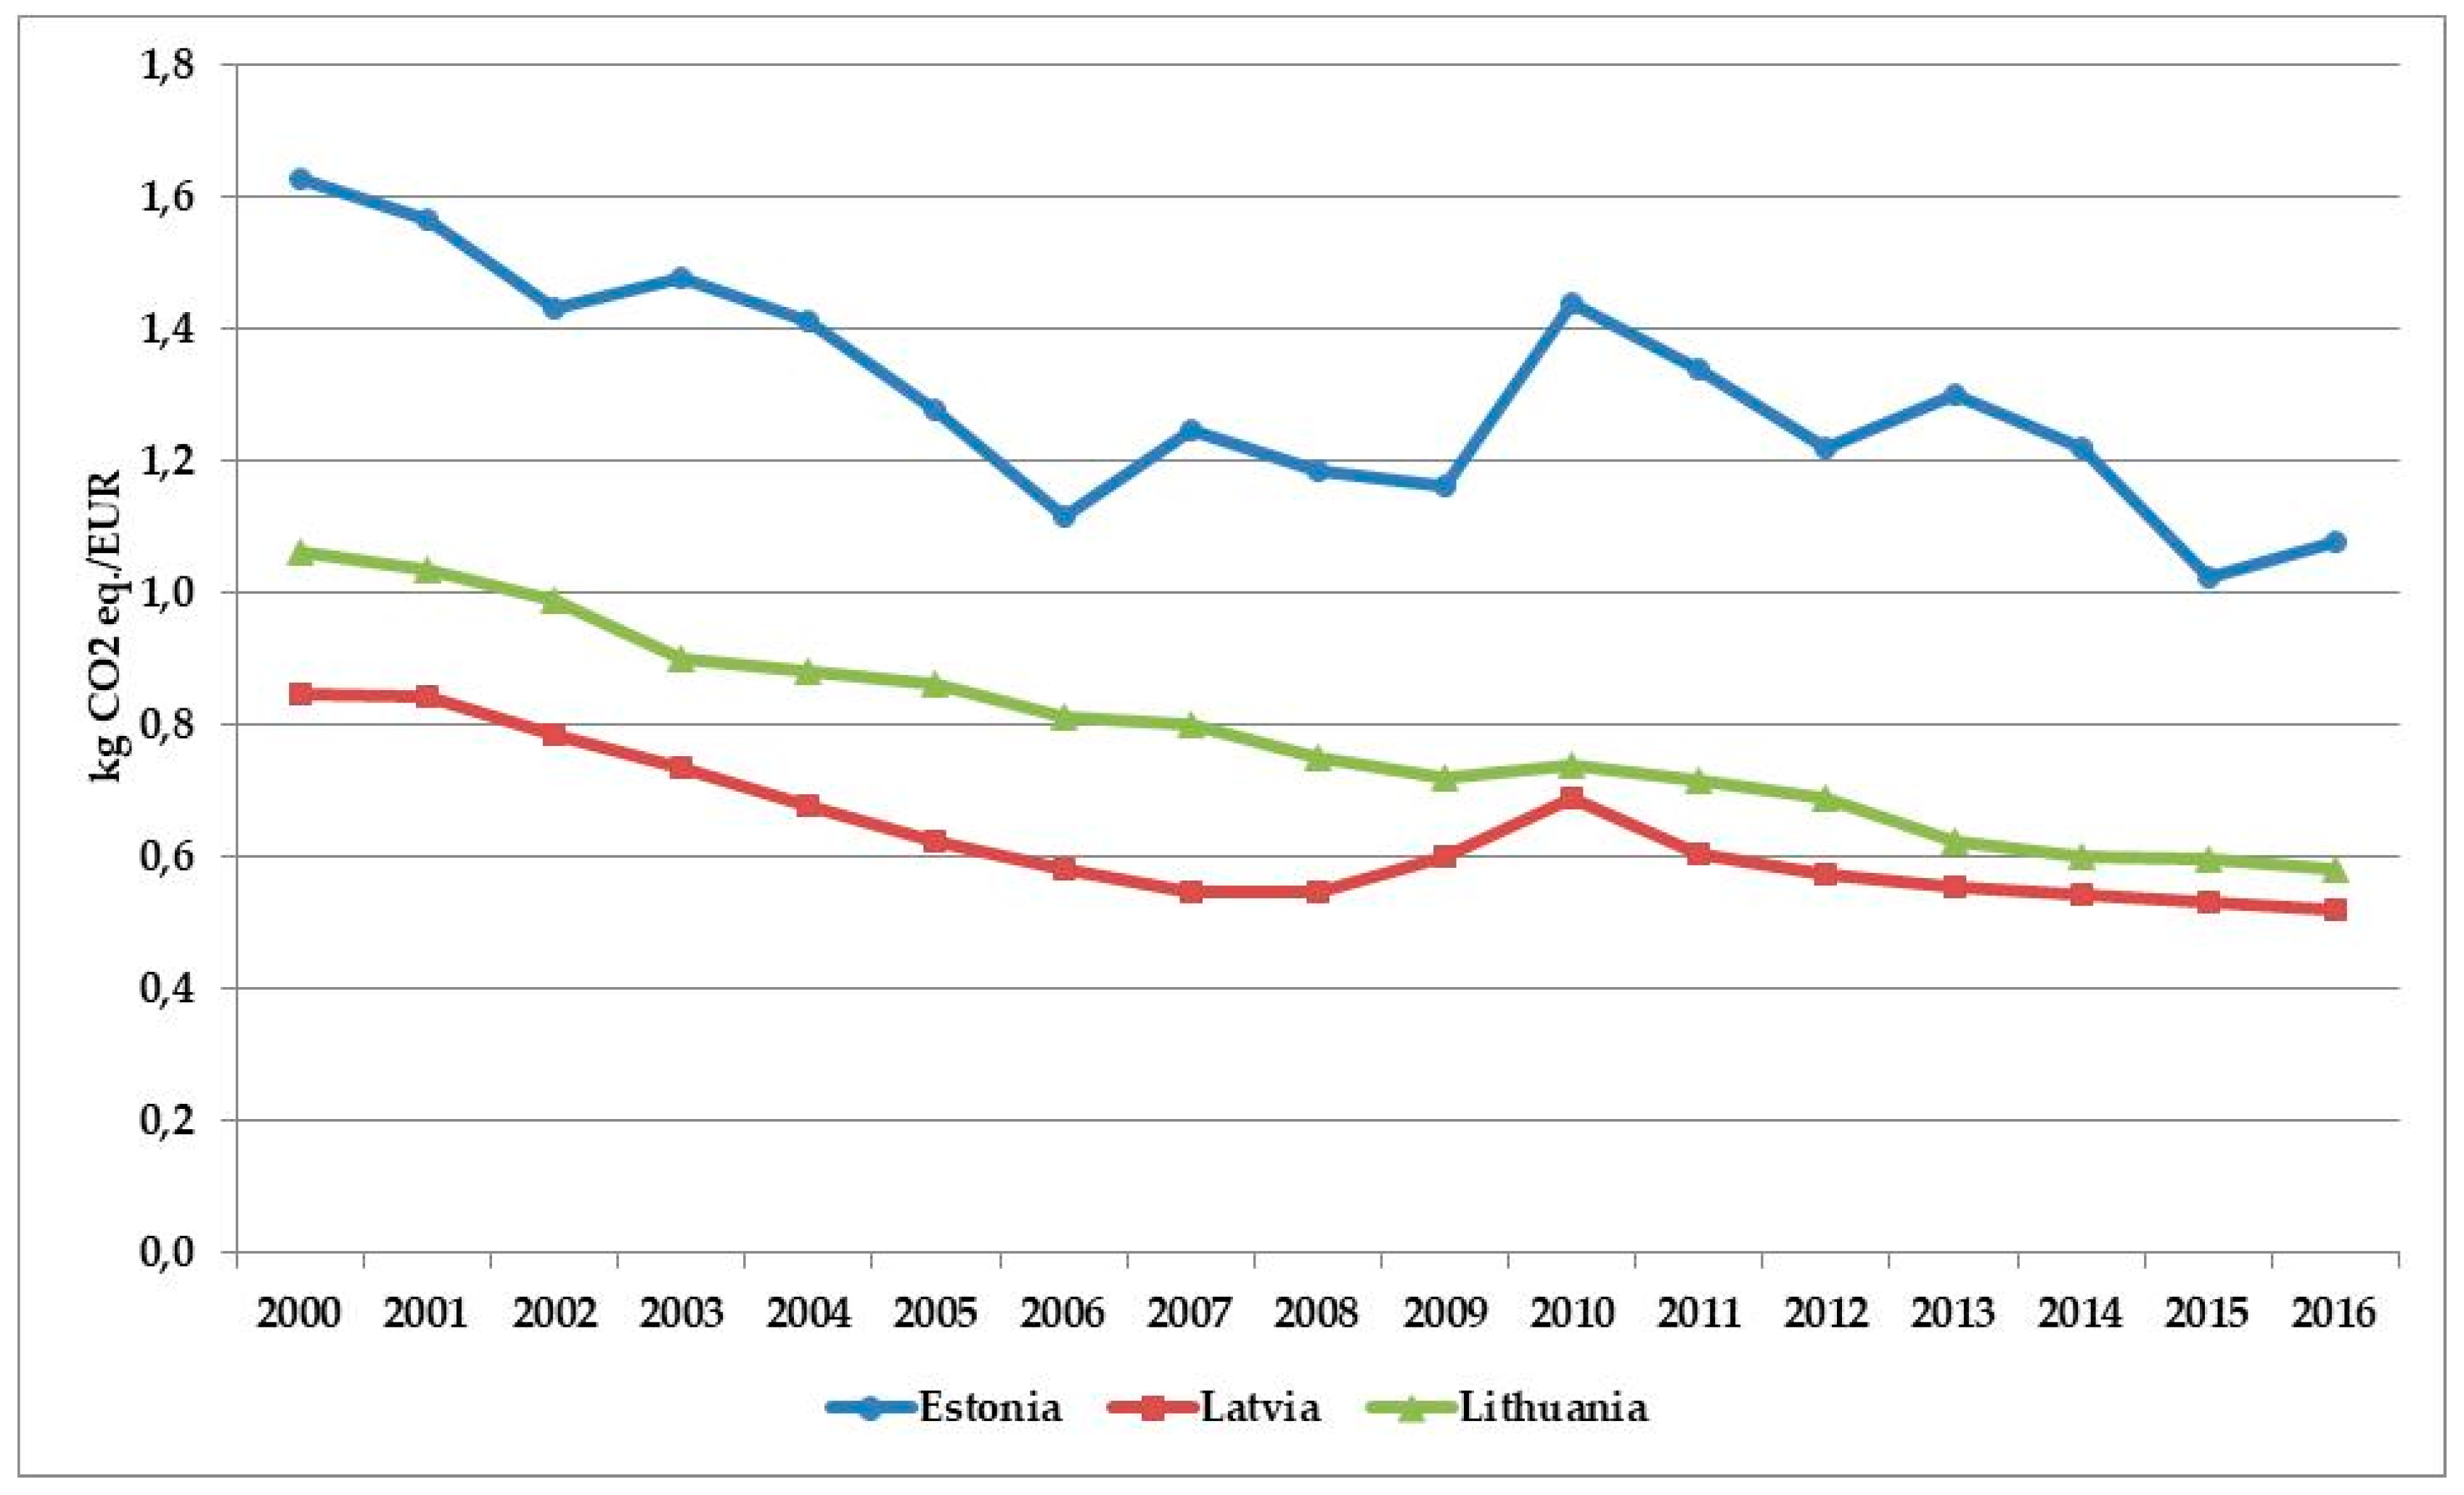
In addition changes in trends of emission intensity indicators, defined as a country’s annual GHG emissions in CO
2 equivalent divided by the country’s’ GDP, are examined. These indicators could be applied for comparison of efforts in each country to mitigate climate change. The trend of this indicator reduction is evident in all three countries (
Figure 12).
Over the period 2000–2016 emission intensity has decreased in Estonia by 33.8%, in Latvia by 38.8%, and in Lithuania by 45.3%. Currently, emission intensity in Estonia is 51.8% and 46.0% higher than in Latvia and in Lithuania, correspondingly. Relatively high values of GHG emissions per GDP in Estonia indicate a potential for decoupling of CO2 emissions from the economic growth and a necessity for technological changes, in particular in the energy transformation sector.
7. Conclusions
The national economies in the Baltic states were growing very fast during the period 2000–2007. GDP in Latvia was increasing on average by 9.0%, in Lithuania by 8.1%, and in Estonia by 7.6% per annum. In 2016, regardless of the severe impact of the global economic recession, GDP in Estonia exceeded the 2000 level by 68.6%, in Latvia by 75.8%, and in Lithuania by 88.5%. The faster economic growth of the Baltic countries is an essential precondition seeking to approach gradually to an average of the EU economic development level measured as GDP per capita in PPS.
Although the dynamics of general indicators during the period 2000–2016 was rather similar in the Baltic states, the detailed analysis has shown large differences in the economic growth of separate sectors. Different growth rates of value added created in the manufacturing and transport sectors as well as in commercial and public services reflect specific features of the national economies and have caused differences in the structure of GDP, which can cause different trends of final energy consumption.
Analysis of the energy sector’s development has indicated quite significant differences and radical changes in the structure of generating capacities in the power systems. The closure of the INNP, as the dominating power plant in the Baltic region, has stipulated an increase of electricity generation at Estonian power plants fired by oil shale and at Latvian combined heat and power plants fired by natural gas, installation of new technologies for electricity generation from RES as well as growth of electricity imports from neighbouring countries. All three countries achieved good results in implementing requirements for the share of RES in electricity generation.
The ratio of final energy consumption and gross inland energy consumption is very different: in 2016, in Estonia it was equal to 51.5%, in Latvia to 86.7%, and in Lithuania to 69.7%. The major reasons of large differences in the structure of primary energy consumption are: a) specific features of the energy transformation sectors; b) the different role of non-energy use and own use in the energy sectors; c) the different structure of the national economies; and d) the different structure of final energy consumption.
Energy policy of the EU oriented to the mitigation of climate change is an important factor stimulating efforts of the Baltic states to increase consumption of RES. Their total consumption during the period 2000–2016 was growing fast—in Latvia on average by 2.0%, in Estonia by 4.5%, in Lithuania by 4.9%, and in the Baltic region by 3.5% per year. It is important to stress that the total volume of RES consumption increased over this period in the Baltic region by 73.6%, and their share in gross inland energy consumption increased from 15.1% in 2000 to 23.6% in 2016.
Analysis has disclosed a remarkable increase of fuelwood, wood chips and wood waste consumption for electricity and district heat generation: over the period 2010–2016, this was growing in Latvia and Lithuania by 15.9% and 15.1% per year correspondingly, while in Estonia this item was growing by 7.0% per year. The share of district heat generated from RES in Lithuania has increased from 2.5% in 2000 to 48.6% in 2016.
Fast growth of the national economies during the period 2000–2007 was followed by growing final energy consumption in all three countries. Total final energy consumption was increasing in Lithuania on average by 4.8%, in Latvia by 4.3%, in Estonia by 4.0%, and in the Baltic region by 4.4% per year. The very fast growth of final energy consumption in the transport sector should be stressed also—in Lithuania this component was increasing on average by 8.6%, in Latvia by 8.3%, in Estonia by 5.9%, and in the Baltic region by 7.8% per year.
The impact of the economic recession was significant—in 2009, final energy consumption decreased in all three countries. Due to comaparatively slow recovering of the national economies changes in final energy consumption during the period 2010–2016 were minor. However, trends of final energy consumption in separate sectors of the economy were different. In 2016, final energy consumption in the Baltic region in the industry sector was higher by 2.6%, in construction by 14.6%, in the transport sector by 11.4%, in agriculture by 12.9%, in commercial and public services by 3.7%, compared with the 2010 level. Final energy consumption in the residential sector has decreased over this period by 12.5% due to the refurbishment of living houses and modernisation of their heating systems. Energy consumption in the transport sector is growing continuously. Thus, strong energy policy interventions in this sector are required.
Based on detailed analysis of the harmonised national energy balances, final energy demand in each country was predicted taking into consideration relationships between economic growth and final energy consumption, structural changes of energy consumption in the main economic sectors and additional energy saving potential. The results demonstrate that growing activities in the manufacturing and transport sectors would cause an increase of energy demand in these two sectors and growth of total final energy demand in the Baltic region. Comparison of our forecast and obligations of the Baltic countries set under the Energy Efficiency Directive 2012/27/EU has shown that Latvia has no problems to meet foreseen targets. Estonia is also on track in implementing its target but additional energy-saving measures should be implemented. While the national target notified in the Lithuanian energy policy documents is very ambitious, an in-depth revision of possibilities to meet the country’s obligations is required.
Detailed analysis of GHG emissions trends has shown some positive shifts—since 2008, their total volume has been decreasing in all three countries. However, the necessity for new policies is identified, in particular in the transport sector and agriculture, because GHG emissions from activities in these two sectors is increasing in the Baltic countries. Over the period 2000–2016, emission intensity, defined as a country’s annual GHG emissions in CO2 equivalent divided by the country’s GDP, has decreased in Estonia by 33.8%, in Latvia by 38.8%, and in Lithuania by 45.3%. Relatively high values of this indicator in Estonia indicate a potential for decoupling CO2 emissions from economic growth and a necessity for technological changes, in particular in the energy transformation sector.

 and
and 


