Article

The Concept of Risk and Possibilities of Application of Mathematical Methods in Supporting Decision Making for Sustainable Energy Development

1
Faculty of Management and Economics of Services, University of Szczecin, 71-004 Szczecin, Poland
2
Lithuanian Institute of Agrarian Economics, V. Kudirkos Str. 18–2, 03105 Vilnius, Lithuania
3
Faculty of Management, Rzeszów University of Technology, al. Powstańców Warszawy 12, 35-959 Rzeszów, Poland
*
Authors to whom correspondence should be addressed.
Sustainability 2019, 11(4), 1018; https://0-doi-org.brum.beds.ac.uk/10.3390/su11041018
Submission received: 11 January 2019 / Revised: 12 February 2019 / Accepted: 13 February 2019 / Published: 15 February 2019
(This article belongs to the Special Issue Sustainable Energy Economics and Policy)

Abstract

:
This study is devoted to presentation of the concept of risk, and the possibility of applying mathematical methods in supporting decision making in the energy sector to promote sustainable energy development. The problem with risk assessment in the energy sector arises mainly due to the difficulty of expressing risk in numerical terms. To avoid risk, it is necessary to set the criteria and objectives of measurement before making decisions in the energy sector. The aim of this study is to try to fill in this gap by means of comparing decisions under risk conditions within models supporting energy decisions. The authors’ focus is on the problem of risk in supporting decision making towards sustainable energy sector development, which is the main target of the European Union (EU) energy policies. Without the ability to determine the probability of occurrence of certain phenomena and their inclusion into the model, it is not possible to determine how well the solutions resulting from the models are accurate, and what is the probability of their implementation under specific conditions linked to renewable energy development.

1. Introduction

Economic processes include various phenomena and economic events. The goal of economics as a science is to detect and describe the dependencies between various economic phenomena. The term of risk in planning energy systems has gone hand in hand with economic problems for a very long time, although the theory of economics did not address this issue. It was not until Frank Knight that the concept of risk was applied to economics. Risk means a situation in which we know the probability of occurrence of the various economic results that can be obtained. If such a result is not known, then we are dealing with a state of uncertainty. This situation means that the expected result can be obtained, but one cannot say anything about the probability of this event.
Therefore, operational research enables, using risk reduction models in production planning, practical determination of the methodology of solving strictly defined economic phenomena, with optimal decision making in different, specific situations. Operational research is particularly often used in solving economic problems, including risk-related production problems.
These phenomena can be presented as “striving to describe reality in terms of systems, their components, and connections, both between the system components and between different systems” [1].
The systemic approach assumes that the reality studied is too complex and risky, and so it can be fully understood. Therefore, the examined, complex phenomenon can be replaced with a model, meaning “simplified images of economic reality, where the use of simplifications results from the complex nature of economic phenomena, and deliberate omission of certain relationships allows focusing on a chosen phenomenon that limits the risk” [2].
A similar approach can be applied in dealing with risky decisions in the energy sector, as decisions in the energy sector are often made under high risks and uncertainty. This is especially applicable to promotion of renewable energy sources and their penetration into the energy market, both requiring extra attention today. Further extension of renewable energy use may also have negative impacts on environmental conditions. Therefore, the problem of risk in supporting decision making in the energy sector is fundamental for the functioning of low carbon contemporary economies [3,4,5]. Without the ability to determine the probability of occurrence of certain phenomena, and their inclusion into the decision-making model, it is not possible to determine how well the solutions resulting from the models are accurate, and what is the probability of their implementation under specific conditions.
There are quantitative and semi-quantitative methods that have been used to model risks and uncertainties in sustainable energy system planning and feasibility studies, including the derivation of optimal energy technology portfolios [6,7,8]. In quantitative methods, risks are mainly measured by means of the variance or probability density distributions of technical and economical parameters [9,10,11,12,13], while semi-quantitative methods such as scenario analysis and multi-criteria decision analysis (MCDA) can also address non-statistical parameters, such as socioeconomic factors (e.g., macroeconomic trends, lack of public acceptance etc.) [14,15,16,17,18,19,20,21,22,23,24]. Quantitative risk-based evaluation methods deal with (statistical) risk factors that can be described by probability distributions. Stochastic optimization methods are usually employed to address statistical risk factors, while semi-quantitative methods, such as scenario analysis and MCDA, are employed to address non-statistical parameters, such as social factors and the emergence of competitive technologies. There is no agreement between authors as to which method is the best in addressing the main risks of energy planning. Some methods of energy planning are very difficult to apply due to the extensive modeling exercise and data requirements, like integrated assessment methods (IAM) [25,26,27,28,29]. In addition, these models need to be coupled with other techniques, like multi-criteria decision aiding (MCDA) tools, to assess and integrate the preferences of various stakeholders [30]. Therefore, there is a need to develop more simple tools to deal with uncertainties in long-term energy planning.
The aim of this paper is to present the concept of risk and the possibility of applying mathematical methods in supporting decision making for sustainable energy sector development.
The paper is structured in the following way: in the second section, a literature review on decision making and the main factors having impact on decision support in the energy sector is analyzed; in the third section, the possible models for limiting the risk of decision support in the energy sector are presented; in the fourth section, application of the lexicographic model for addressing risk in decision support in the energy sector is presented; in the fifth section, empirical application of the proposed lexicographic model is provided; in the sixth section, our results are discussed, followed by conclusions and policy implications.

2. Literature Review

In recent years, researchers have dedicated much effort to identifying which are the factors with the highest influence on decision making in energy sector. The research objectives and outcomes of studies dealing with decision making, and main drivers of these decisions in the energy sector are summarized in Table 1.
Most scientists emphasize that energy planning is a complex issue which takes technical, economic, environmental, and social attributes into account. Therefore, it is a big challenge to plan long-term activities and provide maximum efficiency in sustainable production [20,28]. Therefore, Yazdani et al. [24] investigated implementation of renewable energy sources, and recommend deploying several multi-criteria decision making techniques. In this way, they stress the importance of the evaluation criteria when selecting alternative RES and the causal relationships between the criteria. However, the different multi-criteria decision making techniques provide for different results, and make decision support even more uncertain.
Remarkably, Nerini et al. [27] showed in their paper that myopic planning might result in delayed strategic investments and considerably higher costs for achieving decarbonization targets, compared to estimates done with perfect foresight optimization energy models. The study also demonstrated that using perfect foresight optimization models in tandem with their myopic equivalents could provide valuable indications for policy design.
A more mathematically grounded approach was proposed by Meisel and Powell [24], which used a dynamic decision-making approach and identified four classes of pure policies: policy function approximations (PFAs); a myopic cost function approximation (CFA), a policy based on a value function approximation (VFAs), and lookaheads, each of which may work best depending on the characteristics of the system (volatility of prices, stationarity, accuracy of forecasts). Alongside this work, other researchers have ranked European Union (EU) energy development scenarios based on several IAMs, with respect to multiple criteria. They account for uncertainty surrounding policy priorities outside the IAM. The ranking of policy options is mainly based on EU energy policy priorities: energy efficiency improvements, increased use of renewables, and reduction in and low mitigation costs of greenhouse gas (GHG) emission. The ranking of scenarios is based on the estimates rendered by the two advanced IAMs relying on different approaches, namely TIMES Integrated Assessment Model (TIAM) and World Induced Technical Change Hybrid Model (WITCH [25].
Paying attention to the descriptive factors that impact these processes, institutional factors that influence a strategic wind energy decision-making process were described by Feurtey et al. [9]. Their research confirms that political choices are dynamic and vary with a change in the wind energy context, the balance of power between pressure groups, supranational influences, energy evaluation approaches, and social acceptance. At the same time, Taha and Panchal [26] focused on the decisions made by different market competitors, such as the energy generation companies (GENCOs), and their interactions with the policy makers.
A contradictory approach was considered in the analysis framework discussed and employed by Simpson and Edwards [31], which utilizes the recent recognition that energy is a form of environmental free energy to provide a fundamental basis for valuing environmental interactions independent from their secondary impacts. Supporting this idea, we should mention that Kaya and Kahraman [22] proposed a modified TOPSIS methodology for the selection of the best energy technology alternative.
More recent works show an application of the multi-criteria decision-making methodology used to assess an action plan for the diffusion of renewable energy technologies at regional scale. They also propose methodological tools able to “organize” and “synthesize” the large set of variables coming from several specific judgements (or assessments), helping the “decision maker” to read the complex problem, understand it, and make choices [21,23].
One can see from the provided review that the conducted studies do not place high importance on risk and uncertainties, and do not address the importance of them on decision making in the energy sector, though for supporting decision making in the power industry, it is necessary to pay attention to the associated risks of a selected option.
There are several studies dealing with uncertainties in energy planning [6]. Optimization methods with stochastic inputs have been widely implemented to the problem of allocating optimal power generation assets [9,10,11,12,13]. The Monte Carlo method is usually applied to account for numerous stochastic or uncertain input parameters, and is usually employed to produce probabilistic valuation models that incorporate risk assessment in the evaluation of RES technologies [20]. MCDA can be applied as an alternative risk assessment technique, because it is able to accommodate multiple criteria and is not constrained to use only monetary values; rather, subjective scales can be employed to rate each alternative and to find the best solution [14,15,16,17,18,19,20,21,22,23,24].
Each decision in the energy sector has very far-reaching consequences, and its consequences are often very complex. In the case of selecting the optimal variant in energy production planning, the selection must be multi-faceted, taking into account various problems. When assessing energy production options, one cannot rely solely on the financial analysis of an investment, and one should also take into account very important issues such as environmental aspects (ecological costs linked to air pollution, use of water and land resources), agro-energetic aspects, technological aspects, organizational aspects, or social aspects that are also associated with risk.

3. Models Limiting the Risk of Decision Making Support in the Energy Sector

Decision making in energy production planning requires the careful examination of the options in terms of their positive and negative impact. Positive aspects include benefits and opportunities, while the negative elements include costs and risks. The problem with the assessment of these aspects is often the difficulty of expressing them in numerical terms. For example, some of the benefits are qualitative, at least for environmental or risk elements [32,33].
The decision is often accidental or based on purely intuitive choice, not supported by any analysis. In order to avoid errors and random selection, it is necessary to set the criteria and objectives of the action before planning a decision support model. Therefore, goals can have many different characters:
-
competitive goals—when increasing the value of one of the objectives reduces the implementation of the other, e.g., maximizing profit and increasing its risk;
-
conjugated goals—between which there is a relationship wherein progress in achieving one goal is accompanied by the increase of the other;
-
complementary goals—goals that support each other;
-
supplementary aims—independent of one another, reducing or increasing the implementation of one does not affect the size of the second goal [34].
The relationships between particular goals are not permanent. Some of them can go into the second category, depending on the size of absolute production for energy. Objectives can also be complementary, i.e., complement each other in the use of one factor of production, while at the same time competing with each other for a different factor. The character of relationships between particular criteria is difficult and risky to determine. Their shaping can be observed only in the process of optimizing the mathematical model of planning decision support in the energy sector.
The main task in developing the decision support model is to construct such a production plan that would maximally fulfil individual goals in accordance with its preferences [35], however, other important issues linked to the outcomes of decisions needs to be taken into account.
Therefore, when developing a model limiting the risk in decision making in the energy sector, it is necessary to apply scientific methods tested in practice. Such models should include a random utility function, in which it is assumed that in the decision space X, possible variants of the plan, a random function Y is defined. The usefulness of the solution for an individual decision maker is expressed by the function U (Y). The order in the solution set determines the expected value E [U (Y)], that is, the decision maker considers the variant x1 to be more “favorable” than x2 when:
E [U (Y1)]> E [U (Y2)]
where
Y1 = Y (x1), Y2 = Y (x2)
The expected value E [U (Y)] may depend on various parameters of the Y distribution. For example, for a square function U(Y) = αY + βY2, the expected value depends on E (Y) and the variance V (Y), which can be determined by the formula:
E[U(Y)] = αE[Y] + βV[Y] + βV[Y] + β{E[Y]}2
Assuming the normality of Y distribution also depends on E [Y] and V [Y]. When using the utility function, the optimal plan is obtained by maximizing E [U (Y)] on the set X. Certain parameters of the utility function are interpreted as the aversion coefficients to the risk and uncertainty of the decision maker.
VE models are models in which the usefulness of a Y function depends only on its expected value and variance, or, in general optimization, one of the functions is subject to limitation on the other or also some of their combinations. These are risk reduction models. The variance of a random function, or some functions of variance and expected value, are treated as measures of the risk of implementing the variant of the plan x. The simplest and most commonly used are models in which the function Y is a linear function of decision variables whose coefficients are random variables, i.e.,
Y = C1x1 + C2x2 + … Cnxn
In the general case, it is only assumed that the variables Ci have finite expected values and variances, but, most often, they are assumed to have normal distributions, which allows much more accurate results to be obtained. The starting point of optimization procedures is the calculation of variance, which poses some calculation difficulties. For optimization in general, the linear programming algorithm is not enough, and a number of methods have been developed to overcome these difficulties.
The application of the penalty cost method means saving in the optimization matrix the probability of failure to implement the production plan of individual energy crops, together with determining the amount of costs associated with the purchase.
The concept of penal costs permits the existence of a situation in which the implementation of the plan may occur with a certain probability of favorable phenomena. The adverse effects resulting from this can be balanced, or at least mitigated, by additional inputs. The distribution of stochastic variation can be determined on the basis of a representative sample or as a normal sample (with a larger number of data).
Variable penalty costs make it possible to fill any shortages. The objective function means that energetic plants, the yields of which are realized in the smallest possible range, should be the optimal solution for the inputs. The objective function, by incorporating penalty costs into it, is also carried out with a certain probability, depending on the distribution of plant yields. The incorporation of penalty costs into the objective function does not diminish the significance of crop risk, it only serves to improve the value of the objective function. Since both the penalty costs and the expected value of the optimal solution depend on the same stochastical variability, it seems advisable to build models that would combine these two variations.
Target Minimization of Total Absolute Deviations (MOTAD) is a MOTAD modified by Tauer, which is based on similar principles. In this model, the same auxiliary variables of deviations Zt- are introduced. It assumes knowledge of the probabilities pt, states of nature realizing the observed deviations Zt- from the average. The expected value of the deviations Zt- is maximized. This allows you to choose a solution that maintains the desired relationship between these two expected values (the other is a substitute for variations). The “cover” of the model is based on the fact that with the production structure planned for the coming year, profits from previous (T-1) years can’t be lower than a certain constant (cover), reduced by negative deviations from the average observed in these years.
Simple solutions can be determined for linear systems in cases when the impact on the quality of the environment can be expressed with the help of the so-called environmental costs. Very often, however, we can’t assume the linearity of given dependencies, due to the simultaneous operation of many different types of factors affecting the decision making process. This creates the possibility of applying multi-criteria approaches to the problem. Such methods should include multi-criteria methods.
Three groups of such methods have the greatest application: the distance function method, usability function method, and the lexicographic method.
The distance function method is where for each set of solutions of a multi-criteria task, one can set a certain reference point in the criterial space, against which individual solutions are evaluated. This point can be an ideal point or any other point chosen, in which the values of the individual objective functions meet the expectations of the decision maker. In the classical method of distance function, the solution is the optimal one, for which the image in the criterial space is located as close as possible to the (furthest) reference point, i.e., the distance of this point from the reference point is minimal (maximum) [36].
In the usability function method, a certain aggregated function defined on the set of criterion functions, called the utility function, which is then maximized (minimized), is introduced to determine the solution to the problem, thus reducing the problem of multi-criteria optimization to solving the single-criterion task. It is assumed that, in order for the utility function to be used, it should maintain a strict order in the set of partial objective functions, which means that the increase in the value of each criterion function increases the value of the utility function. The main disadvantage of this method is the very high sensitivity of the result to the selection of criteria. In practice, the decision maker is not able to justify the precise separation of criteria, but only to estimate their approximate values, and a small error in this respect can radically change the result [37].
The lexicographic method requires establishing the hierarchy of criteria validity, and then the variants are set in order to maximize the values of these criteria in sequence. This method allows a ranking to be obtained in a short time, even without the help of a computer, but it requires the assumption of criterion priority [38]. In the following section, application of this method for decision making in the energy sector is discussed.

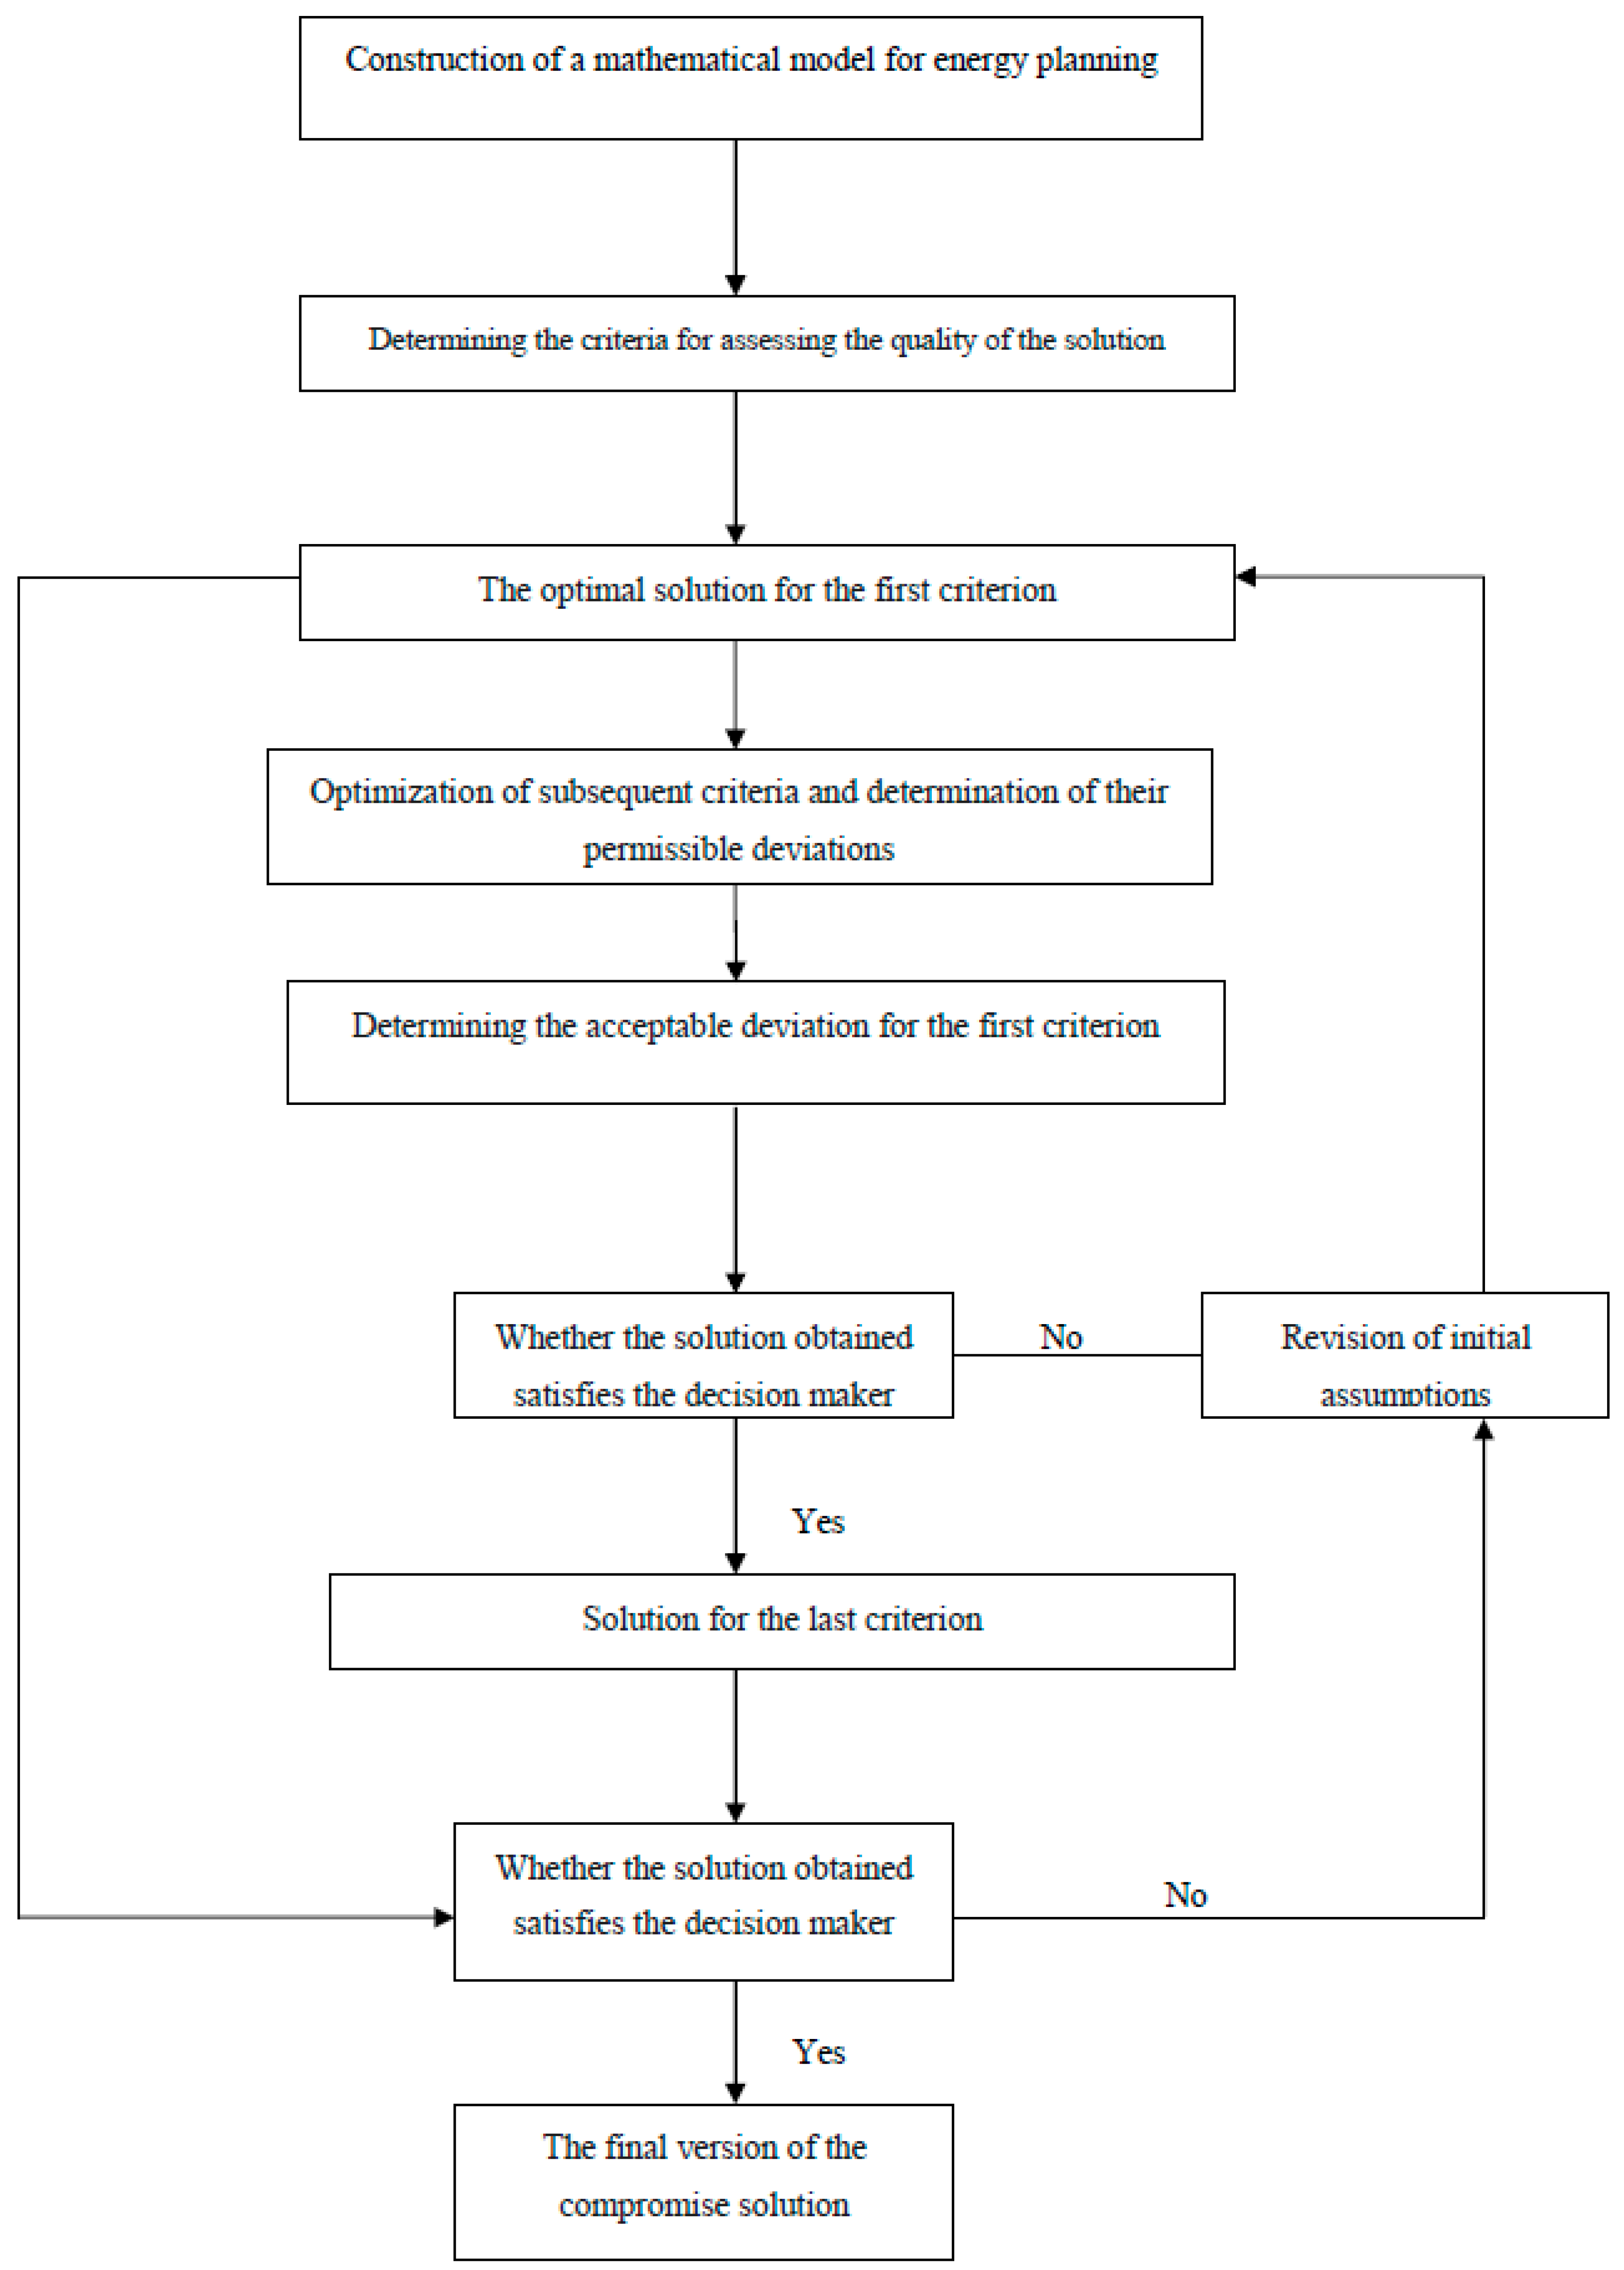
4. Application of the Lexicographic Model for Addressing Risk in Decision Support in the Energy Sector

When developing models supporting decision making in the energy sector, it is also important to examine various types of technologies that may appear in the system [39]. They should be assessed in relation to specific conditions, such as investment accessibility. Thus, determining the optimal set of techniques that will be included in the model requires some calculations, which will be used to build the energy model.
In this method, functional fj (x) are ordered according to the hierarchy defined by the decision maker, and then optimized in sequence. If mi = maxD fi (x), then function fi + 1 is maximized on the set Di with an additional constraint added in the form fj (x) > mi−di.
The lexicographic method has a simple interpretation, and requires arbitrary selection of acceptable deviations from the value. These deviations are determined by the decision maker during the optimization process. The optimization process itself is carried out sequentially according to a set order, starting with a function with the highest hierarchy of validity. When maximizing further functionalities, additional limitations are imposed on functional ones already optimized. The extreme of the last functional, with all additional restrictions, is a sought-after compromise solution [35].
A mathematical description of the procedure can be presented as follows. Let fi,..,fr be the considered functions set by the decision maker according to decreasing importance gradation, and let X be the starting decision space Ax < b, x > 0, with D0 = X.
We calculate:
L1 = maxf1 (x) = f1 (x1)
The production plan matrix and the calculation program can be constructed in such a way that the values of all fi—functional devices (xi) for i = 1,..,r in the first solution x1 are obtained simultaneously. If the solution x1 and the value fi (x1) satisfy decisively, then the procedure can be completed in the first step. It is impossible to obtain a higher value of the function /, under the assumed production conditions. If this value is too small, you have to go back to the earlier stages of the procedure, making adjustments to the assumptions.
If f1 (x1) is satisfactory, but the values of other functionalities are unacceptable, the decision maker returns to the previous stage or determines the amount d1, which is willing to reduce I1 to get a better solution due to other criteria. When d1 is specified, we designate:
D1 = {x e D0: f1> f1- d1}
Creating this set consists of adding an additional constraint f1 > f1—d1 to the existing model constraints. We then calculate L2 = max f2 (x) = f2 (x2), obtaining at the same time the values of f1 (x2) for i = 1,.., r. The following restriction is fulfilled:
fi (x2)> 1—d1
If the solution is satisfactory, the procedure ends, if not, the procedure is the same as for function f1. We revise the assumptions or determine the deviation d2, by which we are willing to reduce I2. In the latter case, we create a set:
D2 = {x e D1: f2> f2- d2}
We continue this procedure until a satisfactory solution is reached or all functionalities are exhausted. If the final solution does not meet the decisions of the decision maker, it is necessary to repeat the procedure with other initial assumptions or another selection of deviations, deciding to reduce the assumed threshold values of certain functionalities.
The procedure for developing decision support technique by applying the lexicographic method is presented in Figure 1.
The basic features of this method are [35]:
-
a clear interpretation of the solutions obtained;
-
the possibility of including more functionalities than in other multi-criteria methods, with no need to consider substitutability of particular criteria;
-
the possibility of using it for large optimization tasks, the possibility of considering various types of criteria in the task: linear, quotient, non-linear;
-
dialogic nature allowing continuation of the procedures until a satisfactory user’s compromise solution is obtained.
Disadvantages of this method:
-
no guarantee that the solution received is Pareto-optimal;
-
labor consumption of the method, to obtain a satisfactory solution for a compromised user;
-
the solution is achieved through multi-criteria recurrence of calculations, in each case verifying the initial, fixed threshold values, or permissible deviations from the maximum values.
These disadvantages can be compensated to a certain extent by the simplicity of calculations, a clear interpretation of the procedure, and the introduction of structural variable calculations that allow for each solution to obtain the values of all its important parameters.
The application of the multi-criteria method will allow building of a mathematical model supporting decision making in the power industry, the solution of which will be characterized by the following features:
  • minimal cost of electricity production;
  • maximum level of renewable energy use;
  • minimal impact on the natural environment.
In the following section, a numerical example of application of the lexicographic method is given.

5. Construction of an Exemplary Model of a Regional System of Alternative Energy Sources in Terms of Risk Taking

This article proposes an original model of a regional system of alternative energy sources, investigating various types of technologies that may appear in the system. With the help of an optimizing multi-criteria model, three scenarios optimizing the regional energy potential were developed.

5.1. Installed Renewable Energy Capacities and Electricity Demand Forecast in the West Pomeranian Region

As a research object, the province chosen was the West Pomeranian region, and the time range of empirical research was set for 2018–2030.
The West Pomeranian region, which was the object of the research, is particularly predestined for the production of renewable energy sources, especially wind energy and energy from biomass. The area of the West Pomeranian region is characterized by low stocking of animals and surpluses of unused agricultural biomass (hay, straw). The largest biomass boiler in the country is located in the studied area (Szczecin power plant). The boiler burns 80% forest biomass, that is, branches, wood chips, or sawdust, and the remaining 20% is biomass of agricultural origin. The Szczecin power plant, due to the price of biomass, imports “green coal” from other regions of the world, without using the surplus of agricultural biomass located in the West Pomeranian region.
According to the statistics kept by the Energy Regulatory Office, the installed capacity of electricity as at December 31, 2017 in the West Pomeranian region was 2778.8 MW, of which renewable energy sources accounted for 825.107 MW. The total energy production in the region was 8877.5 GWh, of which 7425.8 GWh was from conventional sources and 1451.7 GWh was from renewable sources (Table 2).
In the projected period, production and demand for electricity in 2030, compared to 2006, will increase by 21% (Table 3).

5.2. Policy Schemes to Support Electricity from Renewables in the West Pomeranian Region

As a result of the functioning of the support system in Poland related to certificates of origin, the generator of electricity in a renewable energy source obtains two types of guaranteed revenues:
-
revenue from the sale of property rights from certificates of origin;
-
revenue from the sale of electricity.
Certificates of origin for renewables are:
(a)
Green certificates—the co-financing system for renewable sources producing electricity has been conditioned on the ability to obtain certificates of origin. Therefore, all types of renewable energy sources based on renewable primary fuels can benefit from the following type of support.
(b)
Brown certificates—these are certificates that create a certificate of production, and at the same time introduce biogas for distribution to the gas network.
(c)
Yellow certificates—a co-financing system in the form of yellow certificates were directed to entities producing electricity in high-efficiency cogeneration, in installations fired with gaseous fuels.
(d)
Purple certificates—a co-financing system in the form of purple certificates were directed to units fired with methane released and captured at underground mining works in active, liquidated, or liquidated hard coal mines or gas obtained from biomass processing within the meaning of article 2, paragraph 1, point 2 of the Act on biocomponents and liquid biofuels, regardless of the installed capacity of such units.

5.3. Renewable Energy Potential in the West Pomeranian Region

In the model, the existence of NATURA 2000 protected areas is a significant spatial limitation for the development of wind energy. In addition, a further limitation has been added by densely populated areas, where investments for wind energy purposes cannot be implemented, or encounter significant impediments in practice. In the West Pomeranian region, 12.8% of arable lands are attractive areas for wind energy.
It is estimated that the potential of wind energy in the West Pomeranian region, taking into account environmental restrictions, is 12,200 MW. With the assumptions made, this would correspond to the production of 26.600 GWh per year.
In the model, it was assumed that 15% of agricultural land will be used for energy production from biomass, and the rest for commodity production. It was assumed that an average of 50,000 kWh can be obtained per ha of energy crops.
It is estimated that the West Pomeranian region has a relatively high biomass potential, in the region of 7156.5 GWh.
The main factors that shape the structure of agriculture in the West Pomeranian region include: a large area of farms, a favorable percentage of employees in agriculture, and a focus on crop production. Due to the fact that organic fertilizers, such as manure are an important substrate for the production of agricultural biogas, it is also advisable to analyze the number of farm animals in the region. The dominant breeding animals are swine, cattle, and poultry. According to GUS data, the number of cattle and pigs decreases where the number of poultry increases.
In addition to livestock production, the potential for biogas production is high in plants processing agricultural products, such as: sugar factories, distilleries, breweries, slaughterhouses, or fruit and vegetable processing plants.
In the West Pomeranian region, we are also dealing with a decreasing area of meadows and pastures. Assuming that 10% of this area will be used for energy purposes, we can get about 11.4 mln. M3 year–1 of biogas.
For the purposes of the biogas plant, cereals are also used, harvested in the appropriate phase, and used as a supplementary substrate in the form of silage. The optimal vegetable substrate used in agricultural biogas plants is maize silage.
If we assume that, for the cultivation of maize for energy purposes, 13,200 Ha can be allocated in the region, we can assume that we will obtain 56.4 mln. M3 year–1 biogas. By allocating sugar beet leaves to silage, about 39.6 mln. M3 year–1 biogas can be produced. It is estimated that the potential of the West Pomeranian region the basis of available resources, waste from the agro-food industry, organic fertilizers, grass from permanent grassland, sugar beet, and maize leaves, makes it possible to obtain about 638.7 GWh of electricity from biogas.
The market potential of solar energy in the region has been estimated from the point of view of the recipients’ needs and practical possibilities to satisfy them, and not from the point of view of energy supply restrictions, the more so that the development of solar energy in decentralized systems is, relatively, least limited by environmental factors.
The total potential of solar energy in Poland is 19,341 TJ, or 5372.5 GWh, with average solar exposure of around 1100 kWh/m2. In the West Pomeranian region, with an average of 1000 kWh/m2 of sunshine, it is 393.2 GWh of energy. The West Pomeranian region, due to ecological conditions and protected areas, has a small hydropower development potential of 14.3 GWh. Energy potential in the West Pomeranian region is given in Table 4.
Depending on the technology of electricity production from renewable energy sources, power plants will produce a different amount of energy annually. This is due to the fact that power plants rarely work with nominal power, especially those based on renewable energy sources. Therefore, the model introduces a maximum power utilization factor to be able to compare individual technologies with each other (Table 5).
The model assumes that the West Pomeranian region’s natural and climatic conditions predispose it to the production of energy from wind farms, as well as biomass from economically untapped grassland and forest production.
The model assumes that a large share in the production of electricity may be the agriculture of the region, which, apart from the basic function of food production for the population, will play an agro-energetic role.
It is assumed that energy crops should be competitive with commercial agricultural production, and be an element of the market game.
The basic agro-technical restrictions for particular groups of plants have also been adopted (maximum capacity of the given crop in the structure of sowing and soil fertility), in accordance with the principle of sustainable development.
It is also assumed that energy investments will be characterized by high capital intensity and a long investment cycle of 5–10 years, as well as a long period of return of incurred investment expenditures.

5.4. Energy Planning Optimization Model for the West Pomeranian Region

For the construction of optimization models, the values of technical and economic parameters were first calculated, and the minimum or maximum levels of balance conditions (rather than by-side conditions) were established. The model adopted 24 decision variables.
The following decision variables were introduced:
x1—
production of conventional energy (kWh)—energy coming from fossil fuels (e.g., hard and brown coal, oil, natural gas);
x2—
production of energy from co-firing (kWh)—energy from the same generation unit, from the combustion of biomass or biogas with other fuels used to generate electricity;
x3—
hydro energy production (kWh) until December 31, 2017—energy coming from an industrial plant, converting potential energy of water into electricity;
x4—
production of hydropower (kWh) from January 1, 2018—energy coming from an industrial plant, converting potential energy of water into electricity;
x5—
solar energy production (kWh)—energy generated inside the Sun as a result of thermonuclear transformations, mainly the synthesis of hydrogen atoms;
x6—
energy production from household windmills (kWh)—energy generated from a set of field devices used for generation and storage of electricity for the purposes of its use in one or several houses;
x7—
production of energy from wind farms (kWh) until December 21, 2017—energy defined as a generating unit or a set of these units, using wind energy connected to the grid at one connection point for the production of electricity;
x8—
new installations producing energy from wind (kWh) from January 1, 2018—energy defined as a generating unit or a set of these units that use wind energy connected to the grid at one connection point to generate electricity;
x9—
production of energy from biogas (kWh)—energy generated from gas obtained from biomass, in particular from installations for processing animal or vegetable waste, sewage treatment plants, and landfills;
x10—
energy from biogas in high-efficiency co-generation with a total installed electric power of less than 1 MW (in kWh)—energy generated from gas obtained from biomass, in particular from installations for processing animal or vegetable waste, sewage treatment plants, and landfills;
x11—
new installations producing energy from biogas (kWh) from January 1, 2018—energy generated from gas obtained from biomass, in particular from installations for treating animal or vegetable waste, sewage treatment plants, and landfills;
x12—
production of energy from biofuels (kWh)—energy from biofuels obtained from raw materials derived from biological processes, able to be used in electrical power equipment;
x13—
production of energy from biomass combustion in existing boilers (kWh)—energy coming from plant or animal substances that are biodegradable, coming from products, waste, and residues from agricultural or forestry production, as well as the industry processing their products, as well as other parts of waste that are biodegradable;
x14—
new installations producing energy from biomass combustion in new boilers (kWh) from January 1, 2018—energy coming from substances of vegetable or animal origin that are biodegradable, coming from products, waste, and residues from agricultural or forestry production as well as from the industry processing their products, as well as other parts of waste that are biodegradable;
x15—
total energy production (kWh)—total annual production of electricity from various energy sources;
x16—
volume of raw materials for biomass burning (kWh)—energy willow: a fast growing species with high biomass production potential, perfectly suited for energy use;
x17—
volume of raw materials for biomass burning (kWh)—miscatus: a plant that produces a large biomass increase in a relatively short time, suitable mainly for combustion;
x18—
volume of raw materials for biomass burning (kWh)—poplar: a species of tree belonging to the willow family, perfectly suited for energy use;
x19—
volume of raw materials for biomass burning (kWh)—sidaz: perennial plant from North America, growing in the form of clumps composed of several stems with a diameter of up to 25–35 mm and a height of 3.0–3.5 m, suitable for energy use;
x20—
volume of raw materials for biomass burning (kWh)—topinambur: perennial plant originating from North America; utility crop—dried stems with a diameter of 2–3 cm, a height of 2–3 m, and a tuber, suitable for energy use;
x21—
volume of raw materials for biomass burning (kWh)—oilseed rape;
x22—
volume of raw materials for biomass burning (kWh)—cereals;
x23—
volume of raw materials for biomass burning (kWh)—maize;
x24—
volume of raw materials for biomass burning (kWh)—beets.
In the model, the objective function consisted of production costs, certificates, and ecological costs for each type of energy (variables from x1 to x14), and loss of soil fertility caused by their exploitation in the production of raw materials for biomass, biogas of biofuels, and agricultural commodity production (varying from x16 to x24). In the projected period, production and demand for electricity in 2030, compared to 2006, will increase by 21%.

5.5. The Objective Function and Parameters of the Optimization Model

The lexicographic method was used to search for compromise solutions. The objective function (minimized) consisted of four components:
-
costs related to energy production;
-
costs related to certificates;
-
ecological costs;
-
loss of soil fertility.
The model also assumes that, as a result of meeting the EU Climate Package (20-20-20) requirements [42] by a coal-fired power plant in Poland, expenditures forced by climate protection will amount to about PLN 6–7 billion annually. Data from the statistical office show that over the last 10 years (2007–2017) the production price per kWh of conventional energy has increased by 100%.
Based on the data from the Statistical Office, we can estimate the production cost per kWh of energy in 2030, compared to 2017. This means that the price per kWh of conventional energy will increase by 70%, compared to 2017.
Considering the costs of generating electricity, we can estimate the cost parameters (Table 6).
The loss of soil fertility caused by the production of energy resources is presented in Table 7 below.
The next parameters are the average costs of generating energy per kWh from individual energy resources (Table 8).
L(x) = 0.44x1 + 0.58x2 + 0.57x3 + 0.57x4 + 0.97x5 + 0.52x6 + 0.52x7 + 0.44x8 + 0.56x9 + 0.51x10 + 1.17x11 + 0.96x12 + 0.32x13 + 0.24x14 + 1.4x16 + 1.4x17 + 1.4x18 + 1.4x19 + 1.4x20 + 0.53x21 + 0.53x22 + 1.15x23 + 1.15x24 min
The side conditions are as follows:
The boundary conditions assume that all variables must be non-negative.x1 + x2 + x3 + x4 + x5 + x6 + x7 + x8 + x9 + x10 + x11 + x12 + x13 + x14 = x15 total energy production.
x15 = 9,333,450,000 kWh—energy production for the region.x3 + x4 + x5 + x6 + x¬7 + x8 + x9 + x10 + x11 + x12 + x13 + x14 ≥ 0.20 x15—renewable energy must be at least 0.30% of the total energy production.
x6 + x7 + x8 ≤ 26,600,000,000 kWh—windmills can produce kWh energy of 26,600,000,000 kWh;
x9 + x10 ≤ 638,700,000 kWh—biogas production may be less than or equal to 6,387,000,000 kWh;
x1 = 0 kWh—maximum production of conventional energy;
x2 ≤ 5,174,876,000 kWh—maximum energy production from co-firing;
x3 ≤ 14,300,000 kWh—hydropower production;
x4 = 0 kWh—production of new hydropower;
x5 ≤ 393,200,000 kWh—solar energy production;
x14 ≤ 7,155,650,000 kWh—energy production from biomass.
In the optimization model, only one function (L(x)), which was a component of the above components, was minimized.
Three scenarios for the power industry in the West Pomeranian region were developed. The three scenarios presented in the article indicate that the region is self-sufficient in energy, and it can produce surplus energy with large investment outlays.

6. Discussion

The run of the model provided for three scenarios in the power industry of the West Pomeranian region. In Table 9, Table 10 and Table 11, the results of scenarios are presented, followed by discussion.
In Table 9, the solution of the first scenario, which provides the optimization of the use of alternative energy sources in the region, is given.
In this first scenario, we note that the total energy production in the West Pomeranian region will amount to 9333 GWh (i.e., we assume regional demand), of which 3016 GWh is energy production from co-firing (coal plus biomass), and 8 GWh is hydropower created in new hydroelectric power plants. In solar installations, 383 GWh of energy can be generated. In the case of new wind power plants, as much as existing, there will be 2955 GWh of energy generated. In both new and existing installations in the region, 638 GWh of energy will be produced in general for biogas. The remaining 2331 GWh of energy will be generated in new and existing installations producing energy from biomass combustion. The average construction cost of one MW in this energy scenario will amount to PLN 9,333,509, and the loss of soil fertility of the biogas plant raw materials in this scenario will amount to 0.059 t/ha.
In Table 10, the solution of the second scenario, which is based on extensive development of solar energy, is given.
In this second scenario, we note that the total energy production in the West Pomeranian region will amount to 8877 GWh (i.e., we assume the demand in the region is covered), of which 7305 GWh is the production of energy from co-firing (coal plus biomass). A total 44 GWh is hydropower created in hydropower plants created before December 31, 2017. In solar installations, 243 GWh of energy can be generated. In wind farms created before December 31, 2017, 1071 GWh of energy will be generated. In agricultural biogas installations, 25 GWh of energy will be generated, and 13 GWh of energy will be generated from biogas installations from sewage treatment plants and landfill biogas. The remaining 173 GWh of energy will be generated in new and existing installations producing energy from biomass combustion. The average construction cost of one MW in this energy scenario will amount to PLN 4,503,045, and the loss of soil fertility of the biogas plant raw materials in this scenario will amount to 0.059 t/ha.
In Table 11, the solution of the third scenario, which is based on extensive development of wind energy, is given.
In this third scenario, we note that the total energy production in the West Pomeranian region will amount to 8877 GWh (i.e., we assume demand in the region), of which 7274 GWh is energy production from co-firing (coal plus biomass), and 62 GWh is hydropower created in hydroelectric power plants built before December 31, 2017. In solar installations, 34 GWh of energy can be generated. In wind farms created by December 31, 2017, 1634 GWh of energy will be generated, and 147 GWh of energy will be produced in new wind farms established by the end of 2018. In agricultural biogas installations, 31 GWh of energy will be generated, and 21 GWh of energy will be generated from installations with biogas from wastewater treatment plants and landfill biogas. The remaining 416 GWh of energy will be generated in new and existing installations producing energy from biomass combustion. The average construction cost of one MW in this energy scenario will amount to PLN 3,386,560, and the loss of soil fertility of biogas plant raw materials in this scenario will amount to 0.0423 t/ha.
Analyzing the structure of new generation capacities, presented for example in three scenarios in the power industry developed in the West Pomeranian region, we can present the number of new jobs created in the region (Table 12).
Analyzing the structure of new generation capacities, presented for example in three power sector scenarios created in the West Pomeranian region, we can present revenue to the budget from value added tax (VAT), resulting from the increased number of investments related to the development of renewable energy production capacity (Table 13).
Our own research on the example region (West Pomeranian region), as well as the calculations of the proprietary model, indicate the possibility of building a regional system for obtaining energy from alternative sources. The constructed mathematical model and its validation confirm that it could be a tool for simulating the energy policy of each region in terms of risk.
The current state energy policy is risky, and is not conducive to the creation of autonomous regional energy systems, where the main decisions about the size and structure of the energy produced would be decided by the local government, not energy concerns and the Energy Regulatory Office.
Research on the energy mix of the West Pomeranian region indicates that it takes into account the specificity of the region to a small extent, where the main energy supplier is coal power. The development of wind energy is associated with high risk, due to the changing legal aspects. The introduction of the “Anti-Carnage Act” in 2016 resulted in the total blocking of the development of new wind installations. Therefore, the scenario of wind energy development seems to be the most risky one.
The constructed biomass power plant in Szczecin uses local energy resources to a small extent, increasing the risk of growing biomass from wasteland and permanent herbage. It should be emphasized that a large part of the biomass comes from imports.The cultivation of energy crops on arable land is very risky under current price conditions. Aeroenergy is currently losing to trade in crop production.
It seems that, at the moment, the most likely scenario is the development of solar energy, which is currently almost functioning in Poland, and in increasing the scale of production, solar energy may become profitable.
The increase in CO2 emission allowances may cause the structure of the energy mix to look completely different. The burden of CO2 on coal-fired power plants may put the profitability of renewable energy in a different light. The first scenario may thus come true, where the region will be self-sufficient.
Comparing results of this study with results of other studies [25,26,27], one can notice that the proposed lexicographical model is quite simple, and does not require a lot of data like the IAM applied in other studies, but still provides clear and transparent decision support for policy making, and also the uncertainties and risks linked with the higher penetration of renewables in West Pomeranian region were taken into account.
Achieved results are in line with results obtained by other studies [10,12,19], indicating that, though increased use of renewable energy sources in electricity production is linked with a lot of uncertainties and risks [5,16,17], the penetration of renewables provides a lot of additional or external benefits linked to increased labor opportunities and increased budget revenues from VAT and other taxes.
Recently published studies on energy sector planning [43,44,45,46,47,48] have applied various advanced MCDA-integrating fuzzy methods for decision making support however not emphasizing assessments of risks in selecting best energy supply options, though study [46] applied AHP weighting uncertainty analysis for sustainability assessment just of coal-fired power plants and applied approach can be extended for all possible electricity generation alternatives, including renewable energy sources.
The main limitation of the study is the small number of future development scenarios. More options can be elaborated and assessed. Future research is necessary for testing obtained results with other MCDA models and applying stochastic modeling techniques such as the Monte Carlo simulation.

7. Conclusions

Risk is a permanent object related to management, especially when we try to specify the behavior of an economic entity in the annual energy production plan. The importance of decisions taken in risk conditions increases in supporting decision making in the energy sector. The longer the time horizon, the more likely it is to create different situations that can significantly affect the economic result.
Risk is very important for econometric models used to plan production in the energy sector. The conditions for success are the accurate determination of the forecasted parameters of the model and adequate knowledge of cause-and-effect relations of the phenomena included in the model.
Without determining the probability of occurrence of certain phenomena and their inclusion in the model, it is not possible to determine how much the solutions from resulting models are accurate, and what is the probability of their implementation in specific conditions.
This article proposes an original model of a regional system of alternative energy sources, investigating various types of technologies that may appear in the system. With the help of an optimizing multi-criteria model, three scenarios optimizing the regional energy potential were developed by applying a lexicographical model for risk mitigation in decision making. The lexicographic method was used to search for compromise solutions. The objective function (minimized) consisted of four components: costs related to energy production, costs related to certificates, ecological costs, and loss of soil fertility.
For the construction of optimization model, the values of technical and economic parameters were first calculated and the minimum or maximum levels of balance conditions (rather than by-side conditions) were established. The model adopted 24 important decision variables.
The model was applied for a case study in West Pomeranian region. The calculations of the proprietary model indicate the possibility of building a regional system for obtaining energy from alternative sources. The constructed mathematical model and its validation confirm that it can be a valuable tool for simulating the energy policy of each region in terms of risk.
The study revealed that current state energy policy is risky and is not conducive to the creation of autonomous regional energy systems in Poland, where the main decision maker about the size and structure of the energy produced would be decided by the local government.
The proposed model and developed case study can be used by the local government of West Pomeranian region in decision making for future energy sector development by integrating more renewable energy sources in the region.
Though constructed energy sector development scenarios in West Pomeranian region indicated quite high risks linked to wind, biomass, and solar energy extension, significant benefits achieved from renewable energy penetration would be achieved, making these scenarios attractive for decision makers.
The main benefits of penetration of renewables in West Pomeranian region would be obtained due to the creation of new jobs and significant increase of budget revenues from VAT.
In the West Pomeranian region, the main energy supplier currently is coal power. The development of wind energy is associated with high risk, due to the changing legal aspects. The introduction of the “Anti-Carnage Act” in 2016 resulted in the total blocking of the development of new wind installations in Poland. Therefore, the scenario of wind energy development seems to be the most risky one to implement in West Pomeranian region.
The constructed biomass power plant in Szczecin uses local energy resources to a small extent, increasing the risk of growing biomass from wasteland and permanent herbage. It should be emphasized that a large part of the biomass comes from imports. The cultivation of energy crops on arable land is very risky under current price conditions.
It seems that, at the moment, the best scenario in terms of lower risks is the development of solar energy, however, with increasing the scale of production, solar energy may become profitable.
The increase in CO2 emission allowances may cause the structure of the energy mix to look completely different. The burden of CO2 on coal-fired power plants may put the profitability of renewable energy in a different light. The first scenario may thus come true, where the region will be self-sufficient.

Author Contributions

M.R. conceptualized this manuscript; Y.B. and M.R prepared the database, methodology, software validation and wrote this manuscript; D.S consolidated the literature reviewer; D.S., and Y.B. reviewed the manuscript and assisted in writing and finalizing the manuscript.

Funding

This research received no external funding.

Conflicts of Interest

The authors declare no conflict of interest.

References

  1. Jankowski, B. Modeling of the Development of the National Energy System, Taking into Account the Requirements of Stabilizing the Reduction of Carbon Dioxide Emissions in Poland; IPPT PAN: Warsaw, Poland, 1997; p. 26. [Google Scholar]
  2. Gawrońska-Nowak, B.; Walerysiak, G. Economic Decisions Quantitative Approach, Polskie; Wydawnictwo Ekonomiczne: Warsaw, Poland, 2016; p. 11. [Google Scholar]
  3. Chen, J.; Cheng, S.; Nikic, V.; Song, M. Quo Vadis? Major Players in Global Coal Consumption and Emissions Reduction. Transform. Bus. Econ. 2017, 17, 112–132. [Google Scholar]
  4. Thangavelu, S.R.; Khambadkone, A.M.; Karimi, I.A. Long-term optimal energy mix planning towards high energy security and low GHG emission. Appl. Energy 2015, 154, 959–969. [Google Scholar] [CrossRef]
  5. Ji, L.; Zhang, X.P.P.; Huang, G.H.H.; Yin, J.G.G. Development of an inexact risk-aversion optimization model for regional carbon constrained electricity system planning under uncertainty. Energy Convers. Manag. 2015, 94, 353–364. [Google Scholar] [CrossRef]
  6. Ioannou, A.; Angus, A.; Brennan, F. Risk-based methods for sustainable energy system planning: A review. Renew. Sustain. Energy Rev. 2017, 74, 602–615. [Google Scholar] [CrossRef]
  7. Wing, L.C.; Jin, Z. Risk management methods applied to renewable and sustainable energy: A review. Renew. Energ. Syst. 2015, 3, 1–12. [Google Scholar] [CrossRef]
  8. Feurtey, É.; Ilinca, A.; Sakout, A.; Saucier, C. Institutional factors influencing strategic decision-making in energy policy; a case study of wind energy in France and Quebec (Canada). Renew Sustain. Energy Rev. 2016, 59, 1455–1470. [Google Scholar] [CrossRef]
  9. Strantzali, E.; Aravossis, K. Decision making in renewable energy investments: a review. Renew Sustain. Energy Rev. 2016, 55, 885–898. [Google Scholar] [CrossRef]
  10. Gatzert, N.; Kosub, T. Risks and risk management of renewable energy projects: The case of onshore and off-shore wind parks. Renew. Sustain. Energy Rev. 2016, 60, 982–998. [Google Scholar] [CrossRef]
  11. Bhahattacharya, A.; Kojima, S. Power sector investment risk and renewable energy: A Japanese case study using portfolio risk optimization method. Energ. Policy 2012, 40, 69–80. [Google Scholar] [CrossRef]
  12. Escribano Francés, G.; Marín-Quemada, J.M.; San Martín González, E. RES and risk: Renewable energy’s contribution to energy security. A portfolio-based approach. Renew. Sustain. Energy Rev. 2013, 26, 549–559. [Google Scholar] [CrossRef]
  13. Soroudi, A.; Amraee, T. Decision making under uncertainty in energy systems: State of the art. Renew Sustain. Energy Rev. 2013, 28, 37–84. [Google Scholar] [CrossRef]
  14. Stewart, T.J. Dealing with Uncertainties in MCDA, in Multiple Criteria Decision Analysis: State of the Art Surveys; Springer: Berlin, Germany, 2005. [Google Scholar]
  15. Zhang, L.; Zhou, P.; Newton, S.; Fang, J.; Zhou, D.; Zhang, L. Evaluating clean energy alternatives for Jiangsu, China: An improved multi-criteria decision making method. Energy 2015, 90, 953–964. [Google Scholar] [CrossRef]
  16. Kolios, A.J.; Rodriguez-Tsouroukdissian, A.; Salonitis, K. Multi-criteria decision analysis of off-shore wind turbines support structures under stochastic inputs. Ships. Offshore Struct. 2016, 1, 38–49. [Google Scholar]
  17. Cobuloglu, H.I.; Büyüktahtak, I.E. A stochastic multi-criteria decision analysis for sustainable biomass crop selection. Expert. Syst. Appl. 2015, 42, 6065–6074. [Google Scholar] [CrossRef]
  18. Zeng, Z.; Nasri, E.; Chini, A.; Ries, R.; Xu, J. A multiple objective decision making model for energy generation portfolio under fuzzy uncertainty: Case study of large scale investor-owned utilities in Florida. Renew. Energy 2015, 75, 224–242. [Google Scholar] [CrossRef]
  19. Kolios, A.; Read, G.; Ioannou, A. Application of multi-criteria decision-making to risk prioritisation in tidal energy developments. Int. J. Sustain. Energy 2016, 35, 59–74. [Google Scholar] [CrossRef]
  20. Streimikiene, D.; Balezentis, T.; Krisciukaitienė, I.; Balezentis, A. Prioritizing sustainable electricity production technologies: MCDM approach. Renew. Sustain. Energy Rev. 2012, 16, 3302–3311. [Google Scholar] [CrossRef]
  21. Beccali, M.; Cellura, M.; Mistretta, M. Decision-making in energy planning. Application of the Electre method at regional level for the diffusion of renewable energy technology. Renew. Energy 2003, 28, 2063–2087. [Google Scholar] [CrossRef]
  22. Kaya, T.; Kahraman, C. Multicriteria decision making in energy planning using a modified fuzzy TOPSIS methodology. Expert Syst. Appl. 2011, 38, 6577–6585. [Google Scholar] [CrossRef]
  23. Beccali, M.; Cellura, M.; Ardente, D. Decision making in energy planning: The ELECTRE multicriteria analysis approach compared to a fuzzy-sets methodology. Energy Convers. Manag. 1998, 39, 1869–1881. [Google Scholar] [CrossRef]
  24. Yazdani, M.; Chatterjee, P.; Zavadskas, E.K.; Streimikiene, D. A novel integrated decision-making approach for the evaluation and selection of renewable energy technologies. Clean. Technol. Envir. 2018, 20, 403–420. [Google Scholar] [CrossRef]
  25. Baležentis, T.; Streimikiene, D. Multi-criteria ranking of energy generation scenarios with Monte Carlo simulation. Appl. Energy 2017, 185, 862–871. [Google Scholar] [CrossRef]
  26. Taha, A.F.; Panchal, J.H. Decision-making in energy systems with multiple technologies and uncertain preferences. IEEE Transactions on Systems, Man, and Cybernetics: Systems 2014, 44, 894–907. [Google Scholar] [CrossRef]
  27. Nerini, F.F.; Keppo, I.; Strachan, N. Myopic decision making in energy system decarbonisation pathways. A UK case study. Energy Strateg. Rev. 2017, 17, 19–26. [Google Scholar] [CrossRef]
  28. Cipriano, X.; Vellido, A.; Cipriano, J.; Martí-Herrero, J.; Danov, S. Influencing factors in energy use of housing blocks: A new methodology, based on clustering and energy simulations, for decision making in energy refurbishment projects. Energ. Effic. 2017, 10, 359–382. [Google Scholar] [CrossRef]
  29. Meisel, S.; Powell, W.B. Dynamic decision making in energy systems with storage and renewable energy sources. In Advances in Energy System Optimization; Birkhäuser: Cham, Switzerland, 2017; pp. 87–101. [Google Scholar]
  30. Sobczyk, E.J.; Wota, A.; Krężołek, S. Application of mathematical multicriteria methods to choose the optimal variant of the source of hard coal mining. Min. Resour. Econ. 2011, 27, 34–39. [Google Scholar]
  31. Simpson, A.P.; Edwards, C.F. The utility of environmental exergy analysis for decision making in energy. Energy 2013, 55, 742–751. [Google Scholar] [CrossRef]
  32. Gillingham, K.; Newell, R.G.; Palmer, K. Energy efficiency economics and policy. Annu. Rev. Resour. Econ. 2009, 1, 597–620. [Google Scholar] [CrossRef]
  33. Wimmler, G.; Hejazi, E.; de Oliveira Fernandes, E.; Moreira, C.; Connors, S. Multi criteria decision support methods for renewable energy systems on islands. J. Clean. Energy Technol. 2015, 3, 185–195. [Google Scholar] [CrossRef]
  34. Malicki, M. Risk in the Planning of Feed Economy; Wyd. AR Szczecin: Szczecin, Poland, 1999; p. 44. [Google Scholar]
  35. Malicki, M. The Lexographic Method in Planning the Production of a Farm; Wyd. AR Szczecin: Szczecin, Poland, 1993. [Google Scholar]
  36. Konarzewska-Gubała, E. Programming for Multiple goals; PWN: Warsaw, Poland, 1980; p. 98. [Google Scholar]
  37. Kasprzak, T. Multicriteria Decision Support Systems; UW Publishing House: Warsaw, Poland, 1992; p. 143. [Google Scholar]
  38. Krawiec, B. Optimization Methods in Agriculture; PWN: Warsaw, Poland, 1992; p. 35. [Google Scholar]
  39. Jovovic, R.; Simanaviciene, Z.; Dirma, V. Assessment of Heat Production Savings Resulting from Replacement of Gas with Biofuels. Transform. Bus. Econ. 2017, 16, 34–51. [Google Scholar]
  40. Program for the development of the energy sector in the West Pomeranian Region until 2015 with a prospect until 2030, Szczecin 2016. Available online: http://www.beif.pl/wp-content/uploads/2018/02/PRMEPM_EN.pdf?x30829 (accessed on 10 January 2019).
  41. Szymański, B. How to Compare the Power of Renewable Energy Plants with Conventional Ones; Solaria: Warsaw, Poland, 2013. [Google Scholar]
  42. Chang, M.-C.; Shieh, H.-S. The Relations between Energy Efficiency and GDP in the Baltic Sea Region and Non-Baltic Sea Region. Transform. Bus. Econ. 2017, 16, 235–247. [Google Scholar]
  43. Wang, H.; Jiao, W.; Lahdelma, R.; Zhu, C.; Zou, P. Stochastic Multicriteria Acceptability Analysis for Evaluation of Combined Heat and Power Units. Energies 2015, 8, 59–78. [Google Scholar] [CrossRef]
  44. Cavallaro, F.; Zavadskas, E.K.; Raslanas, S. Evaluation of Combined Heat and Power (CHP) Systems Using Fuzzy Shannon Entropy and Fuzzy TOPSIS. Sustainability 2016, 8, 556. [Google Scholar] [CrossRef]
  45. Shaaban, M.; Scheffran, J.; Böhner, J.; Elsobki, M.S. Sustainability Assessment of Electricity Generation Technologies in Egypt Using Multi-Criteria Decision Analysis. Energies 2018, 11, 1117. [Google Scholar] [CrossRef]
  46. Wu, D.; Yang, Z.; Wang, N.; Li, C.; Yang, Y. An Integrated Multi-Criteria Decision Making Model and AHP Weighting Uncertainty Analysis for Sustainability Assessment of Coal-Fired Power Units. Sustainability 2018, 10, 1700. [Google Scholar] [CrossRef]
  47. Brożyna, J.; Mentel, G.; Szetela, B. Influence of double seasonality on economic forecasts on the example of energy demand. J. Int. Stud. 2016, 9, 9–20. [Google Scholar] [CrossRef] [PubMed]
  48. Tvaronavičienė, M.; Prakapienė, D.; Garškaitė-Milvydienė, K.; Prakapas, R.; Nawrot, Ł. Energy Efficiency in the Long-Run in the Selected European Countries. Econ. Sociol. 2018, 11, 245–254. [Google Scholar] [CrossRef] [PubMed]
Figure 1. Procedure for preparing a plan using the lexicographic method. Source: Own study.
Sustainability 11 01018 g001
Table 1. Decision making in the energy sector and major outcomes.
AuthorKey IdeaResearch ObjectOutcome of the Study
Strantzali, E. and Aravossis, K. [8]The paper presents a review of the current state of the art in decision support methods applied to renewable and sustainable energy throughout the literature in the field of energy planning.Decision making in renewable energy investments.The selected papers were classified by their year of publication, decision making technique, energy type, the criteria used, geographic distribution, and the application areas.
Feurtey, É., Ilinca, A., Sakout, A., and Saucier, C. [9]A comparative transnational study of Quebecois (Canada) and French research confirms that political choices are dynamic and vary with changes in the wind energy context, the balance of power between pressure groups, supranational influences, energy evaluation approaches, and social acceptance. Institutional factors that influence a strategic wind energy decision-making process.1. Used an innovative conceptualization of energy policy to investigate under what circumstances a wind energy policy can be successful.
2. The model was built in four steps and nine components.
3. Strategic choices are directly influenced by the initial state of the environment, the economy, and the society, and indirectly affected by industrial sector dissemination process, social acceptance, and the type of energy policy evaluation used.
Streimikiene, D., Balezentis, T., Krisciukaitienė, I., and Balezentis, A. [20]To develop the multi-criteria decision support framework for choosing the most sustainable electricity production technologies.Sustainable electricity production technologies.1. The indicator system covering different approaches of sustainability was established.
2. The analysis proved that future energy policy should be oriented towards the sustainable energy technologies, namely water and solar thermal ones.
Beccali, M., Cellura, M., and Mistretta, M [21]Application of the multi-criteria decision-making methodology used to assess an action plan for the diffusion of renewable energy technologies at regional scale.Decision making in energy planning.1. This methodological tool gives the decision maker considerable help in the selection of the most suitable innovative technologies in the energy sector, according to preliminary fixed objectives.
2. Case study was carried out for the island of Sardinia.
3. This region presents, on one hand, a high potential for energy resource exploitation, but, on the other hand, it represents a specific case among other Italian regions, because of its socio-economic status and history.
4. Three decision scenarios were supposed, each one representing a coherent set of actions, on the basis of which strategies of diffusion were developed.
Kaya, T. and Kahraman, C. [22]Selection of the best energy technology requires the consideration of conflicting quantitative and qualitative evaluation criteria
The fuzzy set theory is a strong tool which can deal with the uncertainty in case of subjective, incomplete, and vague information.
Multi-criteria decision making in energy planning.In the proposed methodology, the weights of the selection criteria are determined by fuzzy pairwise comparison matrices.
Beccali, M., Cellura, M., and Ardente, D. [23]This paper aims to introduce a methodological tool able to organize and synthesize the large set of variables coming from several specific judgements (or assessments), helping the decision maker to read the complex problem, understand it, and make choices.Decision making in energy planning.1. The ELECTRE methods family was presented for energy planning application. It is a flexible ranking method, which takes into account the uncertainties of all the specific assessments, the qualitative nature of some indexes, and the weight of the preferences or willingness systems of the decision maker.
2. A decision making support method, based on fuzzy logic, was tested and compared to the previous one.
3. A case study developed by the authors shows differences among these two different approaches.
4. Advantages and drawbacks of both methods were explored and suggestions proposed.
Yazdani, M., Chatterjee, P., Zavadskas, E. K., and Streimikiene, D. [24]Finding a set of energy sources and conversion devices to meet energy demands in an optimal way. Decision making in the energy sector.1. The hybrid decision making trial and evaluation laboratory and analytic network process (DEMATEL-ANP) model was proposed in order to stress the importance of the evaluation criteria when selecting alternative renewable energy sources (RES) and the causal relationships between the criteria.
2. Sensitivity analysis, result validation and critical outcomes are provided as well, to offer guidelines for policy makers in the selection of the best alternative RES with the maximum effectiveness.
Baležentis, T. and Streimikiene, D. [25]The paper aims at ranking European Union (EU) energy development scenarios based on several integrated assessment models (IAMs) with respect to multiple criteria.Energy policy analysis, effective energy planning.1. IAMs can successfully handle uncertainty pertinent to energy planning problems.
2. Multi-criteria decision making (MCDM) tools are relevant in aggregating diverse information, and thus comparing alternative energy planning options.
3. Accounting for uncertainty surrounding policy priorities outside the IAM.
4. Assigning different importance to objectives.
5. The rankings provided for the scenarios by different MCDM techniques diverge.
Taha, A. F. and Panchal, J. H. [26]Helping the ISO (independent system operators) in modeling the lower-level GENCOs’ (energy generation companies) decision problems. GENCOs compete in energy production, while maximizing their net present values and minimizing their capital investments.Decision making in energy systems with multiple technologies and uncertain preferences.1. The study of the effect of stakeholders’ preferences on the solution of the complementarity problem.
2. Analysis of the effect of the ISO’s parameters on the generation equilibrium quantities.
3. Simulation of the stochastic complementarity problem using different techniques.
4. The market players’ decisions result in a lower-level market equilibrium problem, which is formulated as a complementarity problem.
5. The uniqueness of the solutions for the lower-level problem are shown.
Nerini, F. F., Keppo, I., and Strachan, N. [27]Myopic planning might result in delayed strategic investments and in considerably higher costs for achieving decarbonization targets, compared to estimates done with perfect foresight optimization energy models.Myopia in energy system investments.1. Carbon prices obtained from perfect foresight energy models might be under-estimated.
2. Increasing myopia in energy system investments could result in the postponement (or cancellation) of strategic investments on key technologies, such as low-carbon transportation infrastructure.
3. With increasing myopia of the system, those carbon prices would result in the non-achievement of UK’s climate goals.
4. In order to reach the set targets, significantly higher carbon prices are required under myopia.
Cipriano, X., Vellido, A., Cipriano, J., Martí-Herrero, J., and Danov, S. [28]To identify which are the factors with highest influence in the energy consumption of residential buildings.
To report a new methodology for the assessment of the energy performance of large groups of buildings when considering the real use of energy.
Energy performance of large groups of buildings.Simulation of energy demand and indoor temperature against the monitored comfort conditions in a short period was performed to obtain end use load disaggregation.
This methodology was applied in a district at Terrassa City (Spain), and six reference dwellings were selected.
The method was able to identify the main patterns and provide occupants with feasible recommendations so that they can make required decisions at neighborhood level.
Meisel, S. and Powell, W. B. [29]Energy system optimization: dynamic decision making in energy systems with storage and renewable energy sources.Energy system with a storage device, a renewable energy source with market accessModel of an energy system with a storage device, a renewable energy source, and with market access as a Markov decision process.
Identified four classes of pure policies, each of which may work best depending on the characteristics of the system (volatility of prices, stationarity, and accuracy of forecasts).
Each of the four classes can work best on a particular instance of the problem.
Sobczyk, E. J., Wota, A., and Krężołek, S. [30]Energy production planning exercise was developed based on clustering the relative closeness of actual values to the target values. The relative closeness was obtained by the TOPSIS method while technological clusters were formed by fuzzy techniques.The optimal variant of the source for hard coal mining was selected.The Technique for Order Preference by Similarity to Ideal Solution (TOPSIS ) method was applied for MCDA in selection of hard coal mining sources;
the risks were assessed by applying fuzzy techniques;
the risks were integrated in MCDA for selection of the best option.
Simpson, A. P. and Edwards, C. F. [31]The analysis framework discussed and employed in this paper utilizes the recent recognition that exergy is a form of environmental free energy to provide a fundamental basis for valuing environmental interactions independent from their secondary impacts. A key attribute of the framework is its ability to evaluate the environmental performance of energy systems on a level playing field, regardless of the specifics of the systems, i.e., resources consumed, products and by-products produced, or system size and time scale.The utility of environmental exergy analysis for decision making in energy.1. Extends the principles of technical exergy analysis to the environment in order to quantify the location, magnitudes, and types of environmental impact state change, alteration of natural transfers, and destruction change.
2. Anthropocentric sensitivity analysis enables the results of environmental exergy analysis to be interpreted for decision making.
3. The utility of the analysis framework for decision making is demonstrated through application to three example energy systems.
Gillingham, K., Newell, R. G., and Palmer, K [32]Energy efficiency and conservation are considered key means for reducing greenhouse gas emissions and achieving other energy policy goals, but associated market behavior and policy responses have engendered debates in the economic literature. The article reviews economic concepts underlying consumer decision making in energy efficiency and conservation, and examines related empirical literature.Energy efficiency economics and policy.1. The article provides an economic perspective on the range of market barriers, market failures, and behavioral failures that have been cited in the energy efficiency context.
2. Assess the extent to which these conditions provide a motivation for policy intervention in energy-using product markets, including an examination of the evidence oil policy effectiveness and cost.
Table 2. Installed renewable energy capacities in the West Pomeranian region on 31 December 2017.
Wind energyBiomassSolar energyHydro and geothermal power
Wind farms on land 726.429 MW (43 installations)
-
Installations producing biogas energy from sewage treatment plants, 1.478 MW (4 installations)
-
Installations producing energy from mixed biomass, 75.730 MW (2 installations)
-
Installations producing energy from agricultural biogas, 3.913 MW (4 installations)
-
Installations generating energy from landfill biogas, 423 MW (11 installations)
Installations generating energy from solar energy 3.867 MW (88 installations)
-
Hydroelectric power plants up to 0.3 MW–4.84 MW (61 installations)
-
hydroelectric power plants up to 1MW–2.570 MW (4 installations)
-
5 MW water-flow power plants, 6350 MW (3 installations)
Source: [40].
Table 3. Electricity production forecast in the West Pomeranian region in 2030.
Energy Production in 2006 in the West Pomeranian Region [GWh]Energy Production in 2030 in the West Pomeranian Region [GWh]
7713.69333.45
Source: [40].
Table 4. Renewable energy potential of the West Pomeranian region.
Type of Renewable Energy Potential of the West Pomeranian Region GWh
Wind farms26,600
Installations producing energy from biogas638.7
Installations producing energy from biomass7156.5
Installations generating energy from solar energy393.2
Hydroelectric power plants14.3
Source: Own study based on the model.
Table 5. Maximum power utilization rate.
Power PlantsElectricity GenerationUnitsCoefficient of Use Maximum Power
Theoretical maximum production for 1 MW of power plant8.76GWh100.0%
Photovoltaic power plant0.97GWh11.1%
Wind power plant, good location2.10GWh24.0%
Biomass power plant2.19GWh25.0%
Hydroelectric power plant2.7GWh30.8%
Biogas power plant3.35GWh38.3%
Waste power station2.75GWh31.5%
Coal power station6.9GWh78.8%
Source: [41].
Table 6. Cost factors for each type of energy (in PLN/kWh).
Types of Energyx1x2x3x4x5x6x7x8x9x10x11x12x13x14
Costs of production0.470.610.700.71.100.650.650.650.700.651.391.100.450.45
The cost of the certificate0.003880.003880.123850.123850.123850.123850.123850.20120.123850.123850.20120.123850.123850.2012
Ecological costs0.03160.02520.00060.00060.000720.00060.00060.00060.01160.01160.0120.0120.000420.00042
Total costs0.440.580.57550.57550.97550.525550.525550.44820.564550.514551.17680.964150.325730.24838
Source: Own study based on the model.
Table 7. Loss of soil fertility caused by the production of energy resources (in t/ha).
Energy Resourcesx16x17x18x19x20x21x22x23x24
Loss of soil fertility1.41.41.41.41.40.530.531.151.15
Source: Own study based on the model.
Table 8. Cost of energy production from energy crops (in kWh/ha).
Energy Resourcesx16x17x18x19x20x21x22x23x24
Manufacturing cost0.180.350.170.070.040.50.340.50.21
Source: Own study based on the model.
Table 9. Solution of the first scenario (optimization of the use of alternative energy sources in the region).
Types of Energyx1x2x3x4x5x6x7x8x9x10x11x12x13x14x15
Energy production03016.5359.868.23383.5301452.851502.2921.52123.39533.920416.511914.579333.45
Energy raw materialsx16x17x18x19x20x21x22x23x24
Crop size00000000.0590
Source: Own study based on the model.
Table 10. Solution of the second scenario (development of solar energy).
Types of Energyx1x2x3x4x5x6x7x8x9x10x11x12x13x14x15
Energy production07305.144.210.71243.1601071.71025.2313.8700173.1508877.5
Energy raw materialsx16x17x18x19x20x21x22x23x24
Crop size00000000.0590
Source: Own study based on the model.
Table 11. Solution of the third scenario (development of wind energy).
Types of Energyx1x2x3x4x5x6x7x8x9x10x11x12x13x14x15
Energy production07274.1561.791.0034.801634.83147.1431.5221.5200416.51508877.5
Energy raw materialsx16x17x18x19x20x21x22x23x24
Crop size00000000.04230
Source: Own study.
Table 12. Number of new jobs created in the West Pomeranian region.
Type of Renewable EnergyNumber of Jobs Scenario 1Number of Jobs Scenario 2Number of Jobs Scenario 3
Hydropower30.281
Solar energy25581617
Wind energy9137434434
Energy produced from biogas1880
Energy produced from biomass2447
Source: Own study.
Table 13. Budget receipts from value added tax (VAT), resulting from the increased number of investments related to the development of renewable energy production capacity.
Type of Renewable EnergyBudget Receipts from VAT Scenario 1Budget Receipts from VAT Scenario 2Budget Receipts from VAT Scenario 3
Hydropower8.75 mln zł0.74 mln zł2.88 mln zł
Solar energy708.46 mln zł448.05 mln zł
Wind energy1.728 mld zł 82.105 mln zł
Energy produced from biogas458.98 mln zł
Energy produced from biomass2.203 mld zł
Source: Own study.

