Visualizing Sustainability Research in Business and Management (1990–2019) and Emerging Topics: A Large-Scale Bibliometric Analysis


Abstract
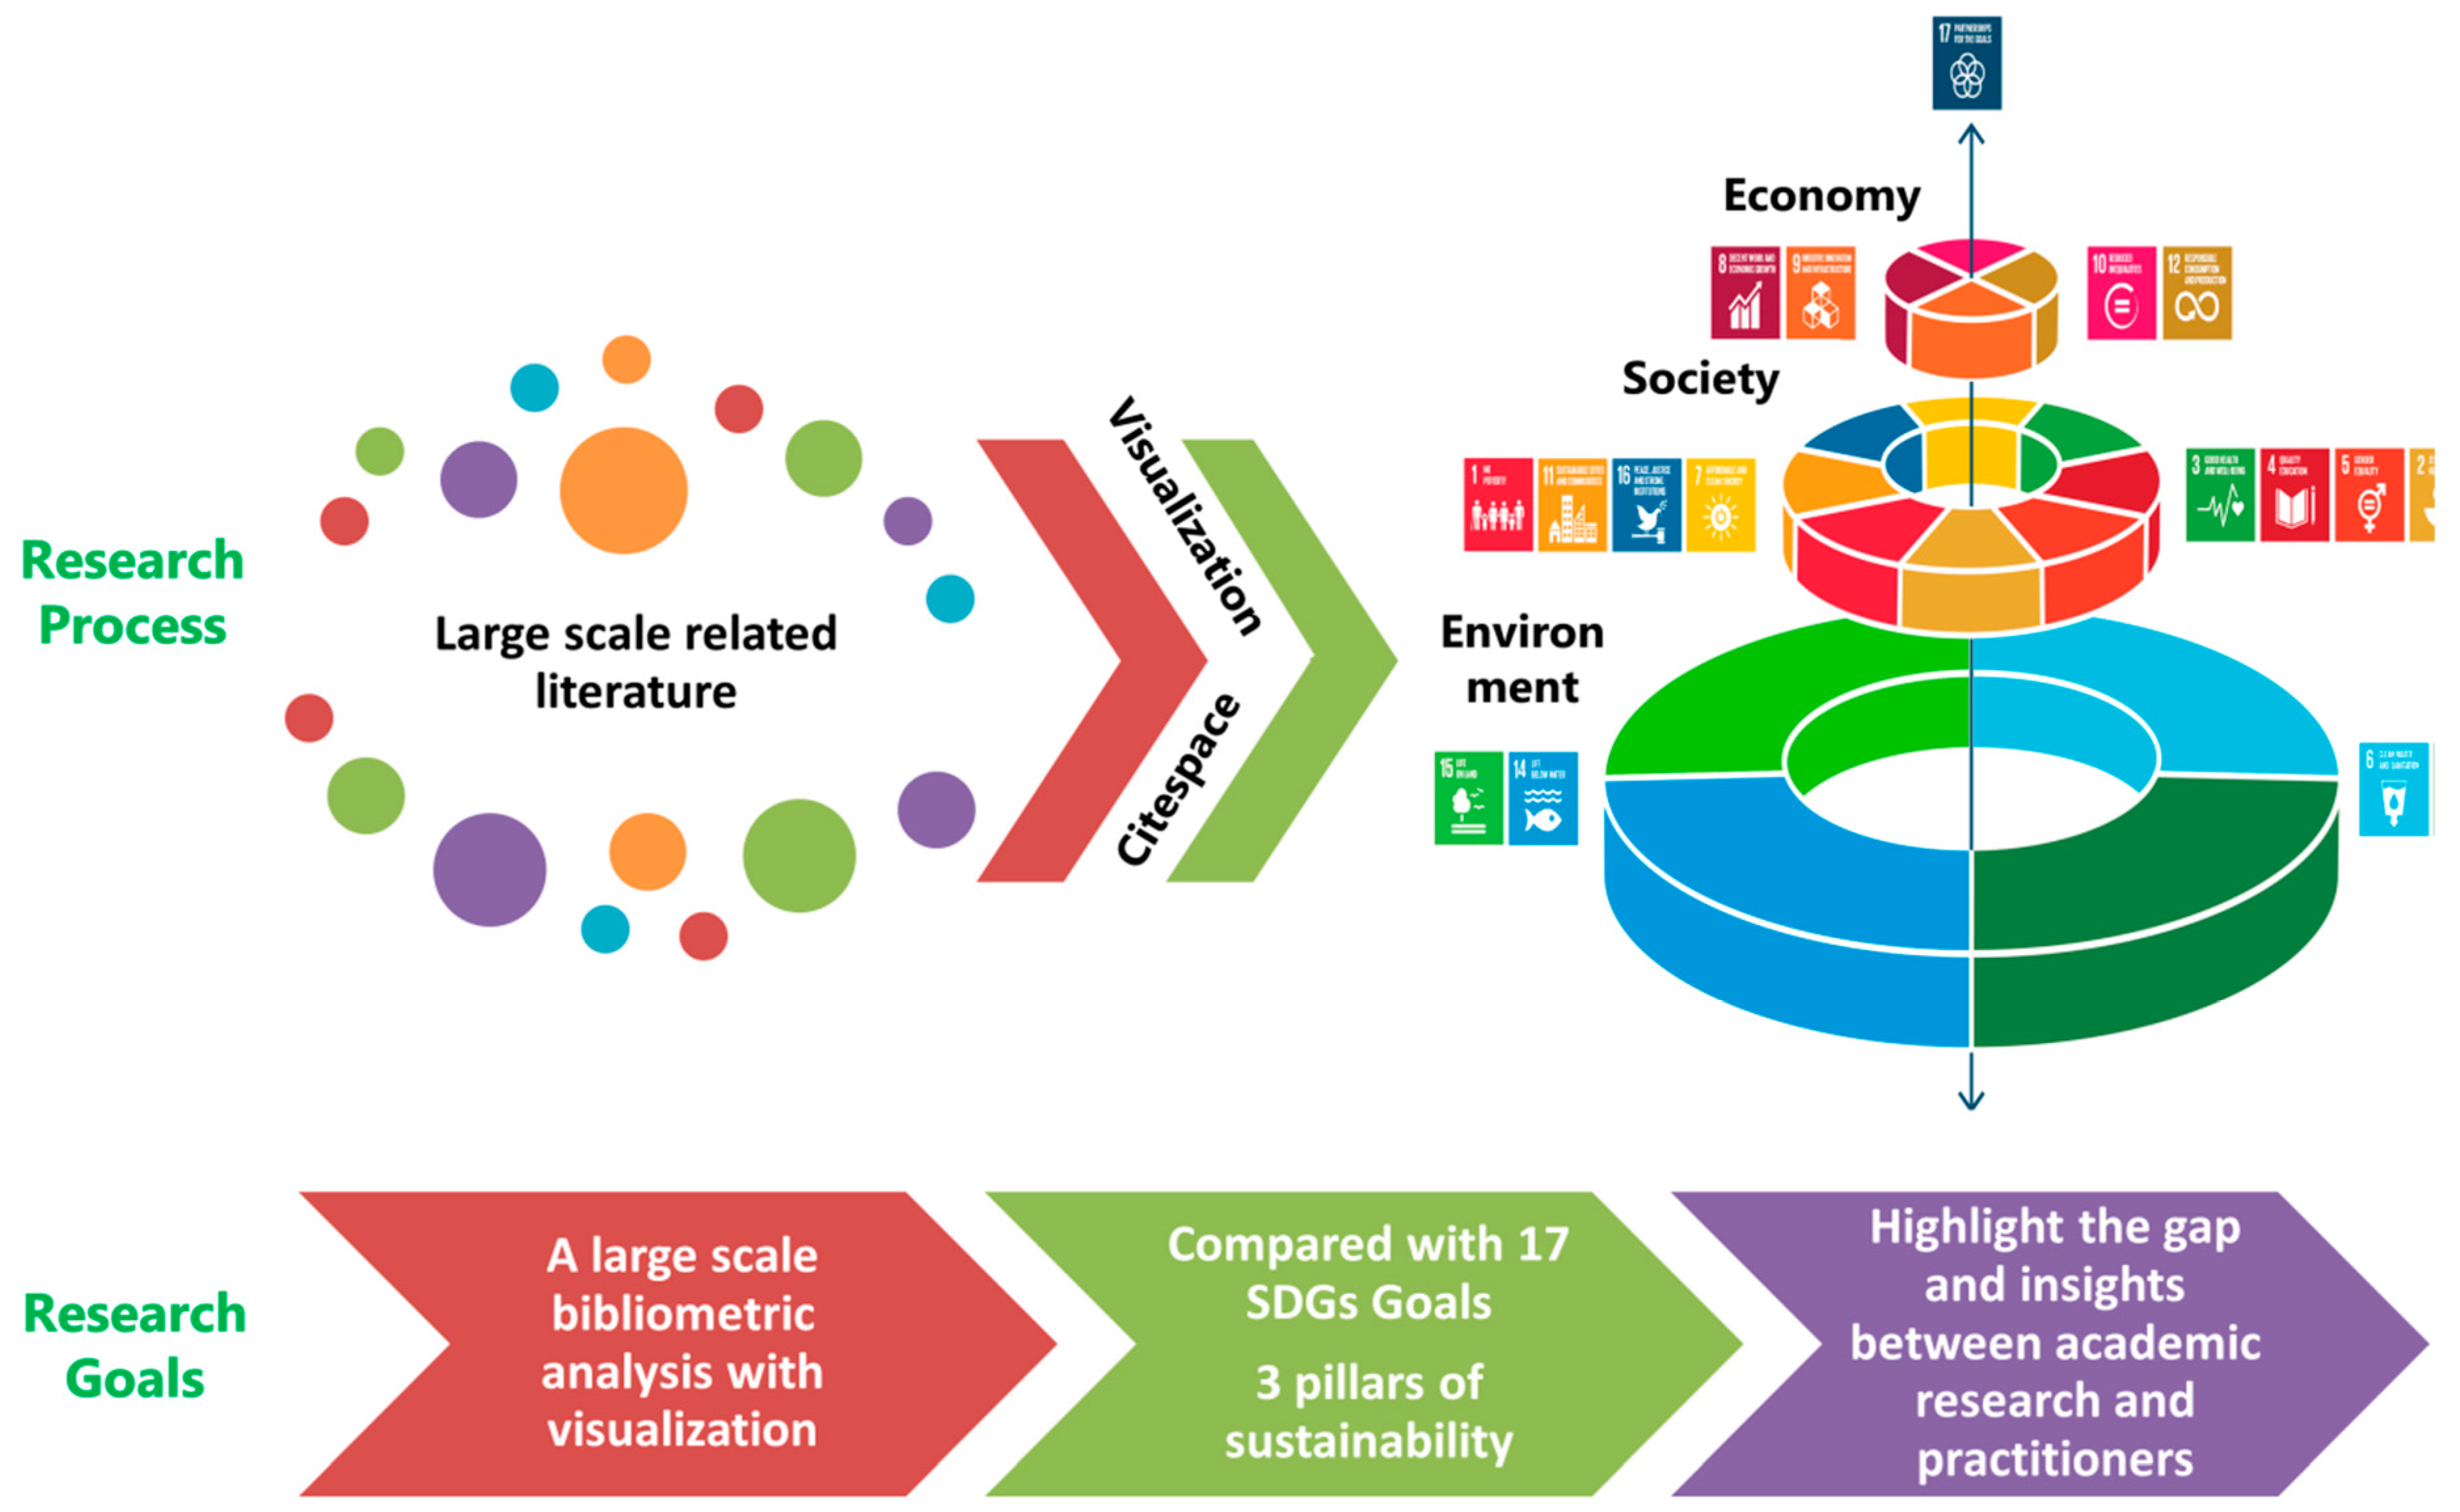
:1. Introduction
“Our challenge is to help more people to make healthy money, ‘sustainable money,’ money that is not only good for themselves but also good for the society. Business people like me are beginning to pay attention to social issues including the environment, taking action and really treating this issue very seriously.”
2. Related Work
2.1. Systematic Literature Reviews of Sustainability
2.2. Large-Scale Bibliometric Review to Identify Specialties
2.3. The Gap between Academic Research and Practice
3. Data and Method
3.1. Sample
3.2. Analytical Method
4. Bibliometric Analyses and Results
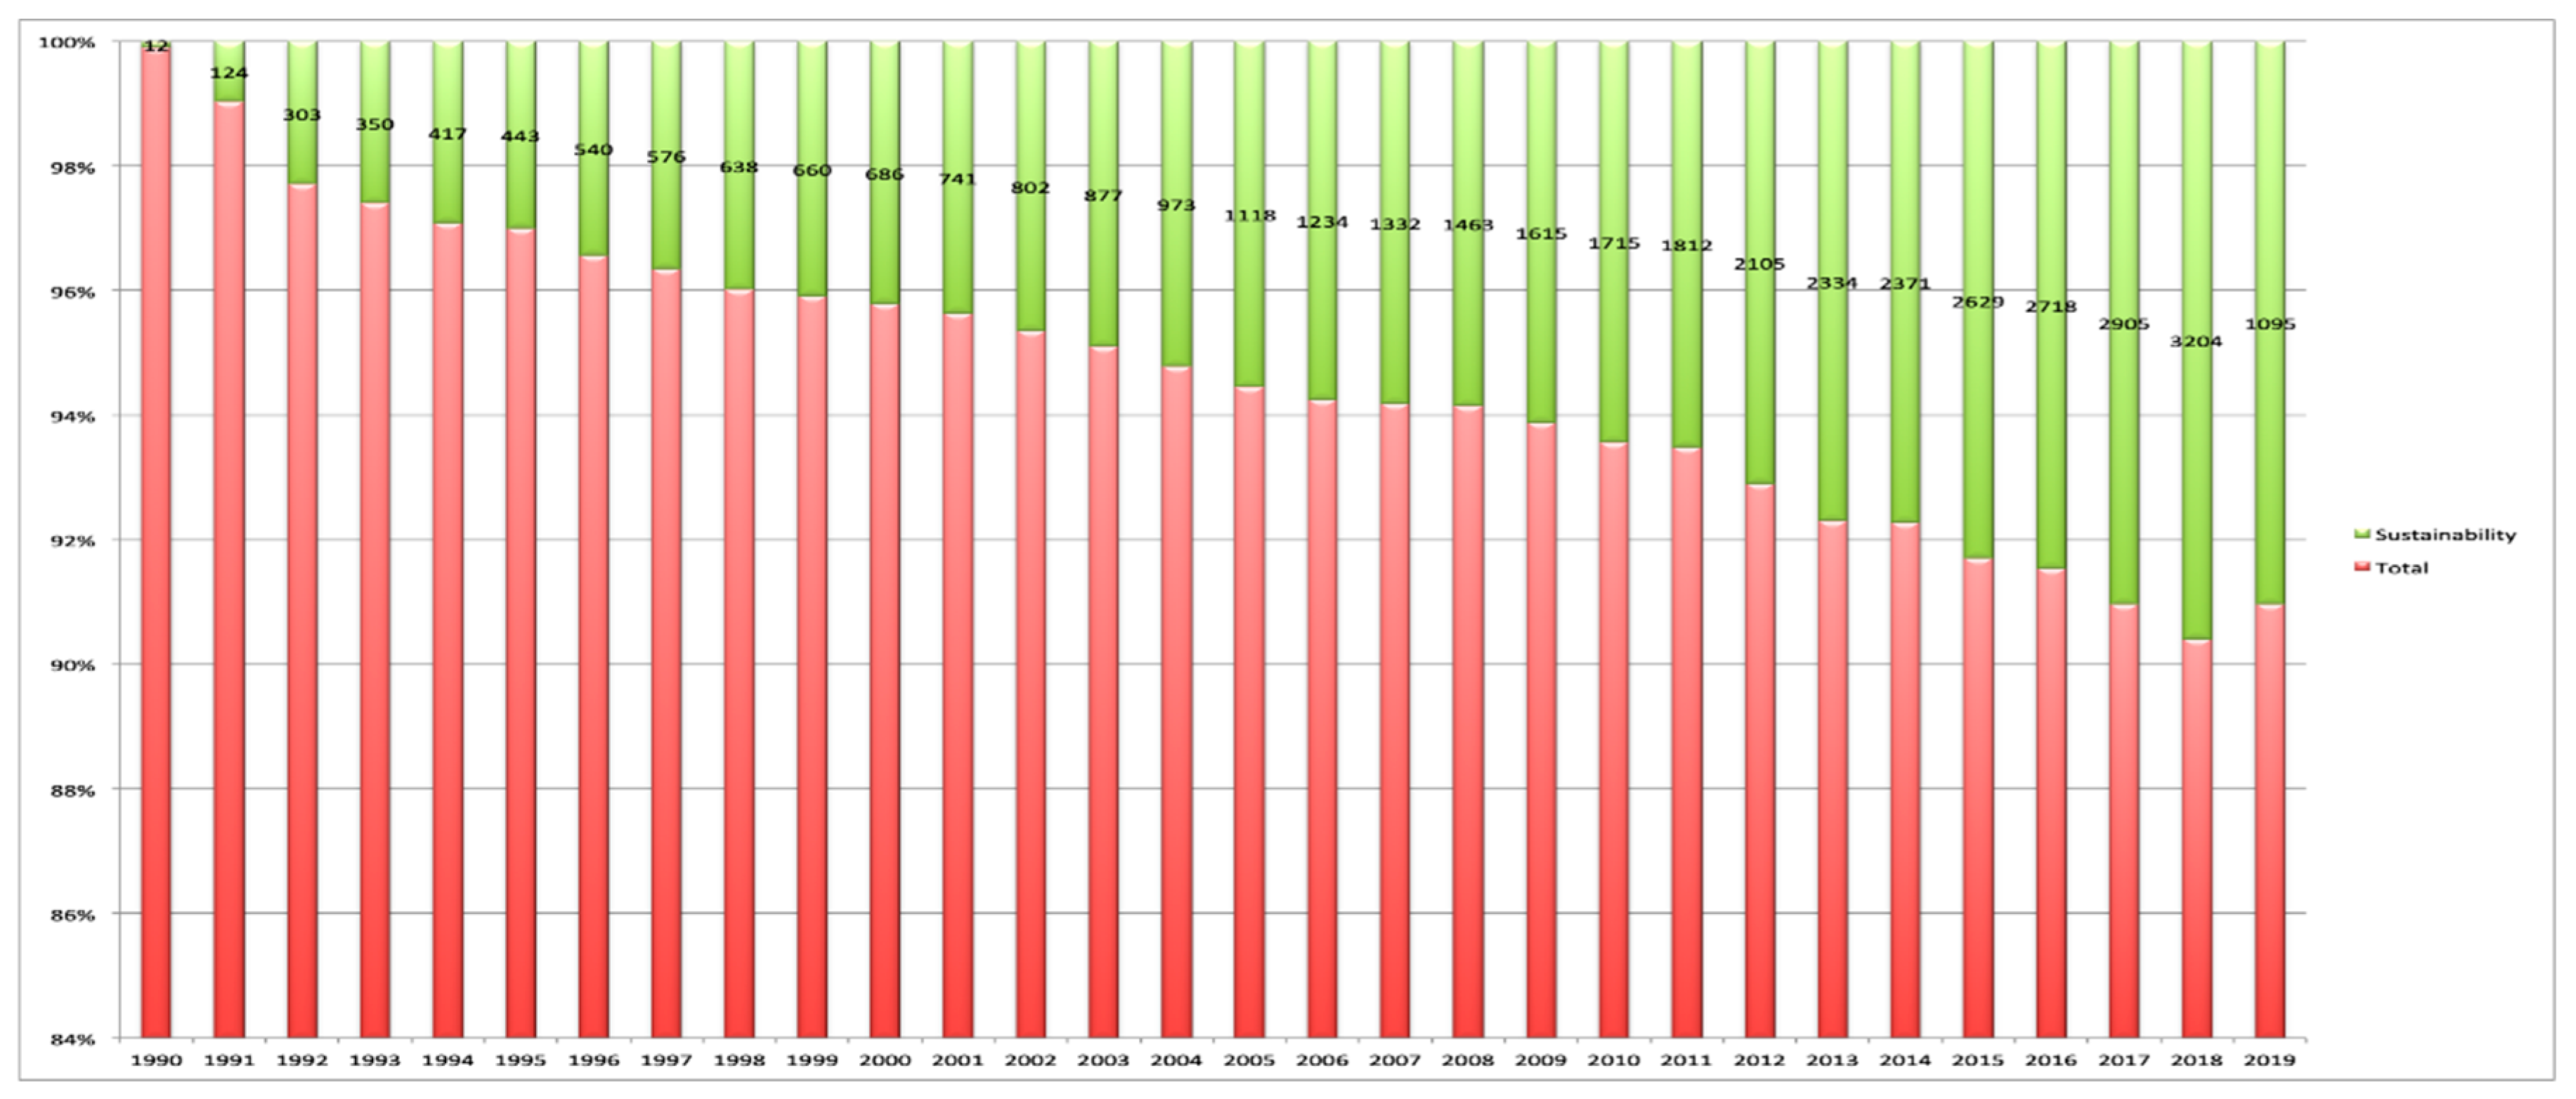
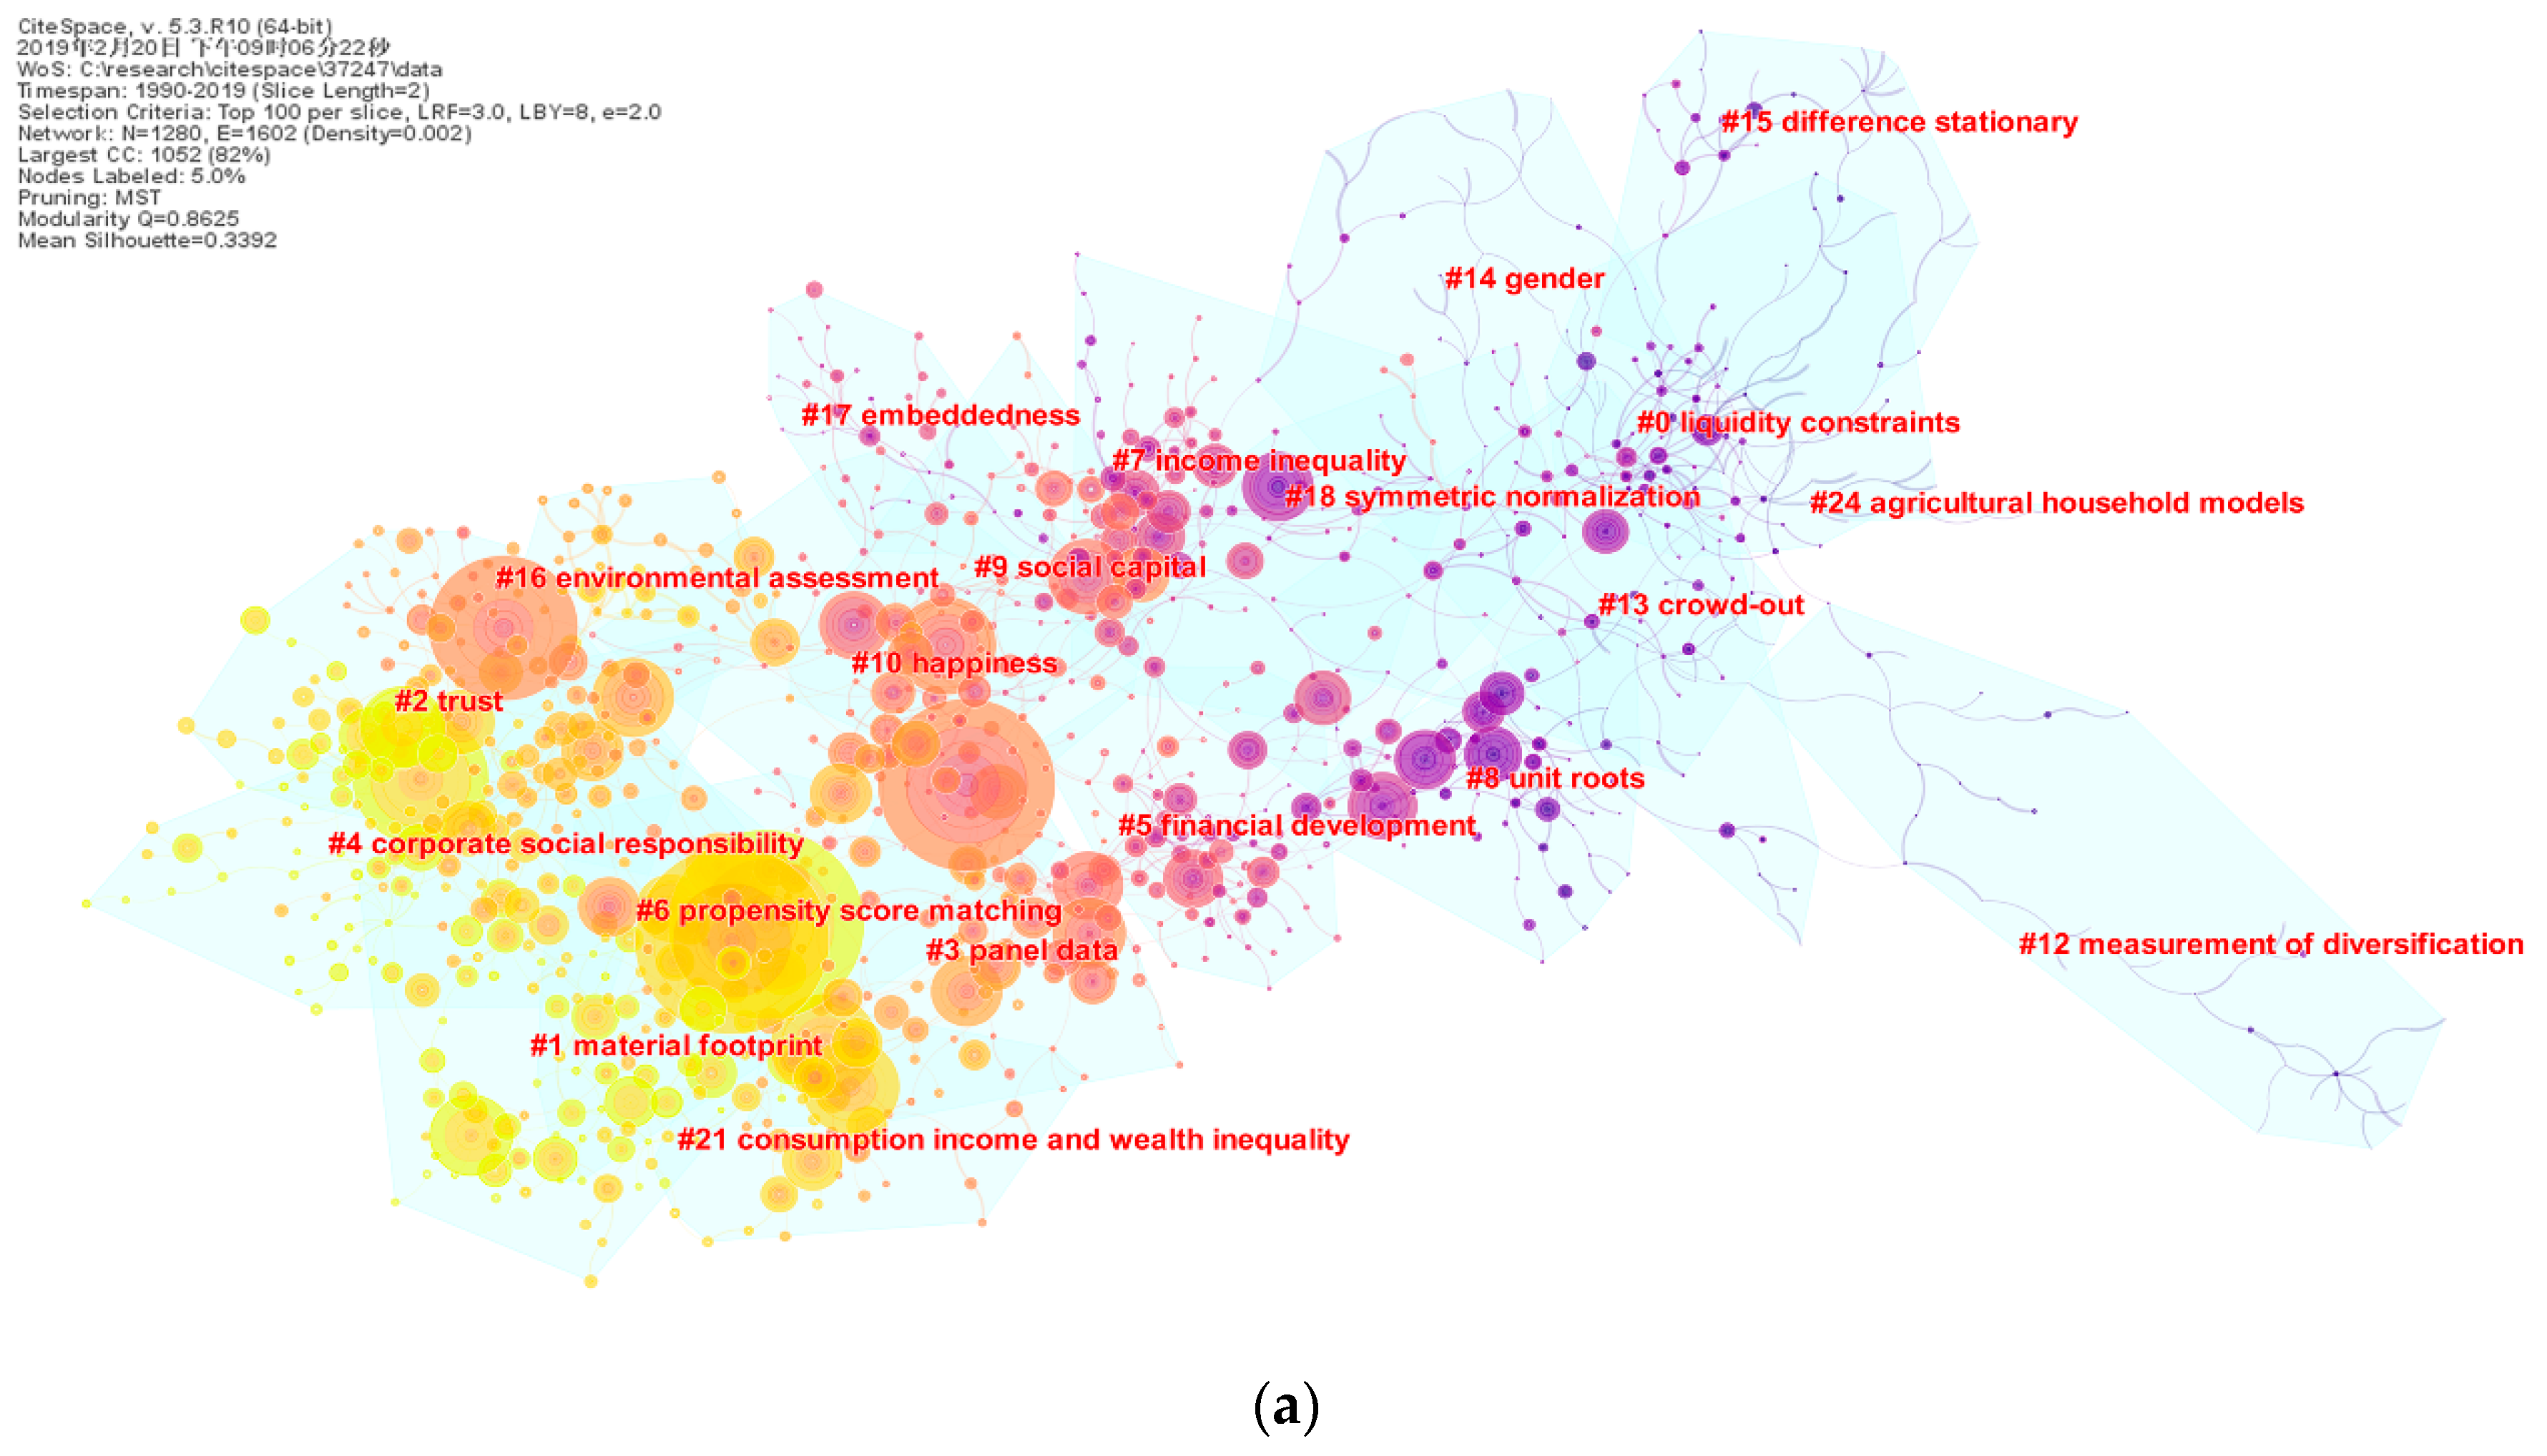
4.1. A Landscape of Thirty Years of Sustainability Research Topics
4.2. The Decade-By-Decade Analysis
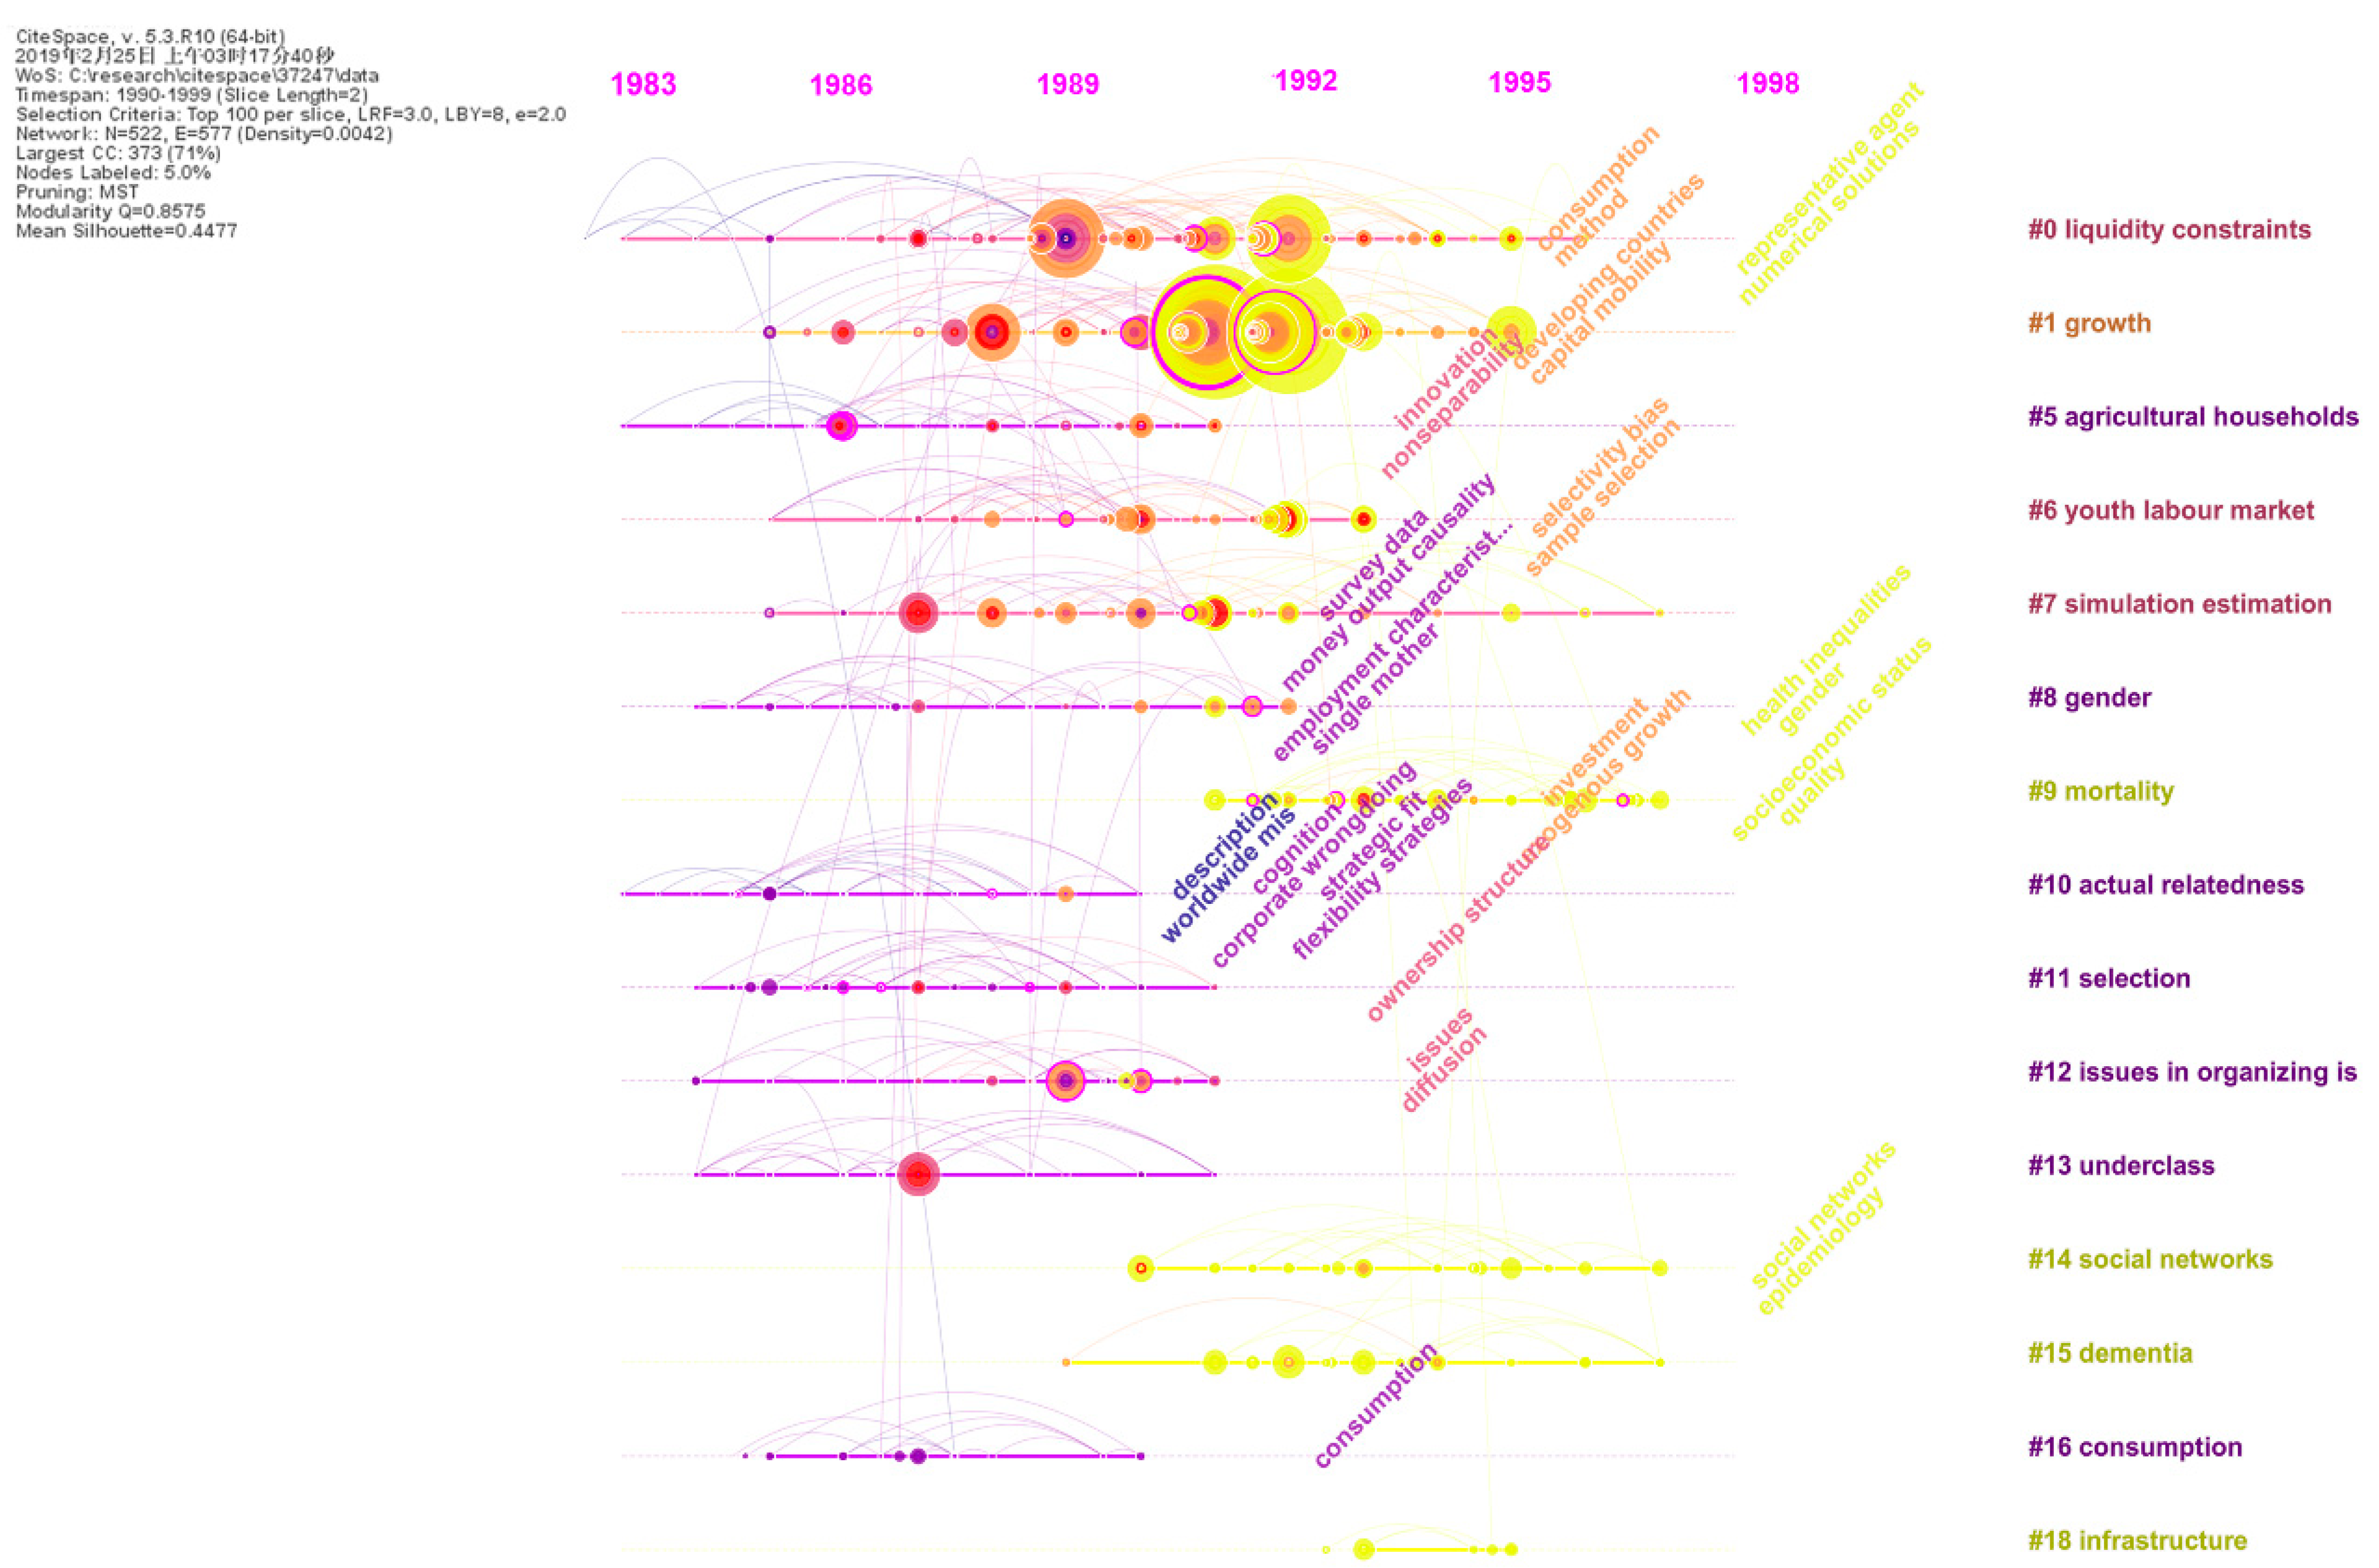
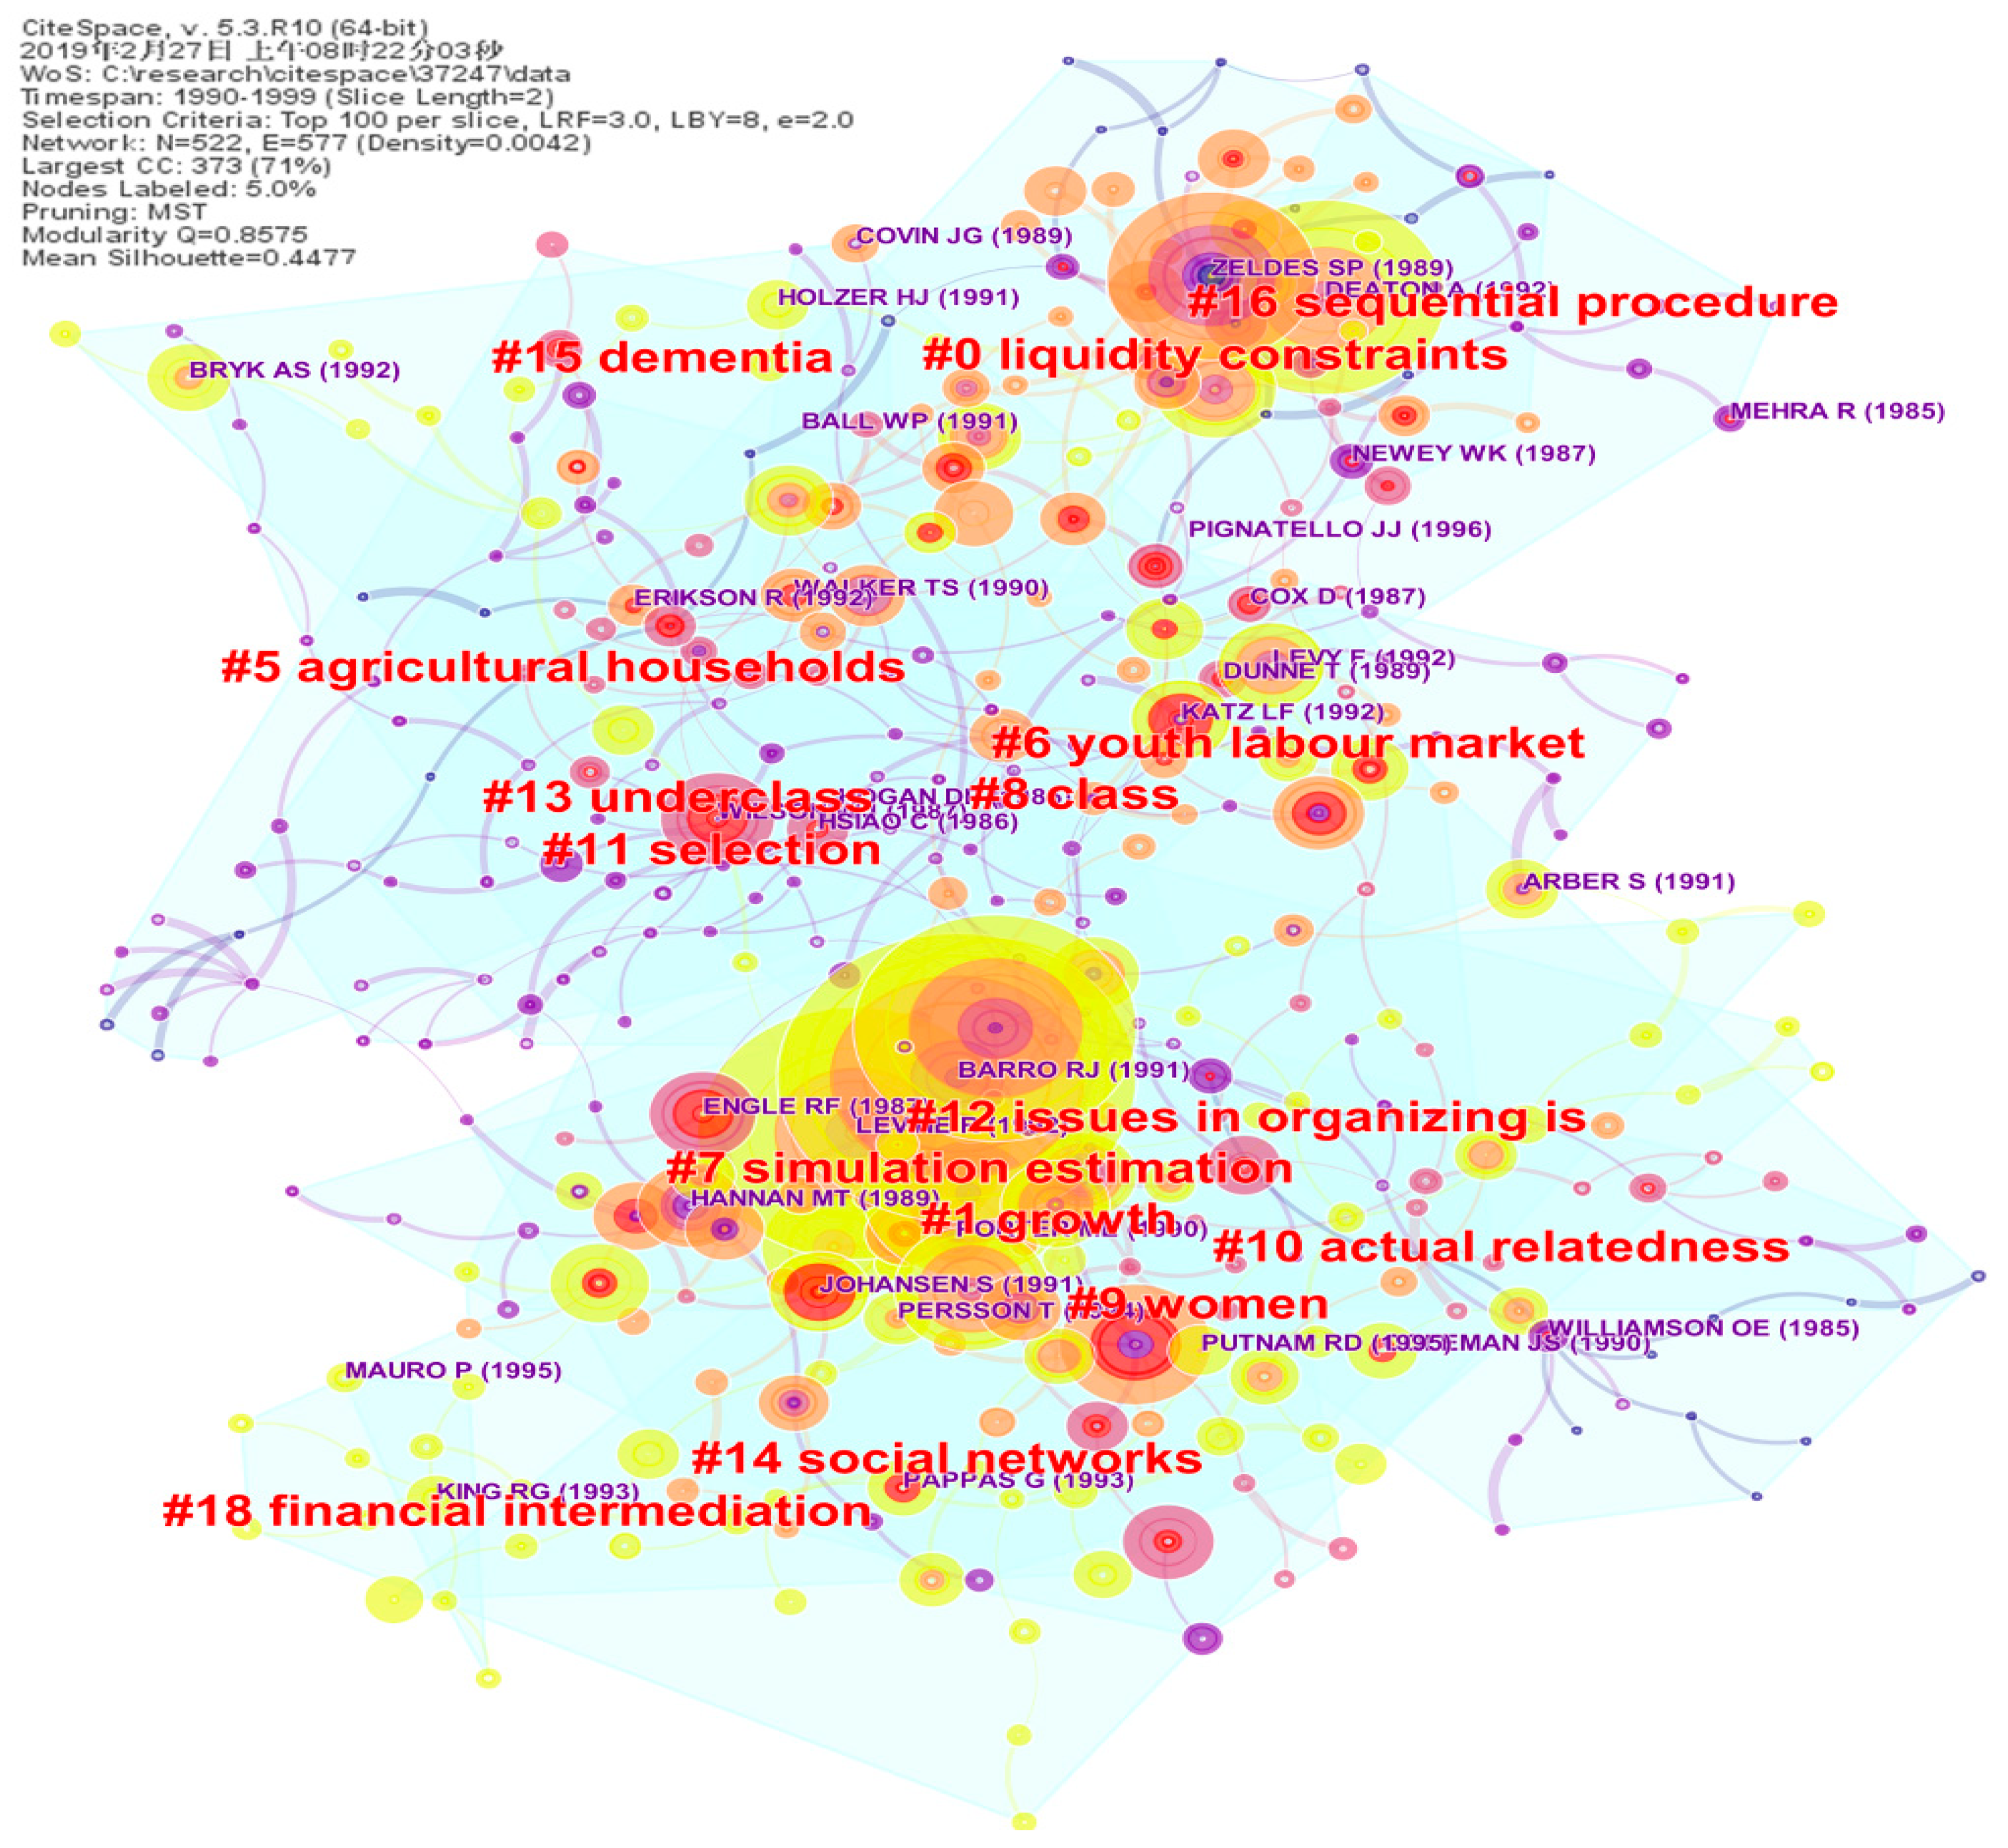
4.2.1. Period I (1990–1999)
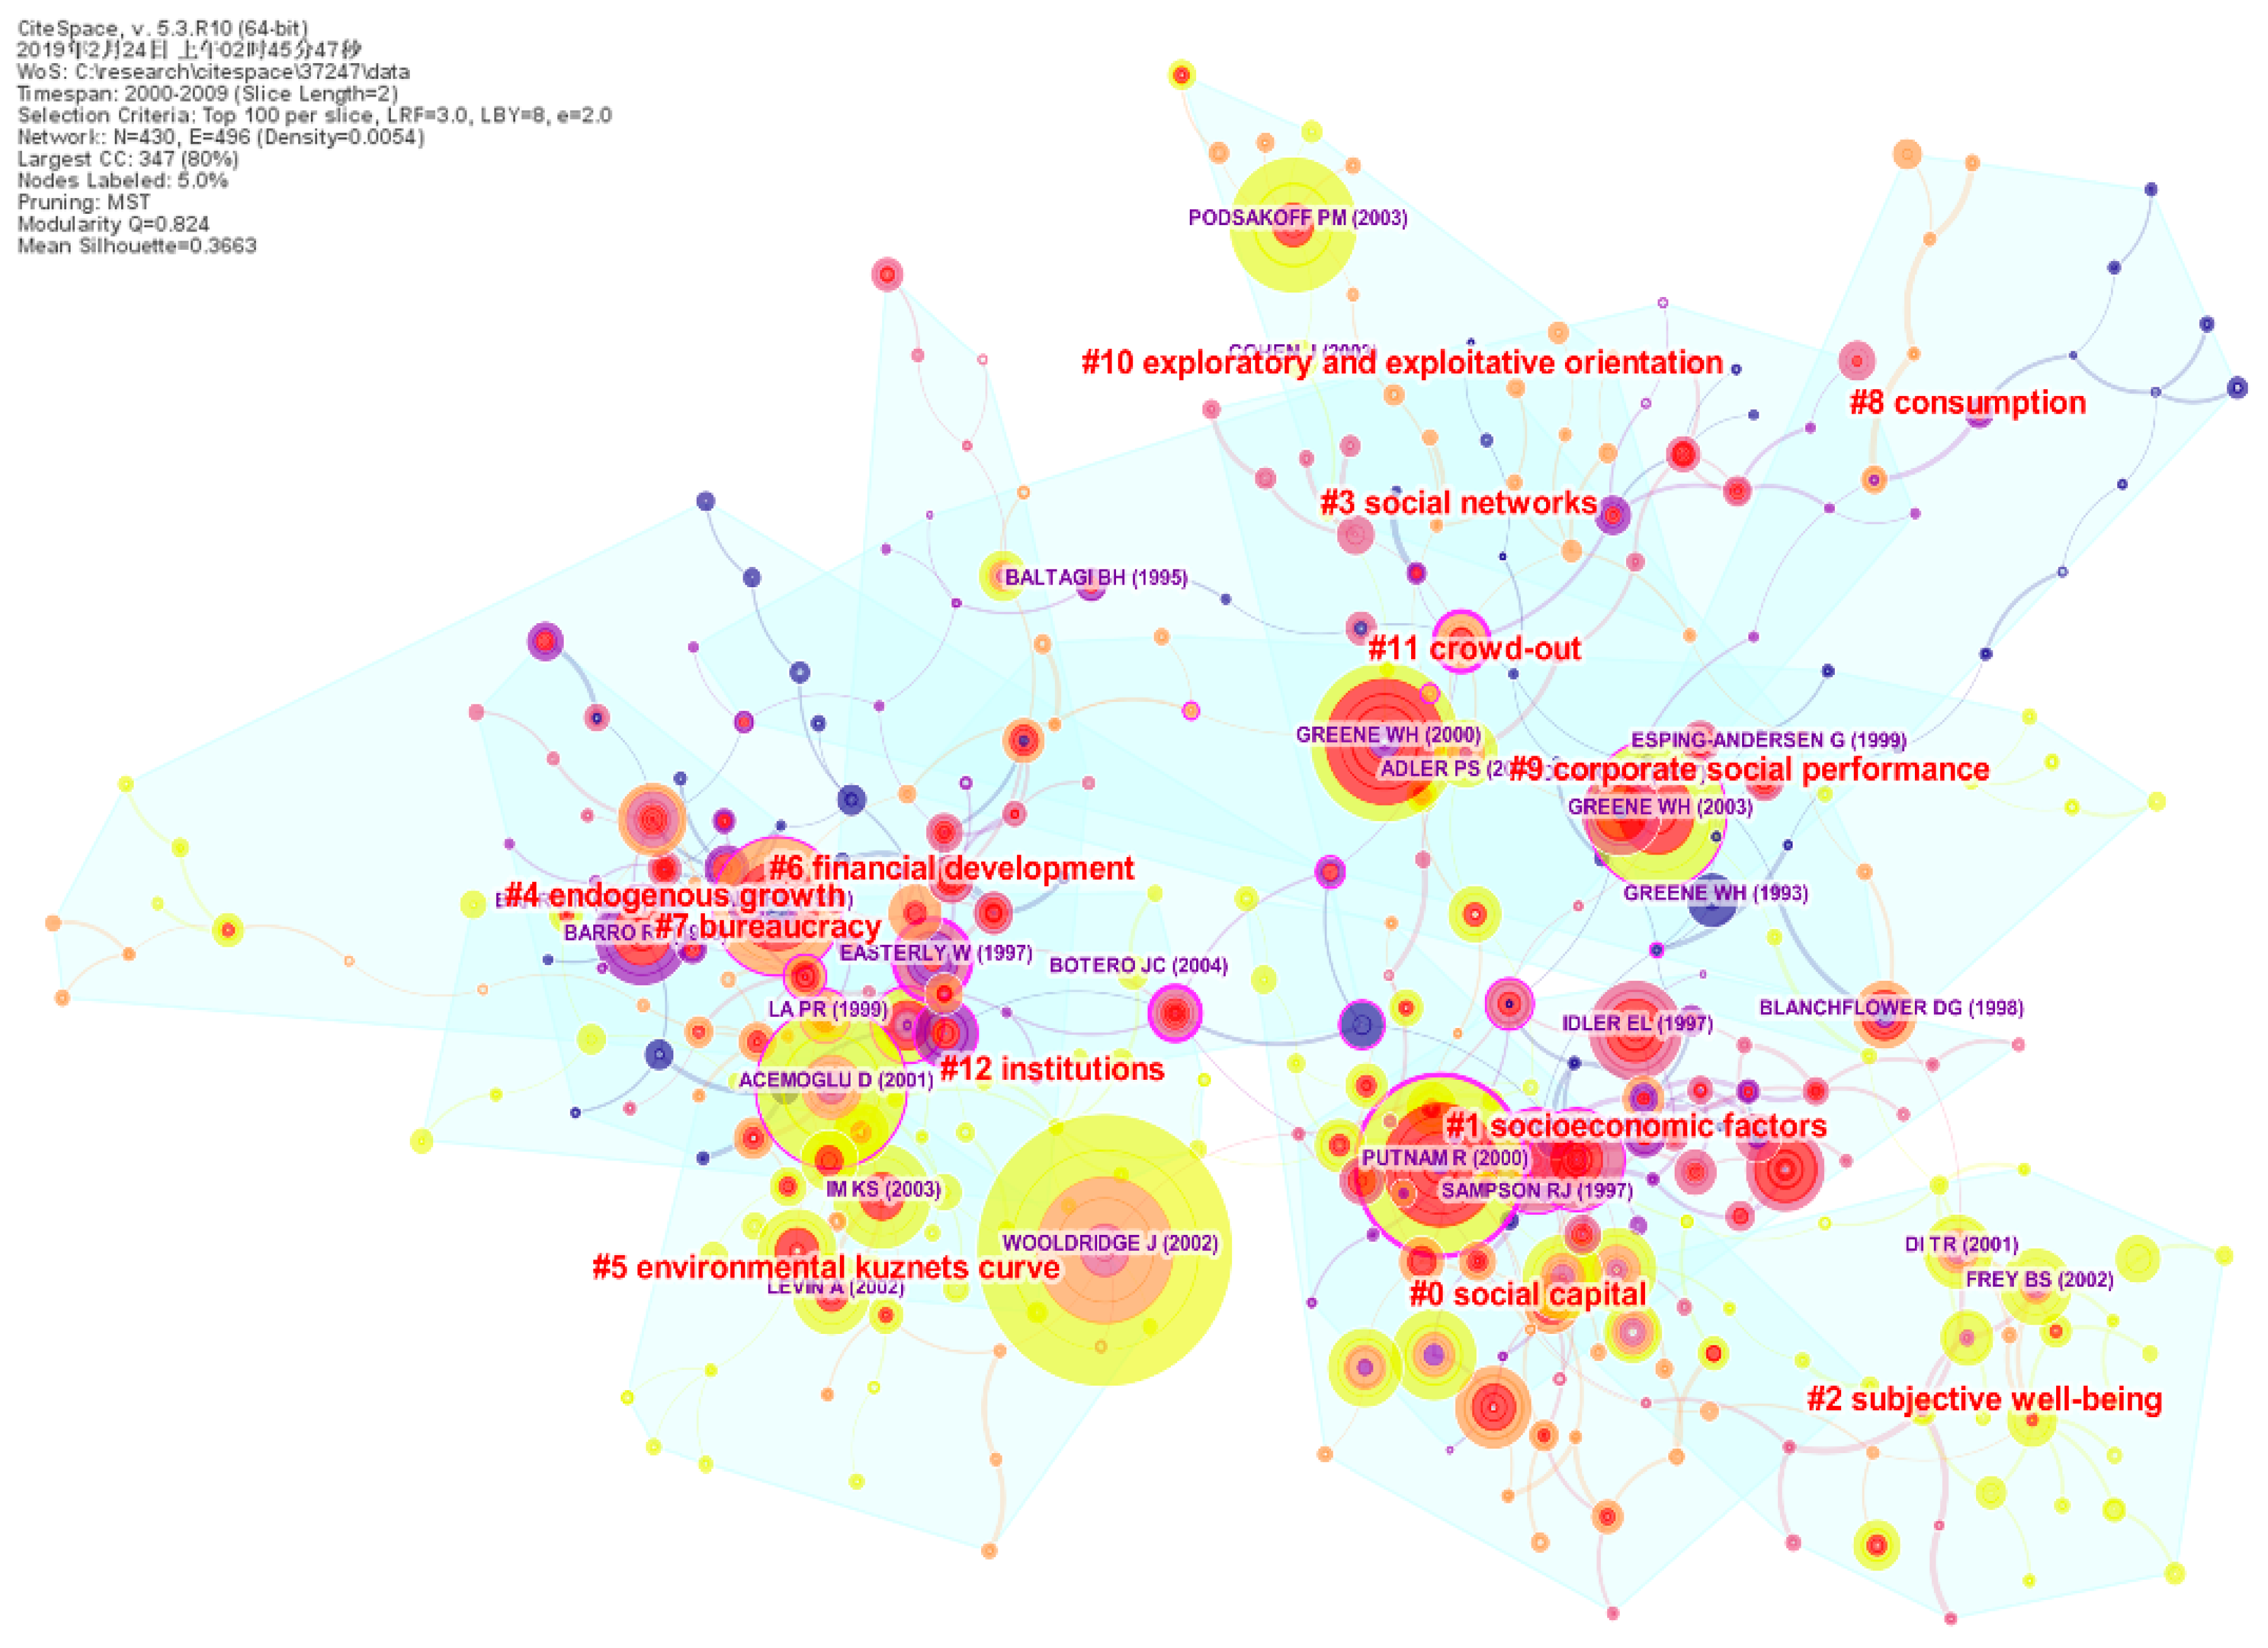
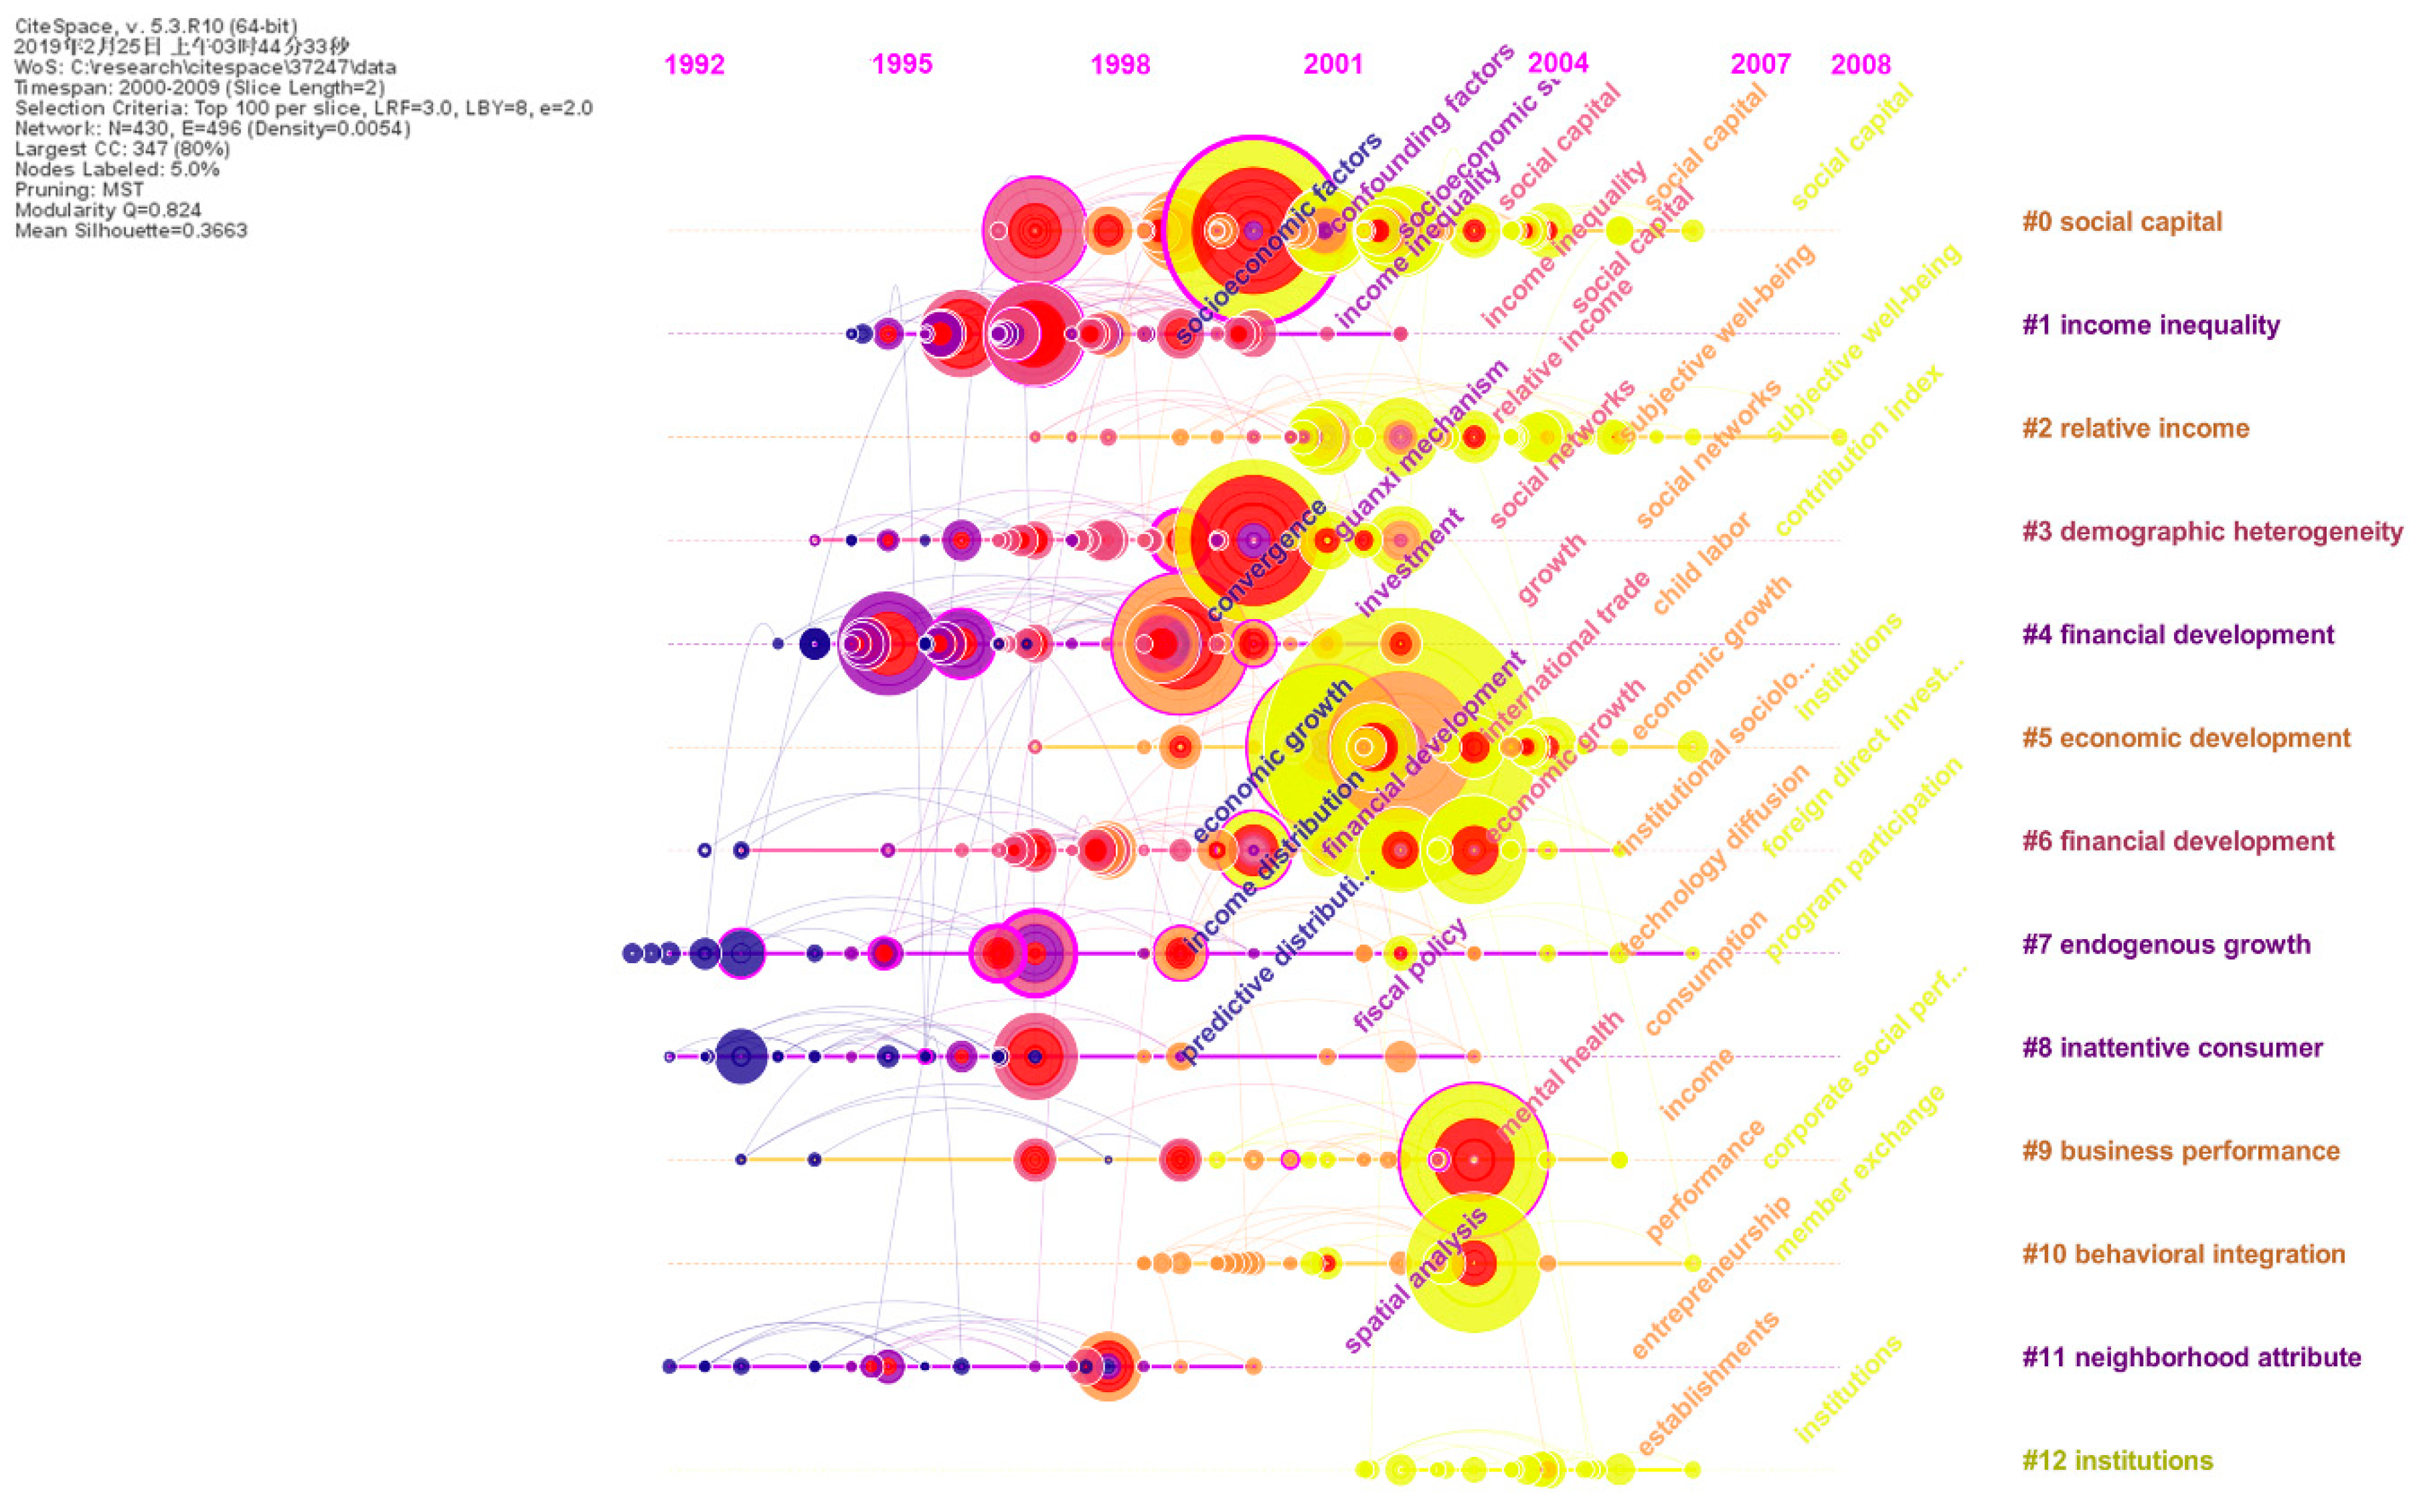
4.2.2. Period II (2000–2009)
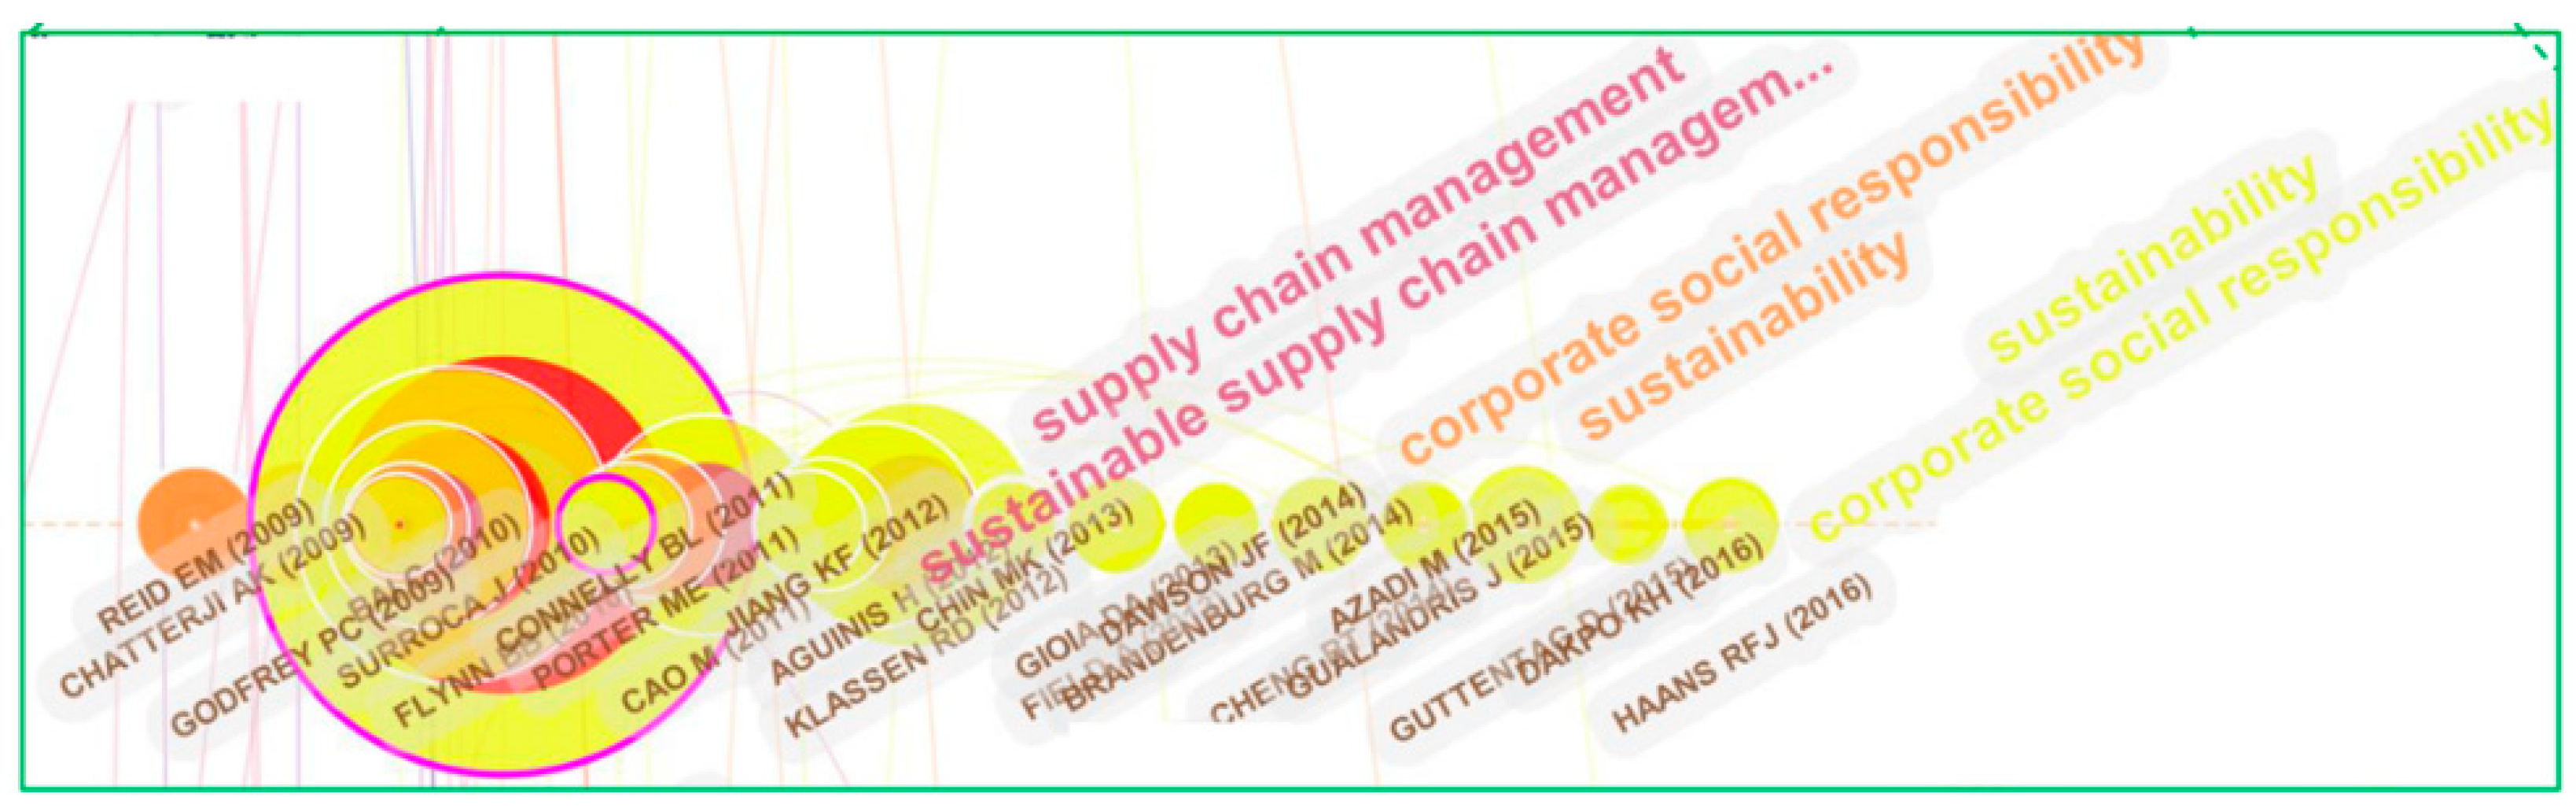
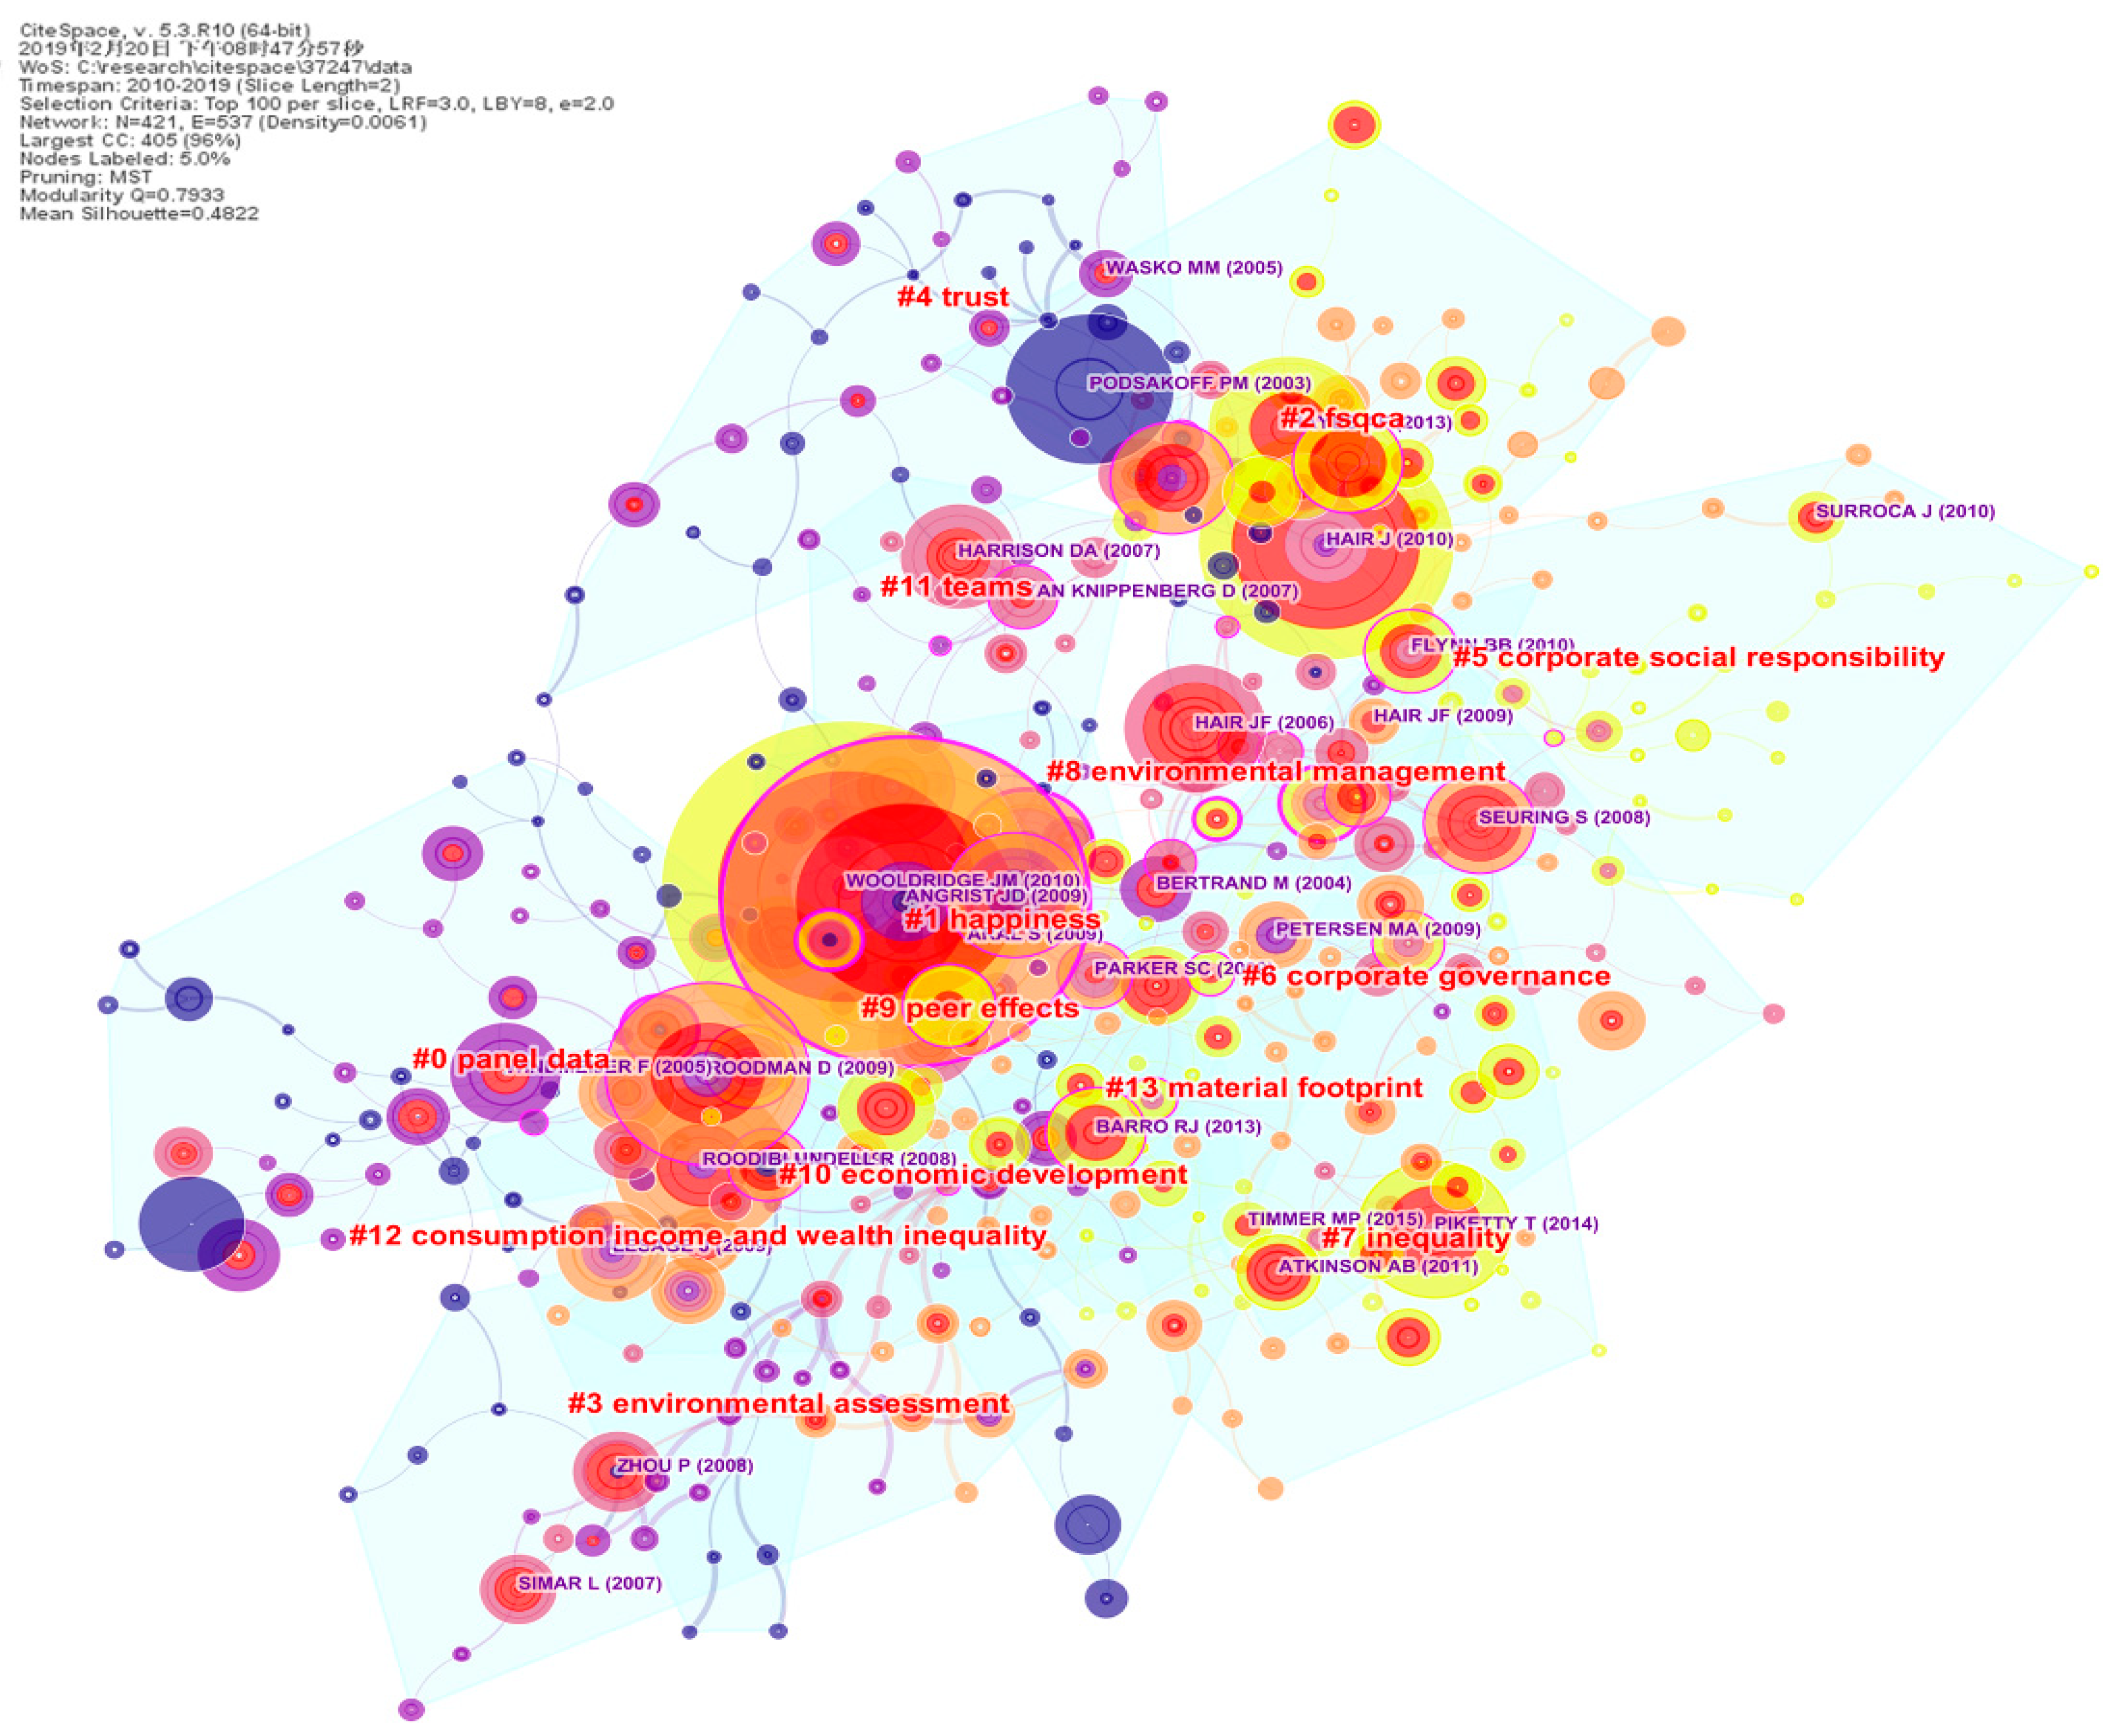
4.2.3. Period III (2010–2019)
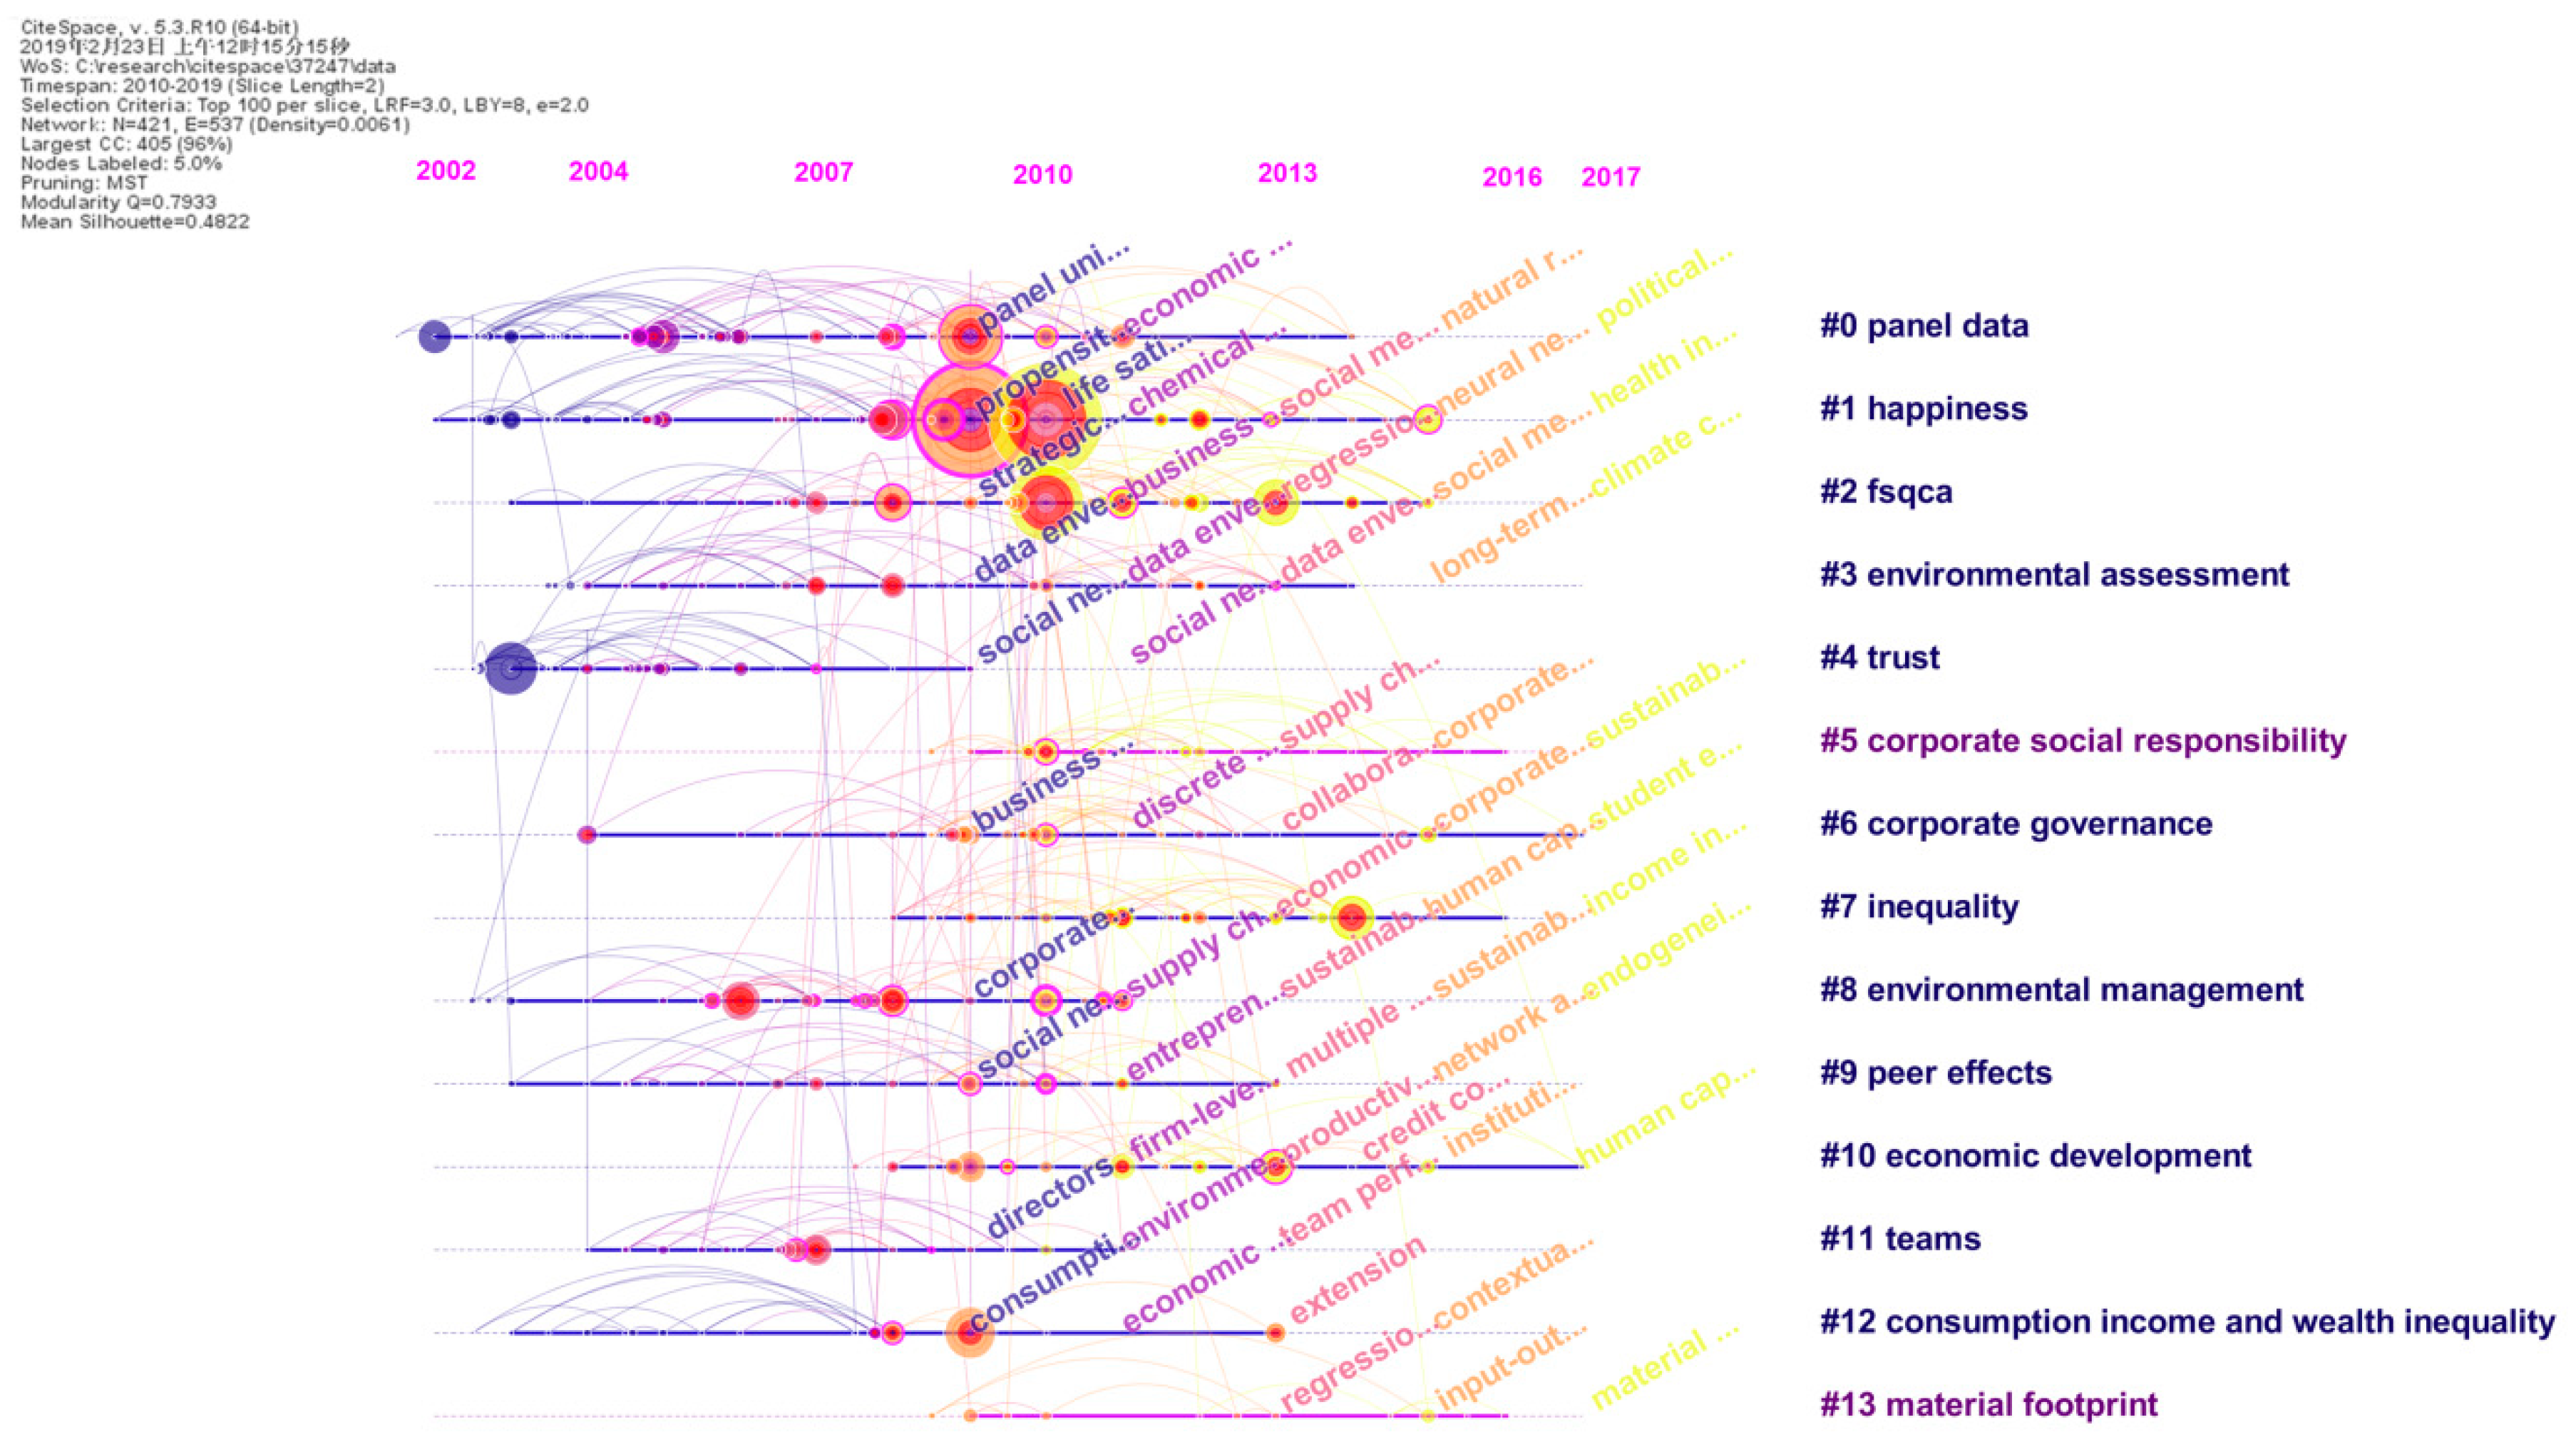
4.3. Timeline
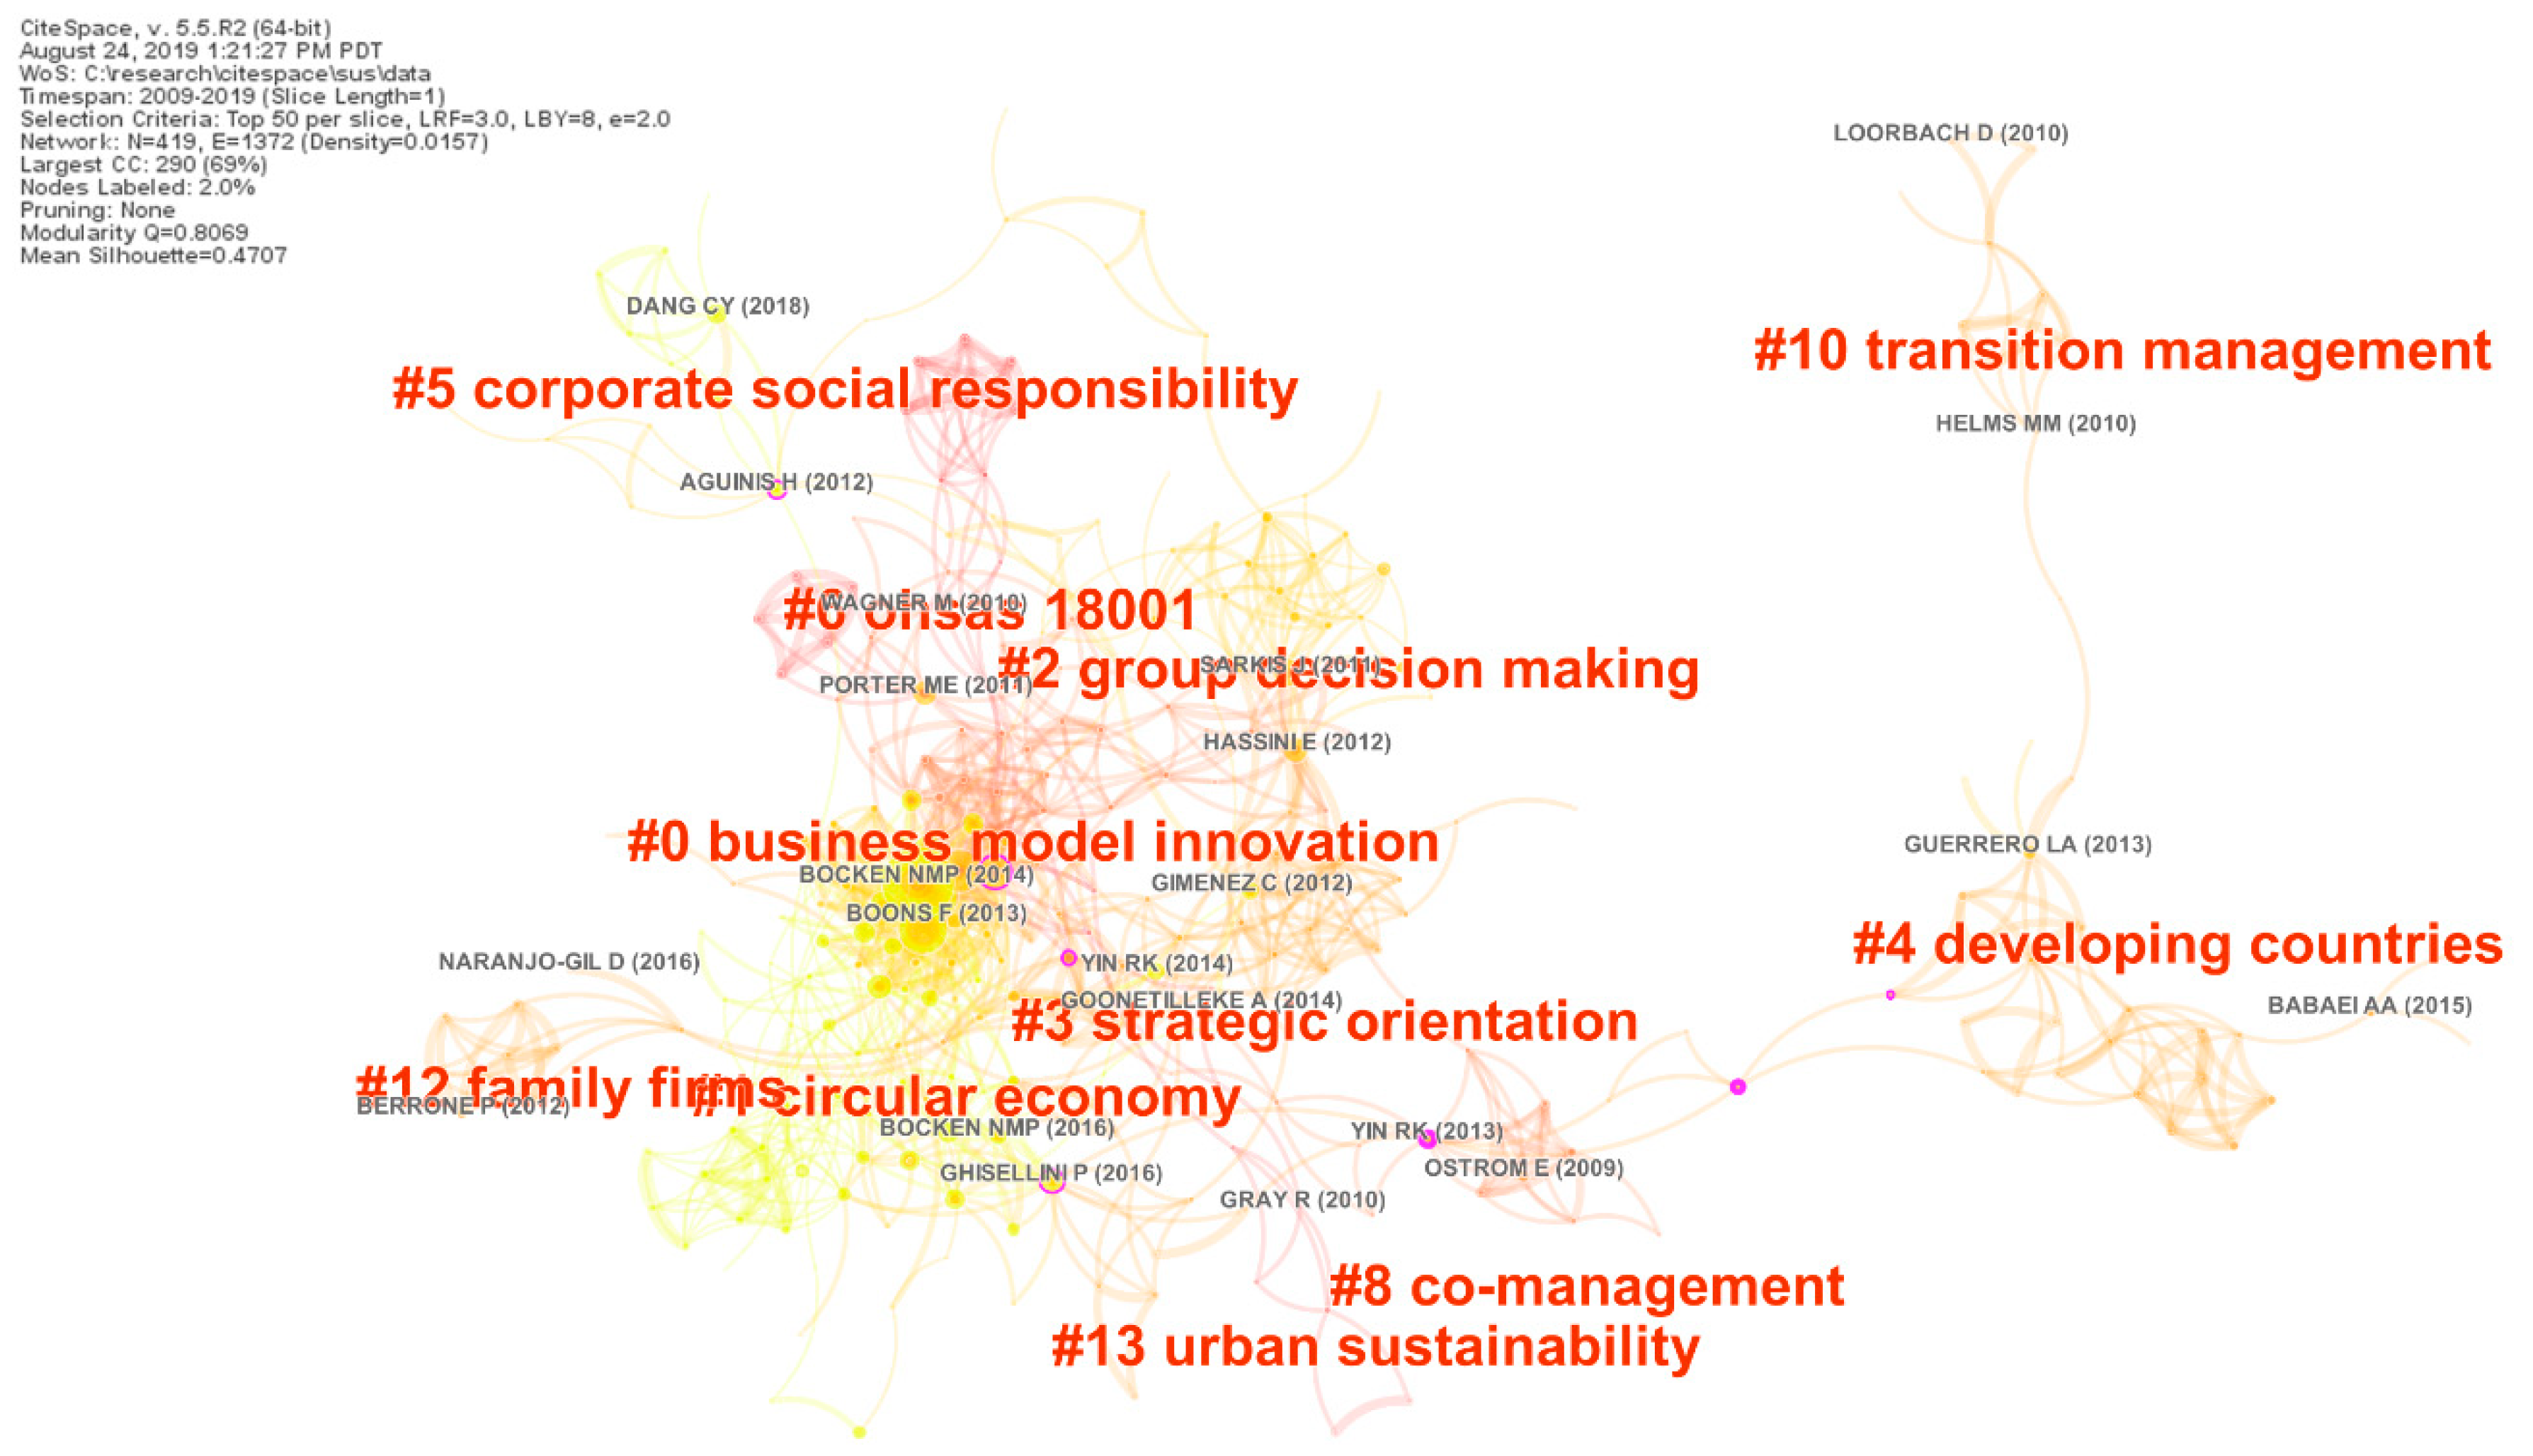
4.4. Business Research in the Journal of Sustainability
5. Research Gaps and Insights
5.1. Good Health and Well-Being
5.2. Decent Work and Economic Growth
5.3. Industry, Innovation, and Infrastructure
5.4. Reduced Inequalities (Goal 10) and Gender Inequalities (Goal 5)
5.5. Peace, Justice, and Strong Institutions
5.6. Natural-Environmental Goals
6. Conclusions
Author Contributions
Funding
Acknowledgments
Conflicts of Interest
Appendix A

| Discipline | 4 * | 4 | 3 | Discipline Total | Discipline | 4 * | 4 | 3 | Discipline Total |
|---|---|---|---|---|---|---|---|---|---|
| Accounting | 4 | 2 | 21 | 27 | Business and economic history | 0 | 2 | 5 | 7 |
| Economics, econometrics, and statistics | 6 | 17 | 67 | 90 | Entrepreneurship and small business management | 0 | 3 | 5 | 8 |
| Finance | 3 | 5 | 29 | 37 | General management, ethics, gender, and social responsibility | 4 | 4 | 12 | 20 |
| Human resources management and employment studies | 0 | 5 | 9 | 14 | Information management | 2 | 2 | 17 | 21 |
| Innovation | 1 | 1 | 2 | 4 | International business and area studies | 1 | 1 | 7 | 9 |
| Management development and education | 0 | 1 | 3 | 4 | Marketing | 6 | 2 | 12 | 20 |
| Operations and technology management | 1 | 2 | 9 | 12 | Operations research and management science | 2 | 3 | 22 | 27 |
| Organizational studies | 1 | 4 | 4 | 9 | Psychology (General) | 1 | 8 | 12 | 21 |
| Psychology (Organizational) | 1 | 6 | 13 | 20 | Public sector and health care | 1 | 2 | 11 | 14 |
| Regional studies, planning, and environment | 0 | 2 | 12 | 14 | Sector studies | 0 | 5 | 10 | 15 |
| Social sciences | 3 | 6 | 27 | 36 | Strategy | 1 | 0 | 3 | 4 |
| Cluster ID | Size | Silhouette | Mean (Year) | Label (LSI) | Label (LLR) |
|---|---|---|---|---|---|
| 0 | 88 | 0.943 | 1988 | consumption; permanent income; time aggregation | liquidity constraints (50.57, 10-4); consumption (40.69, 10-4); dynamic programming (40.35, 10-4) |
| 1 | 82 | 0.835 | 2010 | social networks; network analysis; malware propagation trajectory | material footprint (50.97, 10-4); input-output analysis (40.76, 10-4); social networks (37.23, 10-4) |
| 2 | 81 | 0.99 | 2007 | social networks; information exchange; post-implementation | trust (89.09, 10-4); fsqca (77.15, 10-4); big data (64.51, 10-4) |
| 3 | 78 | 0.943 | 2004 | economic growth; political instability; general practitioner | panel data (72.09, 10-4); institutions (49.7, 10-4); corruption (48.25, 10-4) |
| 4 | 77 | 0.917 | 2009 | corporate social responsibility; diffusion; developing country | corporate social responsibility (214.33, 10-4); sustainability (202.14, 10-4); supply chain management (149.6, 10-4) |
| 5 | 67 | 0.95 | 1997 | economic growth; economic development; foreign aid | financial development (119.93, 10-4); economic growth (87.29, 10-4); growth (60.82, 10-4) |
| 6 | 54 | 0.901 | 2007 | propensity score; impact assessment; agricultural biotechnology | propensity score matching (108.93, 10-4); health insurance (58.83, 10-4); impact assessment (56.82, 10-4) |
| 7 | 54 | 0.943 | 1997 | income inequality; inequality indices; relative poverty | income inequality (133.46, 10-4); socioeconomic factors (96.32, 10-4); mortality (48.01, 10-4) |
| 8 | 54 | 0.995 | 1991 | endogenous growth; applied general equilibrium; strategic trade policy | unit roots (80.87, 10-4); Monte Carlo simulation (66.11, 10-4); endogenous growth (44.53, 10-4) |
| 9 | 53 | 0.944 | 2001 | social capital; preferences; effects | social capital (194.36, 10-4); self-rated health (91.38, 10-4); USA (88.39, 10-4) |
| 10 | 52 | 0.898 | 2002 | subjective well-being; aspiration level; interdependent preferences | happiness (210.37, 10-4); subjective well-being (171.44, 10-4); life satisfaction (56.47, 10-4) |
| 12 | 46 | 1 | 1986 | home; supplemental work; work; organizational design; alternative work arrangements | measurement of diversification (48.03, 10-4); actual relatedness (48.03, 10-4); corporate strategy (28.75, 10-4) |
| 13 | 43 | 0.909 | 1990 | unmeasured heterogeneity; competing risks; time-varying coefficients | crowd-out (37.57, 10-4); youth labor market (37.57, 10-4); returns to education (37.57, 10-4) |
| 14 | 43 | 0.948 | 1988 | employment characteristics; women’s health; quality; role | gender (46.99, 10-4); social roles (40.13, 10-4); paid employment (32.67, 10-4) |
| 15 | 38 | 0.975 | 1988 | scale; self-selection; agency theory; diseconomies | difference stationary (23.14, 10-4); trend stationary (23.14, 10-4); trend (23.14, 10-4) |
| 16 | 37 | 0.999 | 2009 | data envelopment analysis; production uncertainty; Russell-type measure | environmental assessment (600.81, 10-4); data envelopment analysis (362.85, 10-4); dea (323.56, 10-4) |
| 17 | 35 | 0.994 | 1995 | social networks; models; autologistic models; pseudo-likelihood estimation; social capital | embeddedness (55.28, 10-4); strategic alliances (39.09, 10-4); work team effectiveness (38.05, 10-4) |
| 18 | 35 | 0.95 | 1994 | symmetric normalization; employment equations; method; dynamic panel data; Monte Carlo methods | symmetric normalization (18.49, 10-4); intertemporal labor force participation (18.49, 10-4); generalized method of moments (18.49, 10-4) |
| 21 | 28 | 0.951 | 2006 | productivity; real appreciation; competitive pressure | consumption income and wealth inequality (39.1, 10-4); wage dynamics (39.1, 10-4); inequality over the life cycle (39.1, 10-4) |
| Goals | Implication | Period I | Period II | Period III | |
|---|---|---|---|---|---|
| 1 | No poverty | End poverty in all its forms everywhere | Relative poverty | ||
| 2 | Zero hunger | End hunger, achieve food security and improved nutrition, and promote sustainable agriculture | food security (0); | ||
| 3 | Good health and well-being | Ensure healthy lives and promote well-being for all at all ages | Women’s health (8); avoidable mortality (9) | health insurance (0); alcohol dependence (1); health status (1); subjective well-being (2); happiness (2); quality of life (2) spatial amenities (2); self-rated health (3); Medicaid (11) | happiness (1); health insurance (1) |
| 4 | Quality education | Ensure inclusive and equitable quality education and promote lifelong learning opportunities for all | returns to education (6) | Institutions (12); | institutions (9,10); human capital (7,10); skills (9); |
| 5 | Gender equality | Achieve gender equality and empower all women and girls | Women’s health (8); social roles (8); women (9) | gender (6); | |
| 6 | Clean water and sanitation | Ensure available and sustainable management of water and sanitation for all | environmental amenities (11); | environmental assessment (3,11); environmental management (8); material footprint (13) | |
| 7 | Affordable and clean energy | Ensure access to affordable, reliable, sustainable, and modern energy for all | natural resources (10) petroleum industry (11) | ||
| 8 | Decent work and economic growth | Promote sustained, inclusive and sustainable economic growth, full and productive employment, and decent work for all | permanent income (0); economic growth (1); job mobility (5); scale (5); youth labor market (6); intertemporal labor force participation (7); employment characteristics (8) work arrangements (11) unemployment (13) | socioeconomic factors (1); income inequality (1); endogenous growth (4); multiple equilibria (4); ces (4); economic growth (5,6); economic development; foreign aid (5); environmental Kuznets curve (5); international trade (6); currency crises (6); financial development (6,7); banks (6); active labor market policy (7); crowd-out (11) | economic growth (0,10, 12); tax avoidance; tax planning (6); political economy (7,10); peer effects (9); contagion (9); homophily (9); |
| 9 | Industry, innovation and infrastructure | Build resilient infrastructure, promote inclusive and sustainable industrialization, and foster innovation | innovation (5); information system problems (10); information system view (10); issues in organizing is (12); is centralization decentralization (12); structure of the is function (12) | corporate social performance (9); business performance (9); demographic transition (9); differentiation (9); entrepreneurship; performance; firm growth (11) | general practitioner (0); strategic flexibility (2); post implementation (4; corporate social responsibility; diffusion; innovations (5); stakeholders (5); sustainability (5); corporate governance (6); malware defense (9) |
| 10 | Reduced inequalities | Reduce inequality within and among countries | social class (9); underclass (13) | social capital (0,1,3); democratization (5); democracy (5); legal system (7) | board diversity (6); inequality (7); wage dynamics (12); inequality over the life cycle (12); |
| 11 | Sustainable cities and communities | Make cities and human settlements inclusive, safe, resilient, and sustainable | home (11) | social networks (3); alliances (3); networks (3); bureaucracy (7); | social media (2); social networks (2,4,9); information exchange; trust (4); reciprocity (4); self-disclosure (4) heterogeneous agents (9); team (11); pre-colonial societies; (12) |
| 12 | Responsible consumption and production | Ensure sustainable consumption and production patterns | consumption (0); | consumption (8); incomplete markets (8); buffer stock (8); excess sensitivity (8); hand-to-mouth consumers (8) | production uncertainty (3); systems dynamics (3); supply chain management; corporate social responsibility, sustainability (8); consumption income and wealth inequality (12) |
| 13 | Climate action | Take urgent action to combat climate change and its impacts | natural disasters; | ||
| 14 | Life below water | Conserve and sustainably use the oceans, seas, and marine resources for sustainable development | |||
| 15 | Life on land | Protect, restore, and promote sustainable use of terrestrial ecosystems, sustainably manage forests, combat desertification, halt and reverse land degradation, and halt biodiversity | agricultural biotechnology (1) | ||
| 16 | Peace, Justice and strong institutions | Promote peaceful and inclusive societies for sustainable development; provide access to justice for all; and build effective, accountable, and inclusive institutions at all levels. | social security (0); | information privacy threats; responses; ethical issues (10); political instability; capital accumulation(12); corruption (12); | job security (12); political instability (0); long-term political development (12); |
| 17 | Partnerships for the goals | Strengthen the means of implementation and revitalize the global partnership for sustainable development |
References
- Ma, J. Jack Ma on Taking Back China’s Blue Skies. Harvard Business Review. 2013. Available online: https://hbr.org/2013/11/jack-ma-on-taking-back-chinas-blue-skies (accessed on 09 August 2019).
- Zhu, J.; Hua, W. Visualizing the knowledge domain of sustainable development research between 1987 and 2015: A bibliometric analysis. Scientometrics 2017, 110, 893–914. [Google Scholar] [CrossRef]
- Cullen, J.G. Educating business students about sustainability: A bibliometric review of current trends and research needs. J. Bus. Ethics 2017, 145, 429–439. [Google Scholar] [CrossRef]
- Martínez-Jurado, P.J.; Moyano-Fuentes, J. Lean management, supply chain management and sustainability: a literature review. J. Clean. Prod. 2014, 85, 134–150. [Google Scholar]
- Klewitz, J.; Hansen, E.G. Sustainability-oriented innovation of SMEs: a systematic review. J. Clean. Prod. 2014, 65, 57–75. [Google Scholar] [CrossRef]
- Goes, P.B. Big data and is research. MIS Q. 2014, 38, iii–viii. [Google Scholar]
- Sustainable develop goals. Available online: https://sustainabledevelopment.un.org/?menu=1300 (accessed on 01 August 2018).
- Brundiers, K.; Wiek, A. Do we teach what we preach? An international comparison of problem-and project-based learning courses in sustainability. Sustainability 2013, 5, 1725–1746. [Google Scholar] [CrossRef]
- Painter-Morland, M.; Sabet, E.; Molthan-Hill, P.; Goworek, H.; de Leeuw, S. Beyond the curriculum: Integrating sustainability into business schools. J. Bus. Ethics 2016, 139, 737–754. [Google Scholar] [CrossRef]
- Pisani, N.; Kourula, A.; Kolk, A.; Meijer, R. How global is international csr research? Insights and recommendations from a systematic review. J. World Bus. 2017, 52, 591–614. [Google Scholar] [CrossRef]
- Schubert, C. Green nudges: Do they work? Are they ethical? Ecol. Econ. 2017, 132, 329–342. [Google Scholar] [CrossRef] [Green Version]
- Katsikeas, C.S.; Leonidou, C.N.; Zeriti, A. Eco-friendly product development strategy: Antecedents, outcomes, and contingent effects. J. Acad. Market. Sci. 2016, 44, 660–684. [Google Scholar] [CrossRef]
- García-de-Frutos, N.; Ortega-Egea, J.M.; Martínez-del-Río, J. Anti-consumption for environmental sustainability: Conceptualization, review, and multilevel research directions. J. Bus. Ethics 2016, 148, 411–435. [Google Scholar] [CrossRef]
- Fahimnia, B.; Sarkis, J.; Davarzani, H. Green supply chain management: A review and bibliometric analysis. Int. J. Prod. Econ. 2015, 162, 101–114. [Google Scholar] [CrossRef]
- Strozzi, F.; Colicchia, C.; Creazza, A.; Noè, C. Literature review on the ‘smart factory’ concept using bibliometric tools. Int. J. Prod. Res. 2017, 55, 6572–6591. [Google Scholar] [CrossRef]
- Chen, L.; Zhao, X.; Tang, O.; Price, L.; Zhang, S.; Zhu, W. Supply chain collaboration for sustainability: A literature review and future research agenda. Int. J. Prod. Econ. 2017, 194, 73–87. [Google Scholar] [CrossRef]
- Jabbour, A.B.L.D.S.; Jabbour, C.J.C.; Filho, M.G.; Roubaud, D. Industry 4.0 and the circular economy: A proposed research agenda and original roadmap for sustainable operations. Ann. Oper. Res. 2018, 270, 273–286. [Google Scholar]
- Centobelli, P.; Cerchione, R.; Esposito, E. Environmental sustainability in the service industry of transportation and logistics service providers: Systematic literature review and research directions. Transp. Res. Part D Transp. Environ. 2017, 53, 454–470. [Google Scholar] [CrossRef]
- Thies, C.; Kieckhäfer, K.; Spengler, T.S.; Sodhi, M.S. Operations research for sustainability assessment of products: A review. Eur. J. Oper. Res. 2019, 274, 1–21. [Google Scholar] [CrossRef]
- De Stefano, F.; Bagdadli, S.; Camuffo, A. The hr role in corporate social responsibility and sustainability: A boundary-shifting literature review. Hum. Resour. Manag. 2018, 57, 549–566. [Google Scholar] [CrossRef]
- Hall, J.; Matos, S.; Sheehan, L.; Silvestre, B. Entrepreneurship and innovation at the base of the pyramid: A recipe for inclusive growth or social exclusion? J. Manag. Stud. 2012, 49, 785–812. [Google Scholar] [CrossRef]
- Xu, L.; Kajikawa, Y. An integrated framework for resilience research: A systematic review based on citation network analysis. Sustain. Sci. 2017, 13, 235–254. [Google Scholar] [CrossRef]
- Castellacci, F.; Tveito, V. Internet use and well-being: A survey and a theoretical framework. Res. Policy 2018, 47, 308–325. [Google Scholar] [CrossRef]
- Adams, R.; Jeanrenaud, S.; Bessant, J.; Denyer, D.; Overy, P. Sustainability-oriented innovation: A systematic review. Int. J. Manag. Rev. 2016, 18, 180–205. [Google Scholar] [CrossRef]
- Chen, C. Citespace ii: Detecting and visualizing emerging trends and transient patterns in scientific literature. J. Am. Soc. Inf. Sci. Technol. 2006, 57, 359–377. [Google Scholar] [CrossRef]
- Van Eck, N.J.; Waltman, L. Software survey: Vosviewer, a computer program for bibliometric mapping. Scientometrics 2009, 84, 523–538. [Google Scholar] [CrossRef]
- Wu, D.; Li, M.; Zhu, X.; Song, H.; Li, J. Ranking the research productivity of business and management institutions in asia–pacific region: Empirical research in leading abs journals. Scientometrics 2015, 105, 1253–1272. [Google Scholar] [CrossRef]
- Lowry, P.B.; Moody, G.D.; Gaskin, J.; Galletta, D.F.; Humpherys, S.L.; Barlow, J.B.; Wilson, D.W. Evaluating journal quality and the association for information systems senior scholars’ journal basket via bibliometric measures: Do expert journal assessments add value? MIS Q. 2013, 37, 993–1012. [Google Scholar] [CrossRef]
- Randhawa, K.; Wilden, R.; Hohberger, J. A bibliometric review of open innovation: Setting a research agenda. J. Prod. Innovat. Manag. 2016, 33, 750–772. [Google Scholar] [CrossRef]
- Daim, T.U.; Rueda, G.; Martin, H.; Gerdsri, P. Forecasting emerging technologies: Use of bibliometrics and patent analysis. Technol. Forecast. Soc. 2006, 73, 981–1012. [Google Scholar] [CrossRef]
- Chabowski, B.R.; Mena, J.A.; Gonzalez-Padron, T.L. The structure of sustainability research in marketing, 1958–2008: A basis for future research opportunities. J. Acad. Market. Sci. 2011, 39, 55–70. [Google Scholar] [CrossRef]
- Tang, M.; Liao, H.; Wan, Z.; Herrera-Viedma, E.; Rosen, M. Ten years of sustainability (2009 to 2018): A bibliometric overview. Sustainability 2018, 10, 1655. [Google Scholar] [CrossRef]
- Carter, C.R. Knowledge production and knowledge transfer: Closing the research-practice gap. J. Supply Chain Manag. 2008, 44, 78. [Google Scholar] [CrossRef]
- Wilkinson, B.R.; Durden, C.H. Inducing structural change in academic accounting research. Crit. Perspect. Account. 2015, 26, 23–36. [Google Scholar] [CrossRef]
- Li, K.; Rollins, J.; Yan, E. Web of science use in published research and review papers 1997-2017: A selective, dynamic, cross-domain, content-based analysis. Scientometrics 2018, 115, 1–20. [Google Scholar] [CrossRef] [PubMed]
- Falagas, M.E.; Pitsouni, E.I.; Malietzis, G.A.; Pappas, G. Comparison of pubmed, scopus, web of science, and google scholar: Strengths and weaknesses. FASEB J. 2008, 22, 338–342. [Google Scholar] [CrossRef] [PubMed]
- Morris, H.; Harvey, C.; Kelly, A. Journal rankings and the abs journal quality guide. Manag. Decis. 2009, 47, 1441–1451. [Google Scholar] [CrossRef]
- Mingers, J.; Yang, L. Evaluating journal quality: A review of journal citation indicators and ranking in business and management. Eur. J. Oper. Res. 2017, 257, 323–337. [Google Scholar] [CrossRef]
- Small, H. Co-citation in the scientific literature: A new measure of the relationship between two documents. J. Am. Soc. Inform. Sci. 1973, 24, 265–269. [Google Scholar] [CrossRef]
- Chen, C. Searching for intellectual turning points: Progressive knowledge domain visualization. Proc. Natl. Acad. Sci. USA 2004, 101, 5303–5310. [Google Scholar] [CrossRef] [Green Version]
- Small, H. Visualizing science by citation mapping. J. Am. Soc. Inf. Sci. 1999, 50, 799–813. [Google Scholar] [CrossRef]
- Cobo, M.J.; López-Herrera, A.G.; Herrera-Viedma, E.; Herrera, F. Science mapping software tools: Review, analysis, and cooperative study among tools. J. Am. Soc. Inf. Sci. Technol. 2011, 62, 1382–1402. [Google Scholar] [CrossRef]
- Pan, X.; Yan, E.; Cui, M.; Hua, W. Examining the usage, citation, and diffusion patterns of bibliometric mapping software: A comparative study of three tools. J. Informetr. 2018, 12, 481–493. [Google Scholar] [CrossRef]
- Cui, Y.; Mou, J.; Liu, Y. Knowledge mapping of social commerce research: A visual analysis using citespace. Electron. Commer. Res. 2018, 18, 837–868. [Google Scholar] [CrossRef]
- Chen, C.; Dubin, R.; Kim, M.C. Emerging trends and new developments in regenerative medicine: A scientometric update (2000–2014). Expert Opin. Biol. Ther. 2014, 14, 1295–1317. [Google Scholar] [CrossRef] [PubMed]
- Li, X.; Ma, E.; Qu, H. Knowledge mapping of hospitality research—A visual analysis using citespace. Int. J. Hospital. Manag. 2017, 60, 77–93. [Google Scholar] [CrossRef]
- Fang, Y.; Yin, J.; Wu, B. Climate change and tourism: A scientometric analysis using citespace. J. Sustain. Tour. 2017, 26, 108–126. [Google Scholar] [CrossRef]
- Deerwester, S.; Dumais, S.T.; Furnas, G.W.; Landauer, T.K.; Harshman, R. Indexing by latent semantic analysis. J. Am. Soc. Inform. Sci. 1990, 41, 391–407. [Google Scholar] [CrossRef]
- Dunning, T. Accurate methods for the statistics of surprise and coincidence. Comput. Ling. 1993, 19, 61–74. [Google Scholar]
- Ping, Q.; He, J.; Chen, C. How many ways to use citespace? A study of user interactive events over 14 months. J. Assoc. Inf. Sci. Technol. 2017, 68, 1234–1256. [Google Scholar] [CrossRef]
- Zeldes, S.P. Consumption and liquidity constraints: An empirical investigation. J. Polit. Econ. 1989, 97, 305–346. [Google Scholar] [CrossRef]
- Barro, R.J. Economic growth in a cross section of countries. Q. J. Econ. 1991, 106, 407–443. [Google Scholar] [CrossRef]
- Katz, L.F.; Murphy, K.M. Changes in relative wages, 1963–1987: Supply and demand factors. Q. J. Econ. 1992, 107, 35–78. [Google Scholar] [CrossRef]
- Azar, O.H. The impact of economics on management. J. Econ. Behav. Organ. 2008, 68, 667–675. [Google Scholar] [CrossRef]
- Idler, E.L.; Benyamini, Y. Self-rated health and mortality: A review of twenty-seven community studies. J. Health Soc. Behav. 1997, 38, 21–37. [Google Scholar] [CrossRef] [PubMed]
- Podsakoff, P.M.; MacKenzie, S.B.; Lee, J.Y.; Podsakoff, N.P. Common method biases in behavioral research: A critical review of the literature and recommended remedies. J. Appl. Psychol. 2003, 88, 879–903. [Google Scholar] [CrossRef] [PubMed]
- Adler, P.S.; Kwon, S.-W. Social capital: Prospects for a new concept. Acad. Manag. Rev. 2002, 27, 17–40. [Google Scholar] [CrossRef]
- Frey, B.S.; Stutzer, A. What can economists learn from happiness research? J. Econ. Lit. 2002, 40, 402–435. [Google Scholar] [CrossRef]
- van Doorslaer, E.; Wagstaff, A.; Bleichrodt, H.; Calonge, S.; Gerdtham, U.-G.; Gerfin, M.; Geurts, J.; Gross, L.; Häkkinen, U.; Leu, R.E.; et al. Income-related inequalities in health: Some international comparisons. J. Health Econ. 1997, 16, 93–112. [Google Scholar] [CrossRef]
- Alesina, A.; Baqir, R.; Easterly, W. Public goods and ethnic divisions. Q. J. Econ. 1999, 114, 1243–1284. [Google Scholar] [CrossRef]
- Acemoglu, D.; Robinson, J.A. A theory of political transitions. Am. Econ. Rev. 2001, 91, 938–963. [Google Scholar] [CrossRef]
- Im, K.S.; Pesaran, M.H.; Shin, Y. Testing for unit roots in heterogeneous panels. J. Econ. 2003, 115, 53–74. [Google Scholar] [CrossRef]
- Roodman, D. A note on the theme of too many instruments. Oxf. B Econ. Stat. 2009, 71, 135–158. [Google Scholar] [CrossRef]
- Windmeijer, F. A finite sample correction for the variance of linear efficient two-step gmm estimators. J. Econom. 2005, 126, 25–51. [Google Scholar] [CrossRef]
- Dehejia, R.H.; Wahba, S. Propensity score-matching methods for nonexperimental causal studies. Rev. Econ. Stat. 2002, 84, 151–161. [Google Scholar] [CrossRef]
- Ferrer-i-Carbonell, A. Income and well-being: An empirical analysis of the comparison income effect. J. Public Econ. 2005, 89, 997–1019. [Google Scholar] [CrossRef]
- Kaplan, A.M.; Haenlein, M. Users of the world, unite! The challenges and opportunities of social media. Bus. Horizons 2010, 53, 59–68. [Google Scholar] [CrossRef]
- Teece, D.J.; Pisano, G.; Shuen, A. Dynamic capabilities and strategic management. Strat. Manag. J. 1997, 18, 509–533. [Google Scholar] [CrossRef]
- Boyd, D.; Crawford, K. Critical questions for big data. Inf. Commun. Soc. 2012, 15, 662–679. [Google Scholar] [CrossRef]
- Chen, C. Science mapping: A systematic review of the literature. J. Data Inf. Sci. 2017, 2, 1–40. [Google Scholar] [CrossRef]
- Chatterji, A.K.; Levine, D.I.; Toffel, M.W. How well do social ratings actually measure corporate social responsibility? J. Econ. Manag. Strat. 2009, 18, 125–169. [Google Scholar] [CrossRef]
- Bocken, N.M.P.; Short, S.W.; Rana, P.; Evans, S. A literature and practice review to develop sustainable business model archetypes. J. Clean. Prod. 2014, 65, 42–56. [Google Scholar] [CrossRef]
- Ghisellini, P.; Cialani, C.; Ulgiati, S. A review on circular economy: The expected transition to a balanced interplay of environmental and economic systems. J. Clean. Prod. 2016, 114, 11–32. [Google Scholar] [CrossRef]
- Kim, S.H.; Chan, C.W.; Olivares, M.; Escobar, G. Icu admission control: An empirical study of capacity allocation and its implication for patient outcomes. Manag. Sci. 2015, 61, 19–38. [Google Scholar] [CrossRef]
- Huang, Z.Q.; Huang, X.; Jiang, Y.W. The impact of death-related media information on consumer value orientation and scope sensitivity. J. Market. Res. 2018, 55, 432–445. [Google Scholar] [CrossRef]
- Lu, S.F.; Rui, H.X. Can we trust online physician ratings? Evidence from cardiac surgeons in florida. Manag. Sci. 2018, 64, 2557–2573. [Google Scholar] [CrossRef]
- Chan, J.; Ghose, A. Internet’s dirty secret: Assessing the impact of online intermediaries on hiv transmission. MIS Q. 2014, 38, 955–976. [Google Scholar] [CrossRef]
- Rao, H.; Greve, H.R. Disasters and community resilience: Spanish flu and the formation of retail cooperatives in norway. Acad. Manag. J. 2018, 61, 5–25. [Google Scholar] [CrossRef]
- Venkatesh, V.; Rai, A.; Sykes, T.A.; Aljafari, R. Combating infant mortality in rural india: Evidence from a field study of ehealth kiosk implementations. MIS Q. 2016, 40, 353–380. [Google Scholar] [CrossRef]
- Jonasson, J.O.; Deo, S.; Gallien, J. Improving hiv early infant diagnosis supply chains in sub-saharan africa: Models and application to mozambique. Oper. Res. 2017, 65, 1479–1493. [Google Scholar] [CrossRef]
- Koijen, R.S.J.; Van Nieuwerburgh, S.; Yogo, M. Health and mortality delta: Assessing the welfare cost of household insurance choice. J. Finance 2016, 71, 957–1010. [Google Scholar] [CrossRef]
- Goh, J.; Pfeffer, J.; Zenios, S.A. The relationship between workplace stressors and mortality and health costs in the united states. Manag. Sci. 2016, 62, 608–628. [Google Scholar] [CrossRef]
- Leung, M.D. Learning to hire? Hiring as a dynamic experiential learning process in an online market for contract labor. Manag. Sci. 2018, 64, 5651–5668. [Google Scholar] [CrossRef]
- Nicolaou, N.; Patel, P.C.; Wolfe, M.T. Testosterone and tendency to engage in self-employment. Manag. Sci. 2018, 64, 1825–1841. [Google Scholar] [CrossRef]
- Wiersema, M.F.; Nishimura, Y.; Suzuki, K. Executive succession: The importance of social capital in ceo appointments. Strat. Manag. J. 2018, 39, 1473–1495. [Google Scholar] [CrossRef]
- Zhu, J.; Tatachari, S.; Chattopadhyay, P. Newcomer identification: Trends, antecedents, moderators, and consequences. Acad. Manag. J. 2017, 60, 855–879. [Google Scholar] [CrossRef]
- Dineen, B.R.; Allen, D.G. Third party employment branding: Human capital inflows and outflows following “best places to work” certifications. Acad. Manag. J. 2016, 59, 90–112. [Google Scholar] [CrossRef]
- Li, S.L.; Sun, F.; Li, M.Z. Sustainable human resource management nurtures change-oriented employees: Relationship between high-commitment work systems and employees’ taking charge behaviors. Sustainability 2019, 11, 3550. [Google Scholar] [CrossRef]
- Burtch, G.; Carnahan, S.; Greenwood, B.N. Can you gig it? An empirical examination of the gig economy and entrepreneurial activity. Manag. Sci. 2018, 64, 5497–5520. [Google Scholar] [CrossRef]
- Gans, J.S.; Stern, S.; Wu, J. Foundations of entrepreneurial strategy. Strat. Manag. J. 2019, 40, 736–756. [Google Scholar] [CrossRef]
- Eberhart, R.N.; Eesley, C.E. The dark side of institutional intermediaries: Junior stock exchanges and entrepreneurship. Strat. Manag. J. 2018, 39, 2643–2665. [Google Scholar] [CrossRef]
- Paik, Y.; Kang, S.; Seamans, R. Entrepreneurship, innovation, and political competition: How the public sector helps the sharing economy create value. Strat. Manag. J. 2019, 40, 503–532. [Google Scholar] [CrossRef]
- Younkin, P.; Kuppuswamy, V. The colorblind crowd? Founder race and performance in crowdfunding. Manag. Sci. 2018, 64, 3269–3287. [Google Scholar] [CrossRef]
- Lerner, J.; Schoar, A.; Sokolinski, S.; Wilson, K. The globalization of angel investments: Evidence across countries. J. Financ. Econ. 2018, 127, 1–20. [Google Scholar] [CrossRef] [Green Version]
- McKenzie, D.; Woodruff, C. Business practices in small firms in developing countries. Manag. Sci. 2017, 63, 2967–2981. [Google Scholar] [CrossRef]
- Dessaint, O.; Golubov, A.; Volpin, P. Employment protection and takeovers. J. Financ. Econ. 2017, 125, 369–388. [Google Scholar] [CrossRef]
- Li, X.X.; McAllister, D.J.; Ilies, R.; Gloor, J.L. Schadenfreude: A counternormative observer response to workplace mistreatment. Acad. Manag. Rev. 2019, 44, 360–376. [Google Scholar] [CrossRef]
- Ozcelik, H.; Barsade, S.G. No employee an island: Workplace loneliness and job performance. Acad. Manag. J. 2018, 61, 2343–2366. [Google Scholar] [CrossRef]
- Pillemer, J.; Rothbard, N.P. Friends without benefits: Understanding the dark sides of workplace friendship. Acad. Manag. Rev. 2018, 43, 635–660. [Google Scholar] [CrossRef]
- Bellezza, S.; Keinan, A. Brand tourists: How non-core users enhance the brand image by eliciting pride. J. Consum. Res. 2014, 41, 397–417. [Google Scholar] [CrossRef]
- Hu, H.W.; Cui, L.; Aulakh, P.S. State capitalism and performance persistence of business group-affiliated firms: A comparative study of china and india. J. Int. Bus. Stud. 2019, 50, 193–222. [Google Scholar] [CrossRef]
- Boone, C.; Lokshin, B.; Guenter, H.; Belderbos, R. Top management team nationality diversity, corporate entrepreneurship, and innovation in multinational firms. Strat. Manag. J. 2019, 40, 277–302. [Google Scholar] [CrossRef]
- Armanios, D.E.; Eesley, C.E.; Li, J.; Eisenhardt, K.M. How entrepreneurs leverage institutional intermediaries in emerging economies to acquire public resources. Strat. Manag. J. 2017, 38, 1373–1390. [Google Scholar] [CrossRef]
- Yang, N.; Lim, Y.L. Temporary incentives change daily routines: Evidence from a field experiment on singapore’s subways. Manag. Sci. 2018, 64, 3365–3379. [Google Scholar] [CrossRef]
- Retana, G.F.; Forman, C.; Narasimhan, S.; Niculescu, M.F.; Wu, D.J. Technology support and post-adoption it service use: Evidence from the cloud. MIS Q. 2018, 42, 25. [Google Scholar] [CrossRef]
- Benitez, J.; Ray, G.; Henseler, J. Impact of information technology infrastructure flexibility on mergers and acquisitions. MIS Q. 2018, 42, 25–43. [Google Scholar] [CrossRef]
- Paton-Romero, J.D.; Baldassarre, M.T.; Piattini, M.; de Guzman, I.G.R. A governance and management framework for green it. Sustainability 2017, 9, 1761. [Google Scholar] [CrossRef]
- Mostafa, R.; Klepper, S. Industrial development through tacit knowledge seeding: Evidence from the bangladesh garment industry. Manag. Sci. 2018, 64, 613–632. [Google Scholar] [CrossRef]
- Avci, B.; Girotra, K.; Netessine, S. Electric vehicles with a battery switching station: Adoption and environmental impact. Manag. Sci. 2015, 61, 772–794. [Google Scholar] [CrossRef]
- Kapoor, R.; Furr, N.R. Complementarities and competition: Unpacking the drivers of entrants’ technology choices in the solar photovoltaic industry. Strat. Manag. J. 2015, 36, 416–436. [Google Scholar] [CrossRef]
- Kaiser, U.; Kongsted, H.C.; Laursen, K.; Ejsing, A.K. Experience matters: The role of academic scientist mobility for industrial innovation. Strat. Manag. J. 2018, 39, 1935–1958. [Google Scholar] [CrossRef]
- Xu, J.; Forman, C.; Hu, Y.J. Battle of the internet channels: How do mobile and fixed-line quality drive internet use? Inf. Syst. Res. 2019, 30, 65–80. [Google Scholar] [CrossRef]
- Srivastava, S.C.; Shainesh, G. Bridging the service divide through digitally enabled service innovations: Evidence from indian healthcare service providers. MIS Q. 2015, 39, 245–267. [Google Scholar] [CrossRef]
- Mindel, V.; Mathiassen, L.; Rai, A. The sustainability of polycentric information commons. MIS Q. 2018, 42, 607–631. [Google Scholar] [CrossRef]
- Song, P.J.; Xue, L.; Rai, A.; Zhang, C. The ecosystem of software platform: A study of asymmetric cross-side network effects and platform governance. MIS Q. 2018, 42, 121–142. [Google Scholar] [CrossRef]
- Venkatesh, V.; Bala, H.; Sambamurthy, V. Implementation of an information and communication technology in a developing country: A multimethod longitudinal study in a bank in india. Inf. Syst. Res. 2016, 27, 558–579. [Google Scholar] [CrossRef]
- Cobb, J.A. How firms shape income inequality: Stakeholder power, executive decision making, and the structuring of employment relationships. Acad. Manag. Rev. 2016, 41, 324–348. [Google Scholar] [CrossRef]
- Ranganathan, A. Train them to retain them: Work readiness and the retention of first-time women workers in india. Adm. Sci. Q. 2018, 63, 879–909. [Google Scholar] [CrossRef]
- Mun, E.; Jung, J. Change above the glass ceiling: Corporate social responsibility and gender diversity in japanese firms. Adm. Sci. Q. 2018, 63, 409–440. [Google Scholar] [CrossRef]
- Chan, J.; Wang, J. Hiring preferences in online labor markets: Evidence of a female hiring bias. Manag. Sci. 2018, 64, 2973–2994. [Google Scholar] [CrossRef]
- Zhang, L.T. A fair game? Racial bias and repeated interaction between nba coaches and players. Adm. Sci. Q. 2017, 62, 603–625. [Google Scholar] [CrossRef]
- Zhang, L. Who loses when a team wins? Better performance increases racial bias. Organ. Sci. 2019, 30, 40–50. [Google Scholar] [CrossRef]
- Frydman, C.; Papanikolaou, D. In search of ideas: Technological innovation and executive pay inequality. J. Financ. Econ. 2018, 130, 1–24. [Google Scholar] [CrossRef] [Green Version]
- Botelho, T.L.; Abraham, M. Pursuing quality: How search costs and uncertainty magnify gender-based double standards in a multistage evaluation process. Adm. Sci. Q. 2017, 62, 698–730. [Google Scholar] [CrossRef]
- Ordabayeva, N.; Fernandes, D. Better or different? How political ideology shapes preferences for differentiation in the social hierarchy. J. Consum. Res. 2018, 45, 227–250. [Google Scholar] [CrossRef]
- Jung, K.; Garbarino, E.; Briley, D.A.; Wynhausen, J. Blue and red voices: Effects of political ideology on consumers’ complaining and disputing behavior. J. Consum. Res. 2017, 44, 477–499. [Google Scholar] [CrossRef]
- Gupta, A.; Briscoe, F.; Hambrick, D.C. Evenhandedness in resource allocation: Its relationship with ceo ideology, organizational discretion, and firm performance. Acad. Manag. J. 2018, 61, 1848–1868. [Google Scholar] [CrossRef]
- Cettolin, E.; Riedl, A. Justice under uncertainty. Manag. Sci. 2017, 63, 3739–3759. [Google Scholar] [CrossRef]
- Stevens, C.E.; Xie, E.; Peng, M.W. Toward a legitimacy-based view of political risk: The case of google and yahoo in china. Strat. Manag. J. 2016, 37, 945–963. [Google Scholar] [CrossRef]
- Chan, J.; Mojumder, P.; Ghose, A. The digital sin city: An empirical study of craigslist’s impact on prostitution trends. Inf. Syst. Res. 2019, 30, 219–238. [Google Scholar] [CrossRef]
- Sartor, M.A.; Beamish, P.W. Host market government corruption and the equity-based foreign entry strategies of multinational enterprises. J. Int. Bus. Stud. 2018, 49, 346–370. [Google Scholar] [CrossRef]
- Aven, B.L. The paradox of corrupt networks: An analysis of organizational crime at Enron. Organ. Sci. 2015, 26, 980–996. [Google Scholar] [CrossRef]
- den Nieuwenboer, N.A.; da Cunha, J.V.; Trevino, L.K. Middle managers and corruptive routine translation: The social production of deceptive performance. Organ. Sci. 2017, 28, 781–803. [Google Scholar] [CrossRef]
- Sampath, V.S.; Gardberg, N.A.; Rahman, N. Corporate reputation’s invisible hand: Bribery, rational choice, and market penalties. J. Bus Ethics 2018, 151, 743–760. [Google Scholar] [CrossRef]
- Vadera, A.K.; Pratt, M.G. Love, hate, ambivalence, or indifference? A conceptual examination of workplace crimes and organizational identification. Organ. Sci. 2013, 24, 172–188. [Google Scholar] [CrossRef]
- Hui, K.L.; Kim, S.H.; Wang, Q.H. Cybercrime deterrence and international legislation: Evidence from distributed denial of service attacks. MIS Q. 2017, 41, 497–523. [Google Scholar] [CrossRef]
- York, J.G.; Vedula, S.; Lenox, M.J. It’s not easy building green: The impact of public policy, private actors, and regional logics on voluntary standards adoption. Acad. Manag. J. 2018, 61, 1492–1523. [Google Scholar] [CrossRef]
- Hu, Z.L.; Cao, J.; Hong, L.J. Robust simulation of global warming policies using the dice model. Manag. Sci. 2012, 58, 2190–2206. [Google Scholar] [CrossRef]
- Dutta, S. Creating in the crucibles of nature’s fury: Associational diversity and local social entrepreneurship after natural disasters in california, 1991–2010. Adm. Sci. Q. 2017, 62, 443–483. [Google Scholar] [CrossRef]
- Brusset, X.; Bertrand, J.L. Hedging weather risk and coordinating supply chains. J. Oper. Manag. 2018, 64, 41–52. [Google Scholar] [CrossRef]
- Bansal, P.; Kim, A.; Wood, M.O. Hidden in plain sight: The importance of scale in organizations’ attention to issues. Acad. Manag. Rev. 2018, 43, 217–241. [Google Scholar] [CrossRef]
- Wright, C.; Nyberg, D. An inconvenient truth: How organizations translate climate change into business as usual. Acad. Manag. J. 2017, 60, 1633–1661. [Google Scholar] [CrossRef]
- Ferraro, F.; Beunzab, D. Creating common ground: A communicative action model of dialogue in shareholder engagement. Organ. Sci. 2018, 29, 1187–1207. [Google Scholar] [CrossRef]
- Sunar, N.; Birge, J.R. Strategic commitment to a production schedule with uncertain supply and demand: Renewable energy in day-ahead electricity markets. Manag. Sci. 2019, 65, 714–734. [Google Scholar] [CrossRef]
- Nguyen, J.; Donohue, K.; Mehrotra, M. Closing a supplier’s energy efficiency gap through assessment assistance and procurement commitment. Manag. Sci. 2019, 65, 122–138. [Google Scholar] [CrossRef]
- Cruise, J.; Flatley, L.; Gibbens, R.; Zachary, S. Control of energy storage with market impact: Lagrangian approach and horizons. Oper. Res. 2019, 67, 1–9. [Google Scholar] [CrossRef]
- Kok, A.G.; Shang, K.; Yucel, S. Impact of electricity pricing policies on renewable energy investments and carbon emissions. Manag. Sci. 2018, 64, 131–148. [Google Scholar] [CrossRef]


| Dataset | Duration | Results | Articles | Reviews | References | Authors | Institutions |
|---|---|---|---|---|---|---|---|
| Period I | 1990–1999 | 4062 | 3981 | 81 | 114,118 | 7676 | 1830 |
| Period II | 2000–2009 | 10,848 | 10,507 | 341 | 323,222 | 22,262 | 4523 |
| Period III | 2010–2019 | 22,412 | 21,966 | 446 | 762,058 | 48,963 | 9511 |
| PeriodTotal | 1990–2019 | 37,322 | 36,454 | 848 | 1,199,398 | 69,994 | 12,581 |
| Cluster ID | Size | Silhouette | Mean (Year) | Label (LSI) | Label (LLR) |
|---|---|---|---|---|---|
| 0 | 52 | 0.876 | 1989 | consumption; permanent income; social security | liquidity constraints (30.56, 10-4); dynamic programming (21.77, 10-4); saving (21.77, 10-4) |
| 1 | 47 | 0.987 | 1990 | economic growth; economic development; stochastic growth models | growth (24.28, 10-4); endogenous growth (21.96, 10-4); unit roots (21.56, 10-4) |
| 5 | 29 | 0.997 | 1987 | innovation; job mobility; scale | agricultural households (8.68, 0.005); self-selection (8.68, 0.005); diseconomies of scale (8.68, 0.005) |
| 6 | 29 | 0.987 | 1989 | unmeasured heterogeneity; competing risks; time-varying coefficients | youth labor market (25.09, 10-4); returns to education (25.09, 10-4); selection bias (17.63, 10-4) |
| 7 | 26 | 0.961 | 1990 | monte carlo methods; moments; symmetric normalization | simulation estimation (12.4, 10-3); symmetric normalization (12.4, 10-3); intertemporal labor force participation (12.4, 10-3) |
| 8 | 25 | 0.914 | 1987 | employment characteristics; women’s health; social roles | class (18.58, 10-4); paid employment (18.58, 10-4); employment characteristics (18.58, 10-4) |
| 9 | 25 | 0.922 | 1994 | socioeconomic status; social class; avoidable mortality | women (15.17, 10-4); UK (15.17, 10-4); mortality (12.23, 10-3) |
| 10 | 24 | 0.978 | 1986 | information system problems; description; information system view | actual relatedness (28.88, 10-4); measurement of diversification (28.88, 10-4); corporate strategy (17.24, 10-4) |
| 11 | 23 | 0.998 | 1987 | home; work; work arrangements | selection (8.06, 0.005); alternative work arrangements (8.06, 0.005); employment relations (8.06, 0.005) |
| 12 | 20 | 0.882 | 1989 | issues; structure; centralization decentralization | issues in organizing is (15.25, 10-4); IS centralization decentralization (15.25, 10-4); structure of the is function (15.25, 10-4) |
| 13 | 20 | 0.954 | 1986 | flexibility; stratification; unemployment | underclass (22.36, 10-4); employment histories (22.36, 10-4); stratification (22.36, 10-4) |
| Cluster ID | Size | Silhouette | Mean (Year) | Label (LSI) | Label (LLR) |
|---|---|---|---|---|---|
| 0 | 42 | 0.954 | 2001 | social capital; food security; health insurance | social capital (108.37, 10-4); multilevel modelling (53.34, 10-4); USA (50.92, 10-4) |
| 1 | 35 | 0.971 | 1997 | income inequality; alcohol dependence; social capital | socioeconomic factors (94.6, 10-4); income inequality (83.78, 10-4); health status (47.69, 10-4) |
| 2 | 31 | 0.95 | 2002 | subjective well-being; spatial amenities; geographical information systems | subjective well-being (124.24, 10-4); happiness (91.65, 10-4); quality of life (39.72, 10-4) |
| 3 | 31 | 0.95 | 1997 | social capital; self-rated health; network data | social networks (45.06, 10-4); alliances (34.66, 10-4); networks (33.72, 10-4) |
| 4 | 31 | 0.958 | 1997 | convergence; spatial dependence; dynamic panels | endogenous growth (32.01, 10-4); multiple equilibria (22.98, 10-4); ces (22.98, 10-4) |
| 5 | 28 | 0.969 | 2002 | economic growth; economic development; foreign aid | environmental Kuznets curve (28.02, 10-4); democratization (22.66, 10-4); democracy (19.7, 10-4) |
| 6 | 26 | 0.973 | 1999 | economic growth; natural disasters; currency crises; international trade | financial development (63.79, 10-4); economic growth (48.39, 10-4); banks (23.91, 10-4) |
| 7 | 24 | 0.946 | 1998 | economic growth; financial development; legal system | bureaucracy (29.94, 10-4); active labor market policy (23.93, 10-4); growth (14.68, 10-3) |
| 8 | 21 | 0.967 | 1996 | consumption; incomplete markets; buffer stock | consumption (41.27, 10-4); excess sensitivity (35.6, 10-4); hand-to-mouth consumers (27.46, 10-4) |
| 9 | 21 | 0.837 | 2000 | corporate social performance; performance; differentiation | corporate social performance (40.52, 10-4); business performance (23.11, 10-4); demographic transition (23.11, 10-4) |
| 10 | 20 | 0.953 | 2001 | structural equation modeling; information privacy threats; responses; ethical issues | exploratory and exploitative orientation (22.3, 10-4); behavioral integration (22.3, 10-4); ambidexterity (22.3, 10-4) |
| 11 | 20 | 0.979 | 1995 | entrepreneurship; performance; firm growth | crowd-out (28.56, 10-4); Medicaid (28.56, 10-4); environmental amenities (14.25, 10-3) |
| 12 | 17 | 0.938 | 2003 | institutions; political instability; capital accumulation | institutions (45.4, 10-4); corruption (18.62, 10-4); concentration (17.89, 10-4) |
| Cluster ID | Size | Silhouette | Mean (Year) | Label (LSI) | Label (LLR) |
|---|---|---|---|---|---|
| 0 | 48 | 0.92 | 2006 | economic growth; political instability; general practitioner | panel data (66.86, 10-4); granger-causality (48.94, 10-4); panel unit root and cointegration tests (48.94, 10-4) |
| 1 | 45 | 0.969 | 2007 | propensity score; impact assessment; agricultural biotechnology | happiness (99.21, 10-4); propensity score matching (97.25, 10-4); health insurance (62.08, 10-4) |
| 2 | 39 | 0.965 | 2010 | social media; social networks; data mining | fsqca (80.66, 10-4); big data (64.85, 10-4); strategic flexibility (37.12, 10-4) |
| 3 | 34 | 0.983 | 2009 | data envelopment analysis; production uncertainty; systems dynamics | environmental assessment (477.06, 10-4); data envelopment analysis (329.47, 10-4); dea (267.94, 10-4) |
| 4 | 30 | 0.981 | 2004 | social networks; information exchange; post implementation | trust (78.93, 10-4); reciprocity (55.4, 10-4); self-disclosure (50.35, 10-4) |
| 5 | 29 | 0.946 | 2012 | corporate social responsibility; diffusion; innovations | corporate social responsibility (91.94, 10-4); sustainability (48.65, 10-4); stakeholders (41.84, 10-4) |
| 6 | 28 | 0.874 | 2010 | corporate governance; tax avoidance; tax planning | corporate governance (52.09, 10-4); gender (37.96, 10-4); board diversity (36.97, 10-4) |
| 7 | 26 | 0.963 | 2011 | institutions; human capital; political economy | inequality (31.22, 10-4); skills (18.05, 10-4); heterogeneous agents (18.05, 10-4) |
| 8 | 26 | 0.98 | 2007 | supply chain management; corporate social responsibility; bottom line | environmental management (109.78, 10-4); supply chain management (86.76, 10-4); sustainability (57.82, 10-4) |
| 9 | 25 | 0.888 | 2007 | social networks; network analysis; malware defense | peer effects (36.33, 10-4); contagion (30.54, 10-4); homophily (25.24, 10-4) |
| 10 | 25 | 0.939 | 2011 | human capital; institutions; political economy; natural resources | economic development (41.74, 10-4); human capital (23.74, 10-4); development (23.34, 10-4) |
| 11 | 20 | 0.764 | 2007 | environmental assessment; data envelopment analysis; petroleum industry | teams (30.18, 10-4); team performance (24.14, 10-4); job security (18.1, 10-4) |
| 12 | 18 | 0.907 | 2006 | economic growth; pre-colonial societies; long-term political development; | consumption income and wealth inequality (43.21, 10-4); wage dynamics (43.21, 10-4); inequality over the life cycle (43.21, 10-4); |
| 13 | 12 | 0.903 | 2012 | input–output analysis; material footprint; coefficient approach | material footprint (67.75, 10-4); input–output analysis (54.15, 10-4); material flow accounting (27.02, 10-4) |
| Period I (1990–1999) | Period II (2000–2009) | Period III (2010–2019) | |
|---|---|---|---|
| Clusters size | 52 | 61 | 106 |
| Selection (%) | 57.47% | 80.7% | 78.38% |
| Cluster 1 | liquidity constraints (9.96%) | social capital (9.76%) | panel data (11.4%) |
| Cluster 2 | growth (9%) | socioeconomic factors (8.13%) | happiness (10.69%) |
| Cluster 3 | agricultural households (5.56%) | subjective well-being (7.21%) | fuzzy-set qualitativecomparative analysis (fsqca) (9.26%) |
| Cluster 4 | youth labour market (5.56%) | social networks (7.21%) | environmental assessment (8.08%) |
| Cluster 5 | simulation estimation (4.98%) | endogenous growth (6.5%) | trust (7.13%) |
| Cluster 6 | class (4.79%) | environmental kuznets curve (6.05%) | corporate social responsibility (6.89%) |
| Cluster 7 | women (4.79%) | financial development (5.58%) | corporate governance (6.65%) |
| Cluster 8 | actual relatedness (4.60%) | bureaucracy (4.88%) | inequality (6.18%) |
| Cluster 9 | selection (4.41%) | consumption (4.88%) | environmental management (6.18%) |
| Cluster 10 | issues in organizing IS (3.83) | corporate social performance (4.65%) | peer effects (5.94%) |
| Cluster | Size | From | To | Duration | Median | Sustainability | Activeness | Theme |
|---|---|---|---|---|---|---|---|---|
| 0 | 48 | 2002 | 2014 | 13 | 2008 | +++++ | Inactive | panel data |
| 1 | 45 | 2002 | 2015 | 14 | 2008 | ++++++ | Inactive | happiness |
| 2 | 39 | 2003 | 2015 | 13 | 2009 | +++++ | Inactive | fsqca |
| 3 | 34 | 2003 | 2014 | 12 | 2008 | ++++ | Inactive | environmental assessment |
| 4 | 30 | 2003 | 2009 | 7 | 2006 | Inactive | trust | |
| 5 | 29 | 2009 | 2016 | 8 | 2012 | Active | corporate social responsibility | |
| 6 | 28 | 2004 | 2017 | 14 | 2010 | ++++++ | Active | corporate governance |
| 7 | 26 | 2008 | 2016 | 9 | 2012 | Active | inequality | |
| 8 | 26 | 2003 | 2011 | 9 | 2007 | Inactive | environmental management | |
| 9 | 25 | 2003 | 2013 | 11 | 2008 | +++ | Inactive | peer effects |
| 10 | 25 | 2008 | 2017 | 10 | 2012 | Active | economic development | |
| 11 | 20 | 2004 | 2011 | 8 | 2007 | Inactive | teams | |
| 12 | 18 | 2003 | 2013 | 11 | 2008 | +++ | Inactive | consumption income and wealth inequality |
| 13 | 12 | 2009 | 2015 | 7 | 2012 | Inactive | material footprint |
| Cluster ID | Size | Silhouette | Mean (Year) | Label (LSI) | Label (LLR) |
|---|---|---|---|---|---|
| 0 | 63 | 0.829 | 2014 | business model innovation; equipment maintenance; digitalization; | business model innovation (15.82, 10-4); business models (7.17, 0.01); business model (6.4, 0.05); |
| 1 | 41 | 0.875 | 2015 | circular economy; green economy; bibliometric analysis; | circular economy (11.2, 10-3); eco-innovation (8.33, 0.005); circular business models (8.33, 0.005); |
| 2 | 38 | 0.856 | 2013 | circular economy; green economy; resource efficiency; | group decision making (5.11, 0.05); biaxially oriented polypropylene plastic film (5.11, 0.05); uncertainty modeling (5.11, 0.05); |
| 3 | 35 | 0.838 | 2012 | green supply chain management; supply disruption risk; performance; | strategic orientation (9.48, 0.005); green supply chain management (7.93, 0.005); institutional pressures (4.72, 0.05); |
| 4 | 26 | 0.927 | 2013 | waste management; municipal solid waste; benefits; rural district municipalities; | developing countries (9.42, 0.005); municipal solid waste (9.11, 0.005); waste management (7.4, 0.01); |
| 5 | 22 | 0.973 | 2013 | corporate social responsibility; executive compensation; csr contract; csr-contingent compensation; | corporate social responsibility (14.52, 10-3); quality management (9.64, 0.005); stakeholder theory (9.64, 0.005); |
| 6 | 22 | 0.917 | 2012 | audit scheme; environmental management systems; organizational environmental performance; | ohsas 18001 (6.29, 0.05); fashionable products (6.29, 0.05); eco-management and audit scheme (emas) (6.29, 0.05); |
| 8 | 16 | 0.93 | 2011 | co-management; participation; collaboration agreements; | co-management (9.25, 0.005); bottom-up participation (4.61, 0.05); south Africa (4.61, 0.05); |
| 10 | 10 | 0.962 | 2013 | stocks; flows; waste management; | transition management (10.77, 0.005); strategic planning (5.36, 0.05); collaborative landscape planning (5.36, 0.05); |
| 12 | 9 | 0.99 | 2013 | Italian territory; sustainability integration; sustainability control systems; | family firms (12.5, 10-3); sustainability control systems (scss) (6.21, 0.05); family firm (6.21, 0.05); |
| Gap | Enlightening Literature | Insights |
|---|---|---|
| Mortality ratio |
| |
| Diseases |
| |
| Traffic safety | / |
|
| Sexual and reproductive health-care services |
| |
| Health financing |
|
|
| Health workforce management |
|
|
| Health risks management |
|
|
| Gap | Enlightening Literature | Insights |
|---|---|---|
| Decent job creation, employment |
| |
| Entrepreneurship, The formalization and growth of micro-, small- and medium-sized enterprises |
|
|
| labor rights, safe and secure working environments |
|
|
| Sustainable tourism |
|
|
| Developing countries/emerging markets |
|
| Gap | Enlightening Literature | Insights |
|---|---|---|
| Infrastructure |
| |
| Sustainable industrialization |
|
|
| Clean and environmentally technologies |
| |
| Innovation and increasing R&D workers |
|
|
| Information and communication technology |
|
| Gap | Enlightening Literature | Insights |
|---|---|---|
| All women and men equal pay for work of equal value |
| |
| Inequalities in age, disability, race, ethnicity, origin, religion or economic or other status |
| |
| Income inequality |
|
| Gap | Enlightening Literature | Insights |
|---|---|---|
| The influence of political factors on stakeholders in business management |
| |
| Political risk and uncertainty |
| |
| Crime |
|
| Gap | Enlightening Literature | Insights |
|---|---|---|
| Environmental Management Policy |
| |
| Natural-Environmental and business strategy |
| |
| Operation for Energy Storage, Utilization and Investment |
|
© 2019 by the authors. Licensee MDPI, Basel, Switzerland. This article is an open access article distributed under the terms and conditions of the Creative Commons Attribution (CC BY) license (http://creativecommons.org/licenses/by/4.0/).
Share and Cite
Jia, Q.; Wei, L.; Li, X. Visualizing Sustainability Research in Business and Management (1990–2019) and Emerging Topics: A Large-Scale Bibliometric Analysis. Sustainability 2019, 11, 5596. https://0-doi-org.brum.beds.ac.uk/10.3390/su11205596
Jia Q, Wei L, Li X. Visualizing Sustainability Research in Business and Management (1990–2019) and Emerging Topics: A Large-Scale Bibliometric Analysis. Sustainability. 2019; 11(20):5596. https://0-doi-org.brum.beds.ac.uk/10.3390/su11205596
Chicago/Turabian StyleJia, Qiong, Liyuan Wei, and Xiaotong Li. 2019. "Visualizing Sustainability Research in Business and Management (1990–2019) and Emerging Topics: A Large-Scale Bibliometric Analysis" Sustainability 11, no. 20: 5596. https://0-doi-org.brum.beds.ac.uk/10.3390/su11205596