A Novel Method of Developing Construction Projects Schedule under Rework Scenarios


Department of Construction Management and Real Estate, TongJi University, Shanghai 200092, China
*
Author to whom correspondence should be addressed.
Sustainability 2019, 11(20), 5710; https://0-doi-org.brum.beds.ac.uk/10.3390/su11205710
Submission received: 17 September 2019
/
Revised: 11 October 2019
/
Accepted: 14 October 2019
/
Published: 16 October 2019
(This article belongs to the Special Issue Scheduling Problems in Sustainability)
Abstract
:Construction projects have faced serious schedule delays caused by rework risks. However, it appears that traditional methods are of limited value in developing applicable project schedules. This study presents an analysis on construction projects schedule development under rework scenarios by a novel method named the improved critical chain design structure matrix (CCDSM). Research data are collected from a real estate development project in China. As a result, predictions of project completion duration and probability have been made. A reliable schedule considering information interactions has been developed and visualized. Rework impact areas of activities have been examined to quantitatively record the impact on project duration. To meet different demands, the method generates two more schedules setting different rework buffers. Furthermore, these activities have the potential of causing rework and have been quantified based on the calculation of two criticalities, providing an identification of rework-intensive works that should be payed close importance to, which have not be realized by previous methods. The results proved the feasibility and effectiveness of this method in developing a schedule for construction projects disturbed by rework, helping practitioners adopt measures to avoid rework-caused schedule delays and achieve sustainable development of such projects.
1. Introduction
Schedule performance is a vital indicator measuring project performance, but schedule delays are a long-standing challenge for practical application in project management [1]. Even in those projects that have been carefully planned and organized, potential risks of schedule delays still exist [2] and adversely affect the project’s performance and profit [3]. Many participants like contractors, suppliers, and owners are involved in such a complex environment where many activities undertaken by various parties take place simultaneously [4]. Consequently, there will be unforeseen complicated mistakes happening in the project life cycle, leading to uncertain rework defined as "unnecessary effort of redoing a process or activity that was incorrectly implemented the first time" [5]. While the Construction Industry Development Agency [6] holds another view that rework involves doing something at least one extra time due to nonconformance to requirements, which deepens the definition of rework.
As for the impact of rework on project performance, various scholars including Hwang et al. [7,8] and Mao et al. [9], have reached an agreement that the intense emergence of rework is severely impactful on timely completion, hence the reasonable cost and duration of the project [10] have also been negatively plagued. Reported by previous studies, the direct costs of rework in poorly managed projects can amount to as much as 5% of a project’s contract value [11,12]. When it comes to taking indirect costs into account, rework costs can be surprising, even up to 16% and 23% of the contract value [13].
Traditional project scheduling methods have been found incapable of managing schedule distortions and they lack pertinent researches on such problems [14], let alone helping managers to develop project schedules under rework scenarios. The existing periodic inspection and evaluation of project schedules make it even harder to find delays in time or in advance, resulting in frustrating and undesirable schedule delays and cost overruns. Performance on managing critical works with the high potential of inducing rework, which are also defined as rework-intensive works, barely satisfies project managers. Gradually, it has been a chronic problem to identify those influential works and take corresponding steps. More improvements should be added to enhance the level of schedule management in construction project practices. Accordingly, a new method named the critical chain design structure matrix (CCDSM), which integrates critical chain project management (CCPM) and the design structure matrix (DSM) to overcome their respective limitations put forward by Xiao [15], is introduced in this study to fill the gap between the shortage of effective scheduling methods and poor performance of project schedules with duration delays as well as resource overruns. Therefore, this study attempts to apply the improved CCDSM method on a practical project from the perspective of interaction between activities which is conducive to rework scenarios. This updated method shed more light on developing project schedules considering rework impacts, and two innovative criticalities are used to analyze critical works. The analysis serves to identify which activities are performing as driving activities to the on-time project completion rate on duration and cost. On this basis, this study aims to develop accurate schedules for rework-affected projects with the help of the introduced method and furtherly verify its effectiveness and feasibility for better practical and theoretical application.
The rest of the paper is organized as follows: Section 2 describes the literature review on rework in construction projects and its management with technical methods. Section 3 briefly represents the research methodology including basic principles and concepts of the introduced method. Section 4 covers the results of model validation. Moreover, the analysis on the generated results and related discussion on managerial implications of the proposed model are conducted in Section 5. Finally, Section 6 discusses the conclusions, limitations and future scope of work.
2. Review of Related Literature
2.1. Rework in Construction Projects
Imperfections have never been a rare phenomenon in the construction industry and almost occur in every project inevitably including error, fault, defect, nonconformance, and so on [16,17]. These various types of failures may appear at dispersed sections of a construction project, but all of them suggest that the client is not satisfied with existing solutions [18]. Change orders caused by design errors and modifications are a typical kind of rework [10]. They detrimentally impair the productivity, create scheduling delays or cost overruns, and threaten the safety [10,19,20,21]. Hence, diverse definitions of rework abound the normative literature [22], which has resulted in significant discrepancies in reported costs from project to project. Derived from its causations, Taylor and Ford [23] defined rework as work adjusted on account of errors, omissions, or regular changes. The occurrence and subsequent rectification of a defect can also be named so. Ashford [24] refers to the term repair and defines it as “the process of restoring a nonconforming characteristic to an acceptable condition even though the item may not still conform to the original requirement.” To make sense of the essence, Love et al. [25] reveals that rework is more like “uncomfortable knowledge”, which represents a reality that prevails, but project managers are reluctant to their senior management or just ignore due to their psychological unsafety. Rework thereby remains as a challenging issue in the construction industry and abundant companies are suffered by its chronic impact. When rework occurs during the development process, the project manager ought to take measures urgently to solve such conflicts with planned settings [10]. For example, project managers are often inclined to execute their tasks based on empirical data when they are unfamiliar with the actual price, which to some extent may result in the nonconformance with the changing market. Therefore, they have to rectify previous mistakes for a more appropriate solution and the adjustment they make is generally regarded as rework practically.
Stressed by costly rework-caused profit loss and the demand for a higher level of productivity, clients and employed project managers have to attach great importance to rework, or they would lose in competition with other teams [26]. Because of that, identification of the root causes of rework and the management of them to reduce its unfavorable impact on the execution of construction projects is critical [27,28]. Although the varying interpretations and lack of uniformity in rework data collation [29,30] make it difficult to compare these studies and define general preventive measures, scholars still spare no efforts to develop a deeper and richer awareness of why and how rework arises in projects, and therefore, contribute to mitigating the annoying problem. Palaneeswaran [31] identified several reasons including errors, omissions, failures, changes, poor communication and coordination. It is the invisible logical connections and neglected interactions of information flows between activities or people that lead to major rework [32]. Negligence of information interactions between activities also gives rise to rework risk [33]. Specifically, construction projects that are characterized with unstable dynamic environment, strong correlations between project activities, and frequent interactions between participants, have exceeded the applied range of traditional methods [34]. These features bring about complex information interactions, resulting in plenty of rework. Despite these identified technical causations, rework remains a pervasive problem in construction projects [35] owing to some sophisticated organizational impediment. Many firms are reluctant to openly admit rework as a tough issue because it can potentially damage their reputations [36]. Gradually, project managers have been accustomed to treating rework as a common function of operations without efficient countermeasures. Therefore, it becomes our research goal to bridge the gap between unsolved rework risks and project schedule management with poor performance.
2.2. Rework Management with Technical Methods
Construction project performance is widely degraded by a range of limitations, involving site uncertainty, resource deficiency, labor instability and project complexity. It has been generally proved that the critical path method (CPM) and the program/project evaluation and review technique (PERT) are two effective scheduling methods that integrate the aforementioned constraints and have been extensively used to develop and manage project schedules. Whereas, as projects become more complex and diversified prevalently, practitioners and scholars have felt unsatisfied with these methods and gradually vacillated their trust due to certain obsolete assumptions [37,38]. As the mainstream project scheduling technique in many fields [39], the CCPM takes advantages of the theory of constraints (TOC) and strengthens the schedule development considering rework by setting three major types of buffer on the basis of CPM [40], which realizes the integration management of uncertainties in the project. Furtherly, various factors affecting the size of buffers were identified including managerial experience, project circumstances, personnel, and so on [41]. However, it should be noticed that this method is based on the assumption that each activity is independent of each other [42], which is quite against reality. In other words, most research concerning process scheduling and buffer settings in CCPM neglects the interactions between activities, which hinders related rework research with CCPM and needs to be corrected urgently. Furthermore, due to the uncertainty and multi-feedback mechanism of rework, other traditional scheduling techniques including PERT and Gantt charts are not capable of measuring rework time and its impact on project duration, quantitatively [43,44].
Aimed at this issue, further research has been carried out and most of which can be divided into two mainstreams: Qualitative research and quantitative measurement. In the former, researchers generally concern the impact of rework [21,45,46], the identification of factors causing rework [8,45,47], and the measures of reducing rework [29,48,49]. As for the latter, Browning [50] applied system dynamics to find that the uncertainty of the project schedule mainly originates from the number of intentional or unintentional iterations, activity set completeness and the iteration scope. More emphasis has been laid on the information flow interactions between activities by introducing the DSM. Actually, there are two basic types of information flow interactions between activities: Information transmission and information feedback. The former refers to the information spread from one activity to another along the activity’s sequence, while the latter refers to the opposite. As a systematic idea put forward by Steward to solve multi-equations [51,52], the DSM expresses the mentioned information flow interactions among essential elements by matrix composed of graphics or digital symbols [53,54]. Therefore, it has natural advantages in dealing with complex relationships among multiple activities. Using such a method, Eppinger and others gradually conducted quantitative researches on rework. For example, Browning and Eppinger [55] took the lead in measuring rework from two dimensions: Rework probability (RP) and rework impact (RI), which is also one of the theoretical foundations of the model proposed in this study.
Accordingly, Xiao [15] first came up with the new idea, termed the critical chain design structure matrix (CCDSM). Built on the strength of the CCPM and DSM, the CCDSM aims to take advantage of both methods in project scheduling to develop construction project schedules that are adaptive to rework instances. It not only adopts the concepts of rework activity scheduling mechanism and activity criticality from DSM, but also incorporates the idea of critical chain identification and buffer setting from CCPM. Additionally, rework model assumptions and the principle of design criticality have been adjusted to adapt to reality. Zhang et al. [56] have also taken effort to combine CCPM with DSM. A more reasonable buffer sizing method considering information resource tightness is proposed to better reflect the relationships between activities and improve the accuracy of project buffer (PB) calculation. However, the CCDSM still has some deficiencies including misunderstanding the framework of DSM rework theory, lacking consideration and visualization of the impact of occurred rework on critical chain.
This paper commences by taking advantage of a working paper called “A critical design structure method for project schedule development under rework scenarios”, which introduces the mechanism and process of the new method namely the improved CCDSM in detail and has accomplished the second round review of International Journal of Production Research. The concepts of “interface criticality” and “potential criticality” are also applied to identify critical activities. The paper proposes an empirical study of a practical project holistically from data collection to results discussion, in order to fully indicate the potential application and benefits of the proposed method. Various attributes of activities have been observed in the results, enabling the generation and visualization of the project schedule under rework scenarios. While there is an absence of an effective method improving the accuracy and reliability of the schedule, the research presented in this paper makes a substantial contribution toward aiding its development not only in generation considering two types of rework buffers, but also in the process where managers could identify critical activities worthy of extra concern. Bringing such a method to the forefront supports construction project teams with a better prediction of the completion duration and possibility, with which related resources or capital planning could be established more precisely, hence there would be fewer schedule delays and cost overruns.
3. Proposed CCDSM Method
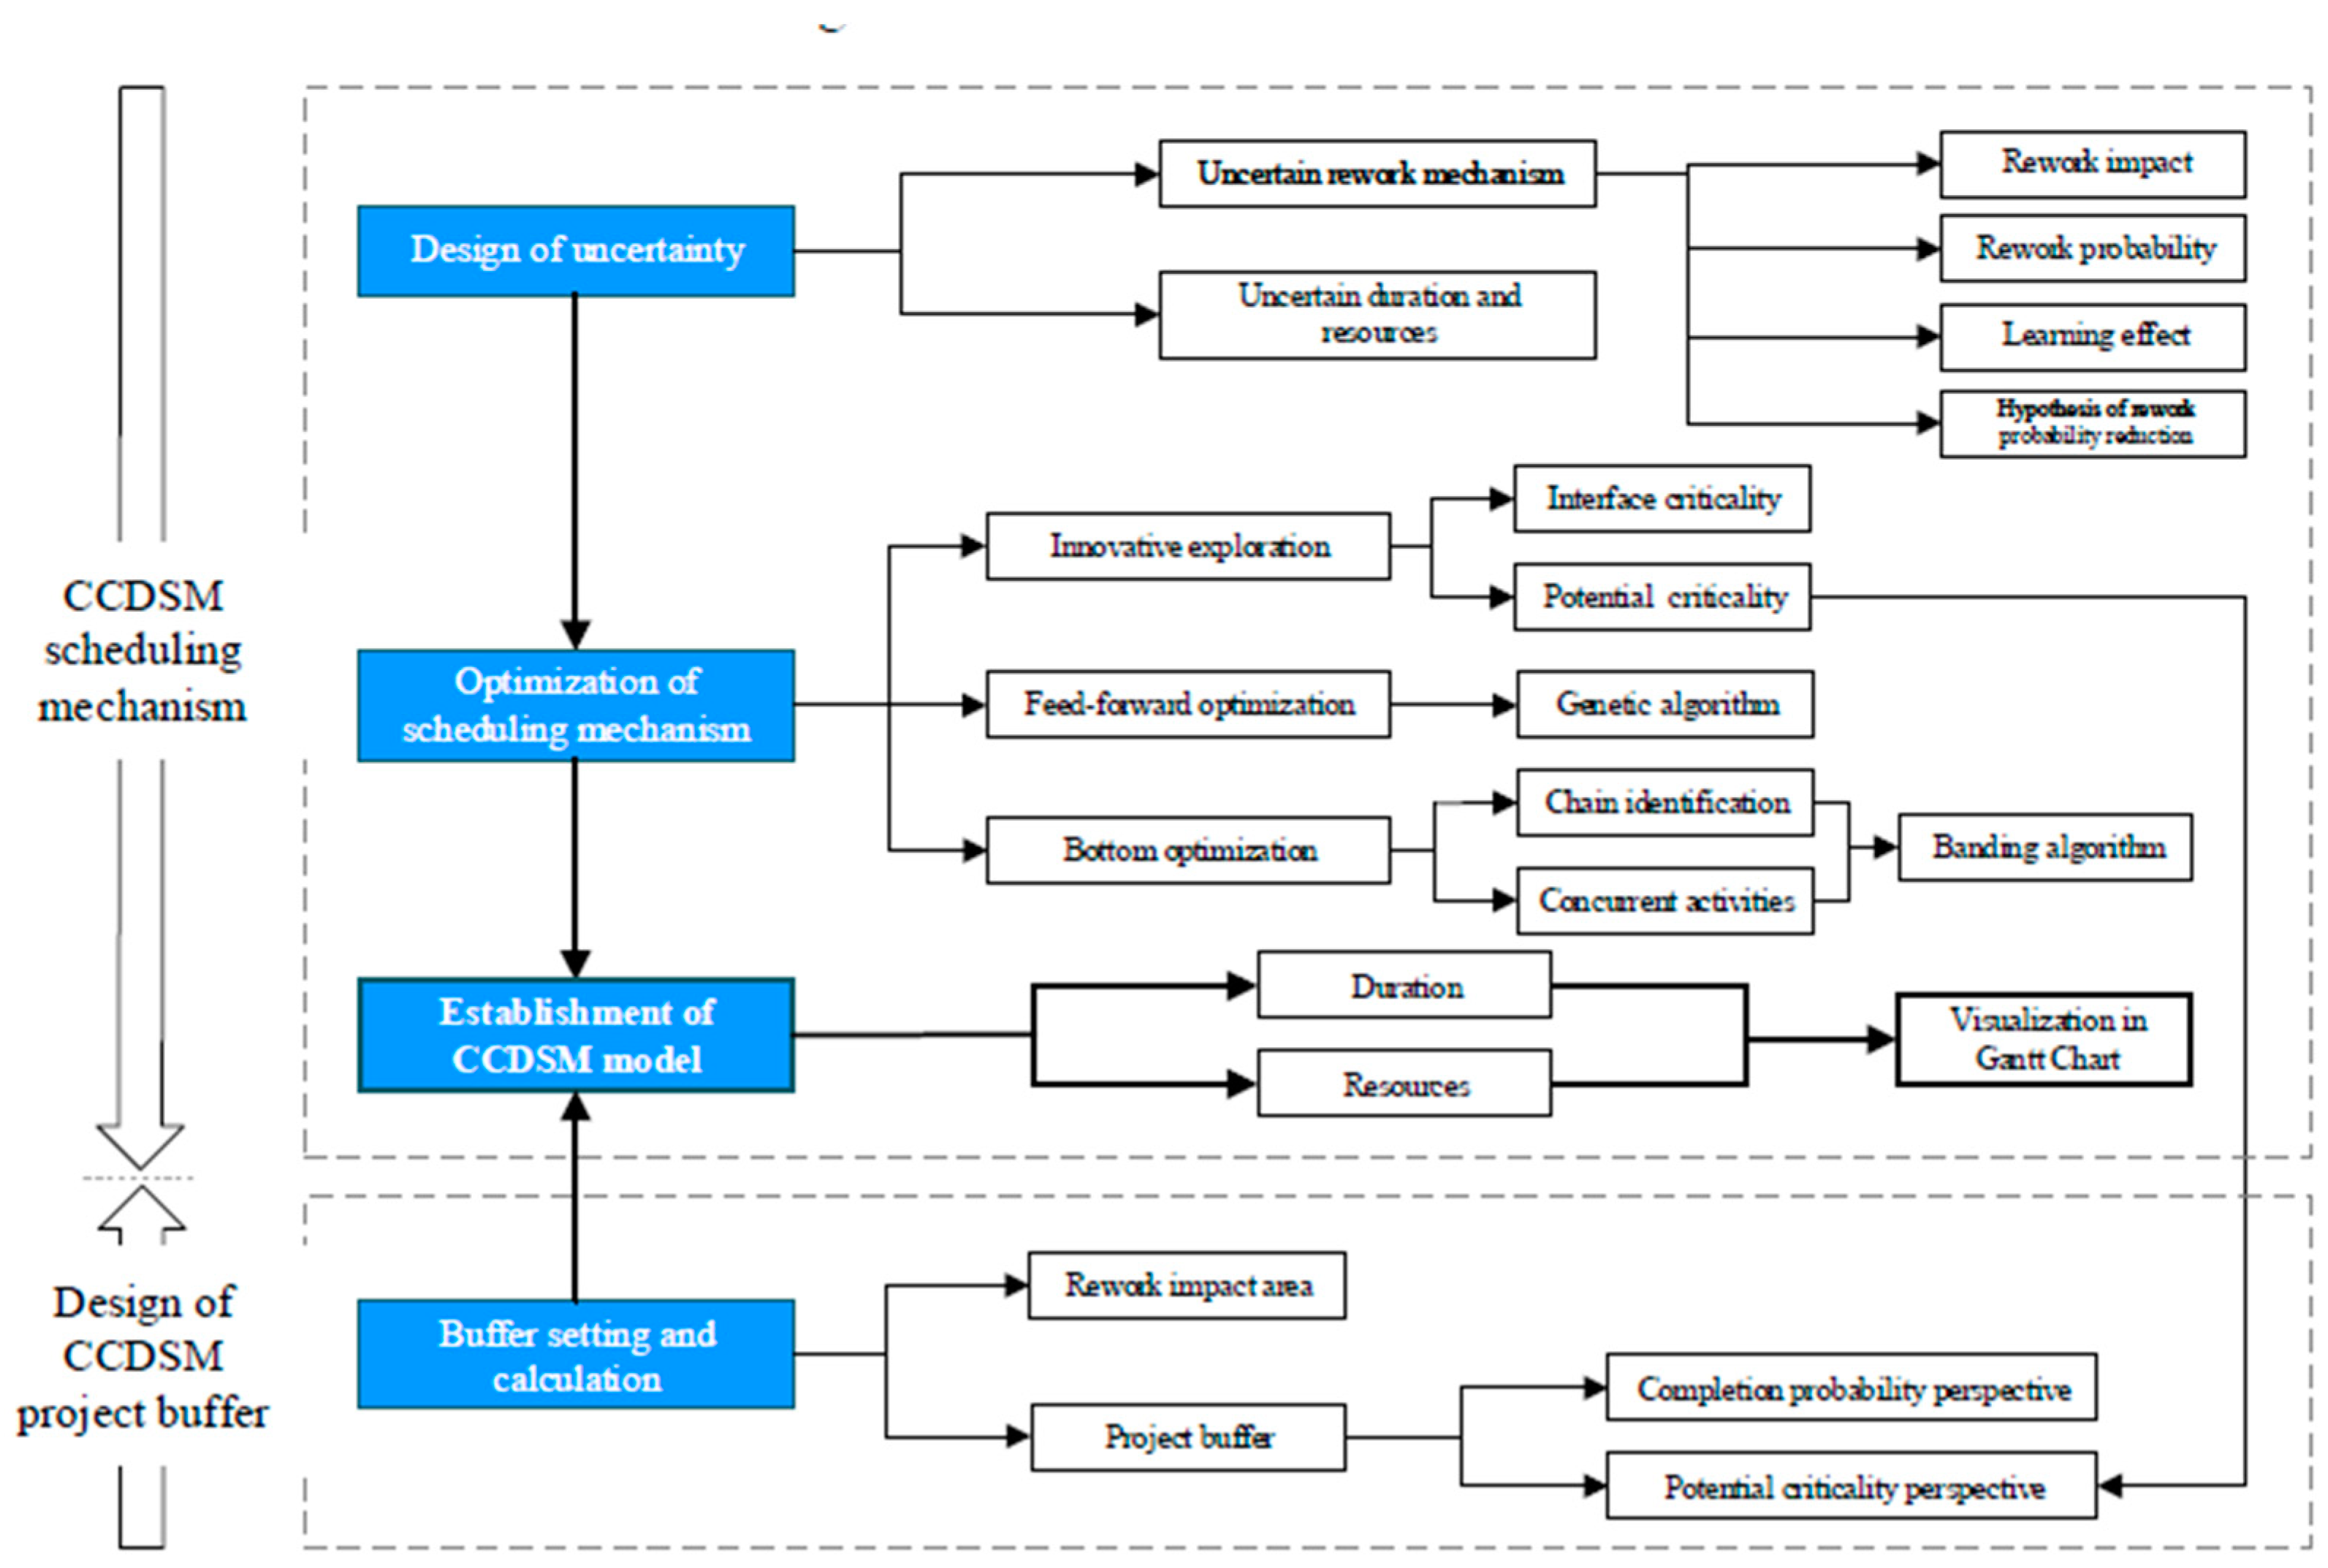
The process of implementing the improved CCDSM method has been summarized in Figure 1, which includes the modeling mechanism of CCDSM and the design of CCDSM buffer. The following part will briefly describe how to set the proposed method and what has been improved to solve the rework issue.
3.1. Modeling Mechanism under Rework Scenarios
3.1.1. Optimization of the CCDSM Modeling Mechanism
Based on the frequent description of the DSM [57], we herein define that activity information inputs are placed in the horizontal line divisions and the outputs lie in the vertical line divisions. If marks above the diagonal of the matrix appear, then a horizontal-located activity cannot begin until the assumed outputs of the above-diagonal activities are satisfied. Considering these activities have not been initiated by that time, the risk arising from disordered information interactions will be accordingly increased and activity iterations are bound to happen, which bring forth the probable rework [58]. In other words, the number of activity iterations will not be decreased unless those undesired marks can be eliminated with the help of adjusting the activity sequence. Primarily, reordering sequence of horizontal and vertical line divisions is the most common and efficient approach when dealing with predetermined activity orders in the DSM model. By taking advantage of the genetic algorithm applied into the CCDSM model, the mentioned sequencing of DSM, included by a NP-hard (non-deterministic polynomial) problem can be furtherly solved to develop feedforward optimization of the overlapping relationships between activities [59,60]. Therefore, the main purpose of reordering activities is to shorten the rework duration and minimize the number of activities affected by rework. In addition, the model brings in a reengineering approach, named a banding algorithm to identify the “bands” of concurrent activities. As first raised by Grose [61], the banding algorithm helps to bind those contiguous elements of activities in aggregate as bands, which stand for the opportunities to accomplish some activities concurrently or in parallel so that iterations are supposed to be minimized and the final duration can be deeply shortened.
3.1.2. Interface Criticality
Actually, almost all projects’ configurations can be treated as stochastic networks, which thereby makes each activity within the network possible to become a critical activity in theory. Therefore, the critical chain made up of some critical activities and identified by CPM or CCPM has attracted most attention herein this study. More specifically, we introduce interface criticality and extend it to potential criticality for deep research. From the perspective of information interaction, Browning and Eppinger [55] have measured the criticality on the interface of DSM and defined it as interface criticality. Furthermore, two detail types of interface criticality, including duration interface criticality and resource interface criticality, are introduced. This model simplifies the positive and skewed curve function of activity duration and resources into triangular distribution. Then the most optimistic value (MOV), the most likely value (MLV) and the most pessimistic value (MPV) are selected to conduct the model. Equation (1) is the mathematical expression of duration interface criticality:
where is the duration of activity , and the duration here is expressed as MLV.
Similarly, resource interface criticality is defined as Equation (2):
where is the resource occupation of activity , and the resource here is expressed as MLV.
3.1.3. Potential Criticality
In terms of project structures, potential criticality is defined to measure the potential effect exerted by a certain activity on the entire project. From individuals to the organization, we make such definition exactly for a better sense of the interactions between activities and projects from an overall view. For each activity , we define the activity with information transmission to activity as the upstream activity of activity , and the activity with information feedback from activity as the downstream activity of activity . As Figure 2 shows, Activity 2 receives information from Activities 1 and 3, therefore, Activities 1 and 3 are upstream activities of Activity 2. While Activity 2 also sends information to Activities 1 and 3, so they are downstream activities of Activity 2. The impact area of Activity 2 is shown in Figure 2.
From the perspective of project schedule, the impact of upstream activities on activity is defined in Equation (3).
The impact of activity i on downstream activities is defined in Equation (4).
Therefore, the impact of activity i in the project, i.e., the potential criticality of duration, is defined in Equation (5).
Similarly, the mathematical expression of potential impact criticality of resource can be defined in Equation (6).
3.2. Buffer Setting and Calculation
3.2.1. Rework Impact Area
Similar to potential criticality, rework impact refers to potential rework caused by two types of information flow: Feedback input from downstream activities and information output to downstream activities. Therefore, the rework impact area measures the duration of potential rework occurrence after activity has been finished at the first time. The mathematical expression of rework impact area is shown as Equation (7).
where refers to the completion time of the first execution of activity , represents the completion time of the rework.
3.2.2. Project Buffer Calculation
A. Perspective of completion probability
Although the project buffer occupies time and resource, it provides sufficient time for the project to meet the required standard with higher completion probability.
Thus, from the perspective of completion probability, project buffer is defined in Equation (8).
where represents the duration with x% completion probability, represents the most likely value of each activity’s duration.
As for the resource consumption of project buffer, it will be allocated with the moving average of resource distribution as in Equation (9).
B. Perspective of potential criticality
Considering the similarities between the definitions of potential criticality of duration and rework impact area, the adaptive procedure with density (APD) method [62] can be a useful reference for calculating the size of project buffer as shown in Equations (10) and (11).
where refers to the potential duration criticality of activity , denotes the duration variance of activity , and represents the number of activities.
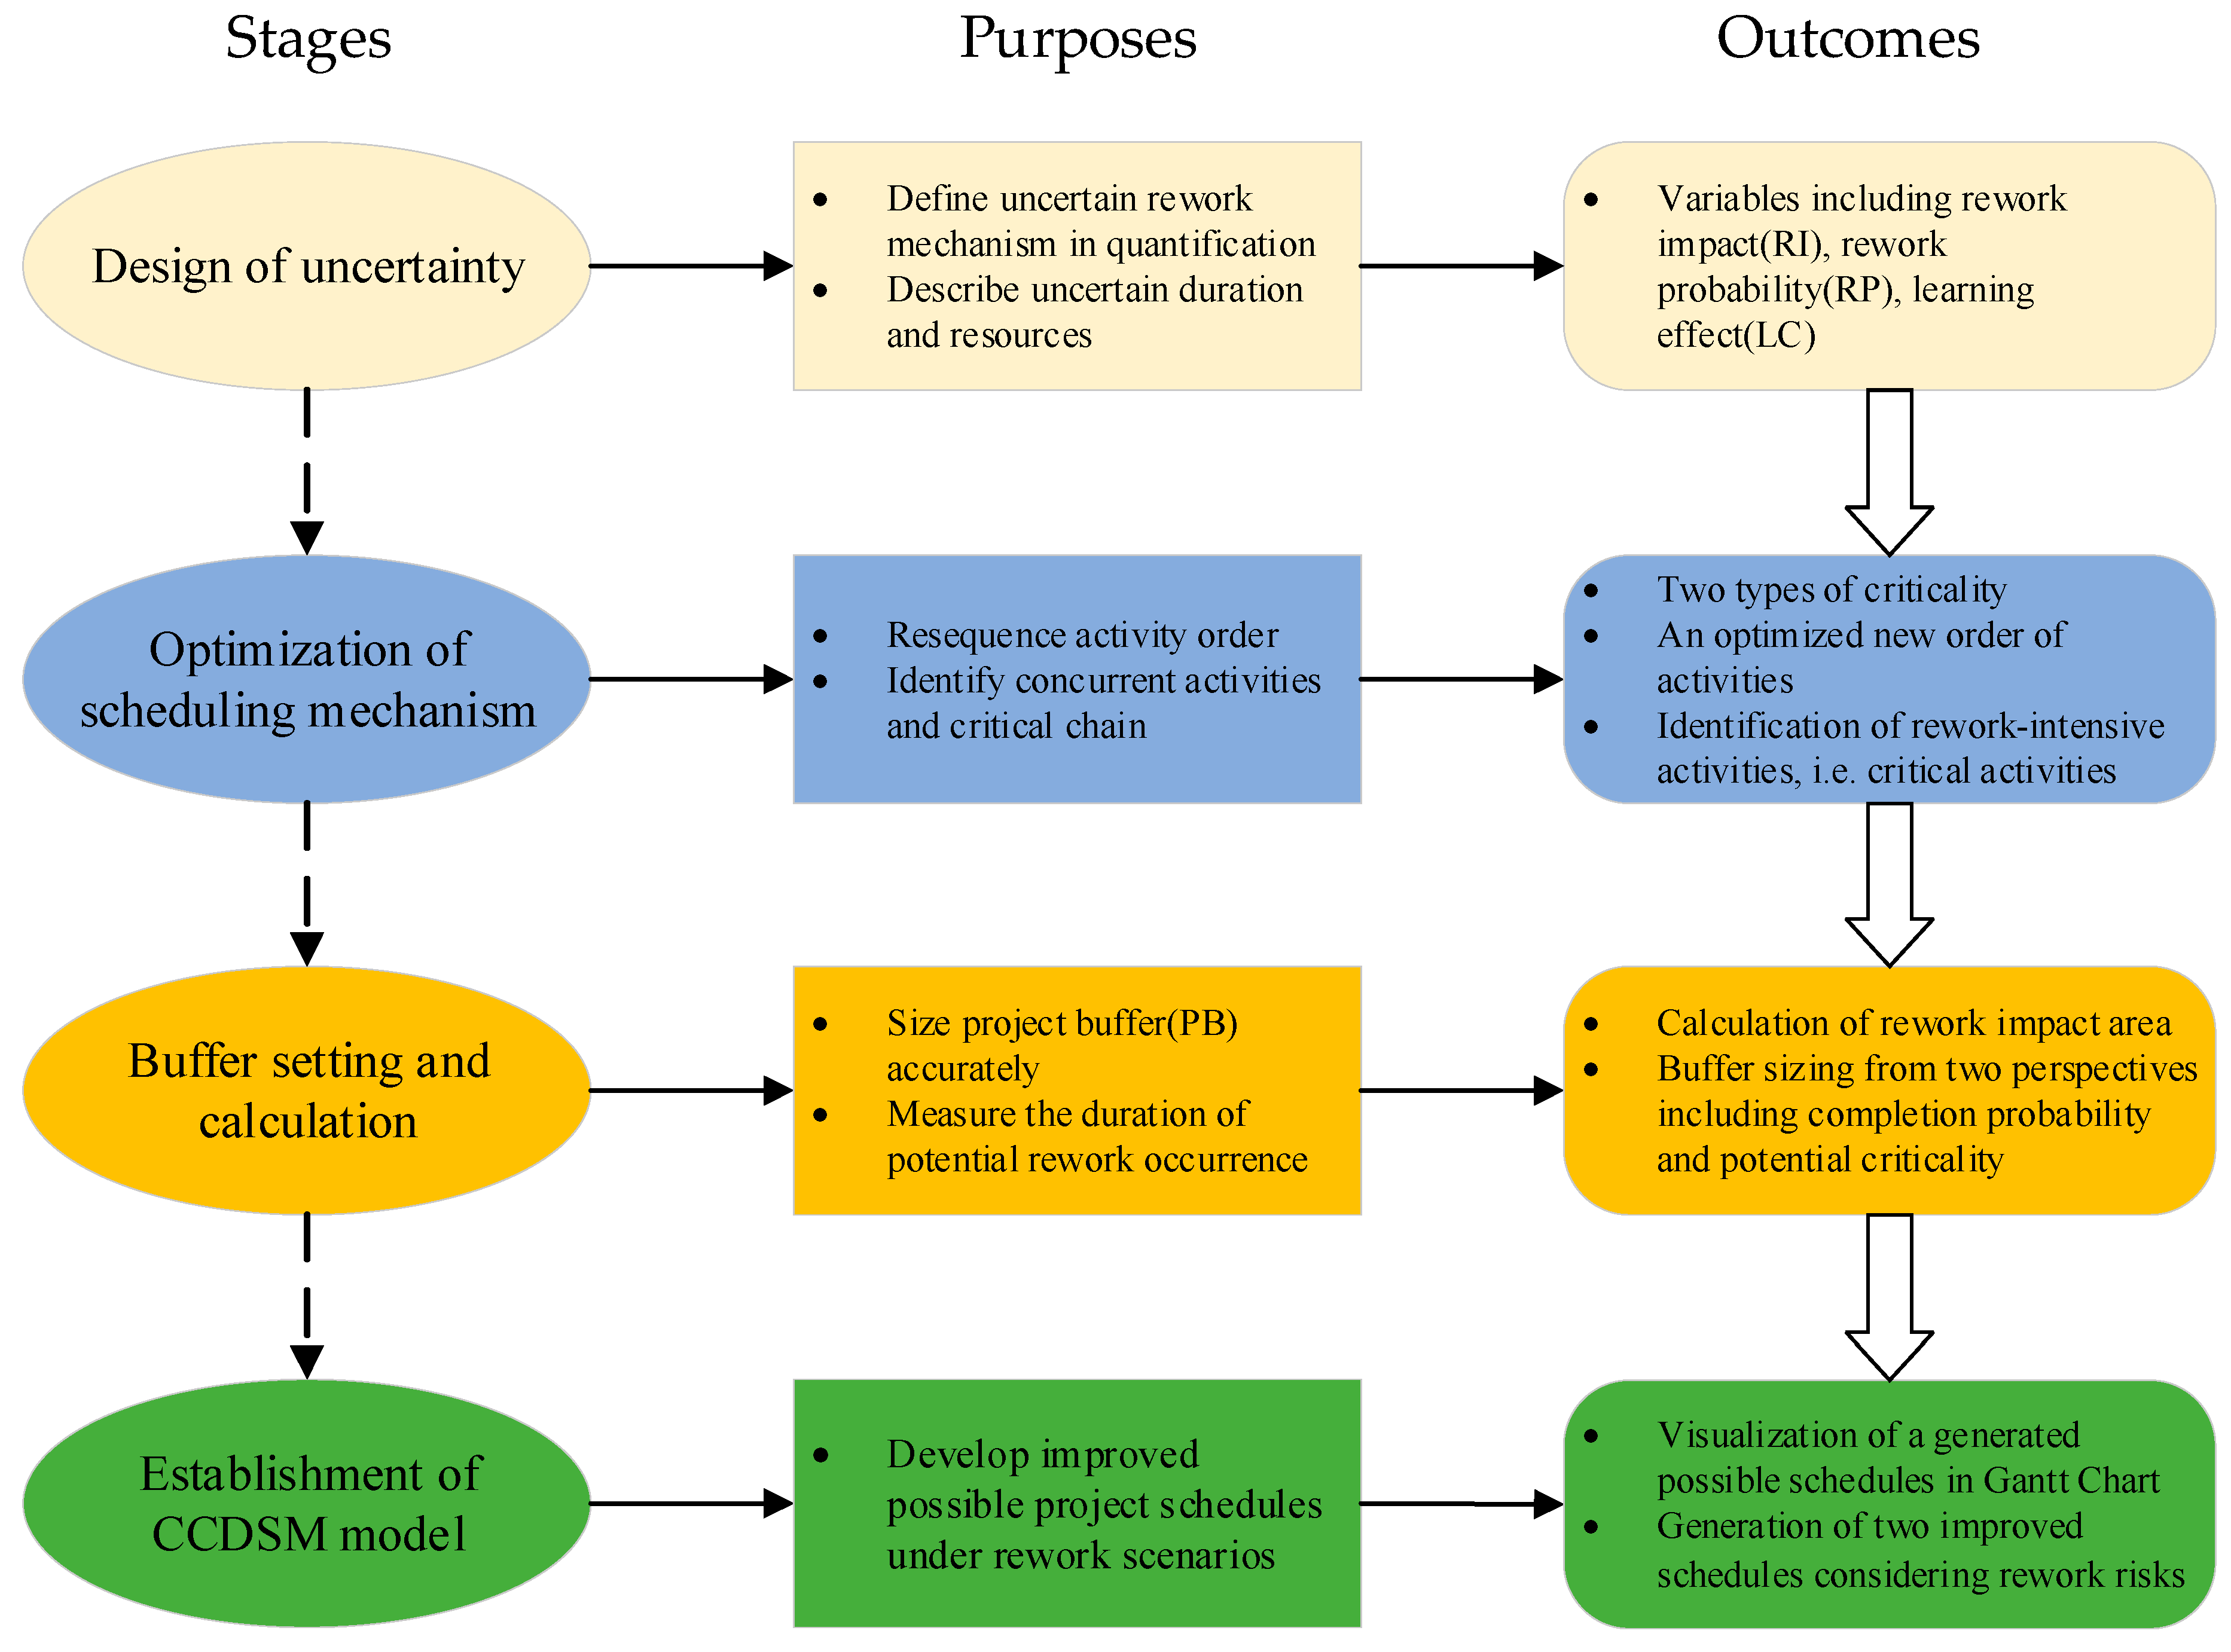
Given these points, the accurate procedure of improved CCDSM modeling has been concluded as illustrated in Figure 3, which includes two main parts and four representative stages. Particularly, the purposes and methods applied within the CCDSM scheduling are also indicated systematically for a better and clearer understanding of the overall introduced method.
4. CCDSM Based Schedule Development
4.1. Case Background
Real estate development projects particularly perform poorly in scheduling among all types of construction projects due to its high investment cost, various participants, and long duration. Geltner et al. [63] believe that reducing any uncertainty within the process is the key to improving the level of scheduling in real estate development projects. Effective controlling, integration and sharing of information in the early stage help to minimize schedule and cost risks. Similarly, commercial real estate development projects also suffer from rework risks. Such projects often cover large capital investment, long investment recovery period, and have strong sensibility to market [9,64] because of many exclusive stages like business invitation, standardization of operation, and asset improvement. Moreover, given the change of Chinese real estate regulations [65] and the structural tightening of credit policies for the real estate industry, more real estate enterprises turn to the private finance initiative (PFI) and private equity real estate (PERE) had emerged accordingly. Therefore, private equity commercial real estate development projects usually have larger scales, more involved participants, more frequent inter-organizational interactions and longer construction duration compared with traditional ones. The integration makes final projects require more cooperation and coordination among all participants, as well as more attention to the rework management and related schedule development.
4.2. Data Collection
The case project is located in Jing’an District, northern Shanghai, which is the first pure commercial office plot developed by the largest PERE company in China. The project covers an area of 80,159 square meters. Pre-project planning was carried out in May 2013. The construction period lasted for almost 20 months from April 2015 to December 2016. Besides, during the process of schedule planning in the early stage, the information transmission and feedback network was extremely complex due to the involvement of various participants, so the complexity and workload of the scheduling tasks were both challenging for the company.
Partial data from this project is excerpted from the “strong coupling” part of the original schedule, i.e., the feasibility study and planning and design phase which has been concluded by applying ADePT software. Due to the benefit from this technical force, 25 activities have been identified to have the most frequent and complex information interactions between each other and play major roles in causing uncertain rework, which has a huge impact on whether the project can meet its deadline. Based on the introduction and records about each activity from the planned schedule, detail parameters have been collected covering duration and resource consumption, as shown in Table 1.
In order to figure out the accurate information interactions between activities, the research team approached officials that had ever joined the selected project. Discussions and interviews were also conducted with relevant experts and professionals by the authors. As a result, the above research efforts led to discussions with 25 interviewees. However, it was found that only eight of these 25 people were sufficiently familiar with the interweaving mechanism between project activities. Finally, the research team managed to get support from five of these experts for in-depth interviews. Profiles of these five experts are shown in Appendix A. It was observed that it was not easy to approach all involved experts. Given the selected experts were all from authoritative departments or organizations, it was considered that analysis driven by their opinions in this research would make sense in spite of the difficulty of communicating with all the experts.
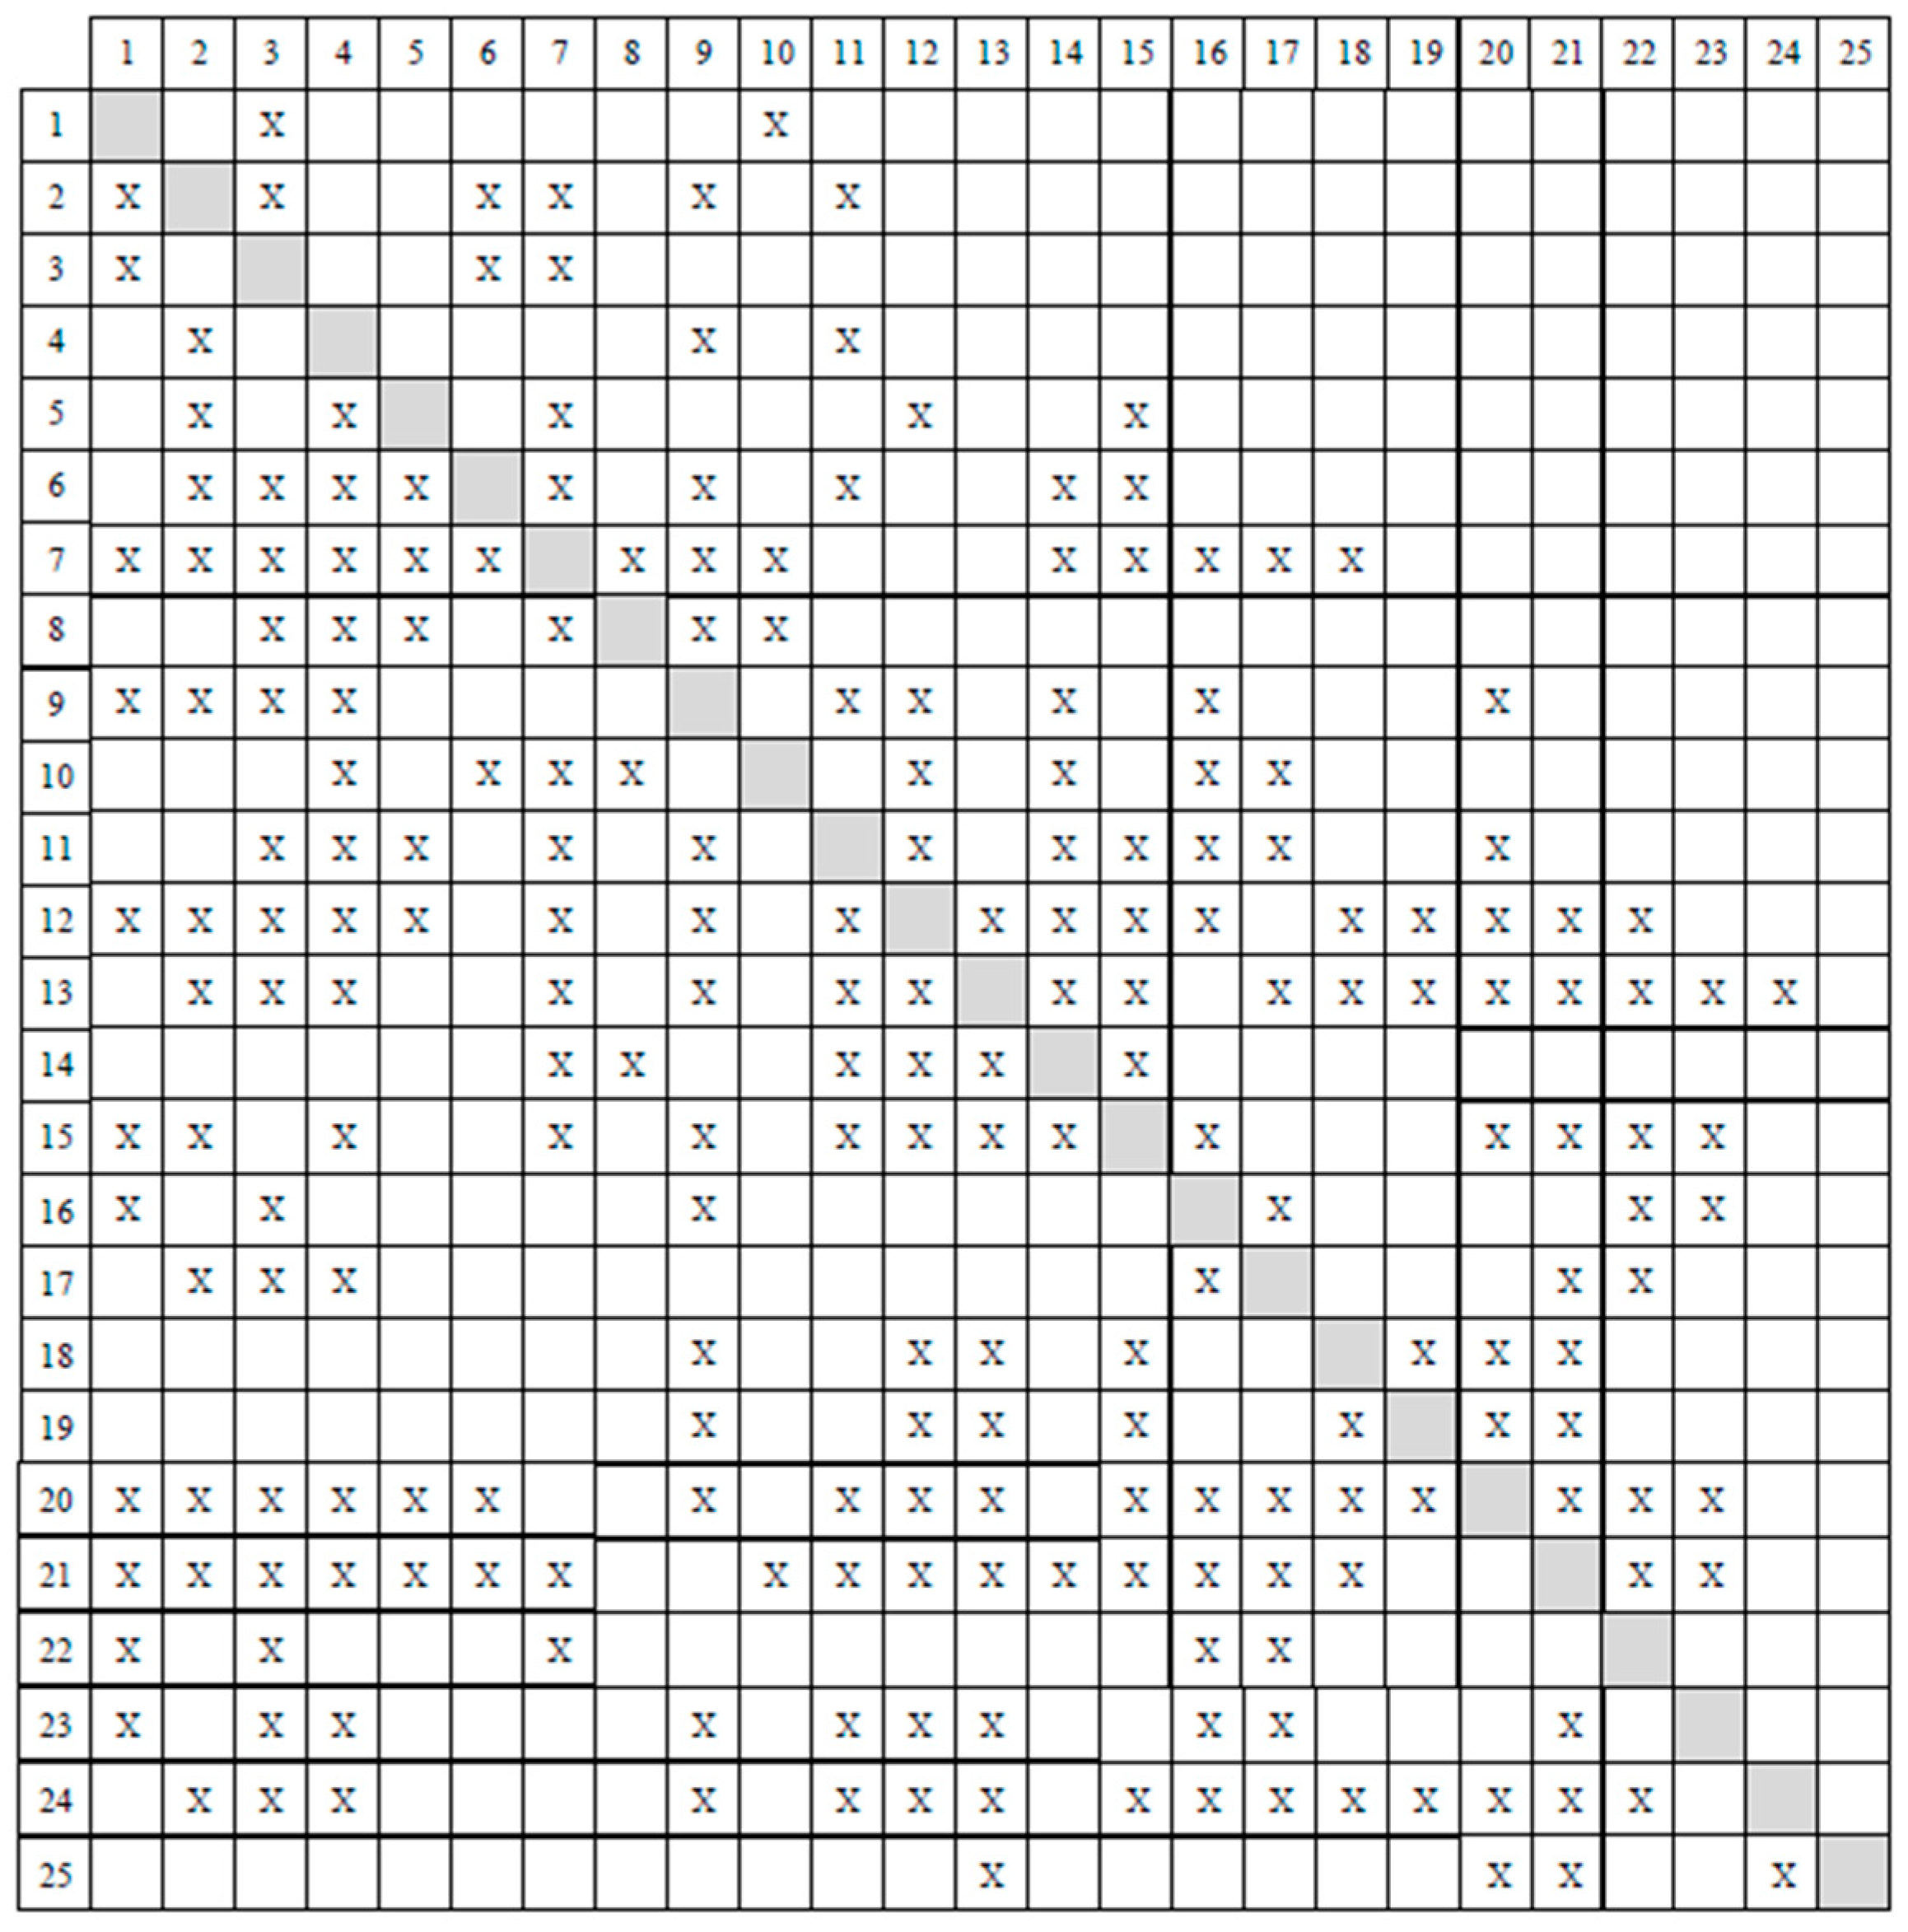
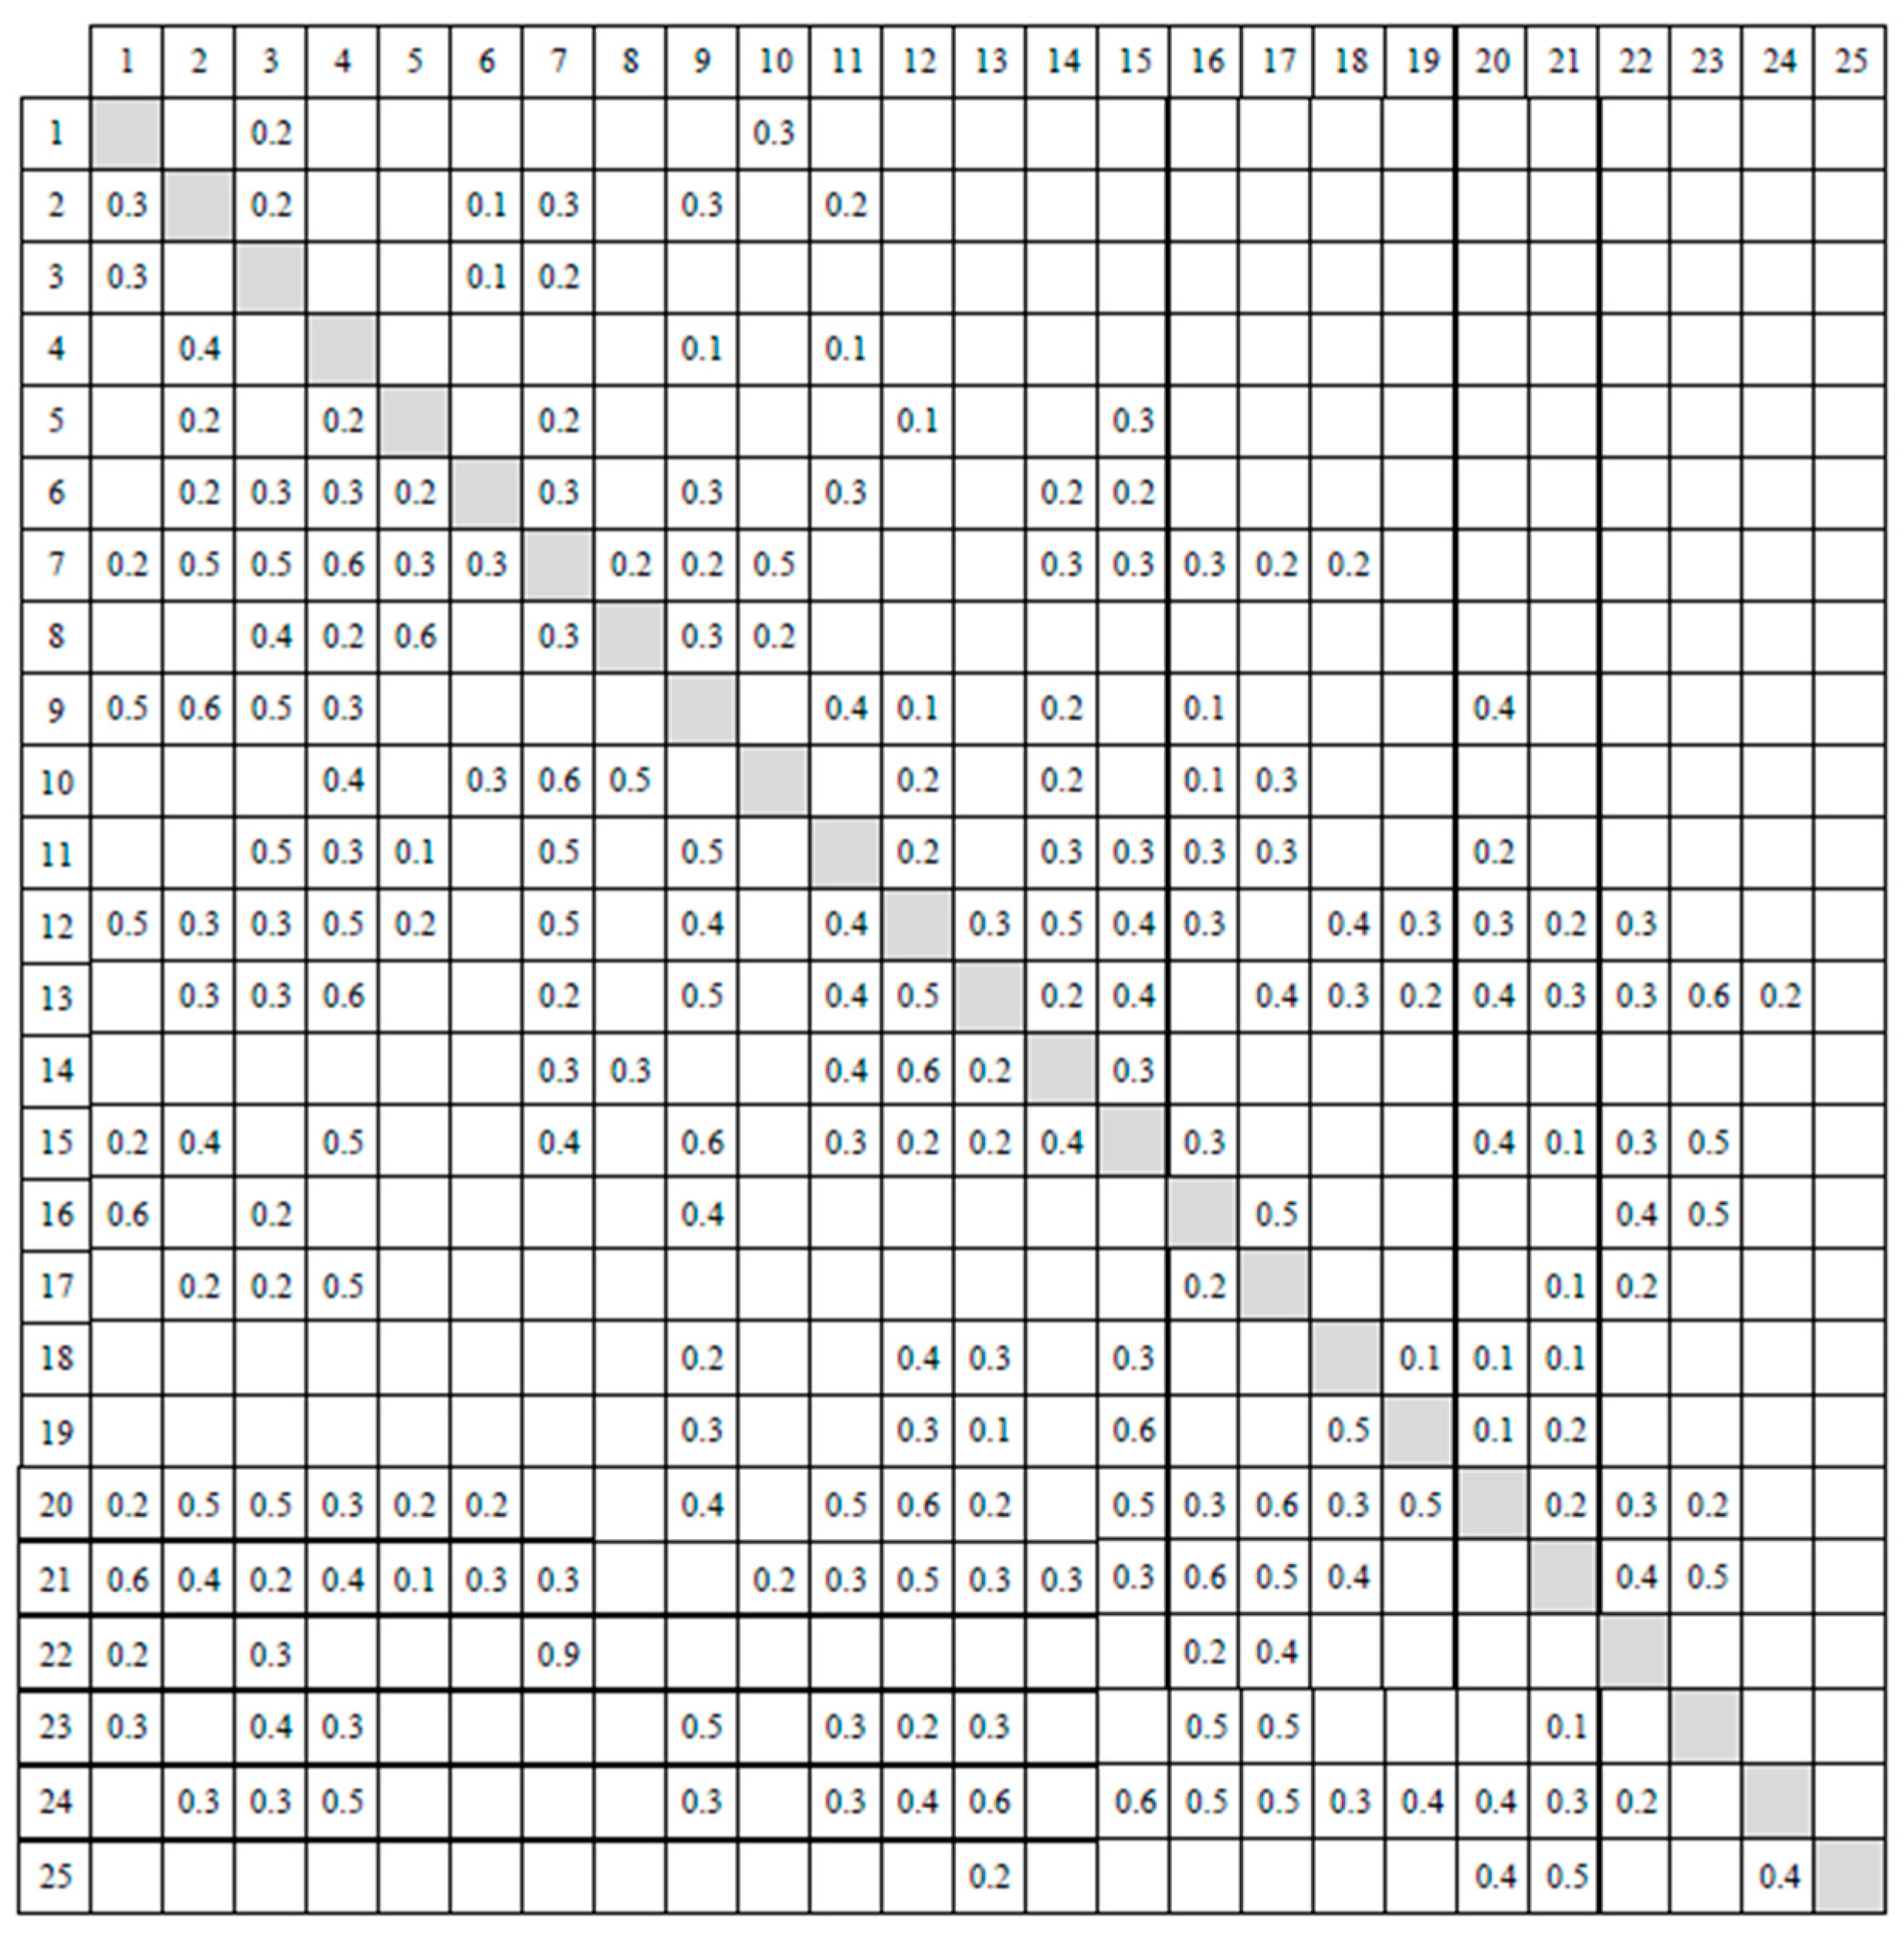
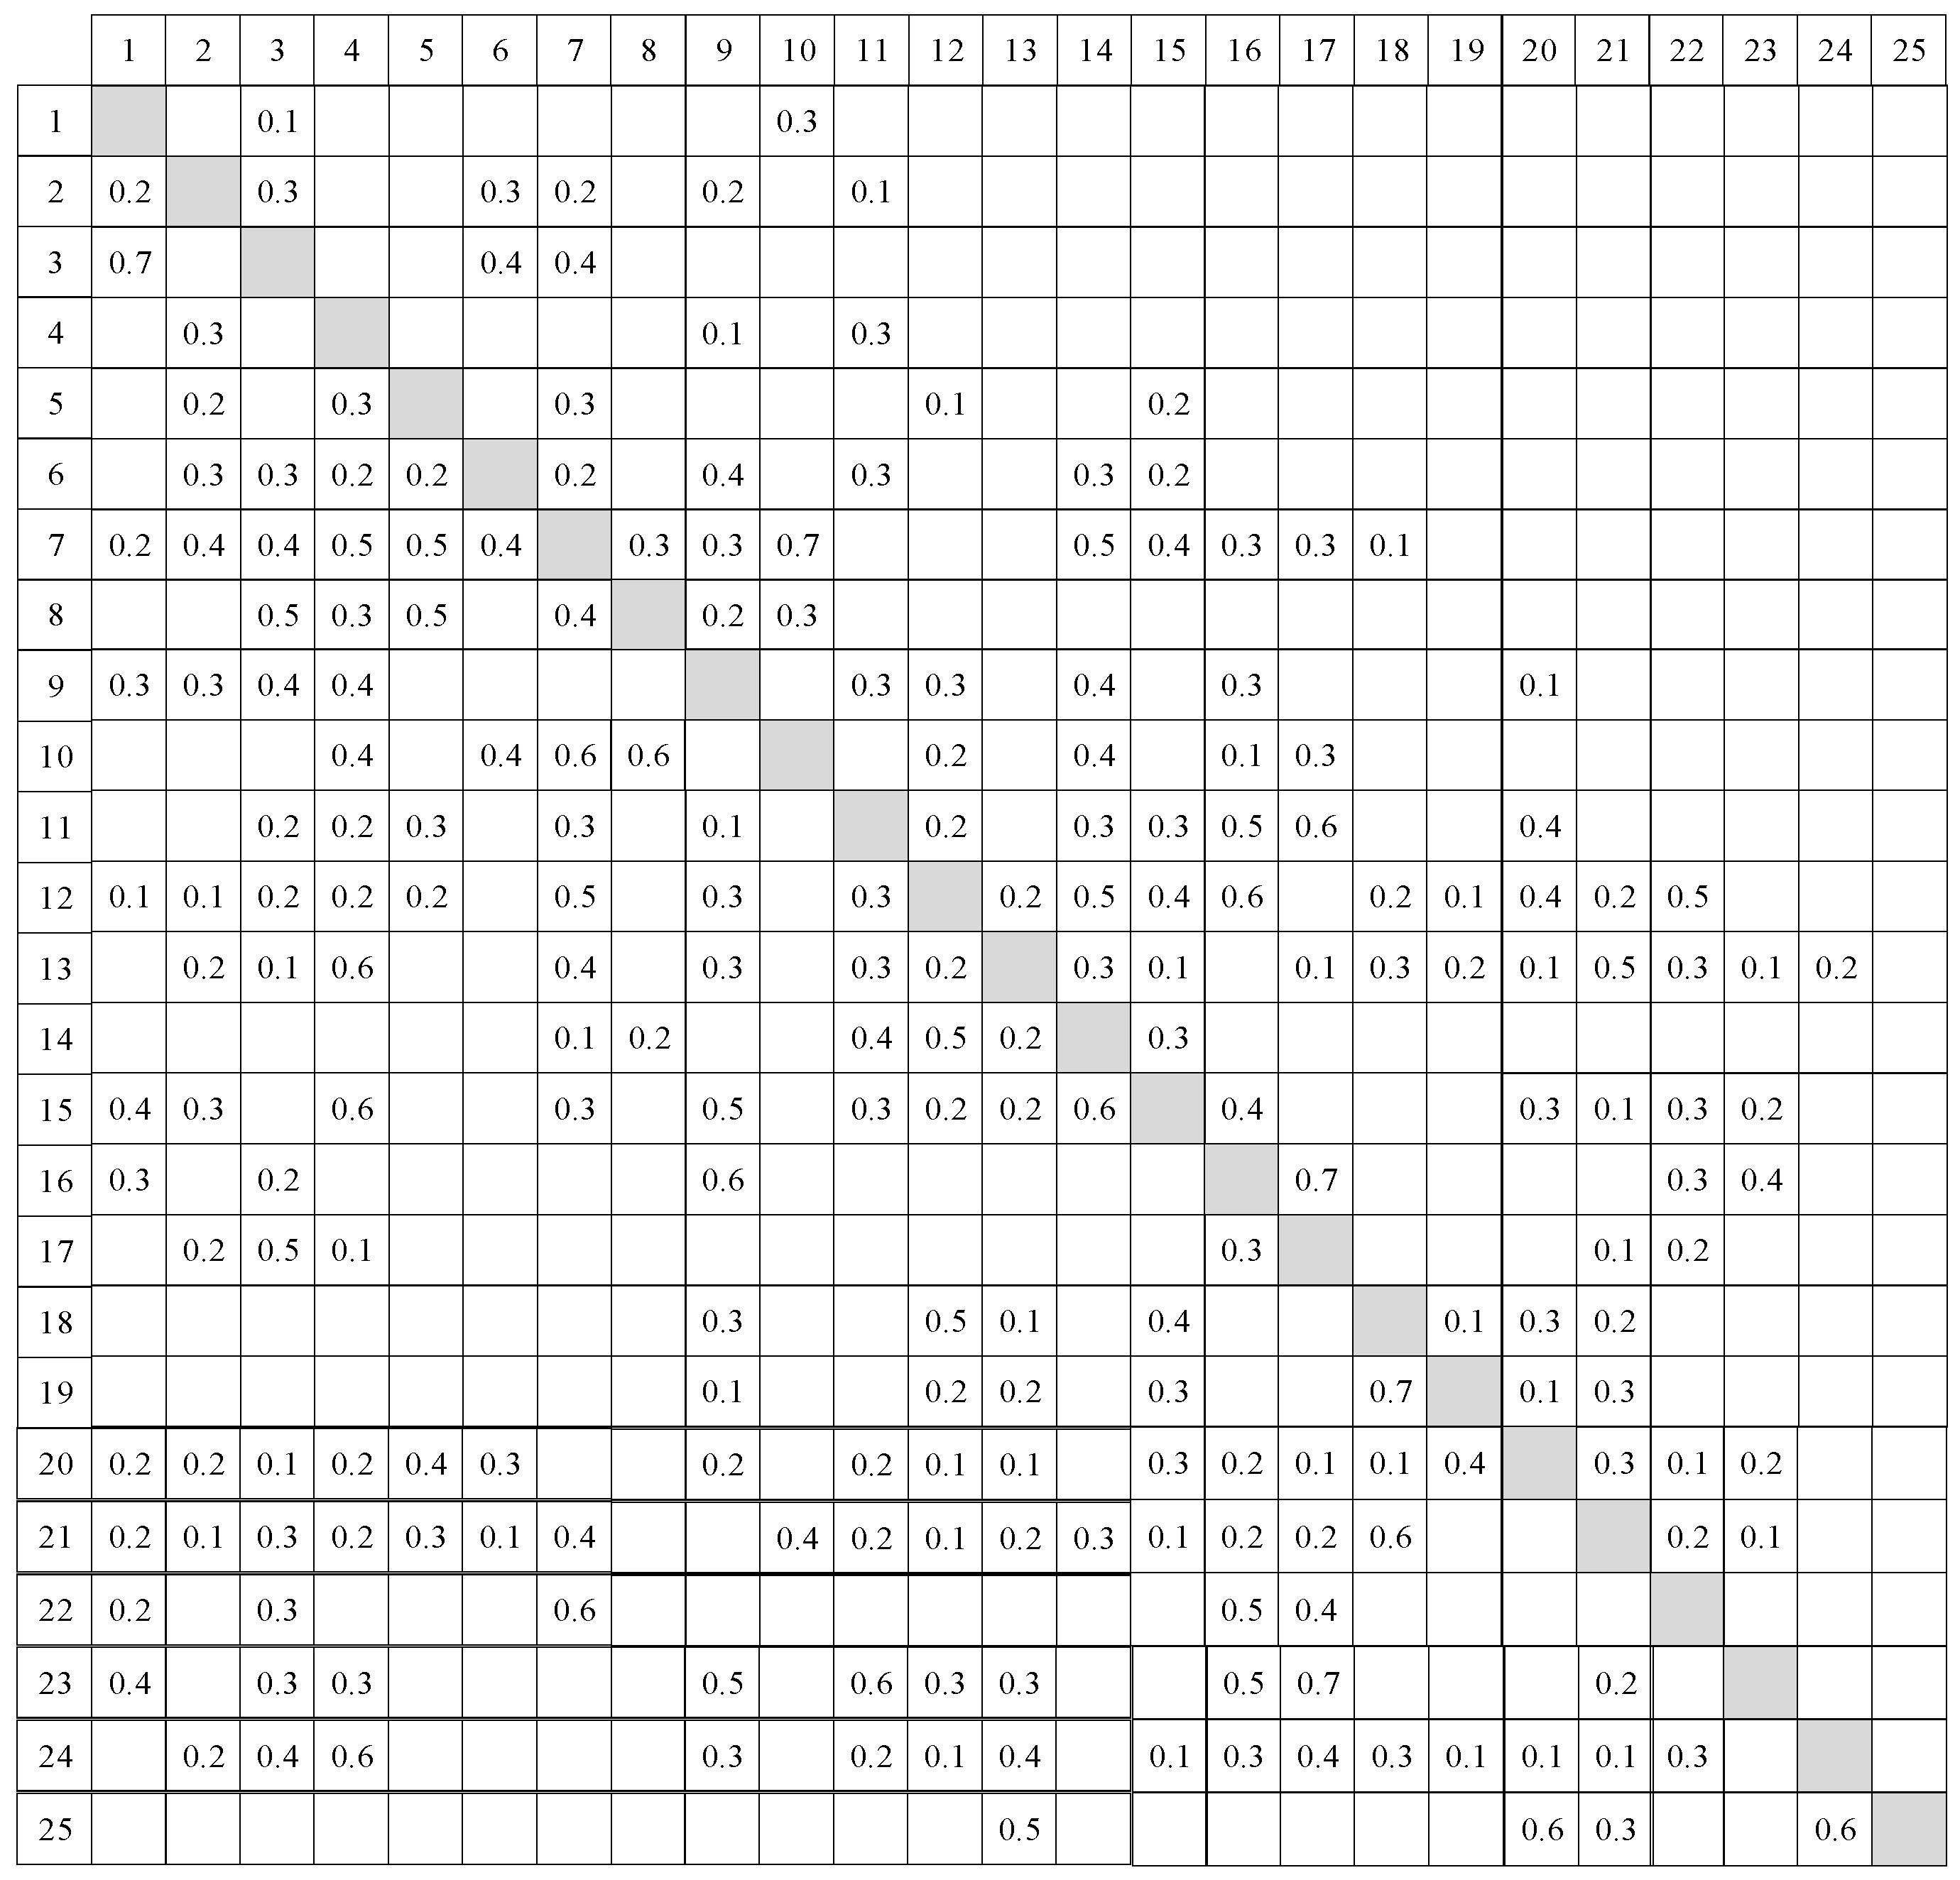
The research team designed a structured questionnaire to acquire the experts’ opinions. The five interviewed experts were asked to conduct a pairwise comparison of 25 activities by answering the questions “Do you think there is an information interaction between activity i and j? If the answer is yes, please give the number of the probability and impact of this potential interaction.” To ensure a precise understanding, we supplemented brief explanations of each activity with the questionnaire. As is acknowledged in previous literature, “the minority gives way to the majority”, such principle is often referred as the basis when integrating different opinions. However, it brings about the omission of a few minor but existing suggestions in the meantime. Therefore, the final outcome was confirmed when all experts reach an agreement. The received information was analyzed carefully and necessary corrections were made to ensure the reliability and validity of the data. As a result, the design structure matrix of information interactions between activities and the related RP matrix and RI matrix are concluded in Figure 4, Figure 5 and Figure 6. As shown in Figure 4, markers in the lower triangular of the matrix mean that there is an information transmission and markers in the upper triangular mean that there is an information feedback. The matrix uses “×” rather than numbers to mark the information interactions between activities. As shown in Figure 5, RP (2, 6) = 0.1 means that Activity 6 will provide Activity 2 with information feedback and the probability of caused rework of Activity 2 is 10%. As shown in Figure 6, RI (2, 6) = 0.3 means that if the mentioned rework of Activity 2 occurs, it will occupy 30% of the total duration of Activity 2.
4.3. Process and Results
The project’s initial data includes the RP matrix, the RI matrix, duration and resource skewed triangular probability distribution function and learning curve array. The CCDSM algorithm is programmed in the environment of MATLAB R2018a, which is more efficient and effective in simulation than traditional DSM programming platforms.
There are 228 activities overlapping relationships in 600 accessible paths for information interactions, which fully prove the complexity of the selected project. In this section, the applicability of proposed model will be validated in the following steps.
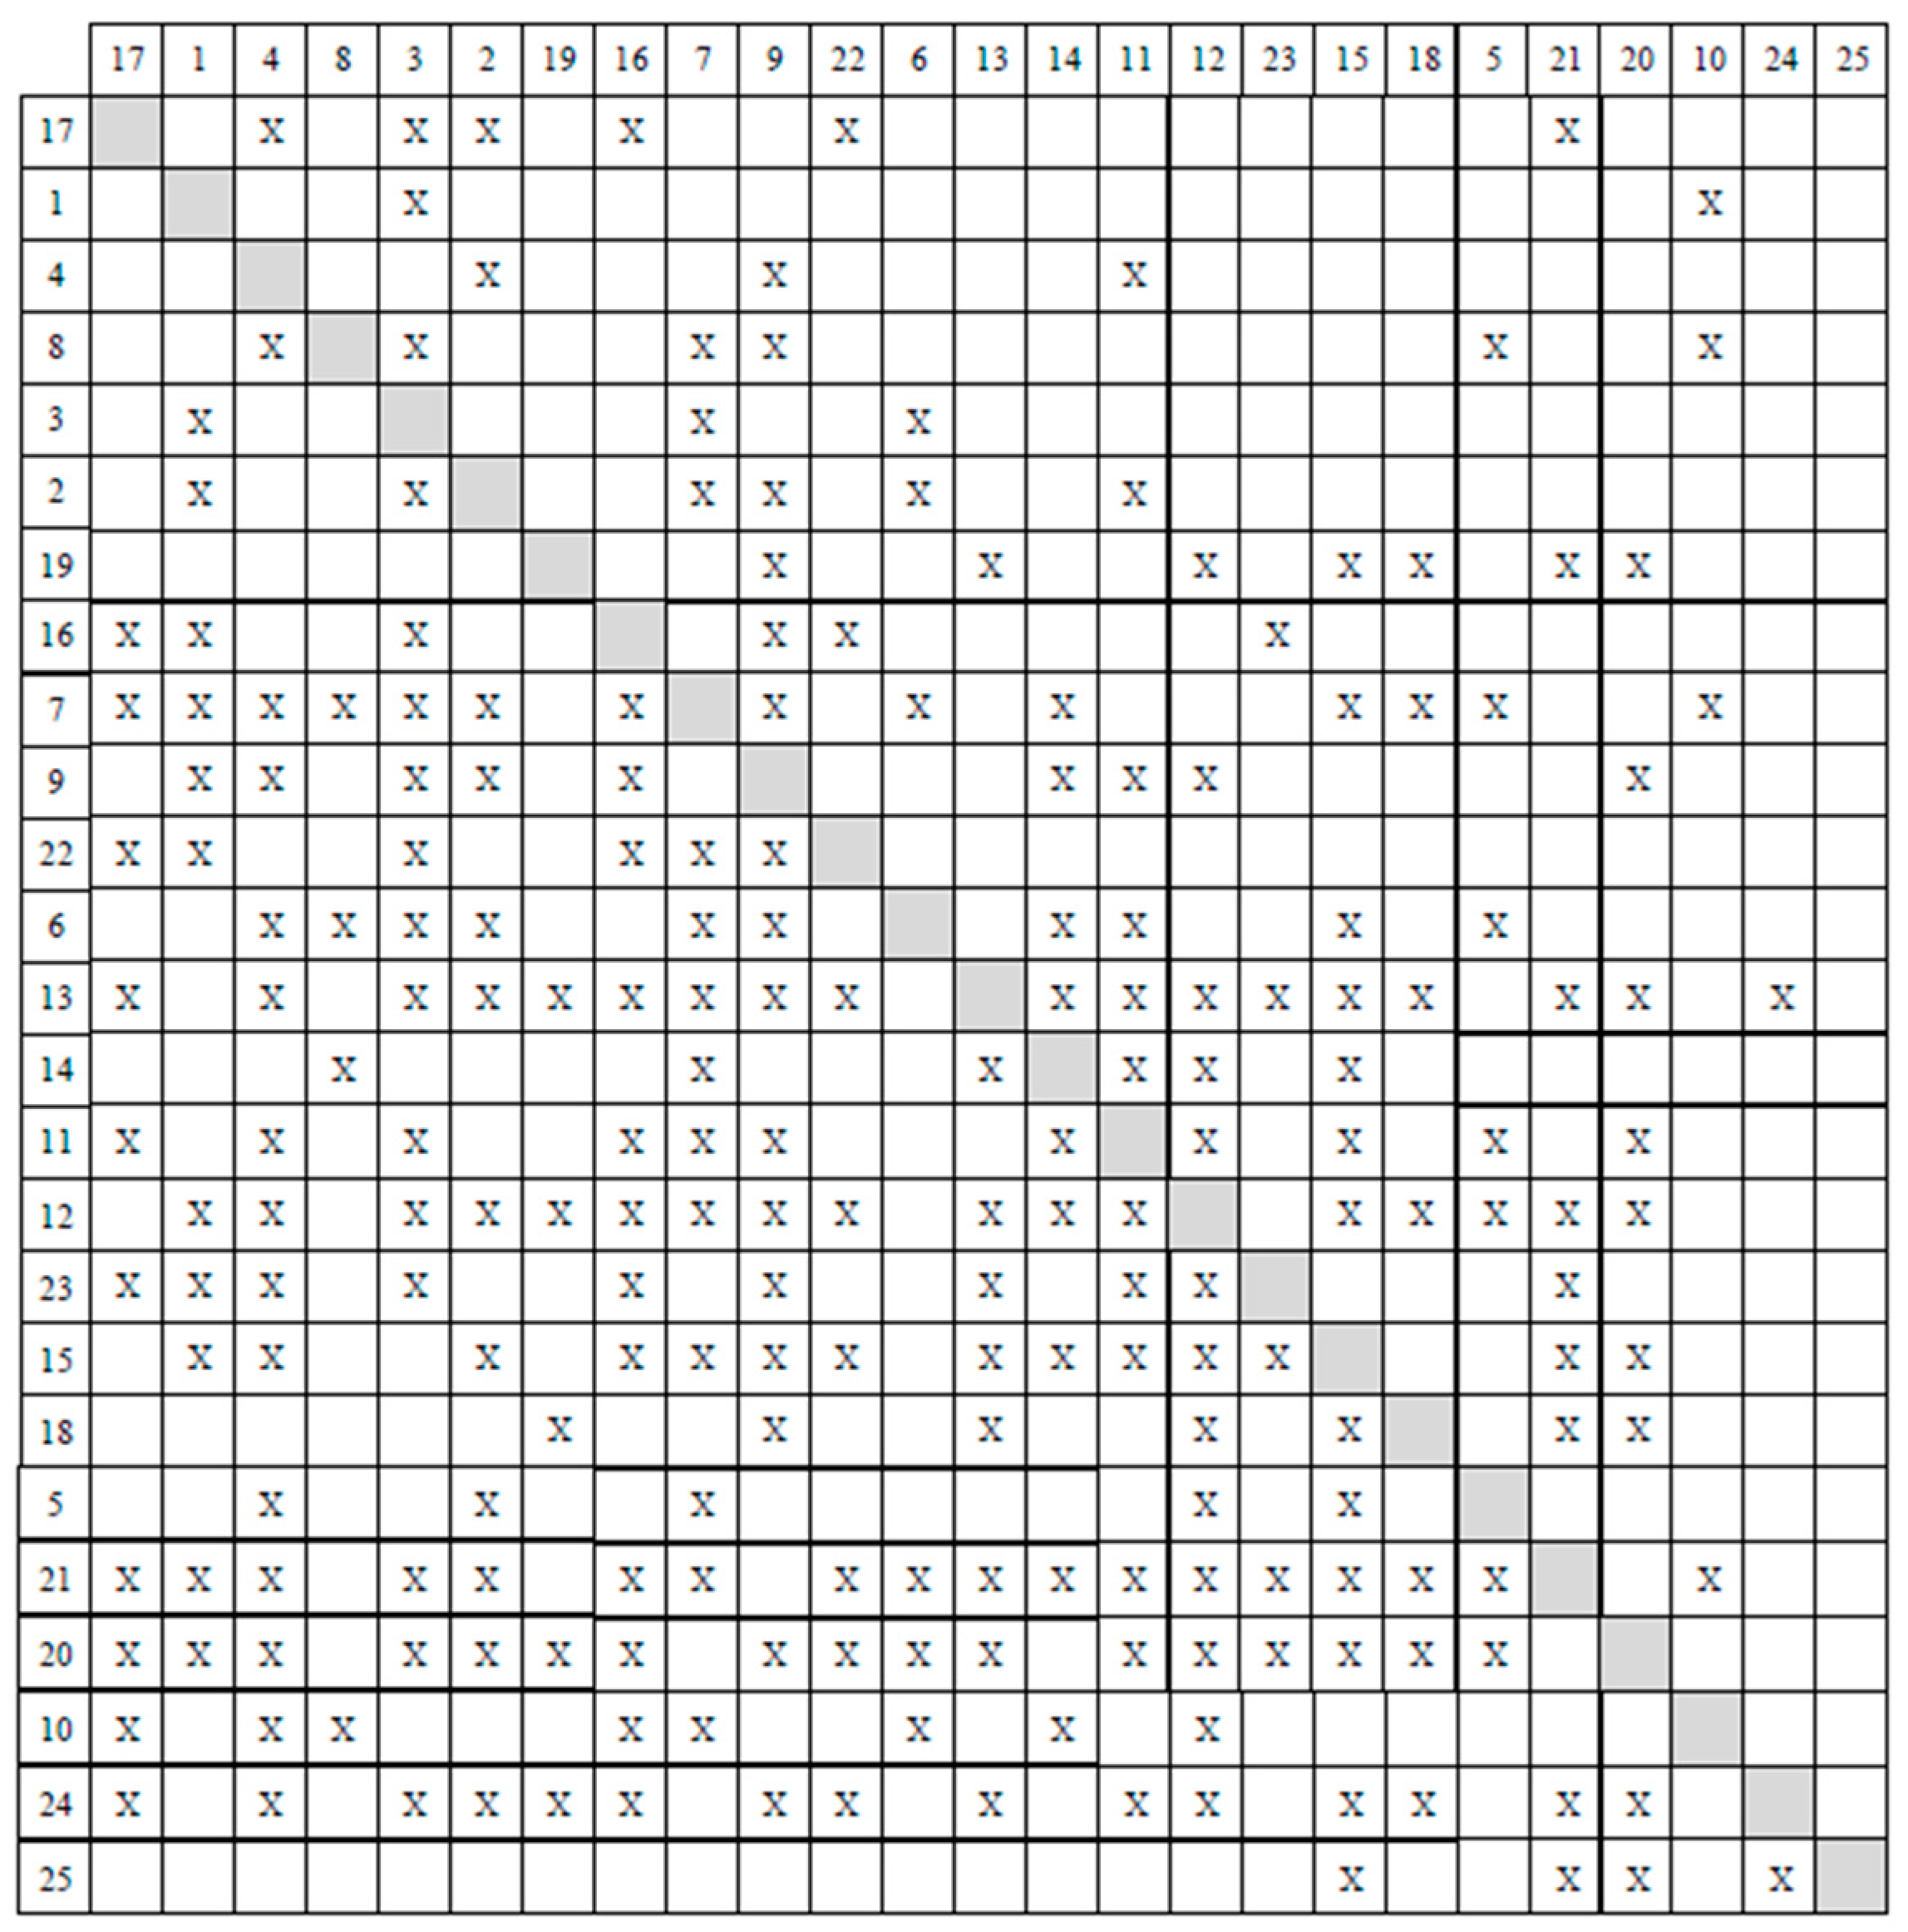
Step 1: Input the above data into the CCDSM model and reorder the initial CCDSM matrix with genetic algorithm, as shown in Figure 7.
The new activity sequence is shown as below.
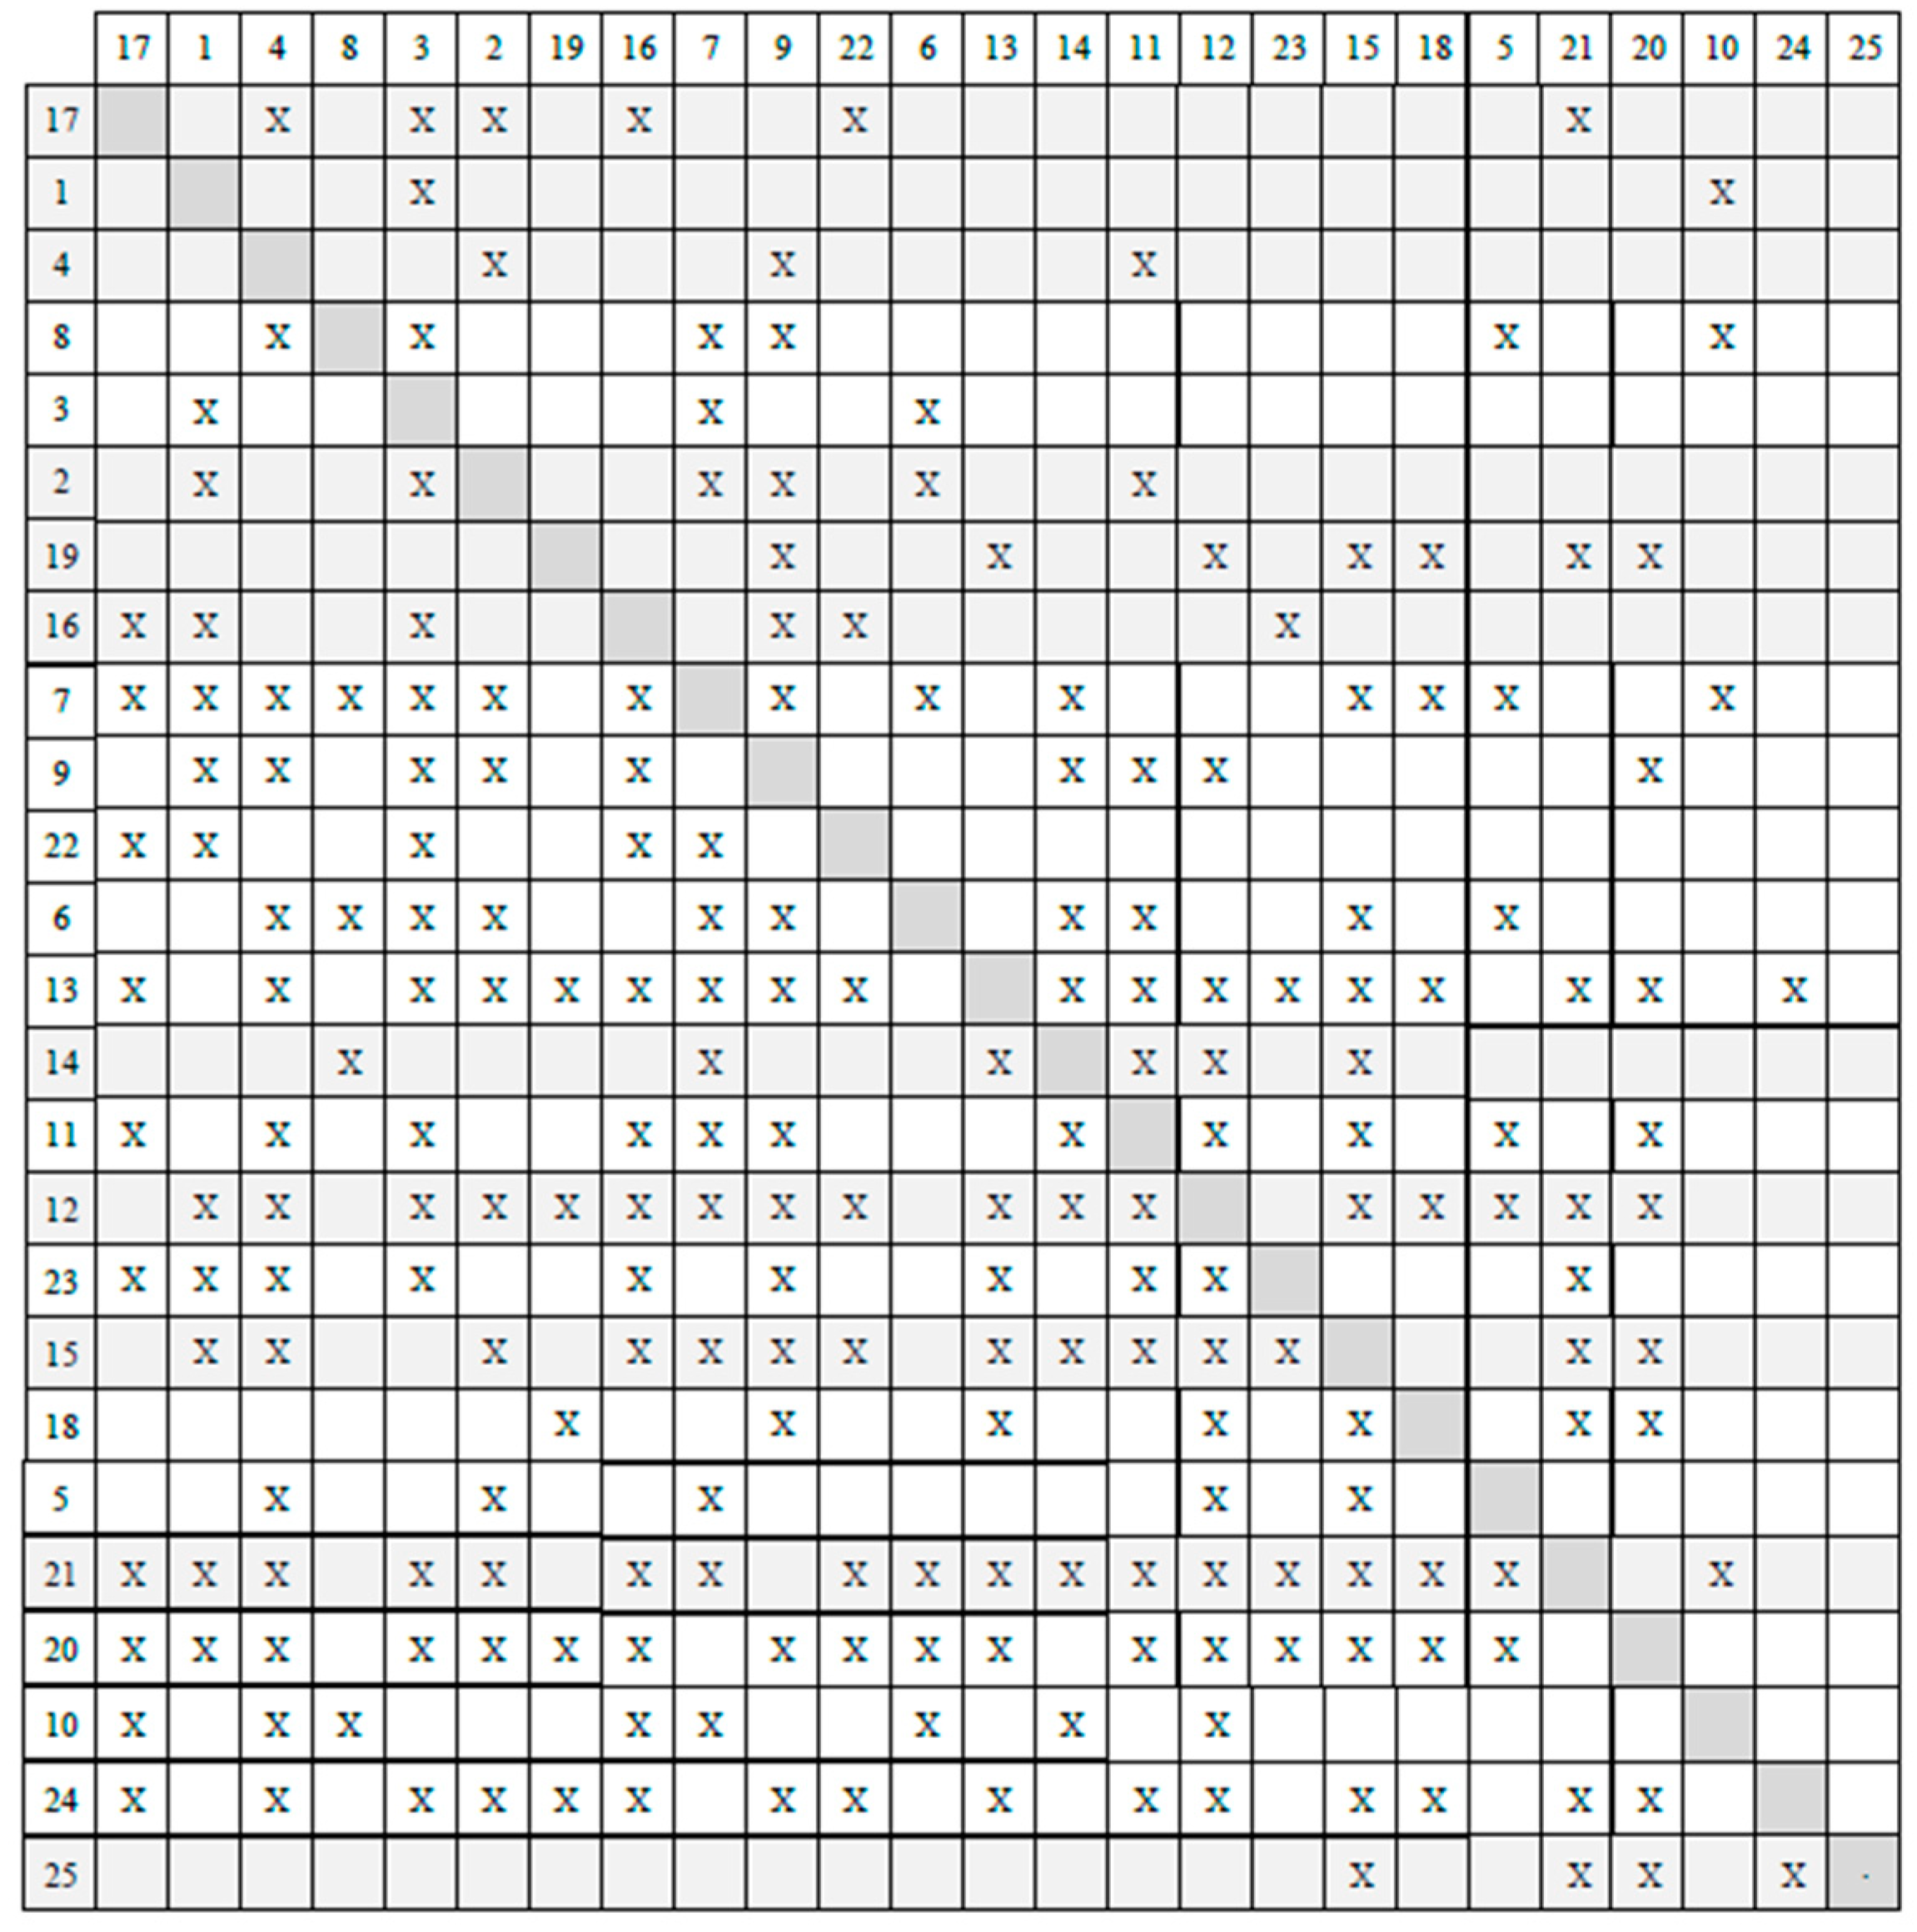
Step 2: Optimize the new CCDSM matrix and identify the critical chain with a banding algorithm as shown in Figure 8.
Therefore, the critical chain based on MLV was as follows:
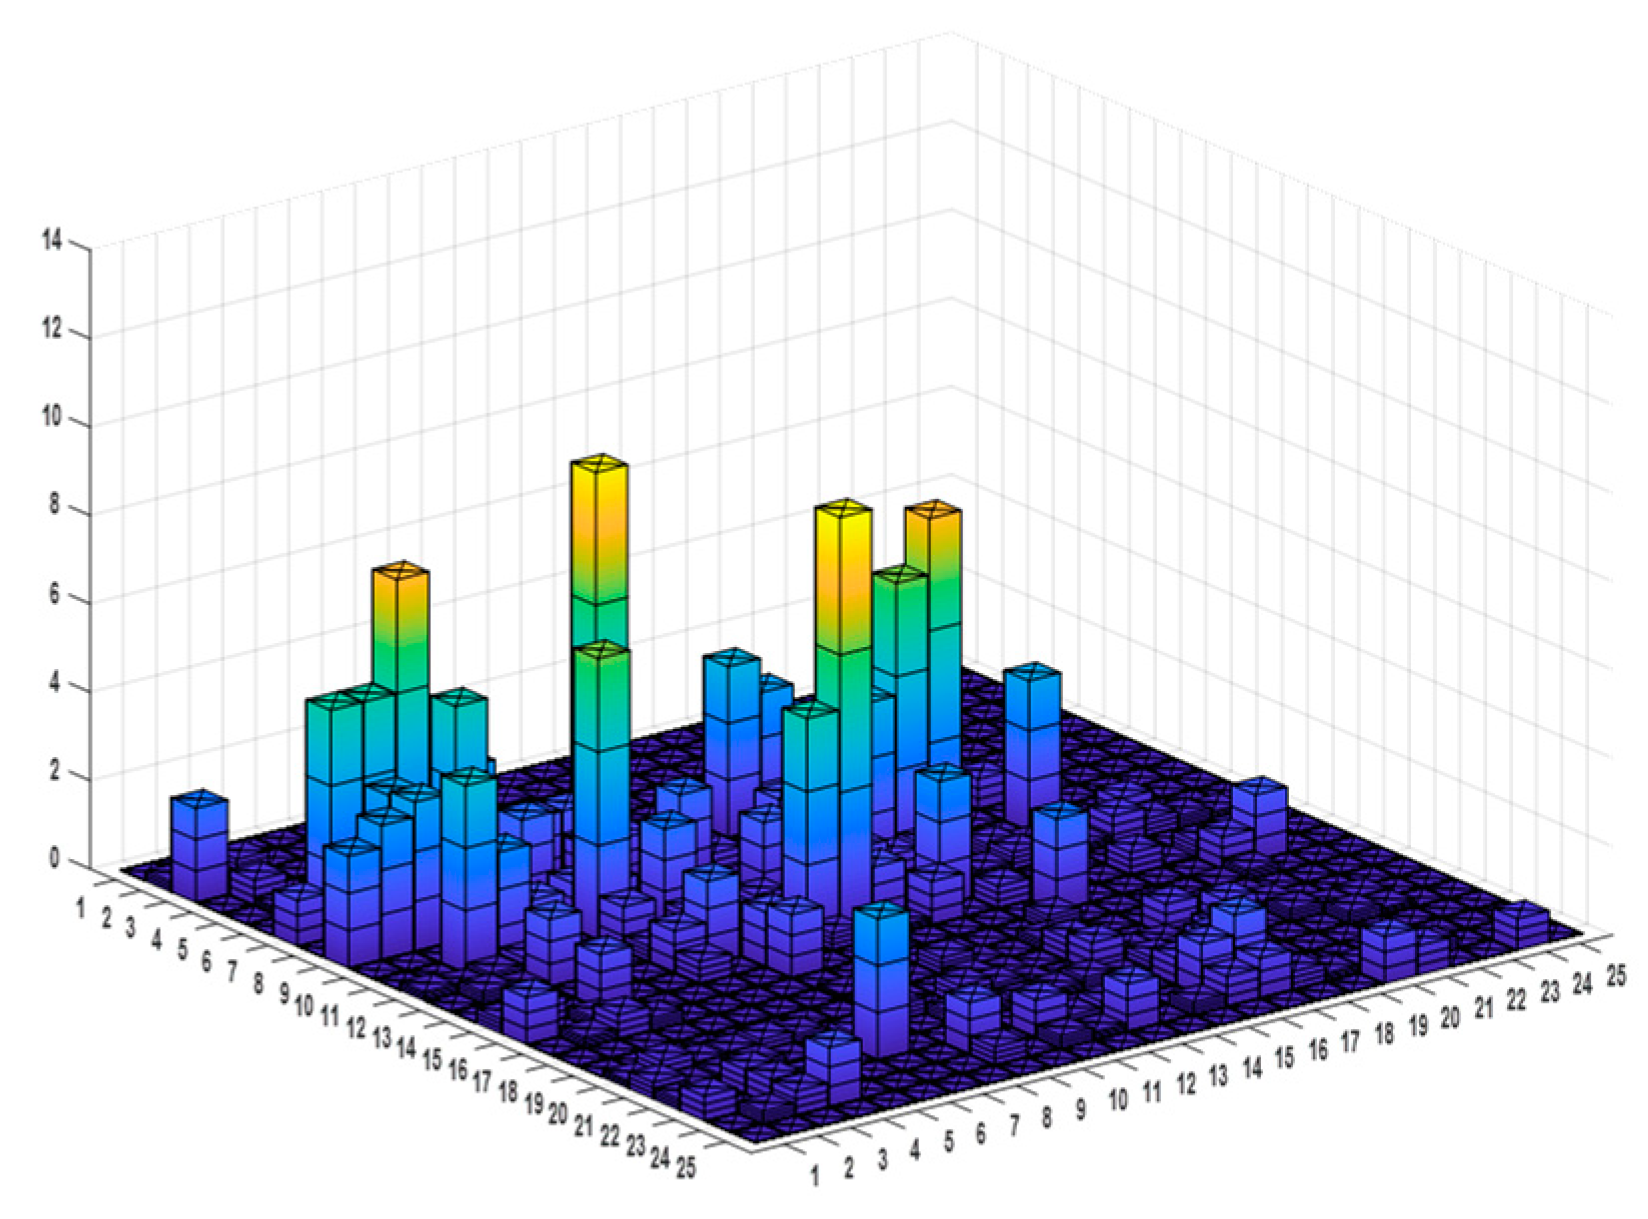
Step 3: Calculate the duration interface criticality and resource interface criticality according to Equations (1) and (2). The results are as shown in Figure 9 and Figure 10.
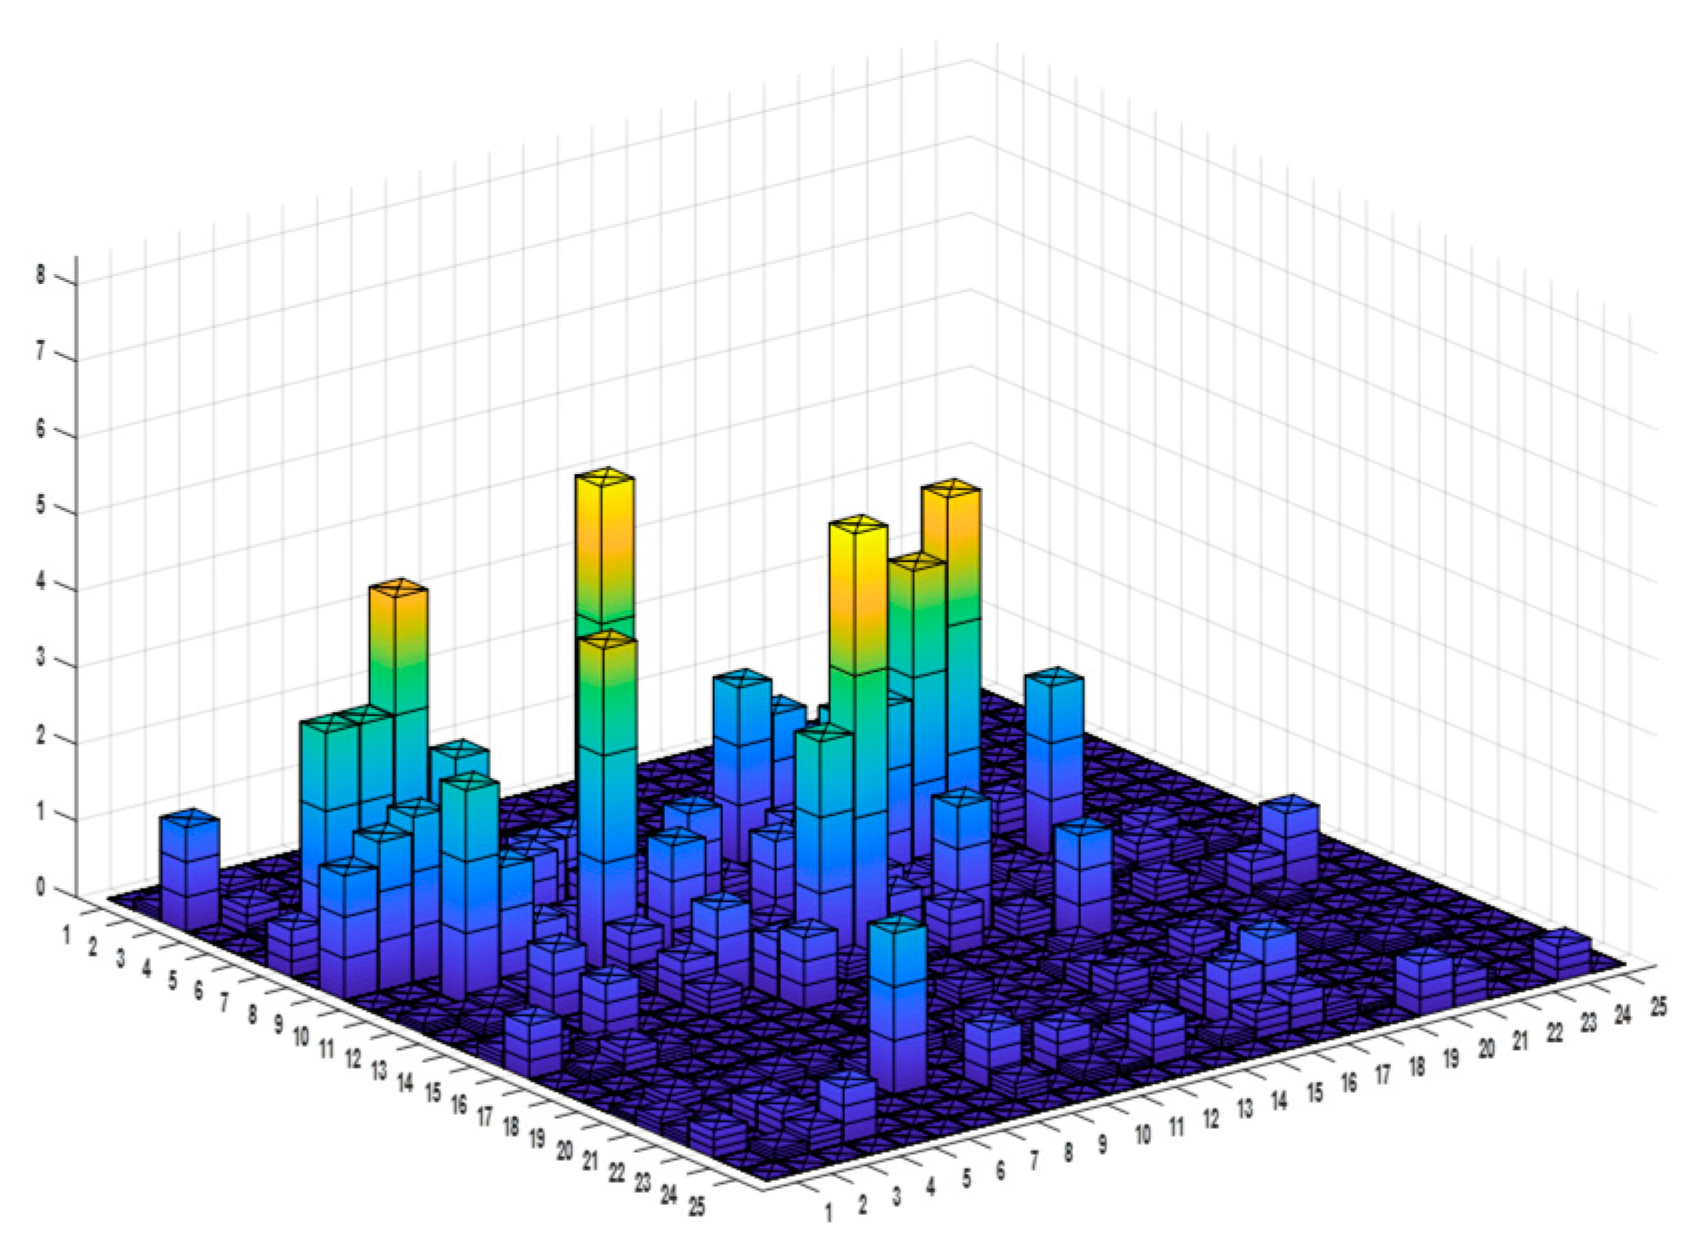
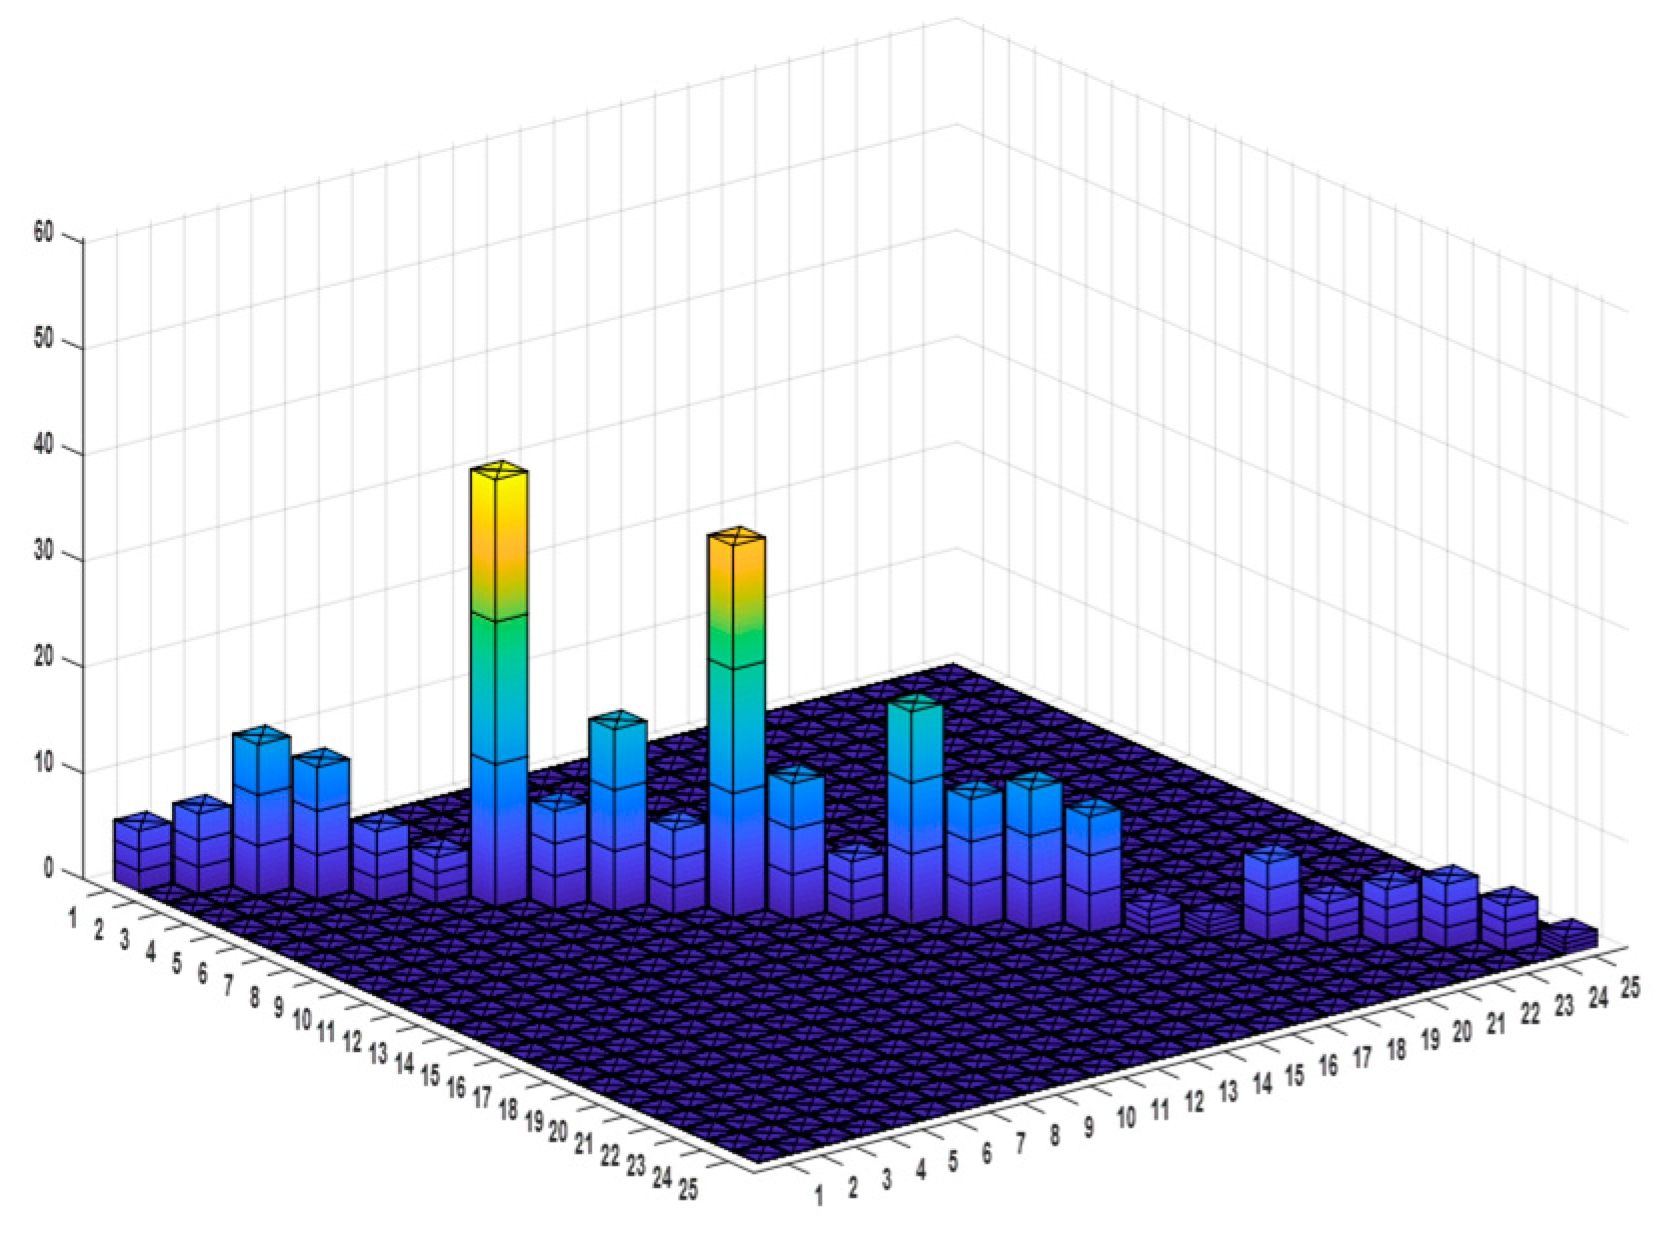
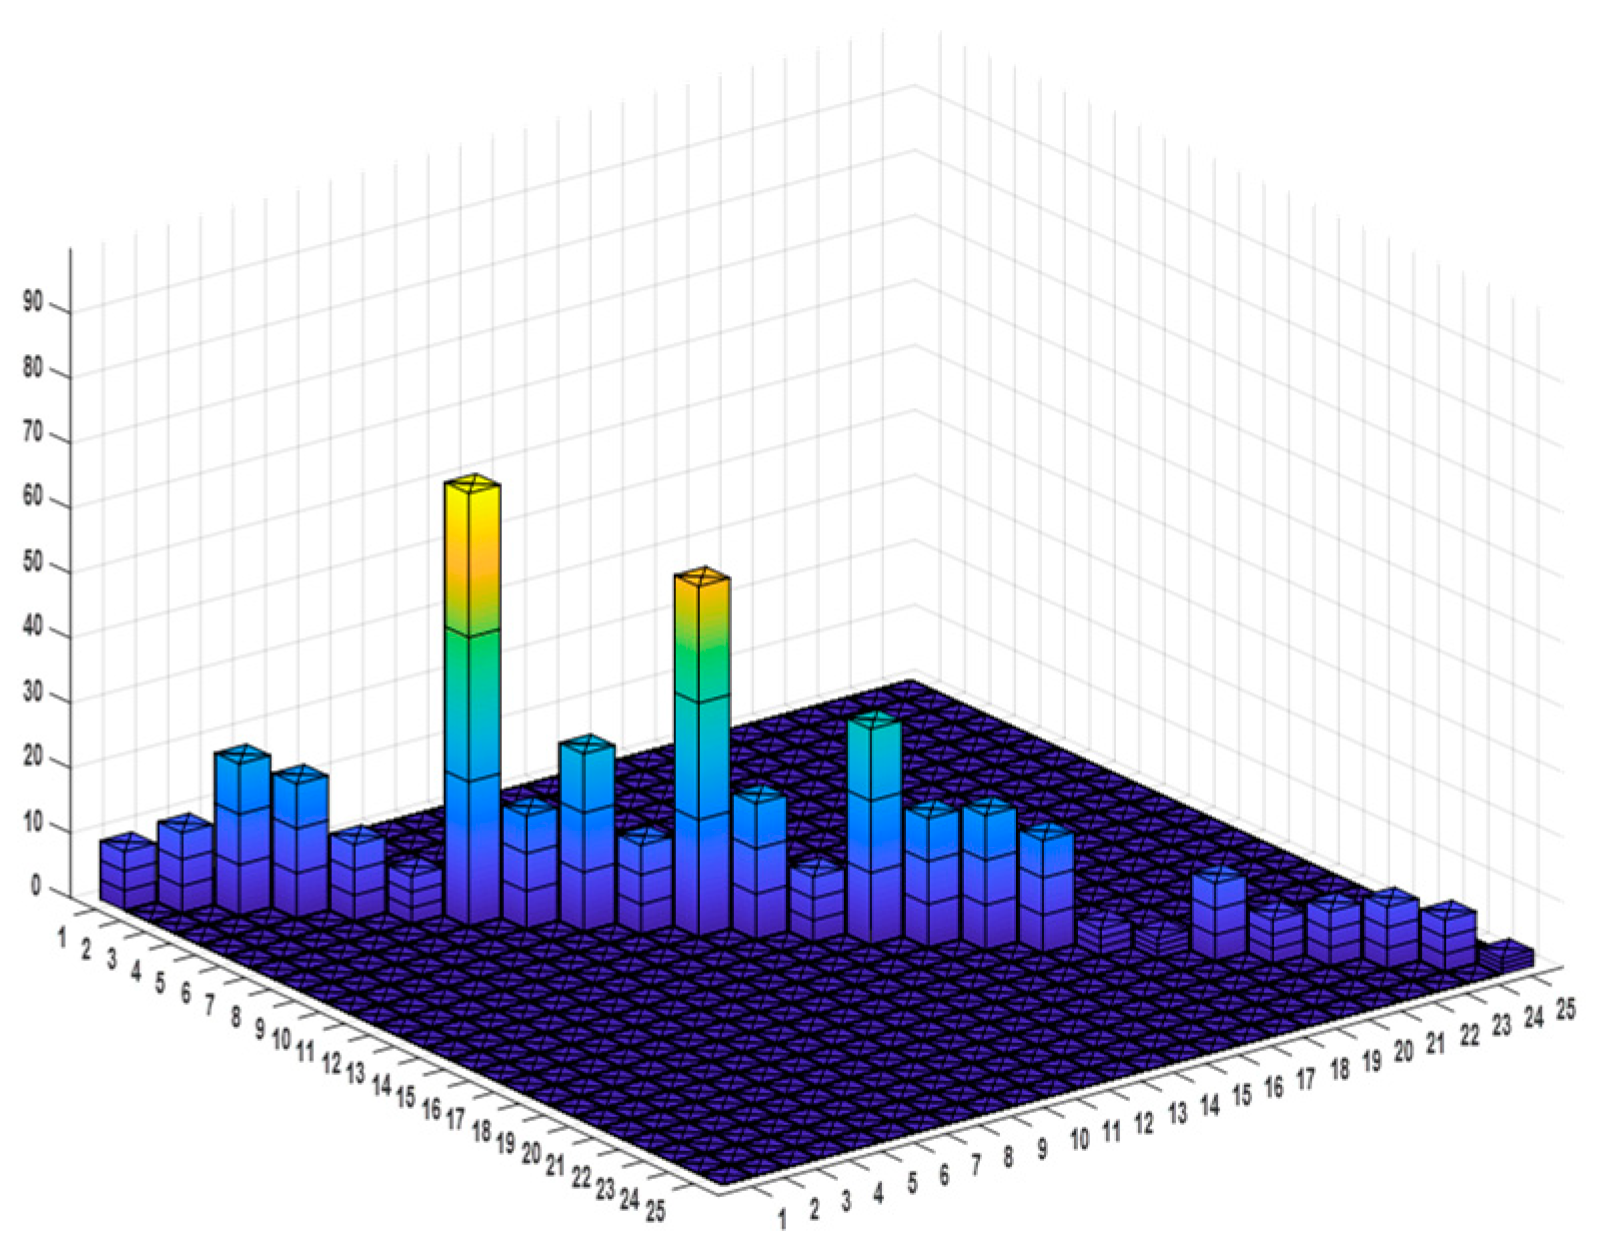
Step 4: Calculate the duration potential criticality and resource potential criticality according to Equations (5) and (6). The results are as shown in Figure 11 and Figure 12.
Step 5: Simulate the duration, resource consumption and schedule with the CCDSM algorithm.
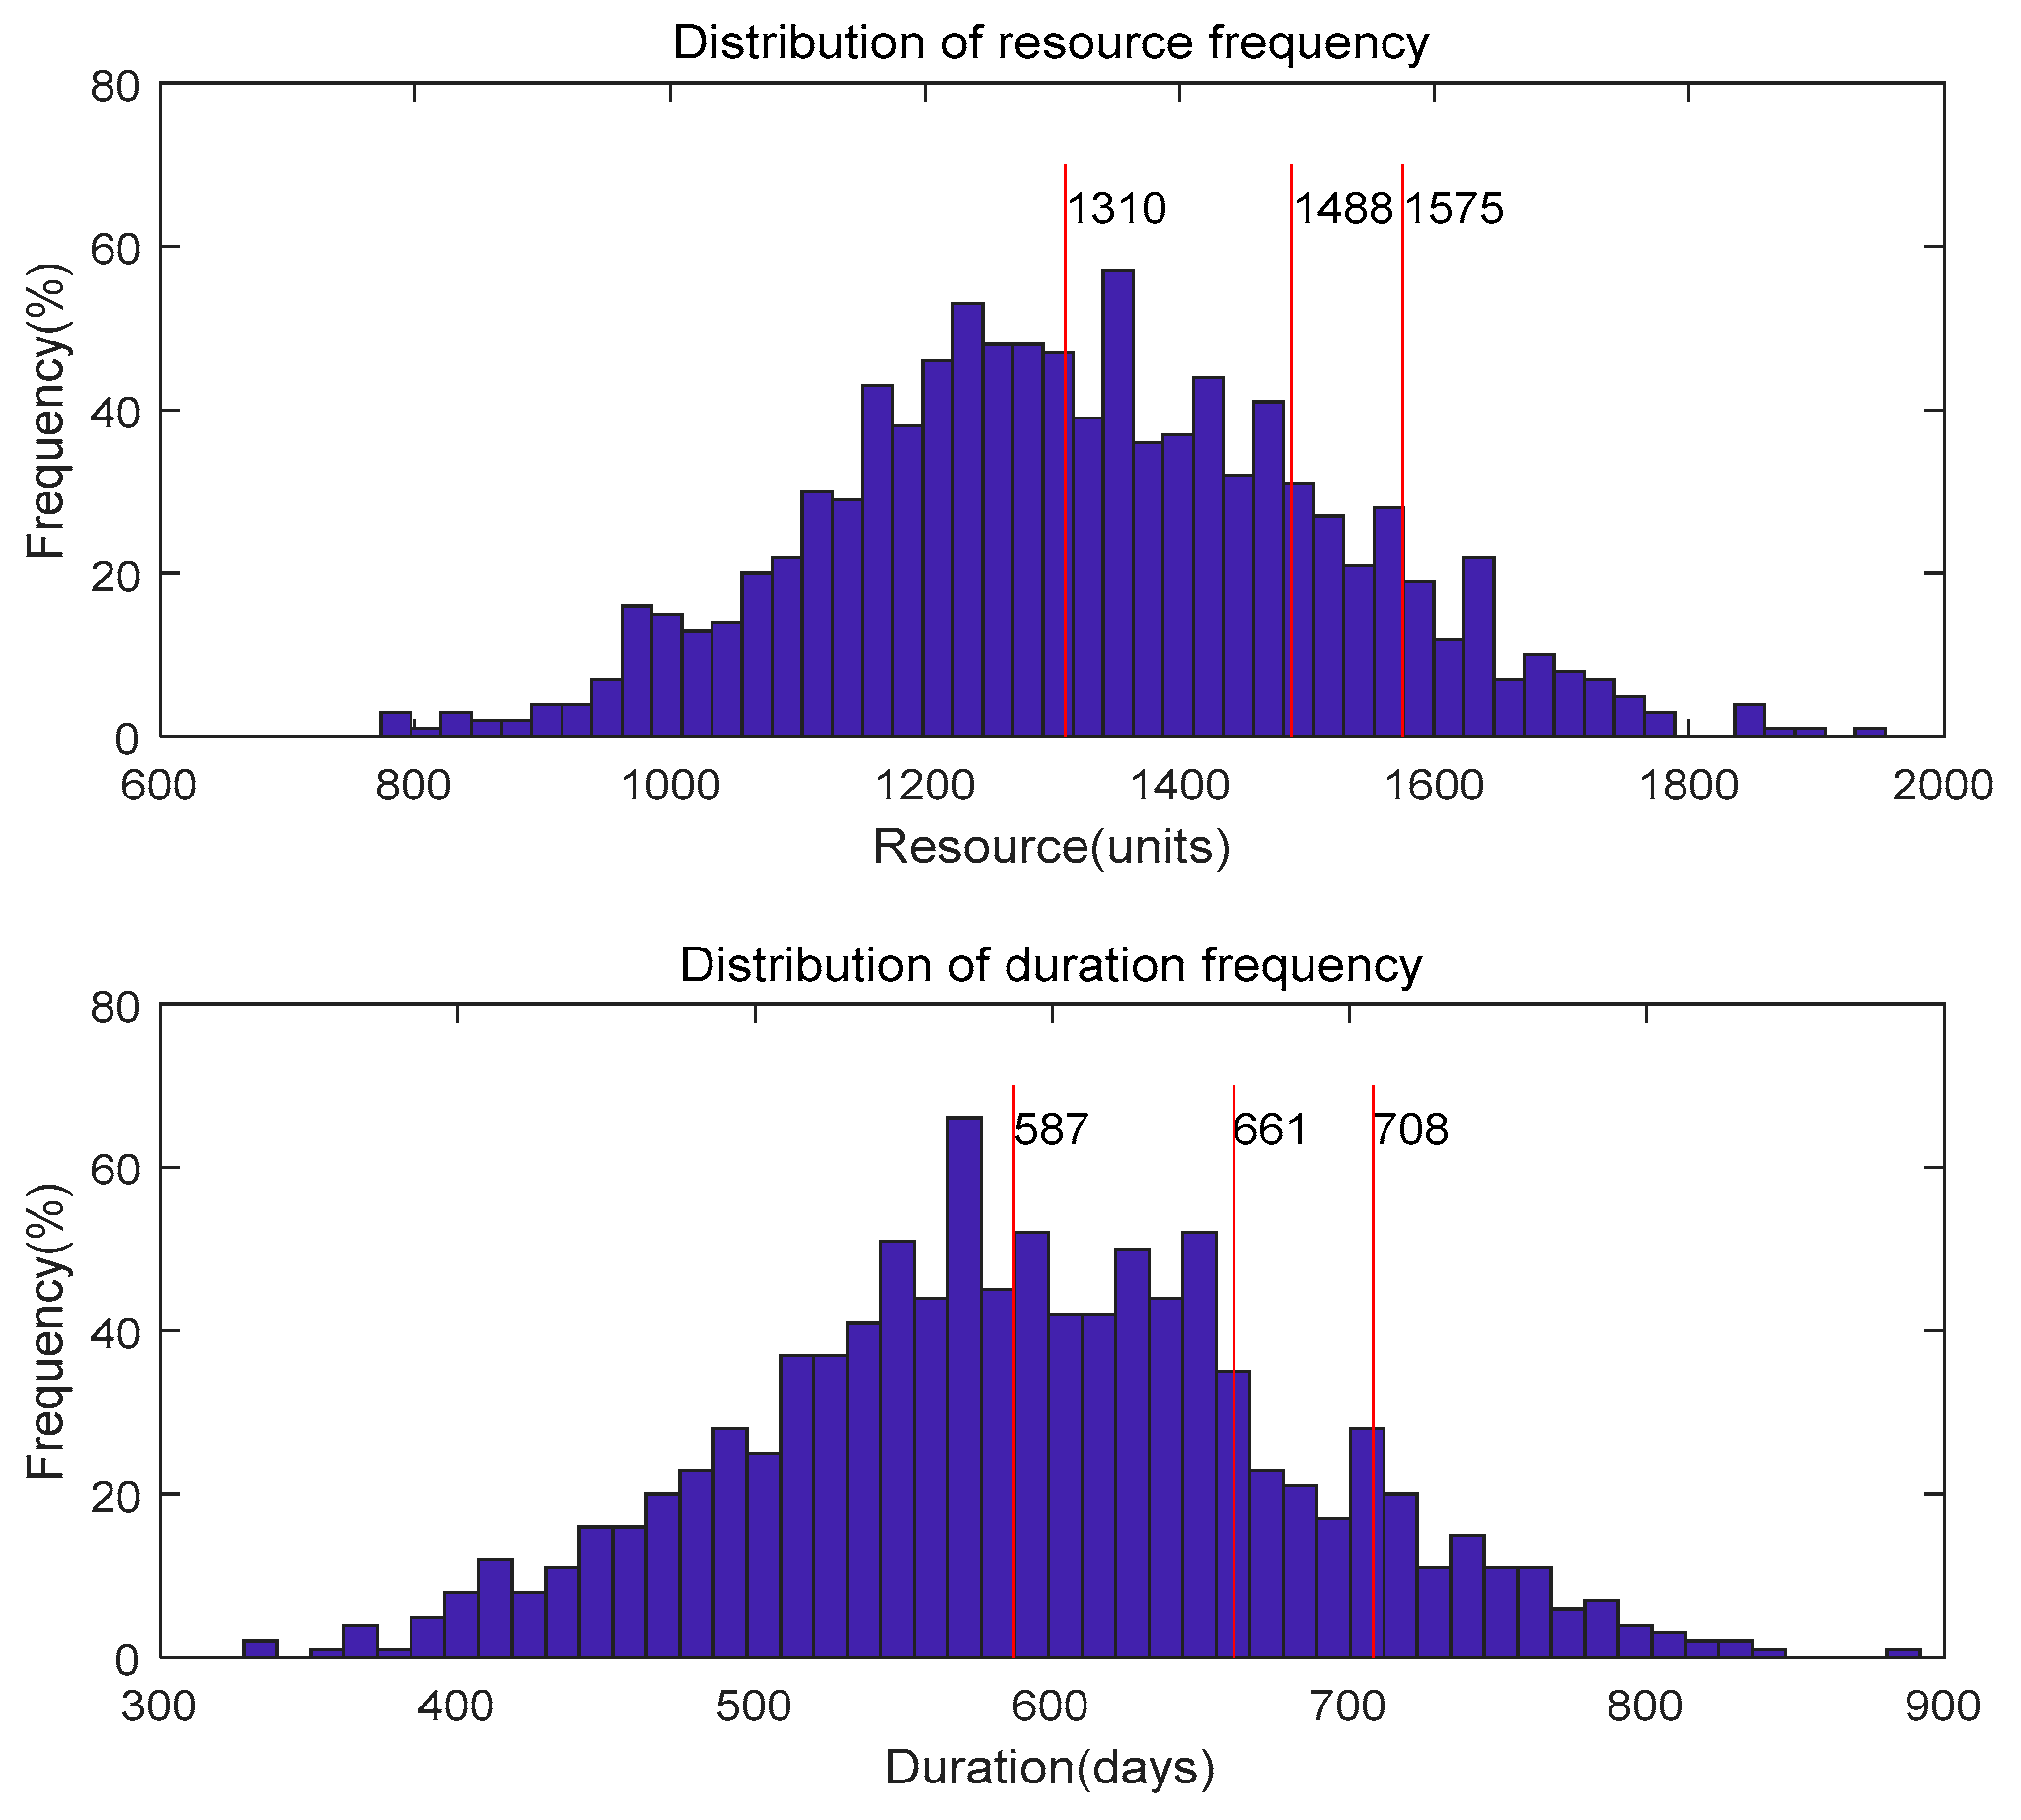
The results of the 1000 Monte Carlo simulations showed that the average project duration expectancy was 587 days, and the average resource expectancy was 1310 units as shown in Figure 13. The results of other scales including 80% and 90% are shown in Table 2.
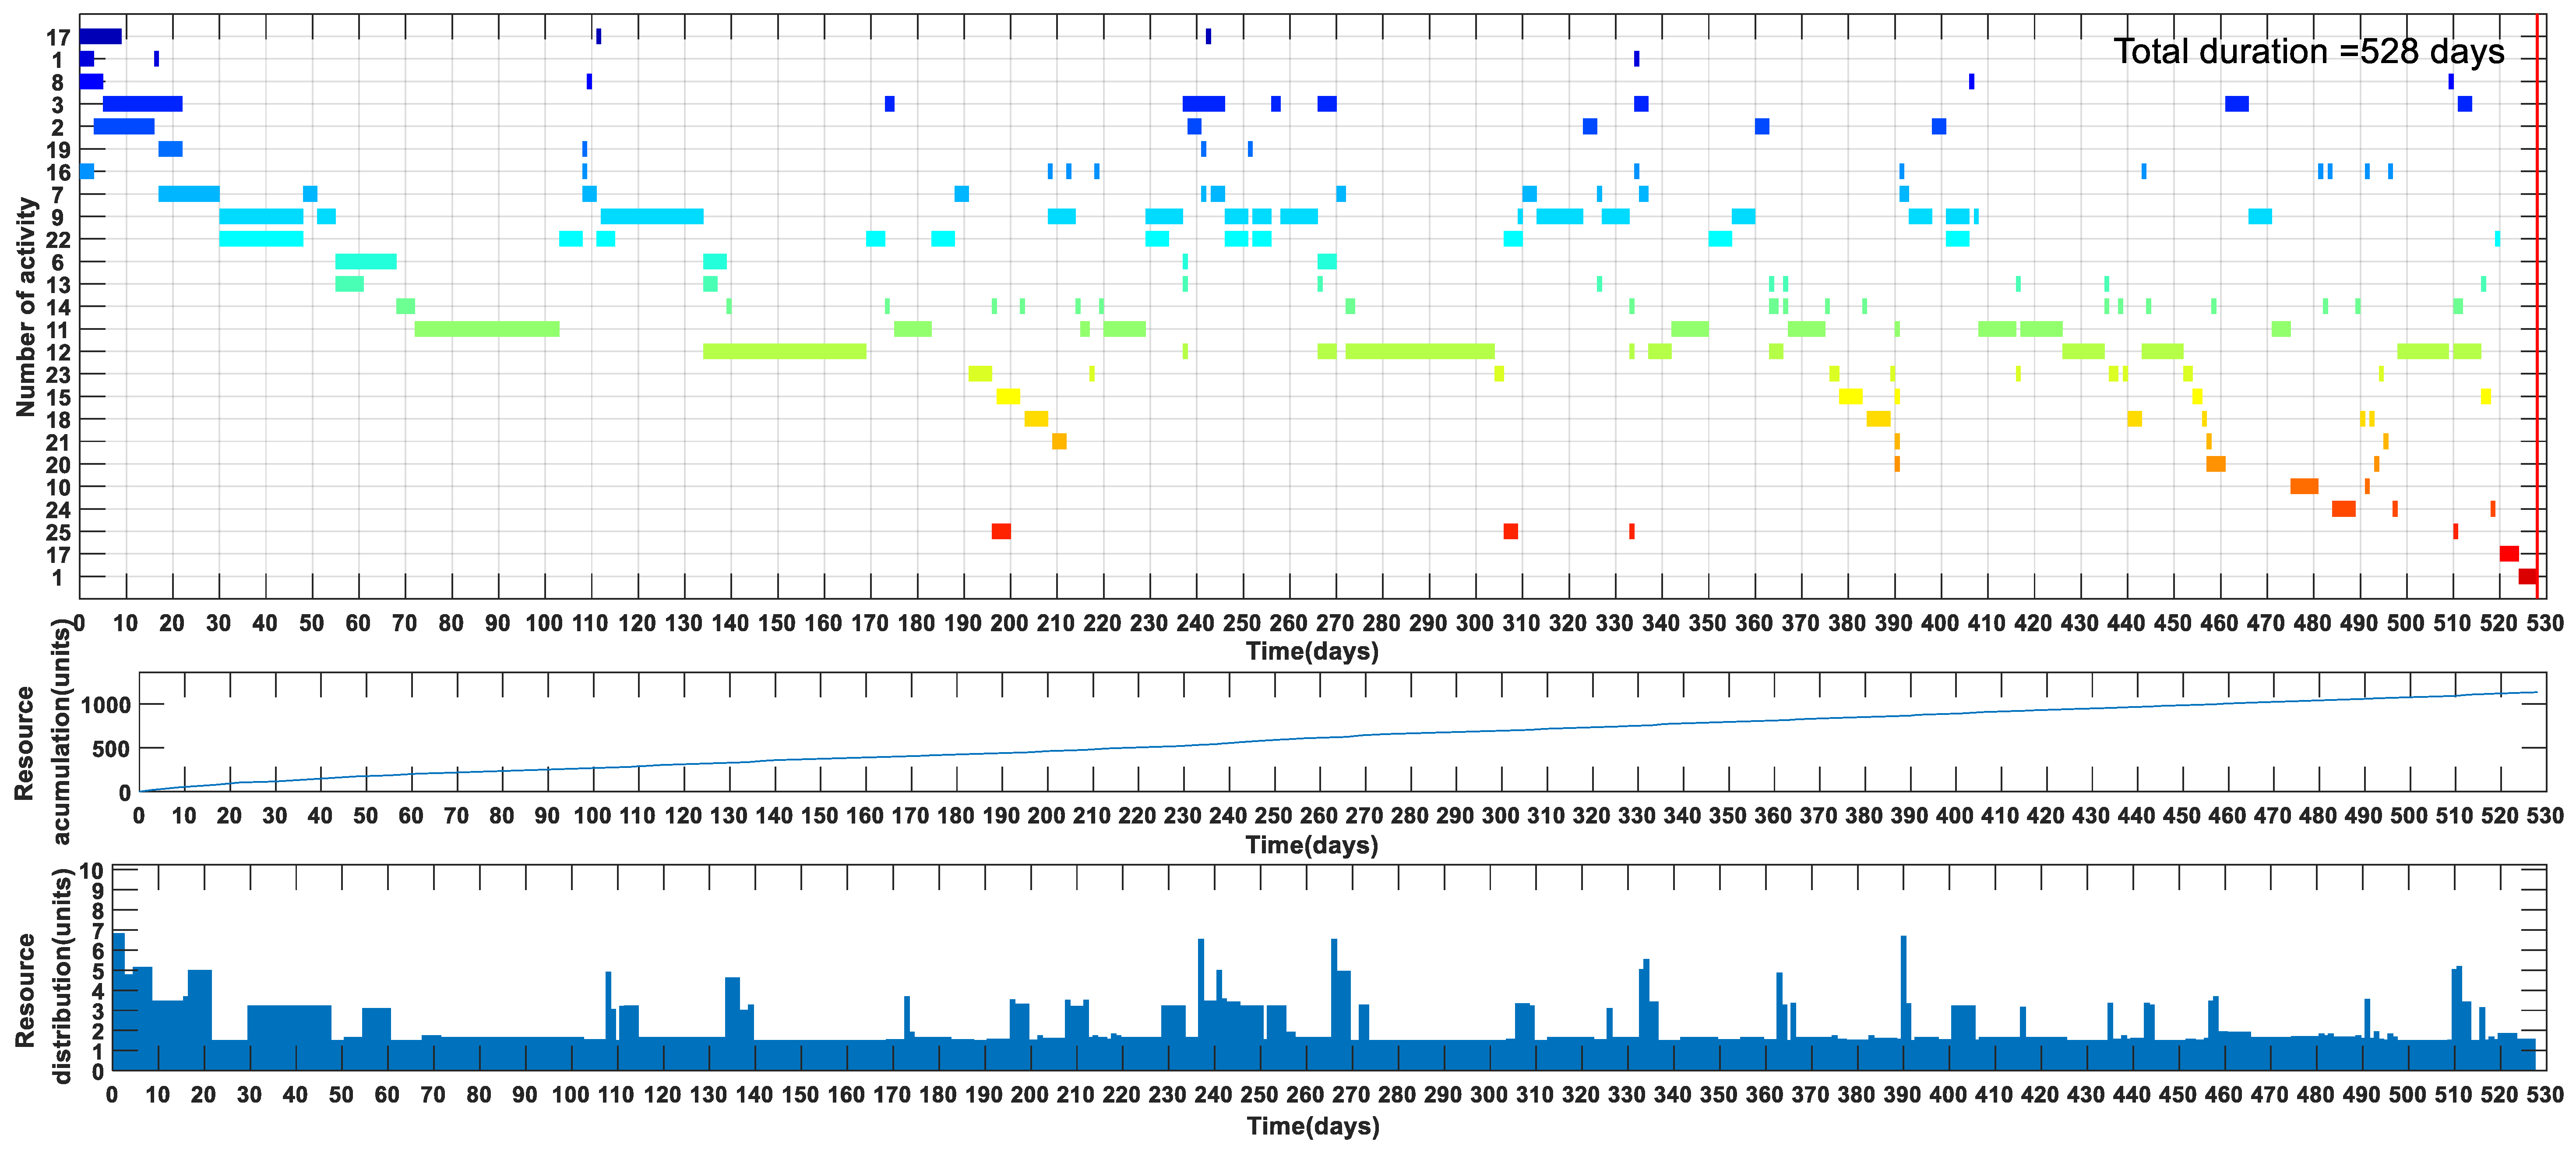
According to the MLV of each activity, a possible schedule and resource consuming plan has been produced by simulation as shown in Figure A1 (in the Section Appendix A). The project duration was 528 days without setting a buffer and the total resource consumption was 1131.8 units.
Step 6: Calculate MLV based rework impact area and project buffer.
According to the mentioned schedule and Equation (7), the results of rework impact areas for each activity were as follows:
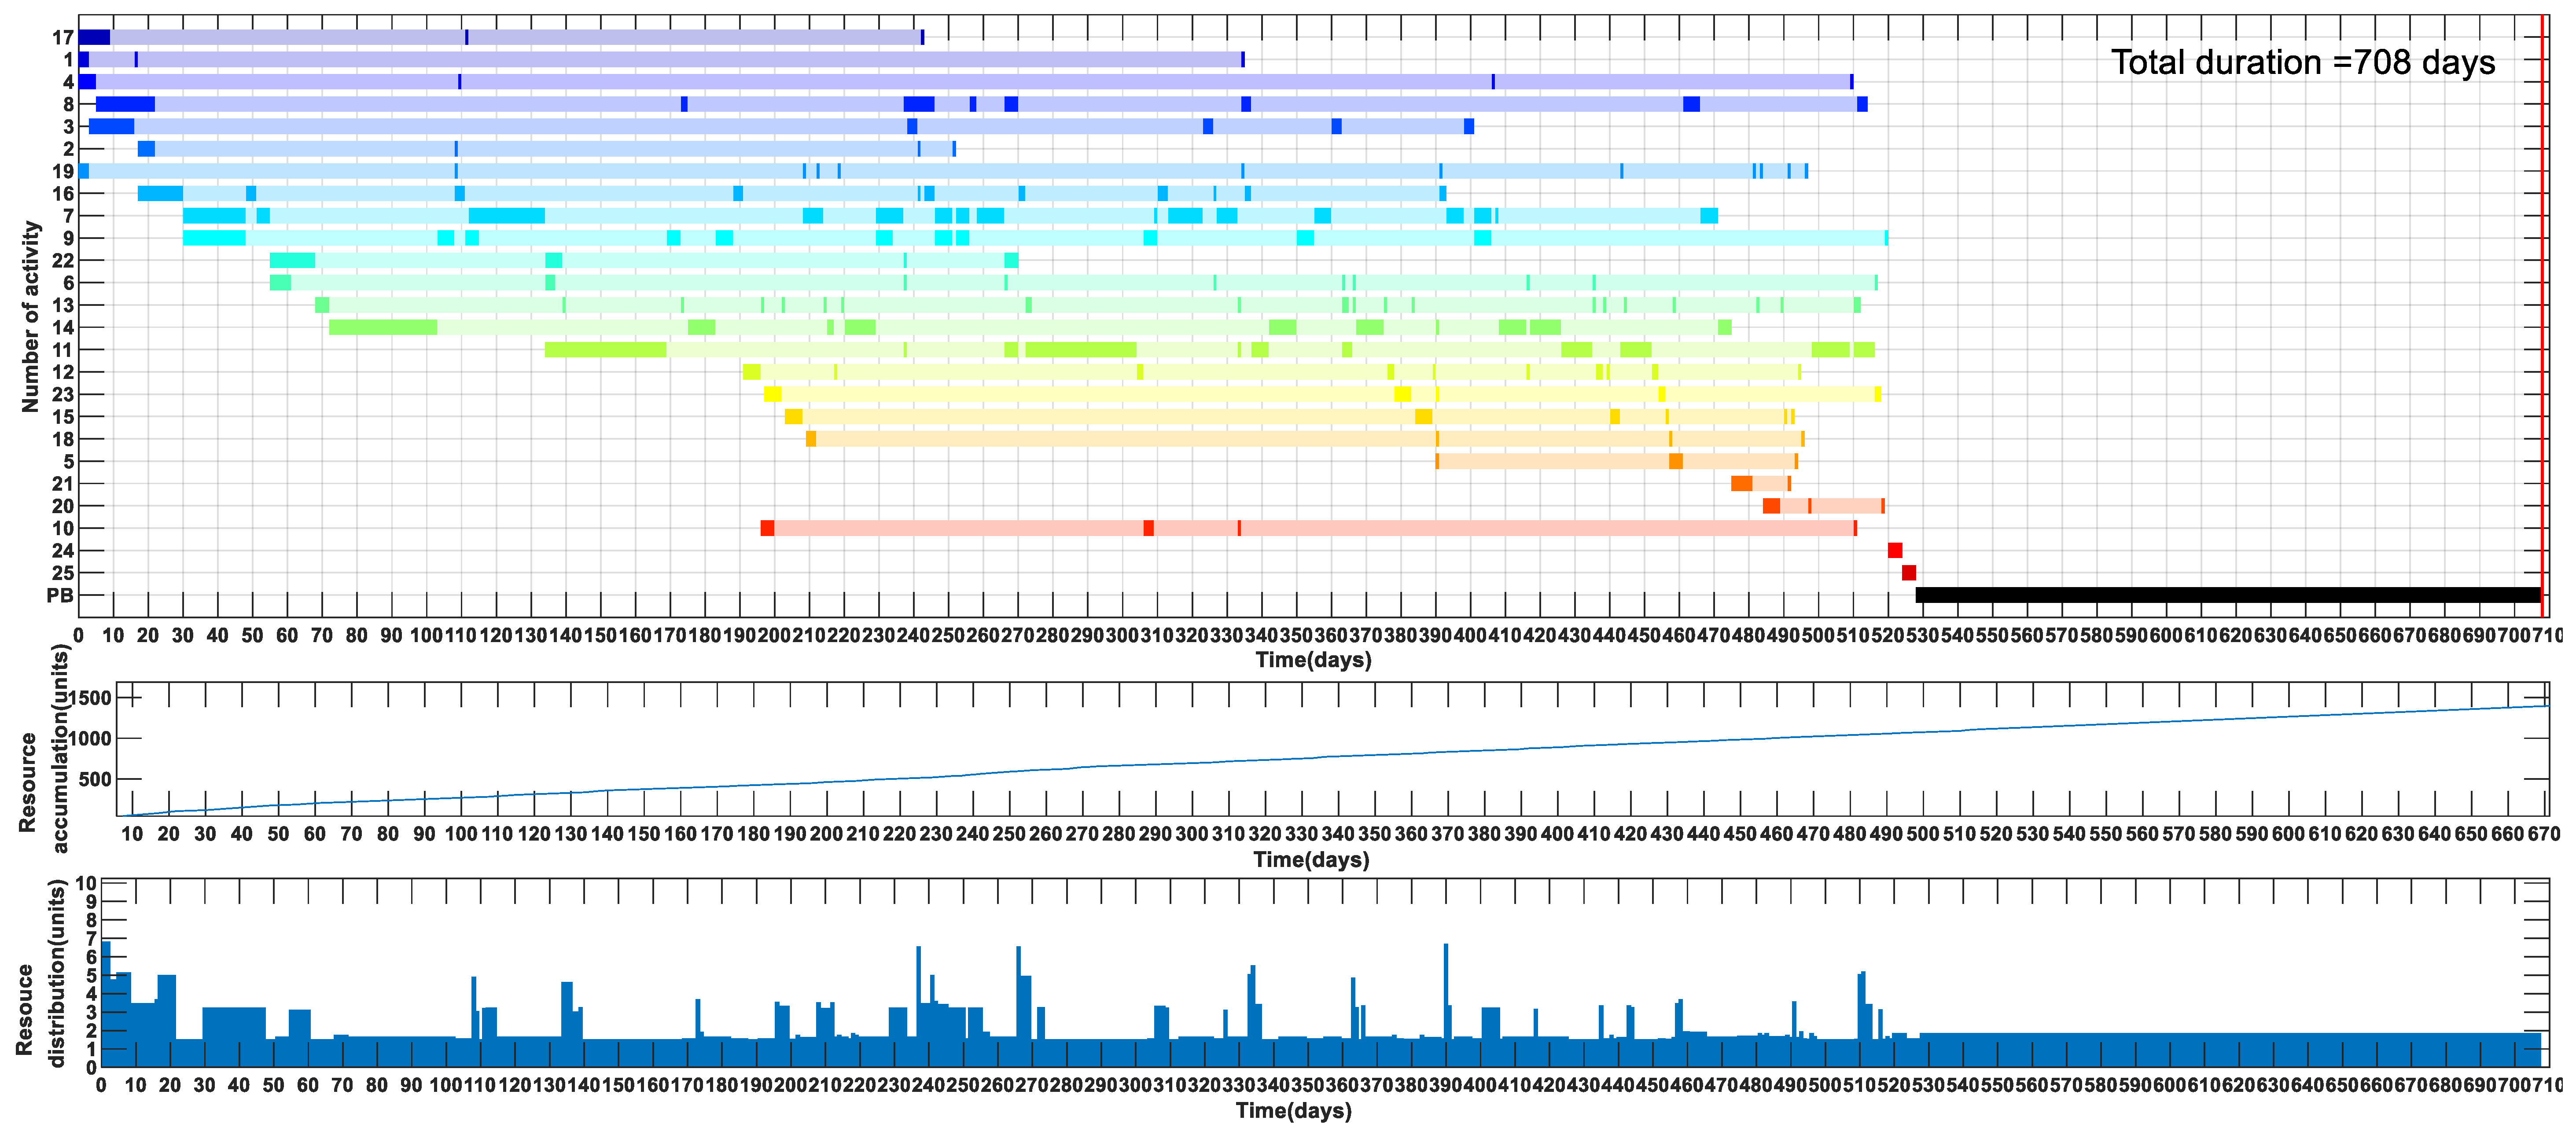
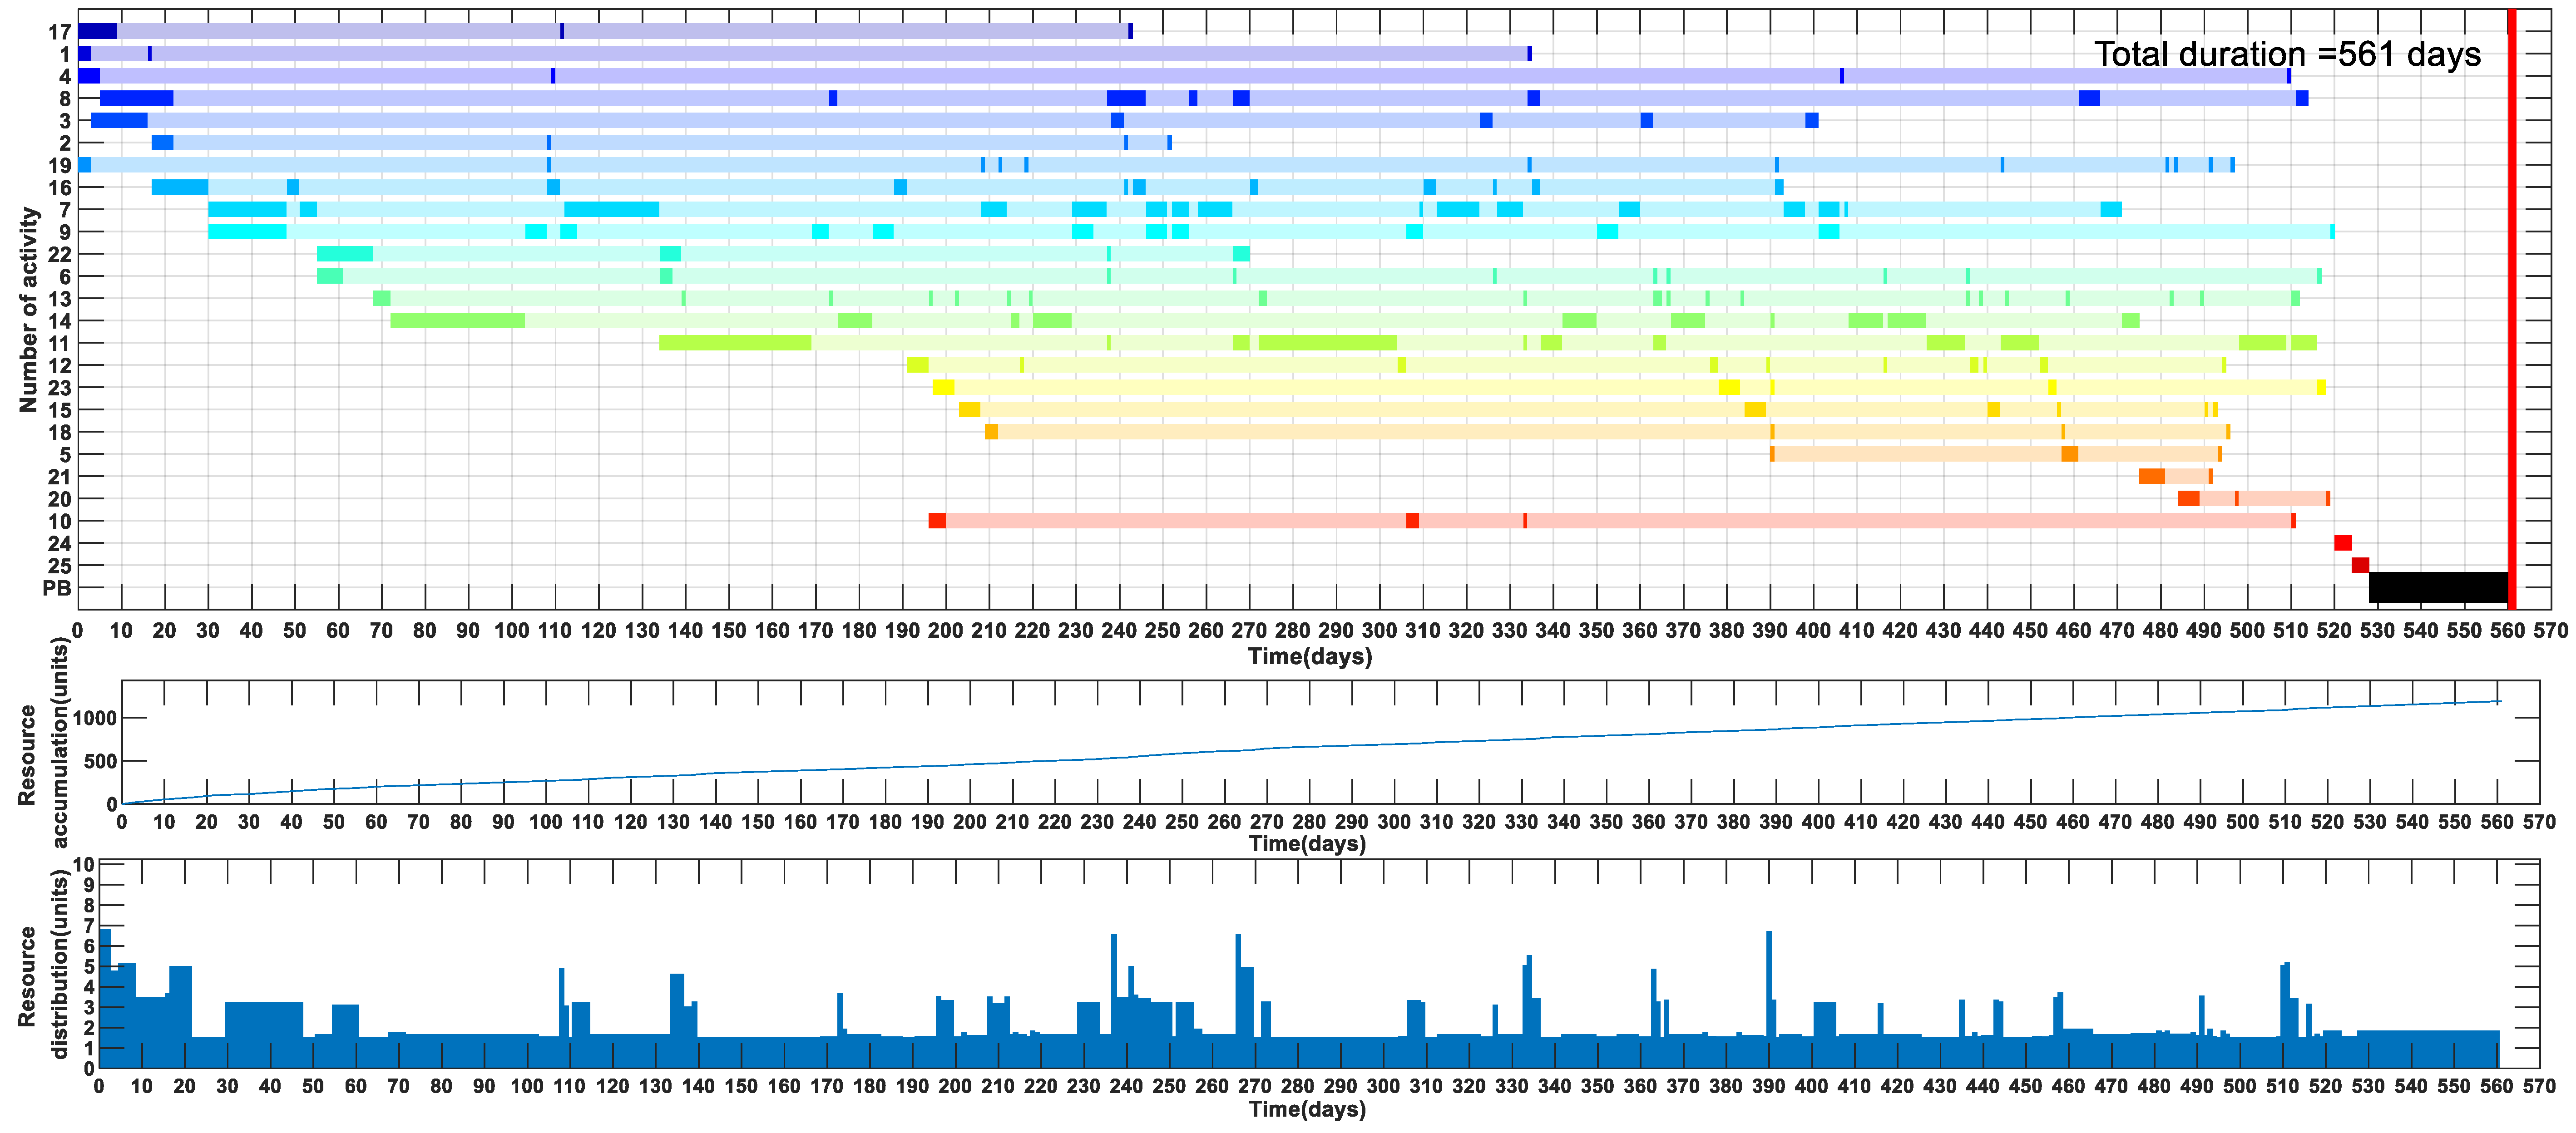
Additionally, the lengths of the two types of buffer were calculated by Equations (8)–(11). From the perspective of 90% completion probability, the project buffer output was . As for the potential criticality perspective, the result was .
The resource consumption of the project buffer adopted the 10-day moving average as the resource occupancy, which is shown in Figure A2 and Figure A3 (in the Section Appendix A) respectively.
5. Discussion and Managerial Implications
The generated results have been plotted in Figure 7, Figure 8, Figure 9, Figure 10, Figure 11, Figure 12 and Figure 13 and Figure A1, Figure A2 and Figure A3. Figure 7 shows the change happening to the activity sequence and information interactions after genetic algorithm-based reordering. Obviously, activities like 17, 19, and 16 were moved to the earlier stage. Since being combined with private equity, the integrated project was supposed to value more on financial activities. The earlier these financial activities were handled with, the less possible the project affected by finance—caused rework. Banding algorithm optimization is presented in Figure 8, where concurrent activities were arranged to start simultaneously instead of waiting just until the activity was ended, so that project duration would not be as long as it was.
Figure 9 and Figure 10 indicate that overlapping relationships between activities like (10,7) and (14,12) have prominent duration and resource interface criticality, denoting that their duration and resource sensitivity will be extremely high. It can be observed from the two figures that much attention should be paid to information interactions between these activities like oral communication or handover of periodical documents between different practitioners. Taking (14,12) for example, once the building plans are determined, it will directly affect the compilation of further design specifications and various indicators. The former is the guiding foundation of the latter, while the latter is the numerical reflection of the former. Only when the two are coordinated and unified can the project be effectively propelled.
As shown in Figure 11 and Figure 12, positioning projects and clients and developing conceptual design are two activities with the highest potential criticalities. More specifically, accurate and reasonable positions of projects and clients determine the final success of the holistic project as clues throughout the lifecycle. However, it appears that few managers regard it as the prerequisite of the following works, instead, they just do before thinking. It is appreciated that project managers can promote the schedule performance through shifting its concentration on the construction period to the planning period. Such positions reveal the core competitiveness of the project and accordingly becomes the guidance of next design, construction and marketing sections. Otherwise, any change or deviation related will be the main causation of rework. Similarly important, developing conceptual design also plays a remarkable role as information interaction pivot in the project. While for those individual activities, which barely interact information with others, they neither receive information from upstream activities, nor send information to downstream activities. Consequently, their interface criticality is not so attractive for project managers.
After 1000 Monte Carlo simulations, the outputs of 50%, 80% and 90% expected project duration were all lower than the actual duration, supporting the idea that the improved model benefited the project duration under rework scenarios. It is because the reordering of the activity sequence helps to alleviate the impact of rework on project duration. The new schedule simulated from MATLAB platform was presented by Gantt chart which demonstrates the progress status and working details of each activity. As for resource utilization analysis, it was displayed in the cumulative curve of resources, showing the distribution of resources during project implementation. Moreover, it appears that the rework impact areas of most activities are long, due to the complex interactions between selected activities from the strong coupling part. The feedforward and feedback frequency of information interactions between these activities are at a high level. Especially activities like 13, 21 and 20 which almost receive input information from all the others, which may lead to rework probably. Hence the rework impact area reflects the complexity of the project from another side.
Furthermore, in order to take rework risks into account, two improved schedules based on 90% completion probability and potential criticality have been developed by setting the project buffer. The former is based on the expected duration when 90% probability of completion is required, so the project buffer is set to ensure that the impact on duration caused by rework can be most recovered. While the latter is based on activities with high potential criticality, which focuses on the overall potential impact of rework on project duration caused by these activities. By comparison, it can be noticed that there is a gap of about 150 days between the PBs generated from the two approaches. It is because that under the constraint from 90% completion probability, a certain period of duration has to be “sacrificed” to ensure the project can be finished promptly, while the other has no need to consider that. Instead, high potential criticality activities should be attached much importance to meet the requirements of the most optimal duration. These two schedules obtained from two different perspectives can not only consider rework in practice fully, but also help to meet the requirements of special management situations. Thus, the efficiency of project scheduling will be greatly improved.
Based on the results of the case project, it can be proved that the improved CCDSM method has substantial potential in the construction industry because of these reasons. First, the genetic algorithm helps to achieve a more rational arrangement of project activities. Critical chain of concurrent activities has also been found by applied banding algorithm. Second, this method is much closer to the real situation of rework than traditional methods. It not only considers the information flow interactions between different activities but also quantifies the resulting rework. Third, the method is capable of developing a reliable project schedule dealing with rework risks, which can be applied to construction projects with varying complexities and resource demands. The rework-based schedule is a clear demonstration of how activities will be arranged when rework occurs within the duration. Finally, two types of criticality bring in managerial inspirations of crucial activities from different perspectives. Activities with information interactions from multi sources are distinguished by interface criticality. While potential criticality identifies activities which exert huge influence on others in terms of duration or resource.
6. Conclusions
This research focuses on project rework management which is a crucial strategy for achieving anticipated scheduling performance. Taking the preceding literature review on methods for project rework-related issues as the start point, this paper briefly introduces and explains the operation mechanism of the improved CCDSM method. Then, the proposed method is implemented systematically for empirical analysis based on a practical project in China. On this basis, the applied improved CCDSM method is considered as advantageous over traditional scheduling methods, the production of operable instructions on rework buffer setting and critical activities identification, which is thereby the main novelty of this study.
The empirical analysis proposed in this paper is a substantial trail to study project scheduling problems in the view of information interactions that is causative for potential rework. The primary contribution can be summarized into three categories.
First, project schedules including duration and resources at different contexts are developed and visualized. A reliable timeline of the project execution is displayed and proved to perform better than the occurred schedule, which provides solid reference to promote sustainable development in the construction industry and helps to motivate resource saving and carbon emission permanently.
Second, rework impacts are quantified by sizing two types of rework buffers in the possible schedules, which strengthens the solution to different project objectives under varying rework scenarios.
Finally, rework-intensive activities are identified from the perspective of two introduced criticalities. Project managers are enabled to recognize most critical and potential activities of causing rework according to the results to avoid similar rework. Hence, a dynamic perspective is employed to sustain rework management.
Moreover, the results provide essential information to project managers for recognizing the focal areas and taking due actions to mitigate impacts of uncertain rework. Being aware of these representative activities can also guide practitioners for participating in construction projects properly. If activities like positioning projects and clients can be handled effectively for the first time, such construction projects will be substantially released from unwanted schedule delays and cost overruns. Therefore, it can be expected by promoting the adoption of this method, the sustainability in project management will be achieved and facilitated substantially in the future.
There are still some shortcomings of this study. One limitation is that private equity commercial real estate development project is an unusual kind of construction project, which may not be representative enough to reflect the ubiquitous reality. To expand the area of applicable schedule management, further researches can pay more attention to diversified projects that are not limited to the construction industry. As for how to improve the accuracy of assessing project completion duration and probability under rework scenarios, as well as build the intelligent recommendation strategies of construction project scheduling, related research is expected to be conducted in the future.
Data Availability Statement
All data collected, generated or analyzed to support the findings of this study are included in this article. Please see the details at the following link https://0-doi-org.brum.beds.ac.uk/10.6084/m9.figshare.9970094.v1.
Author Contributions
Conceptualization, G.M. and S.J.; methodology, S.J. and J.J.; formal analysis, S.J. and G.M.; investigation, S.J, and T.Z.; writing—original draft preparation, S.J. and T.Z.; writing—review and editing, G.M.; supervision, G.M.; funding acquisition, G.M.
Funding
This research was funded by the National Natural Science Foundation of China (grant number 71671128).
Acknowledgments
The authors wish to acknowledge support from the respondents of the questionnaires.
Conflicts of Interest
The authors declare no conflicts of interest.
Nomenclature
| Symbol | Definition | Symbol | Definition |
| The duration interface criticality of activity i | The completion time of the first execution of activity i | ||
| The resource interface criticality of activity i | Project buffer of completion probability | ||
| The rework possibility caused by interactions from activity j to i | The duration with x% completion probability | ||
| The rework impact caused by interactions from activity j to i | The duration simulated with each activity’s most likely duration | ||
| Learning curve for activity i | The resource consumption of project buffer | ||
| Duration of activity i | The potential duration criticality of activity i | ||
| Resource occupation of activity i | The duration variance of activity i | ||
| The impact of activities j on activity i | The number of activities | ||
| potential criticality of duration of activity i | MLV | The most likely value | |
| Rework impact area of activity i | MOV | The most optimistic value | |
| The completion time of the rth rework of activity i | MPV | The most pessimistic value |
Appendix A. Interview Participants

Table A1.
Profiles of the five experts.
| Expert Code | Working Organizations | Job | Years of Work Experience | Interview |
|---|---|---|---|---|
| A | University | Professor | 15 | Face-to-face |
| B | Designer | Senior engineers | 9 | Two rounds of email |
| C | Contractor | Project manager | 17 | Face to Face |
| D | Owner | Department heads | 13 | |
| E | Consultant | Managing director | 12 | Three rounds of email |
Figure A1.
A possible MLV-based schedule and associated resource consumption.

Figure A2.
A possible schedule and associated resource consumption based on MLV and 90% completion probability.
Figure A2.
A possible schedule and associated resource consumption based on MLV and 90% completion probability.

Figure A3.
A possible schedule and associated resource consumption based on MLV and potential criticality.
Figure A3.
A possible schedule and associated resource consumption based on MLV and potential criticality.

References
- Guida, P.L.; Sacco, G. A method for project schedule delay analysis. Comput. Ind. Eng. 2019, 128, 346–357. [Google Scholar] [CrossRef]
- Głuszak, M.; Leśniak, A. Construction Delays in Clients Opinion—Multivariate Statistical Analysis. Procedia Eng. 2015, 123, 182–189. [Google Scholar] [CrossRef]
- Forcada, N.; Gangolells, M.; Casals, M.; Macarulla, M. Factors Affecting Rework Costs in Construction. J. Constr. Eng. Manag. 2017, 143, 04017032. [Google Scholar] [CrossRef] [Green Version]
- Hegazy, T.; Said, M.; Kassab, M. Incorporating rework into construction schedule analysis. Autom. Constr. 2011, 20, 1051–1059. [Google Scholar] [CrossRef]
- Love, P.E.D. Influence of Project Type and Procurement Method on Rework Costs in Building Construction Projects. J. Constr. Eng. Manag. 2002, 128, 18–29. [Google Scholar] [CrossRef]
- Ison, F. Measuring up or Muddling through: Best Practice in the Australian Non-Residential Construction Industry; Construction Industry Development Agency: Sydney, Austraila, 1995; pp. 59–63. [Google Scholar]
- Hwang, B.-G.; Thomas, S.R.; Haas, C.T.; Caldas, C.H. Measuring the Impact of Rework on Construction Cost Performance. J. Constr. Eng. Manag. 2009, 135, 187–198. [Google Scholar] [CrossRef]
- Hwang, B.-G.; Zhao, X.; Goh, K.J. Investigating the client-related rework in building projects: The case of Singapore. Int. J. Proj. Manag. 2014, 32, 698–708. [Google Scholar] [CrossRef]
- Mao, Y.; Wu, W. Fuzzy Real Option Evaluation of Real Estate Project Based on Risk Analysis. Syst. Eng. Procedia 2011, 1, 228–235. [Google Scholar] [CrossRef] [Green Version]
- Li, Y.; Taylor, T.R.B. Modeling the Impact of Design Rework on Transportation Infrastructure Construction Project Performance. J. Constr. Eng. Manag. 2014, 140, 04014044. [Google Scholar] [CrossRef]
- Taggart, M.; Koskela, L.; Rooke, J. The role of the supply chain in the elimination and reduction of construction rework and defects: An action research approach. Constr. Manag. Econ. 2014, 32, 829–842. [Google Scholar] [CrossRef]
- Love, P.E.; Li, H. Quantifying the causes and costs of rework in construction. Constr. Manag. Econ. 2000, 18, 479–490. [Google Scholar] [CrossRef]
- Barber, P.; Graves, A.; Hall, M.; Sheath, D.; Tomkins, C. Quality failure costs in civil engineering projects. Int. J. Qual. Reliab. Manag. 2000, 17, 479–492. [Google Scholar] [CrossRef]
- Ma, G.; Gu, L.; Li, N. Scenario-Based Proactive Robust Optimization for Critical-Chain Project Scheduling. J. Constr. Eng. Manag. 2015, 141, 04015030. [Google Scholar] [CrossRef]
- Xiao, Y. Research on Method and Application of Construction Project Schedule Management. Master’s Thesis, Tongji University, Shanghai, China, 2016. [Google Scholar]
- Josephson, P.-E.; Larsson, B.; Li, H. Illustrative Benchmarking Rework and Rework Costs in Swedish Construction Industry. J. Manag. Eng. 2002, 18, 76–83. [Google Scholar] [CrossRef]
- Mills, A.; Love, P.E.; Williams, P. Defect Costs in Residential Construction. J. Constr. Eng. Manag. 2009, 135, 12–16. [Google Scholar] [CrossRef]
- Ilozor, B.D.; Okoroh, M.I.; Egbu, C.E. Archicentre, Understanding residential house defects in Australia from the State of Victoria. Build. Environ. 2004, 39, 327–337. [Google Scholar] [CrossRef]
- Wanberg, J.; Harper, C.; Hallowell, M.R.; Rajendran, S. Relationship between Construction Safety and Quality Performance. J. Constr. Eng. Manag. 2013, 139, 04013003. [Google Scholar] [CrossRef] [Green Version]
- Rojas, E.M.; Aramvareekul, P. Labor Productivity Drivers and Opportunities in the Construction Industry. J. Manag. Eng. 2003, 19, 78–82. [Google Scholar] [CrossRef]
- Arashpour, M.; Wakefield, R.; Blismas, N.; Lee, E.W.M. Analysis of Disruptions Caused by Construction Field Rework on Productivity in Residential Projects. J. Constr. Eng. Manag. 2014, 140, 04013053. [Google Scholar] [CrossRef] [Green Version]
- Love, P.E.D.; Teo, P.; Ackermann, F.; Alexander, J.; Morrison, J. Reduce Rework, Improve Safety: An Empirical Inquiry into the Precursors to Error in Construction. Prod. Plan. Control 2018, 29, 353–366. [Google Scholar] [CrossRef]
- Taylor, T.; Ford, D.N. Tipping point failure and robustness in single development projects. Syst. Dynam. Rev. 2006, 22, 51–71. [Google Scholar] [CrossRef] [Green Version]
- Ashford, J.L.; Ebrary, I. The Managment of Quality in Construction; Routledge: Thames, UK, 2014. [Google Scholar]
- Love, P.E.D.; Smith, J.; Ackermann, F.; Irani, Z. Making sense of rework and its unintended consequence in projects: The emergence of uncomfortable knowledge. Int. J. Proj. Manag. 2019, 37, 501–516. [Google Scholar] [CrossRef]
- Love, P.E.D.; Edwards, D.J.; Smith, J. Rework Causation: Emergent Theoretical Insights and Implications for Research. J. Constr. Eng. Manag. 2016, 142, 04016010. [Google Scholar] [CrossRef]
- Zhang, D.; Haas, C.T.; Goodrum, P.M.; Caldas, C.H.; Granger, R. Construction Small-Projects Rework Reduction for Capital Facilities. J. Constr. Eng. Manag. 2012, 138, 1377–1385. [Google Scholar] [CrossRef]
- Dehghan, R.; Ruwnapura, J.Y. Model of Trade-Off between Overlapping and Rework of Design Activities. J. Constr. Eng. Manag. 2014, 140, 04013043. [Google Scholar] [CrossRef]
- Love, P.E.D.; Smith, J. Benchmarking, benchaction, and benchlearning: Rework mitigation in projects. J. Manag. Eng. 2003, 19, 147–159. [Google Scholar] [CrossRef]
- Palaneeswaran, E.; Love, P.E.D.; Kumaraswamy, M.M.; Ng, T.S.T. Mapping rework causes and effects using artificial neural networks. Build. Res. Inf. 2008, 36, 450–465. [Google Scholar] [CrossRef]
- Palaneeswaran, E. Reducing Rework to Enhance Project Performance Levels. In Proceedings of the One Day Seminar on Recent Developments in Project Management in Hong Kong, Hong Kong, China, 12 May 2006. [Google Scholar]
- Blackstone, J.J.H.; Cox, I.J.F.; Schleier, J.J.G. A tutorial on project management from a theory of constraints perspective. Int. J. Prod. Res. 2009, 47, 7029–7046. [Google Scholar] [CrossRef]
- Yang, Q.; Zhang, X.; Yao, T. An overlapping-based process model for managing schedule and cost risk in product development. Concurrent Eng. 2012, 20, 3–17. [Google Scholar] [CrossRef]
- Li, Y.; Le, Y.; Chong, D. Literature Review on Large-Scale Complex Project Organization: Sociology Perspectives. J. Eng. Manag. 2011, 1, F284. [Google Scholar]
- Han, S.; Love, P.; Peña-Mora, F. A system dynamics model for assessing the impacts of design errors in construction projects. Math. Comput. Model. 2013, 57, 2044–2053. [Google Scholar] [CrossRef]
- Love, P.E.D.; Ackermann, F.; Carey, B.; Morrison, J.; Ward, M.; Park, A. Praxis of Rework Mitigation in Construction. J. Manag. Eng. 2016, 32, 05016010. [Google Scholar] [CrossRef]
- Kastor, A.; Sirakoulis, K. The effectiveness of resource levelling tools for resource constraint project scheduling problem. Int. J. Proj. Manag. 2009, 27, 493–500. [Google Scholar] [CrossRef]
- Hall, N.G. Project management: Recent developments and research opportunities. J. Syst. Sci. Syst. Eng. 2012, 21, 129–143. [Google Scholar] [CrossRef]
- Kulkarni, A.; Yadav, D.K. Nikraz, H. Aircraft maintenance checks using critical chain project path. Aircr. Eng. Aerosp. Technol. 2017, 89, 879–892. [Google Scholar] [CrossRef]
- Goldratt, E.M. Critical Chain: A Business Novel; North River Press: Great Barrington, MA, USA, 1997. [Google Scholar]
- Ma, G.; Wang, A.; Li, N.; Gu, L.; Ai, Q. Improved Critical Chain Project Management Framework for Scheduling Construction Projects. J. Constr. Eng. Manag. 2014, 140, 04014055. [Google Scholar] [CrossRef]
- Bie, L.; Cui, N.; Zhang, X. Buffer sizing approach with dependence assumption between activities in critical chain scheduling. Int. J. Prod. Res. 2012, 50, 7343–7356. [Google Scholar] [CrossRef]
- Morris, P.W.G.; Pinto, J.K.; Söderlund, J. The Oxford Handbook of Project Managment; Oxford University Press: Oxford, UK, 2012. [Google Scholar]
- Love, P.E.D.; Edwards, D.J. Calculating total rework costs in Australian construction projects. Civ. Eng. Syst. 2005, 22, 11–27. [Google Scholar] [CrossRef]
- Love, P.E.D.; Edwards, D.J.; Watson, H.; Davis, P. Rework in Civil Infrastructure Projects: Determination of Cost Predictors. J. Constr. Eng. Manag. 2010, 136, 275–282. [Google Scholar] [CrossRef]
- Oyewobi, L.O.; Abiola-Falemu, O.; Ibironke, O.T. The impact of rework and organisational culture on project delivery. J. Eng. Des. Technol. 2016, 14, 214–237. [Google Scholar] [CrossRef]
- Ye, G.; Jin, Z.; Xia, B.; Skitmore, M. Analyzing Causes for Reworks in Construction Projects in China. J. Manag. Eng. 2015, 31, 04014097. [Google Scholar] [CrossRef]
- Love, P.E.D.; Irani, Z.; Edwards, D.J. A rework reduction model for construction projects. IEEE Trans. Eng. Manag. 2004, 51, 426–440. [Google Scholar] [CrossRef]
- Love, P.E.D.; Edwards, D.J.; Irani, Z.; Goh, Y.M. Dynamics of Rework in Complex Offshore Hydrocarbon Projects. J. Constr. Eng. Manag. 2011, 137, 1060–1070. [Google Scholar] [CrossRef]
- Browning, T.R. Sources of Schedule Risk in Complex System Development. Syst. Eng. 1999, 2, 129–142. [Google Scholar] [CrossRef]
- Steward, D.V. Partitioning and Tearing Systems of Equations. J. Soc. Ind. Appl. Math. 1965, 2, 345–365. [Google Scholar] [CrossRef]
- Steward, D.V. Systems Analysis and Managment: Structure, Strategy and Design; Petrocelli Books: New York, NY, USA, 1981. [Google Scholar]
- Chen, C.H.; Ling, S.F.; Chen, W. Project scheduling for collaborative product development using DSM. Int. J. Proj. Manag. 2003, 21, 291–299. [Google Scholar] [CrossRef]
- Eppinger, S.D.; Whitney, D.E.; Smith, R.P.; Gebala, D.A. A model-based method for organizing tasks in product development. Res. Eng. Des. 1994, 6, 1–13. [Google Scholar] [CrossRef] [Green Version]
- Browning, T.R.; Eppinger, S.D. Modeling impacts of process architecture on cost and schedule risk in product development. IEEE Trans. Eng. Manag. 2002, 49, 428–442. [Google Scholar] [CrossRef]
- Zhang, J.; Song, X.; Díaz, E. Project buffer sizing of a critical chain based on comprehensive resource tightness. Eur. J. Oper. Res. 2016, 248, 174–182. [Google Scholar] [CrossRef]
- Eppinger, S.D.; Browning, T.R. Design Structure Matrix Methods and Applications; MIT Press: Cambridge, MA, USA, 2012; ISBN 978-02-6230-142-8. [Google Scholar]
- Browning, T.R. Design Structure Matrix Extensions and Innovations: A Survey and New Opportunities. IEEE Trans. Eng. Manag. 2016, 63, 27–52. [Google Scholar] [CrossRef]
- Sheng, H.T.; Wei, F.J. The research and application of genetic-based design structure matrix optimization algorithm. Chin. J. Manag. Sci. 2007, 15, 98–103. [Google Scholar]
- Yang, Q.; Lu, J. Project optimization and simulation based on DSM rework risk evaluation matrix. Syst. Eng. Theory Pract. 2010, 30, 1065–1071. [Google Scholar]
- Grose, D.L. Reengineering the aircraft design process. In Proceedings of the 5th Symposium on Multidisciplinary Analysis and Optimization, Panama City Beach, FL, USA, 7–9 September 1994. [Google Scholar]
- Tukela, O.I.; Eksioglu, S.D. An investigation of buffer sizing techniques in critical chain scheduling. Eur. J. Oper. Res. 2006, 172, 401–416. [Google Scholar] [CrossRef]
- Geltner, D.M.; Miller, N.G.; Clayton, J.; Eichholtz, P. Commercial Real Estate Analysis and Investments, 2nd ed.; South-Western Educational Publishing: Mason, OH, USA, 2006. [Google Scholar]
- Rajakallio, K.; Cuthbertson, R.; Pulkka, L.; Junnila, S. Creating urban platforms—Opportunities and challenges for innovation in commercial real estate development. Cities 2018, 77, 92–103. [Google Scholar] [CrossRef]
- Yi, B. Housing-demand Suppression or Land-supply Adjustment:A Comparison of Real Estate Control Policy. J. Financ. Econ. 2015, 41, 66–75. [Google Scholar]
Figure 1.
The improved critical chain design structure matrix (CCDSM) scheduling process.

Figure 2.
The impact area of Activity 2.

Figure 3.
The procedure of improved CCDSM modeling.

Figure 4.
Design structure matrix of information interactions between activities.

Figure 5.
Rework probability (RP) matrix.

Figure 6.
Rework impact (RI) matrix

Figure 7.
Result of genetic algorithm optimization.

Figure 8.
Result of banding algorithm optimization.

Figure 9.
Duration interface criticality.

Figure 10.
Resource interface criticality.

Figure 11.
Duration potential criticality.

Figure 12.
Resource potential criticality.

Figure 13.
Duration and resource distribution by Monte Carlo simulations.

Table 1.
Excerpted schedule and related activity parameters.
| No. | Activity Name | Activity Duration (Days) | Activity Resource Consumption (Unit) | Learning Curve (LC) | ||||
|---|---|---|---|---|---|---|---|---|
| Most Optimistic Value (MOV) | Most Likely Value (MLV) | Most Pessimistic Value (MPV) | MOV | MLV | MPV | |||
| 1 | Engage feasibility consultants | 2 | 3 | 6 | 3.84 | 5.3 | 12.49 | 0.3 |
| 2 | Analyze macro markets | 3 | 5 | 10 | 4.16 | 7.81 | 20.28 | 0.5 |
| 3 | Investigate regional market situation | 10 | 13 | 20 | 13.33 | 20.32 | 41.69 | 0.5 |
| 4 | Evaluate marketability options | 3 | 5 | 10 | 3.97 | 7.75 | 20.36 | 0.6 |
| 5 | Assess resource requirements | 2 | 4 | 9 | 4.03 | 7.79 | 20.13 | 0.5 |
| 6 | Analyze market risks | 4 | 6 | 11 | 5.43 | 9.61 | 21.02 | 0.5 |
| 7 | Position projects and clients | 18 | 22 | 35 | 22.13 | 36.78 | 63.43 | 0.7 |
| 8 | Determine types of operation and quantities | 10 | 13 | 20 | 13.33 | 20.32 | 41.69 | 0.5 |
| 9 | Predict supply and demand of products and develop Strengths-Weaknesses-Opportunities-Threats (SWOT) analysis | 15 | 18 | 27 | 19.68 | 28.11 | 55.73 | 0.6 |
| 10 | Estimate project costs | 2 | 4 | 9 | 4.05 | 7.13 | 19.67 | 0.4 |
| 11 | Develop conceptual design | 30 | 35 | 50 | 40.15 | 53 | 100.3 | 0.8 |
| 12 | Confirm building plans | 3 | 5 | 9 | 4.68 | 7.88 | 18.39 | 0.5 |
| 13 | Establish and estimate schedules | 3 | 4 | 7 | 4.34 | 7.04 | 14.69 | 0.6 |
| 14 | Compile design specifications and various indicators | 25 | 31 | 48 | 35.72 | 51.93 | 88.61 | 0.6 |
| 15 | Obtain rough construction costs | 3 | 5 | 10 | 4.97 | 8.16 | 21.33 | 0.5 |
| 16 | Identify permits and approvals | 10 | 13 | 20 | 13.73 | 19.67 | 40.17 | 0.3 |
| 17 | Identify external stakeholders | 5 | 8 | 15 | 7.35 | 13.34 | 30.16 | 0.4 |
| 18 | Identify debt options | 2 | 3 | 5 | 2.87 | 4.63 | 10.25 | 0.4 |
| 19 | Identify equity options | 2 | 3 | 5 | 3.83 | 5.54 | 10.03 | 0.5 |
| 20 | Update financial underwriting | 3 | 5 | 10 | 3.95 | 8.42 | 21.58 | 0.5 |
| 21 | Improve final plan | 3 | 6 | 11 | 4.78 | 10.33 | 23.68 | 0.3 |
| 22 | Complete the first phase of Environmental Site Assessment | 10 | 13 | 20 | 13.73 | 19.67 | 40.17 | 0.3 |
| 23 | Evaluate consultants and contractors | 3 | 5 | 10 | 4.27 | 7.74 | 21.56 | 0.6 |
| 24 | Gain control of site and client | 3 | 4 | 7 | 4.83 | 7.43 | 15.03 | 0.6 |
| 25 | Review and approve | 3 | 4 | 7 | 4.07 | 6.31 | 15.22 | 0.7 |
Table 2.
Result Statistics.
| Degree of Division | Construction Period (Days) | Resource Volume (Units) |
|---|---|---|
| 50% (average) | 587 | 1310 |
| 80% | 661 | 1488 |
| 90% | 708 | 1575 |
© 2019 by the authors. Licensee MDPI, Basel, Switzerland. This article is an open access article distributed under the terms and conditions of the Creative Commons Attribution (CC BY) license (http://creativecommons.org/licenses/by/4.0/).
Share and Cite
MDPI and ACS Style
Ma, G.; Jiang, S.; Zhu, T.; Jia, J. A Novel Method of Developing Construction Projects Schedule under Rework Scenarios. Sustainability 2019, 11, 5710. https://0-doi-org.brum.beds.ac.uk/10.3390/su11205710
AMA Style
Ma G, Jiang S, Zhu T, Jia J. A Novel Method of Developing Construction Projects Schedule under Rework Scenarios. Sustainability. 2019; 11(20):5710. https://0-doi-org.brum.beds.ac.uk/10.3390/su11205710
Chicago/Turabian StyleMa, Guofeng, Shan Jiang, Tiancheng Zhu, and Jianyao Jia. 2019. "A Novel Method of Developing Construction Projects Schedule under Rework Scenarios" Sustainability 11, no. 20: 5710. https://0-doi-org.brum.beds.ac.uk/10.3390/su11205710
Note that from the first issue of 2016, this journal uses article numbers instead of page numbers. See further details here.