An Efficient Representation Using Harmony Search for Solving the Virtual Machine Consolidation


1
Department of Industrial Engineering, Yonsei University, 50 Yonsei-ro, Seodaemun-gu, Seoul 03722, Korea
2
Department of Management Information Systems, Kyonggi University, 155-42, Gwanggyosan-ro, Suwon 16227, Korea
*
Author to whom correspondence should be addressed.
Sustainability 2019, 11(21), 6030; https://0-doi-org.brum.beds.ac.uk/10.3390/su11216030
Submission received: 29 September 2019
/
Revised: 21 October 2019
/
Accepted: 29 October 2019
/
Published: 30 October 2019
(This article belongs to the Special Issue Multi-Utility Energy System Optimization)
Abstract
:A data center with a large number of servers, large storage, and many network devices requires power for cooling to reduce heat generation, air conditioning, and emergency power generation facilities, in addition to power for operation internally consumed by infrastructure equipment. The power consumed by data centers worldwide makes up a large proportion. Although the size of data centers is expected to increase, we are already faced with power problems because stability is prioritized over efficiency when operating data centers in order to meet the Service Level Agreement (SLA) conditions. Most data centers are in a virtualization environment, and virtual machine consolidation using physical machine (PM) transitions to the idle mode through virtual machine (VM) migration has been suggested as one of the most effective ways to reduce the amount of power usage in a data center. This study takes into account the characteristics of virtualization environments and presents an algorithm that effectively solves VM consolidation (VMC) through operator design using a grouping representation method and a meta-heuristic method known as harmony search.
1. Introduction
Data centers around the world are rapidly transforming itself into cloud data centers to create and process large amounts of data due to expansion of businesses such as cloud, big data, artificial intelligence (AI), and Internet of Things(IoT), and are evolving into hyperscale data centers. According to data from Gartner, data center investments were US$181 billion in 2017, increasing 3.87% year on year to US$188 billion in 2018, and is expected to reach US$190 billion by 2019. The amount of cloud-based workloads in data centers is expected to reach 94% in 2021, up from 39% in 2012. The growth in the number of hyperscale data centers, essential for processing and managing exponentially growing volumes of data, has become a global trend. The number of hyperscale data centers increased by 14.2% year on year to 386 in 2017 and to 448 in 2018. It is expected to reach 628 in 2021, a 10.17% increase compared to 2020 [1,2].
A data center comprises a lot of servers, storage and network devices, and in addition to power for running the equipment, they also consume a lot of energy for cooling, air conditioning, and emergency power reserves. From 2005 to 2010, data centers saw a rapid increase of power consumption by 24%. It was reported that data centers accounted for approximately 1.1% to 1.5% of the global energy use and approximately 2% of the global greenhouse gas emissions during this period. Based on this, many experts predict that data center energy consumption will continue to increase rapidly. Since data centers need to provide service 24/7/365 without interruption, a power-efficient design and operation are important; however, many governments and corporations continue to operate data centers inefficiently. In many cases, a server operates on its initial setup from its initialization to its disposal, and the requirement for vendors to isolate and run applications is another cause of inefficient server operation [3,4,5,6,7,8].
Many studies have been conducted to solve the power consumption problem of data centers. Typical methodologies include a facility-efficient approach, which improves the efficiency of data center infrastructure facilities by optimizing the airflow, temperature, cooling, and power supply, and an operation-efficient approach, which reduces the number of servers through virtual machine (VM) consolidation and redeployment technique. An analysis of various methodologies that can reduce power consumption in data centers shows that the most efficient power saving method is server transitions to the idle mode as much as possible [9,10].
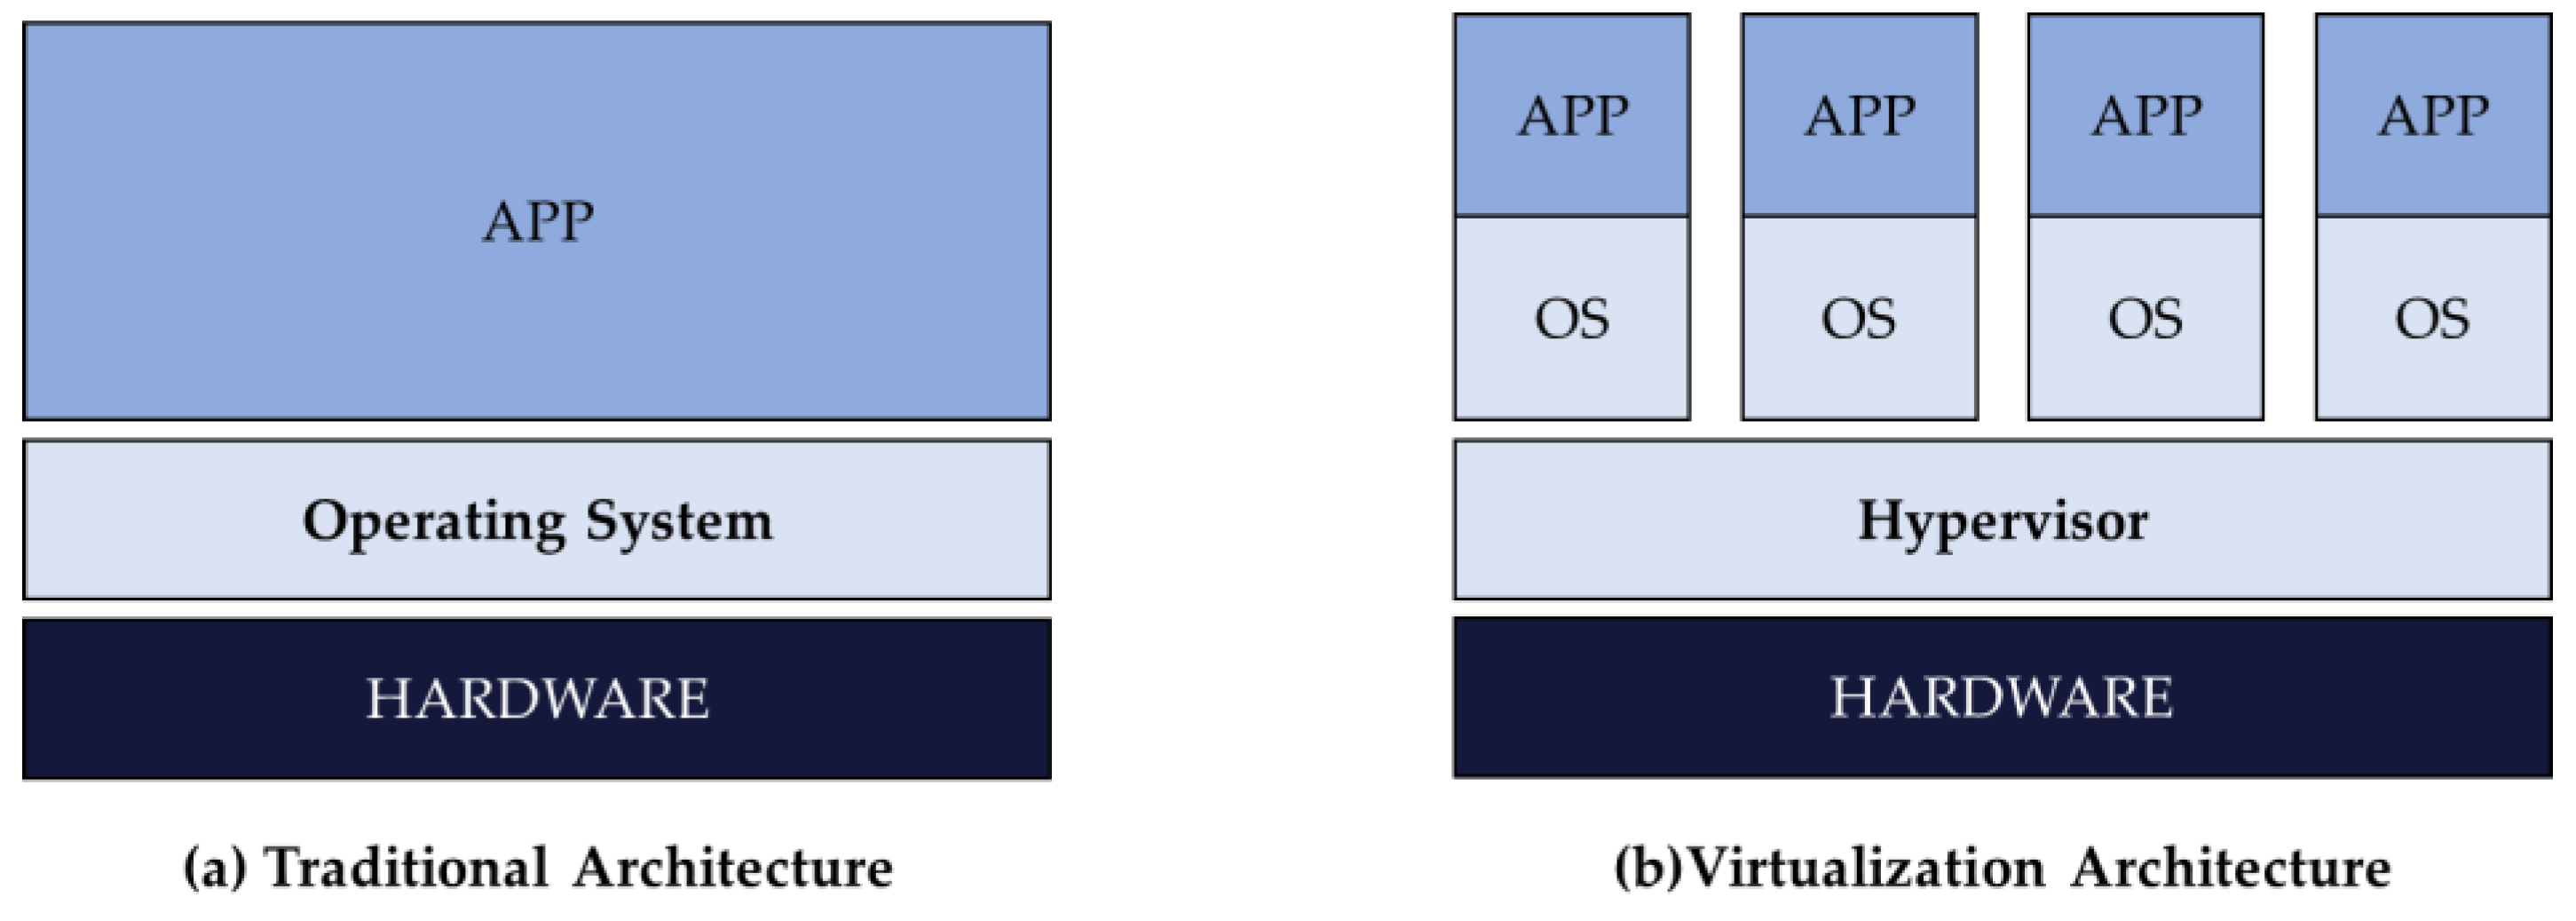
Most data centers today are managed by using virtualization technology that logically reconfigures a physical machine (PM) into multiple virtual machines (VMs). Unlike the traditional structure in which one operating system is installed on one server, virtualization technology allows several operating systems to be run on one server by installing virtualization software known as hypervisor, as shown in Figure 1. In Figure 1b, one Operating Systems(OS) unit is called VM, and a certain resource (CPU, memory, etc.) of the server is allocated to the VM. Server virtualization can be expected to reduce complexity and costs and to increase flexibility and agility, but there are frequent service level agreement violations even though there are enough resources available. The operation status still shows lower-than-expected levels, with poor resource utilization due to inefficient VM deployment, the lack of agile response due to an increased number of VMs, and a waste of power and budget of data centers with unnecessary server operation.
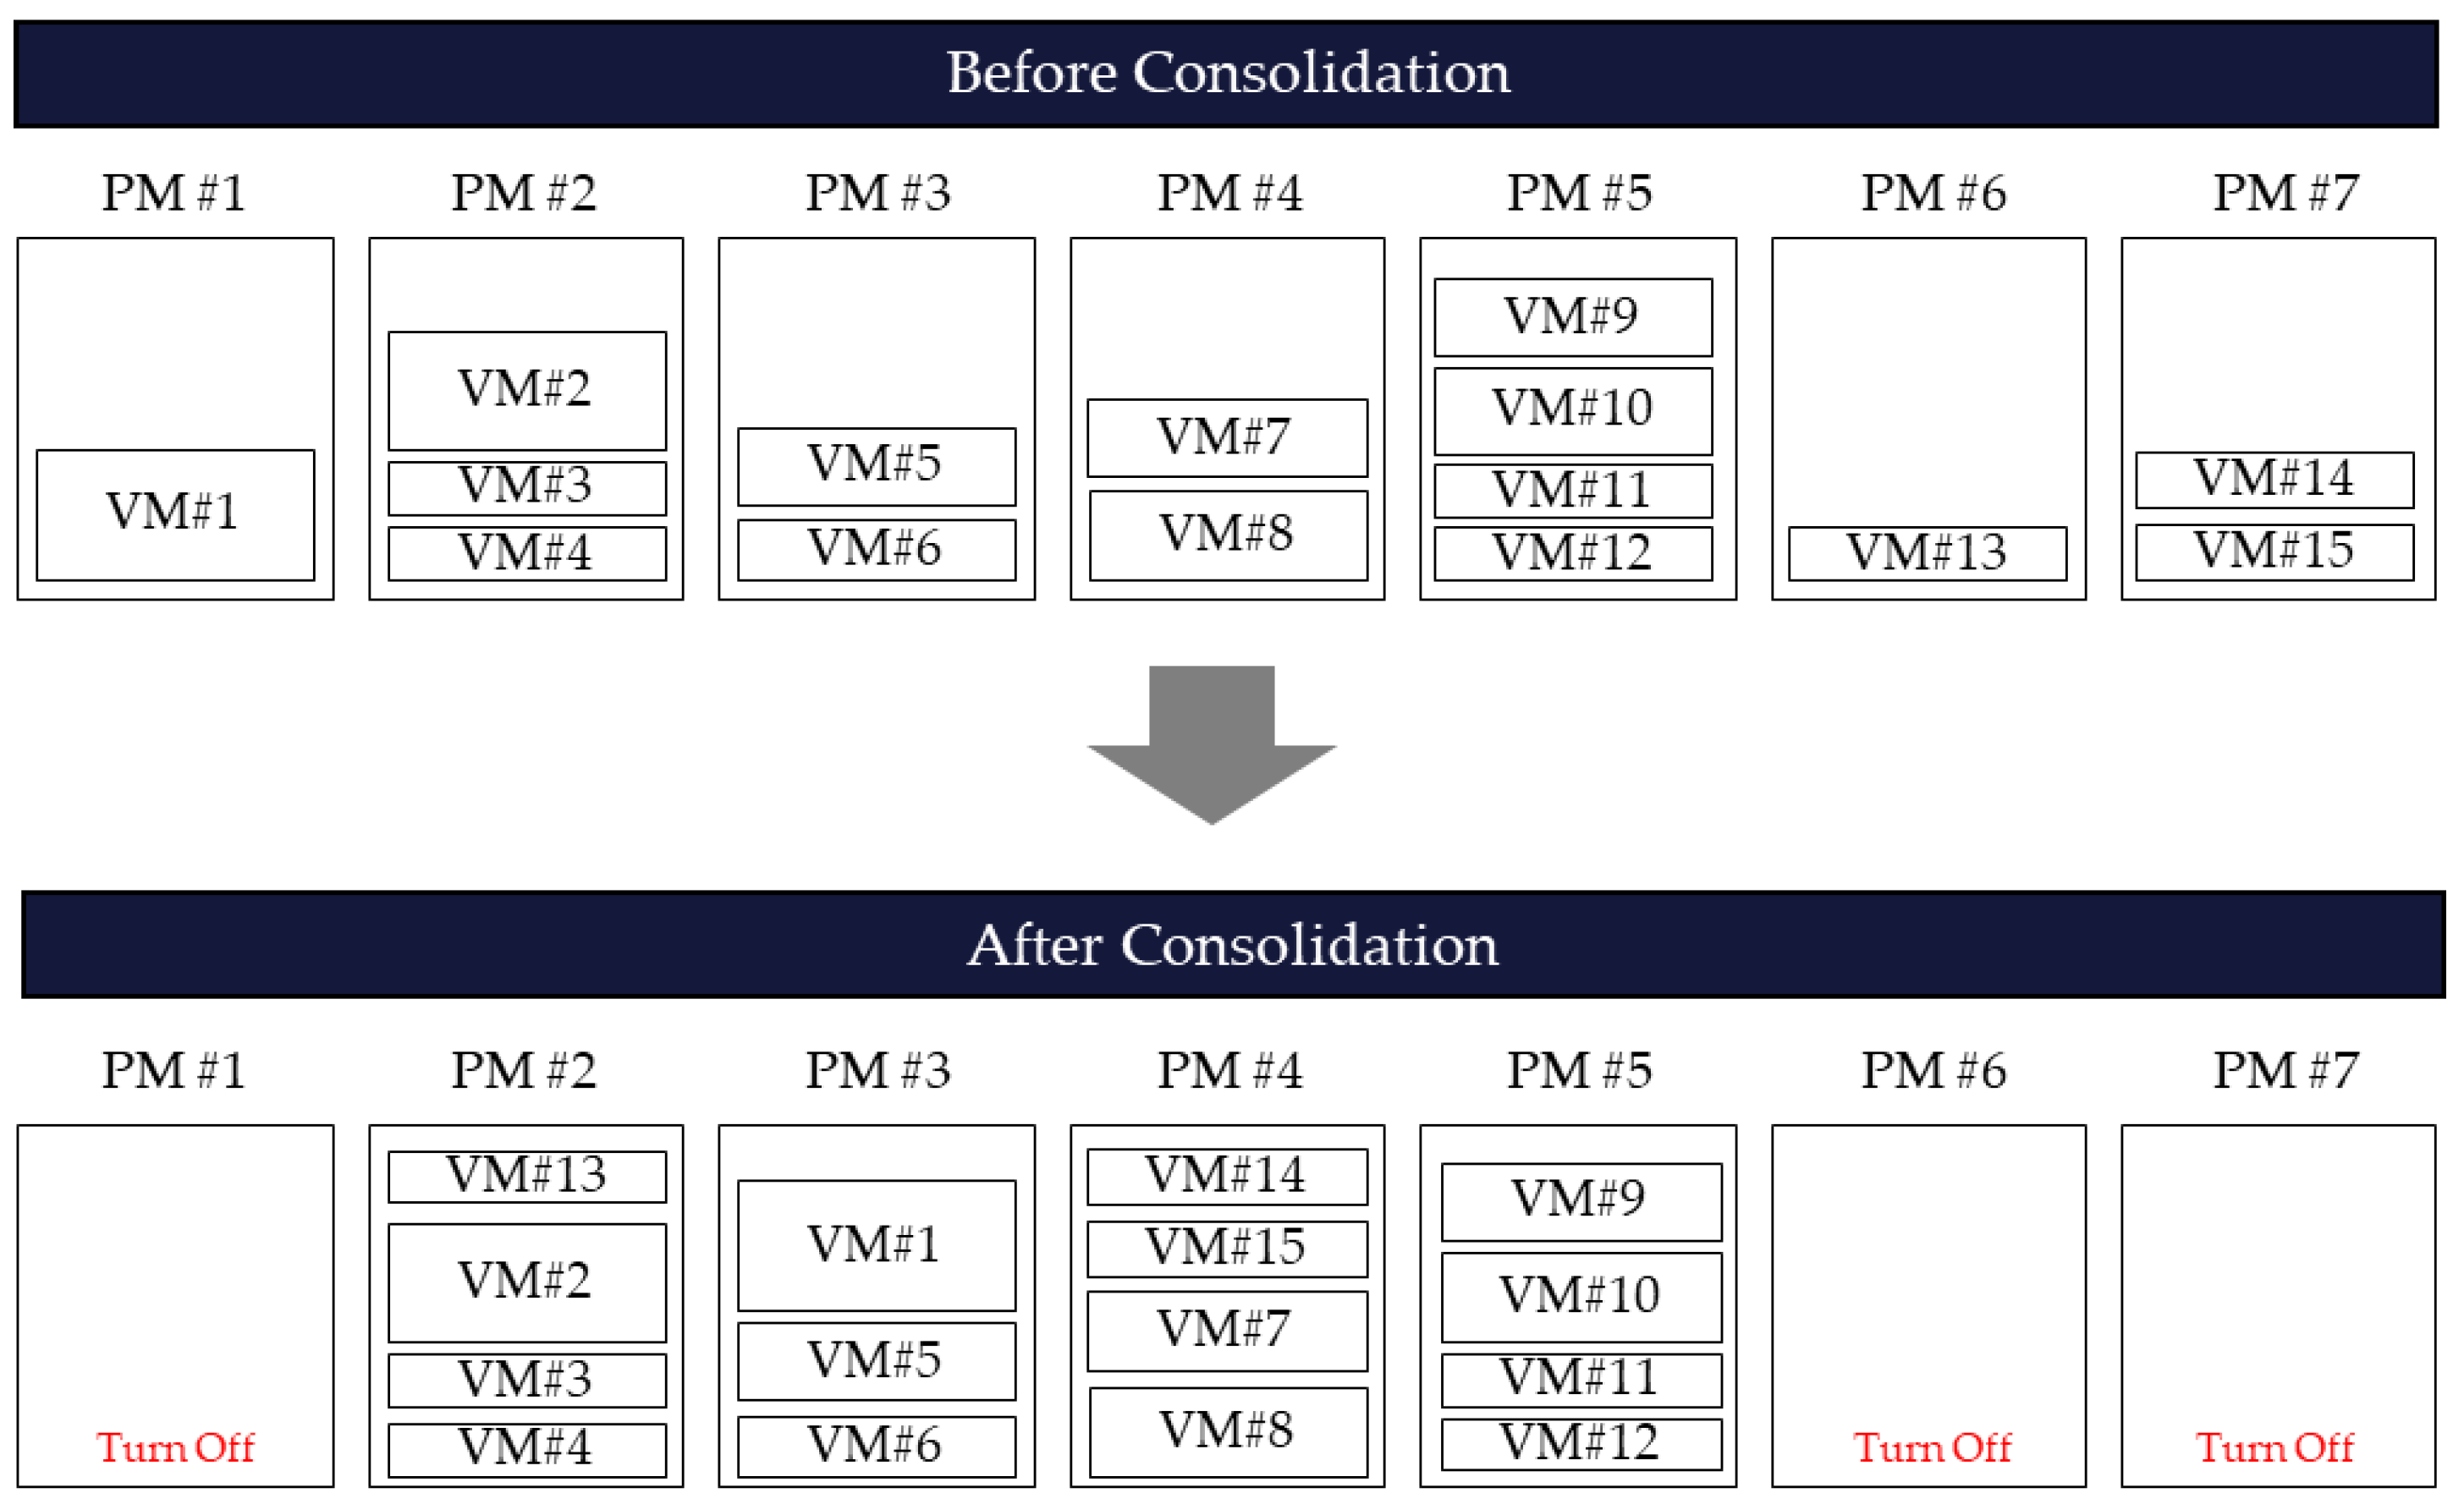
Hypervisor can move a running VM to another PM and supports the live migration function, which maintains the application’s service on the move [11]. If the destination PM can allow the resources allocated to the VM, migration is possible. If all VMs located in one PM are migrated to another PM, the existing server can be stopped because it is empty. Migrating VMs for server transition to the idle mode and minimizing power usage is called virtual machine consolidation (VMC), as shown in Figure 2. This study aims to induce the transition of PMs to the idle mode, which is the most efficient power saving method for data centers, through VMC, and proceeds with efficient algorithm design for VMC problem solutions.
This paper is organized as follows: Section 2 describes VMC and related research. Section 3 defines the problems of VMC that this study aims to solve. Section 4 describes the design of metaheuristic technique for solving VMC problems. Section 5 describes the experiment design and results, and Section 6 describes the conclusions.
2. Literature Review
VMC basically has the same mechanism as that of the bin packing problem. The bin packing problem is a typical NP-hard problem in which N items are filled into M bins as much as possible, under the assumption that N items have fixed weight, size, etc. and that M bins have a limited maximum capacity. The difference between the bin packing problem and VMC is that the bin packing problem is to fill items into an empty bin in an initially clean state, whereas VMC is more difficult as the VM that already exists in PM needs to be re-allocated. In addition, unlike the bin packing problem, which only considers the surface area and, additionally, the value, VMC has many things to consider such as CPU occupancy, memory usage, network bandwidth, and so on.
PM and VM deployment and the addition and removal of PMs and VMs due to new events are ongoing and common tasks in data centers. Initially optimized deployment reduces the operational efficiency and stability of systems over time due to operational changes in services and newly added PMs and VMs. VMC technique keeps data center resources optimized by redeploying VM tasks to remaining PM resources and migrating VMs from resource-lacking PMs to other locations [12]. This optimization is an important means of managing data centers’ Service Level Agreements (SLAs) and Quality of Service(QoS). In addition, redeployment of resources can keep PMs in the idle state. Research has shown that reducing the number of PMs through VMC is the most obvious way to minimize data center energy consumption because nearly 70% of the server’s energy is consumed even with a server simply being turned on without a VM [13]. VMC migrates VMs from underutilized PMs to highly utilized PMs, consolidating VMs into fewer PMs than before. The state of a PM without a VM can be changed from an active state (that is, a turned-on state) to a low energy consumption state such as sleep mode, thereby minimizing energy consumption. Several studies on VMC have been undertaken to balance energy efficiency with QoS, which is well known as an NP-hard problem that can no longer solve sudden computational complexity by intuitive human judgments or optimization methodologies using formulas such as integer programming in large-scale and complex data center environments [10].
VMC can be classified by objective function into energy consumption minimization, network traffic minimization, economical revenue maximization, performance maximization, resource utilization maximization, and so on [14,15,16,17,18,19]. Among these, energy consumption minimization, performance maximization, and resource utilization maximization belong to a similar theme. The most common problem was minimizing the number of PMs or minimizing the power as calculated directly by the researcher. The problem of minimizing energy consumption through VMC inevitably correlates with VM migration minimization and SLA violations. Live migration is an expensive operation that includes CPU throughput for the source PM, link bandwidth between the source and target PMs, service downtime in the migration VM, and overall migration time. As it is a sensitive task that is also related to the stability of service operations, minimizing VM migration also becomes an important objective function. Migration has a different weight depending on the service sensitivity of the task. Due to slight downtime, certain sensitive service tasks may not be able to migrate VMs if they put all of their value on service stability rather than economic utility. SLAs are an important requirement for data center operations to maintain the desired QoS, and QoS requirements are typically formulated in an SLA format that specifies service level requirements for the data center in terms of minimum latency or maximum response time.
VMC is usually a matter of determining the following three pivotal components [10]. First is source host selection. A PM set is selected among all PMs from which the VM is to be migrated. Generally, selection is made using threshold-based methods, which include static and adaptive methods. The adaptive threshold-based method is generally used in most cases. Second is VM selection. At least one VM is selected from source PM for migration. For this step, methodologies such as random choice, minimization of VM migration, high potential growth, minimization of migration time, and maximum correlation are commonly used. Third is destination PM selection. Lastly, destination PM selection is a series of processes that select the PM for the deployment of the selected VM. Various methodologies exist including random PM selection, optimization, heuristic, metaheuristic, etc.
When the existing research is classified by methodology for solving VMC, there are studies using optimization techniques such as binary integer programming, constraint programming, dynamic programming, integer linear programming, linear programming, etc. The limitations include that the conditions were simplified for solutions and the execution time was too long compared to performance. Generally, about 10 to 20 VMs are allocated to one PM. Since it is difficult to derive the optimal value and it takes a long time when the size of PM is large, most studies used heuristics. As this is also an NP-hard problem, it is more efficient to approach it with a heuristic or metaheuristic method than with an optimization method. Heuristic techniques include studies using best fit decreasing (BFD), best fit (BF), first fit (FF), and first fit decreasing (FFD), while many studies using the greedy algorithm also exist. Recently, due to the increasing complexity of VMC following the increased size of data centers, many studies on methodologies using metaheuristics are being conducted. Y. Gao [20] and four others presented the ant colony optimization (ACO) suitable for a multi-objective problem in order to reduce wasted server resources and power, and compared it with the genetic algorithm (GA) and max–min ant system in a study. K.Y. Chen [21] and four others calculated the cost of VM deployment and solved the problem of minimizing the cost with cut-and-search. C.C.T. Mark [22] and two others presented an evolutionary algorithm that predicts the resource demands of VMs and optimizes VM deployment to minimize costs. A.C. Adamuthe [23] and two others designed the GA suitable for VM deployment and compared the performance with FFD. G. Wu [24] and three others solved the problem of maximizing load balancing and profits and minimizing the waste of resources using GA, NSGA and NSGA-II. Y. Wu [25] and two others used simulated annealing (SA) to solve a VM deployment problem [26], and T. Ferreto and two others proposed the Tabu search (TS) algorithm that ensures that migration is completed within the specified maximum time.
Virtualization has a characteristic that the size of the VMC problem is large-scale because multiple VMs are assigned to one PM. For this reason, many studies have applied metaheuristic because it is difficult to solve the global optimal solution. As a result of analyzing the existing studies using metaheuristics, only the design of the algorithm is presented, and few studies have suggested how to solve the large-scale problem effectively. In this study, we propose a grouping representation method to effectively searches for optimal solutions even at large scale, reflecting the characteristics of VMC.
3. Virtual Machine Consolidation Modeling
VMC can reduce PM power through VM migration, but VM migration is one of the tasks to avoid. This is because virtual machine migration itself is a resource-intensive task, and there is slight downtime during the migration [11]. From a practical point of view, administrators should also be aware of the mapping information of PMs and VMs. If the mapping information of multiple PMs and VMs is changed frequently, the complexity of management points will increase. For these reasons, VM migration is rarely used during operation and is used to plan a regular inspection schedule in advance and migrate a VM that is powered off or suspended between hosts (cold migration). Therefore, this study reflects such environments of data centers and considers the VMC’s original purpose of reducing the amount of power and minimizing the number of VM migrations. VMC constraints are set as follows.
VM allocation constraints: Virtualization technology makes it possible to assign multiple VMs to a single PM. This is indicated as in Equation (1) and shows whether the VM has been allocated to the PM. The value is 1 when allocated; if not, the value is 0. The condition is that a VM cannot be assigned to multiple PMs. Therefore, the sum of for VM j should be 1 as in Equation (2), and it means that the VM should be allocated to one PM.
PM capacity constraints: The number of VMs allowed by PM can be calculated through CPU and memory. As in Equations (3) and (4), the CPU usage () and memory usage ( of PMis calculated as the total sum of the CPU () and memory ( of VMs allocated to the PM. In general, PM is set to have a workload not exceeding a certain threshold for stable operation. In other words, PM ’s workload should not exceed the threshold (), and thus the usage is calculated by dividing the quantity of CPU and Memory currently being used by the total capacity of (, of the CPU and Memory of the PM.
PM released constraints: PMs without any VMs can be turned off to reduce power. Equation (4) indicates the value of 0 if at least 1 VM is allocated to the PM because PM cannot be released; otherwise, it indicates 1. It is used as the sum ( of the number of released PMs in the calculation of the objective function, and is calculated as in Equation (8).
Number of VM migration calculation: In the initial state, VMC derives , the PM–VM allocation information through an operation. When the initial PM–VM allocation information is and the PM–VM allocation information changed through VM migration is , the number of migrations is calculated as shown in Equation (9).
Objective function: Murtazaev et al. [27] refers to migration efficiency as a performance measure that measures the maximum of transitions of PMs to the idle mode with minimum migrations. The higher the value, the higher the efficiency. For example, if three PMs transition to the idle mode by three migrations, the migration efficiency is 100%. The objective function of this study is to maximize migration efficiency, and the formula for calculation is as in Equation (10).
The primary goal of this study was for PM transition to the idle mode, which is the basic purpose of VMC, and at the same time, the goal was to maximize PM transitions to the idle mode with minimum migrations. Since VMC is known as an NP-hard, a metaheuristic suitable for this was adopted as a methodology. Section 4 describes the efficient metaheuristic operator design for solving VMC problems.
4. Proposed Grouping Harmony Search for Virtual Machine Consolidation
This section described the detailed procedures of harmony search (HS) and grouping harmony search (GHS), one of the metaheuristic techniques used to solve VMC, and the contents of the operators designed to efficiently solve VMC problems.
4.1. Overview of Harmony Search
HS is an optimization algorithm that was created based on the observation that better chords are produced by repeated practice in improvisation of jazz. This refers to a series of processes that the most beautiful chords (global optimum) can be made through repetitive practice (iteration) when played by a variety of instruments.
In the case of GA, inspired by population genetics inspired by population genetics, generates new genes from two genes, but HS generates new solution from multiple solution, which has a high probability of searching for global optimal. Compared to SA and TS, which are typical single solution based metaheuristics, population based HS has a high global search capability. In the case of SA and TS, it is possible to drive a good quality through a mechanism that probabilistically adopts a bad solution. When HS generates a new solution, it adopts a quality solution within the population and searches for an optimal solution.
HS consists of three operators in total: memory considering, pitch adjusting, and random playing. Each operator determines the frequency of operation based on predefined parameter values. The pseudo code of HS is shown in Table 1.
HS generates one solution (HM, harmony memory) per iteration (line 5–17). New Harmony x’ is generated through memory considering, pitch adjusting, and random playing operators by increasing the index (line 6). The operator of HS generates the first random number (line 7) to determine whether to calculate the memory considering (line 8). If the first random number is smaller than the predefined harmony memory considering rate (HMCR), memory considering is executed. If the first random number is larger than HMCR, random playing is executed (line 13). Random playing is a method of adopting the value of one of the feasible solution groups. Memory considering adopts the value of one of several solutions of harmony memory size (HMS). When the solution is generated through memory considering, the operation for pitch adjusting is determined by generating a second random number. If the second random number is smaller than the predefined pitch adjusting rate (PAR), pitch adjusting is executed (line 10). Pitch adjusting means the neighboring value of the solution generated by memory considering. The target value is calculated once x’ is generated, and if it has a better value than the target value of the worst HM in the HMS, the solution is replaced with new harmony (line 16–17). HS repeats the above process until the end condition is met.
4.2. Grouping Representation for Virtual Machine Consolidation
Harmony search is population-based metaheuristics that generate new HMs by combining multiple HMs and has the advantage of having a high degree of diversification; however, as a result of controlling a large number of HMs, there is a disadvantage that computation times increase compared to single solution metaheuristics. As the size of the node grows, the HMS also needs to grow to increase the efficiency of searching for a solution, so the problem occurs when handling a large-scale problem. To solve this problem, we adopted grouping representation in this study for the efficient design of algorithms.
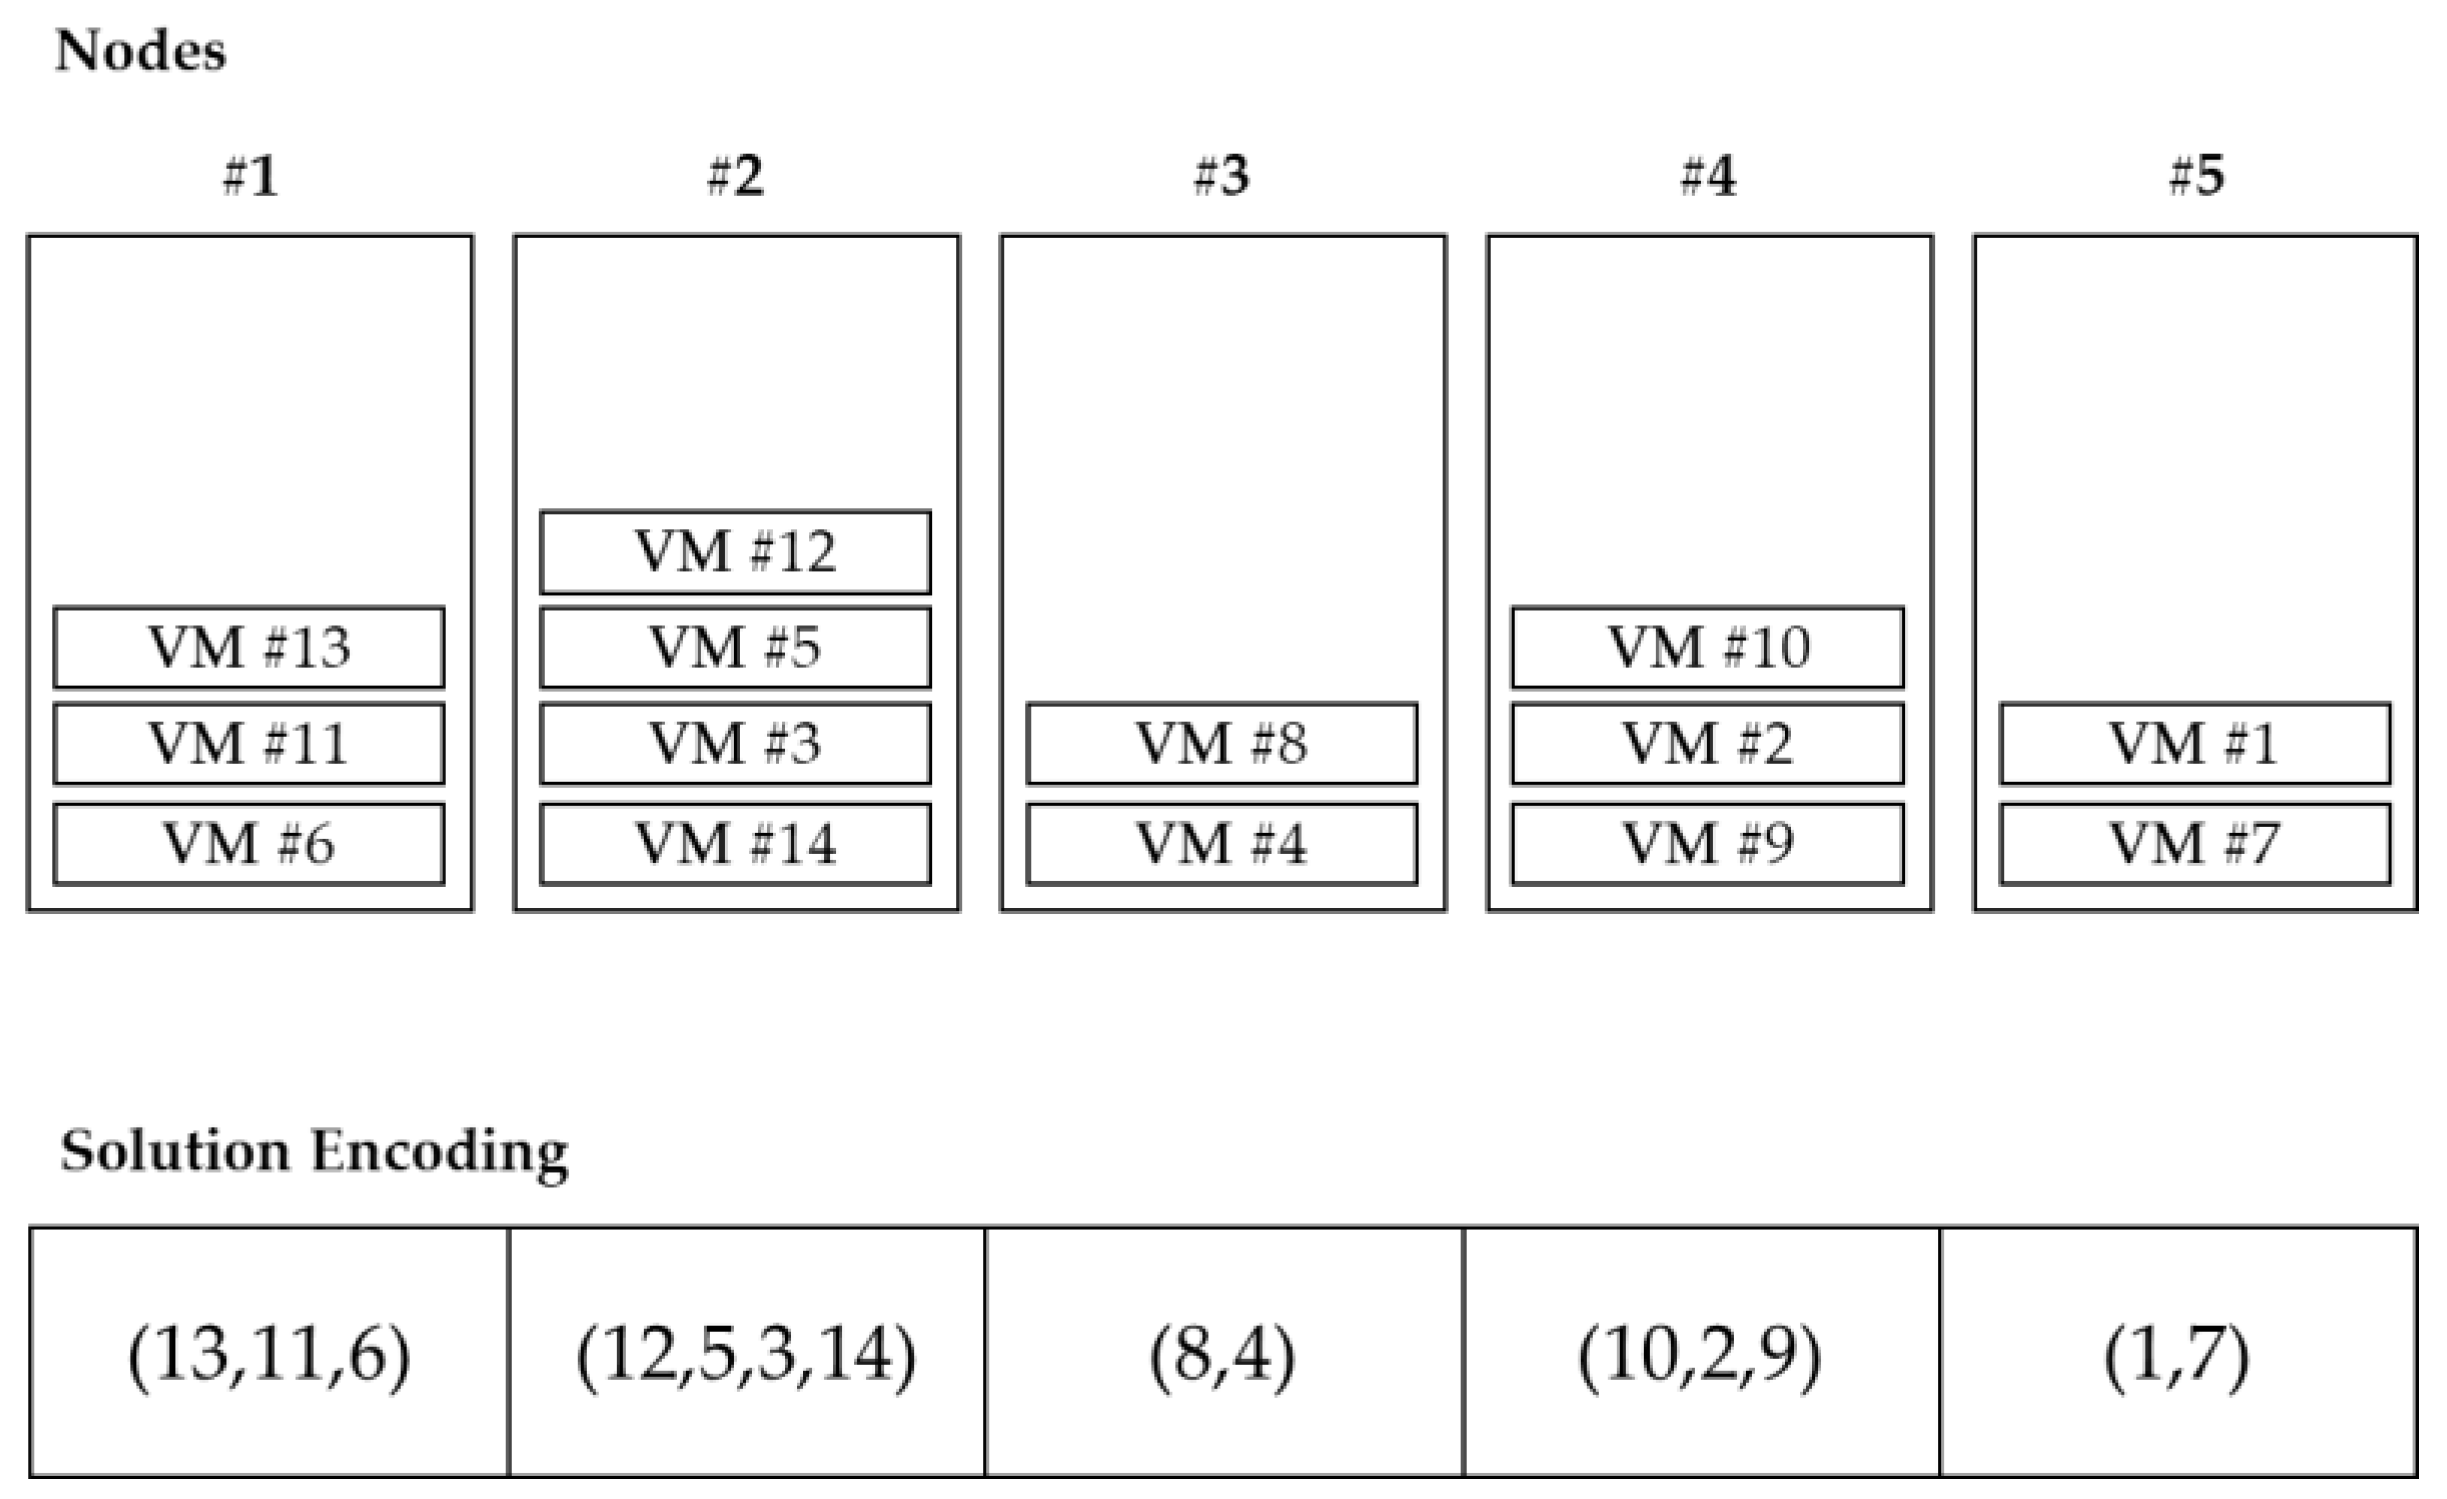
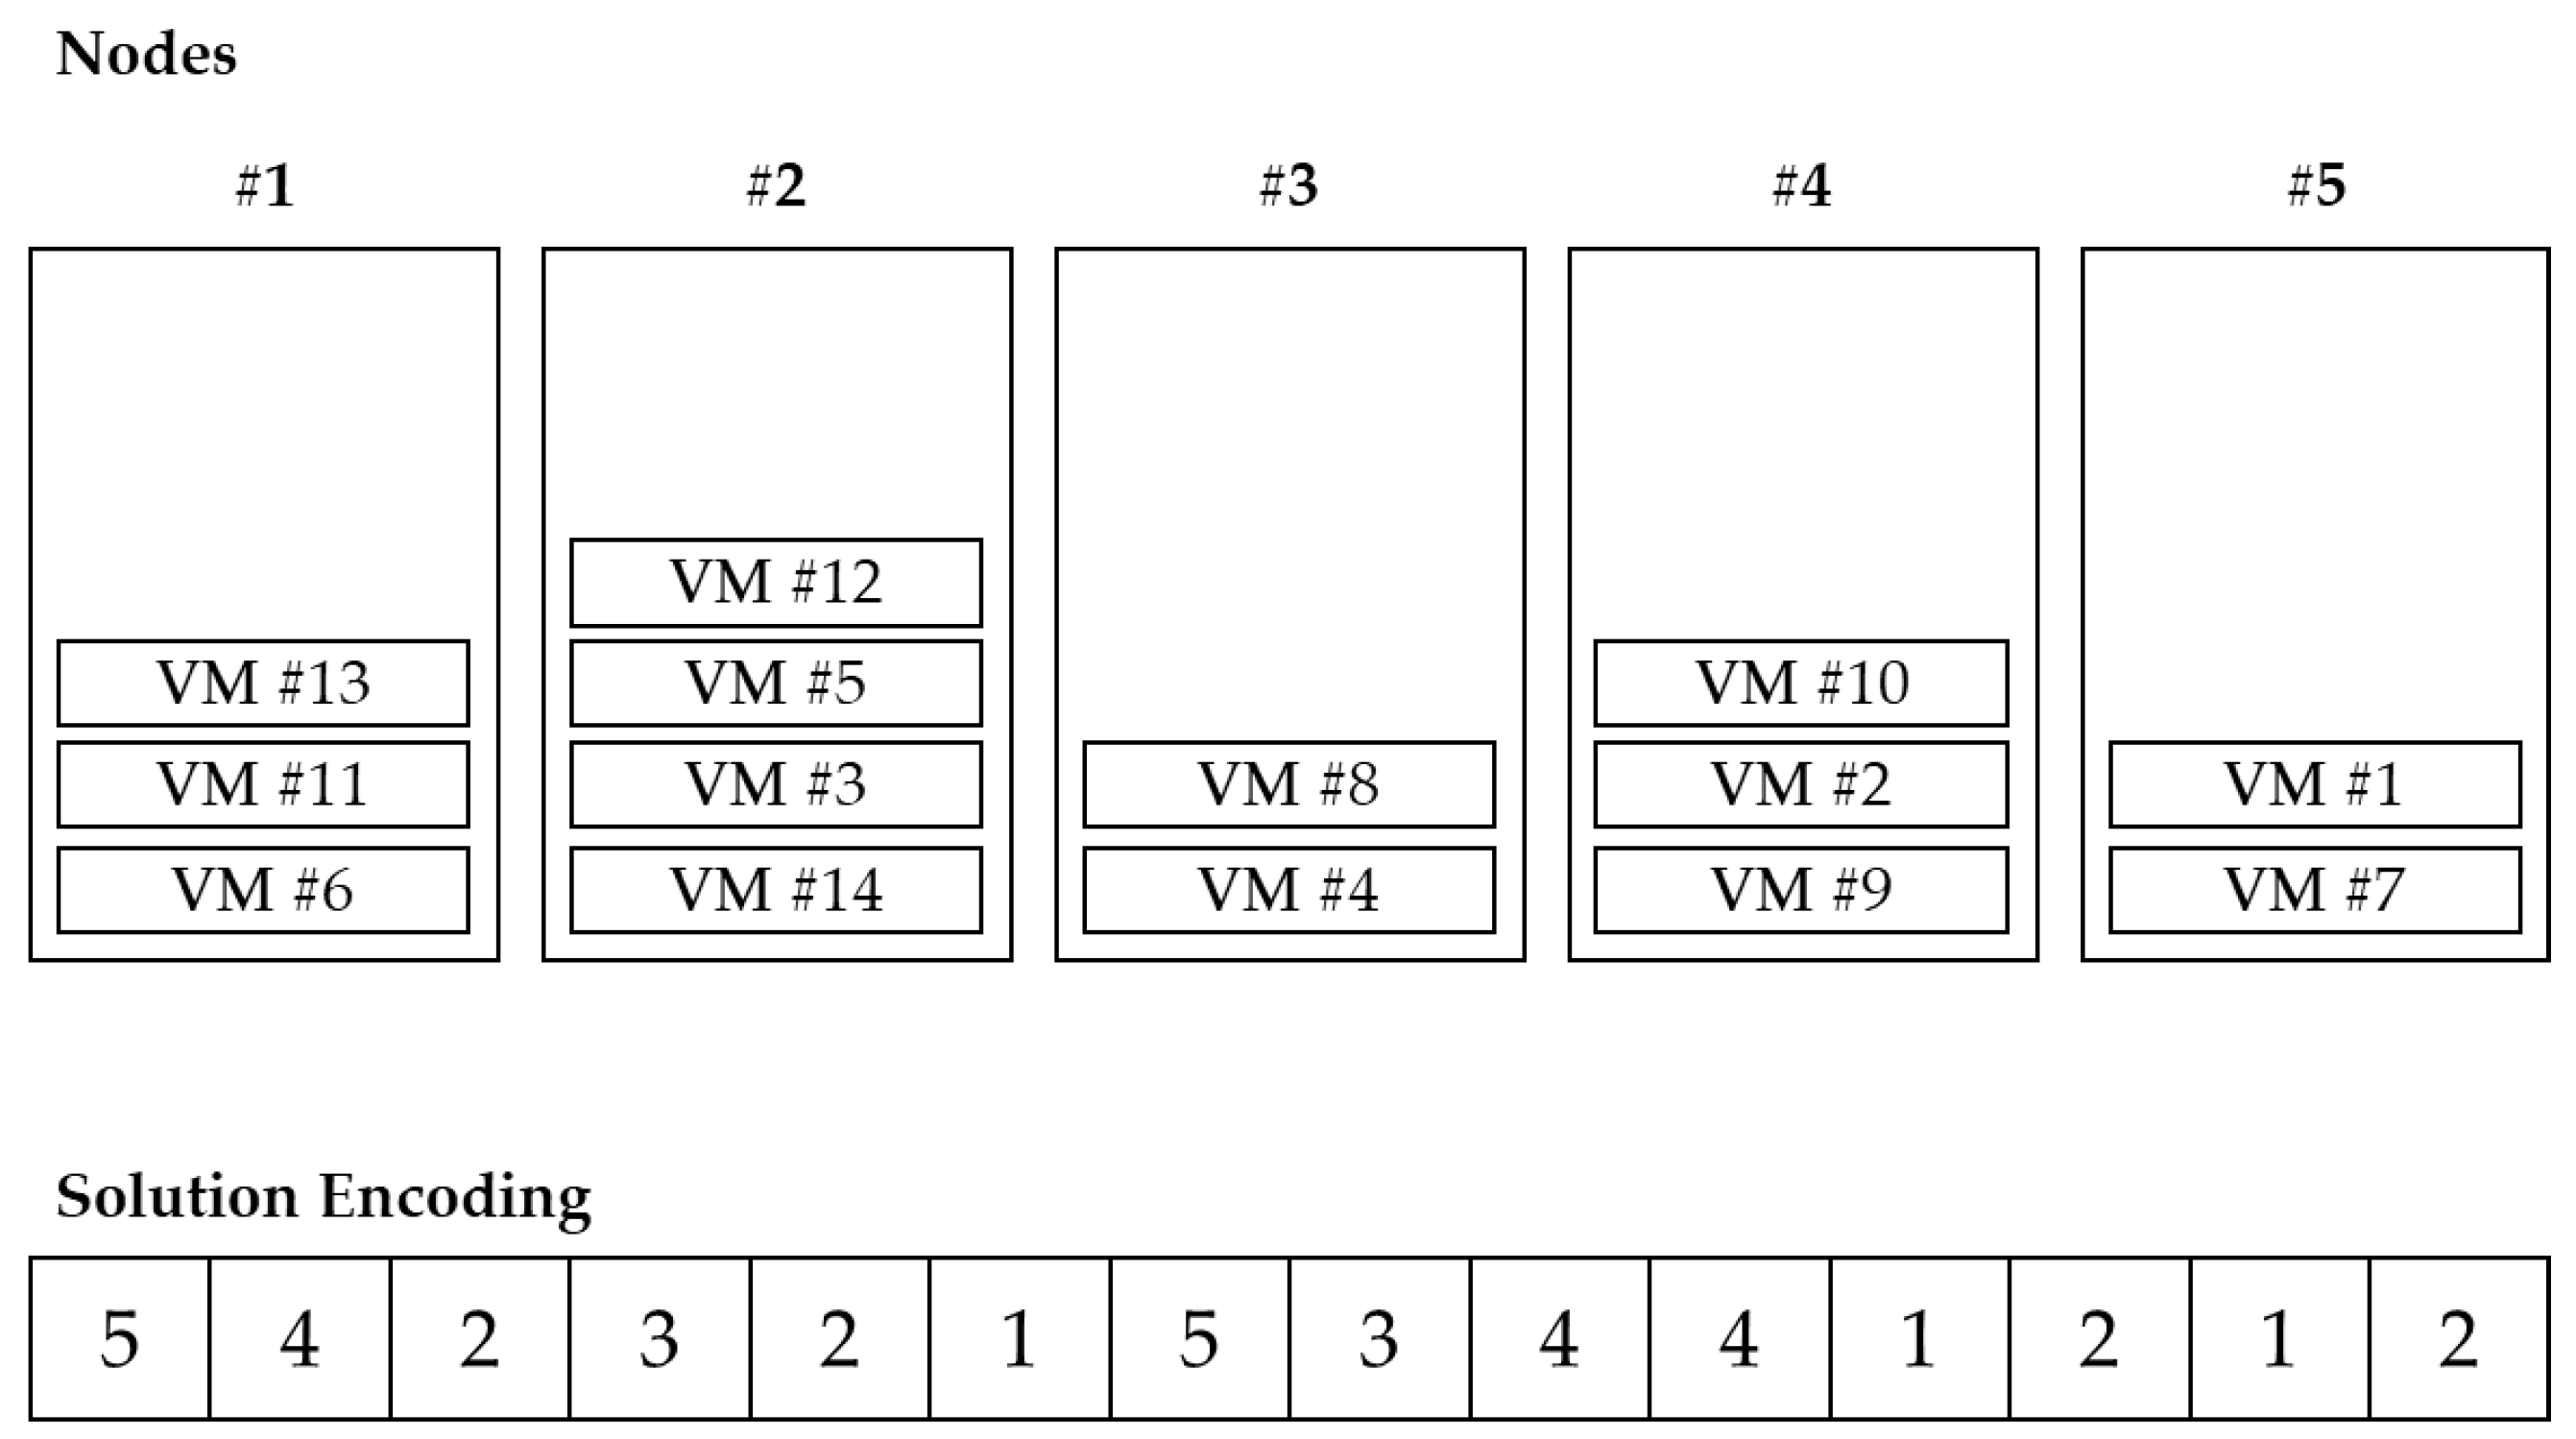
VMC belongs to grouping problems, and the ordering of objects within a group is meaningless. In other words, the combination of VMs located in the PM is important, not the order in the group. Since it also deals with virtualization environments, the number of PMs is basically smaller than the number of VMs. Since there are multiple VMs in one PM, if the problem size is adjusted, the increase in VM is higher than the increase in PM. If the solution is encoded in the permutation form of the VM, the length of the solution also increases as the number of VMs increases. This method is inefficient when searching for a solution as the solution space is increased with many duplicate solution representations. Therefore, PM-oriented representation is more efficient than VM-oriented solution representation. Falkenauer [30] proposed a one-gene-for-one-group method for one solution grouping problem. With this in mind, this study represented PM and VM information based on groups as shown in Figure 3. The index of each array indicates the index of PM, and the value of each array indicates the index of VM located in the corresponding PM, which is controlled in the form of a list.
4.3. Pitch Adjustments for Virtual Machine Consolidation
HS consists of three operators—memory considering, pitch adjustment, and randomization. Among them, the operator that directly changes the new HM is pitch adjustment. VMC has to decide the source PM selection, VM selection, and destination PM selection as a problem of migrating VM located in one PM to another PM. The pitch adjustment operator changes the solution by determining the above three factors. The criteria for determining each problem are as follows.
4.3.1. Source PM Selection
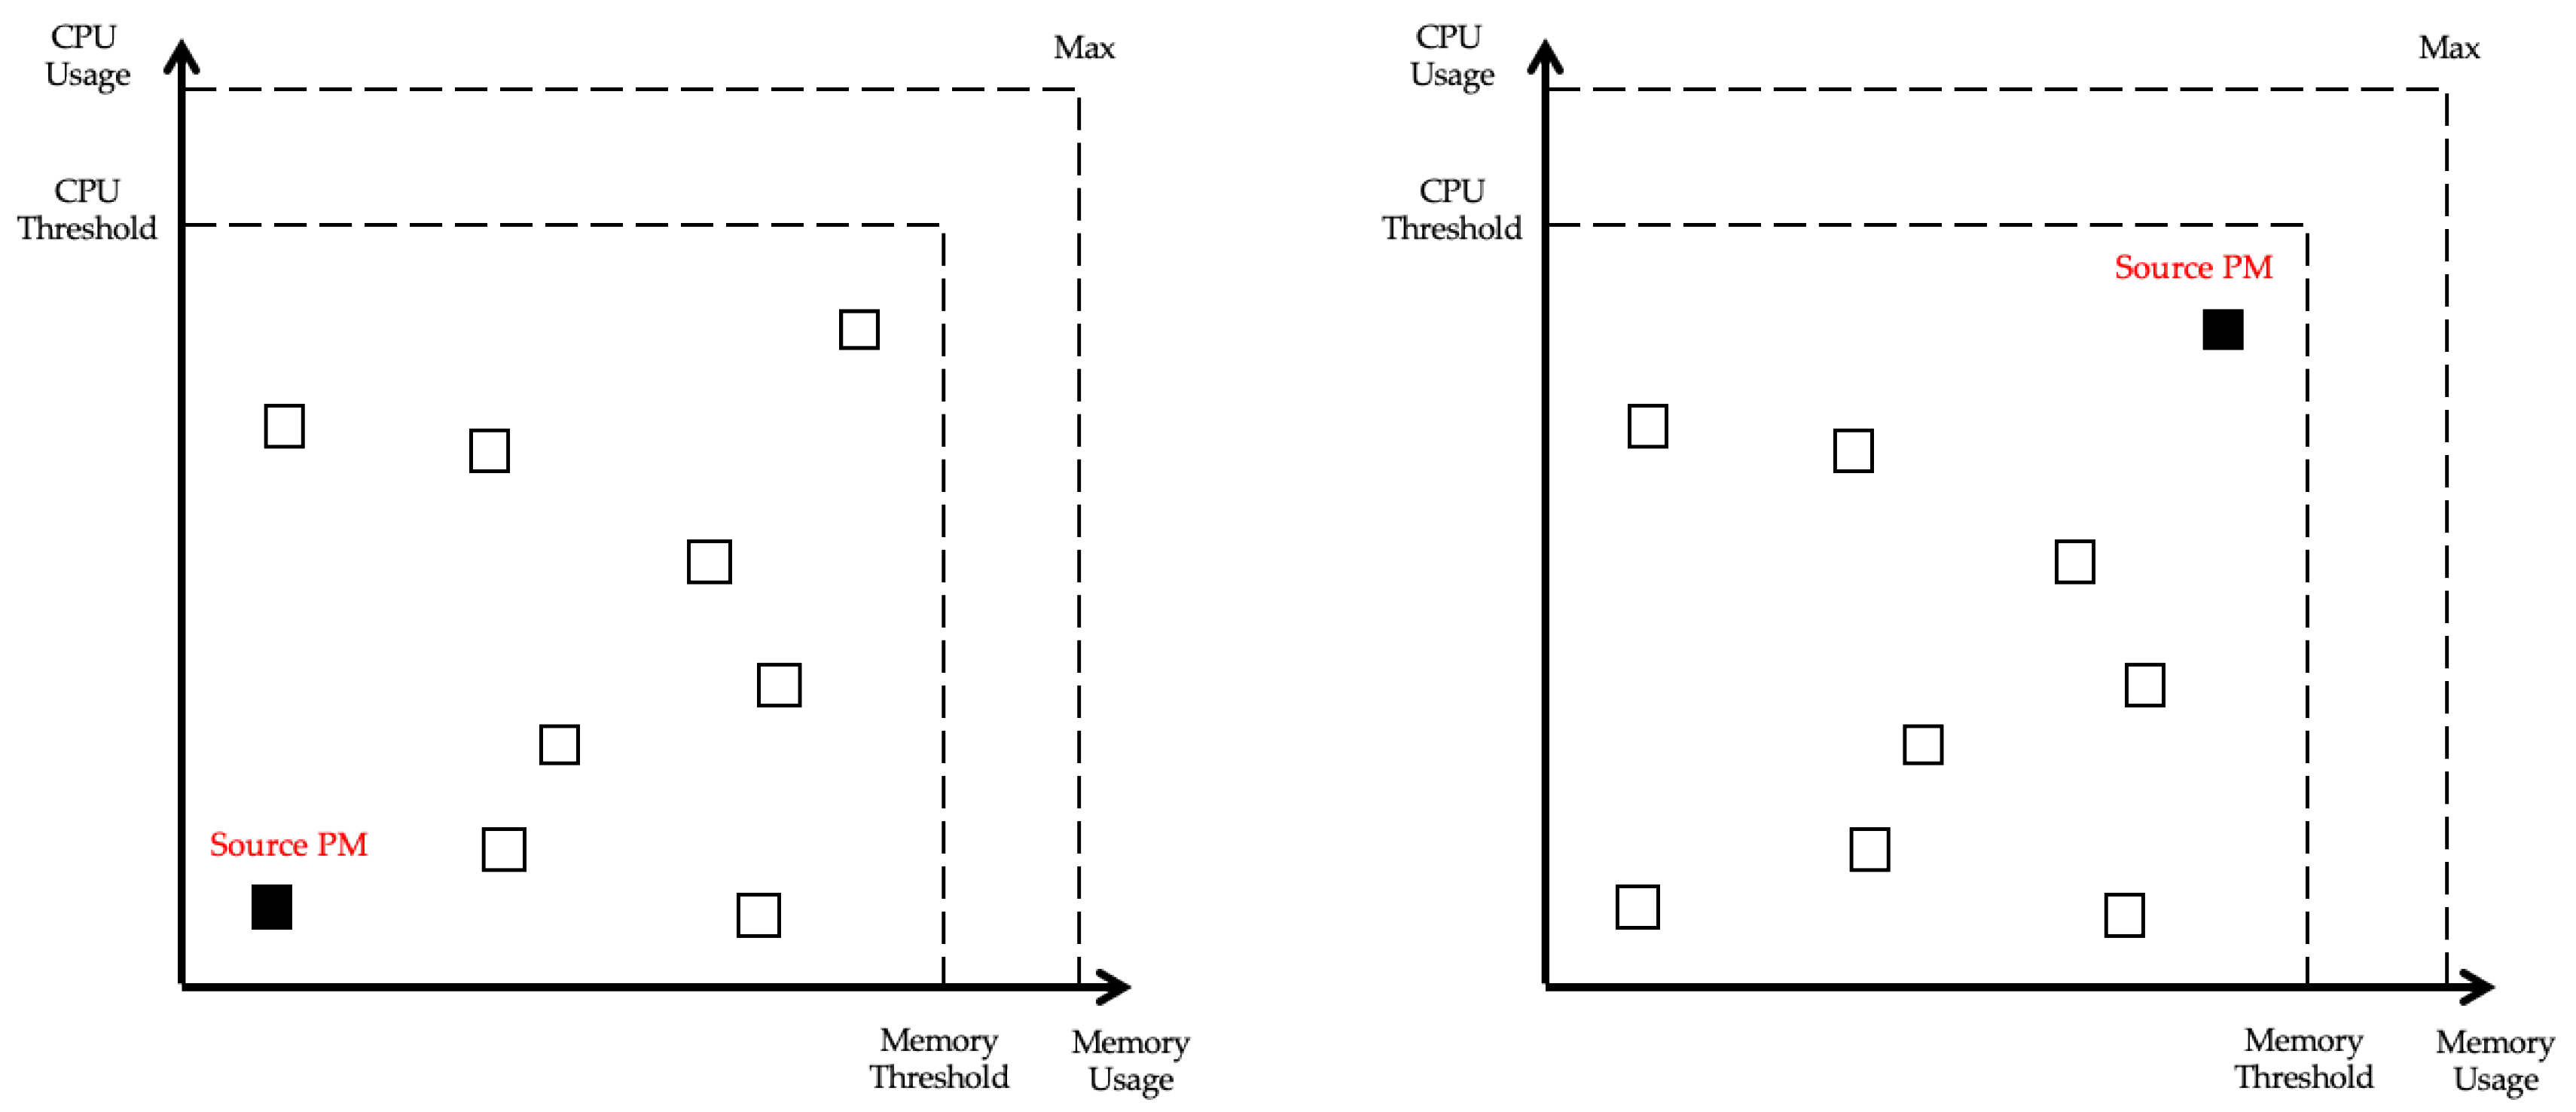
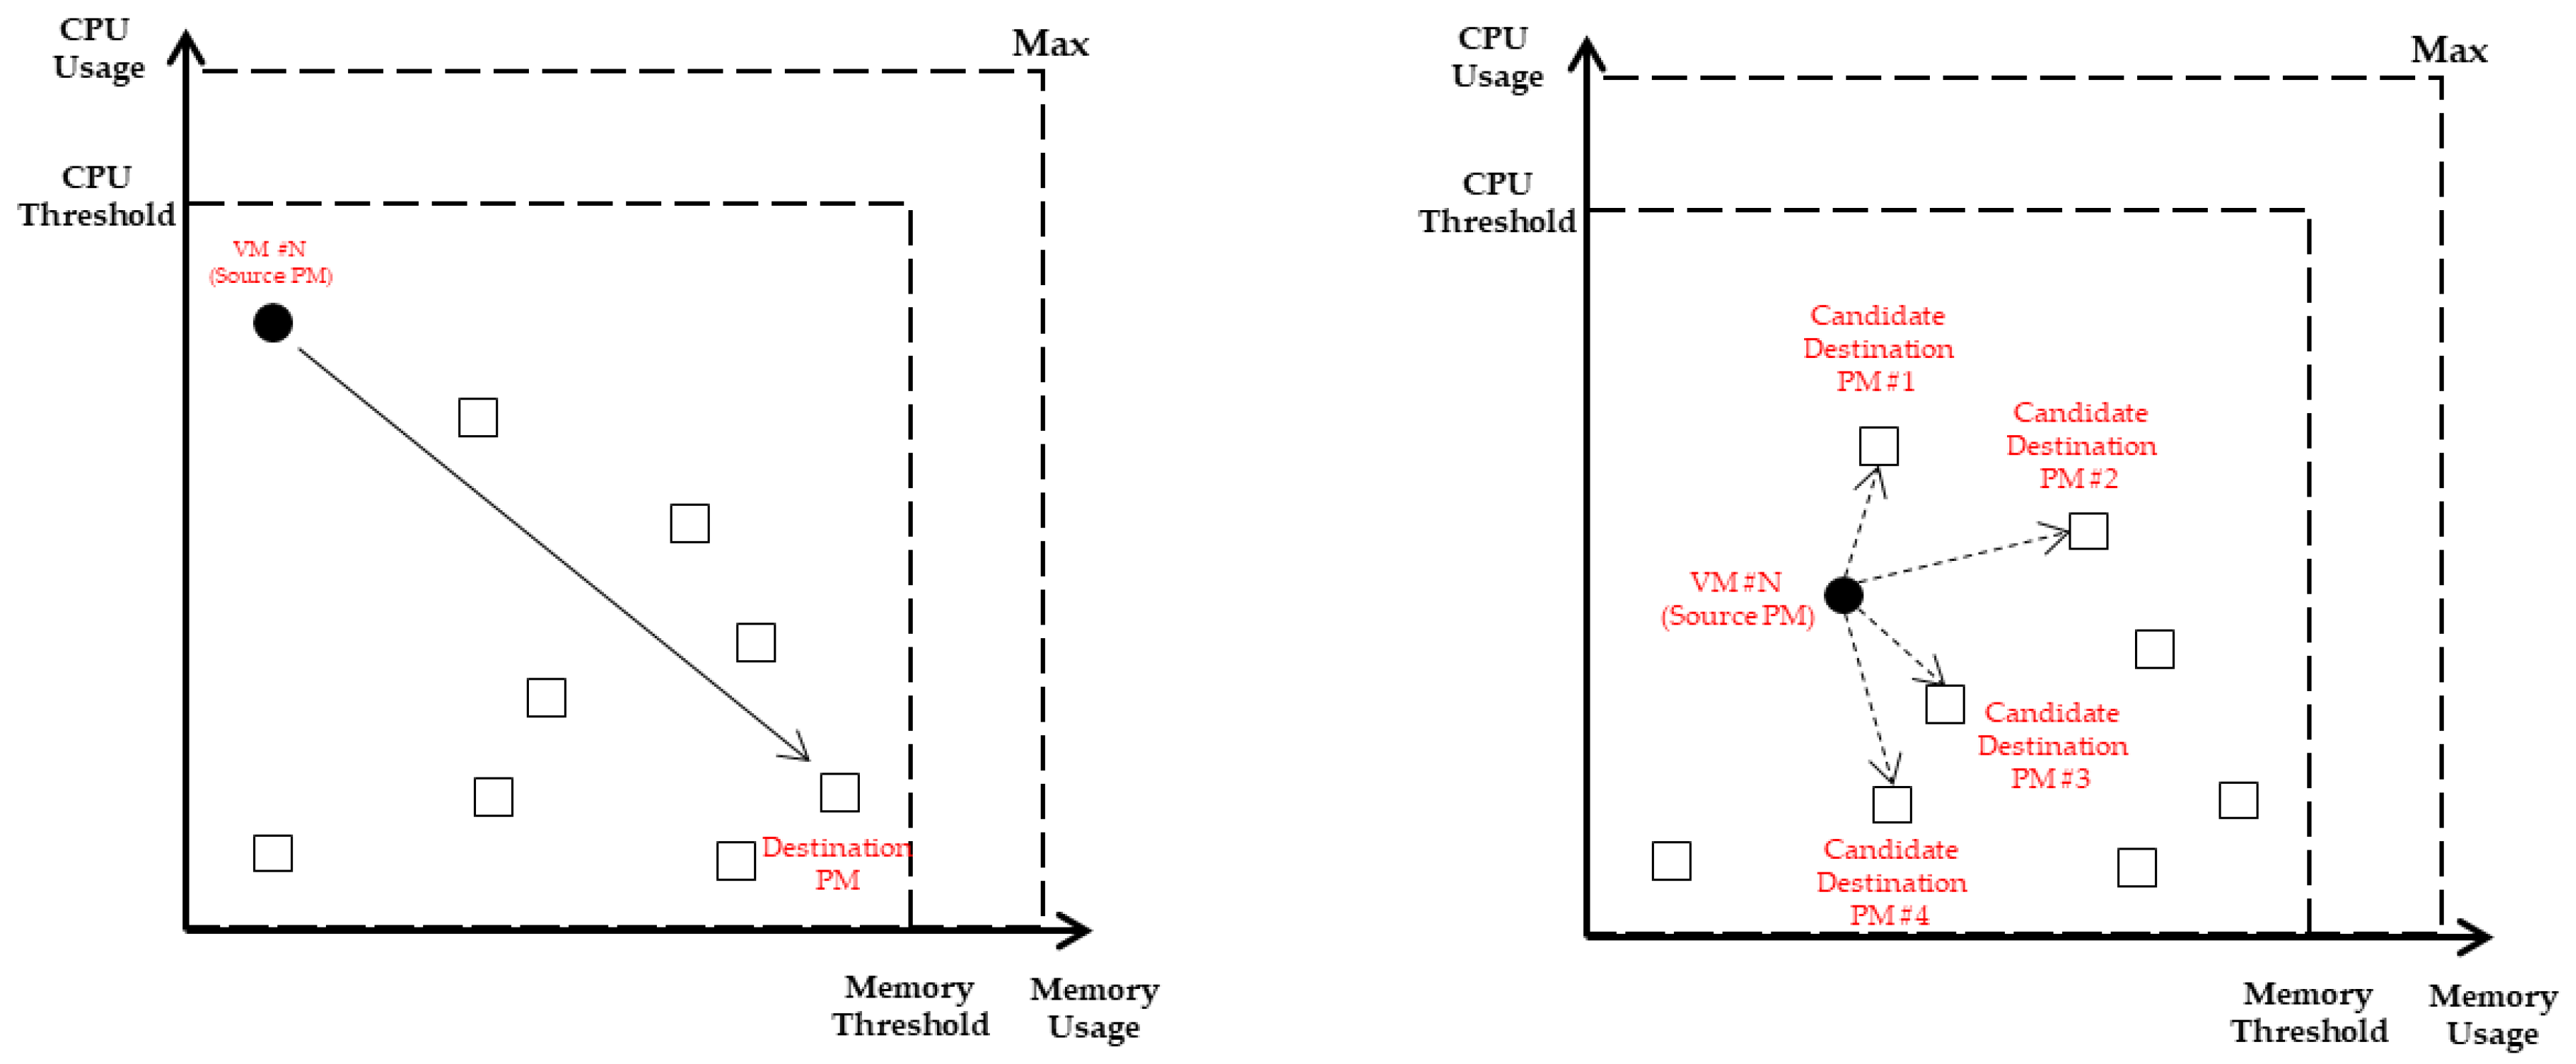
The purpose of VMC is to reduce power usage by migrating VMs and turning off unnecessary servers and to ensure stable operation of the PMs at the same time. Based on this, the selection criteria of the source PM are the PM in the underload state and the PM in the overload state. Since underloaded PM means low resource utilization and the number of VMs is often small, power can be saved with minimum migration. Selecting the overloaded PM is to ensure stable operation, and PM in the overload state should be avoided because it is likely to violate the SLA. The CPU and memory workload status of each PM can be presented by X-Y coordinates as shown in Figure 4, and the PM that is farthest from the PM (filled square) closest to the origin becomes the source PM.
4.3.2. VM Selection and Destination PM Selection
When a source PM is selected, the VM to be migrated should be selected if there are more than one VM in that PM. The selected VM is migrated from the current PM to another PM and the number of VMs that can be migrated depends on the free capacity of the destination PM. VMC is a problem similar to the bin packing problem, and the number of VMs loaded into the PM varies depending on how the VM set is formed. Therefore, VM should be filled with the goal of minimizing the free capacity of each PM. For this reason, VM selection and destination PM selection should not be considered independently, but should be considered in the same line. In Figure 5. the VM located in the source PM is represented by a filled circle. The VM has an unbalanced characteristic in which the workload is biased toward the Y-axis (CPU usage). The VM can balance the usage of resources of the destination PM if the workload migrates to the unbalanced PM. The destination PM of the VM whose workload is unbalanced is the PM with the longest Euclidean distance. For VMs with unbalanced workloads as in Figure 5, it is probabilistically selected based on the Euclidean distance between the VM and the destination PM candidates.
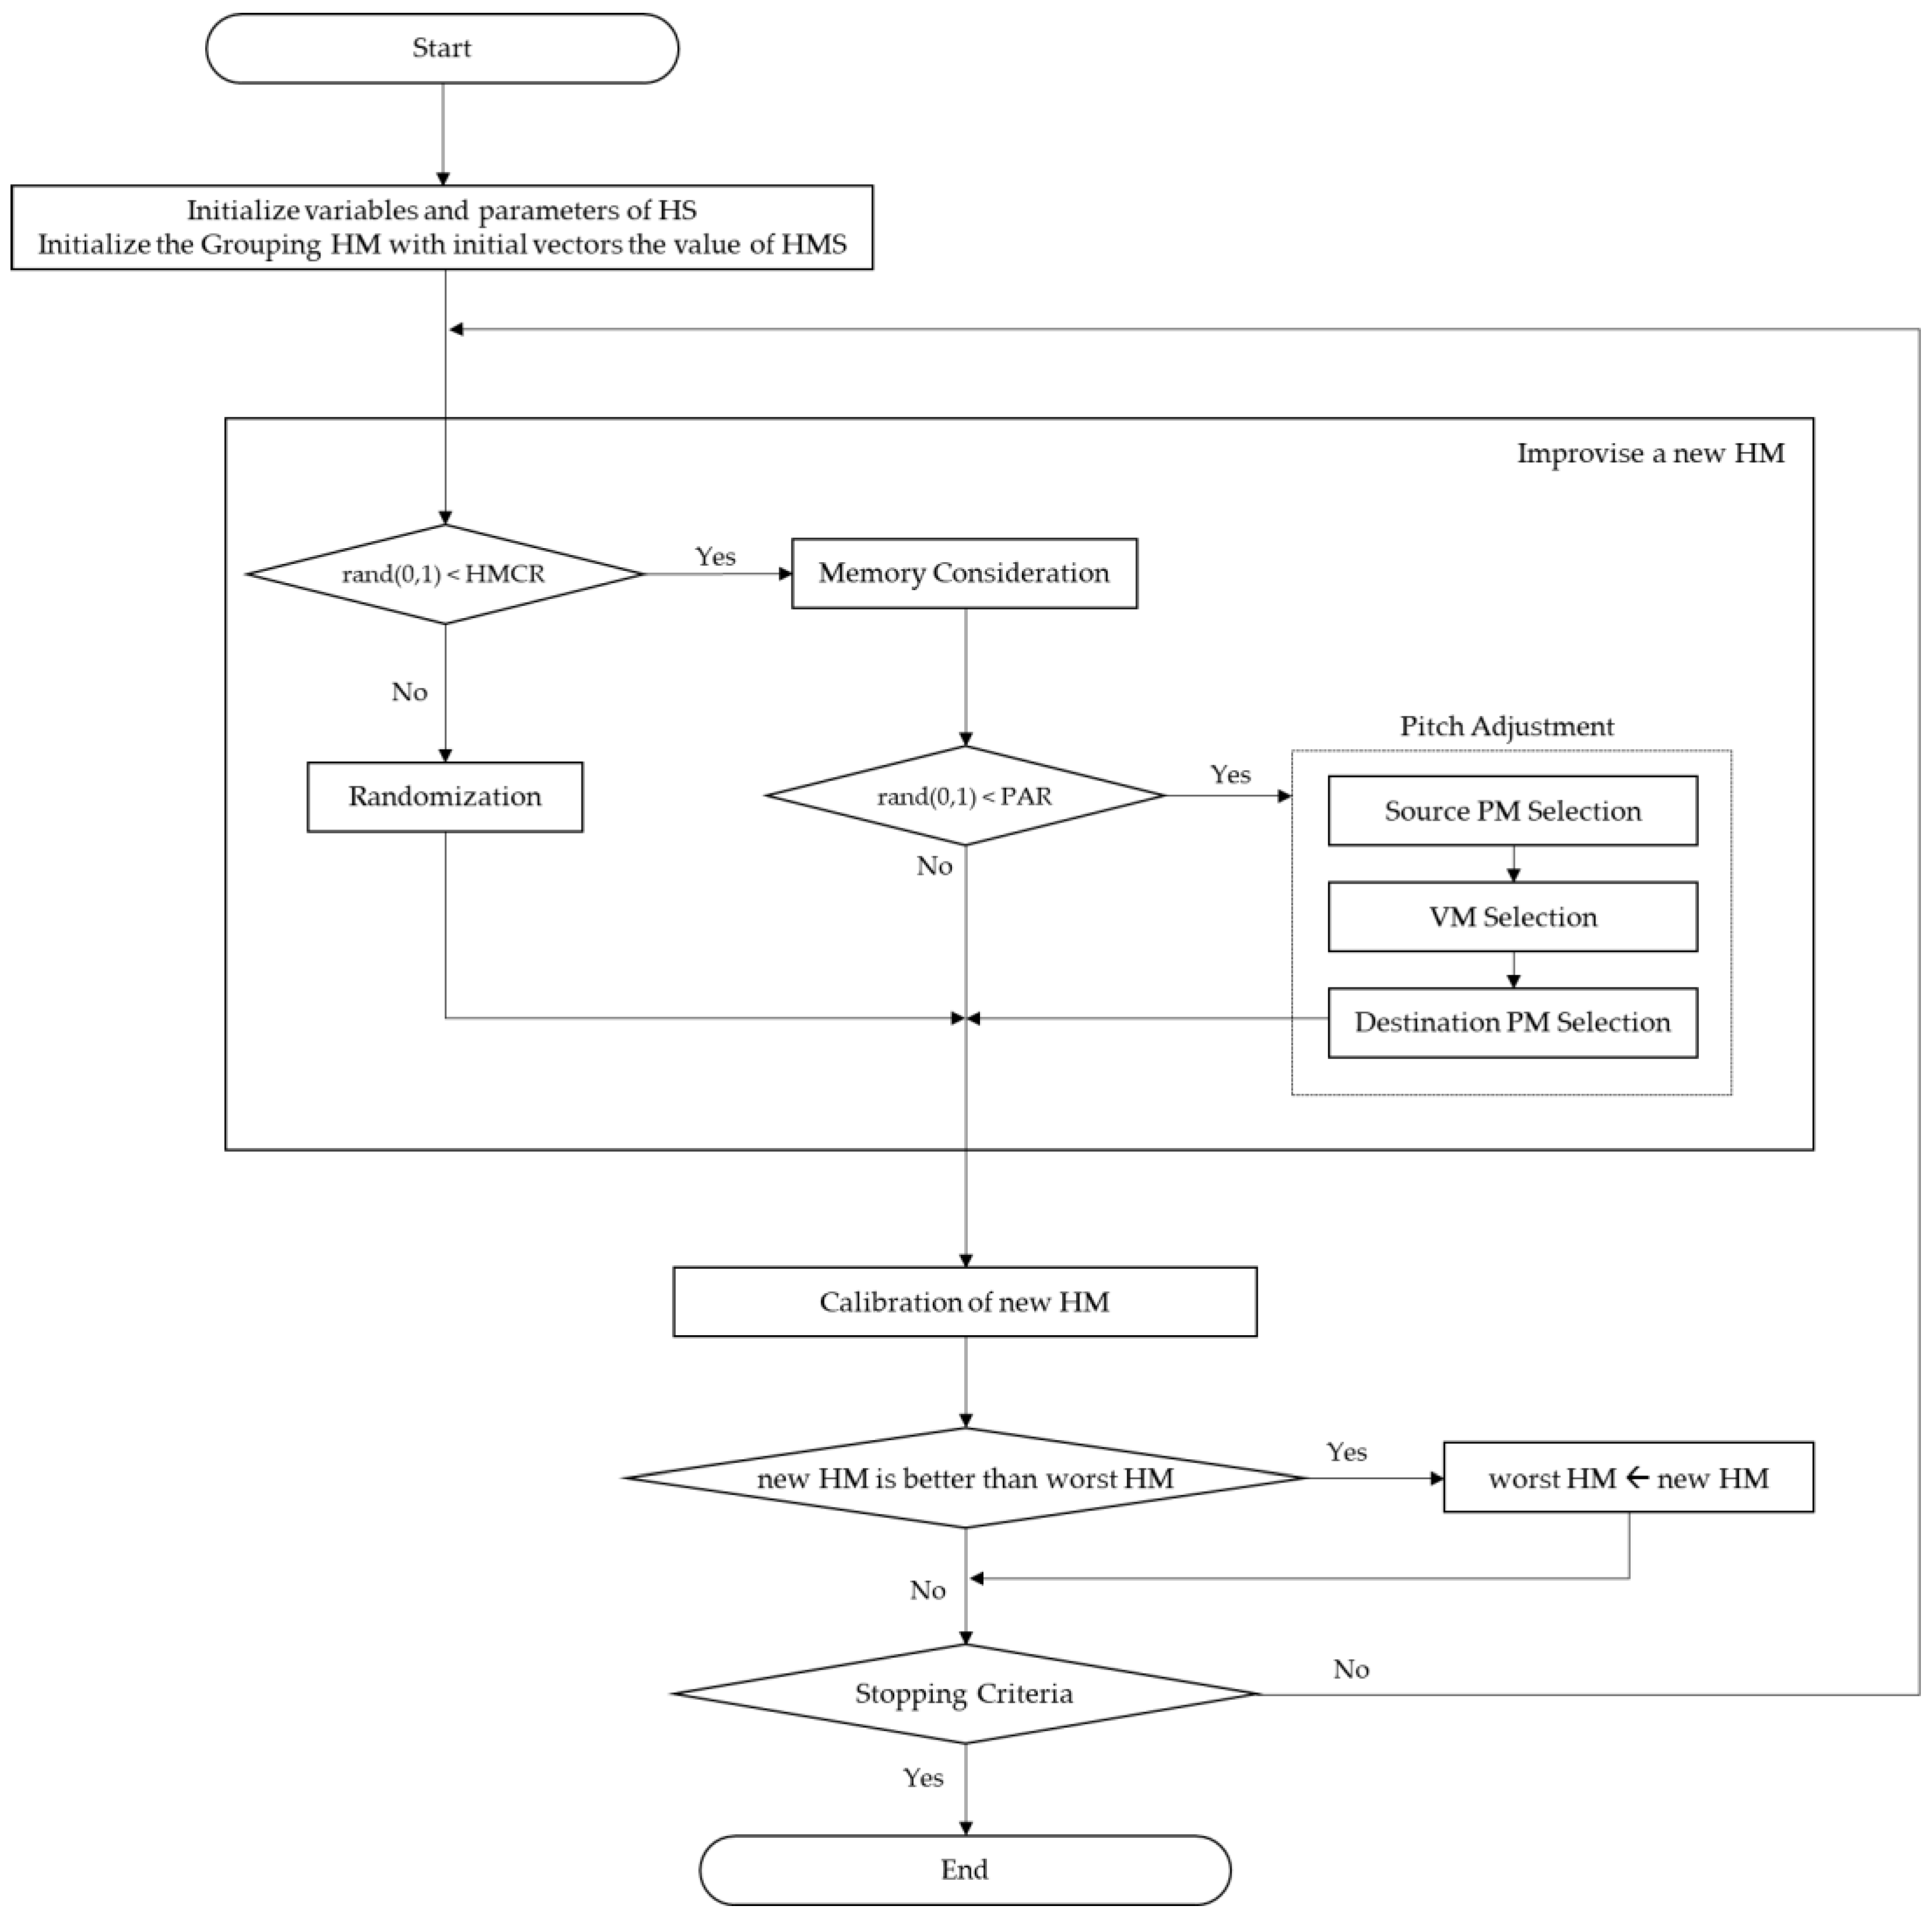
4.4. Procedure of GHS for Virtual Machine Consolidation
The GHS procedure for solving VMC is the same as the general HS procedure. However, there is a difference in that the solution representation is a group representation and the calibration method of infeasible solutions generated therefrom is added. (shown as Figure 6)
4.5. Infeasible Solution Calibration Method
In the case of GHS, VM duplication may occur when creating a new HM in groups. VMC should not allow duplicate VMs due to restrictions on VM allocation. In existing research, heuristic techniques were used to design a separate operator that deletes the duplicate objects properly in the process of solving the grouping problem. Typical heuristic techniques applied to the bin packing problem include FFD and BFD, and an analysis showed that there is no big difference in the performance between the two [27]. When VM duplication occurs in GHS, the heuristic technique is used to delete the remaining VMs except the best-fit VM. In addition, a solution to which a VM is not allocated may be generated. In this case, a list of unallocated VMs is searched and allocation to PM is done through a heuristic technique.
5. Computational Experiments
5.1. Data Set
For VMC experiment, information about the PM’s CPU capacity, memory capacity, VM’s CPU quota, and memory quota is needed. Test cases were generated in the same manner as data generation in existing research [27], and were classified into eight classes in total according to the specifications of PM and VM. In the case of class 1, 2, 5, and 6, homogeneous was 1, 2, 5, and 6 while the class that generated heterogeneous PM was 3, 4, 7, and 8. (shown as Table 2). The specifications marked with an asterisk had a higher probability of generation compared to other specifications. In this case, the probability was (1)/(number of possible values); for example, the generation of CPU values of the PM of Class 3 was (1)/4. The value of was set to 0.9. The number of values VM generated was between 25 and 500, and the VMs were sequentially allocated by generating the number of PMs corresponding to the amount of lowerbound value multiplied by 3. The formula for calculating the lowerbound is as in Equation (11). This was determined as the larger of the sum of CPU values of all VMs divided by the CPU average value of all PMs and the sum of memory values of all VMs divided by the memory average value of all PMs.
5.2. HS Parameter Determination
In the case of the metaheuristic technique, the user must set the parameter by a technique that finds a solution through the probabilistic generation of random numbers. Since the optimal parameter value is different for each problem to be solved, it is common to repeat the experiment by selecting various parameter combinations by specifying an appropriate range. In the case of HS, two parameters, HMCR for determining HMC and PAR for determining PA, must be set in advance. In this study, in order to reduce the time required for VMC experiments, we selected parameters that derive high quality solutions based on medium size VM for each class and applied them to other size VMs in the same way. Table 3 shows the results of deriving the optimal parameters for Class 1. With the VM size of 300, the average of the number of power saving PMs was analyzed by repeated experiments for each parameter of HS. The best results were obtained when the HMCR was 0.99 and the PAR was 0.85. GHS improved the solution through PA, and as PA is an HMC dependent operator, the overall result was better when HMCR was higher. In the case of PAR, when HMC was properly executed, the result was higher than that of performing PA alone.
5.3. Experimental Results: Comparison with HS and GHS
This study adopted grouping representation in designing metaheuristic technique for efficient solutions of VMC. A popular solution representation for VMC solution is permutation encoding, which is shown in Figure 7. The index of each array is the index of the VM, and the value of the index of each array is the index of the PM where the VM is located.
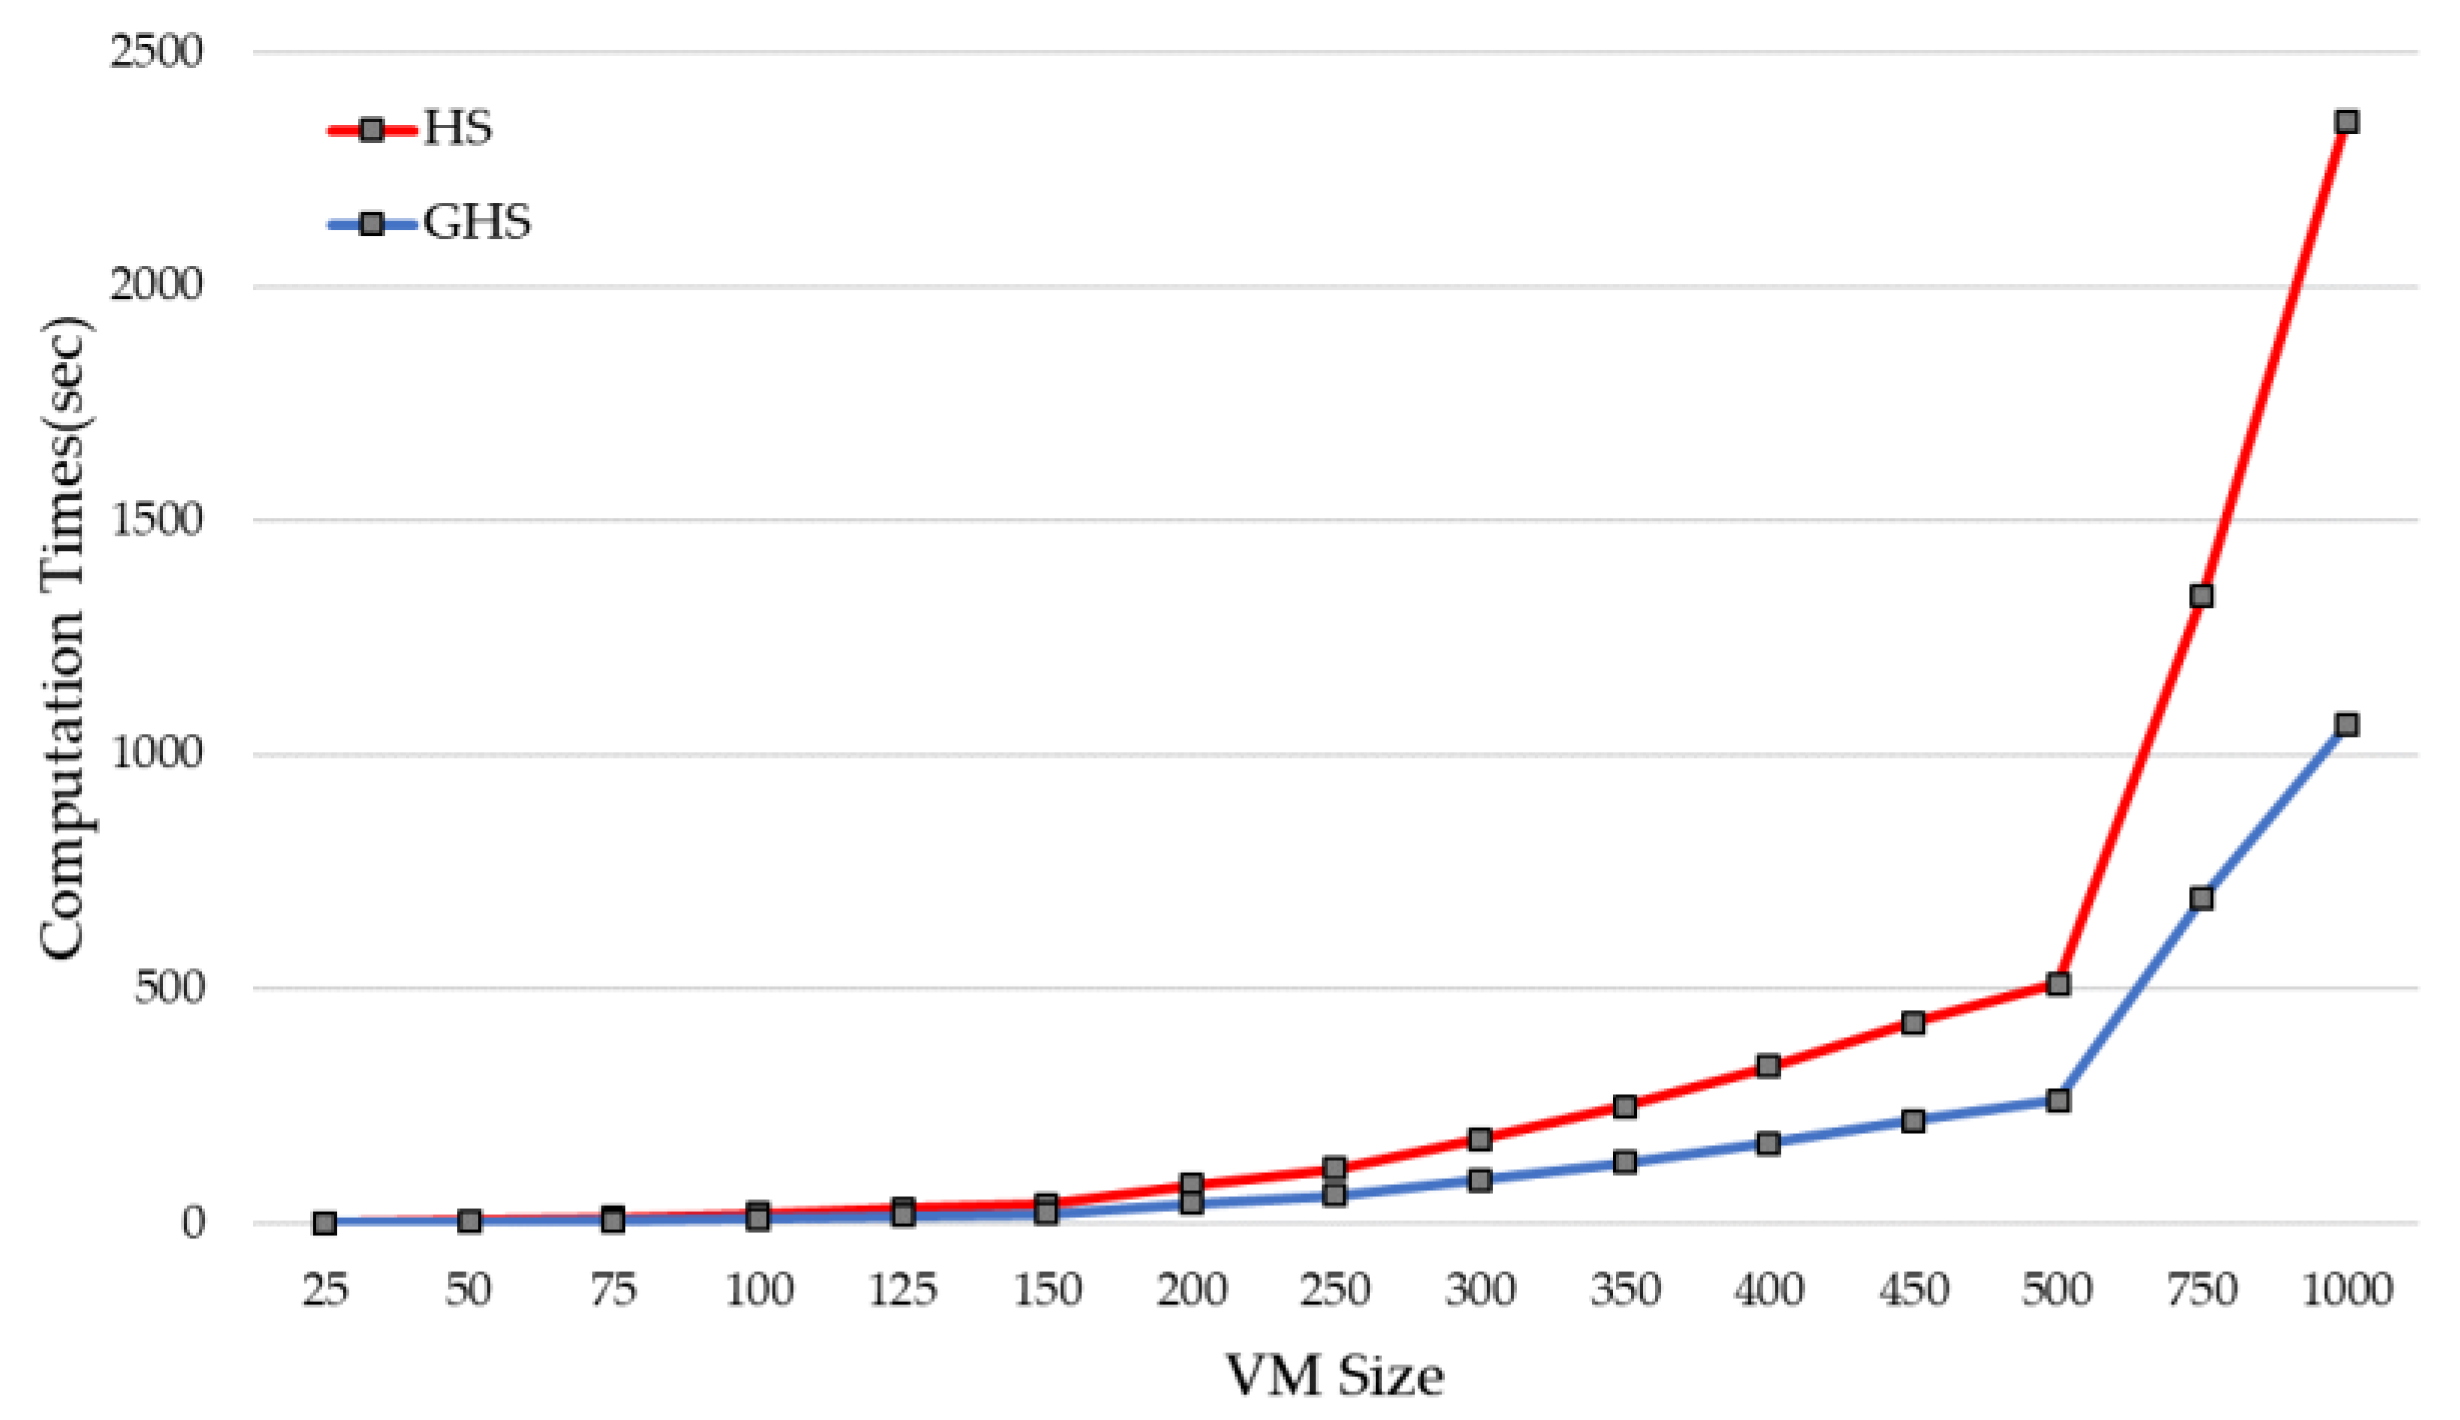
In this study, to verify the justification of adopting grouping representation to solve VMC, we compared the grouping representation and permutation representation. The comparative experiments compared the time to reach 85% of the lowerbound value of the power saving PM of HS and GHS based on all VM sizes. The HMS of HS and GHS were set equal to the length of the array. In the case of HS, the number of VMs is HMS, and in the case of GHS, the number of PMs was HMS. HMCR and PAR were set equal to the values derived in 5.2.
The experiment results showed that the larger the VM size, the faster the GHS reached the target value than HS. In addition, the trend of the time that the HS reached the target value showed a higher slope than the time that the GHS reached the target value. Since HS determines HMS based on VM, and GHS determines HMS based on PM, the larger the VM size, the better the GHS solution search range and efficiency. When 750 and 1000 VMs were created to look at increases in the experiment time, it was found that GHS tended to increase relatively linearly in comparison to HS. (shown as Figure 8).
5.4. Experimental Results
5.4.1. Experimental Environments
The purpose of VMC is to reduce power usage by migrating VMs and turning off unnecessary servers and to ensure The VMS target value is the maximum of PM transitions to the idle mode. Migration efficiency was considered to determine the efficiency of migration at the same time. For the parameter of HS, HMCR was set to 0.99 and PAR was set to 0.85 as determined in 5.2; iteration was set to 10,000 times, and the repeat experiment was performed for a total of 30 times. Experimental environment is as in Table 4.
5.4.2. Analysis for Experimental Results by Class
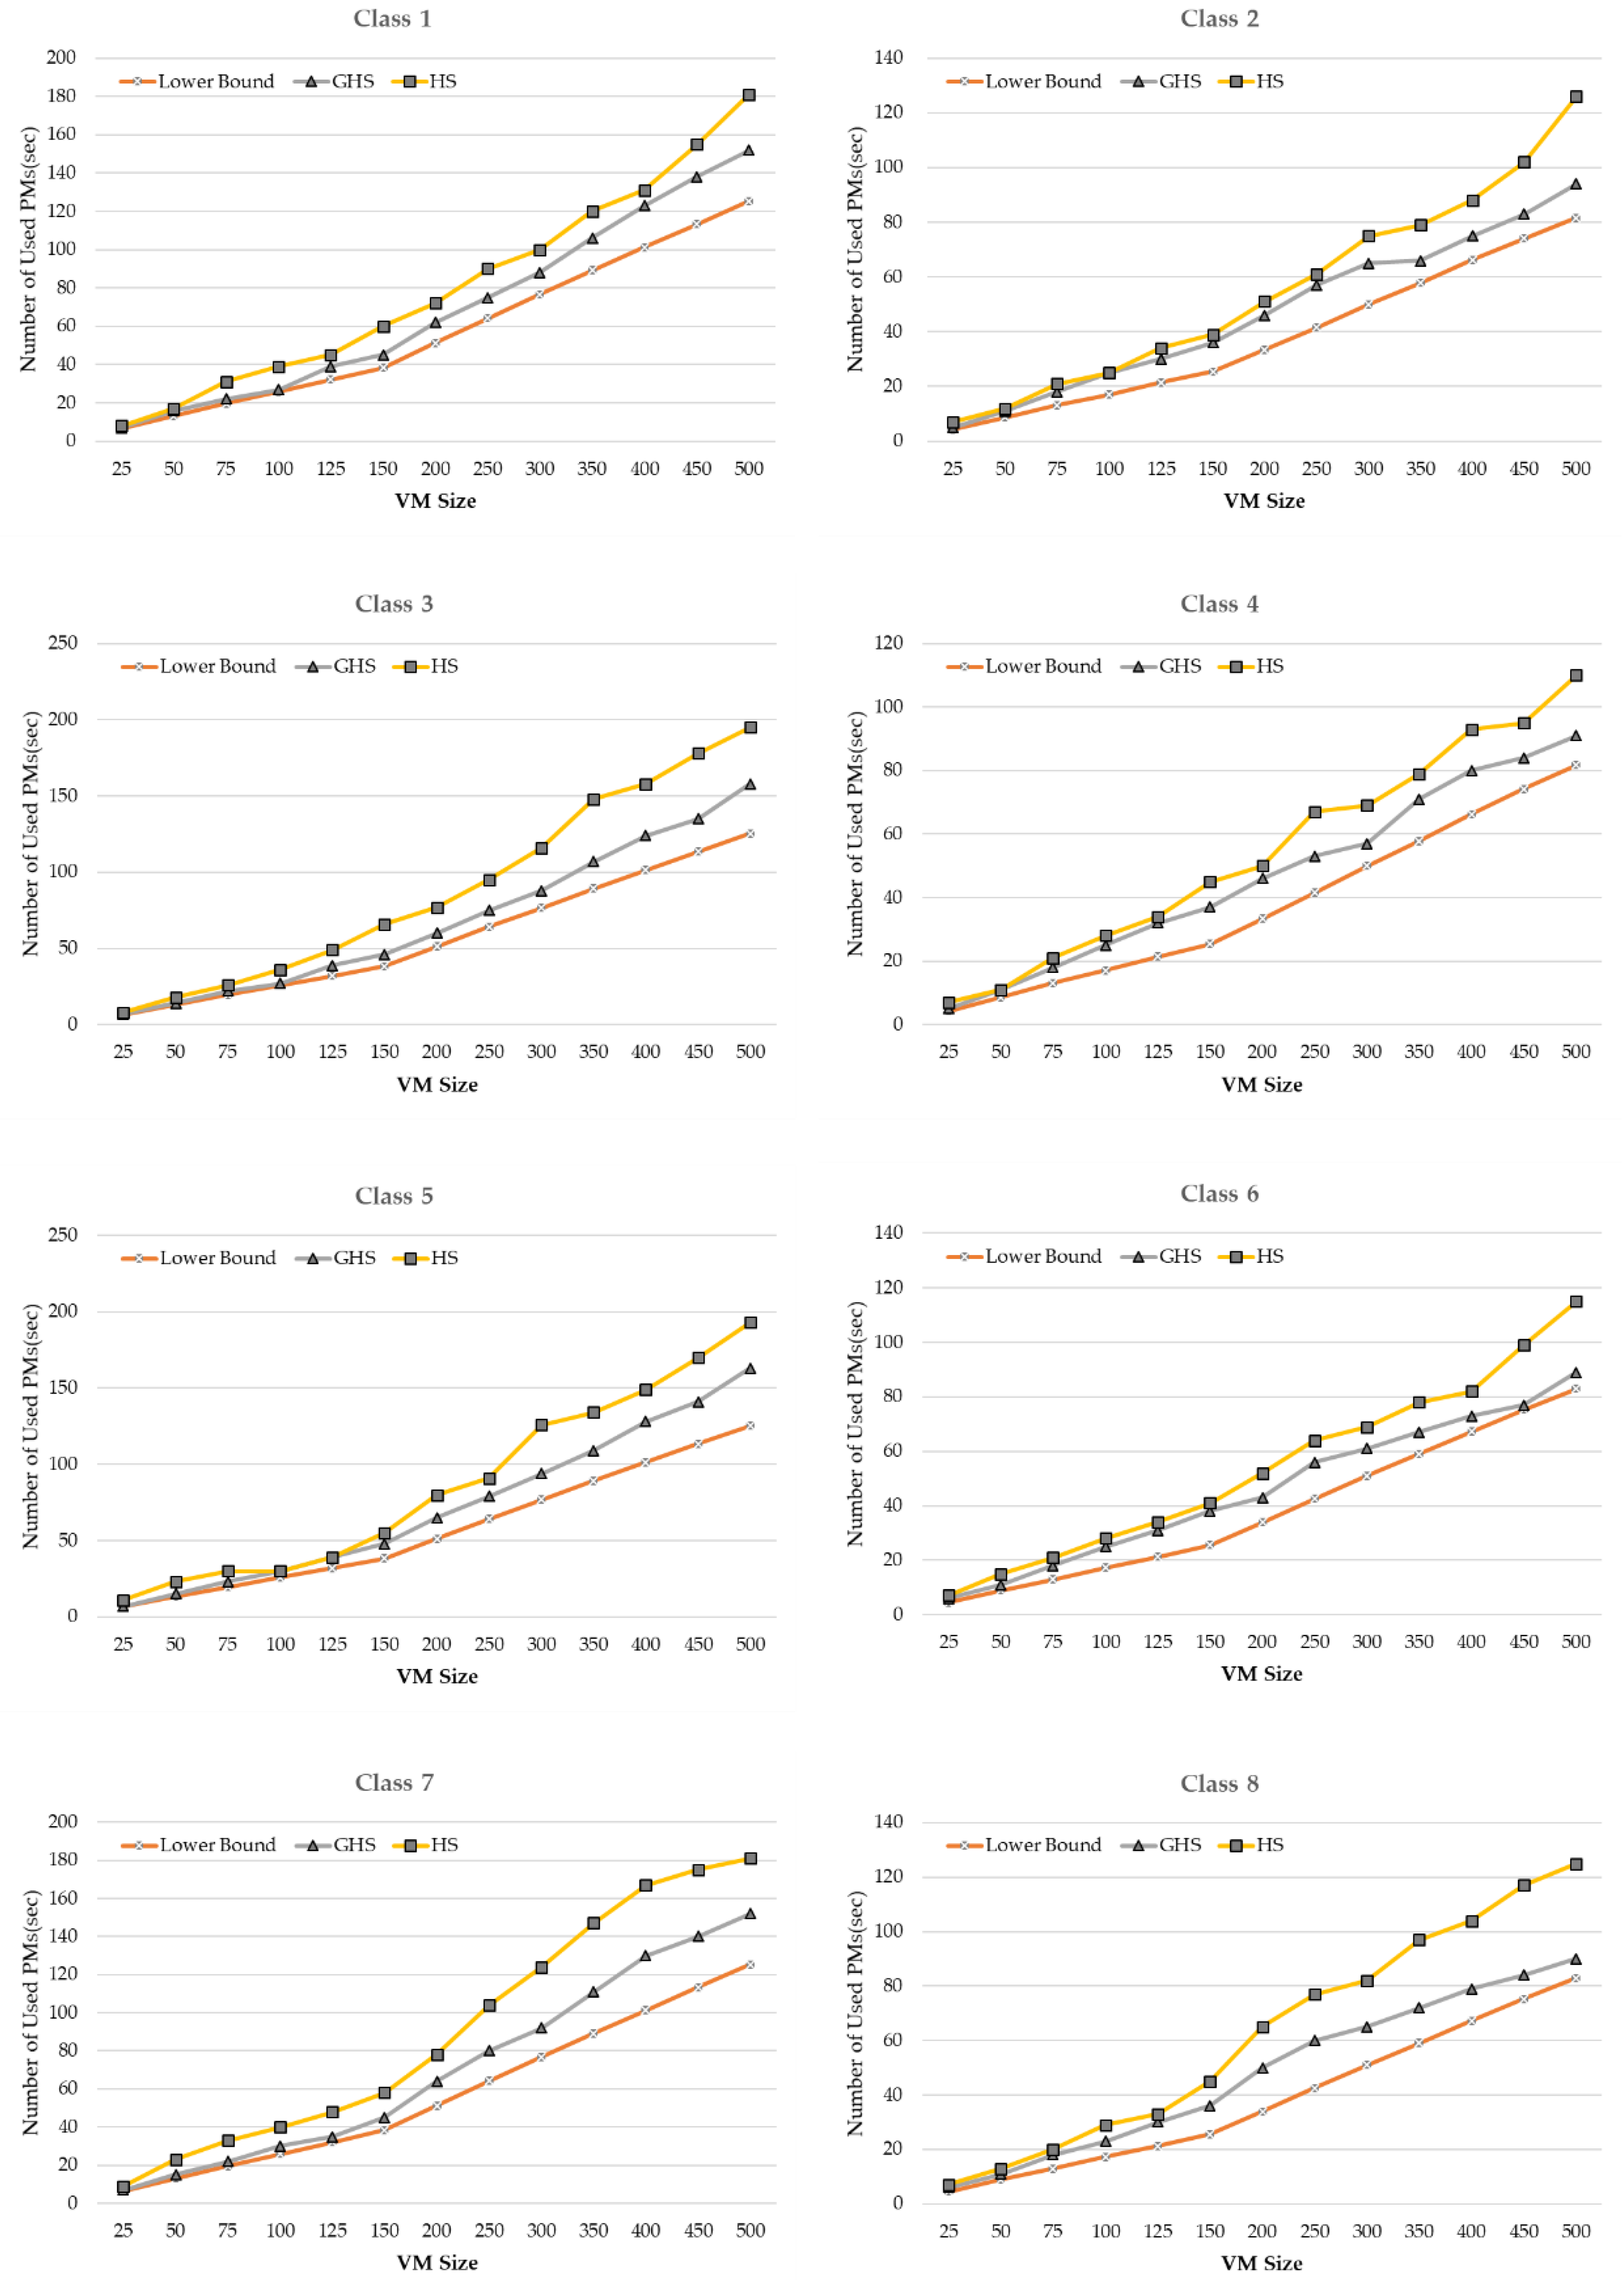
Figure 9 shows a comparison of the numbers of running PMs, excluding idle-transitioned PMs, across all GHS and HS servers. The experiment results showed that GHS outperformed HS in all eight classes. In the case of small VM sizes (25 to 100), GHS reached close to lowerbound, whereas HS did not. The difference from lowerbound was larger for HS than for GHS as the VM size increased. This suggests that GHS was a more efficient algorithm for VMC aimed at maximizing idle servers and minimizing uptime servers.
Referring to Table 5 and the experimental results table in the Appendix A, in Class 1, GHS reached 85% of lowerbound, and migration efficiency was also high at 92.3–100%. HS reached 72% of lowerbound under the same conditions, and migration efficiency was only 72.9% on average. Even in Class 3, 5, and 7, GHS reached 97.4–98.4% of migration efficiency, which was 26.9–30.8% higher than HS of 68.1–71.1%. It can be said that GHS was superior even when GHS and HS were compared in terms of migration efficiency.
Referring to Table 6 and the experimental results table in the Appendix A, In Class 2, GHS reached about 78% of lowerbound, which was higher than HS reaching 67% of the lowerbound. Migration efficiency also showed higher results for GHS at 65.6%, compared to HS at 50.8% on average. In Class 2, 4, and 6, HS reached 50.6–54.1% of migration efficiency, while GHS showed a migration efficiency of 63.7–69.4%. Comprehensive points of 10.6%–18.8% of the gap compared to HS proved the superiority of GHS.
Overall, the even-numbered classes showed a difference in the number of power saving PMs compared with the odd-numbered classes, but migration efficiency was low. Through this experiment, the factors influencing migration efficiency were found to be the balance of the number of allocated VMs between PMs and the number of VMs allocated to PMs. When the data sets of odd-numbered class and even-numbered class were compared, the larger the CPU and memory size of the PM, the more VMs were allocated to one PM. PMs with only one VM could save PM power with one migration, but PMs with multiple VMs could save power after multiple migrations, resulting in lower migration efficiency. In addition, if the total number of VMs was allocated to all PMs in consideration of balance, the migration efficiency tended to be lower as well.
When the environment where PMs with multiple VMs and PMs with few VMs were mixed (= environment with underloaded PMs based on the assigned VMs) and the environment where allocation of VMs to PMs is well-balanced were compared, the former environment could save power with minimum migrations from PMs with a small number of VMs, but the latter environment required many migrations to save power as it had relatively fewer PMs with a small number of allocated VMs, showing lower migration efficiency. Accordingly, if the PM–VM configuration of a data center did not consider the load balance and had an environment where overload was mixed with underload, it was appropriate to consider migration efficiency in evaluating the algorithm.
5.4.3. Summary and Future Work
VMC can be expected to have such a big effect. However, VM migration has slight downtime, and migration itself should be avoided due to the nature of data centers that adheres to conservative operation because migration itself causes overload. In this study, we considered maximizing server power saving, which is the basic purpose of VMC, and at the same time, inducing efficient migration by utilizing the concept of migration efficiency. For workloads, CPU and memory were considered and the distance between PM and VM in X–Y coordinates was calculated to determine source PM, VM to migrate, and destination PM selection.
To solve VMC, we proposed an effective algorithm design using harmony search among metaheuristic techniques. In population-based metaheuristics such as harmony search, the number of populations should increase in proportion to the increased problem size to ensure the diversity of the search. In this case, there is a disadvantage that the cost for the solution search also increases. VMC is targeted at virtualization environments. In virtualization environments, the number of VMs is greater than the number of PMs. In addition, as VM is a logically divided unit, the order in which they are located in PM does not matter. Reflecting this feature, the length of the solution will be reduced if the solution representation is grouped based on PM rather than VM-based permutation. In this case, as the problem size becomes larger, the increase in population will be relatively more linear, leading to an efficient search. The performance of the algorithm proposed in this study was verified through experiments.
This study was based on PM capacity and VM resource allocation in VMC. VMs had unique workload patterns because they provided real-time services using CPU and memory resources. When migrating a VM, considering the time series patterns of the VM as well as the size of allocated resources, high quality PM–VM mapping that could operate the PM stably would be possible. Based on this, studies should be conducted to predict the workload pattern and additionally consider the workload balance degree as the objective function.
6. Conclusions
VMC was proposed as one of the ways of effectively solving the power consumption problem of data centers, which is expected to intensify in the future. The power savings of running servers through VMC could reduce the power costs of the servers and reduce the heat, leading to a direct cooling effect in data centers. In addition, PM is a consumable with a persisting period, so the introduction and disposal of equipment should be periodically reviewed from the perspective of operating a data center. If the number of servers required for annual operation can be decreased through VMC, the cost of introducing servers as well as the software licenses installed on servers can be reduced as well. This, in turn, can indirectly reduce the data center operating costs.
In general, a virtualization environment consists of 5 to 20 VMs in one PM. In a data center, tens or hundreds of PMs are managed at the same time. In terms of VMs, a general optimization problem will become a large-scale problem. The size of data centers is expected to increase in the future, and single cloud environments are shifting to multi-hybrid cloud environments. However, due to conservative management that emphasizes stability only, inefficient operation still continues. Management points are too extensive to rely on the intuition of administrators to operate complex data centers, and this can cause human errors. For efficient data center management, managers should move beyond conservative management and examine technologies that contribute to efficient operation. Forward, it is necessary to pursue data center automation and manualization by developing an integrated intelligent cloud management platform using artificial intelligence and big data analysis technology.
Author Contributions
M.J.K. developed the model and wrote the majority of the manuscript. J.S.H. performed the experiments and analyzed data. W.J.K. developed the overall idea and the basic outline of the paper.
Funding
This research received no external funding
Conflicts of Interest
The authors declare no conflict of interest.
Appendix A

Table A1.
Experiment results for Class 1.
| VM Size | Lower Bound | Used PMs | Turn Off PMs | Migration Efficiency | Computation Times |
|---|---|---|---|---|---|
| 25 | 6.55 | 7 | 12 | 92.3% | 0.934 |
| 50 | 13.13 | 16 | 23 | 100.0% | 3.104 |
| 75 | 19.65 | 22 | 36 | 97.3% | 6.022 |
| 100 | 25.83 | 27 | 50 | 98.0% | 10.379 |
| 125 | 32.08 | 39 | 57 | 100.0% | 16.326 |
| 150 | 38.33 | 45 | 70 | 100.0% | 21.161 |
| 200 | 51.23 | 62 | 91 | 100.0% | 42.113 |
| 250 | 64.28 | 75 | 117 | 100.0% | 59.812 |
| 300 | 76.73 | 88 | 142 | 99.3% | 92.178 |
| 350 | 89.17 | 106 | 161 | 99.4% | 128.784 |
| 400 | 101.28 | 123 | 180 | 100.0% | 170.812 |
| 450 | 113.40 | 138 | 202 | 99.5% | 219.382 |
| 500 | 125.27 | 152 | 223 | 100.0% | 262.670 |
Table A2.
Experiment results for Class 2.
| VM Size | Lower Bound | Used PMs | Turn Off PMs | Migration Efficiency | Computation Times |
|---|---|---|---|---|---|
| 25 | 4.30 | 5 | 7 | 70.0% | 0.564 |
| 50 | 8.65 | 11 | 14 | 77.8% | 1.707 |
| 75 | 13.10 | 18 | 21 | 67.7% | 3.655 |
| 100 | 17.02 | 25 | 26 | 65.0% | 5.921 |
| 125 | 21.38 | 30 | 34 | 69.4% | 8.995 |
| 150 | 25.37 | 36 | 40 | 64.5% | 12.271 |
| 200 | 33.38 | 46 | 54 | 70.1% | 21.772 |
| 250 | 41.58 | 57 | 67 | 66.3% | 33.941 |
| 300 | 50.00 | 65 | 85 | 63.0% | 51.022 |
| 350 | 57.82 | 66 | 107 | 62.9% | 69.698 |
| 400 | 66.23 | 75 | 123 | 60.9% | 86.992 |
| 450 | 74.13 | 83 | 139 | 58.4% | 112.269 |
| 500 | 81.67 | 94 | 151 | 56.3% | 136.726 |
Table A3.
Experiment results for Class 3.
| VM Size | Lower Bound | Used PMs | Turn Off PMs | Migration Efficiency | Computation Times |
|---|---|---|---|---|---|
| 25 | 6.55 | 7 | 12 | 92.3% | 0.927 |
| 50 | 13.13 | 14 | 25 | 92.6% | 3.071 |
| 75 | 19.65 | 22 | 36 | 97.3% | 6.146 |
| 100 | 25.83 | 27 | 50 | 98.0% | 10.434 |
| 125 | 32.08 | 39 | 57 | 95.0% | 16.191 |
| 150 | 38.33 | 46 | 69 | 95.8% | 22.806 |
| 200 | 51.23 | 60 | 93 | 100.0% | 41.621 |
| 250 | 64.28 | 75 | 117 | 96.7% | 63.149 |
| 300 | 76.73 | 88 | 142 | 99.3% | 94.986 |
| 350 | 89.17 | 107 | 160 | 99.4% | 127.951 |
| 400 | 101.28 | 124 | 179 | 100.0% | 169.648 |
| 450 | 113.40 | 135 | 205 | 99.5% | 221.295 |
| 500 | 125.27 | 158 | 217 | 100.0% | 271.288 |
Table A4.
Experiment results for Class 4.
| VM Size | Lower Bound | Used PMs | Turn Off PMs | Migration Efficiency | Computation Times |
|---|---|---|---|---|---|
| 25 | 4.30 | 5 | 7 | 63.6% | 0.558 |
| 50 | 8.65 | 11 | 14 | 63.6% | 1.684 |
| 75 | 13.10 | 18 | 21 | 72.4% | 3.538 |
| 100 | 17.02 | 25 | 26 | 76.5% | 5.874 |
| 125 | 21.38 | 32 | 32 | 78.0% | 8.970 |
| 150 | 25.37 | 37 | 39 | 73.6% | 12.344 |
| 200 | 33.38 | 46 | 54 | 74.0% | 21.822 |
| 250 | 41.58 | 53 | 71 | 77.2% | 33.753 |
| 300 | 50.00 | 57 | 93 | 73.2% | 50.135 |
| 350 | 57.82 | 71 | 102 | 64.2% | 69.255 |
| 400 | 66.23 | 80 | 118 | 62.8% | 90.268 |
| 450 | 74.13 | 84 | 138 | 61.6% | 116.745 |
| 500 | 81.67 | 91 | 154 | 61.1% | 140.142 |
Table A5.
Experiment results for Class 5.
| VM Size | Lower Bound | Used PMs | Turn Off PMs | Migration Efficiency | Computation Times |
|---|---|---|---|---|---|
| 25 | 6.55 | 7 | 12 | 92.3% | 0.928 |
| 50 | 13.15 | 15 | 24 | 96.0% | 2.908 |
| 75 | 19.48 | 23 | 35 | 97.2% | 5.934 |
| 100 | 25.85 | 30 | 47 | 97.9% | 10.313 |
| 125 | 31.95 | 39 | 56 | 98.2% | 15.340 |
| 150 | 38.40 | 48 | 67 | 100.0% | 22.036 |
| 200 | 51.23 | 65 | 88 | 100.0% | 41.025 |
| 250 | 64.28 | 79 | 113 | 100.0% | 60.559 |
| 300 | 76.73 | 94 | 136 | 99.3% | 92.569 |
| 350 | 89.17 | 109 | 158 | 99.4% | 122.108 |
| 400 | 101.28 | 128 | 175 | 100.0% | 170.564 |
| 450 | 113.40 | 141 | 199 | 99.5% | 230.187 |
| 500 | 125.27 | 163 | 212 | 99.5% | 245.834 |
Table A6.
Experiment results for Class 6.
| VM Size | Lower Bound | Used PMs | Turn Off PMs | Migration Efficiency | Computation Times |
|---|---|---|---|---|---|
| 25 | 4.40 | 6 | 7 | 63.6% | 0.593 |
| 50 | 8.87 | 11 | 15 | 62.5% | 1.759 |
| 75 | 12.93 | 18 | 20 | 60.6% | 3.331 |
| 100 | 17.25 | 25 | 26 | 63.4% | 5.794 |
| 125 | 21.25 | 31 | 32 | 62.7% | 8.411 |
| 150 | 25.60 | 38 | 38 | 62.3% | 12.234 |
| 200 | 33.92 | 43 | 58 | 66.7% | 21.919 |
| 250 | 42.58 | 56 | 71 | 68.9% | 33.846 |
| 300 | 50.97 | 61 | 91 | 66.9% | 51.150 |
| 350 | 59.10 | 67 | 110 | 62.1% | 65.206 |
| 400 | 67.22 | 73 | 128 | 64.6% | 82.934 |
| 450 | 75.30 | 77 | 148 | 63.8% | 108.132 |
| 500 | 82.98 | 89 | 159 | 59.6% | 137.537 |
Table A7.
Experiment results for Class 7.
| VM Size | Lower Bound | Used PMs | Turn Off PMs | Migration Efficiency | Computation Times |
|---|---|---|---|---|---|
| 25 | 6.55 | 7 | 12 | 92.3% | 0.965 |
| 50 | 13.15 | 15 | 24 | 96.0% | 3.000 |
| 75 | 19.48 | 22 | 36 | 92.3% | 6.186 |
| 100 | 25.85 | 30 | 47 | 97.9% | 10.237 |
| 125 | 31.95 | 35 | 60 | 98.4% | 15.692 |
| 150 | 38.40 | 45 | 70 | 100.0% | 22.154 |
| 200 | 51.23 | 64 | 89 | 100.0% | 40.758 |
| 250 | 64.28 | 80 | 112 | 100.0% | 63.020 |
| 300 | 76.73 | 92 | 138 | 99.3% | 97.007 |
| 350 | 89.17 | 111 | 156 | 99.4% | 121.459 |
| 400 | 101.28 | 130 | 173 | 100.0% | 186.162 |
| 450 | 113.40 | 140 | 200 | 99.5% | 218.366 |
| 500 | 125.27 | 152 | 223 | 99.6% | 248.294 |
Table A8.
Experiment results for Class 8.
| VM Size | Lower Bound | Used PMs | Turn Off PMs | Migration Efficiency | Computation Times |
|---|---|---|---|---|---|
| 25 | 4.40 | 6 | 7 | 63.6% | 0.605 |
| 50 | 8.87 | 11 | 15 | 68.2% | 1.753 |
| 75 | 12.93 | 18 | 20 | 66.7% | 3.429 |
| 100 | 17.25 | 23 | 28 | 68.3% | 5.916 |
| 125 | 21.25 | 30 | 33 | 61.1% | 8.324 |
| 150 | 25.60 | 36 | 40 | 61.5% | 12.313 |
| 200 | 33.92 | 50 | 51 | 63.8% | 21.951 |
| 250 | 42.58 | 60 | 67 | 67.0% | 35.059 |
| 300 | 50.97 | 65 | 87 | 62.6% | 50.179 |
| 350 | 59.10 | 72 | 105 | 65.2% | 70.651 |
| 400 | 67.22 | 79 | 122 | 64.9% | 89.321 |
| 450 | 75.30 | 84 | 141 | 66.5% | 111.878 |
| 500 | 82.98 | 90 | 158 | 62.0% | 142.396 |
References
- Adrian, O. Forecast: Data Centers, Worldwide, 2015–2022, 2018 Update; Gartner Research: Stamford, CT, USA, 2018. [Google Scholar]
- CISCO. Cisco Global Cloud Index: Forecast and Methodology, 2016–2021; CISCO: San José, CA, USA, 2018. [Google Scholar]
- Arman, S.; Sarah, S.; Dale, S.; Richard, B.; Magnuns, H.; Jonathan, K.; Eric, M.; Nathaniel, H.; Inês, A.; William, L. United States Data Center Energy Usage Report; Ernest Orlando Lawrence Berkeley National Laboratory: Berkeley, CA, USA, 2016.
- Koomey, J.G. Estimating Total Power Consumption by Servers in the US and the World; Stanford University: Stanford, CT, USA, 2007. [Google Scholar]
- ICT Gartner Estimates. Industry Accounts for 2 Percent of Global CO2 Emissions; Press Release: Pittsburgh, PA, USA, 2007. [Google Scholar]
- Uddin, M.; Rahman, A.A. Energy efficiency and low carbon enabler green IT framework for data centers considering green metrics. Renew. Sustain. Energy Rev. 2012, 16, 4078–4094. [Google Scholar] [CrossRef]
- Berl, A.; Gelenbe, E.; Di Girolamo, M.; Giuliani, G.; De Meer, H.; Dang, M.Q.; Pentikousis, K. Energy-efficient cloud computing. Comput. J. 2010, 53, 1045–1051. [Google Scholar] [CrossRef]
- Chang, K.; Park, S.; Kong, H.; Kim, W. Optimizing energy consumption for a performance-aware cloud data center in the public sector. Sustain. Comput. 2018, 20, 34–45. [Google Scholar] [CrossRef]
- Vogels, W. Beyond Server Consolidation. ACM Queue 2008, 6, 20–26. [Google Scholar] [CrossRef]
- Beloglazov, A. Energy-Efficient Management of Virtual Machines in Data Centers for Cloud Computing. Ph.D. Thesis, The University of Melbourne, Melbourne, Australia, 2013. [Google Scholar]
- Clark, C.; Fraser, K.; Hand, S.; Hansen, J.G.; Jul, E.; Limpach, C.; Pratt, I.; Warfield, A. Live migration of virtual machines. In Proceedings of the 2nd Conference on Symposium on Networked Systems Design & Implementation, Berkeley, CA, USA, 2–4 May 2005. [Google Scholar]
- Khan, M.A.; Paplinski, A.; Khan, A.M.; Murshed, M.; Buyya, R. Dynamic virtual machine consolidation algorithms for energy-efficient cloud resource management: A review. In Sustainable Cloud and Energy Services; Springer: Cham, Switzerland, 2018; pp. 135–165. [Google Scholar]
- Feller, E.; Morin, C.; Esnault, A. A case for fully decentralized dynamic VM consolidation in clouds. In Proceedings of the IEEE 4th International Conference on Cloud Computing Technology and Science, Taipei, Taiwan, 3–6 December 2012; pp. 26–33. [Google Scholar]
- Wood, T.; Shenoy, P.; Venkataramani, A.; Yousif, M. Sandpiper: Black-box and gray-box resource management for virtual machines. Comput. Netw. 2009, 53, 2923–2938. [Google Scholar] [CrossRef]
- Tang, M.; Pan, S. A hybrid genetic algorithm for the energy-efficient virtual machine placement problem in data centers. Neural Process. Lett. 2015, 41, 211–221. [Google Scholar] [CrossRef]
- Pires, F.L.; Barán, B. Multi-objective virtual machine placement with service level agreement: A memetic algorithm approach. In Proceedings of the 2013 IEEE/ACM 6th International Conference on Utility and Cloud Computing, Washington, DC, USA, 9–12 December 2013; pp. 203–210. [Google Scholar]
- Kakadia, D.; Kopri, N.; Varma, V. Network-aware virtual machine consolidation for large data centers. In Proceedings of the Third International Workshop on Network-Aware Data Management, Denver, CO, USA, 17–21 November 2013; Volume 6, pp. 1–8. [Google Scholar]
- Cao, Z.; Dong, S. An energy-aware heuristic framework for virtual machine consolidation in Cloud computing. J. Supercomput. 2014, 69, 429–451. [Google Scholar] [CrossRef]
- Ho, Y.; Liu, P.; Wu, J.J. Server consolidation algorithms with bounded migration cost and performance guarantees in cloud computing. In Proceedings of the 2011 Fourth IEEE International Conference on Utility and Cloud Computing, Victoria, Australia, 5–8 December 2011; pp. 154–161. [Google Scholar]
- Gao, Y.; Guan, H.; Qi, Z.; Hou, Y.; Liu, L. A multi-objective ant colony system algorithm for virtual machine placement in cloud computing. J. Comput. Syst. Sci. 2013, 79, 1230–1242. [Google Scholar] [CrossRef]
- Chen, K.Y.; Xu, Y.; Xi, K.; Chao, H.J. Intelligent virtual machine placement for cost efficiency in geo-distributed cloud systems. In Proceedings of the 2013 IEEE International Conference on Communications (ICC), Budapest, Hungary, 9–13 June2013; pp. 3498–3503. [Google Scholar]
- Mark, C.C.T.; Niyato, D.; Chen-Khong, T. Evolutionary optimal virtual machine placement and demand forecaster for cloud computing. In Proceedings of the 2011 IEEE International Conference on Advanced Information Networking and Applications, Singapore, 22–25 March 2011; pp. 348–355. [Google Scholar]
- Adamuthe, A.C.; Pandharpatte, R.M.; Thampi, G.T. Multiobjective virtual machine placement in cloud environment. In Proceedings of the 2013 International Conference on Cloud & Ubiquitous Computing & Emerging Technologies, Pune, India, 15–16 November 2013; pp. 8–13. [Google Scholar]
- Wu, G.; Tang, M.; Tian, Y.C.; Li, W. Energy-efficient virtual machine placement in data centers by genetic algorithm. In International Conference on Neural Information Processing; Springer: Berlin, Germany, 2012; pp. 315–323. [Google Scholar]
- Wu, Y.; Tang, M.; Fraser, W. A simulated annealing algorithm for energy efficient virtual machine placement. In Proceedings of the 2012 IEEE International Conference on Systems, Man, and Cybernetics (SMC), Seoul, Korea, 14–17 October 2012; pp. 1245–1250. [Google Scholar]
- Ferreto, T.; De Rose, C.A.; Heiss, H.U. Maximum migration time guarantees in dynamic server consolidation for virtualized data centers. In European Conference on Parallel Processing; Springer: Berlin, Germany, 2011; pp. 443–454. [Google Scholar]
- Murtazaev, A.; Oh, S. Sercon: Server consolidation algorithm using live migration of virtual machines for green computing. IETE Tech. Rev. 2011, 28, 212–231. [Google Scholar] [CrossRef]
- Al-Betar, M.A.; Khader, A.T. A harmony search algorithm for university course timetabling. Ann. Oper. Res. 2012, 194, 3–31. [Google Scholar] [CrossRef]
- Yun, H.Y.; Jeong, S.J.; Kim, K.S. Advanced harmony search with ant colony optimization for solving the traveling salesman problem. J. Appl. Math. 2013, 2013, 123738. [Google Scholar] [CrossRef]
- Falkenauer, E. A new representation and operators for genetic algorithms applied to grouping problems. Evolut. Comput. 1994, 2, 123–144. [Google Scholar] [CrossRef]
Figure 1.
Traditional operating system architecture and virtualization architecture.

Figure 2.
An Example of virtual machine consolidation.

Figure 3.
Encoding for physical machine (PM)–virtual machine (VM) mapping.

Figure 4.
Example of the source PM to be selected in the X–Y coordinates.

Figure 5.
Example of VM and destination PM expressed in X–Y coordinates.

Figure 6.
Procedure of grouping harmony search (GHS) for virtual machine consolidation.

Figure 7.
Permutation encoding for PM–VM mapping.

Figure 8.
Comparison of computation times with HS and GHS (Class 1).

Figure 9.
Comparison of the results of the number of used PM by class (lowerbound, GHS, and HS).

Table 1.
Pseudo code of harmony search.
| Pseudo Code 1. Harmony Search referring to [28,29] | |
| 1: | Initialize the problem and Harmony Search parameters (HMS, HMCR, PAR) |
| 2: | Construct the vectors of the Harmony Memory, HM = {x1, x2, ..., xHMS} |
| 3: | Recognize the worst vector in HM, xworst ∈{x1, x2, ..., xHMS} |
| 4: | While (not termination) |
| 5: | x’= 𝜙 // new harmony vector |
| 6: | fori = 1, ... , N // N is the number of decision variables |
| 7: | If (rand() ≤ HMCR) then |
| 8: | // Memory Considering |
| 9: | If (rand ()≤ PAR) then |
| 10: | // Pitch Adjusting |
| 11: | end if |
| 12: | Else |
| 13: | // Random Playing |
| 14: | end if |
| 15: | end for |
| 16: | If () then |
| 17: | Replace with |
| 18: | end while |
| 19: | Find the current best harmony |
Table 2.
Test cases for the experiments.
| Class | PM | VM | ||
|---|---|---|---|---|
| 1 | 6 | 4 | [1.0, 2.0] | [0.5, 1.5] |
| 2 | 10 | 6 | [1.0, 2.2] | [0.5, 1.5] |
| 3 | {4,5,6*,7,8} | {3,4*,5} | [1.0, 2.0] | [0.5, 1.5] |
| 4 | {8,9,10*,11,12} | {5,6*,7} | [1.0, 2.2] | [0.5, 1.5] |
| 5 | 6 | 4 | [1.0, 2.0] | [/2, /2+0.5] |
| 6 | 10 | 6 | [1.0, 2.2] | [/2, /2+0.4] |
| 7 | {4,5,6*,7,8} | {3,4*,5} | [1.0, 2.0] | [/2, /2+0.5] |
| 8 | {8,9,10*,11,12} | {5,6*,7} | [1.0, 2.2] | [/2, /2+0.4] |
Table 3.
Experiment results for each harmony search (HS) parameter (avg. number of power saving PMs Class 1, VM size = 300). Bold typeface indicates better solutions.
Table 3.
Experiment results for each harmony search (HS) parameter (avg. number of power saving PMs Class 1, VM size = 300). Bold typeface indicates better solutions.
| HMCR PAR | 0.75 | 0.8 | 0.85 | 0.9 | 0.95 | 0.99 |
|---|---|---|---|---|---|---|
| 0.75 | 91.20 | 90.53 | 90.13 | 90.43 | 90.16 | 89.36 |
| 0.8 | 91.66 | 90.53 | 90.10 | 90.36 | 89.86 | 89.00 |
| 0.85 | 91.26 | 90.60 | 89.96 | 90.46 | 89.00 | 88.00 |
| 0.9 | 91.70 | 89.50 | 90.40 | 89.93 | 90.03 | 88.90 |
| 0.95 | 92.00 | 90.40 | 90.56 | 90.00 | 89.60 | 89.50 |
| 0.99 | 91.96 | 90.36 | 90.93 | 90.43 | 90.23 | 88.90 |
Table 4.
Experimental environments.
| Section | Item | Description |
|---|---|---|
| Experimental Parameters | Objective Function | Max (turn off PM), Max (migration efficiency) |
| Parameter | HMS = PM Size, HMCR = 0.99, PAR = 0.85 | |
| Iteration | 10,000 | |
| Repetition | 30 | |
| Experimental Environments | OS | Windows 10, 64bit |
| CPU | Intel Core i7 (2.67GHz) | |
| Memory | 16GB RAM | |
| IDE | Visual Studio 2017 | |
| Programming Language | C# 6.0 |
Table 5.
Comparison of experimental results of HS and GHS (Class 1, 3, 5, and 7). Bold typeface indicates better solutions.
Table 5.
Comparison of experimental results of HS and GHS (Class 1, 3, 5, and 7). Bold typeface indicates better solutions.
| VM Size | Class 1 | Class 3 | Class 5 | Class 7 | ||||||||
|---|---|---|---|---|---|---|---|---|---|---|---|---|
| HS | GHS | GAP | HS | GHS | GAP | HS | GHS | GAP | HS | GHS | GAP | |
| 25 | 73.3% | 92.3% | 19.0% | 68.8% | 92.3% | 23.6% | 53.3% | 92.3% | 39.0% | 58.8% | 92.3% | 33.5% |
| 50 | 84.6% | 100.0% | 15.4% | 65.6% | 92.6% | 34.4% | 61.5% | 96.0% | 34.5% | 64.0% | 96.0% | 32.0% |
| 75 | 65.9% | 97.3% | 31.4% | 71.1% | 97.3% | 26.2% | 63.6% | 97.2% | 33.6% | 64.1% | 92.3% | 28.2% |
| 100 | 64.4% | 98.0% | 33.6% | 70.7% | 98.0% | 27.3% | 69.1% | 97.9% | 28.8% | 77.1% | 97.9% | 20.8% |
| 125 | 78.5% | 100.0% | 21.5% | 73.4% | 95.0% | 26.6% | 72.7% | 98.2% | 25.5% | 77.0% | 98.4% | 21.3% |
| 150 | 69.6% | 100.0% | 30.4% | 74.2% | 95.8% | 25.8% | 71.4% | 100.0% | 28.6% | 78.1% | 100.0% | 21.9% |
| 200 | 79.4% | 100.0% | 20.6% | 76.8% | 100.0% | 23.2% | 76.8% | 100.0% | 23.2% | 81.5% | 100.0% | 18.5% |
| 250 | 76.1% | 100.0% | 23.9% | 70.3% | 96.7% | 29.7% | 72.7% | 100.0% | 27.3% | 78.6% | 100.0% | 21.4% |
| 300 | 75.6% | 99.3% | 23.7% | 69.9% | 99.3% | 29.4% | 74.8% | 99.3% | 24.4% | 73.1% | 99.3% | 26.2% |
| 350 | 73.1% | 99.4% | 26.2% | 69.6% | 99.4% | 29.8% | 73.1% | 99.4% | 26.3% | 71.4% | 99.4% | 27.9% |
| 400 | 73.2% | 100.0% | 26.8% | 62.8% | 100.0% | 37.2% | 70.6% | 100.0% | 29.4% | 70.8% | 100.0% | 29.2% |
| 450 | 69.8% | 99.5% | 29.7% | 57.2% | 99.5% | 42.3% | 68.8% | 99.5% | 30.7% | 67.9% | 99.5% | 31.6% |
| 500 | 64.0% | 100.0% | 36.0% | 54.7% | 100.0% | 45.3% | 60.9% | 99.5% | 38.7% | 61.8% | 99.6% | 37.8% |
| Average | 72.9% | 98.9% | 26.0% | 68.1% | 97.4% | 30.8% | 68.4% | 98.4% | 30.0% | 71.1% | 98.0% | 26.9% |
Table 6.
Comparison of experimental results of HS and GHS (Class 2, 4, 6, and 8). Bold typeface indicates better solutions.
Table 6.
Comparison of experimental results of HS and GHS (Class 2, 4, 6, and 8). Bold typeface indicates better solutions.
| VM Size | Class 2 | Class 4 | Class 6 | Class 8 | ||||||||
|---|---|---|---|---|---|---|---|---|---|---|---|---|
| HS | GHS | GAP | HS | GHS | GAP | HS | GHS | GAP | HS | GHS | GAP | |
| 25 | 50.0% | 70.0% | 20.0% | 50.0% | 63.6% | 13.6% | 66.7% | 63.6% | −3.0% | 75.0% | 63.6% | −11.4% |
| 50 | 50.0% | 77.8% | 27.8% | 50.0% | 63.6% | 13.6% | 57.9% | 62.5% | 4.6% | 56.5% | 68.2% | 11.7% |
| 75 | 54.5% | 67.7% | 13.2% | 54.5% | 72.4% | 17.9% | 50.0% | 60.6% | 10.6% | 50.0% | 66.7% | 16.7% |
| 100 | 52.2% | 65.0% | 12.8% | 50.0% | 76.5% | 26.5% | 53.5% | 63.4% | 9.9% | 50.0% | 68.3% | 18.3% |
| 125 | 52.5% | 69.4% | 16.8% | 50.8% | 78.0% | 27.2% | 51.8% | 62.7% | 11.0% | 51.7% | 61.1% | 9.4% |
| 150 | 51.4% | 64.5% | 13.2% | 51.4% | 73.6% | 22.2% | 52.2% | 62.3% | 10.1% | 53.4% | 61.5% | 8.1% |
| 200 | 50.0% | 70.1% | 20.1% | 50.5% | 74.0% | 23.5% | 51.6% | 66.7% | 15.1% | 50.0% | 63.8% | 13.8% |
| 250 | 50.0% | 66.3% | 16.3% | 50.0% | 77.2% | 27.2% | 52.1% | 68.9% | 16.9% | 53.2% | 67.0% | 13.8% |
| 300 | 50.0% | 63.0% | 13.0% | 50.0% | 73.2% | 23.2% | 51.9% | 66.9% | 15.0% | 53.8% | 62.6% | 8.7% |
| 350 | 50.0% | 62.9% | 12.9% | 50.0% | 64.2% | 14.2% | 51.3% | 62.1% | 10.9% | 53.3% | 65.2% | 11.9% |
| 400 | 50.0% | 60.9% | 10.9% | 50.0% | 62.8% | 12.8% | 50.6% | 64.6% | 14.0% | 52.2% | 64.9% | 12.7% |
| 450 | 50.0% | 58.4% | 8.4% | 50.0% | 61.6% | 11.6% | 50.0% | 63.8% | 13.8% | 52.2% | 66.5% | 14.3% |
| 500 | 50.0% | 56.3% | 6.3% | 50.0% | 61.1% | 11.1% | 50.0% | 59.6% | 9.6% | 51.7% | 62.0% | 10.3% |
| Average | 50.8% | 65.6% | 14.8% | 50.6% | 69.4% | 18.8% | 53.0% | 63.7% | 10.6% | 54.1% | 64.7% | 10.6% |
© 2019 by the authors. Licensee MDPI, Basel, Switzerland. This article is an open access article distributed under the terms and conditions of the Creative Commons Attribution (CC BY) license (http://creativecommons.org/licenses/by/4.0/).
Share and Cite
MDPI and ACS Style
Kim, M.; Hong, J.; Kim, W. An Efficient Representation Using Harmony Search for Solving the Virtual Machine Consolidation. Sustainability 2019, 11, 6030. https://0-doi-org.brum.beds.ac.uk/10.3390/su11216030
AMA Style
Kim M, Hong J, Kim W. An Efficient Representation Using Harmony Search for Solving the Virtual Machine Consolidation. Sustainability. 2019; 11(21):6030. https://0-doi-org.brum.beds.ac.uk/10.3390/su11216030
Chicago/Turabian StyleKim, MinJun, JuneSeok Hong, and Wooju Kim. 2019. "An Efficient Representation Using Harmony Search for Solving the Virtual Machine Consolidation" Sustainability 11, no. 21: 6030. https://0-doi-org.brum.beds.ac.uk/10.3390/su11216030
Note that from the first issue of 2016, this journal uses article numbers instead of page numbers. See further details here.