Ammonia Volatilization Losses during Irrigation of Liquid Animal Manure

Department of Agricultural Sciences, Agricultural Mechanization and Business Program, Clemson University, McAdams Hall, Clemson, SC 29634, USA
Sustainability 2019, 11(21), 6168; https://0-doi-org.brum.beds.ac.uk/10.3390/su11216168
Submission received: 16 September 2019
/
Revised: 22 October 2019
/
Accepted: 4 November 2019
/
Published: 5 November 2019
(This article belongs to the Special Issue Green, Closed Loop, Circular Bio-Economy)
Abstract
:Ammonia loss resulting from land application of liquid animal manure varies depending on the composition of the manure and the method used to apply manure to cropland. High levels of ammonia volatilization result in an economic loss to the farmer based on the value of the nitrogen and have also been shown to be a source of air pollution. Using irrigation as a method of applying liquid manure to cropland has generally been accepted as a method that increases the volatilization of ammonia. However, only three studies available in the literature measured the amount of ammonia lost during the irrigation process. Only one of the three studies concluded that ammonia loss during irrigation was significant. A pooled statistical and uncertainty analysis of the 55 available observations was performed to determine if ammonia loss occurred during irrigation of animal manure. Data on the total solids content of the manure were also included as an indicator of evaporation losses. Volatilization losses during irrigation were not found to be statistically significant, and evaporation losses were small, 2.4%, and agreed with previous studies on irrigation performance. Furthermore, the range of ammonia loss reported in previous studies was determined to be within the errors associated with the measurement of total ammoniacal nitrogen concentrations and the calculation of per cent differences.
1. Introduction
Ammonia loss to the atmosphere following manure application contributes to air pollution and is a loss of valuable fertilizer nitrogen. Broadcast application of liquid or slurry manure without incorporation can result in ammonia losses ranging from 11% to 70% of applied total ammoniacal nitrogen (TAN = NH4+-N + NH3-N) [1,2]. A review of the literature by Meisinger, and Jokela [3] indicated that the main factors that determine the magnitude of ammonia loss were the total solids content of the manure (TS, %), the amount of time that elapsed following an application before incorporation into soil or rainfall, and whether the manure was applied to bare soil or a crop. In general, application of manure with a low TS (1% or less) to bare soil resulted in the lowest ammonia loss since a greater portion of the TAN in the manure infiltrated into the soil with water instead of remaining on the surface.
Several land application practices have been shown to reduce or nearly eliminate the ammonia losses associated with a broadcast application of slurry of manure (6% to 10% TS). The most common approaches were to use methods that provided incorporation into the soil using light tillage on the day of manure application, direct sub-surface injection of manure, use of implements that provided some means of immediate incorporation, or spreading of manure in bands [4,5,6]. The reduction in ammonia losses as compared to a surface application of manure varied from 30% for incorporation of manure on the same day to 98% for sub-surface manure injection. Many of the banding techniques (e.g., towed hose or shoe) provided ammonia loss reductions of 30% to 70% on grasslands [2,4,6].
Sprinkler irrigation of liquid animal manure onto crop, forage, or pasture land to recycle plant nutrients is a common practice in many regions of the United States. The practice is most common on dairy and swine farms that use large amounts of water to remove manure from the animal housing area on a daily (flush) or weekly basis (pit-recharge). Liquid manure from the buildings is treated and stored prior to reuse for manure removal from the animal housing area. Treatment systems can be configured in a variety of ways with the two most common being treatment in a single anaerobic lagoon and one or more stages of solid-liquid separation followed by a treatment lagoon. In some cases, two or more treatment lagoons are used in series to provide a higher level of biological treatment. Irrigation is the favoured method of liquid manure application due to lower labour cost, energy cost, reduced soil compaction, and higher speed of application as compared to application using a tractor and tank-type spreader [7] (p.99). The primary disadvantages of using irrigation equipment to land apply liquid manure are the high initial investment, the potential for increased odour generation, and the possibility of spraying manure outside the field onto a road or a neighbour’s property. Proper design and operation of the irrigation equipment can minimize issues of over-spray to areas outside the field that is intended to be fertilized.
Unlike other methods of manure application, ammonia loss can potentially occur between the time the liquid exits the nozzle and lands on the soil or crop, that is during the irrigation process, and after the manure is applied to the ground. In one study, lagoon water with a TS of 0.57% or less resulted in ammonia losses of 0.4% to 3.6% of the TAN applied following application by irrigation [8]. These results suggest that most volatilization of ammonia occurred after manure was applied to the ground, and that irrigation of treated liquid manure (lagoon supernatant) facilitated the reduction in ammonia loss as compared to a broadcast of untreated liquid manure with a higher solids content. In some extension publications (e.g., [8], p. 99), and in a few research articles [9,10,11] it has been asserted that using traveling gun or centre pivot irrigation to apply manure to cropland increased the amount of ammonia volatilized to the air as compared to broadcast without incorporation. Westermann et al. [10] reported ammonia losses of 5.7% of the total ammoniacal nitrogen on the average with maximum losses of 24% when using a traveling gun to apply liquid swine manure. A previous study by Safley et al. [11] reported average ammonia losses of 2.9% to 4.9% of TAN applied when concentrations of the irrigation source was compared to concentrations in the manure obtained from containers on the ground used to catch the irrigated manure. When the data were analysed to make an estimate that included what was termed evaporation and drift they reported ammonia losses as high as 37% of the TAN contained in lagoon effluent [11]. Earlier work by Welsh [12] that also compared TAN concentrations in irrigated and ground collected samples concluded that volatilization losses during the irrigation of dairy slurry, liquid swine manure, and effluent from an oxidation ditch were insignificant. A more recent study by Montes [13] agreed with Welsh [12] and concluded that ammonia loss did not occur during sprinkler irrigation of swine lagoon water. However, the three studies that indicated that additional ammonia loss occurred during irrigation [9,10,11], along with endorsement of the idea in some cooperative extension literature [7] has led to a general acceptance of the idea that, regardless of the level of manure treatment implemented on a farm, using irrigation as a method to land apply liquid manure increased ammonia volatilization to the atmosphere and was to be avoided.
The level of physical (solid–liquid separation) and biological treatment (anaerobic lagoon or biological N removal) used prior to land application of dairy and swine manure has been shown to have a significant impact on the concentration of total solids, TAN, and the total Kjeldahl nitrogen (TKN = TAN + Organic-N) as shown by the data from several case studies provided in Table 1. Significant reductions in the TAN concentration reduced the mass of ammonia that could be lost during irrigation. The reduction in TS was also accompanied by a reduction in volatile solids which was often associated with a reduction in odour. Data from a dairy facility that used two stages of solid–liquid separation followed by a treatment lagoon resulted in 93% lower TS content and 54% lower TAN concentration than the manure flushed from the animal housing area [14]. Experiments were also performed to show that application of a polyacrylamide polymer (PAM) to screened dairy manure prior to settling could provide TS and TAN concentrations for the separated liquids that were similar to those achieved by lagoon treatment [14]. Treatment of swine manure in a single stage lagoon yielded a 75% reduction in TS concentration and a 69% reduction in TAN [15] as compared to untreated manure from the building. An advanced manure treatment on a swine farm that included chemically enhanced solid-liquid separation followed by biological treatment for nitrogen (nitrification and denitrification) and chemical treatment for phosphorous provided a 66% reduction in TS and a 96% reduction in TAN as compared to untreated manure [16]. In addition, comparison of surface water and agitated lagoon sludge and liquids from dairy and swine lagoons in South Carolina [17,18,19,20], California [21], Kansas [22], and Texas [23] indicated that lagoon treatment provided significant reductions in TS and TAN concentrations as compared to untreated manure. The highest TS and TAN concentrations shown in Table 1 were for lagoons located in regions of the USA with a dry climate [21,22,23] where evaporation tends to increase the concentrations due to loss of volume in the treatment system.
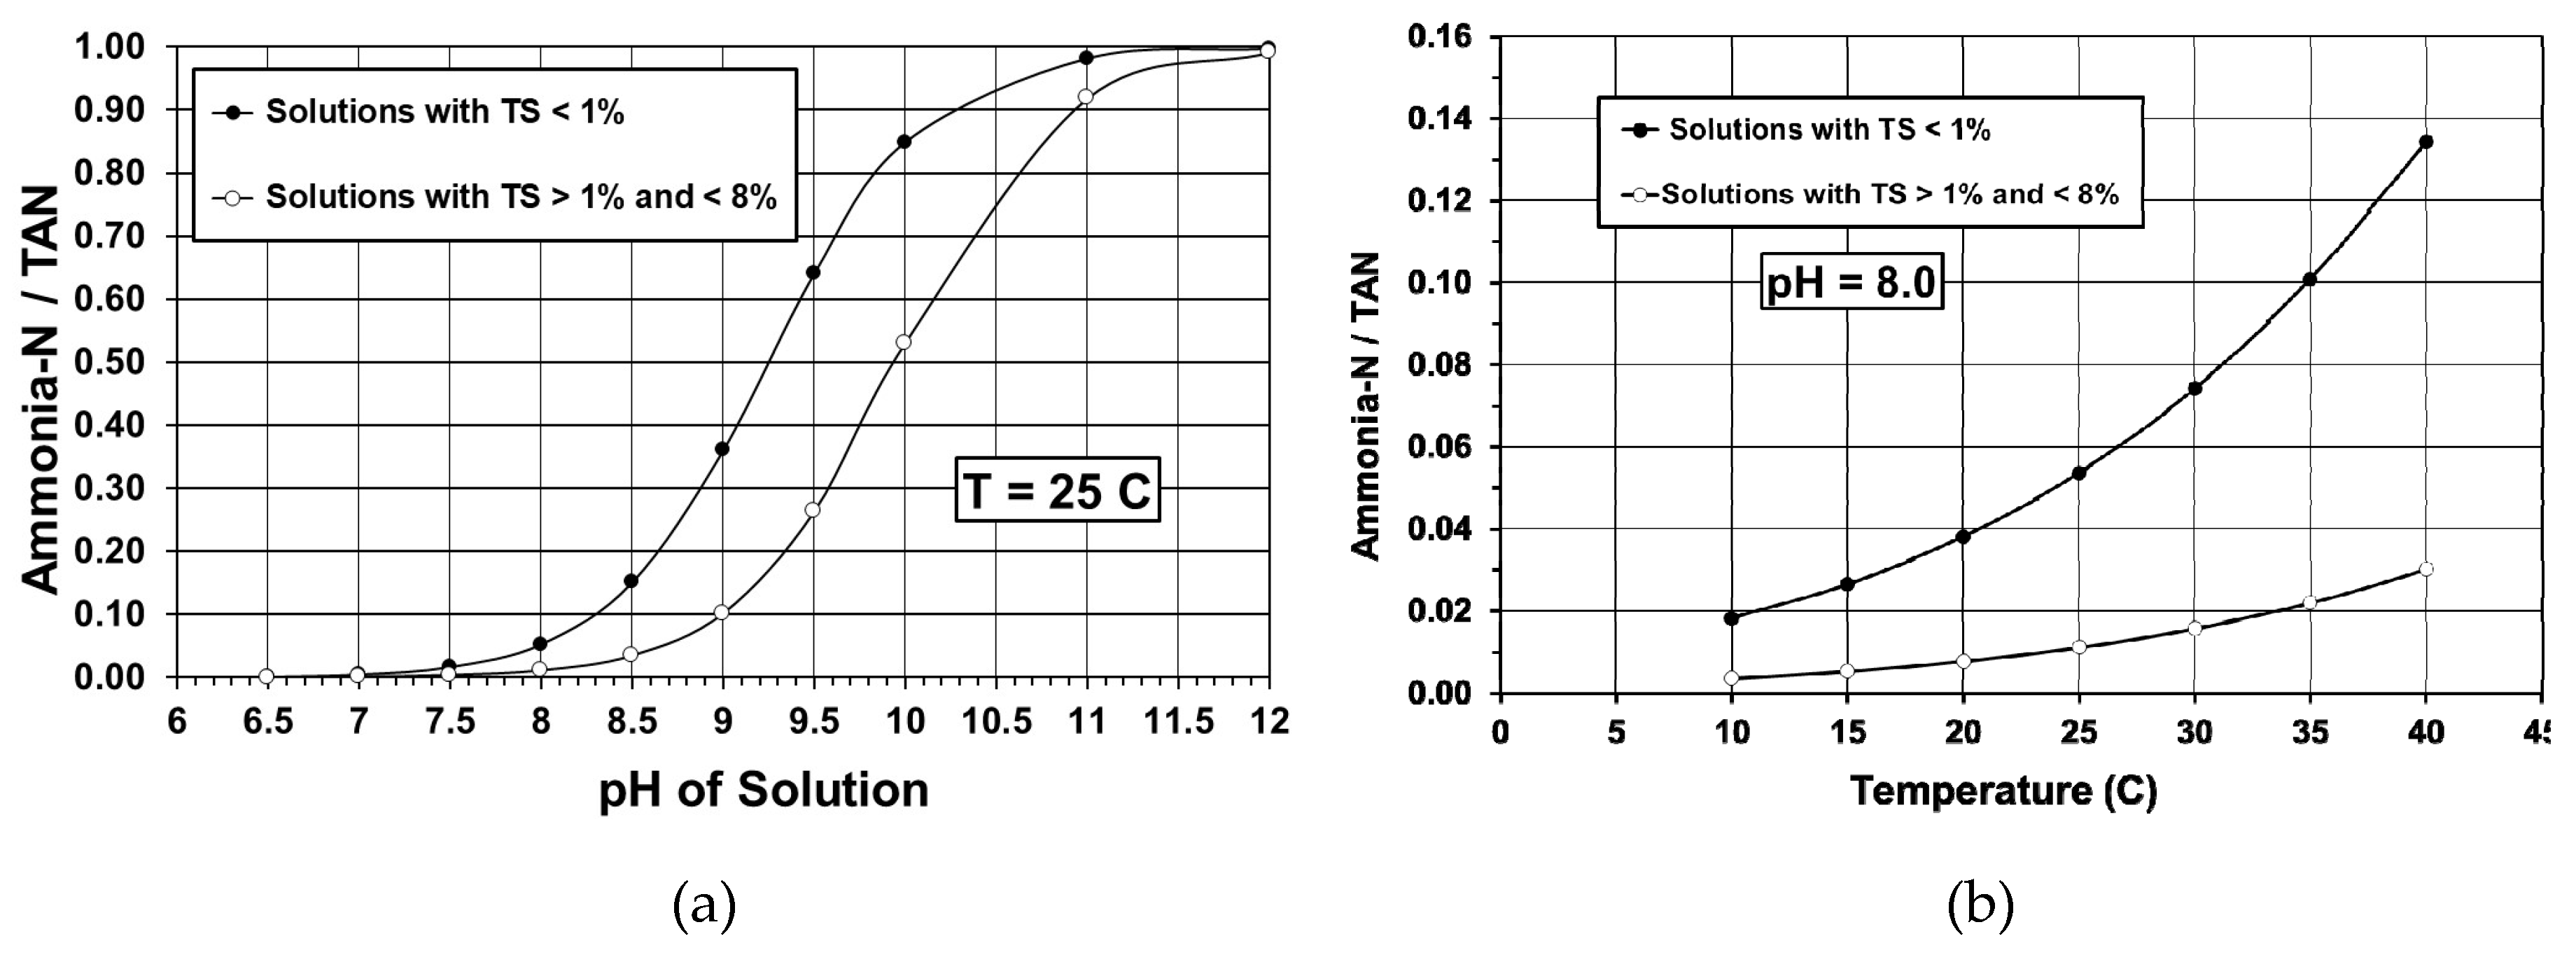
The TAN concentration is not the only factor that determines the amount of ammonia that could be lost during irrigation of liquid manure since only the fraction of total ammoniacal nitrogen that is in the ammonia form can be volatilized. The percentage of the TAN in the ammonia form has been shown to be a function of pH and temperature [24,25] as shown in Figure 1. Most liquid animal manure has a pH in the range of 7.0 to 8.0. Therefore, at a temperature of 25 °C the percentage of TAN in the ammonia form is in the range of 0.6% to 5.4%, Figure 1a. For liquid manure with a pH of 8.0, the percentage of TAN that could be lost as ammonia gas ranges from 5.4% at 25 °C to 13.4% at 40 °C, Figure 1b. The practical upper limit for ammonia loss as a percentage of TAN applied is 10% since most manure is not spread to fertilize cropland during hot weather. An ammonia loss of 10% during irrigation of liquid animal manure would require all ammonia in the liquid manure to be lost from the time it exits the sprinkler nozzle and before it strikes the ground. Therefore, ammonia losses during irrigation greater than 10% of the applied TAN in liquid manure were judged to be unlikely and nonhomogeneity in the liquid manure, or uncertainties in measurement or calculation may have confounded some of the observations.
Only three studies [11,12,13] were found that had the quantification of ammonia loss during irrigation as a primary objective, and only one study concluded that ammonia loss was significant [12]. Only one of these studies [13] included statistical and error analyses. Therefore, the objective of this study was to perform a pooled statistical analysis of the available data related to ammonia volatilization and evaporation losses during sprinkler irrigation of liquid animal manure.
2. Materials and Methods
A summary of the available data on ammonia volatilization loss during irrigation of liquid animal manure is presented in Table 2. Ammonia volatilization losses were calculated from the data reported by the authors based on the difference between the irrigated ([TANI]) and ground collected, ([TANG]) concentrations of total ammoniacal nitrogen. Ammonia losses, as a percentage of TAN applied ([TANI]), ranged from −33% to 26%, and the mean ammonia loss ranged from −2.5% to 13% across all studies shown.
The values of pH reported in these studies ranged from 7.1 to 8.6 with an average of about 7.7. Data were not provided on air temperature or wind speed in these studies. Some of the pH values reflect an increase in pH during irrigation [11] while others simply reported a range. Comparison of the mean pH of 7.7 with the relationships provided in Figure 1 indicated that the fraction of the TAN in the ammonia form was in the range of 6% to 10%. Therefore, if all ammonia was lost as the liquid travelled through the air the ammonia loss would be 10% or less of the TAN applied.
Negative ammonia loss values implied that TAN concentrations increased during irrigation. This was only possible if evaporation of water was substantial. Overall, the data indicated that a significant amount of uncertainty in the quantification of ammonia losses existed. The factors that have been proposed to affect the magnitude of ammonia loss from the time manure exited the sprinkler nozzle until it was collected in containers on the ground include air temperature, relative humidity, irrigation operating pressure, drop diameter, spray velocity, TAN content of the irrigated material, and pH [9,24,26,27]. These factors have been suggested as the cause of the variability in measuring ammonia volatilization losses. However, most of the authors did not report data on these factors or perform an error analysis on their data collection procedures.
In the investigation by Welsh [12], samples were taken from the storage or treatment structure before irrigation and from samples collected from several containers of unknown diameter on the ground following the irrigation event. The difference in average TAN concentration from the source and the containers was used to estimate NH3-N loss that occurred between the time the manure exited the nozzle and when it struck the ground. This study, conducted in Minnesota, included four different liquid manure types with very different characteristics as was reflected by the large range in total solids and TAN concentrations, Table 2. The average ammonia loss was −2.5% and was reported as not significantly different from zero [12].
Safley et al. [11] studied ammonia losses during irrigation of swine lagoon supernatant using centre pivot and traveling gun irrigation equipment in North Carolina. Ammonia losses were estimated by calculating the difference in TAN concentration between samples taken from the top 0.6 m of depth in the lagoon, and samples taken from liquid caught on the ground during irrigation using rain gauges with a diameter of 95 mm. The TAN concentration difference between irrigated and ground collected samples in the data presented by Safley et al. [11] ranged from −2.1% to 18.4% with a mean of 2.9% for the large bore sprinkler (big gun) and 4.9% for the centre-pivot.
Montes [13] collected ammonia volatilization data for sprinkler irrigation from two swine lagoons in South Carolina. Montes collected irrigated lagoon water samples from a sampling port in the irrigation pipe on the discharge side of the irrigation pump. The ground collected samples were the composite of samples collected in 8 locations within the irrigated plots using short plastic containers with a diameter of about 152 mm.
The studies by Westermann et al. [10], and Sharpe and Harper [9] did not include all the data required to be included in the present study and were excluded. All data included in the analysis are tabulated in Appendix A.
The data from the studies by Welsh [12], Safley et al. [11], and Montes [13] were pooled into common linear regression analyses. The quantities that were included were concentrations of TS, TAN, and TKN. The change in TS between the irrigated and ground collected samples was included to provide a measure of evaporation loss. Both TAN and TKN were included since a significant reduction in TAN or loss of water by evaporation during irrigation would be expected to result in a change in TKN.
3. Results and Discussion
Pooled linear regression analyses were performed for the irrigated and ground collected concentrations of TAN, TKN, and TS. The least-squares best fit for each constituent was represented by the following equation form:
where: [CI] = the concentration of TAN, TKN, or TS in the irrigated manure; [CG] = the concentration of TAN, TKN, or TS in the manure collected on the ground; and b = the slope of the line.
[CG] = b [CI]
The y-intercept in Equation (1) was set to zero because it was impossible for the concentration of TAN, TKN, or TS in the manure collected from containers on the ground, [CG], to have a value greater than zero if the corresponding concentrations in the irrigated manure, [CI], were zero. Therefore, the analysis was performed to force Equation (1) through the origin and force all error into the value of the slope, b.
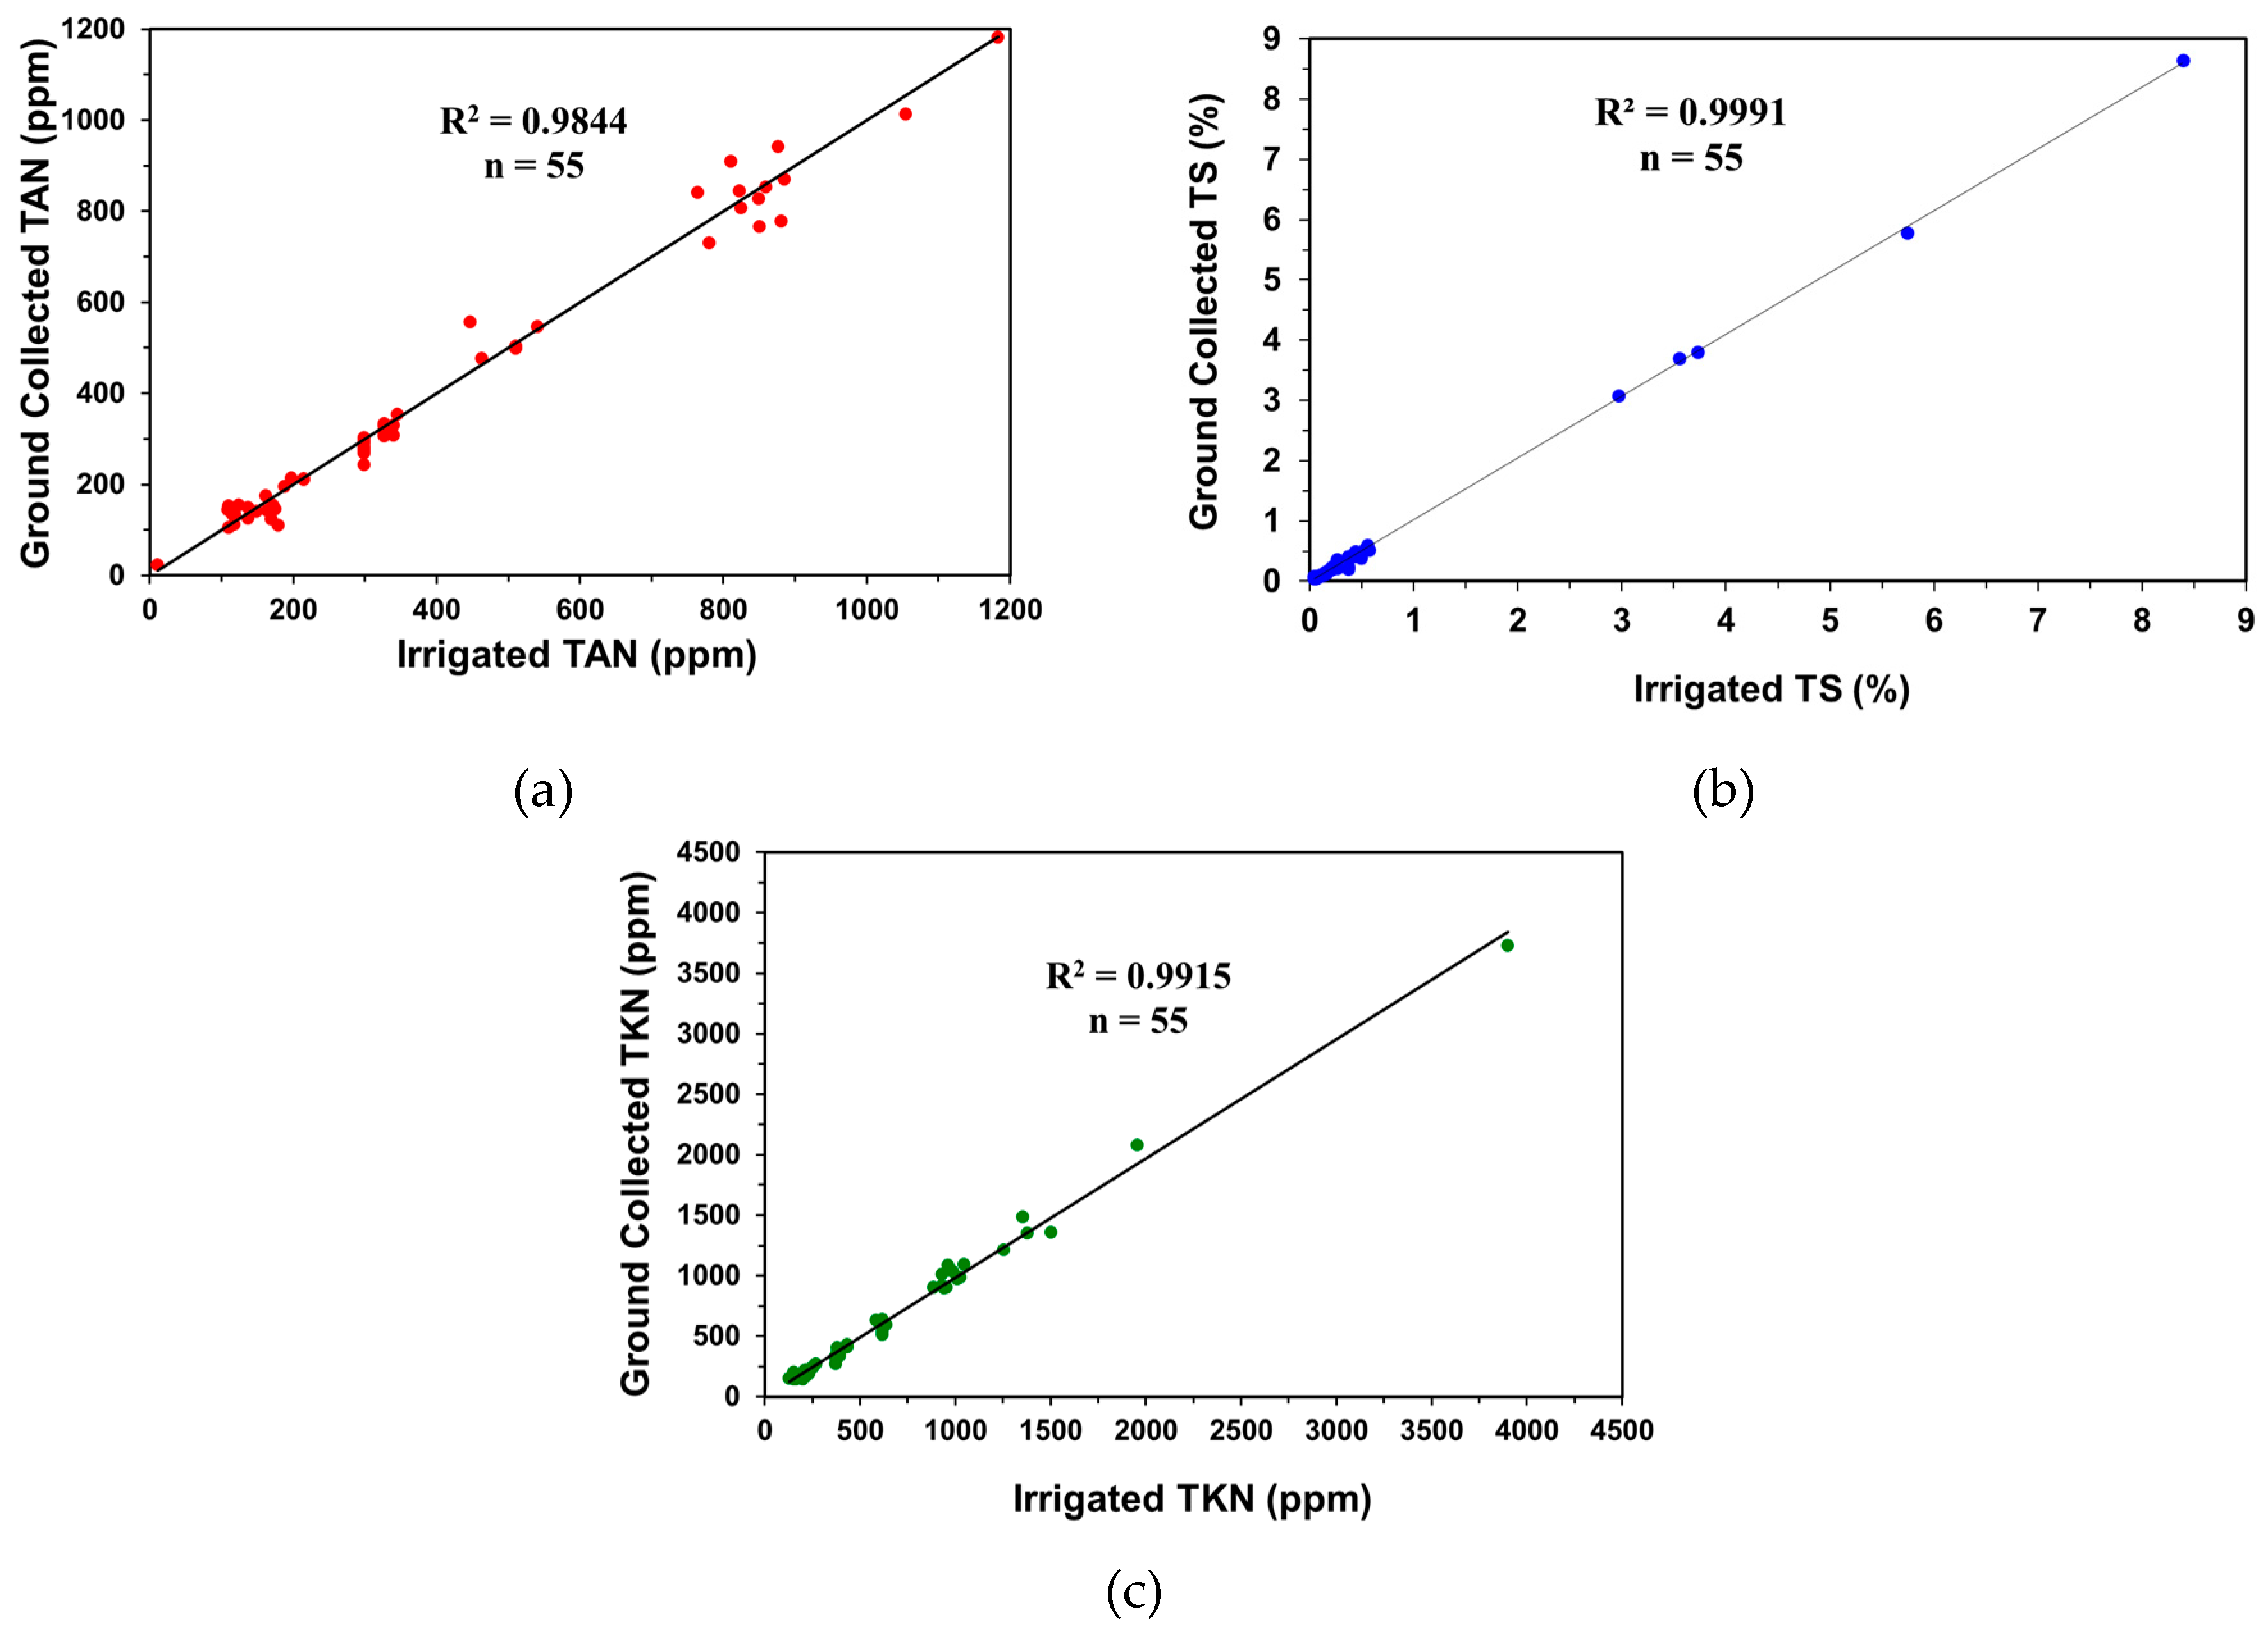
An analysis of variance (ANOVA) was performed for each regression [28]. The slope of the equation, b, was compared to 1.0 using a t-test at the 95% confidence level since a slope of 1.0 represented no change in concentration during irrigation. Correlations for irrigated versus ground collected TAN, TS, and TKN concentrations are provided in Figure 2. The results for the three analyses of variance are given in Table 3.
3.1. Influence of Irrigation on TAN—Ammonia Loss
The effect of the irrigation process on the TAN concentration of liquid animal manure is shown in Figure 2a, and the slope of the regression line was not significantly different from 1.0 at the 95% level (Table 3). As a result, the pooled analysis of 55 observations indicated that ammonia volatilization loss during irrigation was not statistically significant for manure with TS ranging from 0.04 to 8.39% TS, and TAN concentrations ranging from 11 to 1183 ppm.
The differences between TAN concentrations in irrigated and ground collected samples ([TANI] – [TANG]) were sometimes negative as indicated in Table 2 and Figure 2a. Since the statistical analysis indicated that the concentrations were not significantly different these negative values were due to the uncertainty, or lack of accuracy, in the measurements of TAN concentration.
The procedure to determine TAN concentration for irrigated and ground collected samples included the following potential sources of error: nonhomogeneity of the liquid manure, sampling in the field, sub-sampling in the laboratory to prepare aliquots for chemical analysis, and execution of the chemical analysis procedures. Each step had an associated error that contributed to the overall error in determining TAN concentration.
An estimate of the magnitude of overall error in determining TAN was made based on the variability in TAN concentration of samples taken from similar materials and conditions. The estimate of uncertainty in TAN measurements was based on the pooled variance of 965.3 (ppm)2 based on 62 observations of TAN provided by Montes [13]. The estimate of uncertainty in TAN concentration was the pooled standard deviation of ± 31.1 ppm.
Calculation of the volatilization loss in per cent required taking the difference between the irrigated and ground collected concentrations. The uncertainty in the difference between two measured values was estimated as [29,30]:
where: u(a−b) = uncertainty in knowing the difference between a and b; ua = uncertainty in measuring a; and ub = uncertainty in measuring b.
Using Equation (2) and the defined uncertainty for TAN (± 31.1 ppm), the uncertainty in per cent difference in concentrations between irrigated and ground collected samples (U ΔTAN) was estimated as:
U ΔTAN = (± 44 ppm ÷ [TAN I]) × 100.
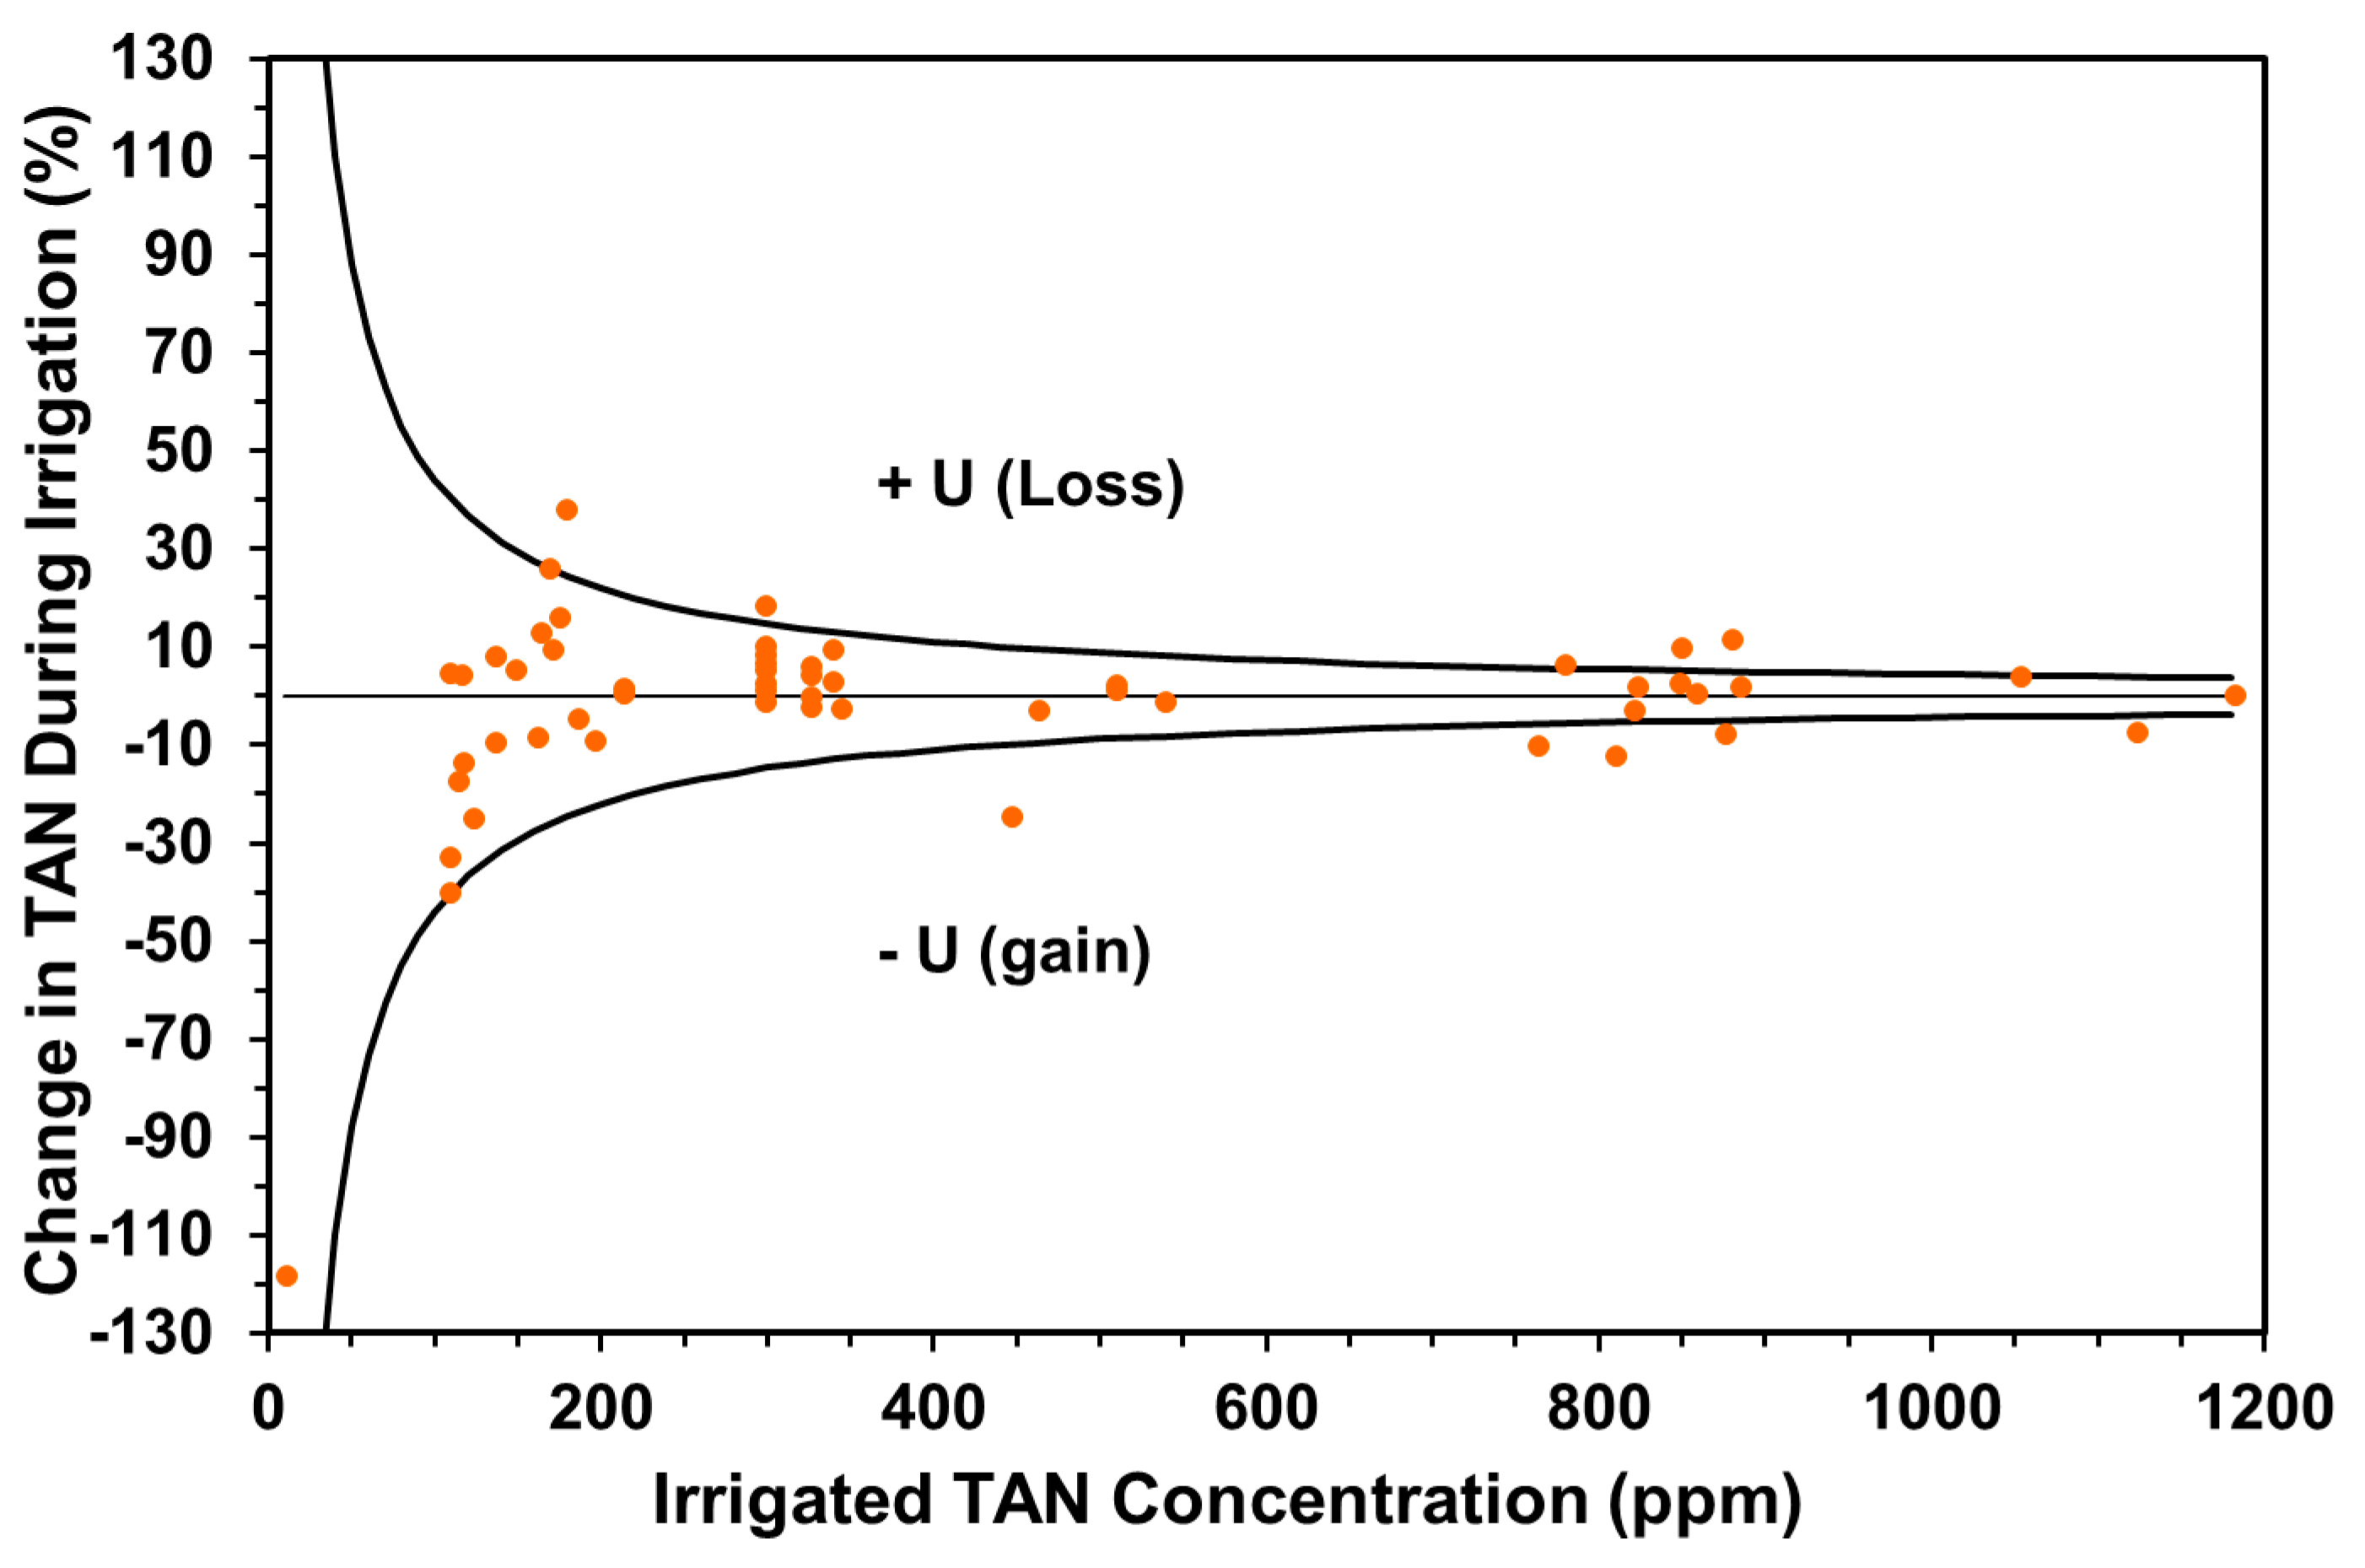
The uncertainty interval for TAN loss defined by Equation (3) is plotted in Figure 3 with all the data included in the present study. These results indicated that volatilization losses were well distributed about the line of zero difference. Ten of the 55 data points were not contained within the uncertainty interval for TAN. These results support the statistical conclusion and indicate that volatilization losses were not significant within the errors induced by calculation of a per cent loss and the errors associated with measurement.
3.2. Influence of Irrigation on TS—Evaporation Loss
The correlation results between the ground collected and irrigated concentrations of total solids were given previously in Figure 2b and Table 3. A t-test on the slope for the TS relationship indicated that a slope of 1.024 was significantly different from 1.0. Therefore, evaporation during irrigation increased the TS of the ground collected sample by 2.4%. Both empirical and modelling studies have observed evaporation losses during irrigation in the range of 1.0% to 3.5% [31,32]. The observation from this study agreed with the literature.
3.3. Influence of Irrigation on TKN
Total Kjeldahl nitrogen is the sum of TAN and organic nitrogen. Therefore, the TKN concentration in the ground collected sample would be expected to be slightly higher, giving a slope greater than 1.0, even if ammonia volatilization did not occur due to small, but significant, evaporation losses. However, the correlation analysis summarized in Figure 2c and Table 3 indicated that the TKN concentrations were not significantly influenced by irrigation at the 95% level. It appears that the uncertainties associated with measuring TKN concentrations, similar to those discussed for TAN, overshadowed the impact of the small amount of evaporation that was observed.
3.4. Comparison of the Ammonia Loss Results with Efforts to Include Evaporation and Drift
Safley et al. [11] attempted to incorporate the influence of evaporation and drift into the estimation of ammonia losses during irrigation using a centre pivot equipped with impact sprinklers. They reported that the ammonia losses during irrigation of lagoon supernatant ranged from 13.9% to 37.3% of TAN applied if evaporation and drift were included. However, their concentration data indicated that volatilization losses averaged 4.9% for 12 observations (Table 2). The irrigate-catch technique to estimate volume loss during irrigation was used by Safley et al. [11]. The error in the irrigate-catch technique was described as a recovery error (RE) defined as [31]:
where: AG = measured application depth (cm); AI = application depth (cm) based on flow measurements in the main irrigation pipe and the application area; and (AG /AI) = fraction of the actual irrigation depth (AI) recovered in containers on the ground.
RE = [ 1 − (AG/AI)] × 100
Safley et al. [11] incorporated Equation (4) in their calculation of ammonia loss (TAN LOSS) during irrigation as:
TAN LOSS = (1 − (AG/AI) ([TANG]/[TANI])) × 100.
If one notes that the irrigation depths in Equation (5) are for the same application area, the equation was an attempt to observe ammonia loss based on the mass of TAN collected on the ground versus the mass of TAN irrigated. Results obtained by this technique need to be interpreted with caution since all errors in (AG/AI) were counted as an irrigation recovery error (Equation (4)). The recovery error defined in Equation (4) included the following effects: (1) collection error, EC; (2) error due to the lack of uniformity of the irrigation system, EU; and (3) error caused by evaporation loss, EE.
The collection error, EC, was caused by liquid that drifted away from the collection containers, liquid that struck the collection containers but was not trapped, liquid lost by splashing out of the collection containers, and evaporation from the collection containers. A collection error related to the type of container used was explicitly measured by Kohl [33]. Kohl showed that the collection error for 76 mm diameter, funnel-type rain gauges (typical height of 304 mm) ranged from 85% at an application rate of 0.09 cm/h to 12% at a rate of 0.94 cm/h when compared to a precise collecting device (EC ≈ 0).
The error induced by lack of uniformity, EU, was directly related to the design of irrigation equipment, and the number and distribution of collection containers used to capture the spray. Centre pivot irrigation equipment typically provides an application uniformity that varies from 70% to 90% [34]. For design purposes, 80% is typically used as the application uniformity which yielded an EU of 20% [34].
Evaporation error from sprinkler spray, EE, depended on system pressure and droplet size, and has been observed to be small when compared with the effects of irrigation uniformity [31]. Empirical and modelling studies have shown that evaporation losses from irrigation systems varied from 1.0% to 3.5% [31,32]. The value used for EE in the present analysis was 2.0%.
The recovery error was estimated from the three common sources of irrigation calibration error to provide an independent estimate of the recovery error that was previously defined in Equation (4). This independent estimate of recovery error, RE, was calculated as [29,30]:
Safley et al. [11] used 95 mm rain gages to measure the application depth, AG, from a centre pivot irrigation system with an average application rate of 1.1 cm/h. Assuming a collection error of 12%, a uniformity error of 20%, and an evaporation error of 2% in Equation (6) yielded a recovery error (RE) of 23% for a centre pivot irrigation system. Evaporation from the sprinkler spray accounted for only 0.7% of the total recovery error while uniformity error contributed 73%.
Setting RE equal to 23% in Equation (4) and solving for (AG/AI) indicated that one would expect to recover 0.77 AI for a typical centre pivot irrigation system. The average fraction recovered observed by Safley et al. [11] was 0.77 indicating that their centre pivot performed as expected. Safley et al. [11] erroneously attributed the 23% recovery error, to evaporation and drift losses during irrigation.
As shown in Table 2, the average TAN loss for Safley’s center pivot study was 4.9%, which sets ([TANG]/[TANI]) equal to 0.951, and the mean value of (AG/AI) was 0.77. As a result, the average TAN loss reported by Safley et al. [11] using Equation (5) was 26.8%. However, most of the average ammonia loss predicted using Equation (5) was due to volume collection error in the irrigate-catch technique and not evaporation and drift as assumed by Safley et al. [11].
4. Conclusions
Ammonia volatilization data from three independent studies [11,12,13] were pooled to determine if ammonia loss was significant during irrigation of liquid animal manure. The concentrations of TAN in the irrigated manure ranged from 11 to 1183 ppm. The corresponding range of total solids in the irrigated manure ranged from 0.04% to 8.39%. The following conclusions were developed based on the results.
- Irrigation of liquid animal manure increased the TS concentration by 2.4%. Evaporation was small, but statistically significant and agreed with expectations for centre pivot irrigation using rain gauges to measure irrigation depth.
- Irrigation of liquid animal manure did not significantly influence the concentration of TAN or TKN in the ground collected samples and the slopes of the regression equations were not significantly different from 1.0. Therefore, ammonia volatilization loss during irrigation was not statistically significant.
- The per cent difference between irrigated and ground collected TAN concentrations was within the errors associated with measurement of TAN concentrations, and calculation of per cent differences.
- Authors of a previous study attempted to calculate the impact of evaporation and drift on ammonia losses during center pivot irrigation of lagoon water. However, there efforts were confounded by irrigation volume measurement error (recovery error).
While the results of this study concluded that ammonia volatilization was not significant during irrigation, it does not imply that ammonia volatilization after the manure strikes the ground is to be ignored. The suitability of irrigation as a liquid manure application technique should be evaluated based on the level of treatment provided, the solids content of the manure, and the potential for odour impact on neighbours. The irrigation system should be designed and operated to prevent drift, or overspray onto roads, or adjacent property owned by neighbours. In addition, any method of manure application must be carried out to prevent manure from being applied so as to impair surface water. Irrigation may still be a suitable and cost-effective method to apply large quantities of liquid manure to utilize the plant nutrients for crop production in cases where physical and biological treatment is provided. Application methods that reduce ammonia loss following application, such as immediate incorporation, direct injection, band application, or similar methods that reduce ammonia loss are generally recommended if slurry manure or agitated lagoon sludge is to be used as a fertilizer substitute.
Author Contributions
The author is responsible for the content and data analysis provided in this paper.
Funding
This research received no external funding.
Conflicts of Interest
The author declares no conflict of interest.
Appendix A

Table A1.
Concentrations of TS, TAN, and TKN in the irrigated manure and the ground-collected samples obtained from a studies conducted in Minnesota (Welsh [12]), and North Carolina (Safley et al [11]).
| Source | [TS I] (%) | [TS G] (%) | [TAN I] (ppm) | [TAN G] (ppm) | [TKN I] (ppm) | [TKN G] (ppm) |
|---|---|---|---|---|---|---|
| Big Gun, Dairy, Beef, Swine [12] | 8.39 | 8.65 | 850 | 767 | 3900 | 3733 |
| 0.29 | 0.31 | 11 | 24 | 377 | 336 | |
| 3.73 | 3.80 | 345 | 354 | 1500 | 1358 | |
| 3.55 | 3.70 | 187 | 196 | 960 | 1090 | |
| 5.74 | 5.79 | 810 | 910 | 1953 | 2083 | |
| Big Gun, Swine Lagoon [11] | 0.26 | 0.22 | 340 | 330 | 431 | 434 |
| 0.26 | 0.36 | 340 | 308 | 431 | 414 | |
| 0.37 | 0.20 | 510 | 499 | 617 | 516 | |
| 0.37 | 0.25 | 510 | 504 | 617 | 538 | |
| 0.11 | 0.11 | 214 | 211 | 251 | 246 | |
| 0.11 | 0.10 | 214 | 213 | 251 | 243 | |
| Center Pivot, Swine Lagoon [11] | 0.17 | 0.15 | 299 | 269 | 391 | 338 |
| 0.17 | 0.17 | 299 | 274 | 391 | 359 | |
| 0.17 | 0.16 | 299 | 283 | 391 | 383 | |
| 0.17 | 0.17 | 299 | 279 | 391 | 388 | |
| 0.16 | 0.14 | 327 | 313 | 379 | 344 | |
| 0.16 | 0.17 | 327 | 307 | 379 | 351 | |
| 0.16 | 0.17 | 327 | 328 | 379 | 371 | |
| 0.16 | 0.17 | 327 | 334 | 379 | 406 | |
| 0.14 | 0.12 | 299 | 244 | 372 | 274 | |
| 0.14 | 0.14 | 299 | 291 | 372 | 329 | |
| 0.14 | 0.14 | 299 | 296 | 372 | 324 | |
| 0.14 | 0.14 | 299 | 303 | 372 | 335 |
Table A2.
Concentrations of TS, TAN, and TKN in the irrigated manure and the ground-collected samples obtained from two swine lagoons in South Carolina (Montes [13]).
Table A2.
Concentrations of TS, TAN, and TKN in the irrigated manure and the ground-collected samples obtained from two swine lagoons in South Carolina (Montes [13]).
| Source | [TS I] (%) | [TS G] (%) | [TAN I] (ppm) | [TAN G] (ppm) | [TKN I] (ppm) | [TKN G] (ppm) |
|---|---|---|---|---|---|---|
| Lagoon A, Solid-Set Impact Sprinkler | 0.49 | 0.39 | 859 | 854 | 1026 | 985 |
| 0.44 | 0.46 | 880 | 779 | 941 | 900 | |
| 0.44 | 0.42 | 780 | 731 | 929 | 915 | |
| 0.44 | 0.5 | 764 | 842 | 883 | 905 | |
| 0.47 | 0.45 | 849 | 828 | 951 | 907 | |
| 0.49 | 0.47 | 824 | 808 | 928 | 1014 | |
| 0.57 | 0.52 | 1054 | 1014 | 1252 | 1214 | |
| 0.5 | 0.48 | 1183 | 1183 | 1352 | 1485 | |
| 0.49 | 0.48 | 1124 | 1206 | 1378 | 1352 | |
| 0.54 | 0.53 | 876 | 943 | 1045 | 1093 | |
| 0.53 | 0.54 | 885 | 870 | 986 | 1037 | |
| 0.55 | 0.6 | 822 | 845 | 1009 | 977 | |
| 0.37 | 0.4 | 463 | 477 | 583 | 636 | |
| 0.37 | 0.42 | 447 | 557 | 614 | 640 | |
| 0.39 | 0.41 | 540 | 547 | 637 | 597 | |
| Lagoon B, Solid-Set, Impact Sprinkler | 0.14 | 0.11 | 169 | 125 | 209 | 181 |
| 0.22 | 0.2 | 164 | 143 | 232 | 193 | |
| 0.23 | 0.26 | 162 | 176 | 208 | 219 | |
| 0.21 | 0.23 | 197 | 215 | 269 | 274 | |
| 0.05 | 0.06 | 115 | 135 | 162 | 146 | |
| 0.05 | 0.05 | 137 | 126 | 174 | 153 | |
| 0.04 | 0.05 | 124 | 155 | 162 | 181 | |
| 0.04 | 0.08 | 175 | 147 | 216 | 224 | |
| 0.09 | 0.08 | 149 | 141 | 165 | 168 | |
| 0.06 | 0.08 | 118 | 134 | 128 | 155 | |
| 0.06 | 0.06 | 179 | 111 | 200 | 146 | |
| 0.05 | 0.08 | 110 | 154 | 161 | 176 | |
| 0.08 | 0.08 | 171 | 155 | 214 | 171 | |
| 0.07 | 0.06 | 137 | 150 | 152 | 201 | |
| 0.06 | 0.06 | 110 | 105 | 150 | 146 | |
| 0.06 | 0.06 | 117 | 112 | 137 | 162 | |
| 0.05 | 0.06 | 109 | 145 | 158 | 155 |
References
- Sommer, S.G.; Olsen, J.E. Effects of dry matter content and temperature on ammonia loss from surface-applied cattle slurry. J. Environ. Qual. 1991, 20, 679–683. [Google Scholar] [CrossRef]
- Sommer, G.S.; Friis, E.; Bach, A.; Schoriing, J. Ammonia volatilization from pig slurry applied with trail hoses or broad spread to winter wheat: Effects of crop developmental stage, microclimate, and leaf ammonia absorption. J. Environ. Qual. 1997, 26, 1153–1160. [Google Scholar] [CrossRef]
- Meisinger, J.J.; Jokela, W.E. Ammonia Volatilization from Dairy and Poultry Manure. In Managing Nutrients and Pathogens from Animal Agriculture; NRAES-130; Natural Resource, Agriculture, and Engineering Service (NRAES), Cooperative Extension, Cornell University: Ithaca, NY, USA, 2000; pp. 334–354. [Google Scholar]
- Pain, B.F.; Misselbrook, T.H. Sources of Variation in Ammonia Emission Factors for Manure Applications to Grassland. In Gaseous Nitrogen Emissions from Grasslands; Jarvis, S.C., Pain, B.F., Eds.; CAB Internat: Oxon, UK, 1997; pp. 293–301. [Google Scholar]
- Frost, J. Effect of spreading method, application rate and dilution on ammonia volatilization from cattle slurry. Grass Forage Sci. 1994, 49, 391–400. [Google Scholar] [CrossRef]
- Huijsmans, J.F.M.; Hol, J.M.G.; Bussink, D.W. Reduction of Ammonia Emission by New Slurry Application Techniques on Grassland. In Gaseous Nitrogen Emissions from Grasslands; Jarvis, S.C., Pain, B.F., Eds.; CAB Internat: Oxon, UK, 1997; pp. 281–285. [Google Scholar]
- Dougherty, M.; Geohring, L.D.; Wright, P.; Lash, M. Liquid Manure Application Systems Design Manual; NRAES-89; NRAES, Cornell University Cooperative Extension: Ithaca, NY, USA, 1998. [Google Scholar]
- Montes, F.; Chastain, J.P. Ammonia Volatilization Losses Following Irrigation of Liquid Swine Manure in Commercial Pine Plantations. In Animal, Agricultural and Food Processing Wastes IX, Proceedings of the Ninth International Symposium, Research Triangle Park, NC, USA, 12–15 October 2003; Burnes, R.T., Ed.; ASABE: St. Joseph, MI, USA, 2003; pp. 620–628. [Google Scholar]
- Sharpe, R.R.; Harper, L.A. Ammonia and nitrous oxide emissions from sprinkler irrigation applications of swine effluent. J. Environ. Qual. 1997, 26, 1703–1706. [Google Scholar] [CrossRef]
- Westerman, P.W.; Huffman, R.F.; Baker, J.C. Environmental and Agronomic Evaluation of Applying Swine Lagoon Effluent to Coastal Bermudagrass for Intensive Grazing and Hay. In Proceedings of the Seventh International Symposium, Chicago, IL, USA, 18–20 June 1995; pp. 150–161. [Google Scholar]
- Safley, L.M.; Barker, J.C.; Westerman, P.W. Loss of nitrogen during sprinkler irrigation of swine lagoon liquid. Bioresour. Technol. 1992, 40, 7–15. [Google Scholar] [CrossRef]
- Welsh, S.K. The Effect of Sprinkling on the Physical and Chemical Properties of Liquid Animal Waste. Master’s Thesis, University of Minnesota, St. Paul, MN, USA, 1973. [Google Scholar]
- Montes, F. Ammonia Volatilization Resulting from Application of Liquid Swine Manure and Turkey Litter in Commercial Pine Plantations. Master’s Thesis, Clemson University, Clemson, SC, USA, 2002. [Google Scholar]
- Chastain, J.P.; Vanotti, M.B.; Wingfield, M.M. Effectiveness of liquid-solid separation for treatment of flushed dairy manure: A case study. Appl. Eng. Agric. 2001, 17, 343–354. [Google Scholar] [CrossRef]
- Chastain, J.P.; Lucas, W.D.; Albrecht, J.E.; Pardue, J.C.; Adams, J., III; Moore, K.P. Removal of solids and major plant nutrients from swine manure using a screw press separator. Appl. Eng. Agric. 2001, 17, 355–363. [Google Scholar] [CrossRef]
- Vanotti, M.B.; Szogi, A.A.; Millner, P.D.; Loughrin, J.H. Development of a second generation environmentally superior technology for treatment of swine manure in the USA. Bioresour. Technol. 2009, 100, 5406–5416. [Google Scholar] [CrossRef] [PubMed]
- Chastain, J.P.; Camberato, J.J. Dairy Manure Production and Nutrient Content. In Confined Animal Manure Managers Certification Program Manual: Dairy Version; Clemson University Extension: Clemson, SC, USA, 2004; pp. 3a-1–3a-16. Available online: https://www.clemson.edu/extension/camm/manuals/dairy_toc.html (accessed on 2 September 2019).
- Chastain, J.P.; Camberato, J.J.; Albrecht, J.E.; Adams, J., III. Swine Manure Production and Nutrient Content. In Confined Animal Manure Managers Certification Program Manual: Swine Version II; Clemson University Extension: Clemson, SC, USA, 1999; pp. 3-1–3-17. Available online: https://www.clemson.edu/extension/camm/manuals/swine_toc.html (accessed on 2 September 2019).
- Chastain, J.P.; Darby, J.A., Jr. A Thickening Process for Reducing the Cost of Utilizing Dairy Lagoon Sludge. In Animal, Agricultural and Food Processing Wastes, Proceedings of the Eighth International Symposium, Des Moines, IA, USA, 9–11 October 2000; Moore, A., Ed.; ASABE: St. Joseph, MI, USA, 2000; pp. 694–701. [Google Scholar]
- Cantrell, K.B.; Chastain, J.P.; Moore, K.P. Geotextile filtration performance for lagoon sludges and liquid animal manures dewatering. Trans. ASABE 2008, 51, 1067–1076. [Google Scholar] [CrossRef]
- Pettygrove, G.S.; Heinrich, A.L.; Eagle, A.J. Dairy Manure Nutrient Content and Forms. In Manure Technical Bulletin Series; University of California Cooperative Extension: Davis, CA, USA, 2010; Available online: http://manuremanagement.ucdavis.edu/files/134369.pdf. (accessed on 2 September 2019).
- DeRouchey, J.M.; Goodband, R.D.; Nelssen, J.L.; Tokach, S.S.; Murphy, J.P. Nutrient composition of Kansas swine lagoon and hoop barn manure. J. Anim. Sci. 2002, 80, 2051–2061. [Google Scholar] [CrossRef] [PubMed]
- Mukhtar, S.; Ullman, J.L.; Auvermann, B.W.; Feagley, S.E.; Carpenter, T.A. Impact of anaerobic lagoon management on sludge accumulation and nutrient content for dairies. Trans. ASAE 2004, 47, 251–257. [Google Scholar] [CrossRef]
- Denmead, O.T.; Frenney, J.R.; Simpson, J.R. Dynamics of ammonia volatilization during furrow irrigation of maize. Soil Sci. Soc. Am. J. 1982, 46, 149–155. [Google Scholar] [CrossRef]
- Zhang, R.H. Degradation of Swine Manure and a Computer Model for Predicting the Desorption Rate of Ammonia from an Under-floor Pit. Ph.D. Thesis, University of Illinois, Urbana-Champaign, IL, USA, 1992. [Google Scholar]
- Pote, J.W.; Miner, J.R.; Koelliker, J.K. Ammonia losses during sprinkler application of animal wastes. Trans. ASAE 1980, 23, 1202–1206. [Google Scholar] [CrossRef]
- Brunke, R.; Alvo, P.; Schuepp, P.; Gordon, R. Effect of meteorological parameters on ammonia loss from manure in the field. J. Environ. Qual. 1988, 17, 431–436. [Google Scholar] [CrossRef]
- Steel, R.G.D.; Torrie, J.H.; Dickey, D. Principles and Procedures of Statistics: A Biometrical Approach, 3rd ed.; McGraw-Hill Book Company: New York, NY, USA, 1997. [Google Scholar]
- Taylor, J.R. An Introduction to Error Analysis: The Study of Uncertainties in Physical Measurements, 2nd ed.; University Science Books: Sausalito, CA, USA, 1997. [Google Scholar]
- Holman, J.P. Experimental Methods for Engineers, 6th ed.; McGraw-Hill Book Company: New York, NY, USA, 1993. [Google Scholar]
- Heermann, D.F.; Kohl, A. Fluid Dynamics of Sprinkler Systems. In Design and Operation of Farm Irrigation Systems; ASAE Monograph No., 3; Jensen, M.E., Ed.; ASABE: St. Joseph, MI, USA, 1980. [Google Scholar]
- Thompson, A.L.; Gilley, J.R.; Norman, J.M. A Sprinkler water droplet evaporation and plant canopy model. Trans. ASAE 1993, 36, 735–750. [Google Scholar] [CrossRef]
- Kohl, R. Sprinkler precipitation gage errors. Trans. ASAE 1972, 15, 264–265. [Google Scholar] [CrossRef]
- Kruse, E.G.; Bucks, D.A.; Von Bernuth, R.D. Comparison of Irrigation Systems. Agronomy 1990, 30, 475–508. [Google Scholar]
Figure 1.
Impact of pH (a, temperature held at 25 °C) and temperature (b, pH held at 8.0) on the fraction of total ammoniacal nitrogen (TAN = NH4+-N + NH3-N) in ammonia form for liquid animal manure (adapted from Denmead et al. [24] and Zhang [25]).

Figure 2.
Comparison of irrigated and ground collected concentrations of TAN (a), TS (b), and TKN (c) for irrigated manure.
Figure 2.
Comparison of irrigated and ground collected concentrations of TAN (a), TS (b), and TKN (c) for irrigated manure.

Figure 3.
Comparison of the change in total ammoniacal nitrogen concentration during irrigation with the uncertainty associated with the calculation of per cent differences (± U ΔTAN, Equation (3)).
Figure 3.
Comparison of the change in total ammoniacal nitrogen concentration during irrigation with the uncertainty associated with the calculation of per cent differences (± U ΔTAN, Equation (3)).

Table 1.
Example concentrations of total solids (TS), total Kjeldahl nitrogen (TKN), total ammoniacal nitrogen (TAN), and TAN/TKN for liquid dairy and swine manure as removed from buildings and after various levels of treatment.
Table 1.
Example concentrations of total solids (TS), total Kjeldahl nitrogen (TKN), total ammoniacal nitrogen (TAN), and TAN/TKN for liquid dairy and swine manure as removed from buildings and after various levels of treatment.
| Description | TS (%) | TKN (mg/L) | TAN (mg/L) | TAN/TKN (%) |
|---|---|---|---|---|
| Multi-stage treatment on a dairy farm [14] | ||||
| As removed from animal housing | 3.8 | 1433 | 661 | 46 |
| After solid-liquid separation by screening | 1.5 | 729 | 359 | 49 |
| After gravity settling | 1.1 | 703 | 399 | 57 |
| After lagoon treatment—surface liquid | 0.27 | 373 | 303 | 81 |
| After screening and gravity settling with polymer (250 to 400 mg polyacrylamide polymer (PAM/L)) | 0.26–0.43 | 374–481 | 272–247 | 73–51 |
| Single-stage lagoon treatment on a swine finishing farm [15] | ||||
| As removed from animal housing | 2.0 | 2397 | 1666 | 70 |
| After lagoon treatment—surface liquid | 0.50 | 760 | 520 | 68 |
| Advanced multi-step treatment on a swine finishing farm [16] | ||||
| As removed from animal housing | 2.9 | 2007 | 1251 | 62 |
| After polymer enhanced solid–liquid separation | 1.4 | 1414 | 1190 | 84 |
| After biological N treatment (nitrification and denitrification) | 0.95 | 121 | 103 | 85 |
| After phosphorus treatment | 0.97 | 83 | 43 | 52 |
| Effluent from treatment lagoons | ||||
| Dairy—surface water [17,21] | 0.60–0.85 | 599–670 | 360–383 | 54–64 |
| Dairy—agitated sludge and liquids [19,20,21,23] | 4.0–7.5 | 918–2565 | 138–434 | 15–17 |
| Swine—surface water [18,22] | 0.37–1.3 | 576–1852 | 408–1506 | 71–87 |
| Swine—agitated sludge and liquids [18,20] | 2.2–3.7 | 960–2012 | 393–467 | 20–49 |
Table 2.
Summary of available data on volatilization losses during sprinkler irrigation of liquid animal manure.
Table 2.
Summary of available data on volatilization losses during sprinkler irrigation of liquid animal manure.
| Description and Source | Irrigated TAN (ppm) | Irrigated TS (%) | pH | Ammonia Loss (% of TAN Applied) | n |
|---|---|---|---|---|---|
| Big Gun: Dairy, Beef (treated), Swine [12] | 11 to 850 | 0.28 to 8.39 | 7.4 to 7.9 | −2.5 (−12.4 to 9.8) | 5 |
| Centre Pivot: Swine [11] | 299 to 327 | 0.14 to 0.17 | 7.4 to 7.5 | 4.9 (−2.1 to 18.4) | 12 |
| Big Gun: Swine [11] | 214 to 510 | 0.11 to 0.37 | 7.1 to 7.7 | 2.9 (0.5 to 9.4) | 6 |
| Big Gun: Swine [10] | NR 1 | NR | NR | 5.7 (−5.0 to 24) | 3 |
| Solid Set: Swine [9] | 53 | NR | NR | 13 | NR |
| Solid Set: Swine [13] | 110 to 1183 | 0.04 to 0.57 | 7.6 to 8.6 | 0.3 (−33 to 26) | 32 |
1 NR = not reported.
Table 3.
Results of the analysis of variance of the regression using Equation (1) for comparison of irrigated and ground collected concentrations of TS, TAN, and TKN (n = 55, residual degrees of freedom = 54).
Table 3.
Results of the analysis of variance of the regression using Equation (1) for comparison of irrigated and ground collected concentrations of TS, TAN, and TKN (n = 55, residual degrees of freedom = 54).
| Irrigated Concentration | R2 | b | SE b 1 | C.I. (b) 2 | SE y 3 |
|---|---|---|---|---|---|
| [TSI], 0.04% to 8.39% | 0.9991 | 1.024* | 0.004 | ± 0.008 | 0.046 % |
| [TANI], 11 to 1183 ppm | 0.9844 | 0.9999 | 0.010 | ± 0.021 | 39.3 ppm |
| [TKNI], 128 to 3900 ppm | 0.9915 | 0.9846 | 0.009 | ± 0.018 | 56.0 ppm |
1. Standard error of b. 2. 95% confidence interval about b. 3. Standard error of the y-estimate. * Significantly different from 1.0 at the 95% level.
© 2019 by the author. Licensee MDPI, Basel, Switzerland. This article is an open access article distributed under the terms and conditions of the Creative Commons Attribution (CC BY) license (http://creativecommons.org/licenses/by/4.0/).
Share and Cite
MDPI and ACS Style
Chastain, J.P. Ammonia Volatilization Losses during Irrigation of Liquid Animal Manure. Sustainability 2019, 11, 6168. https://0-doi-org.brum.beds.ac.uk/10.3390/su11216168
AMA Style
Chastain JP. Ammonia Volatilization Losses during Irrigation of Liquid Animal Manure. Sustainability. 2019; 11(21):6168. https://0-doi-org.brum.beds.ac.uk/10.3390/su11216168
Chicago/Turabian StyleChastain, John P. 2019. "Ammonia Volatilization Losses during Irrigation of Liquid Animal Manure" Sustainability 11, no. 21: 6168. https://0-doi-org.brum.beds.ac.uk/10.3390/su11216168
Note that from the first issue of 2016, this journal uses article numbers instead of page numbers. See further details here.