Passenger Flow Pushing Assignment Method for an Urban Rail Network Based on Hierarchical Path and Line Decomposition


School of Traffic and Transportation Engineering, Central South University, Changsha 410075, China
*
Author to whom correspondence should be addressed.
Sustainability 2019, 11(22), 6441; https://0-doi-org.brum.beds.ac.uk/10.3390/su11226441
Submission received: 10 October 2019
/
Revised: 11 November 2019
/
Accepted: 13 November 2019
/
Published: 15 November 2019
(This article belongs to the Collection Sustainable Rail and Metro Systems)
Abstract
:For urban rail transit, an environmentally-friendly transportation mode, reasonable passenger flow assignment is the basis of train planning and passenger control, which is conducive to the sustainability of finance, operation and production. With the continuous expansion of the scale of urban rail networks, passenger travel path decision-making tends to be complex, which puts forward higher requirements of networked transportation organization. Based on undirected graphs and the idea of the recursive divide-and-conquer algorithm, this paper proposes a hierarchical effective path search method made up of a three-layer path generation strategy, which consists of deep search line paths, key station paths composed of origin–destination (O-D) nodes and transfer stations, and the station sequence path between the key stations. It can effectively simplify the path search and eliminate obvious unreasonable paths. Comparing the existing research results based on the classical polynomial Logit model, a practical Improved C-Logit multi-path passenger flow assignment model is proposed to calculate the selection ratio of each path in the set of effective paths. Combining the hierarchical path search strategy, the O-D pairs of passenger flow are divided into local-line and cross-line situations. The time-varying cross-line passenger flow is decomposed into a series of passenger sections along the key station paths. A passenger flow pushing assignment algorithm based on line decomposition is designed, which satisfies the dynamic, time-varying and continuous characteristics. The validation of Guangzhou Metro’s actual line network and time-varying O-D passenger demand in 2019 shows that the spatio-temporal distribution results of the passenger pushing assignment have a high degree of coincidence with the actual statistical data.
1. Introduction
As the backbone of the public transport system, urban rail transit has the characteristics of energy-saving, land-saving, large capacity, non-pollution and safety, which are suitable for the sustainable development of large and medium-sized cities [1,2,3,4]. With the expansion of the construction scale of urban rail transit networks in China, the demand for passenger flow has increased substantially. Faced with the increasingly severe contradiction between supply and demand, the network operation of urban rail transit gradually presents the characteristics of refined capacity arrangement and diversified transport modes. Under the operation mode of transfer within the station, the automatic fare collection (AFC) system records the information of origin and destination (O-D) and inbound and outbound time. The assignment of passenger flow is the basis of train operation planning. Reasonable train operation planning depends on accurate passenger flow distribution characteristics, so as to achieve the goal of not only maintaining a high level of passenger service, but also improving vehicle utilization efficiency, which is also the inherent requirement of the sustainable development of urban rail transit. However, it is difficult to accurately determine the transfer path and ride information of passenger flow with the same O-D pair in the urban rail system, which brings challenges to the assignment of urban rail passenger flow on a network scale and in a systemic way.
In this context, aiming at the characteristics of urban rail network operation, based on undirected graphs and the recursive divide-and-conquer idea, this paper proposes a Hierarchical Effective Path Search Strategy which generates the effective path set by dividing the network into three layers: line layer, key station layer and station sequence layer between key stations. That is to say, line paths are searched in depth according to the connection relationship between lines. On this basis, the key station paths composed of O-D pairs and transfer stations are sequentially determined, and the station sequence between key stations is filled to form complete and effective paths, eliminating obvious unreasonable paths as well. A practical Improved C-Logit multi-path passenger flow assignment model is proposed to calculate the selection ratio of each path in the set of effective paths. According to the characteristics of urban rail transit passenger flow and hierarchical path search strategy, a passenger flow pushing assignment algorithm is designed based on the idea of line decomposition, which satisfies dynamic, time-varying and continuous characteristics, where “passenger flow pushing assignment” means that passengers are transported forward at a certain travel speed, reflecting the dynamic riding process from the origin to the destination. According to the key station path, time-varying O-D passenger flow demand is decomposed into each ride section of the corresponding line, thus formulating the local-line and cross-line passenger flow pushing assignment algorithm, where for one passenger flow O-D pair, “local-line” refers to the situation in which all stations on the ride path are located in one line, and passengers do not need to transfer during the journey, whereas “cross-line” means that all stations on the ride path are located in several ride sections belonging to different lines separately, and passengers have to transfer at least once during the journey. Finally, the model and algorithm are verified by the Guangzhou Metro instance.
2. Literature Review
Theoretical models of traffic flow distribution have been developed in recent decades, which makes it possible for the existing theories and methods to be effectively applied to the passenger flow assignment of urban rail transit networks. The complete passenger flow assignment includes three parts: effective path search, multi-path passenger flow assignment model and network loading. This paper reviews the above three aspects by analyzing the related achievements.
2.1. Effective Path Search
In order to obtain an effective path set, it is necessary to search for the shortest path or k-shortest paths according to the point–arc connection relationship of the network. In the shortest path search algorithm of urban rail transit networks, algorithms based on Dijkstra’s algorithm [5] and Floyd’s algorithm [6] have been formed. As one of the most well-known shortest path search algorithms, Dijkstra’s algorithm has been improved by using heuristics to speed up computation while preserving the optimality [7,8]. The Floyd–Warshall algorithm is drastically augmented by reducing the path combinations examined [9]. Yin [10] proposed a k-shortest path searching algorithm based on Floyd’s algorithm, which has been applied to the Beijing urban rail network and validated. The time complexity of an algorithm for searching for effective paths of all-pairs has made great strides since the seventies [11,12], in which an -time algorithm is proposed to describe the problem. From the perspective of geometry of transportation networks, Aldous [13] discussed numerically a general model where the network minimizes the average time between all pairs of points and proposed a scaling form for the average time. Based on complex network theory, Jia [14] developed a model based on betweenness to improve the public transportation network’s sustainability, which is also of great importance when we try to analyze the topological structure of an urban rail network.
2.2. Multi-Path Passenger Flow Assignment Model
Presently, multi-path stochastic probability assignment models are mainly based on stochastic utility theory, which studies the factors of a passenger’s path selection. Through the evaluation of a passenger’s decision-making utility for path selection, the non-aggregate model is established to calculate the probability of each path selection for passenger flow assignment. Cascetta [15] originally summarized passengers’ choice of path plans as a utility decision-making model. According to the distribution type of random residuals, the stochastic probability distribution model mainly forms two distribution modes: Probit and Logit. By introducing the commonality factor [16], the C-Logit model is proposed to overcome the disadvantage of the classical Logit, i.e., unexpected selection probability for paths sharing links. When paths are explicitly enumerated using a k-shortest path model, the computational results of C-Logit show better performance than that of the implicit stochastic user equilibrium (SUE) assignment, which retains the characteristics of simplicity, good applicability and explicability [17,18]. Hu and Li [19] proposed a Logit-based model improved by using relative cost difference to allocate the incremental passenger flow of urban rail networks. As shown by Li [20], a model for distributing cooperation profits among operators of urban rail transit under public-private partnership (PPP) pattern is developed by considering comprehensive travel impedance and proportion of different service types provided by operators, which has the form of the Logit model. However, the above models have certain limitations in real-time passenger flow assignment, and less consideration is given to the influence of train capacity limitation on it.
2.3. Network Loading
With the popularity of computer simulation methods, the passenger flow distribution model relying on the simulation method has a greater advantage than the analytical model. Tong [21] developed a dynamic transit assignment model considering in-vehicle time, waiting time, walking time and a time penalty for each line change, and a Monte Carlo approach is adopted to solve the problem, in which numerical simulation was applied earlier to the passenger flow distribution process. Hassannayebi [22] proposed a two-stage genetic algorithm based simulation approach to minimize the passenger waiting times, which provides a reference for the construction of the simulation model framework of passenger behavior. Liu [23] proposed an improved Dial’s algorithm based on random network assignment to solve the urban railway flow assignment model considering the passenger classification.
Based on the practical needs of urban rail transit operation organization, many researches on passenger flow assignment have been used to guide operation and planning. Seeking an efficient passenger flow assignment method that can adapt to the large-scale urban rail network, this paper simulates the decision-making process of a passenger’s choice of path and dynamic passenger journey to reproduce the passenger flow distribution as truly as possible. The main contribution of this research is that we have made some improvements in the above three aspects and the method can be effectively applied in the urban rail transit system, and incidentally, it has been put into use in Guangzhou Metro for passenger flow analysis and train planning. Compared to the current studies, the following three contributions are provided in the paper:
(1) Combined with the application of an efficient data structure, the characteristics of line connection in the urban rail network are used to propose a novel effective path set search method, thereby reducing the computational complexity compared with the algorithm proposed by Chan [11].
(2) Under the research status of Logit-based models, the C-Logit model has been improved while retaining the original applicability and explicability, which gives more realistic results of the stochastic probability assignment than the models proposed before.
(3) A practical passenger flow pushing assignment method, which simulates the process of passenger travel, has been proposed according to the urban rail passenger flow propagation law. Compared with the time-slice search strategy [24], where passenger flow in each path and section is calculated period by period, this method is more efficient and precise.
The rest of this paper has been organized as follows. The problem of passenger flow pushing assignment in an urban rail network is analyzed in Section 3, and based on hierarchical path structure, an effective path searching strategy is designed in Section 4. Then, a multi-path passenger flow assignment model, i.e., Improved C-Logit, is developed after the evolution of classic Multi-Nominal Logit in Section 5. Moreover, a passenger flow pushing assignment algorithm based on line decomposition is described in Section 6. Finally, the Line 1 of Guangzhou Metro is used as a case for a numerical experiment in Section 7 and conclusions are summarized in Section 8.
3. Analysis of Passenger Flow Pushing in Urban Rail Network
3.1. Notations
The physical topological network of urban rail transit is defined as , and all the relevant notations involved in the paper are listed in Table 1.
3.2. Problem Analysis
The passenger flow of urban rail transit, which is the service object of the train operation plan and train diagram, has obvious characteristics of aggregation, dispersion and time-varying. Owing to the strong fluctuation of urban rail transit travel demand throughout the day, the daily passenger flow from station to station is usually , , which needs to be further refined according to the time periods. The operation time span of urban rail transit is divided into periods with relatively stable passenger flow by a step function. In each period, passenger demand can be regarded as a uniform distribution of equal intensity, which is called the passenger travel time period. The set of all-day passenger travel time periods can be expressed as , where . Each passenger travel time period corresponds to an O-D demand matrix , . It can be assumed that the passenger flow demand of each O-D pair in each passenger travel time period is uniformly distributed with equal intensity. The passenger flow from station to in the passenger travel time period is , .
The piecewise step function is a discontinuous approximate expression of the full-day time-varying passenger flow fluctuation. The coincidence between the step function of the passenger flow distribution and the time-varying curve of the passenger flow is related to its time span, which can shorten the length of the period to improve the precision of description. However, with the gradual refinement of time divisions, too small time divisions will greatly increase the amount of data, and passenger demand needs to be described by a large number of data. Therefore, as long as the running frequency of trains corresponding to the average passenger flow during the passenger travel time period also meets the peak and valley extrema of the passenger flow in that period, the accuracy can be considered to meet the requirements.
The set of effective paths between the O-D pair of the urban rail network is , and the path can be chosen for traveling. For an effective path , the sets of key stations and lines are and , respectively, where is the number of transfer times, and the transfer line is indicated by , . Thus the path can be expressed as , which consists of four parts: starting station, transfer stations, terminal stations and station sequence of ride sections. is the passenger ride section on the line . That is, is the starting station or transfer station, is the transfer station or the terminal station, and are transfer stations. Among them, are station codes on different lines of the same physical transfer station, and .
4. Hierarchical Searching Strategy of Effective Path
The path between an O-D pair in an urban rail network contains various kinds of cost information, such as travel time, transfer time, waiting time, etc. For any O-D pair , there may be multiple connected paths, and for some of them, no matter whether there is congestion or not on the network , passengers will not use them. Therefore, only some reasonable paths selected by users can be used for the passenger flow assignment, which are called effective paths, that is, the proportion of effective paths chosen is obviously greater than 0. Intuitively, the effective path usually satisfies the following two conditions: firstly, in actual travel, passengers will not transfer from one line to another and then to the previous line; secondly, passengers will not transfer twice at the same station (a transfer station is expressed as two stations with different codes), that is, there will be no loop path.
Corresponding to the urban rail network , any O-D pair between the path is effective, and the above two conditions are expressed as:
- (1)
- The passenger ride section belonging to the same line cannot appear intermittently, ;
- (2)
- For , we have , .
There are three commonly used effective path search algorithms [25,26], namely, Dial’s algorithm, k-shortest path search method and graph-based traversal method, but the above methods all take the station as the vertex. However, in the passenger flow assignment problem, the path searching algorithm is called frequently. If the urban rail network composed of stations is used for effective path searching directly, the huge network scale will increase the calculation load of the path search. Thus, this paper uses three-layer hierarchical topological structures to search paths, which can significantly reduce the difficulty of searching in a large-scale network. The first layer is the line network, on which the path is mainly searched between the interconnected lines; the second layer is the key station network, which consists of O-D pairs and transfer stations, and the path searching in this layer is based on the results of the first layer; and by supplementing other stations between key stations, the third layer extends the key station path to the complete station path section-by-section.
Based on the traditional graph traversal method, combined with the transfer characteristics of the urban rail network, the passenger path formation process is divided into three layers: line path, key station path composed of the O-D pair and transfer stations, and complete path composed of station sequence. A generation strategy for the effective path set based on hierarchical path-searching is proposed. Considering each line as a vertex, the undirected graph with vertices is constructed, and the line adjacency matrix is defined, where
For any O-D pair , the specific idea is to obtain the lines of station and station , i.e., and , and the two lines are mutually reachable if they connect each other. Similarly, depth or breadth traversal is used to search paths. Because there are much fewer lines than stations, the traversal efficiency of a line graph is much higher than that of a station graph. The line path is not unique for a large network, so the line path set of the line combination can be defined as , where and . Based on the searched path , the transfer stations of two adjacent lines are solved sequentially. The vertex set of lines in the undirected graph is transformed into the path set of key stations in the network , including the start station, terminal station and transfer stations. Finally, the complete path between the O-D pair can be obtained by making up the sequence of stations between the two adjacent stations of each key-station path.
Especially, as for the query efficiency of line path set , it is stored using an efficient data structure. A hash table is a data structure accessed directly according to the form of key and value, whose time complexity of query speed is , and it is more efficient than using an ordinary set to traverse a query where at least of the time would be cost. In this paper, the is set with line index as the key and as the value. Its mapping relationship is , and the adding method is defined as .
The recursive divide-and-conquer method is used to search the line path of the undirected graph in depth. The input parameters are the line path set , current line path , current line and terminal line . The line path search algorithm is designed as Algorithm 1.
| Algorithm 1 |
| 1: Begin |
| 2: Let vector ; |
| 3: Begin 1 |
| 4: For |
| 5: Begin 2 |
| 6: If and , then and ; |
| 7: Else if |
| 8: If |
| 9: If , then and ; |
| Else |
| 10: If , then , and call the algorithm ; |
| 11: Return 2 |
| 12: Return 1 |
| 13: End |
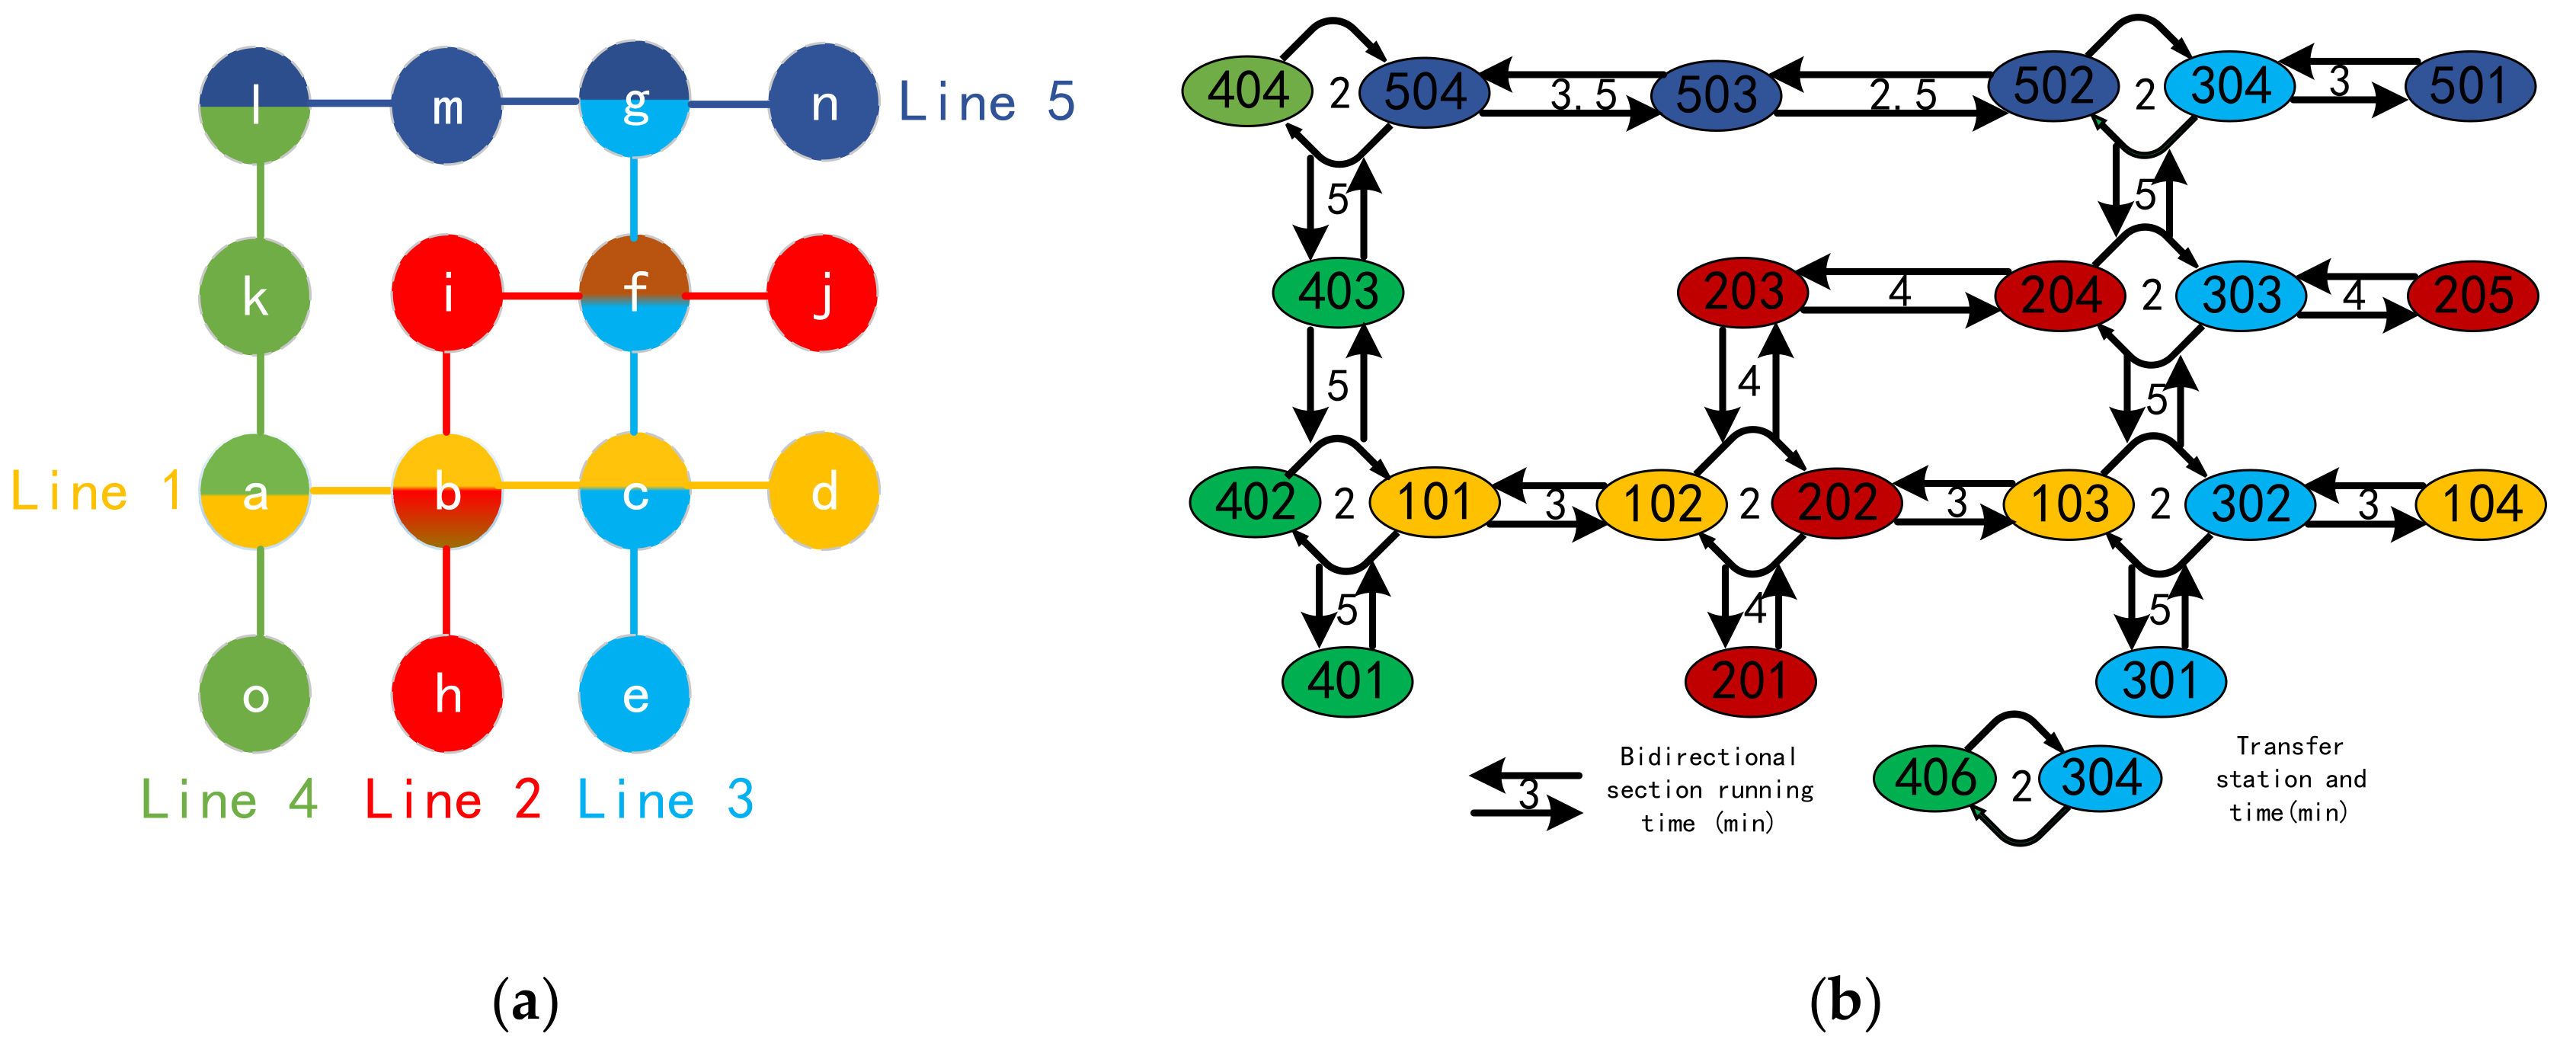
The following is a simple example of the hierarchical path of the urban rail network, as shown in Figure 1. Figure 1a is the physical topological structure, with station set , line set , and transfer station set . As the transfer station connects at least two lines, in order to better distinguish the ownership of the transfer station, the uniqueness of each station is represented by a station code which contains information of the line and station sequence, that is, the transfer station has at least two codes. The physical topology is extended to the network structure of train operation and transfer as in Figure 1b. Without loss of generality, let be a sequence path of stations from to . Then is its key station path, and is the line path.
For any O-D pair on the network, Algorithm 1 is called to generate the line paths and gradually refine them into key station paths and sequence paths of stations according to the relationship between transfer stations. According to the hierarchical search idea, the corresponding effective path search algorithm is designed as Algorithm 2.
| Algorithm 2 Hierarchical Effective Path Search Algorithms for Networks. |
| 1: Input: Network graph , line adjacency matrix , absolute threshold , relative threshold ; |
| 2: Output: Effective path set of all O-D pairs in the network graph, . |
| 3: Begin |
| 4: is defined to generate the line path; |
| 5: Begin 1 |
| 6: For , |
| 7: For , |
| 8: Initialize ,, and call the algorithm to search the path in depth; |
| 9: Add the generated to the hash table, ; |
| 10: Return 1 |
| 11: Begin 2 |
| 12: For , |
| 13: For z, |
| 14: pair corresponding to lines and line paths can be obtained from mapping relation; |
| 15: For the line path , combined with the network , the adjacency relationship between transfer stations can be transformed into a set of key stations , where and ; |
| 16: Make up the station sequence between two key stations in to obtain the complete path , ; |
| 17: Find the shortest path in , whose minimum cost is , and compare the cost of with , if , then . |
| 18: Return 2 |
| 19: End |
Algorithm 1 is the core of Algorithm 2. In the worst case, the computational time complexity satisfies the following recursive equation:
Equation (2) is the recursive relationship satisfied by the time complexity of the divide-and-conquer method. If there is an extreme case in Algorithm 1, such that the connecting line is not the target line at each step, the upper bound of the time complexity obtained by solving this recursive equation is . Meanwhile, in consideration of the connectivity of the network, that is, the vector , so actually . Since the general urban rail network has , the path search efficiency of Algorithm 1 is much higher than that of other path search algorithms. By controlling the parameters and of Algorithm 2, roundabout or bypass paths can be effectively excluded. Based on [19] and a large number of experiments in the Guangzhou Metro network, and .
5. Multi-Path Passenger Flow Assignment Model Based on Improved C-Logit
5.1. Generalized Travel Cost of Passenger Flow
All multi-path passenger flow assignment models are actually based on stochastic or deterministic cost theory [11]. We should define the attributes in the cost function of the system and the random residual in the probability distribution function when describing a model. The perceived cost of an effective path of the O-D pair is Equation (3):
where is the observation or system generalized cost of path , and is the random residual of passengers who choose path . In the multi-path passenger flow assignment model, there are many factors influencing the generalized travel cost [27]. Under the “one-ticket” mode, we mainly focus on the mathematical combination of four measurable attributes: waiting time , running time , transfer walking time and number of transfers , as in Equation (4):
1) is the waiting time after passengers arrive at the platform from the gate or transfer passage, which is proportional to the train operating interval, that is, the shorter the operating interval, the shorter the waiting time for passengers. The results of [28] show that the waiting time on each line is a random variable and is evenly distributed in . Therefore, the mathematical expectation of the average waiting time of passengers is as shown in Equation (5):
where is the headway of the line .
2) is composed of the train running time and stopping time of each ride section of the effective path , and it is a system attribute that is generally obtained by traction calculation or time standards of the train diagram, as shown in Equation (6):
3) is the transfer walking time for passengers to get to the platform for boarding on another line from the platform for alighting through the transfer passage. Usually, the transfer walking time of a transfer station is determined by the distance of the transfer passage and the average walking speed, and it can also be determined by actual measurements, as shown in Equation (7):
where is the set of all transfer stations which the effective path contains. The transfer station has two codes.
4) The number of transfers is an important measure for passengers in considering whether to adopt an effective path. Transfers would consume passengers’ physical strength and patience. Each increase in the number of transfers will significantly increase the marginal transfer cost for the path in a passenger’s mind, thereby amplifying the actual measured walking time . Therefore, the transfer time should be corrected as shown in Equation (8):
where is the number of transfers, and is the correction parameter, which can be obtained by statistical analysis of SP survey data.
In summary, the generalized travel cost of the path between the O-D pair is as shown in Equation (9):
5.2. Improved C-Logit Multi-Path Passenger Flow Assignment Model
The basic assumptions of the generation model of path selection sets are related to passengers’ familiarity with the urban rail network, and the evaluation criteria that the generated paths can be regarded as viable alternative paths. That is to say, SUE traffic assignment assumes that there is a deviation between passengers’ perceived travel costs and actual costs, and there is a preference for generalized travel cost assessment criteria, so there are differences in path selection.
In this case, the perceived cost of the path between the O-D pair can be expressed as the sum of the generalized travel cost and a random residual , such as Equation (3). Assuming that the cost random residuals of each utility function are independent random variables with Gumbel distribution, the classical polynomial Logit model can be derived according to the principle of minimizing cost. Its probability selection formula is as shown in Equation (10):
In deriving the Logit model, it is assumed that the cost random residual of each path is independent, consequently leading to the property of independence of irrelevant alternatives (IIA). In fact, this assumption is divorced from reality in some cases. The choice probability in the above formula is determined by the absolute difference of generalized travel costs, which may lead to absurd results. Among them, the “independence” hypothesis results in “red bus/blue bus” errors [29], which means that in view of the situation of this paper, the probabilities of alternative effective paths sharing many sections are calculated separately without considering the relationship between the overlapping parts and thereby are theoretically unacceptable. Additionally, the “identical distribution” hypothesis is the root of the errors that lead to the same probability of selection between long and short paths. Liu et al. [30] proposes to improve the Logit model by calculating the probability of path selection with the relative cost difference, as in Equation (11):
where . Equation (11) obtains a more realistic result on the selection probability between long and short paths, but it still fails to solve the problem of overestimating the selection scheme with great similarity. According to the property of IIA, a C-Logit model is proposed in [10], which retains the original concise analytical form, as in Equation (12):
where and are commonality factors, indicating the similarity between path and other paths in . Among the various common factor expressions, the numerical results and fitting degree of the following formula are better, as in Equation (13):
where is the overlap length between the paths and between the O-D pair , and and are the lengths of the paths and , respectively; and and are undetermined parameters. In this paper, we assume that and . The attribute of is the inverse measure of the degree of independence of path . In fact, if all ride sections do not belong to other paths, ; the larger the is, the more other paths share the sections with path . Generally speaking, the C-Logit model reduces the probability of paths with more overlap and increases the probability of independent paths. When the paths in do not overlap each other, the model degenerates into classical Logit. Therefore, this paper combines the Logit model with the relative generalized cost proposed by [30] with the C-Logit model, and proposes an improved C-Logit multi-path passenger flow assignment model, as in Equation (14):
where .
The actual effect of each model is illustrated by the simple urban rail network as shown in Figure 1. By [31], let = 1.8481 and = 1.8660. In time period , let the headway of each line , and the station stopping time . Considering the O-D pair , the path set on the network contains three paths, where with once transfer, with twice transfers, with once transfer, and overlaps half of the length with . The generalized travel costs of each path are , and ; and the commonality factors are and . The classical polynomial Logit model, the improved Logit model, the C-Logit model and the improved C-Logit model are used to calculate the selection probabilities of the paths in the set , as shown in Table 2.
It can be seen that the selection probabilities of different models for are quite different. The results of classical Logit and C-Logit calculation are close to 0. It is too early to estimate the situation that is an effective path that no one chooses, which is inconsistent with the assumption of an effective path, so the results of the above two models are unacceptable. Relatively speaking, the results of Improved Logit and Improved C-Logit are more convincing. Since the Improved Logit model still depends on the “independence” assumption, that is, the “red and blue bus” error still exists, the results are totally the same when assigning the selection probabilities of and . Actually, the path and can be considered as a whole and have certain substitutability since they overlap each other. So the probability of equals while probability of and is , which shows that the roughly equal results of the two are due to the identical minimum generalized travel costs of and . Furthermore, the probabilities of and continue to be assigned under the sum of and the results are 0.3771 and 0.1221, respectively. In summary, after overcoming the property of IIA, the Improved C-Logit model proposed in this paper takes the path overlap into account and calculates with the relative generalized cost, and the allocation ratios are relatively more reasonable.
6. Passenger Flow Pushing Assignment Algorithm Based on Line Decomposition
6.1. General Thoughts of Network Passenger Flow Pushing Assignment
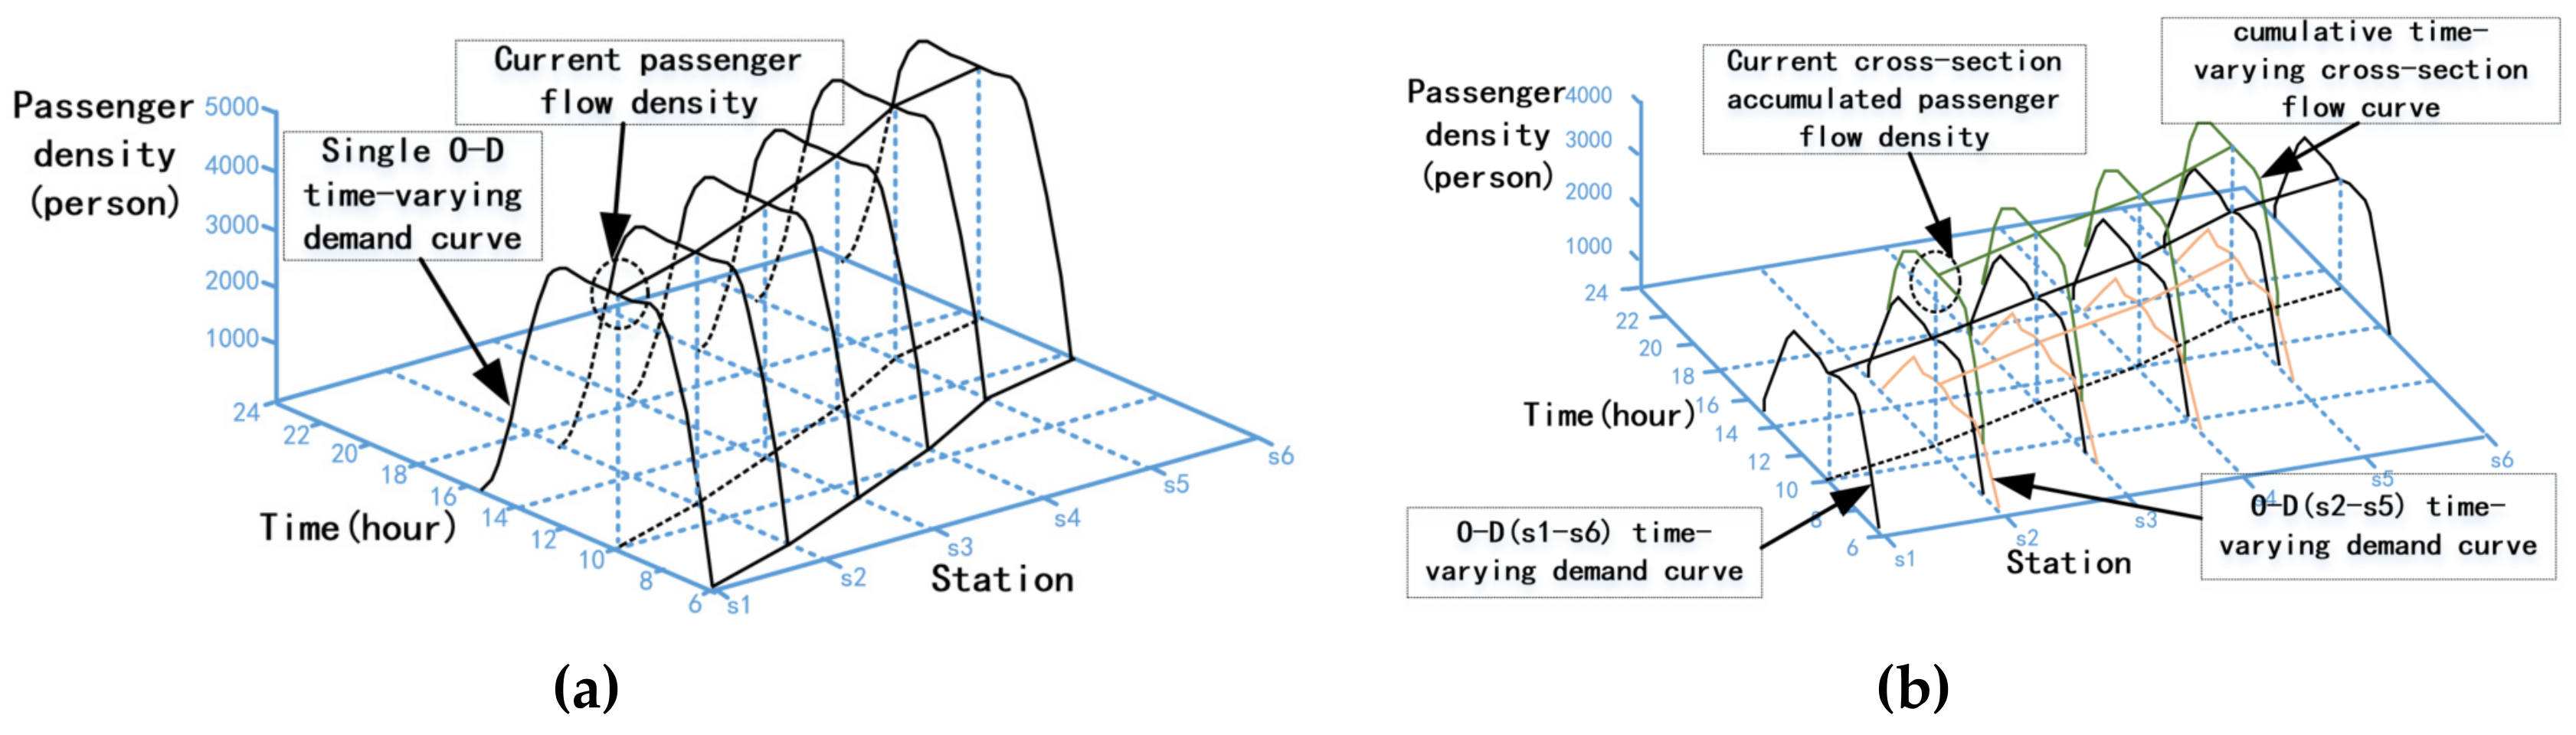
Passenger pushing assignment can be divided into cross-line and local-line passenger flow pushing assignment, depending on whether the time-varying O-D passenger flow has to transfer. The effective path is decomposed into the passenger ride sections according to the key station path composed of O-D pairs and transfer stations. The passenger flow pushing assignment must conform to the rule that the continuous time-varying demands of each O-D are pushed by sections with time. The is pushed forward to the destination from the origin at the average travel speed of the line to obtain the continuous time-varying demand intensity at each section.
Figure 2 is an illustration of the principle of passenger flow pushing. Figure 2a is a 3D cross-section flow distribution of a single O-D pair pushed from the origin S1 to the destination S6. Pushing multiple time-varying O-D flows on the network will accumulate in overlap sections. The distribution of passenger flow on the network is actually the result of mutual accumulation after each time-varying O-D pushing. Figure 2b shows the cumulative 3D cross-section flow distribution of two O-D pairs pushed between sections S1 to S6 and S2 to S5, with the cumulative part from S2 to S5.
Passenger flow assignment should be based on the dynamic riding process for each O-D flow and the flow accumulation of different O-D passengers. The general idea of the algorithm is as follows: By decomposing the passenger ride path into the passenger ride sections of each line according to the key stations, the passenger flow that selects the path is loaded period-by-period and pushed to the terminal at the travel speed of each passenger ride section. Thus, the exact time of passengers arriving at each station is calculated, and the passenger travel time period is transformed into the passenger flow pushing time period, and then the boarding flow, alighting flow and cross-section flow at each section of each line in each period can be obtained. For local-line passengers who do not need to transfer, each line can be pushed independently from the starting station to the terminal station according to the sequence of passenger travel time periods. For cross-line passenger flow, each O-D pair needs to be pushed to the actual time period of the transfer node along each path in the effective path set , and the passenger flow demand is decomposed into the corresponding lines of each passenger ride section according to the path direction. Local-line passenger flow pushing is the basis of cross-line passenger flow pushing.
6.2. Local-Line Passenger Flow Pushing Assignment Algorithm
According to the condition of determining the effective path, which is proposed in Section 4, there is only one ride path for local-line passenger flow, that is, the proportion of passengers traveling by local trains is 100%. The basic idea of the local-line passenger flow pushing assignment algorithm is that the time-varying passenger flow in the direction of line , where boarding station and alighting station , is pushed forward along the effective path at the average travel speed during the passenger travel time period . According to the spatio-temporal relationship of the train operation, the passenger flow push time period arriving at each station ahead is calculated. Next, the overlapping passenger flow travel time periods and and their time ratios and , which include the passenger flow push time period , and their time ratios to the period length , are calculated, where , , . Then the cross-section passenger flow increments and in the passenger flow travel time periods and are obtained and updated until the last section of the current line direction. In addition, the boarding passenger flow is updated at the starting station, consequently updating the alighting passenger flow and at the terminal station. The local-line passenger flow pushing assignment algorithm is as Algorithm 3.
| Algorithm 3 Local-line passenger flow pushing assignment. |
| 1: Input: Local-line time-varying O-D passenger demand , line and its stations , pure running time of section and stopping time of station on line ; |
| 2: Output: On passenger flow travel time period , two-way cross-section passenger flow , boarding passenger flow , alighting passenger flow , set of passenger flow in the ride section, where , , . |
| 3: Begin |
| 4: Set the two-way cross-section passenger flow , boarding passenger flow and alighting passenger flow of line to 0; |
| 5: For local-line passenger flow , make the current passenger push time period , calculating the ratios, which are and , of the overlapping period between passenger flow pushing time period and passenger flow travel time periods and , making the boarding station and . Therefore, the boarding passenger flow increment and the cross-section passenger flow increment are and , respectively. Update the boarding passenger flow and cross-section passenger flow ; |
| 6: Begin 1 |
| 7: By calculating the time deviation, which is , of passenger flow pushed to the station of the forward section, the passenger flow pushing time period of the direction of station is obtained to be ; |
8: Begin 2
|
| 9: Return 2 |
| 10: If is the alighting station, i.e., , then the increments of alighting passenger flow of and in the direction of station are and , respectively, and the alighting passenger flows and are updated and break; |
| 11: Otherwise, the increments of the cross-section passenger flow corresponding to section in the direction are and , respectively, and the cross-section passenger flows and are updated, making the current passenger flow pushing time period , and , and keep running; |
| 12: Return 1 |
| 13: ; |
| 14: End |
6.3. Cross-Line Passenger Flow Pushing Assignment Algorithm
For cross-line time-varying O-D passenger flow pushing assignment, it needs to be assigned one-by-one according to the selection ratio of each path in the effective path set . The basic idea of the cross-line passenger flow pushing assignment algorithm is to decompose the cross-line time-varying passenger flow along the effective path into the corresponding passenger ride sections of the line according to the key station path composed of the O-D pair and transfer stations. The cross-line passenger flow is regarded as the local-line passenger flow to be pushed in each passenger ride section. Based on the transfer time periods, the local-line passenger flow pushing assignment algorithm is called in each passenger ride section until the destination. In the process of pushing, it is important to consider the travel time period of cross-line passenger flow, the transfer time period of each transfer station and the description of transfer flow characteristics, including the transfer-out line , the transfer-in line , the transfer-out station , the transfer-in station , the transfer-out direction , and the transfer-in direction . The cross-line passenger flow pushing assignment algorithm is as Algorithm 4.
| Algorithm 4 Local-line passenger flow pushing assignment. |
| 1: Input: Cross-line time-varying O-D passenger demand , effective path set , line and its stations , pure running time of section and stopping time of station on line , headway ; |
| 2: Output: On passenger flow travel time period , two-way cross-section passenger flow , boarding passenger flow , alighting passenger flow , transfer passenger flow , set of passenger flow in the ride section, where , , . |
| 3: Begin |
| 4: Set the two-way cross-section passenger flow , boarding passenger flow , alighting passenger flow and transfer passenger flow of line to 0; |
| 5: Begin 1 |
| 6: The passenger flow is calculated according to the ratio of the effective path selected by the cross-line passenger flow , and the passenger flows of ride sections are calculated by traversing them, setting and current passenger flow pushing time period ; |
7: Begin 2
|
| 8: ; |
| 9: ; |
| 10: Return 2 |
| 11: Return 1 |
| 12: End |
The essence of cross-line passenger flow pushing assignment is that by decomposing the travel path of passenger flow according to the key station path into journey sections, the cross-line passenger flow with identical O-D is sequentially pushed forward along each journey section. Moreover, the time of passenger flow arriving at the terminal of the journey section can be calculated accurately based on the spatio-temporal pushing relationship and the average train running speed. This loading method simulates the process of passenger flow travel and has good adaptability to the passenger demand in the form of period, which is generally collected by the urban rail operator from AFC. Compared with the time-slice search strategy used in current study [31], this method is more efficient and precise.
7. Case Study
According to the proposed improved C-Logit multi-path passenger flow assignment model, taking the actual network of Guangzhou Metro in 2019 as an example, the O-D effective paths and their selection ratios among 257 stations of 14 lines in the whole network are calculated; the daily average time-varying O-D passenger flow data from the AFC system on workdays of a week in 2019 are extracted, and the time-varying passenger flow is loaded onto the network dynamically using the proposed passenger flow pushing assignment algorithm. The model and algorithm in this paper have been embedded in the Automatic Generation Module of Train Operation plan of “Guangzhou Metro Network Train Diagram Simulating & Checking System” through the Asp.Net Web development framework. It also provides basic data support for Guangzhou Metro operation and management, such as passenger flow analysis, peak period judgment, train route mode (i.e., long-short route, express/slow train operation mode, Y-type route, etc.) scheme selection, transfer plan optimization and train operation plan formulation.
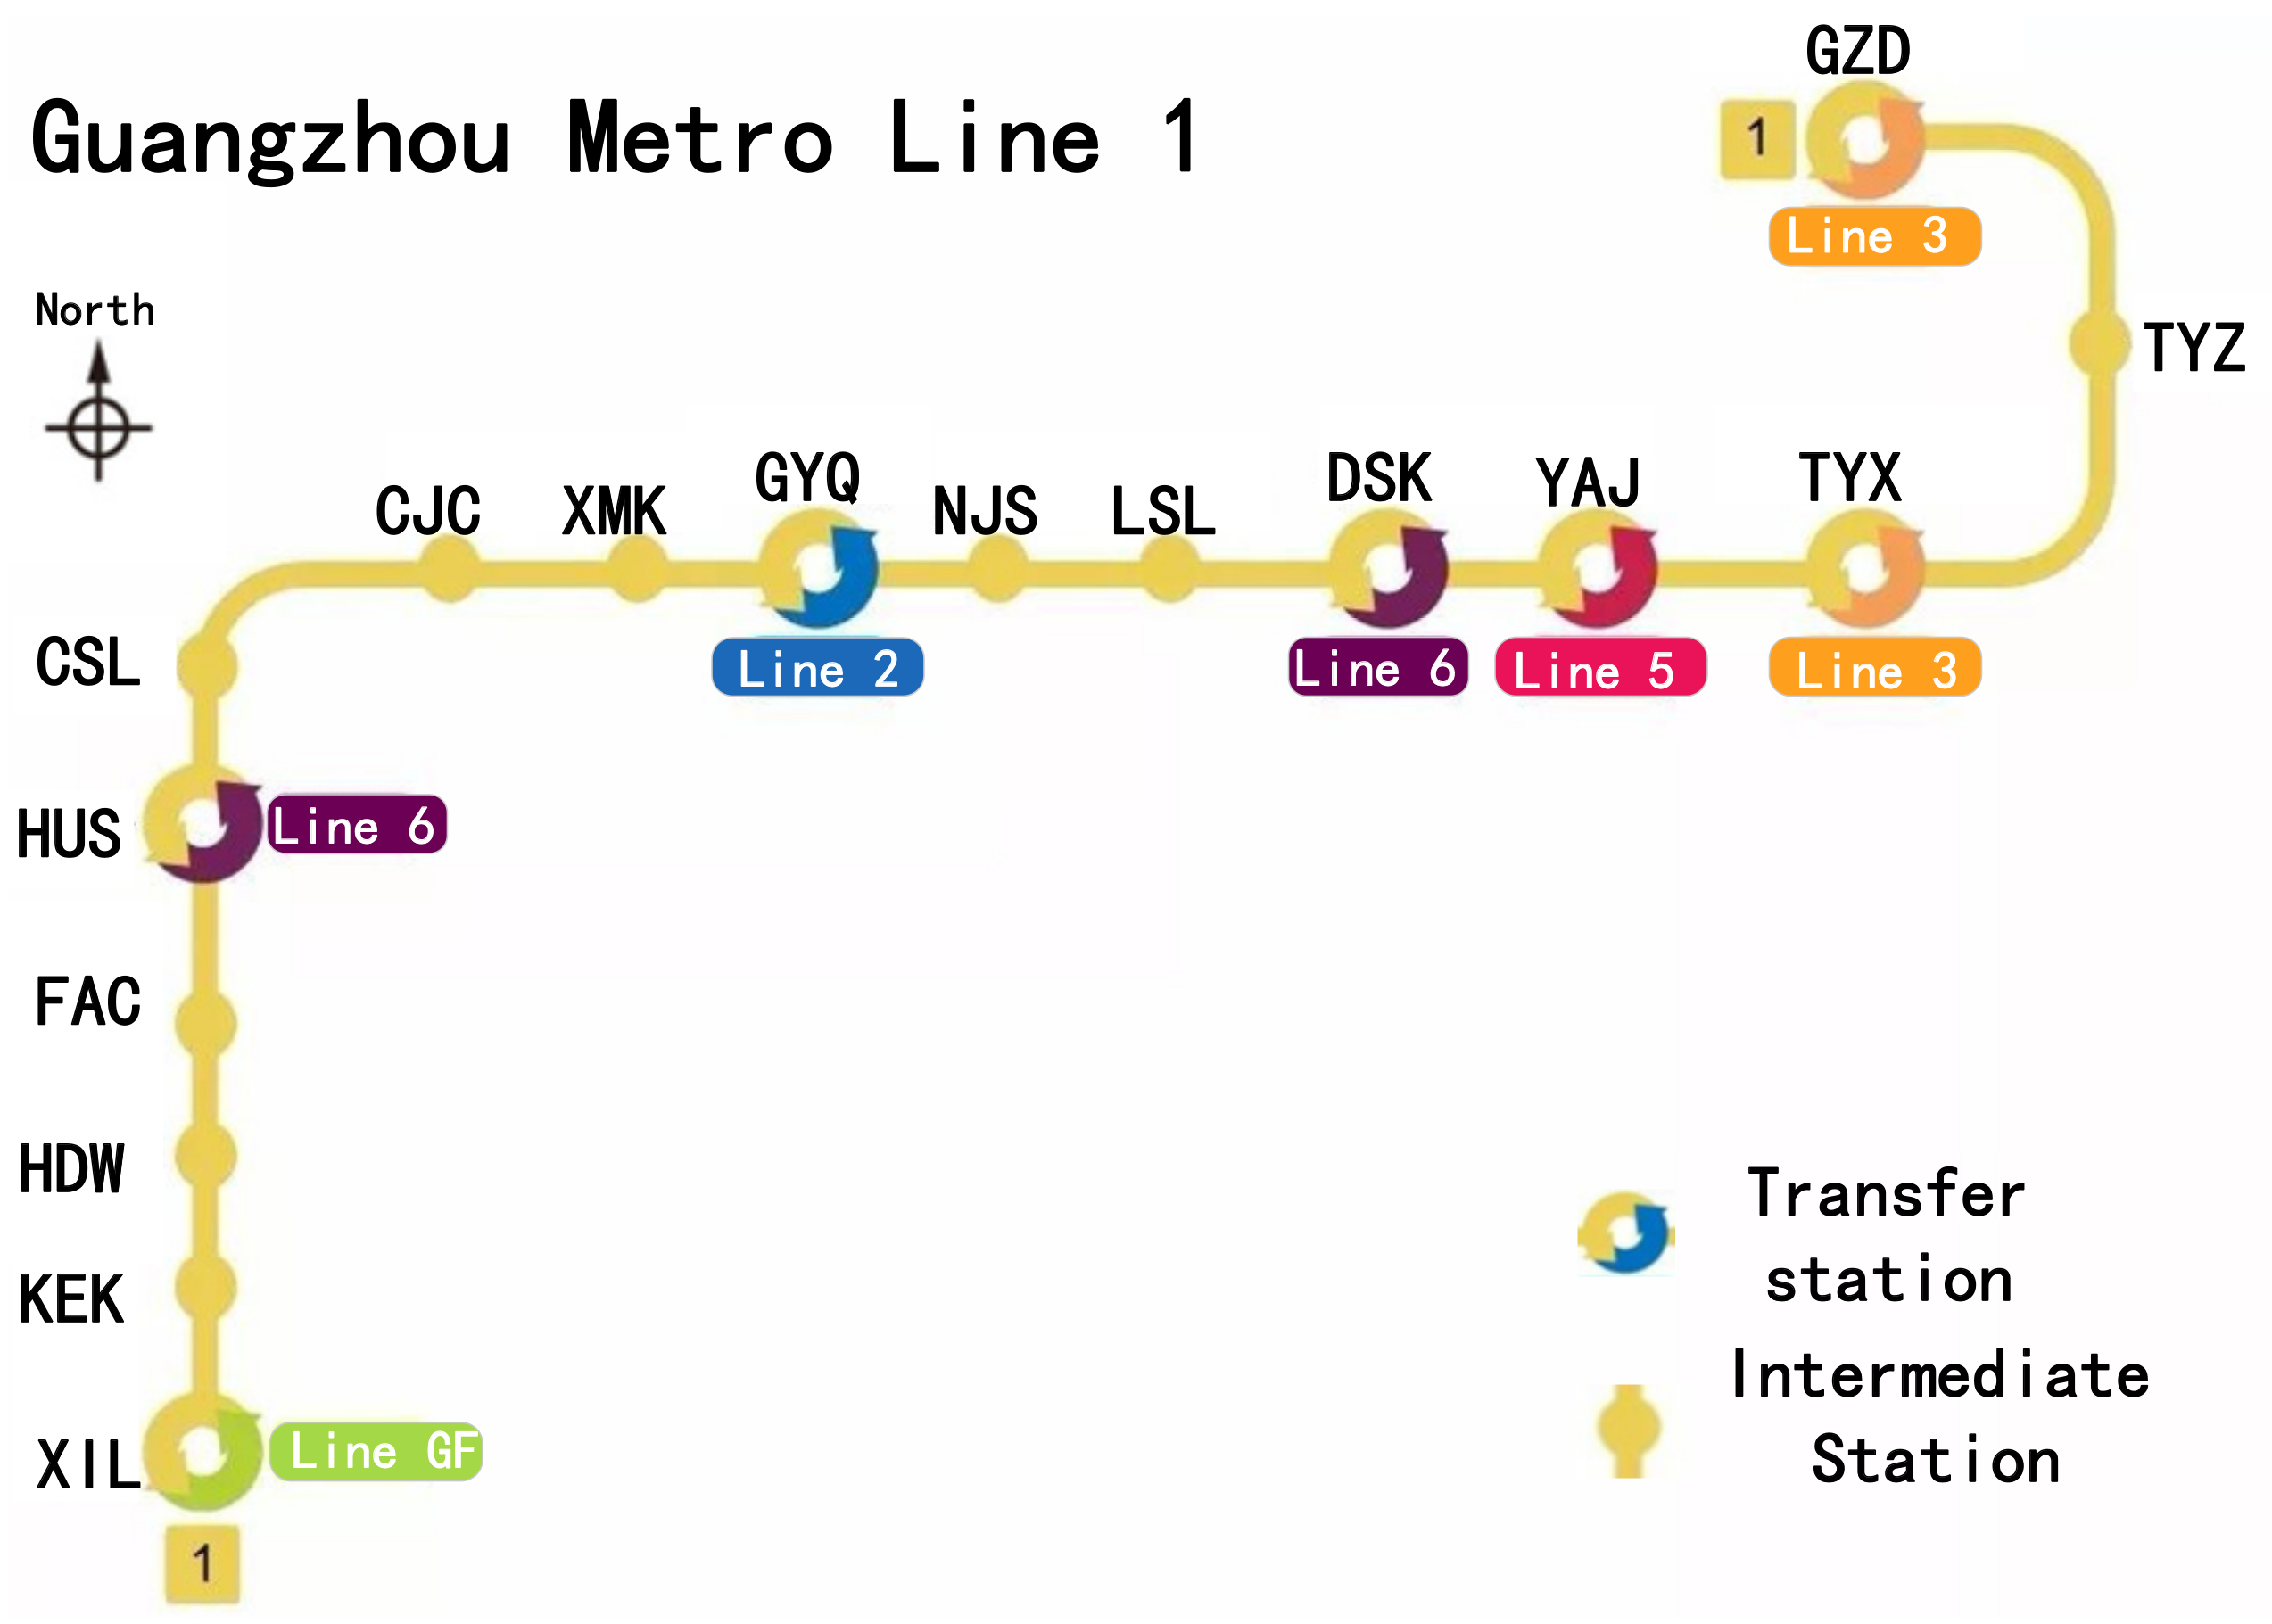
This paper takes Line 1, which is the earliest built line with relatively stable spatio-temporal distribution of passenger flow in the Guangzhou Metro network, as an example to analyze the results of passenger flow pushing assignment. The codes of the stations are marked in black, as shown in Figure 3.
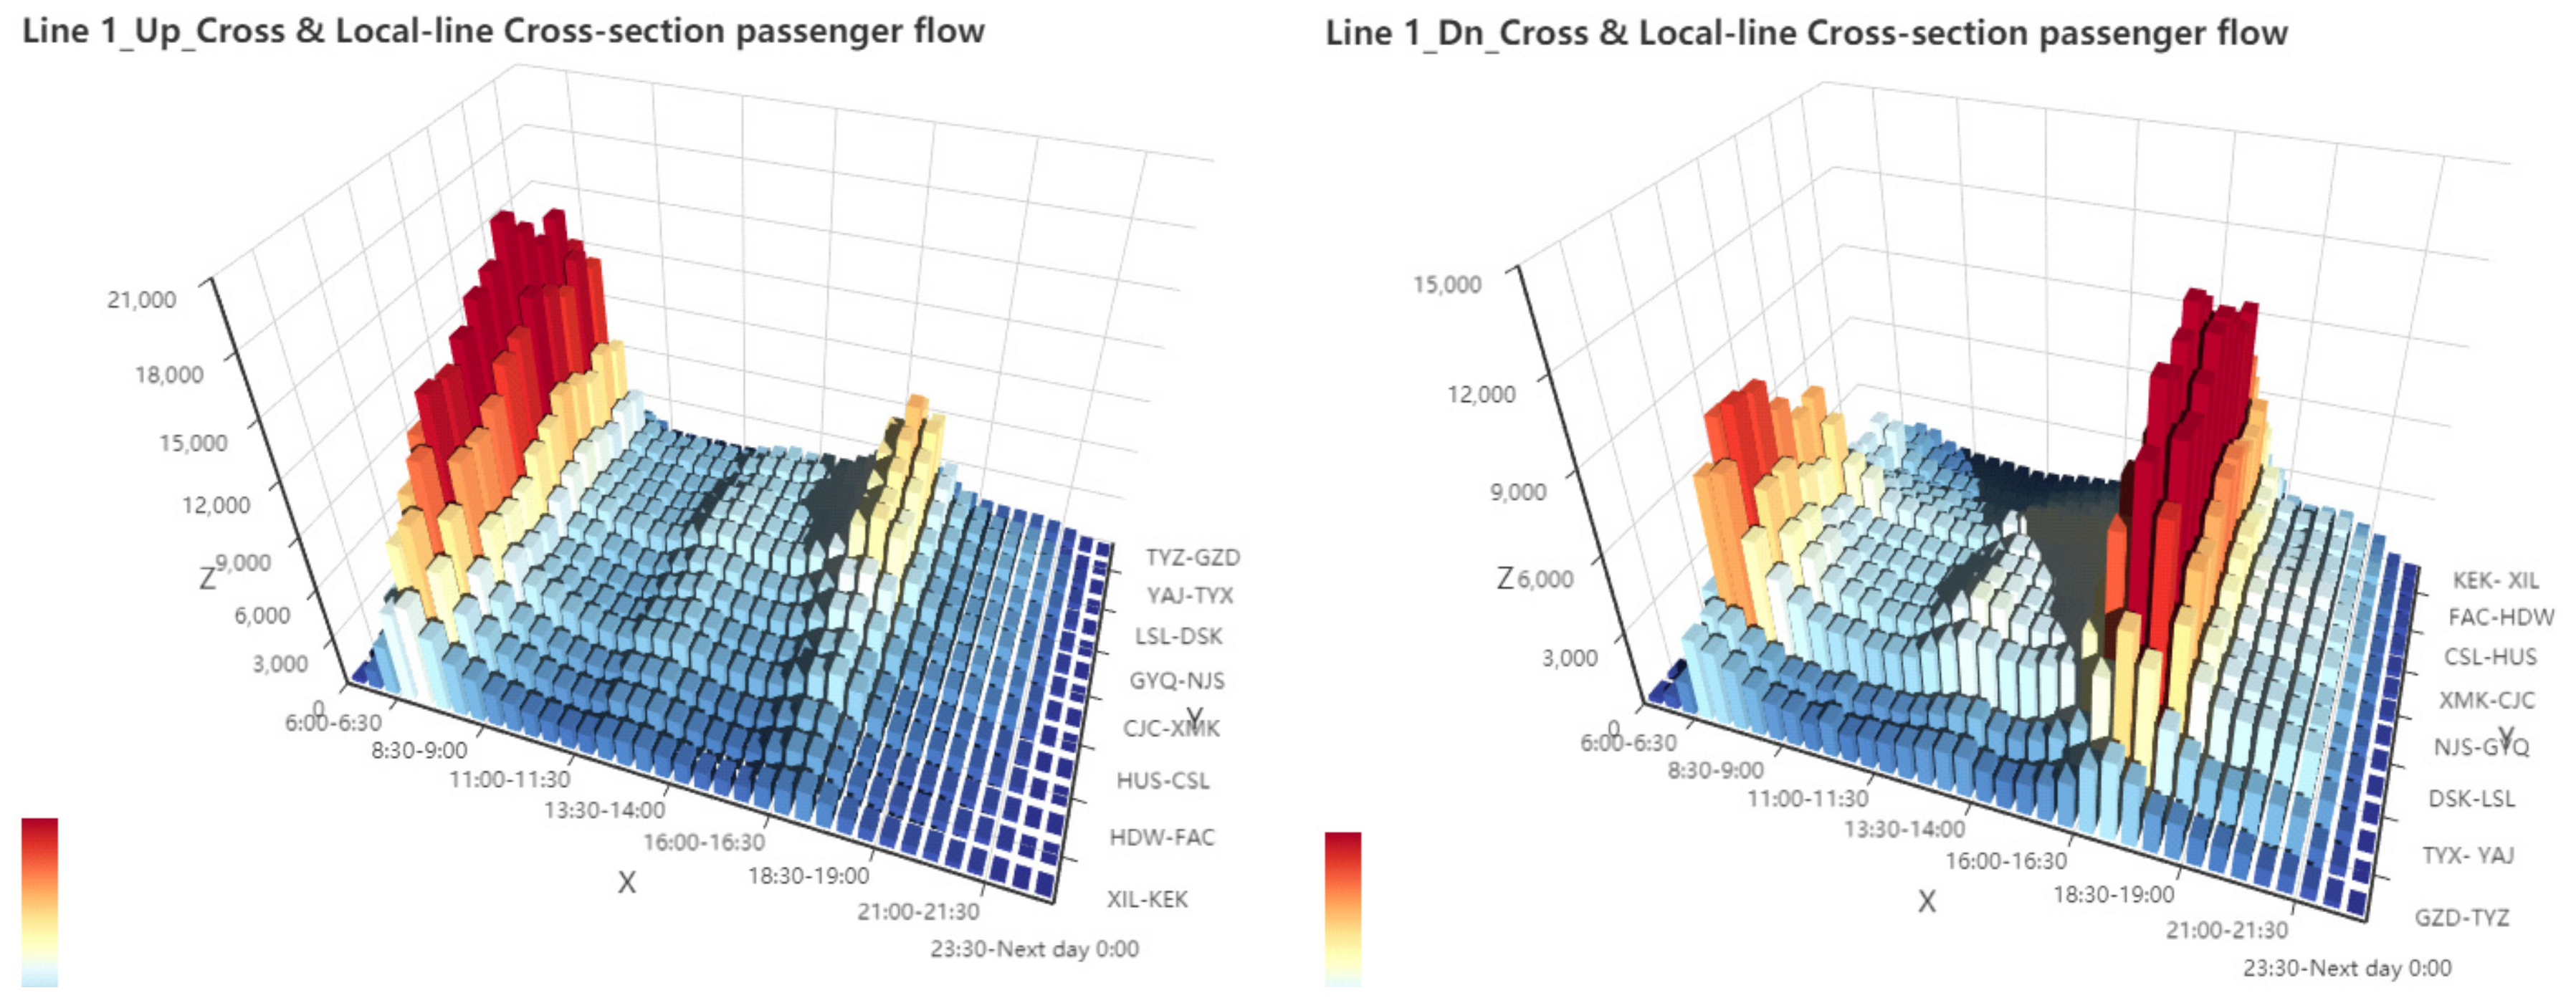
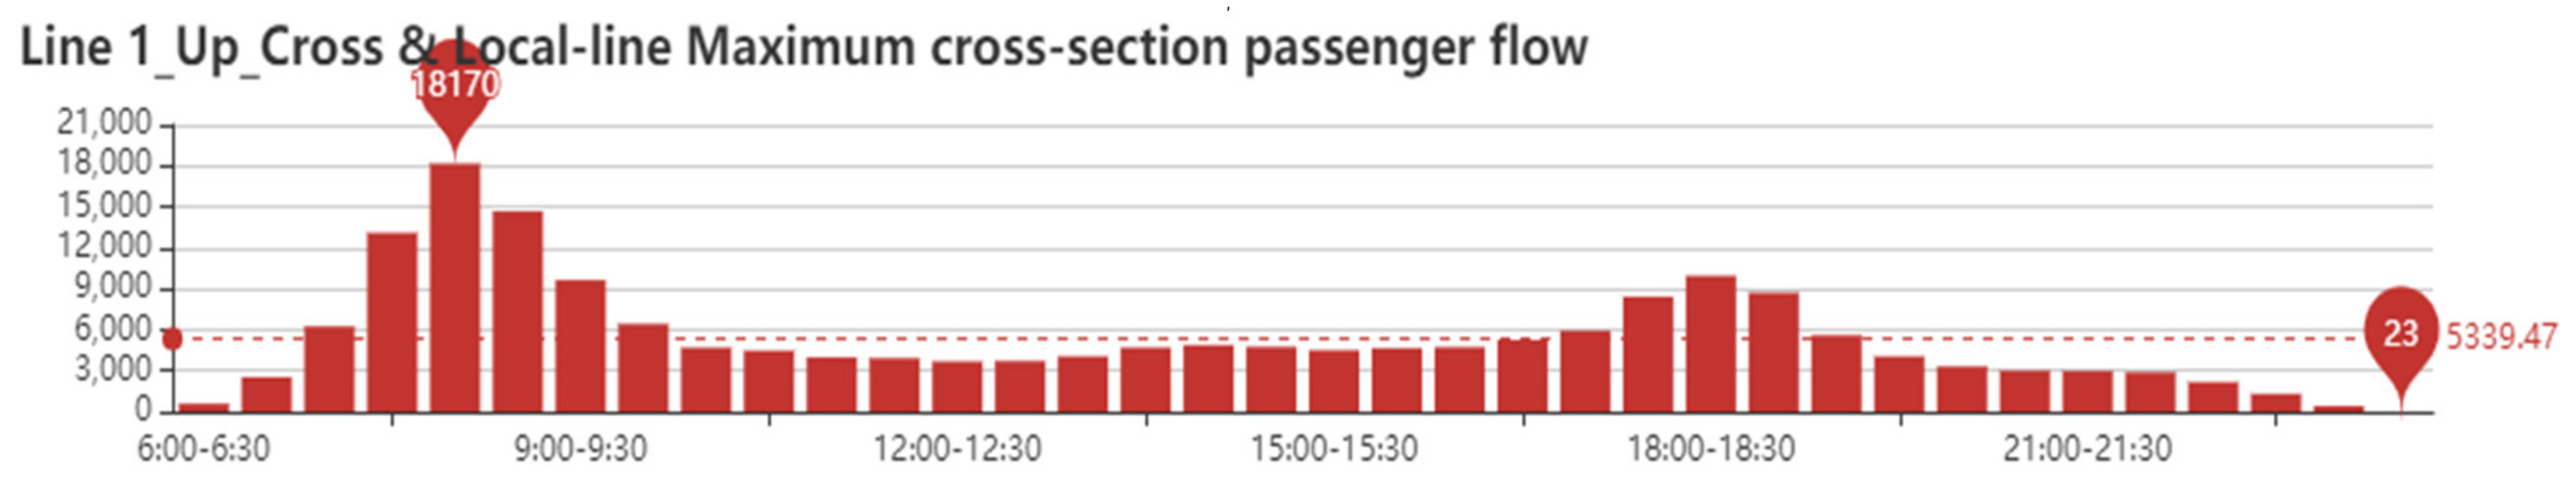
The spatio-temporal distribution of 3D cross-section passenger flow generated by two-way local- & cross-line passenger flow pushing assignment on Line 1 is shown in Figure 4, with obvious tidal characteristics in the morning and evening peak periods. In up direction, the cross-section with maximum ridership at morning super peak is GYQ-NJS from 8:00 to 8:30, during which the ridership is 18,170 persons/30 minutes, and the maximum ridership at evening peak is DSK-YAJ from 18:00 to 18:30, during which the ridership is 9957 persons/30 minutes. In down direction, the cross-section with maximum ridership at morning peak is YAJ-DSK from 8:00 to 8:30, during which the ridership is 9786 people/30 min, and the cross-section with maximum ridership at evening super peak is NJS-GYQ from 18:00 to 18:30, during which the ridership is 13,713 people/30 min.
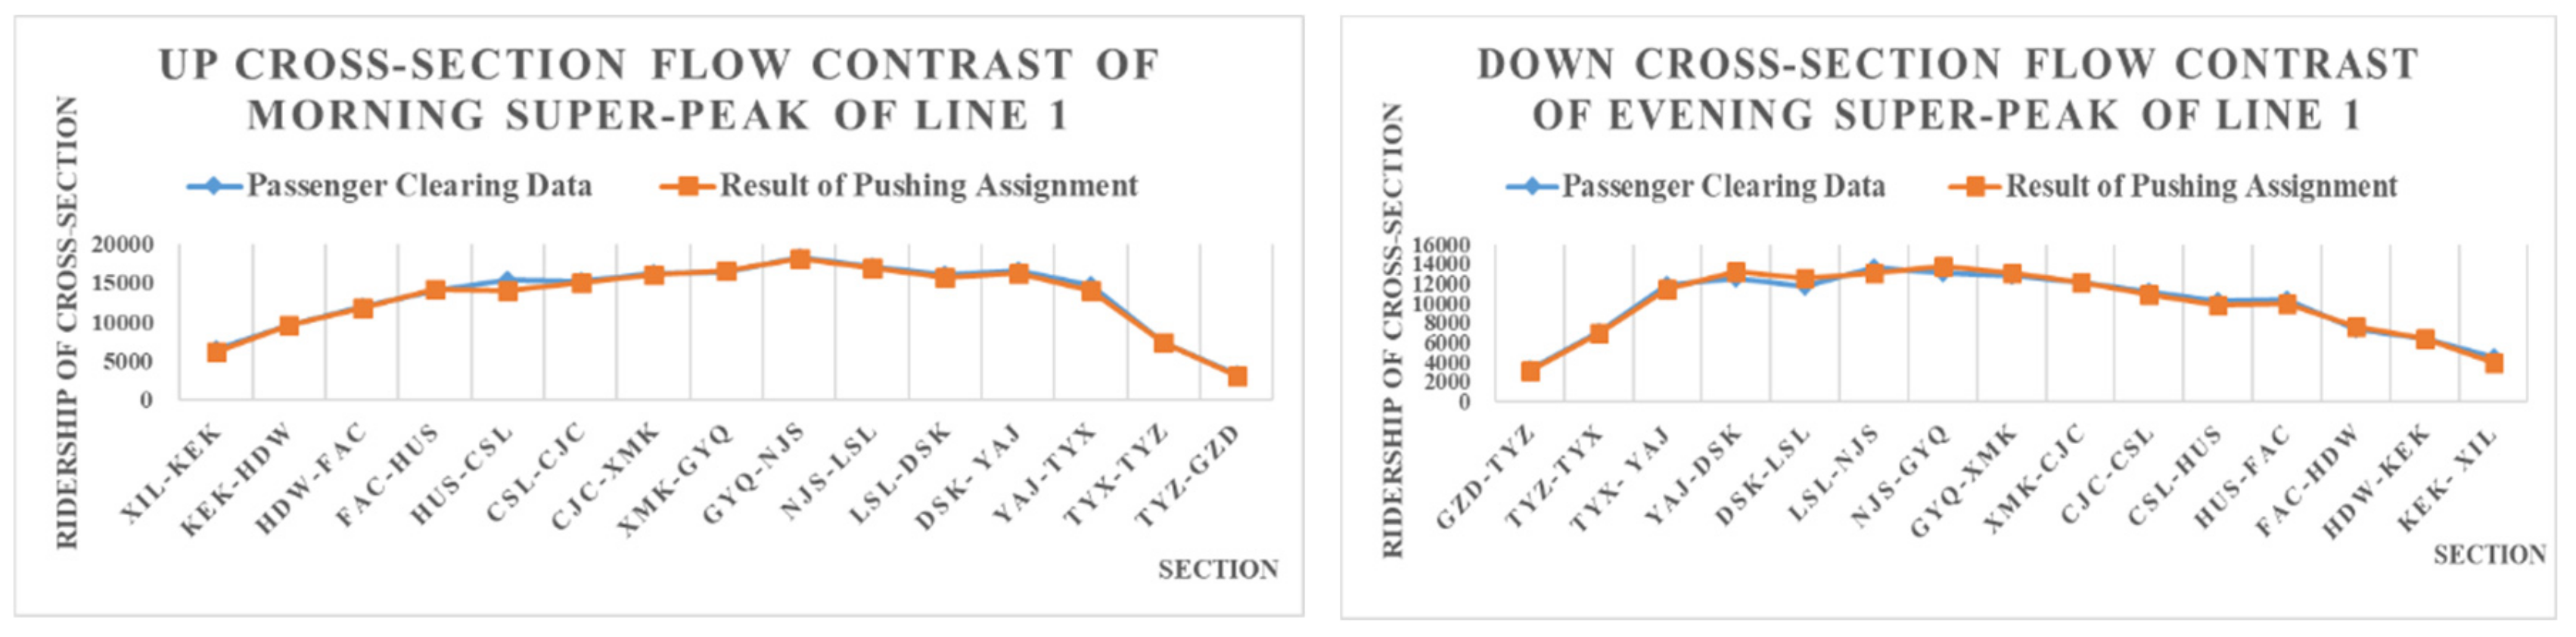
From the perspective of operation, the cross-section with maximum ridership during super peak is the basic data for operation organization, train dispatch and passenger flow control. Thus, decision makers often pay more attention to the ridership and its cross-section at super peak during the operational periods. Therefore, the pushing assignment results of the morning super peak cross-section in up direction and the evening super peak cross-section in down direction are compared with the passenger clearing data from the Fare Clearing System (FCS) [32] for Guangzhou Metro, as shown in Figure 5. From the curve shape, the cross-sections with maximum ridership at morning super peak in the up direction and evening super peak in the down direction obtained by passenger flow pushing assignment are highly consistent with the passenger clearing data in terms of ridership and evolution trends with the time.
As shown in Table 3, in the up direction, according to the algorithm results, the cross-section with maximum ridership at the morning super peak is GYQ-NJS, which is consistent with the passenger clearing data highlighted in bold, and the relative error of ridership is −0.1%. In the down direction, the cross-section with maximum ridership at the evening super peak is NJS-GYQ by the algorithm results, and the ridership is 13,713 persons/30 min. The passenger clearing data show that the cross-section with maximum ridership is LSL-NJS, and the ridership is 13,674 persons/30 min. The difference between them is only one cross-section, with a relative error of 0.3% in ridership. The relative errors of the total ridership of two-way cross-sections are −2.0% and −0.1%, respectively. It can be seen that the models and algorithms in this paper have high accuracy and can provide reliable basic passenger flow data for the formulation of a train operation plan.
The cross-sections with maximum ridership in each period of the day formed by cross-line and local-line passenger flow on Line 1 are shown in Figure 6. Among them, the average value of maximum ridership during full-day operation time periods is 5339 persons/30 minutes, and the periods with the maximum ridership of cross-section higher than the average are the peak periods. Therefore, it can be judged that the morning peak period is from 7:00 to 9:30, and the evening peak period is from 17:30 to 19:30, which is consistent with the data used by the Guangzhou Metro operation department. The transport supply arrangement, capacity rate requirement and departure frequency in the peak period are higher than those in the non-peak periods.
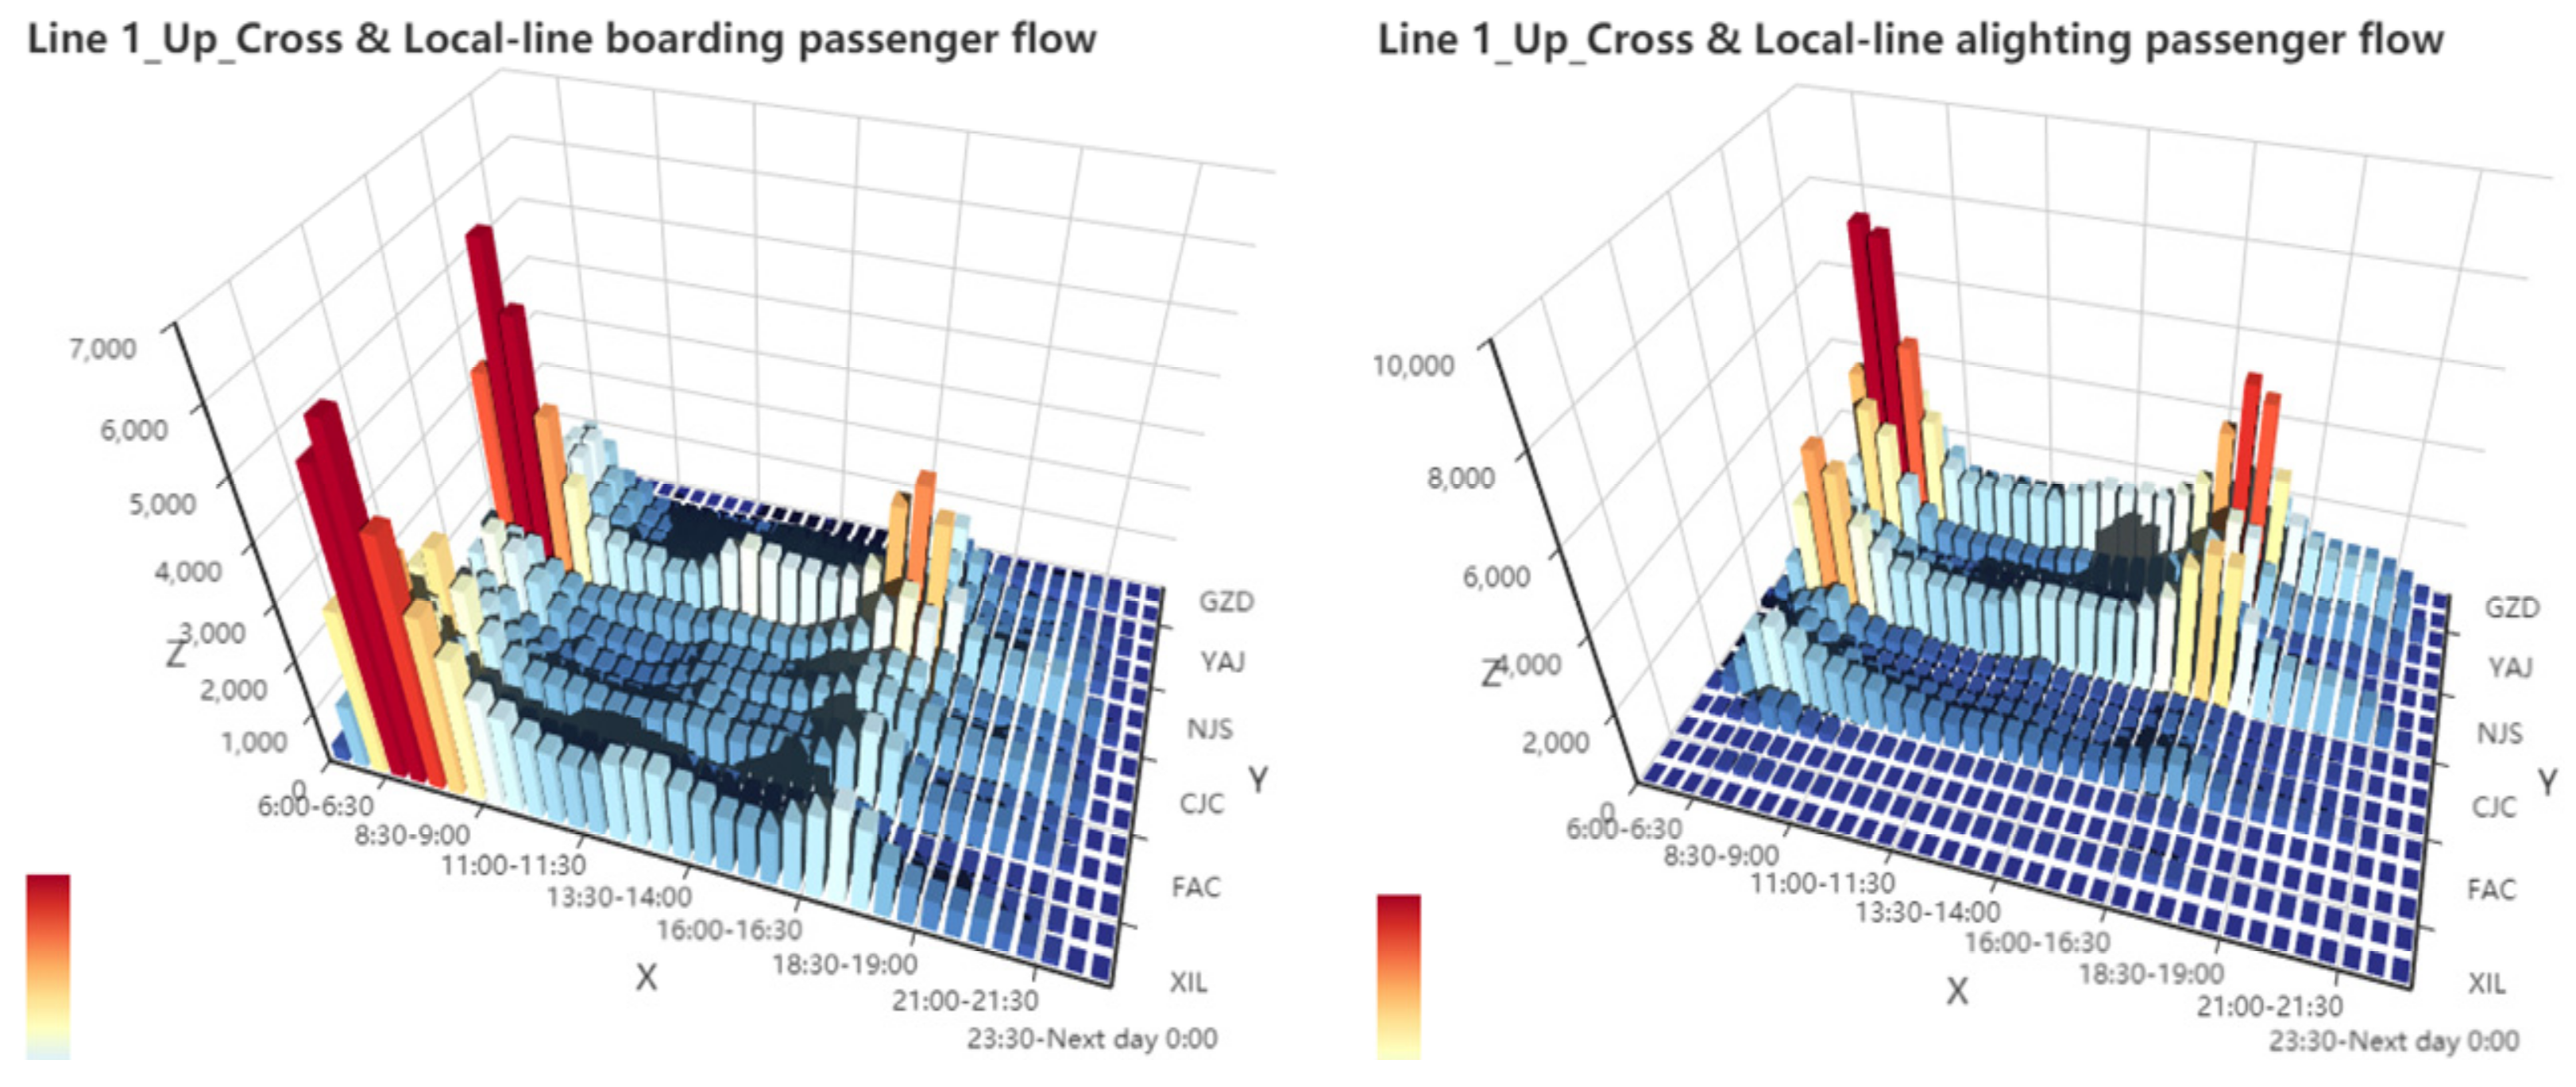
In the up direction of Line 1, the spatio-temporal distributions of boarding and alighting passenger flow formed by the pushing assignment of cross-line and local-line passenger flow are shown in Figure 7. Among them during the morning rush hour, the passenger traffic at 7:30 to 8:30 is mainly concentrated in the transfer stations XIL and GYQ, which are connected to the Line GF and the Line 2 with large passenger volume, and the boarding ridership are 6072 persons/30 minutes and 6350 persons/30 minutes, respectively; the alighting passenger flow mainly distributes in TYX station with the ridership of 8099 people/30 minutes, which is one of the few transfer stations with three-line intersection and one of the most important stations of passenger flow organization and train operation in Guangzhou Metro. The large passenger flow characteristics of the three stations are closely related to their role as an important transfer key node in the network.
The transfer flow of the above three transfer stations during the morning peak from 7:00 to 9:30 in all directions is analyzed, as shown in Table 4. The proportion of passenger flow from Line GF transferring into the up direction on Line 1 at station XIL is 77.5%, and from Line 2 transferring into the up direction on Line 1 at station GYQ is 34.8%, with the transfer volumes of 8975 persons and 14,128 persons, which leads to a large morning-peak passenger flow at stations XIL and GYQ, respectively. The proportion of passenger flow from Line 1 transferring out to Line 3 at station TYX is 37.6%, and the transfer volume is 7249 persons. The proportion of transferring-out flow is higher than that of total alighting flow.
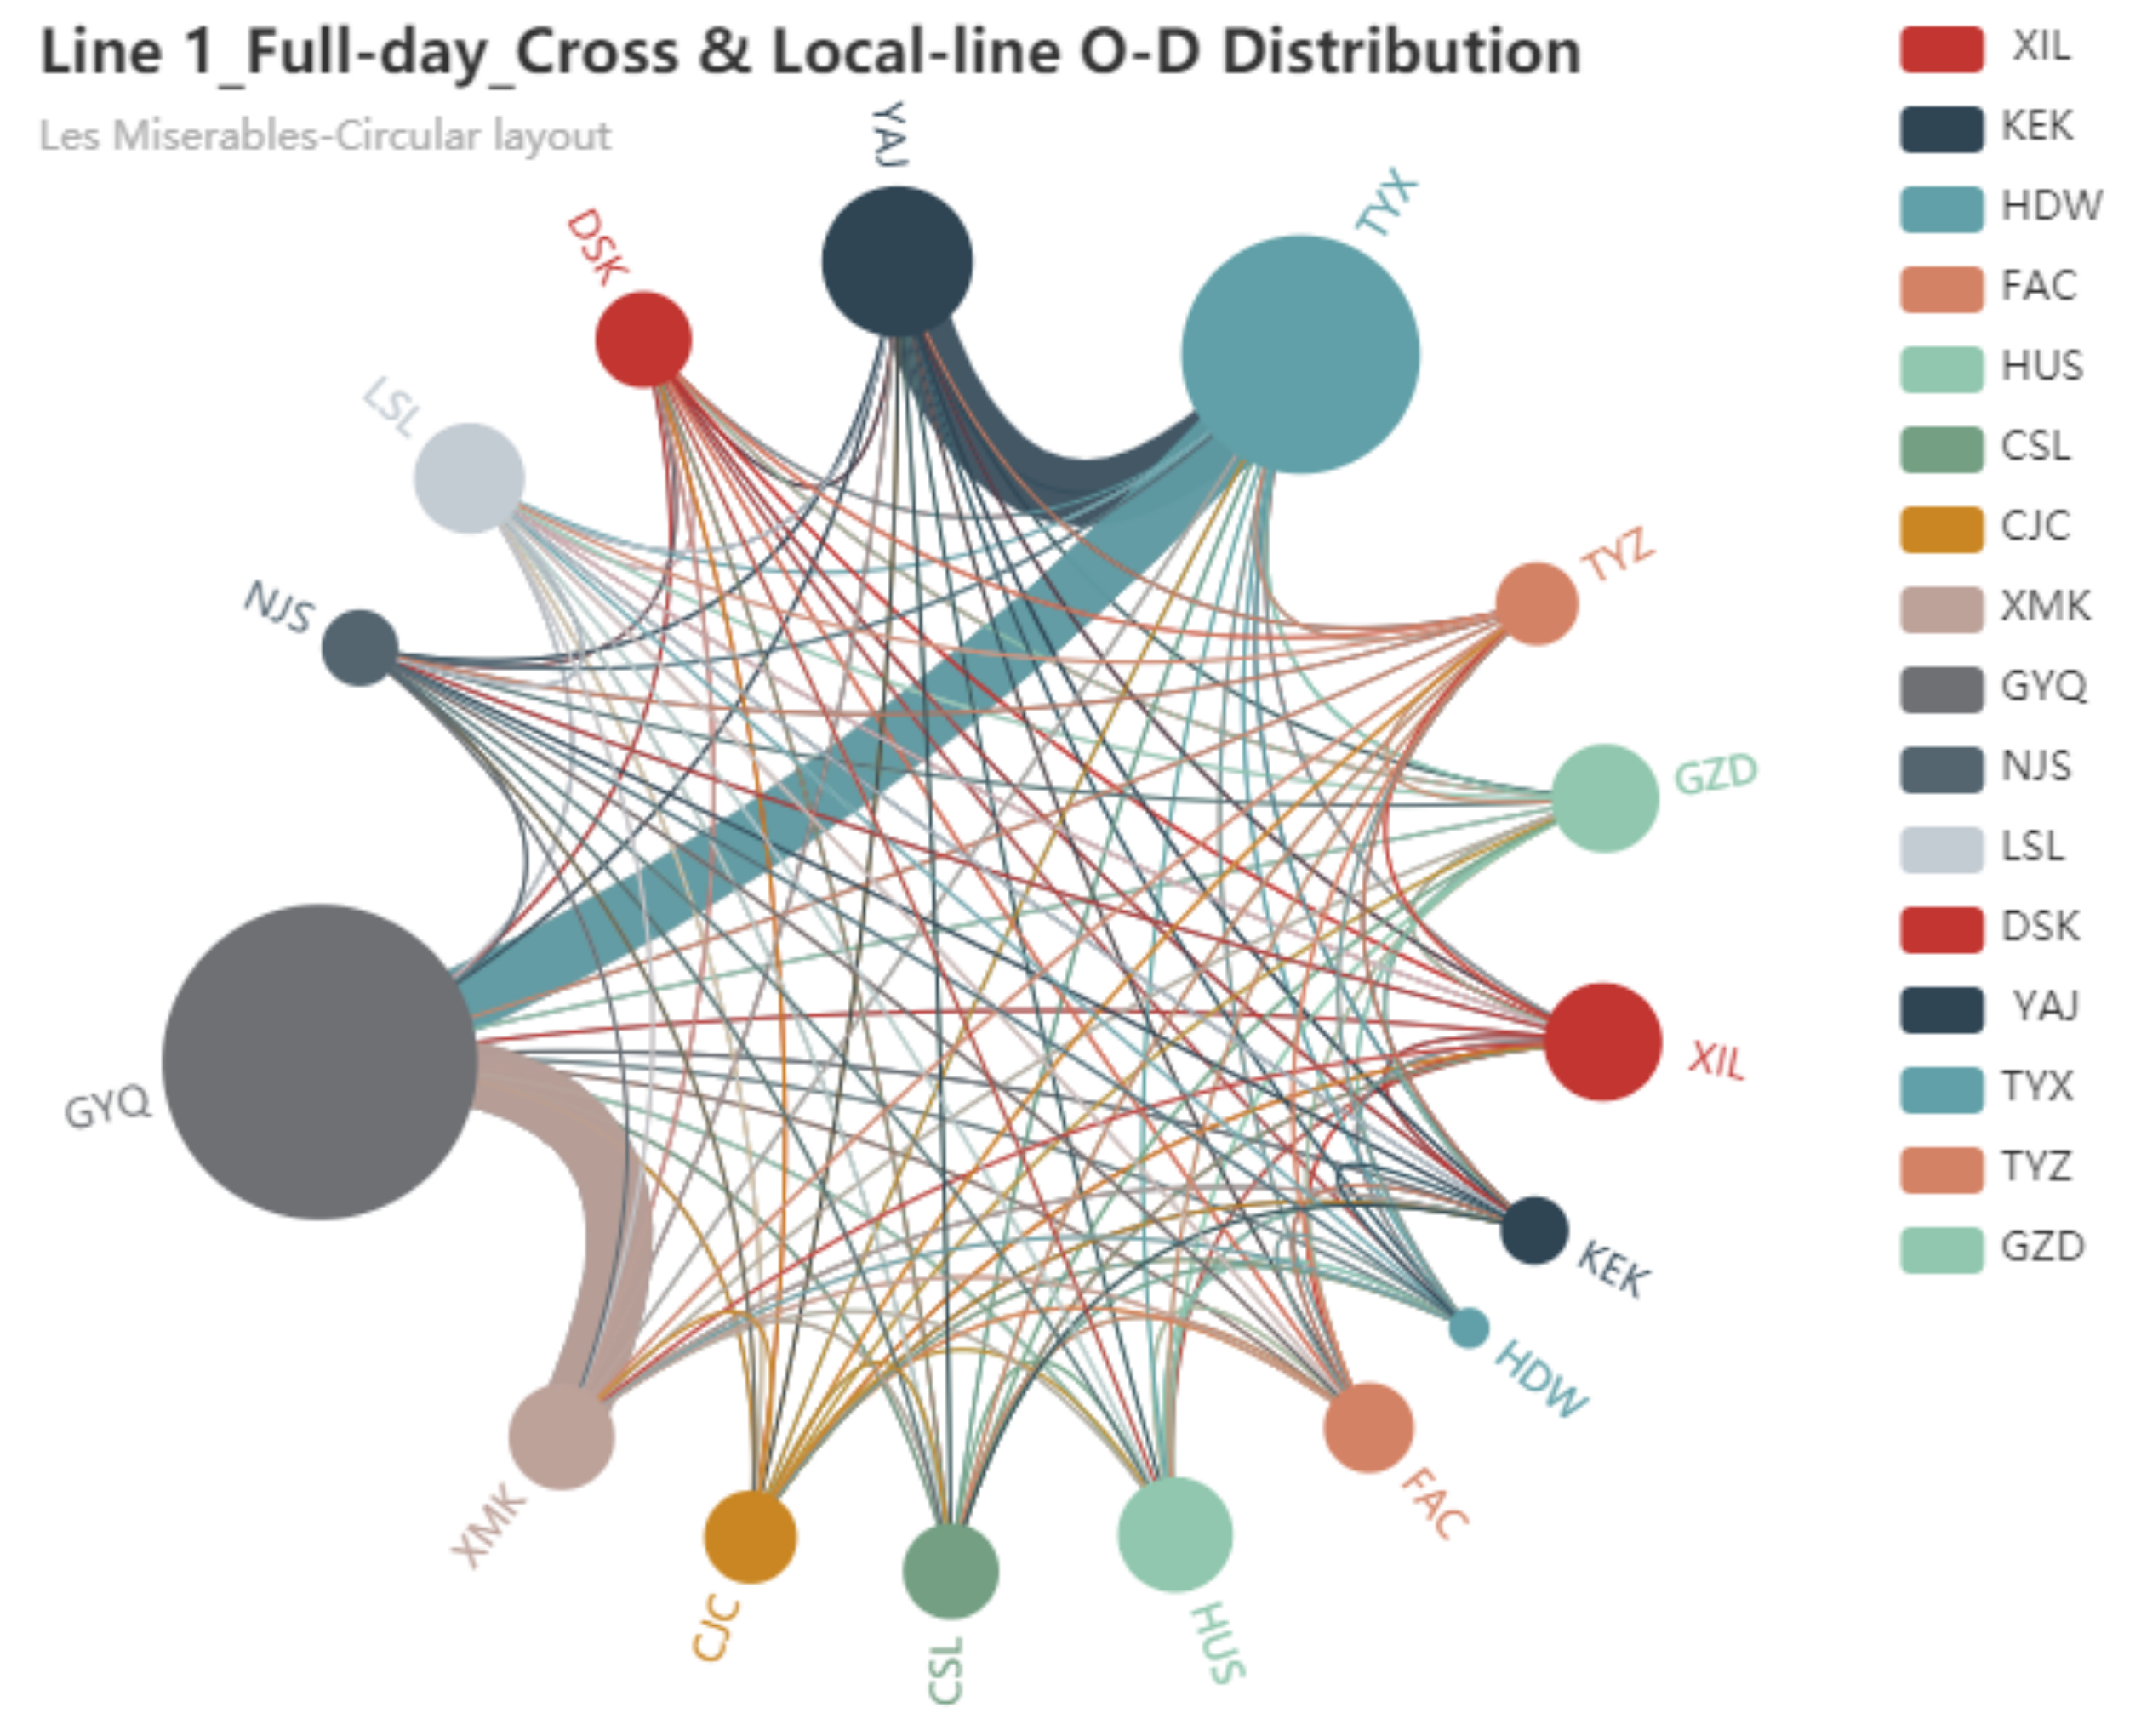
For , where , , that is, the passenger flow of ride sections with boarding and alighting stations on Line 1 in each time period is statistically analyzed, and the full-day O-D distribution of Line 1 is obtained, as shown in Figure 8. According to the size of the nodes, the transfer stations GYQ, TYX and YAJ have larger passenger flow, which are 294,817 persons, 223,134 persons and 141,388 persons, respectively; by the width of the arc, the O-D passenger volumes from GYQ to TYX, YAJ to TYX and XMK to GYQ are larger, which are 19,918 persons, 16,360 persons and 15,975 persons, respectively. Line 1 is the backbone line of Guangzhou Metro. The transfer stations only account for 43.75% of the total number of stations but transport 59.9% of the passengers of the whole line, which plays an important role in the network operation.
8. Conclusions
Under the background of deepening network operation organization of urban rail transit, this paper proposes a passenger flow pushing assignment method based on hierarchical path and line decomposition for urban rail networks. The main work completed includes:
(1) Based on the undirected graph of lines and the recursive divide-and-conquer idea, a hierarchical effective path generation strategy is proposed. Using this strategy, the effective path is searched in three-layer hierarchical topological structures including, in order, line path layer, key station path layer and station sequence path layer, which not only enormously simplifies the searching complexity and eliminates unreasonable paths, but also improves the searching efficiency and quality of the effective path;
(2) The proposed improved C-Logit multi-path passenger flow assignment model fully overcomes the “independence hypothesis” and “identical probability distribution hypothesis” and can assign reasonable selection proportions for effective paths;
(3) According to the idea of hierarchical searching for effective paths, local-line and cross-line passenger flow pushing assignment algorithms based on line decomposition are proposed, which have been successfully applied in the Guangzhou Metro large-scale network, and the results are in good agreement with the actual passenger clearing data. Moreover, the model and algorithms proposed in this paper are universal for urban rail transit systems. Passenger flow assignment method can simulate the process of passenger travel with high accuracy and lay a solid foundation for the sustainable operation of an urban rail network. Using the results of passenger flow distribution calculated by this method, a reasonable train operation plan can be formulated to meet passenger demand to the utmost and improve vehicle utilization efficiency, which has good social benefit.
The research on passenger flow assignment based on line decomposition has certain theoretical guiding significance for the network operation organization of urban rail transit. The results of the passenger flow pushing assignment can be used for a series of transportation organization optimization problems, such as passenger flow analysis, peak period identification, transportation mode selection, formulation of a train operation plan and transfer connection scheme.
The following limitations of the method proposed in this paper need to be further addressed in the future.
(1) As a complex system, there are many factors affecting the path choice behavior of passengers in an urban rail network. In this paper, passengers are assumed to be homogeneous and the impact of gender, age, travel purpose and familiarity with the network on path selection is not specifically considered. In fact, different types of travelers have different path preference. Therefore, the influence of cost factors on the behavior of path selection needs to be further explored.
(2) At present, the parameters of the model in this paper mainly have been taken from previous researches and are applicable to the Guangzhou Metro. Further research will focus on parameter calibration and congestion in the generalized travel cost to improve the applicability of the model.
Author Contributions
L.D. and J.Z. conceived the study, established the models and designed the algorithm; J.Z. achieved the program code and conducted the data experiments; L.D., J.Z. and H.M. were responsible for data analysis and editing; L.D. and J.Z. wrote the paper; and L.D. and J.Z. and H.M. helped to modify the paper.
Funding
This research work was supported by the National Natural Science Foundation of China (Grant Nos. U1834209 and 71471179). The authors are responsible for all results and opinions expressed in this paper.
Acknowledgments
The authors would like to acknowledge the anonymous reviewers for their valuable comments.
Conflicts of Interest
The authors declare no conflict of interest. The funders had no role in the design of the study; in the collection, analyses, or interpretation of data; in the writing of the manuscript, or in the decision to publish the results.
References
- United Nations. Sustainable Development Goals. 2016. Available online: https://www.un.org/milleniumgoals/ (accessed on 8 November 2019).
- Manni, M.; Coccia, V.; Nicolini, A.; Marseglia, G.; Petrozzi, A. Towards Zero Energy Stadiums: The case study of the Dacia Arena in Udine, Italy. Energies 2018, 11, 2396. [Google Scholar] [CrossRef]
- Shayegh, S.; Sanchez, D.L.; Caldeira, K. Evaluating relative benefits of different types of R&D for clean energy technologies. Energy Policy 2017, 107, 532–538. [Google Scholar]
- Marseglia, G.; Rivieccio, E.; Medaglia, C.M. The dynamic role of Italian Energy strategies in the worldwide scenario. Kybernetes 2019, 48, 636–649. [Google Scholar] [CrossRef]
- Dijkstra, E.W. A note on two problems in connexion with graphs. Numer. Math. 1959, 1, 269–271. [Google Scholar] [CrossRef]
- Floyd, R.W. Algorithm 97: Shortest path. Commun. ACM 1962, 5, 345. [Google Scholar] [CrossRef]
- Schulz, F.; Wagner, D.; Weihe, K. Dijkstra’s algorithm on-line: An empirical case study from public railroad transport. In Proceedings of the International Workshop on Algorithm Engineering, London, UK, 19–21 July 1999; pp. 110–123. [Google Scholar]
- Rodríguez-Puente, R.; Lazo-Cortés, M.S. Algorithm for shortest path search in Geographic Information Systems by using reduced graphs. SpringerPlus 2013, 2, 291. [Google Scholar] [CrossRef]
- Brodnik, A.; Grgurovič, M. Practical algorithms for the all-pairs shortest path problem. In Shortest Path Solvers: From Software to Wetware; Adamatzky, A., Ed.; Emergence, Complexity and Computation; Springer: Cham, Switzerland, 2018; Volume 32, pp. 163–180. [Google Scholar]
- Yin, H.; Han, B.; Li, D.; Lu, F. Modeling and application of urban rail transit network for path finding problem. In Practical Applications of Intelligent Systems; Wang, Y., Li, T., Eds.; Advances in Intelligent and Soft Computingn; Springer: Berlin/Heidelberg, Germany, 2011; Volume 124, pp. 689–695. [Google Scholar]
- Chan, T.M. All-pairs shortest paths with real weights in O(n3/log n) time. Algorithmica 2008, 50, 236–243. [Google Scholar] [CrossRef]
- Henzinger, M.; Krinninger, S.; Nanongkai, D. Dynamic approximate all-pairs shortest paths: Breaking the $O(mn)$ barrier and rerandomization. In Encyclopedia of Algorithms; Springer: Boston, MA, USA, 2015. [Google Scholar]
- Aldous, D.; Barthelemy, M. Optimal geometry of transportation networks. Phys. Rev. E 2019, 99. [Google Scholar] [CrossRef]
- Jia, G.; Ma, R.; Hu, Z. Urban Transit Network Properties Evaluation and Optimization Based on Complex Network Theory. Sustainability 2019, 11, 2007. [Google Scholar] [CrossRef]
- Cascetta, E.; Cantarella, G.E. A day-to-day and within-day dynamic stochastic assignment model. Transp. Res. Part A General 1991, 25, 277–291. [Google Scholar] [CrossRef]
- Cascetta, E.; Nuzzolo, A.; Russo, F.; Vitetta, A. A modified logit route choice model overcoming path overlapping problems: Specification and some calibration results for interurban networks. Presented at the 13th International Symposium on Transportation and Traffic Theory, Lyon, France, 24–26 July 1996. [Google Scholar]
- Cascetta, E.; Russo, F.; Vitetta, A. Stochastic user equilibrium assignment with explicit path enumeration: Comparison of models and algorithms. IFAC Proc. Vol. 1997, 30, 1031–1037. [Google Scholar] [CrossRef]
- Cascetta, E.; Papola, A. Random utility models with implicit availability perception of choice travel for the simulation of travel demand. Transp. Res. Part C Emerg. Technol. 2001, 9, 249–263. [Google Scholar] [CrossRef]
- Hu, S.; Li, H. A urban rail transport network carrying capacity calculation method based on the logit model. In Proceedings of the 2011 International Conference on Transportation, Mechanical, and Electrical Engineering (TMEE), Changchun, China, 16–18 December 2011; pp. 191–194. [Google Scholar]
- Jia, L.; Lei, D.; Zhang, Y.; Zeng, Q.; Wang, J. The model and algorithm of distributing cooperation profits among operators of urban rail transit under PPP pattern. Clust. Comput. 2017, 20, 3023–3036. [Google Scholar] [CrossRef]
- Tong, C.O.; Wong, S.C. A stochastic transit assignment model using a dynamic schedule-based network. Transp. Res. Part B Methodol. 1999, 33, 107–121. [Google Scholar] [CrossRef]
- Hassannayebi, E.; Sajedinejad, A.; Mardani, S. Urban rail transit planning using a two-stage simulation-based optimization approach. Simul. Model. Pract. Theory 2014, 49, 151–166. [Google Scholar] [CrossRef]
- Liu, J.F. Transfer-Based Modeling Flow Assignment with Empirical Analysis for Urban Rail Transit Network. Ph.D. Thesis, Beijing Jiaotong University, Beijing, China, 2012. (In Chinese). [Google Scholar]
- Yu, H.F. A Dynamic Stochastic Disequilibrium Passenger Flow Assignment Method and Its Application on a Local Disruption of Urban Railway Network. Master’s Thesis, School of Traffic and Transportation, Beijing Jiaotong University, Beijing, China, 2015. (In Chinese). [Google Scholar]
- Zhang, F. Research on Passenger Flow Assignment Model and Method of Urban Rail Transit Network. Master’s Thesis, Beijing Jiaotong University, Beijing, China, 2016. (In Chinese). [Google Scholar]
- Chen, P.W. Study on Passenger Flow Assignment Method of Urban Rail Transit Based on Improved Logit Model. Master’s Thesis, School of Civil Engineering, Beijing Jiaotong University, Beijing, China, 2018. (In Chinese). [Google Scholar]
- Wu, Z.Y. Research on the Theory of Passenger Flow Assignment and Control Technology in Urban Rail Transit Network. Master’s Thesis, School of Transportation and Logistics, Southwest Jiaotong University, Chengdu, China, 2018. (in Chinese). [Google Scholar]
- Zhou, F.; Shi, J.G.; Xu, R.H. Estimation method of path-selecting proportion for urban rail transit based on AFC data. Math. Probl. Eng. 2015, 2015, 350397. [Google Scholar] [CrossRef]
- Zhou, Z.; Chen, A.; Bekhor, S. C-logit stochastic user equilibrium model: Formulations and solution algorithm. Transportmetrica 2012, 8, 17–41. [Google Scholar] [CrossRef]
- Liu, J.F.; Sun, F.L.; Bai, Y.; Xu, J. Passenger flow route assignment model and algorithm for urban rail transit network. J. Transp. Syst. Eng. Inf. Technol. 2009, 9, 81–86. (In Chinese) [Google Scholar]
- Lin, Z.; Jiang, M.Q.; Liu, J.F.; Si, B.F. Improved Logit model and method for urban rail transit network assignment. J. Transp. Syst. Eng. Inf. Technol. 2012, 12, 145–151. (In Chinese) [Google Scholar]
- Li, Y.; Deng, X.; Wen, X. Establishing fare clearing system in urban rail transit. Urban Rapid Rail Transit 2007, 20, 22–25. (In Chinese) [Google Scholar]
Figure 1.
A simple network of urban rail transit. (a) Physical topological structure of the simple network. (b) Extended network.
Figure 1.
A simple network of urban rail transit. (a) Physical topological structure of the simple network. (b) Extended network.

Figure 2.
Principle of passenger flow pushing. (a) Time-varying pushing law of an origin–destination (O-D) pair. (b) Time-varying pushing accumulation law of two O-D pairs.
Figure 2.
Principle of passenger flow pushing. (a) Time-varying pushing law of an origin–destination (O-D) pair. (b) Time-varying pushing accumulation law of two O-D pairs.

Figure 3.
Guangzhou Metro Line 1.

Figure 4.
Spatio-temporal distribution of cross- and local-line passenger flow of Line 1.

Figure 5.
Comparison of the cross-section ridership of super peak on Line 1.

Figure 6.
Cross-section with maximum ridership in up direction of Line 1.

Figure 7.
Boarding and alighting passenger flows in up direction of Line 1.

Figure 8.
Full-day O-D distribution of Line 1.


Table 1.
Notations in the paper.
| Sets | |
|---|---|
| Set of stations, , is the total number of stations. | |
| Set of lines, . | |
| Set of stations on line , . | |
| Set of sections of line , . | |
| Set of stations within the section of line , . | |
| Set of transfer stations, . | |
| station-to- station set of traffic demand, O-D pair . | |
| Set of effective paths between O-D pair . | |
| Set of passenger flows in ride sections. | |
| Parameters | |
| Mileage of section . | |
| Pure running time of section , which is equivalent to . | |
| Stopping time of station . | |
| Transfer time of transfer station . | |
| Binary variable of line direction, if stands for the upward direction and stands for the downward direction. For line , let be the station order of the upward direction and be the downward direction. | |
| The th effective path of O-D pair , . | |
| , | is the total number of transfers of effective path and is the ordinal number of it, . |
| Selection probability of path . | |
| Travel time period , where and are the beginning and end times of the period , respectively. | |
| , | Start and end times of operation for rail transit. |
| Length of a certain passenger travel time period, which is set according to the actual situation. | |
| , | At travel time period , the passenger flow in direction of line who board at station and alight at station , respectively. |
| At travel time period , the passenger flow in direction of line who pass through section . | |
| At travel time period , the passenger flow with O-D pair who board at station and alight in station at direction; conditions , may fail to hold when transfer is required. | |
| At travel time period , the passenger flow who transfer from station of line in direction to station of line in direction. | |
| , | Ratios to the period length of travel time periods , . |
Table 2.
Comparisons of path assignment probability by different models.
| Probability Model | Sum | |||
|---|---|---|---|---|
| Classical Logit | 0.5000 | 2.7196 × 10⁻¹² | 0.5000 | 1 |
| Improved Logit | 0.4303 | 0.1393 | 0.4303 | 1 |
| C-Logit | 0.4295 | 23362 × 10−12 | 0.5705 | 1 |
| Improved C-Logit | 0.3771 | 0.1221 | 0.5008 | 1 |
Table 3.
Error analysis of cross-section ridership at super peak on Line 1.
| Up Direction | Down Direction | ||||||
|---|---|---|---|---|---|---|---|
| Section | Passenger Clearing Data | Algorithm Results | Relative Error | Section | Passenger Clearing Data | Algorithm Results | Relative Error |
| XIL-KEK | 6573 | 6072 | −7.6% | GZD-TYZ | 3225 | 3149 | −2.4% |
| KEK-HDW | 9509 | 9480 | −0.3% | TYZ-TYX | 7004 | 6949 | −0.8% |
| HDW-FAC | 11,906 | 11,720 | −1.6% | TYX-YAJ | 11,903 | 11,464 | −3.7% |
| FAC-HUS | 14,069 | 14,097 | 0.2% | YAJ-DSK | 12,555 | 13,186 | 5.0% |
| HUS-CSL | 15,448 | 13,932 | −9.8% | DSK-LSL | 11,712 | 12,583 | 7.4% |
| CSL-CJC | 15,235 | 14,941 | −1.9% | LSL-NJS | 13,674 | 13,088 | −4.3% |
| CJC-XMK | 16,175 | 16,034 | −0.9% | NJS-GYQ | 13,040 | 13,713 | 5.2% |
| XMK-GYQ | 16,364 | 16,564 | 1.2% | GYQ-XMK | 12,868 | 13,064 | 1.5% |
| GYQ-NJS | 18,188 | 18,170 | −0.1% | XMK-CJC | 12,160 | 12,098 | −0.5% |
| NJS-LSL | 17,069 | 16,963 | −0.6% | CJC-CSL | 11,207 | 10,845 | −3.2% |
| LSL-DSK | 16,048 | 15,623 | −2.6% | CSL-HUS | 10,211 | 9857 | −3.5% |
| DSK- YAJ | 16,528 | 16,238 | −1.8% | HUS-FAC | 10,338 | 10,003 | −3.2% |
| YAJ-TYX | 14,762 | 13,958 | −5.4% | FAC-HDW | 7388 | 7660 | 3.7% |
| TYX-TYZ | 7301 | 7340 | 0.5% | HDW-KEK | 6361 | 6394 | 0.5% |
| TYZ-GZD | 3181 | 3158 | −0.7% | KEK-XIL | 4537 | 3950 | −12.9% |
| Sum | 198,356 | 194,290 | −2.0% | Sum | 148,183 | 148,003 | −0.1% |
Table 4.
Transfer flow in all directions during morning peak.
| Transfer Station | Transfer-out Line | Transfer-out Direction | Transfer-in Line | Transfer-in Direction | Transfer Flow | Transfer Ratio |
|---|---|---|---|---|---|---|
| XIL | GF | Up | 1 | Up | 7229 | 62.4% |
| GF | Down | 1 | Up | 1746 | 15.1% | |
| 1 | Down | GF | Up | 646 | 5.6% | |
| 1 | Down | GF | Down | 1973 | 17.0% | |
| GYQ | 1 | Up | 2 | Up | 5398 | 13.3% |
| 1 | Up | 2 | Down | 3975 | 9.8% | |
| 2 | Up | 1 | Up | 7682 | 18.9% | |
| 2 | Down | 1 | Up | 6446 | 15.9% | |
| 1 | Down | 2 | Up | 2880 | 7.1% | |
| 1 | Down | 2 | Down | 2250 | 5.5% | |
| 2 | Up | 1 | Down | 6041 | 14.9% | |
| 2 | Down | 1 | Down | 5904 | 14.6% | |
| TYX | 1 | Up | 3 | Up | 4435 | 23.0% |
| 1 | Up | 3 | Down | 2814 | 14.6% | |
| 3 | Up | 1 | Up | 2703 | 14.0% | |
| 3 | Down | 1 | Up | 239 | 1.2% | |
| 1 | Down | 3 | Up | 114 | 0.6% | |
| 1 | Down | 3 | Down | 935 | 4.9% | |
| 3 | Up | 1 | Down | 3462 | 18.0% | |
| 3 | Down | 1 | Down | 4569 | 23.7% |
© 2019 by the authors. Licensee MDPI, Basel, Switzerland. This article is an open access article distributed under the terms and conditions of the Creative Commons Attribution (CC BY) license (http://creativecommons.org/licenses/by/4.0/).
Share and Cite
MDPI and ACS Style
Deng, L.; Zeng, J.; Mei, H. Passenger Flow Pushing Assignment Method for an Urban Rail Network Based on Hierarchical Path and Line Decomposition. Sustainability 2019, 11, 6441. https://0-doi-org.brum.beds.ac.uk/10.3390/su11226441
AMA Style
Deng L, Zeng J, Mei H. Passenger Flow Pushing Assignment Method for an Urban Rail Network Based on Hierarchical Path and Line Decomposition. Sustainability. 2019; 11(22):6441. https://0-doi-org.brum.beds.ac.uk/10.3390/su11226441
Chicago/Turabian StyleDeng, Lianbo, Junhao Zeng, and Hongda Mei. 2019. "Passenger Flow Pushing Assignment Method for an Urban Rail Network Based on Hierarchical Path and Line Decomposition" Sustainability 11, no. 22: 6441. https://0-doi-org.brum.beds.ac.uk/10.3390/su11226441
Note that from the first issue of 2016, this journal uses article numbers instead of page numbers. See further details here.