An Analysis of the Effectiveness of Greenhouse Gas Reduction Policy for Office Building Design in South Korea

Abstract
:1. Introduction
1.1. Background and Purpose
1.2. Research Scope and Methods
2. Related Works
2.1. Current State of Research on GHG Emissions in the Building Sector
2.2. Purpose and Application of Reference Buildings
2.3. South Korea’s Policy for Reducing GHG Emissions in the Building Sector
2.3.1. Progress Toward Meeting GHG Emissions Reduction Targets
2.3.2. Major Strategies to Reduce GHG Emissions in the Building Sector
3. Investigating and Analyzing Office Buildings Using Design Data
3.1. Building Form
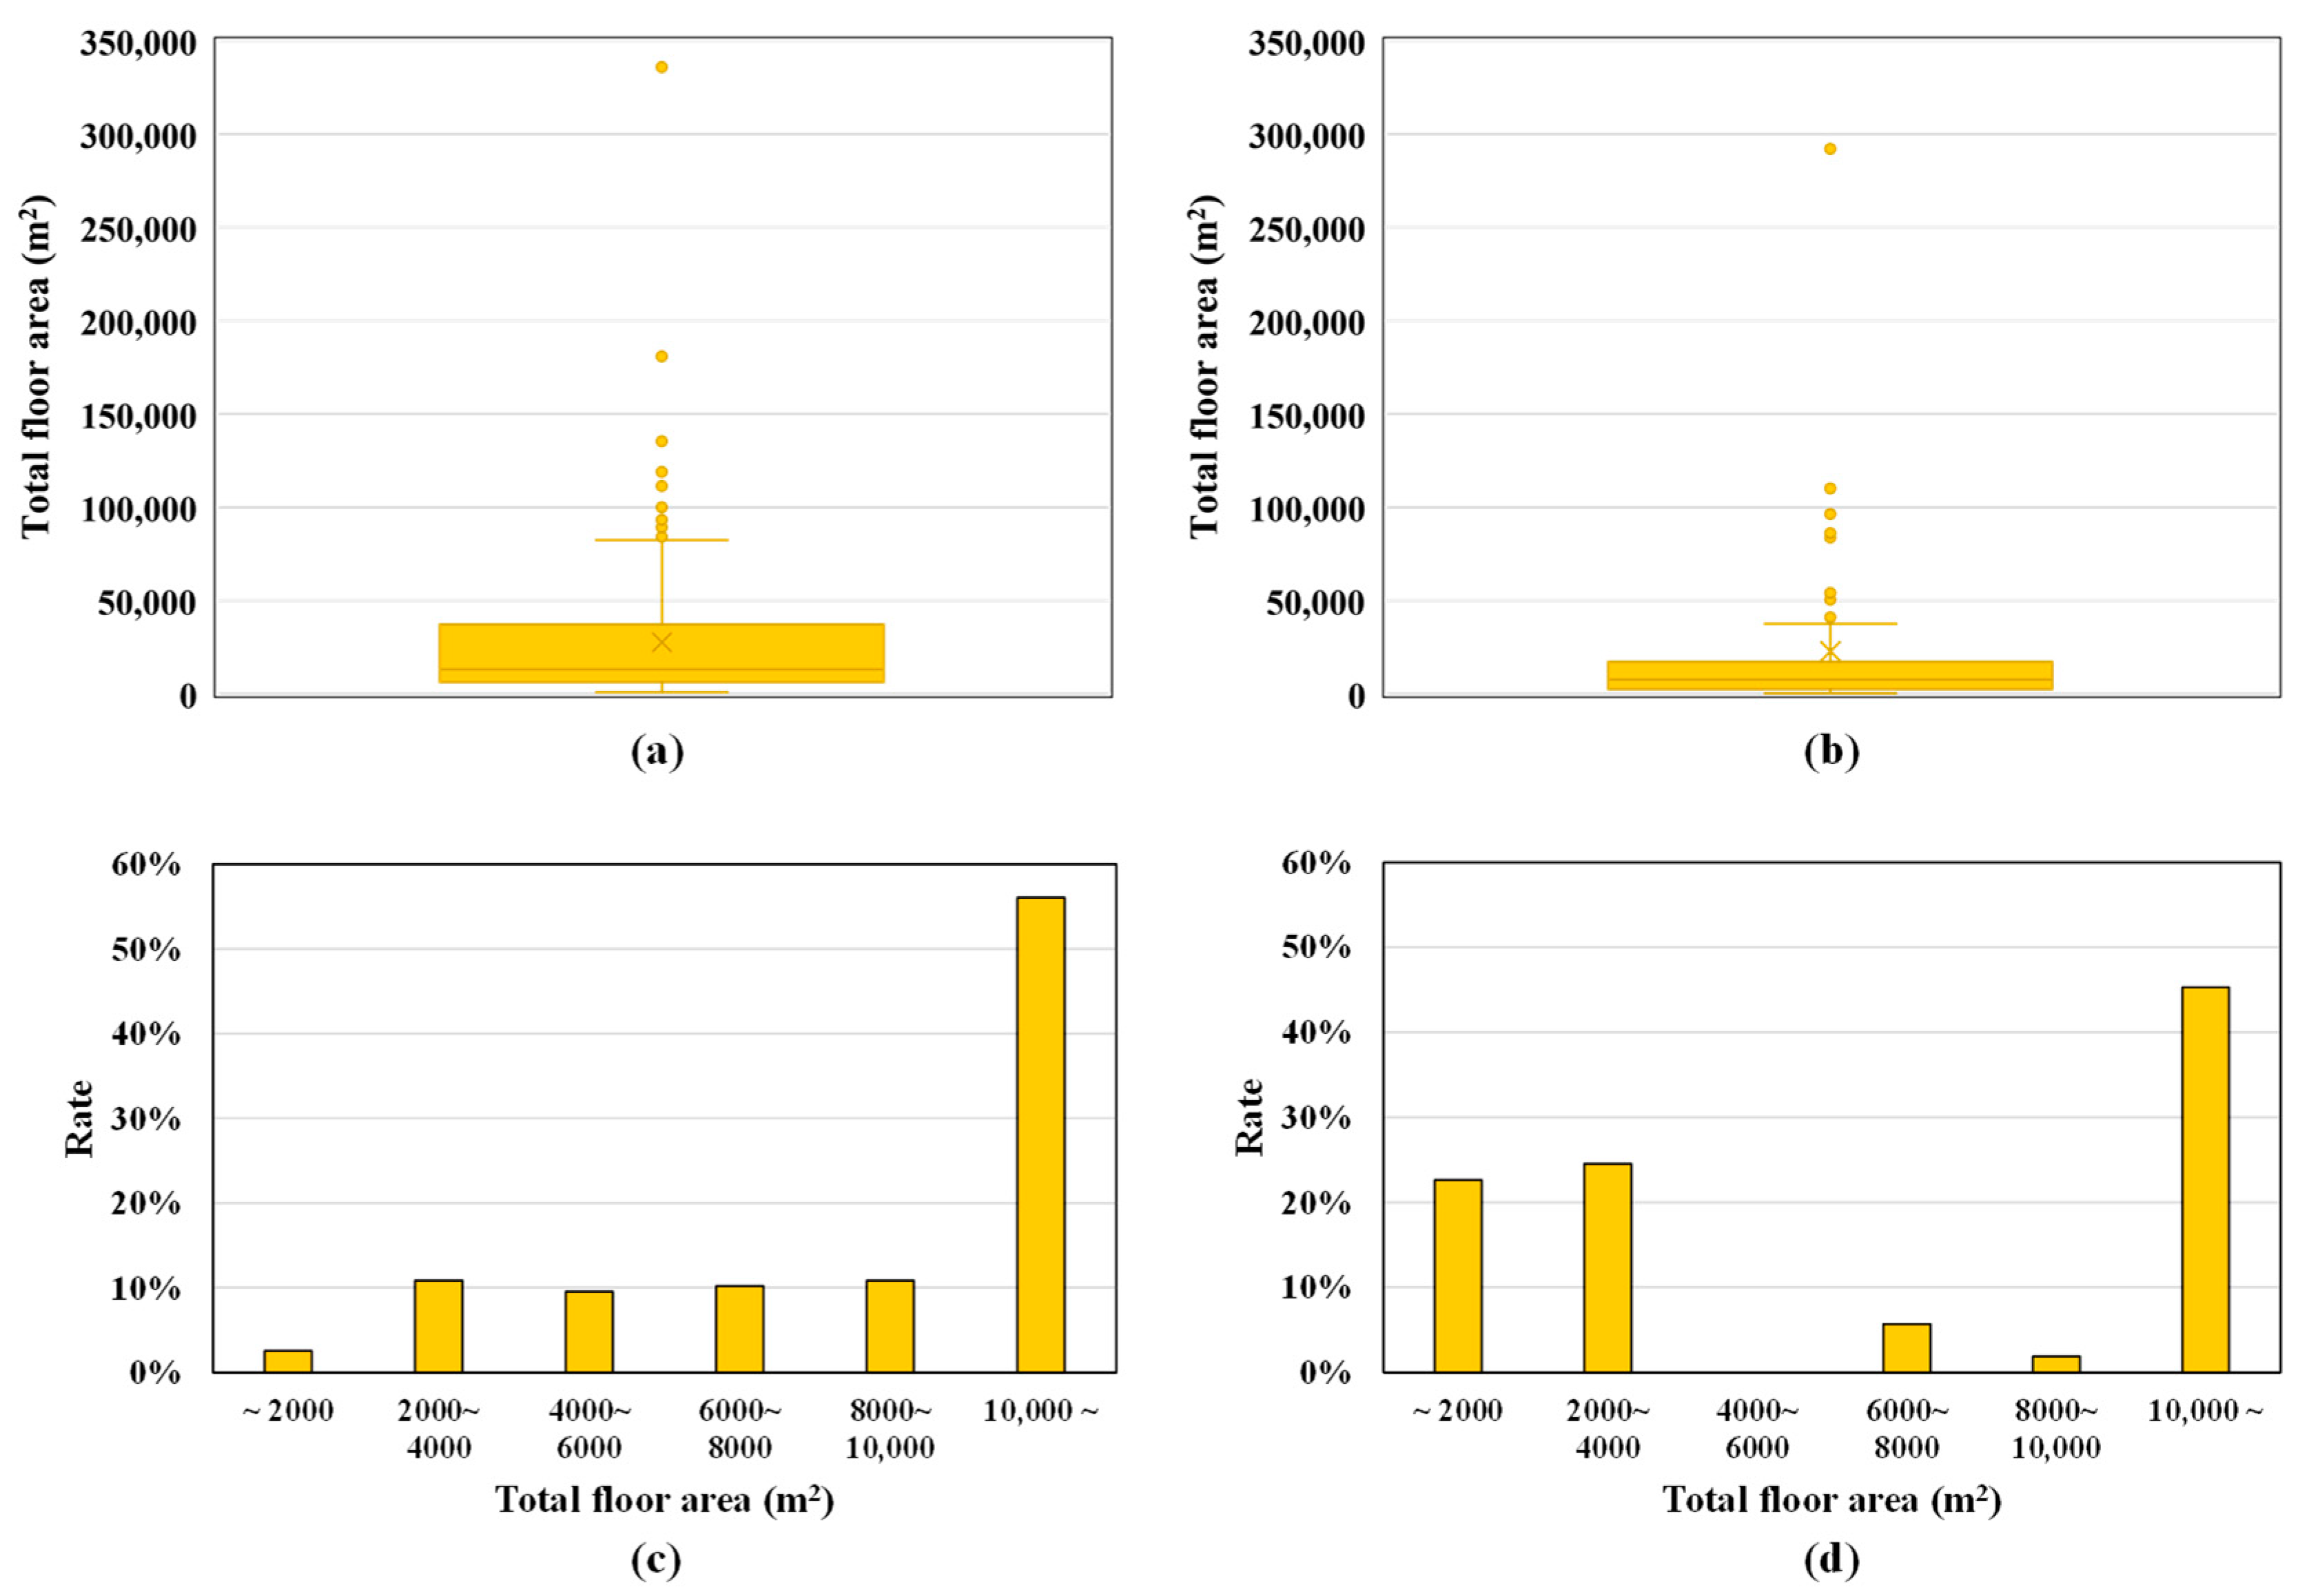
3.1.1. Total Floor Area
3.1.2. Aspect Ratios of Building Plans
3.1.3. Number of Floors
3.1.4. Floor Height
3.2. Window Systems
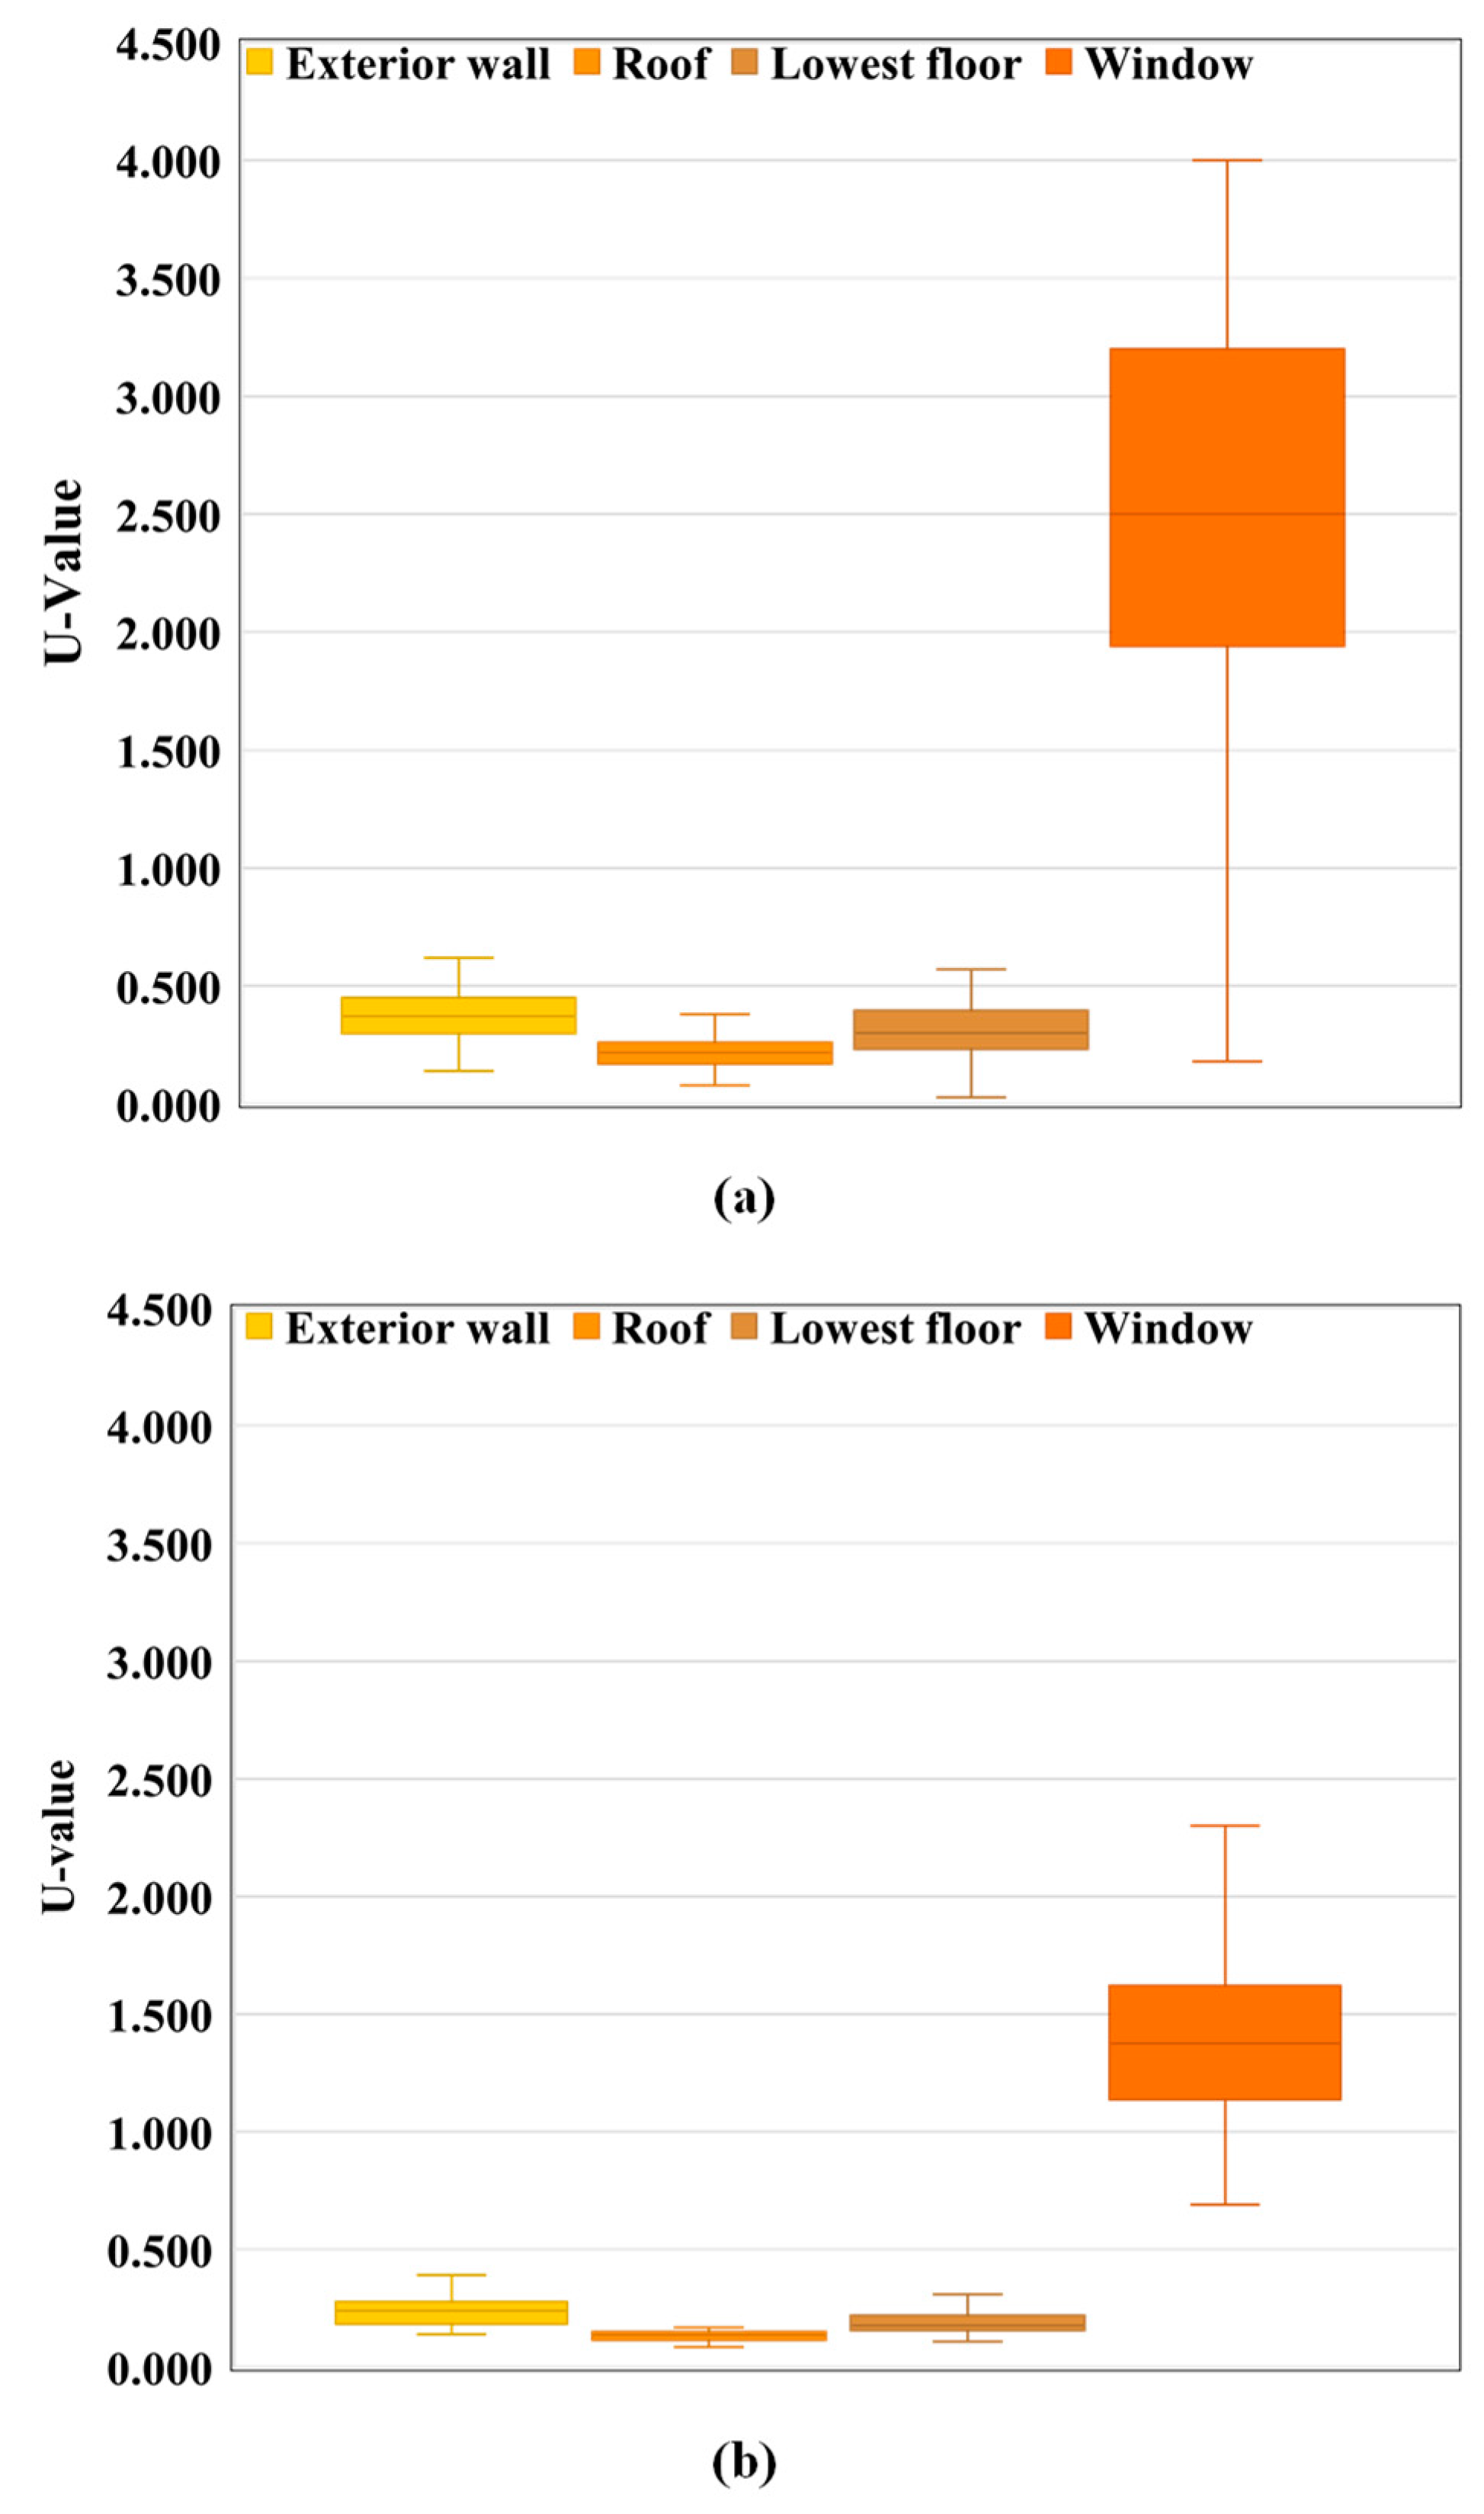
3.3. U-Values
4. Case Study
4.1. Reference Buildings and Factors of Building Design
4.2. Reference Building for Case Study
4.3. Results of Simulations of the Reference Buildings
- Comparison of the effects of building form
- Comparison of the effects of window systems
- Comparison of the effects of U-values
- Comparison of the effects of combination of building form and window systems
- Comparison of the effects of combination of window systems and U-values
- Comparison of the effects of combination of building form and U-values
- Comparison of the two groups
5. Results and Discussion
5.1. Results
5.2. Discussion
5.2.1. Contributions and Applications
- South Korea’s policy for reducing GHG emissions
- Reference buildings
5.2.2. Limitations and Future Work
6. Conclusions and Policy Implications
- Changes in the design of office buildings were evaluated by analyzing the statistical values of three design elements—building form, window systems, and U-values—for two periods: 2007–2011 (Group A) and 2015–2017 (Group B). Among the results, U-values showed the greatest variation, and WWR in relation to window systems shifted considerably. Between the two periods, building forms have become thinner and elongated due to changes in aspect ratio.
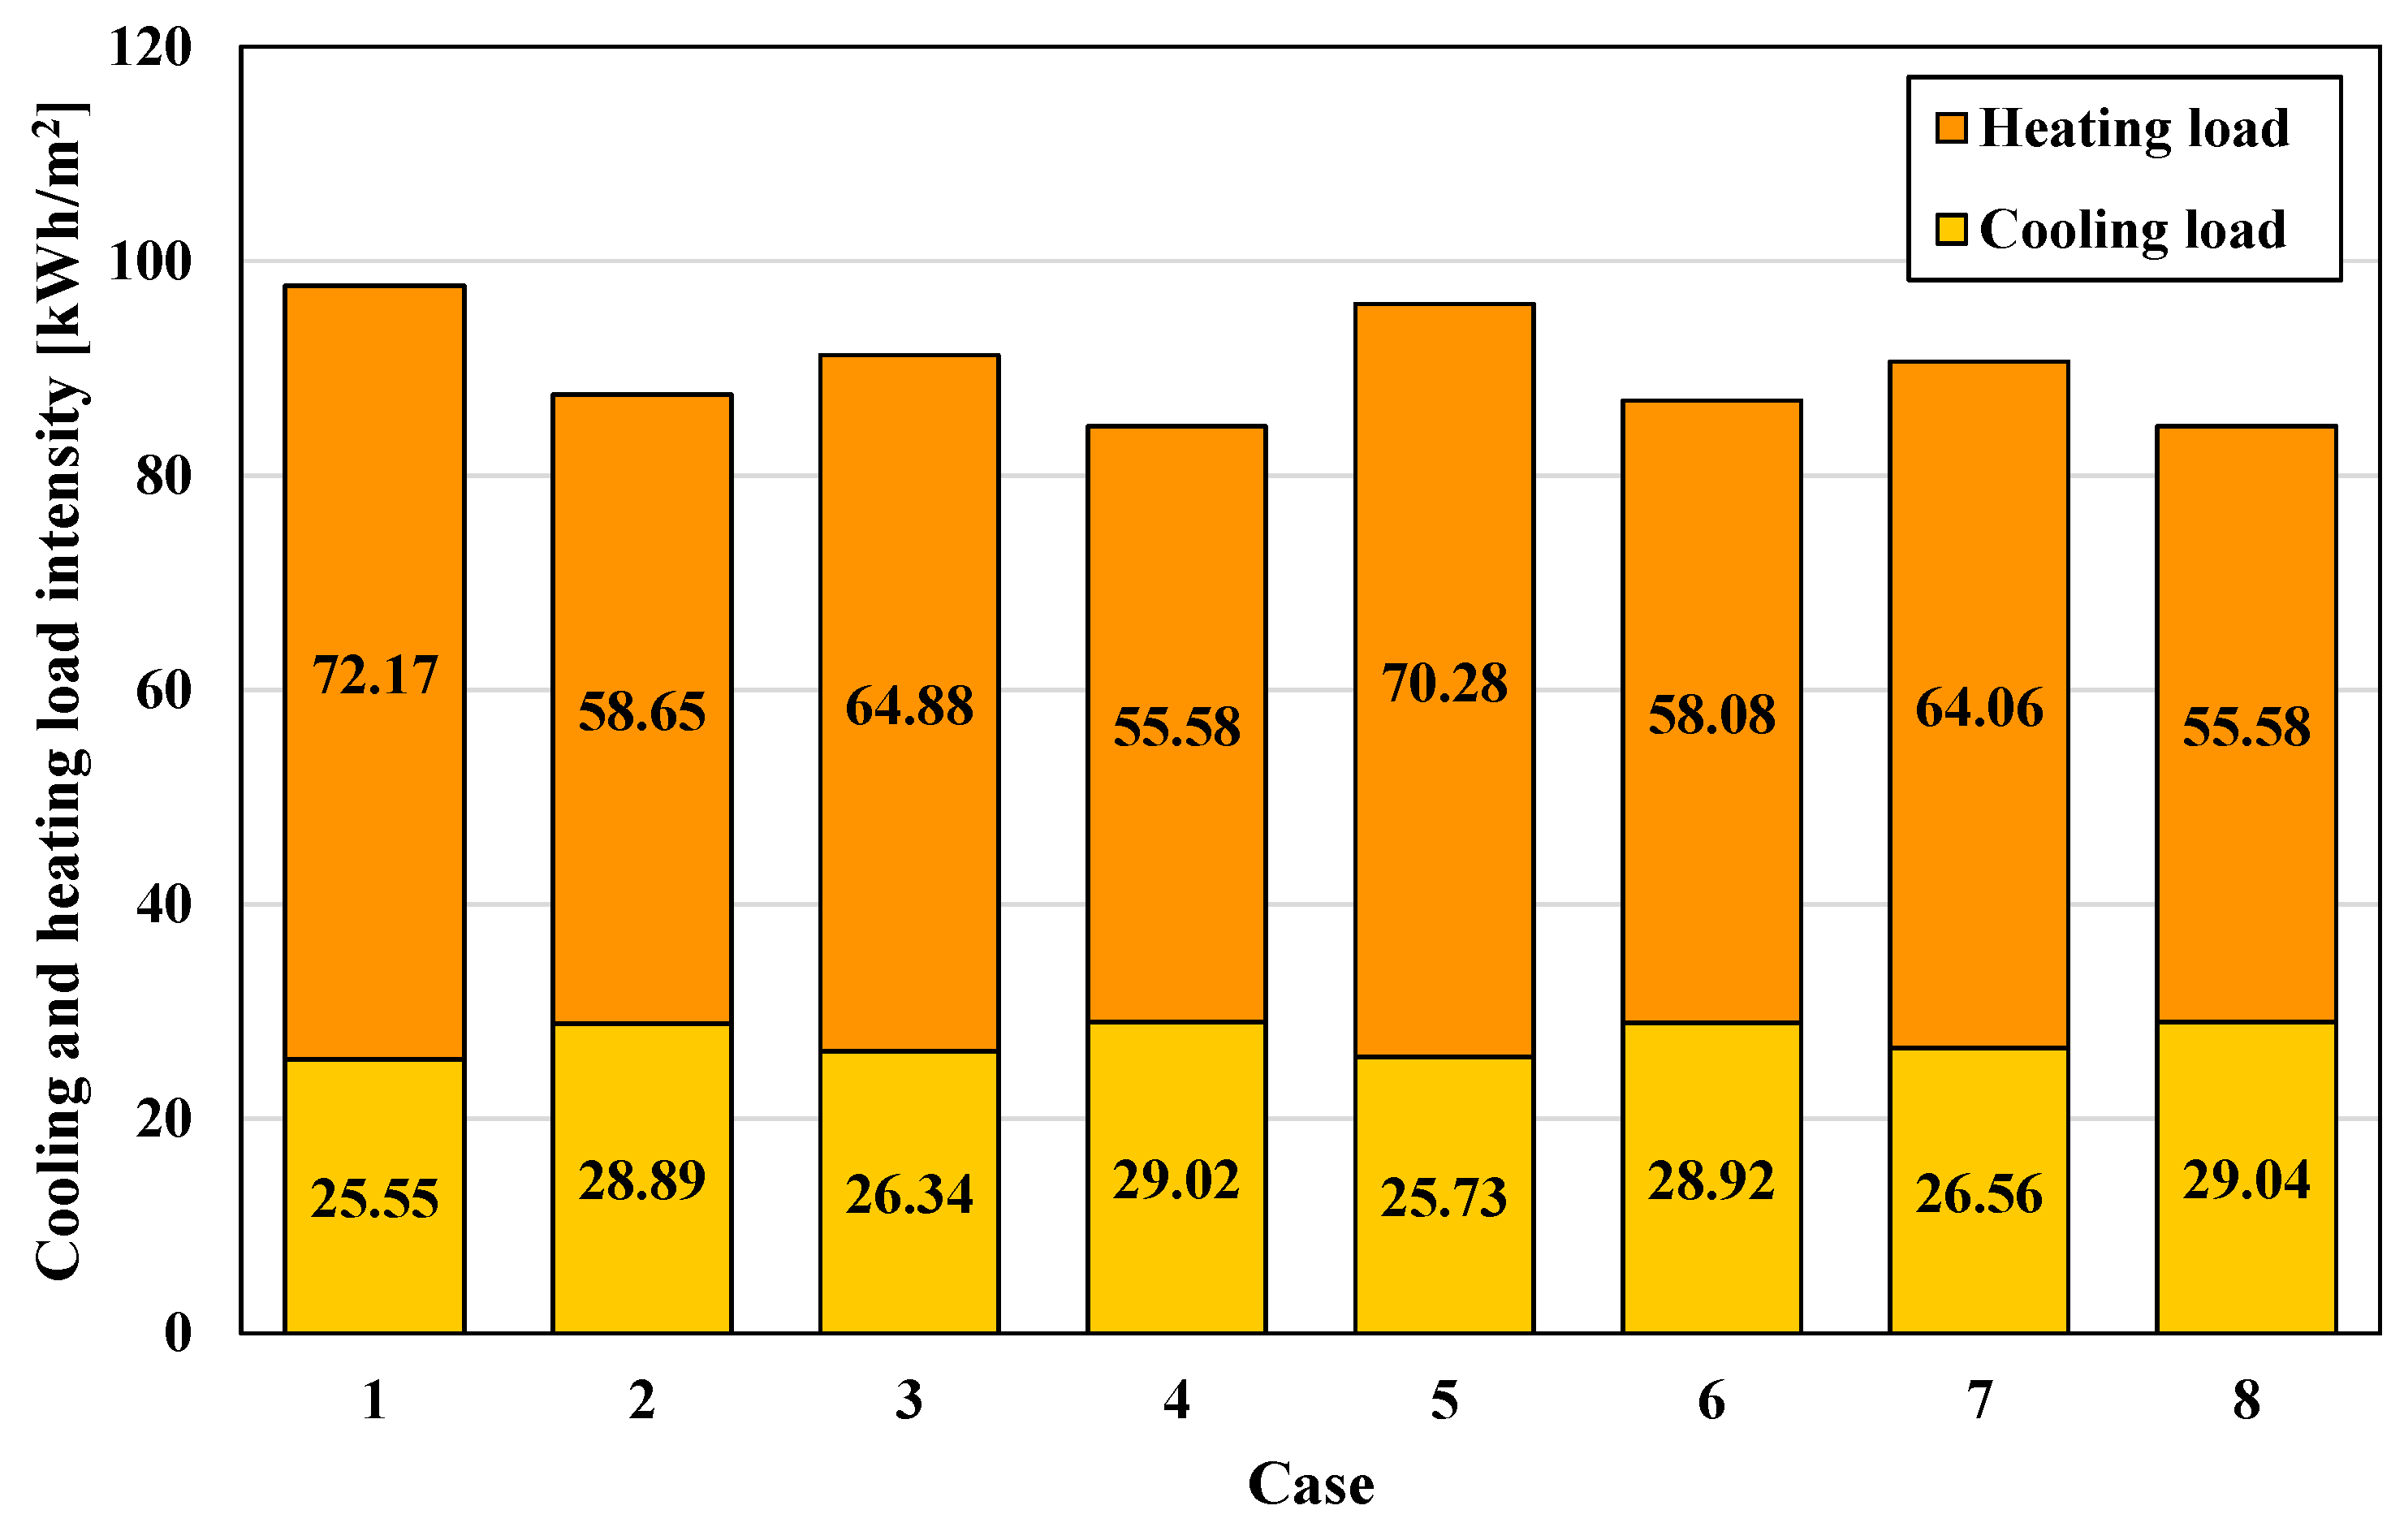
- After a reference building for each of the three elements was developed, eight case studies were performed to analyze the various effects of changes in the elements compared to the reference building (i.e., Case 1), which contained elements characteristic of older buildings (i.e., Group A). Among the results, although the cooling load increased, the total energy load decreased due to the large reduction in the heating load.
- Although total building load savings were expected to be the largest in Case 8 (i.e., reference building for Group B), the largest load savings occurred in Case 4, with a building form representing Group A but window systems and U-values representing Group B. That finding suggests new office buildings can save more energy by using up-to-date window systems and insulation (i.e., represented by U-values) but maintaining the use of conventional building forms.
- Although the South Korean government has strengthened criteria for the design of insulation in new buildings, the results of the analysis indicate that building form and window systems have changed at the same time. A 10% reduction in building load was achieved due to improved insulation, while an additional 3% reduction was achieved by implementing changes in building forms and window systems.
- With changes in the design of building envelopes, achieving a 12.8% reduction in GHG emissions in the building sector is possible.
Author Contributions
Acknowledgments
Conflicts of Interest
Abbreviations
| Nomenclature | |
| Primary energy consumption [kWh] | |
| Primary cooling energy consumption [kWh] | |
| Primary heating energy consumption [kWh] | |
| Annual building thermal load (cooling demand) [kWh] | |
| Annual building thermal load (heating demand) [kWh] | |
| System efficiency of HVAC (cooling) | |
| System efficiency of HVAC (heating) | |
| Acronyms and Abbreviations | |
| BAU | Business as usual |
| GHG | Greenhouse gas |
| HVAC | Heating, ventilation, and air conditioning |
| LEAP | Long-Range Energy Alternative Planning |
| U-value | Overall heat transfer coefficient |
References
- Kim, H.K. The Right Way to Know about Green Growth; Nanam Publishing House: Gyeonggi-Do, Korea, 2011. [Google Scholar]
- Graham, P. Sustainable Buildings and Climate Initiative. Draft Briefing on the Sustainable Building Index; UNEP SBCI: Paris, France, 2010. [Google Scholar]
- UNEP. Building and Climate Change: Summary for Decision-Makers; United Nations Environment Programme; UNEP: Nairobi, Kenya, 2009. [Google Scholar]
- Corgnati, S.P.; Fabrizio, E.; Filippi, M.; Monetti, V. Reference buildings for cost optimal analysis: Method of definition and application. Appl. Energy 2013, 102, 983–993. [Google Scholar] [CrossRef]
- Intergovernmental Panel on Climate Change. Fifth Assessment Report; Intergovernmental Panel on Climate Change: Geneva, Switzerland, 2014. [Google Scholar]
- Kim, T.H.; Jeong, Y.S. Analysis of energy-related greenhouse gas emission in the Korea’s building sector: Use national energy statistics. Energies 2018, 11, 855. [Google Scholar] [CrossRef] [Green Version]
- Intergovernmental Panel on Climate Change. Fourth Assessment Report; Intergovernmental Panel on Climate Change: Geneva, Switzerland, 2007. [Google Scholar]
- Jeong, Y.-S. Assessment of Alternative Scenarios for CO2 Reduction Potential in the Residential Building Sector. Sustainability 2017, 9, 394. [Google Scholar] [CrossRef] [Green Version]
- Korean Government. Amendment of 2030 National GHG Emissions Reduction Roadmap; Korean Government: Sejong, Korea, 2018. (In Korean)
- Cuce, E. Accurate and reliable U-value assessment of argon-filled double glazed windows: A numerical and experimental investigation. Energy Build. 2018, 171, 100–106. [Google Scholar] [CrossRef]
- EnergyPlus. Available online: https://energyplus.net/ (accessed on 13 March 2019).
- OpenStudio. Available online: https://www.openstudio.net (accessed on 13 March 2019).
- Yu, S.; Eom, J.; Evans, M.; Clarke, L. A long-term, integrated impact assessment of alternative building energy code scenarios in China. Energy Policy 2014, 67, 626–639. [Google Scholar] [CrossRef]
- Tan, X.; Lai, H.; Gu, B.; Zeng, Y.; Li, H. Carbon emission and abatement potential outlook in China’s building sector through 2050. Energy Policy 2018, 118, 429–439. [Google Scholar] [CrossRef]
- Wang, H.; Chen, W.; Shi, J. Low carbon transition of global building sector under 2- and 1.5-degree targets. Appl. Energy 2018, 222, 148–157. [Google Scholar] [CrossRef]
- Wang, T.; Foliente, G.; Song, X.; Xue, J.; Fang, D. Implications and future direction of greenhouse gas emission mitigation policies in the building sector of China. Renew. Sustain. Energy Rev. 2014, 31, 520–530. [Google Scholar] [CrossRef]
- Jeong, Y.S.; Lee, S.E.; Huh, J.H. Estimation of CO2 emission of apartment buildings due to major construction materials in the Republic of Korea. Energy Build. 2012, 49, 437–442. [Google Scholar] [CrossRef]
- Zhao, S.; Song, Q.; Duan, H.; Wen, Z.; Wang, C. Uncovering the lifecycle GHG emissions and its reduction opportunities from the urban buildings: A case study of Macau. Resour. Conserv. Recycl. 2019, 147, 214–226. [Google Scholar] [CrossRef]
- Cellura, M.; Guarino, F.; Longo, S.; Mistretta, M. Modeling the energy and environmental life cycle of buildings: A co-simulation approach. Renew. Sustain. Energy Rev. 2017, 80, 733–742. [Google Scholar] [CrossRef]
- Wang, T.; Seo, S.; Liao, P.C.; Fang, D. GHG emission reduction performance of state-of-the-art green buildings: Review of two case studies. Renew. Sustain. Energy Rev. 2016, 56, 484–493. [Google Scholar] [CrossRef]
- Chau, C.K.; Hui, W.K.; Ng, W.Y.; Powell, G. Assessment of CO2 emissions reduction in high-rise concrete office buildings using different material use options. Resour. Conserv. Recycl. 2012, 61, 22–34. [Google Scholar] [CrossRef]
- Iwaro, J.; Mwasha, A. A review of building energy regulation and policy for energy conservation in developing countries. Energy Policy 2010, 38, 7744–7755. [Google Scholar] [CrossRef]
- TABULA Project Team. Use of Building Typologies for Energy Performance Assessment of National Building Stocks. Existent Experiences in European Countries and Common Approach. First TABULA Synthesis Report; Institut Wohnen und Umwelt GmbH: Darmstadt, Germany, 2010; Available online: http://www.building-typology.eu/downloads/public/docs/report/TABULA_SR1.pdf (accessed on 8 November 2019).
- ASIEPI. Comparison of Energy Performance Requirements Levels: Possibilities and Impossibilities. Summary Report; Report of Assessment and Improvement of the EPBD Impact (ASIEPI); ASIEPI Project: Pan European, 2010; Available online: https://www.buildup.eu/sites/default/files/content/ASIEPI_Intercomparison_SummaryReport_0.pdf (accessed on 8 November 2019).
- Deru, M.; Field, K.; Studer, D.; Benne, K.; Griffith, B.; Torcellini, P.; Liu, B.; Halverson, M.; Winiarski, D.; Rosenberg, M.; et al. Department of Energy Commercial Reference Building Models of the National Building Stock; Technical Report NREL/TP-5500-46861; NREL: Golden, CO, USA, 2011. [Google Scholar]
- Kim, D.W.; Kim, Y.M.; Lee, S.H.; Park, W.Y.; Bok, Y.J.; Ha, S.K.; Lee, S.E. Development of Reference Building Energy Models for South Korea. In Proceedings of the 15th IBPSA Conference, San Francisco, CA, USA, 7–9 August 2017. [Google Scholar]
- Schaefer, A.; Ghisi, E. Method for obtaining reference buildings. Energy Build. 2016, 128, 660–672. [Google Scholar] [CrossRef]
- Brandão De Vasconcelos, A.; Pinheiro, M.D.; Manso, A.; Cabaço, A. EPBD cost-optimal methodology: Application to the thermal rehabilitation of the building envelope of a Portuguese residential reference building. Energy Build. 2016, 111, 12–25. [Google Scholar] [CrossRef]
- Bhatnagar, M.; Mathur, J.; Garg, V. Development of reference building models for India. J. Build. Eng. 2019, 21, 267–277. [Google Scholar] [CrossRef]
- Buso, T.; Corgnati, S.P. A customized modelling approach for multi-functional buildings—Application to an Italian Reference Hotel. Appl. Energy 2017, 190, 1302–1315. [Google Scholar] [CrossRef]
- Brandão de Vasconcelos, A.; Cabaço, A.; Pinheiro, M.D.; Manso, A. The impact of building orientation and discount rates on a Portuguese reference building refurbishment decision. Energy Policy 2016, 91, 329–340. [Google Scholar] [CrossRef]
- Brandão de Vasconcelos, A.; Pinheiro, M.D.; Manso, A.; Cabaço, A. A Portuguese approach to define reference buildings for cost-optimal methodologies. Appl. Energy 2015, 140, 316–328. [Google Scholar] [CrossRef]
- Li, J.; Ng, S.T.; Skitmore, M. Review of low-carbon refurbishment solutions for residential buildings with particular reference to multi-story buildings in Hong Kong. Renew. Sustain. Energy Rev. 2017, 73, 393–407. [Google Scholar] [CrossRef] [Green Version]
- Ballarini, I.; Corgnati, S.P.; Corrado, V. Use of reference buildings to assess the energy saving potentials of the residential building stock: The experience of TABULA project. Energy Policy 2014, 68, 273–284. [Google Scholar] [CrossRef]
- Shabunko, V.; Lim, C.M.; Mathew, S. EnergyPlus models for the benchmarking of residential buildings in Brunei Darussalam. Energy Build. 2018, 169, 507–516. [Google Scholar] [CrossRef]
- Dino, I.G.; Stouffs, R. Evaluation of reference modeling for building performance assessment. Autom. Constr. 2014, 40, 44–59. [Google Scholar] [CrossRef]
- Chen, Y.; Hong, T. Impacts of building geometry modeling methods on the simulation results of urban building energy models. Appl. Energy 2018, 215, 717–735. [Google Scholar] [CrossRef] [Green Version]
- Chen, Y.; Hong, T.; Luo, X.; Hooper, B. Development of city buildings dataset for urban building energy modeling. Energy Build. 2019, 183, 252–265. [Google Scholar] [CrossRef] [Green Version]
- Kazas, G.; Fabrizio, E.; Perino, M. Energy demand profile generation with detailed time resolution at an urban district scale: A reference building approach and case study. Appl. Energy 2017, 193, 243–262. [Google Scholar] [CrossRef]
- Korean Government. 2020 National GHG Emissions Reduction Roadmap; Korean Government: Sejong, Korea, 2014. (In Korean)
- Korean Government. Greenhouse Gas Reduction Targets by Sectors and Years; Korean Government: Seoul, Korea, 2011. (In Korean)
- Korean Government. The National Roadmap to Achieve the National Greenhouse Gas Emissions Reduction Target. Available online: http://me.go.kr/home/web/board/read.do?pagerOffset=0&maxPageItems=10&maxIndexPages=10&searchKey=&searchValue=&menuId=286&orgCd=&boardId=339265&boardMasterId=1&boardCategoryId=&decorator= (accessed on 8 November 2019). (In Korean)
- Arıcı, M.; Kan, M. An investigation of flow and conjugate heat transfer in multiple pane windows with respect to gap width, emissivity and gas filling. Renew. Energy 2015, 75, 249–256. [Google Scholar] [CrossRef]
- Muneer, T.; Han, B. Simplified analysis for free convection in enclosures—Application to an industrial problem. Energy Convers. Manag. 1996, 37, 1463–1467. [Google Scholar] [CrossRef]
- U.S. Department of Energy. EnergyPlus Version 8.9.0 Documentation, Input Output Reference; U.S. Department of Energy: Washington, DC, USA, 2018. Available online: https://energyplus.net/sites/all/modules/custom/nrel_custom/pdfs/pdfs_v8.9.0/InputOutputReference.pdf (accessed on 8 November 2019).
- U.S. Department of Energy. EnergyPlus, Input Output Reference. The Encyclopedic Reference to EnergyPlus Input and Output; U.S. Department of Energy: Washington, DC, USA, 2018. Available online: https://energyplus.net/sites/default/files/pdfs/pdfs_v8.3.0/InputOutputReference.pdf (accessed on 8 November 2019).
- Al-janabi, A.; Kavgic, M.; Mohammadzadeh, A.; Azzouz, A. Comparison of EnergyPlus and IES to model a complex university building using three scenarios: Free-floating, ideal air load system, and detailed. J. Build. Eng. 2019, 22, 262–280. [Google Scholar] [CrossRef]
- International Energy Agency. Energy Policies of IEA Countries: Republic of Korea 2012 Review; International Energy Agency: Paris, France, 2012. [Google Scholar]
- Cho, J.; Kim, J.; Lee, S.; Koo, J. A bi-directional systematic design approach to energy optimization for energy-efficient buildings. Energy Build. 2016, 120, 135–144. [Google Scholar] [CrossRef]
- Carli, R.; Dotoli, M. Decentralized control for residential energy management of a smart users’ microgrid with renewable energy exchange. IEEE/CAA J. Autom. Sin. 2019, 6, 641–656. [Google Scholar] [CrossRef]
- Giordano, A.; Mastroianni, C.; Menniti, D.; Pinnarelli, A.; Scarcello, L.; Sorrentino, N. A Two-Stage Approach for Efficient Power Sharing Within Energy Districts. IEEE Trans. Syst. Man Cybern. Syst. 2019, 1–11. [Google Scholar] [CrossRef]
- Hosseini, S.M.; Carli, R.; Dotoli, M. Robust Day-Ahead Energy Scheduling of a Smart Residential User Under Uncertainty. In Proceedings of the 2019 18th European Control Conference (ECC), Naples, Italy, 25–28 June 2019; pp. 935–940. [Google Scholar]
- Parra, D.; Swierczynski, M.; Stroe, D.I.; Norman, S.A.; Abdon, A.; Worlitschek, J.; O’Doherty, T.; Rodrigues, L.; Gillott, M.; Zhang, X.; et al. An interdisciplinary review of energy storage for communities: Challenges and perspectives. Renew. Sustain. Energy Rev. 2017, 79, 730–749. [Google Scholar] [CrossRef]
- Murphy, A.R.; Fung, A.S. Techno-economic study of an energy sharing network comprised of a data centre and multi-unit residential buildings for cold climate. Energy Build. 2019, 186, 261–275. [Google Scholar] [CrossRef]
- Roberts, M.B.; Bruce, A.; Macgill, I. Impact of shared battery energy storage systems on photovoltaic self- consumption and electricity bills in apartment buildings. Appl. Energy 2019, 245, 78–95. [Google Scholar] [CrossRef]
- Quddus, A.; Shahvari, O.; Marufuzzaman, M.; Usher, J.M.; Jaradat, R. A collaborative energy sharing optimization model among electric vehicle charging stations, commercial buildings, and power grid. Appl. Energy 2018, 229, 841–857. [Google Scholar] [CrossRef]
- Vares, S.; Häkkinen, T.; Ketomäki, J.; Shemeikka, J.; Jung, N. Impact of renewable energy technologies on the embodied and operational GHG emissions of a nearly zero energy building. J. Build. Eng. 2019, 22, 439–450. [Google Scholar] [CrossRef]
- Shin, M.S.; Rhee, K.-N.; Lee, E.-T.; Jung, G.-J. Performance evaluation of CO2-based ventilation control to reduce CO2 concentration and condensation risk in residential buildings. Build. Environ. 2018, 142, 451–463. [Google Scholar] [CrossRef]
- Park, S.; Koo, S.Y.; Lim, J.H.; Seong, Y.B.; Song, S.Y. Condensation Resistance Evaluation of a Double-sliding Window System for Apartment Buildings. Procedia Eng. 2016, 146, 60–68. [Google Scholar] [CrossRef]
- Cho, S. Analysis of the performance of vacuum glazing in office buildings in Korea: Simulation and experimental studies. Sustainability 2017, 9, 936. [Google Scholar] [CrossRef] [Green Version]
- Koo, B.; Lee, K.; An, Y.; Lee, K. Solar heat gain reduction of ventilated double skin windows without a shading device. Sustainability 2018, 10, 64. [Google Scholar] [CrossRef] [Green Version]


| Sector | 2020 BAU (Million Ton CO2eq) | Reduction Target for 2020 (Million Ton CO2eq) | ||
|---|---|---|---|---|
| Reduction | Targeted Emission | Rate of Reduction (%) | ||
| Residential | 81.2 | 21.9 | 59.2 | 27.0 |
| Commercial | 86.4 | 23.1 | 63.4 | 26.7 |
| Total | 167.6 | 45.0 | 122.6 | 26.9 |
| Roadmap | 2030 BAU (Million Ton CO2eq) | Building sector (Million Ton CO2eq) | ||
|---|---|---|---|---|
| Reduction | Targeted Emission | Rate of Reduction (%) | ||
| 2016 Roadmap (i.e., pre-amendment) | 197.2 | 35.8 | 161.4 | 18.1 |
| 2018 Roadmap (i.e., post-amendment) | 64.5 | 132.7 | 32.7 | |
| Categories | Group A | Group B | |
|---|---|---|---|
| Building form | Total floor area (m2) | 27,679 | 22,823 |
| Aspect ratio | 2.17:1 | 2.43:1 | |
| Number of stories (above ground) | 10 | 12 | |
| Number of stories (below ground) | 2 | 2 | |
| Floor height (m) | 4.0 | 3.9 | |
| Window systems | WWR (%) | 45 | 27 |
| Window filling gas | Air | Argon 1 | |
| U-values | Exterior wall (W/m2∙K) | 0.393 | 0.240 |
| Roof (W/m2∙K) | 0.215 | 0.138 | |
| Lowest floor (W/m2∙K) | 0.311 | 0.193 | |
| Window (W/m2∙K) | 2.478 | 1.403 | |
| Categories | Building Form | Window Systems | U-Values |
|---|---|---|---|
| Case 1 (reference building of Group A) | Group A | Group A | Group A |
| Case 2 | Group A | Group A | Group B |
| Case 3 | Group A | Group B | Group A |
| Case 4 | Group A | Group B | Group B |
| Case 5 | Group B | Group A | Group A |
| Case 6 | Group B | Group A | Group B |
| Case 7 | Group B | Group B | Group A |
| Case 8 (reference building of Group B) | Group B | Group B | Group B |
| Division | Comparison | Building Load Variation (kWh/m2) | |||
|---|---|---|---|---|---|
| Cooling | Heating | Total | |||
| ① | Building form (F) | Case 1 vs. Case 5 | 0.18 | −1.89 | −1.71 |
| ② | Window system (W) | Case 1 vs. Case 3 | 64.5 | 132.7 | 32.7 |
| ③ | U-value (U) | Case 1 vs. Case 2 | 3.34 | −13.52 | −10.18 |
| ④ | F & W | Case 1 vs. Case 7 | 1.01 | −8.11 | −7.10 |
| ④′ | (① + ②) | 0.97 | −9.18 | −8.21 | |
| ⑤ | W & U | Case 1 vs. Case 4 | 3.47 | −16.59 | −13.12 |
| ⑤′ | (② + ③) | 4.13 | −20.81 | −16.68 | |
| ⑥ | F & U | Case 1 vs. Case 6 | 3.37 | −14.09 | −11.89 |
| ⑥′ | (① + ③) | 3.52 | −15.41 | −11.89 | |
| ⑦ | Group B | Case 1 vs. Case 8 | 3.49 | −16.59 | −13.10 |
| ⑦′ | (① + ② + ③) | 4.31 | −22.70 | −18.39 | |
| Division | Year-to-Year Rates of Reduction (%) | |||
|---|---|---|---|---|
| 2015 | 2016 | 2017 | Mean | |
| National | 10.0 | 13.8 | 16.2 | 13.3 |
| Building sector | 8.9 | 13.3 | 16.2 | 12.8 |
© 2019 by the authors. Licensee MDPI, Basel, Switzerland. This article is an open access article distributed under the terms and conditions of the Creative Commons Attribution (CC BY) license (http://creativecommons.org/licenses/by/4.0/).
Share and Cite
Kwak, Y.; Kang, J.-A.; Huh, J.-H.; Kim, T.-H.; Jeong, Y.-S. An Analysis of the Effectiveness of Greenhouse Gas Reduction Policy for Office Building Design in South Korea. Sustainability 2019, 11, 7172. https://0-doi-org.brum.beds.ac.uk/10.3390/su11247172
Kwak Y, Kang J-A, Huh J-H, Kim T-H, Jeong Y-S. An Analysis of the Effectiveness of Greenhouse Gas Reduction Policy for Office Building Design in South Korea. Sustainability. 2019; 11(24):7172. https://0-doi-org.brum.beds.ac.uk/10.3390/su11247172
Chicago/Turabian StyleKwak, Younghoon, Jeong-A Kang, Jung-Ho Huh, Tae-Hyoung Kim, and Young-Sun Jeong. 2019. "An Analysis of the Effectiveness of Greenhouse Gas Reduction Policy for Office Building Design in South Korea" Sustainability 11, no. 24: 7172. https://0-doi-org.brum.beds.ac.uk/10.3390/su11247172