Magnitude, Causes, and Solutions of the Performance Gap of Buildings: A Review
by
Xing Shi
1,2,*, 
Binghui Si
1,2,
Jiangshan Zhao
1,2,
Zhichao Tian
1,2,
Chao Wang
1,2,
Xing Jin
1,2 and
Xin Zhou
1,2 1
Key Laboratory of Urban and Architectural Heritage Conservation, Ministry of Education, Nanjing 210096, China
2
School of Architecture, Southeast University, Nanjing 210096, China
*
Author to whom correspondence should be addressed.
Sustainability 2019, 11(3), 937; https://0-doi-org.brum.beds.ac.uk/10.3390/su11030937
Submission received: 26 December 2018
/
Revised: 14 January 2019
/
Accepted: 31 January 2019
/
Published: 12 February 2019
(This article belongs to the Section Energy Sustainability)
Abstract
:The performance gap of buildings is commonly defined as the difference between the performance value predicted in the design stage and that measured in the post-occupancy stage. Knowledge about the performance gap of buildings is valuable in many aspects and thus is a research subject drawing much attention. Important questions that should be asked include: (1) Definition: what is the performance gap of buildings? (2) Magnitude: how large is the performance gap of buildings? (3) Techniques: how to determine the performance gap of buildings? (4) Causes: what are the reasons leading to the performance gap of buildings? (5) Solutions: how to bridge the performance gap of buildings. By collecting and analyzing more than 20 published works with reported data on the performance gap of buildings and other research articles, these important questions are addressed. Through this review state-of-the-art knowledge regarding the performance gap of buildings is presented. Major conclusions are drawn and future research directions are pointed out.
1. Introduction
To deal with the challenges of energy shortages and environmental crises, sustainability is considered by many industries as the leading philosophy for development. In the building sector, designing, constructing, and operating green buildings is a widely accepted path to sustainability. This trend is confirmed by the development and implementation of green building standards in many countries, examples being LEED in the US [1], BREEAM in the UK [2], the Green Building Label in China [3], and CASBEE in Japan [4].
Although the general framework and specific technical contents of these green building standards are different, they share one commonality, that is, they all put an emphasis on the quantifiable performance of buildings. In fact, the objective of delivering a green building can only be achieved by ensuring that various performance issues of the building meet a set of predefined requirements. Therefore, a green building is, to a large extent, a performance based building.
The performance of green buildings is a critical issue in both the design and occupation stage. In the design stage, the performance of green buildings can be predicted through theoretical calculation or experimental testing. In the occupation stage, it can be physically measured or investigated through other means such as occupant surveying. The difference between the performance predicted in the design stage and that measured in the occupation stage is commonly referred to as ‘the performance gap’. Note that the concept of the performance gap can be interpreted differently as discussed later in this paper [5].
The performance gap of green buildings and buildings in general has been extensively studied for well over two decades. Large scale research efforts focusing on the building performance gap are often inter-connected with other research subjects such as post-occupancy evaluation. Typical examples include the PROBE project conducted in the UK in the 1990s [6,7,8,9,10] and a series of research projects attempting to assess and benchmark the performance of LEED certified buildings [11,12,13,14,15,16,17] and buildings obtaining other green building certifications [18,19,20].
To address the issue of the performance gap of green buildings, five fundamental questions need to be answered: (1) How to define the performance gap? (2) How large is the performance gap? (3) How to determine the magnitude of the performance gap? (4) What are the causes leading to the performance gap? (5) How to bridge the performance gap? Most of the research works covered in this review attempt to answer one or more of these questions.
The knowledge on the performance gap of buildings is valuable in many aspects. First and foremost, it sheds light on the performance difference between design and as-built. It reminds us that a building is a complex system and often performs differently from its design intentions. In fact, it is impossible to have a building which performs, in every aspect, exactly the same as it is designed. This can be considered a basic law to govern the performance of buildings. Secondly, the knowledge on the performance gap of buildings helps facility managers or other stake-holders to better operate a building. A variety of factors can cause a building to deviate from its designed and intended performance. Problematic operation of the building is often one of them. Detailed information on what goes wrong can greatly help facility managers to diagnose the situation and develop better operational plans for the building. Last but not least, the knowledge on the performance gap of buildings serves as invaluable feedback to architects, engineers, consultants, and other building professionals on what can be done to improve design. When a building does not perform the same as it is designed, the construction and operation sides are usually considered faulty. However, this is a misunderstanding that should be corrected. The root causes of the performance gap can occur in design as often as they do in construction and operation. Therefore, bridging the performance gap of buildings requires a collective effort from all professionals involved in a building project, including architects, engineers, consultants, clients, builders, facility managers, etc.
2. Previous Reviews
There is a substantial body of research works that focus on or partially deal with the performance gap of buildings. However, reviews dedicated to this subject are rare. Wilde [5] conducted a literature review on the performance gap of buildings and identified three types of gaps. A pilot study was presented to investigate the performance gap. Some critical issues regarding the performance gap that warranted future study were addressed. The review concluded that the only way to bridge the building performance gap was to adopt a broad and coordinated approach. This approach should combine model validation and verification, improved data collection for predictions, better forecasting, and change of industry practice.
Although reviews focusing on the performance gap of buildings are rare, some reviews on other subjects are worth noting. These subjects include building energy metering and environmental monitoring [21], occupant behavior [22,23,24], building energy model verification and benchmarking [25,26], post-occupancy evaluation [27,28], etc. Readers are encouraged to explore these review works to gain important knowledge related to the performance gap of buildings.
Apparently the performance gap of buildings is a critical matter in the field of green buildings and therefore, should be carefully reviewed. This paper conducts a systematic review to address the five fundamental and important questions regarding the building performance gap, namely definition, magnitude, causes, determination, and bridging solutions. The knowledge presented is valuable to owners, designers, engineers, consultants, and policy makers when they need to understand, evaluate, and/or reduce the building performance gap.
The outline of this review is as follows. Section 3 discusses various definitions of the performance gap of buildings and confirms that the building energy performance gap is by far the most commonly studied performance gap issue and, therefore, should be the focus of this review. Section 4 summarizes the reported numbers from more than 20 research works to gain an understanding of the magnitude of the building energy performance gap. In Section 5, techniques to quantify the building energy performance gap in both the design stage and the operation stage are analyzed. Section 6 focuses on the causes leading to the building energy performance gap. Solutions for how to bridge the building energy performance gap are presented in Section 7 before Section 8 concludes the paper. The core literature reviewed, excluding those intended to offer some background information, is summarized in Table 1. They are grouped by the sections in which they appear.
3. Definition: What is the Performance Gap of Buildings?
3.1. The Performance
In accordance with the Merriam-Webster dictionary, performance means ‘the ability to perform’, similar in meaning to efficiency. In the context of buildings, performance can be used in a broad way to represent a variety of qualities or properties such as energy efficiency, thermal comfort, indoor air quality, acoustical environment, daylight level, etc. Among these performance aspects, the building industry and research presently focus on the energy performance; this might be due to the fact that energy metering is more prevalent and easier to implement than measurement of the other aspects [5]. Research works that study the non-energy performance gap can also be found, examples being the ventilation performance gap [29] and the building envelope performance gap [30]. This review focuses on the energy performance gap of buildings without losing sight of other non-energy performance gaps.
3.2. The Gap
It is universally accepted that ‘gap’ means ‘difference’ or ‘discrepancy’. The question usually arises when it comes to deciding what performance indices should be used to evaluate the gap. The most common definition of the performance gap refers to the difference or discrepancy between predicted (or calculated, anticipated, designed, etc.) and measured (or actual, real, achieved, etc.) performance [5,31,32,33,34,35,36]. However, the concept of the performance gap can be understood and interpreted more broadly. Wilde [5] pointed out that the discussion about the performance gap is complicated because of various approaches to both prediction and measurement and building regulations. Three types of the performance gap can be identified. The first type aligns with the most common understanding of the performance gap as mentioned above, i.e., the difference between the predicted and the measured building performance. The second type is the difference between the performance obtained by developing a correlation between input parameters and output parameters without explicitly modeling the physical processes and that obtained through measurement. The third type deviates from the common definition even further. It is defined as the difference between the predicted performance in accordance with the regulations and the public displayed performance. These three different definitions indicate that the performance gap is certainly a complicated issue in design, engineering, and research. In the later sections of this review, unless noted otherwise, the most common definition of the performance gap, i.e., the disparity between the predicted and the measured performance, is used.
3.3. Other Issues About the Definition
Even when the meanings of the two keywords, i.e., ‘performance’ and ‘gap’, are defined without any ambiguity, other issues can still exist and should be clarified. For instance, the building energy performance gap is defined as the difference between the predicted energy consumption and the actual energy consumption. This definition appears to be clear and complete. However, one can still argue about what the energy consumption includes or excludes. Does the energy consumption include all of the energy uses in the building or only the portion used for space conditioning? Another example is that both the percentage and the absolute value of the differential can be used to quantify the gap. Therefore, it is imperative to clearly define, without any ambiguity, what the performance gap means in a reported study to avoid confusion. One important advantage of doing so is to make the comparison of the performance gap across different studies possible, which is one of the problems in the field as discussed later.
An interesting term called ‘policy gap’ is given by Burman et al. [37] and is relevant to the building energy performance gap to some extent. It refers to a structural barrier related to policy making in the context of building energy regulations.
4. Magnitude: How Large is the Performance Gap of Buildings?
The first question regarding the performance gap of buildings is its magnitude, i.e., how large is the performance gap. Although this is the most fundamental question, no clear or definitive answer can be offered. By examining relevant literature, one conclusion can be reached, that is, the performance gap of buildings is real and can be significant. The following section summarizes the reported magnitudes of the building energy performance gap gathered from 22 research works published. For comparative purposes, the gap is presented as the ratio between the calculated and the measured energy consumption. In the cases where the original magnitudes of the gap are reported in different terms or implicitly, necessary conversions are made.
Fokaides et al. [36] presented a comparison between the measured and the calculated energy performance of dwellings in Cyprus with a summer dominant climate. A total of 10 dwellings were examined. On average, the ratio between the calculated and the measured total energy consumption was 2.5. In an extreme case, the ratio was as large as 4, which indicated that the predicted energy consumption was three times larger than the actual energy consumption. Magalhães and Leal [38] used a performance database and the national energy statistics to analyze the heating gap of the residential building stock in Portugal. For space heating, the nominal heating need was 22.1 times the actual heating energy consumption. For space cooling, it was 38.3 times. Therefore, the authors stated that the differences found were tremendous, much beyond what could be explained only by the lack of precision of the calculation procedure of the energy performance assessment or from the assumptions in the top-down breakdown of the national energy balance data. Note that these two numbers are significantly higher than all other reported gap values. It might be caused by the fact that the national level statistics, not the actual energy data measured from one or multiple buildings, are used in calculation. Hens et al. [39] studied two residential projects in Belgium. For the first residential project with eight dwellings, the ratio between the calculated and the measured energy consumption was 1.79. For the second residential project with 12 dwellings, the ratio was 2.03. Fedoruk et al. [40] selected a high-profile green building, namely the Center for Interactive Research on Sustainability at the University of British Columbia in Vancouver, Canada, and compared its anticipated and achieved energy performance. The comparison suggests that for this particular building the ratio between the calculated and measured electricity consumption was 0.78. Marjanovic-Halburd et al. [41] studied a 1280 m2 university office building in the UK and used two different approaches to calculate its total energy consumption (electricity and gas), namely the SBEM (Simplified Building Energy Model) method and detailed simulation. The ratio between the calculated energy consumption obtained by using the SBEM method and the measured energy consumption was 0.83. If a detailed simulation was conducted, the ratio would become 0.70. Tronchin and Fabbri [42] tested 10 different energy calculation methods on an existing residential building located in Ravenna, Italy, near the Adriatic Sea and compared the results with the energy bills. The ratio between the calculated energy consumption and the energy bills varied between 1 and 2.42, depending on the calculation method used. Herrando et al. [34] studied 15 academic buildings and six research buildings in Spain, among which only one did not have utility bills. These buildings are significantly different, with useful areas ranging from 800 to 27,600 m2. According to the reported data, the ratio between the calculated energy consumption and the measured energy consumption varied from 0.62 to 1.52 for the 14 academic buildings and from 0.27 to 0.8 for the six research buildings. Stoppel and Leite [43] examined two LEED gold certified dormitory buildings and compared their predicted and actual energy consumption. The ratio between the predicted and actual energy consumption was 1.9 for one dormitory building and 2.12 for the other. Menezes et al. [31] studied a high-density office building and used five predictive models with different levels of details to obtain the energy consumption by lighting, small powers, and catering. The results indicate that in model 1 the predicted electricity consumption was less than 1/3 of the actual consumption and that in model 5 the difference was only 3%. If these numbers are converted to the ratio between the predicted and measured energy consumption, the values range from 0.33 to approximately 1.0. Wilde [5] selected the Roland Levinsky Building at Plymouth University in the UK to explore the feasibility of investigating and quantifying the performance gap while taking into account the uncertainties in both prediction and measurement. The ratio between the predicted and measured energy consumption was found to be 0.39. Calì et al. [32] selected three refurbished apartment buildings located in southern Germany and monitored their energy performance from 2009 through 2015. The ratio between the predicted and measured heating energy consumption ranged from 0.26 to 1.14. On average, the ratios were 0.46, 0.48, 0.71, and 0.63 in 2011, 2012, 2013, and 2014, respectively. Petersen and Hviid [33] studied a 5147 m2 office building in Kolding, Denmark and calculated the expected energy consumption in accordance with the Danish national calculation method. The ratio between the calculated and actual total energy consumption was 0.65. Pegg et al. [44] investigated five ‘low-energy’ schools in the UK to understand their post-occupancy performance. Three of the five school buildings had both calculated and monitored energy consumption data. The ratios between the calculated and actual energy consumption were 0.44, 0.35, and 0.42, respectively. The UCL (University College London) Energy Institute of the UK [45] conducted a number of audits on buildings to examine issues such as the performance gap between design predictions and operational performance. The data suggested that for office buildings the ratio between the calculated and measured total electricity was 1.71. Note that this ratio was the mean value obtained from the data of more than 200 office buildings. Turner and Frankel [12] analyzed measured energy performance for 121 LEED New Construction buildings of various types such as office, school, library, data center, etc. The ratio between the calculated and measured EUI (Energy Use Intensity) varied between approximately 0.35 and 4.0. The Green Construction Board and Buildings Working Group of Arup [46] issued a report in which a case study of an office building was presented. The reported ratio between the calculated and measured electricity was 0.59. Galvin [47] studied thermal retrofits of existing homes and presented data for three case buildings in Germany. The ratios between the calculated and actual energy consumption were 0.98, 0.64, and 0.27, respectively. Binks [48] compared the predicted HVAC energy consumption with the actual measurement of a 30,000 m2 office tower in Australia and found that the ratio between them was 0.82. Salehi et al. [49] created a design model and an as-built model to predict the energy consumption of a multi-purpose university building located at the Vancouver campus of the University of British Columbia, Canada. For the design model, the ratio between the predicted and the actual energy consumption was 0.6 and for the as-built model the ratio was 0.54. Gupta and Kapsali [50] evaluated the as-built performance of an eco-housing development in the UK and found that the actual annual electricity energy use exceeded the prediction by a factor of about 1.8 in both houses, which was approximately equivalent to a ratio between the predicted and actual energy consumption of 0.56. Burman et al. [37] calculated and measured the energy performance of a secondary school building in North West England and reported the equivalent CO2 emission data, which was converted to a ratio between the calculated and actual energy consumption of 0.29. Ballarini and Corrado [51] reported the calculated and measured energy consumption of six buildings in Italy. The ratio varied between 0.93 to 1.36. The 22 reviewed works with reported numbers of the building energy performance gap are summarized in Table 2. In addition to the magnitudes of the reported gap, the period in which the gap was investigated and the energy items considered are also presented in the table. Note that almost all of the reported gaps were measured on a yearly basis. However, the energy items considered were much less consistent. Heating and cooling electricity was the most common energy item considered. Others were domestic hot water gas, lighting, fan electricity, pump electricity, and plug loads.
It is evident that the magnitude of the building energy performance gap found in published research works varies significantly. No reliable correlations can be established between the magnitude of the gap and some common parameters such as building type, climate, floor area, etc. However, some valuable observations and conclusions can still be made as follows.
- Regardless of the building type, location, climate, or the method of design and construction, the existence of the building energy performance gap is factual and cannot be denied.
- One of the possible reasons why the magnitude of the building energy performance gap varies significantly is that it is interpreted and reported in different ways. Although most research works reviewed consider the difference between the predicted and measured energy performance values as the gap, they quantify it differently. Some research works use the measured energy performance value as the baseline and quantify the gap as the percentage difference of the predicted value against the baseline. Others adopt an exactly opposite approach, i.e., use the predicted energy performance value as the baseline and quantify the measured value against it. Instead of using percentage differentials, the absolute difference between the predicted and measured energy performance values is also used to quantify the gap. Therefore, adopting a uniform and standardized way to quantify and present the performance gap of buildings would be beneficial to having a more convenient and revealing comparison among different research works.
- One fundamental question regarding the magnitude of the building energy performance gap is whether the measured energy consumption or the predicted energy consumption is larger. Unfortunately, no definite answer can be given with a satisfactory level of confidence based on the reported numbers in the reviewed literature. Among the 21 works that explicitly report the building energy performance gap, five of them report larger predicted energy consumption and 12 larger measured energy consumption. Four of the works report mixed results, i.e., in some cases the predicted energy consumption is larger and in other cases it is the other way around. Figure 1 illustrates the ratios between the predicted energy consumption and the measured energy consumption from the 21 sources. Note that the reported numbers by Burman et al. [37] are not included because they are obtained using national level statistics and do not reflect the energy performance of any individual building. In addition, the ratios are larger than 20 and would skew the figure significantly.
5. Techniques: How to Determine the Performance Gap of Buildings?
Since the building energy performance gap is defined as the difference between the predicted and actual energy performance, its determination requires the knowledge of the energy performance values on both sides, namely the design side and the operation side. Various techniques are available to obtain the predicted and actual energy performance values.
On the design side, the building energy consumption is obtained through calculation. The techniques differ in calculation methods, simulation tools, and theoretical models used. They can be broadly categorized into two groups, namely the simplified approach and the detailed simulation approach.
The simplified approach involves using simplified calculation methods to determine the energy consumption of the target building [31,32,33,36,38,39,41,42,44,45,49,50]. These simplified calculation methods can usually be solved by hand, using a spreadsheet, or by a simple computer program. They are often recommended in building codes or by influential organizations, examples being SBEM (Simplified Building Energy Model) [36,41,45] developed by the Building Research Establishment and based on the CEN standard umbrella document CEN/TR 15615:2008 [52], the monthly balance procedure [32] proposed in the German standard [53], the standard rating calculation [50] per EN ISO 13790:2008 [54], and the procedure [44] outlined in CIBSE [55].
The detailed simulation approach involves calculating the energy consumption of the target building using one of the many dynamic building energy simulation programs such as EnergyPlus [5,35,42] developed by the DOE [34,46]. Note that some research works reviewed report that the energy consumption of the target building was obtained through simulation without specifying what simulation program was used [12,40,43]. Compared with the simplified approach, the detailed simulation approach is generally believed to produce more accurate results because it uses sophisticated, and often dynamic, calculation models. However, no evidence is found from this literature review to support the notion that adopting the detailed simulation approach helps to bring the predicted energy performance closer to the actual value, i.e., decrease the building energy performance gap.
On the operational end, the actual energy performance of buildings is obtained by taking physical measurements [5,31,32,33,36,40,46,47], or by having access to utility bills [12,34,42], or both [44]. The energy consumption actually measured includes different components. The total electricity and gas consumption was the most commonly measured energy component [5,32,34,40,41,42,43,44,46,50]. In some cases, only the electricity consumption dominated by space conditioning, i.e., heating and/or cooling, was measured [36,38,46]. Few studies focused on the non-space-conditioning electricity consumption such as lighting, plug-in loads, and catering [31]. Other energy consumption components such as district heating were measured as well [33]. Most of the reviewed works on the performance gap do not discuss the measurement techniques or metering systems in detail. It is beyond the scope of this review to include an in-depth discussion on those matters. Nevertheless, the knowledge on sensors, meters, and data exchange protocols is important for understanding the measured performance of buildings. Therefore, readers are directed to a review conducted by Ahmad et al. [21] for more information on the state-of-the-art building energy metering and environmental monitoring methods.
One line of research works that is different from but related to the quantification of the building energy performance gap is the study of benchmarking or calibrating building energy models. Although they are both concerned with the disparity between the predicted and actual building energy performance, their research objectives are different. For the research on the building energy performance gap, the primary objectives are to understand the gap, including its magnitude, pattern, and causes, and to develop means to reduce it. For the research on benchmarking or calibrating building energy models, the primary objective is to increase the accuracy and reliability of the models. Therefore, it uses the actual energy performance as the benchmark. In other words, improving the actual energy performance is not within its scope.
Benchmarking and calibrating building energy models have been important research subjects since the early 1990s [56]. Extensive studies can be found to calibrate influential building energy models against actually measured data such as DOE-2 [57,58,59,60,61,62,63,64], EnergyPlus [65,66], BLAST [67], and ESP-r [68].
6. Causes: What are the Reasons Leading to the Performance Gap of Buildings?
Many causes contribute to the performance gap of buildings. As stated by Mehta [69], when evaluating a building’s actual energy consumption versus predicted it is hard to find the root cause of the difference because all possible errors within the program are occurring simultaneously. This includes occupancy load, scheduling, lighting schedule, temperature set points, and HVAC design. The most significant causes leading to the performance gap of buildings include occupant behavior, micro-environment, and ‘design vs. as-built’ issues.
6.1. Occupant Behavior
6.1.1. The Concept of Occupant Behavior
Occupant behavior is widely accepted as one of the most important causes leading to the energy performance gap of buildings. It is an active research field in its own right as demonstrated by some large scale research efforts such as IEA EBC (International Energy Agency, Energy in Buildings and Communities) Program Annex 66: Definition and Simulation of Occupant Behavior in Buildings [70]. Occupant behavior is identified by IEA EBC Program Annex 53 as one of the six driving factors of energy use in buildings [71]. In a broad sense, occupant behavior refers to all actions and responses to stimulations of building occupants. In the context of building energy, occupant behavior includes occupants’ interactions with and operation of windows, thermostats, lights, blinds, and their movement between spaces [23,70].
6.1.2. The Relationship Between Occupant Behavior and the Building Energy Performance Gap
The primary reason that occupant behavior leads to the building energy performance gap is its uncertainty and unpredictability in the design stage. Occupant behavior is a complicated mechanism and influenced by multiple contextual factors [23]. Environmental conditions, psychological reasons, and sociological factors can all be the drives behind various occupant behavioral patterns. For example, in winter the indoor air quality tends to be the primary factor motivating occupants to open windows [72]. In summer, it is the outdoor noise that is likely to cause occupants to close windows [72]. Other environmental conditions such as humidity, wind, rain, etc., can also contribute to the window opening or closing behavior [73,74]. In addition to the operation of windows, occupants’ use and control of lighting and other energy systems such as the thermostat and appliances are also difficult to predict. Menezes et al. [31] conducted a study to compare the predicted and actual energy performance of a high-density office building with focuses on electricity consumption due to lighting, small power, and catering equipment rather than thermal loads. It was confirmed that the occupants’ operation of these equipments is hard to predict in the design stage and that the accuracy of the model can be significantly improved by using post-occupancy evaluation data to reduce the energy performance gap.
Another type of occupant behavior which often contributes to the building energy performance gap is the occupants’ movement in building spaces. Energy simulation requires that the number of people and their occupying hours are specified in simulation models. However, it is difficult to accurately predict this information in the design stage. A commonly used method is to assume the number of people and their occupying hours in building spaces based on building types, space functions, and other rules of thumb. Unfortunately, these assumptions are vulnerable to being significantly different from the post-occupancy reality.
6.1.3. Modeling Occupant Behavior to Reduce the Building Energy Performance Gap
To account for the impact of occupant behavior on the building energy performance gap, more accurate and reliable occupant behavior models are needed. These models include occupant movement models [75], window opening models, and appliance usage models [76,77,78,79]. Integration of occupant behavior models with building energy modeling programs can help to better predict the energy performance of buildings and thus reduce the building energy performance gap.
Based on an environmental sensing network and hidden Markov models, Dong et al. [80] made a real-time occupancy detection program for offices with an average accuracy as high as 73%. The utility of the developed model is expected to extend to human-centered environmental control, security, energy efficient and sustainable green buildings, and so on. In order to maximize the environmental benefits of the operation of blinds, the influence of occupants should be considered. Zhang and Barrett [81] used logic analysis to predict the probability of blind lowering and raising actions. The results were significant statistically. In addition, different behavior patterns in non-office spaces within the building were reported. Zhou et al. [82] developed a reduced-order air-conditioning conditional probability model to describe the air-conditioning usage. With the consideration of stochastic air-conditioning usage models, the uncertainty of user compositions was studied. The simulation results revealed that air-conditioning usage modes and user compositions can lead to a 4.5 times difference in the system efficiency of district cooling systems. Tanimoto et al. [83] considered the behavioral variations of the inhabitants of dwellings and calculated the cooling/heating loads based on a series of Monte Carlo simulations in which the air-conditioning on/off state and the indoor heat generation schedules were varied. The simulation model was applied to a typical residential building. The results confirmed that the utility demands, especially at the peak, cannot be predicted without such a framework. Meanwhile, the peak shift effect can be effectively captured based on the new simulation method. New technologies such as BIM (Building Information Modeling) were applied to the study of occupant behavior [84]. An agent-based computer simulation model combined with realistic occupant information was developed. The behavior of a building’s inhabitants with regard to the lighting system was modeled to gauge its efficiency and effectiveness. A series of simulations were conducted to illustrate the interactions between design choices and occupant behavior. The study points out that the consideration of occupant behavior will lead designers to different choices of lighting systems and that it is important to bring the objective and subjective aspects of occupants together within a common framework.
Despite these efforts to model occupant behavior, the related research is still quite limited and the results and standards should be viewed critically [23]. Currently, multiple occupant-related models have been developed, while the demands of various levels of application need to be clarified. Meanwhile, there is still a lack of a standard framework for the description and modeling of occupant behavior in buildings, which makes the exchange and reuse of models difficult and hinders the development of the integration with building simulation models.
6.2. Micro-Environment
Micro-environment or micro-climate is another major contributor to the building energy performance gap. In dynamic energy simulation, climate information is needed as the boundary condition for the building being simulated. This climate information is typically provided in the form of standard climate files such as *.epw or *.cwsd files used by EnergyPlus. The data contained in these standard climate files are measured at climate stations such as those in the WMO (World Meteorology Organization) climate station network [85]. However, it is imperative to understand that in reality buildings are operated in specific micro-environmental conditions which can be notably or even significantly different from those described by standard climate files. For instance, a building in a high-density city center is surrounded by many other buildings with various shapes and heights. The environmental factors affecting this building such as solar radiation, wind speed, ambient air temperature, etc., all differ from the measurements at the nearest climate station which may be several kilometers away or even further. It is difficult to have a general assessment of the difference between standard climatic station data and site specific climatic data because each building exists in a unique micro-environment. What is certain is that this difference is factual and can cause the building energy performance gap.
Urban heat island (UHI) effect is a revealing example to demonstrate that micro-environments can lead to the building energy performance gap. UHI is an extensively studied subject in the field of urban physics and urban climatology as evidenced by several important review works [86,87]. It is widely recognized that UHI causes the energy consumption of buildings to significantly increase [88,89,90].
A noteworthy research effort is to combine urban micro-climate simulation with building energy simulation. The idea is to perform urban micro-climate simulation first and use the results as the boundary climate condition for the concerned building. Yang and Zhao [91] classified the approach into two categories based on the micro-climate model being used, namely the non-CFD approach and the CFD approach. Typical examples of the non-CFD approach include the urban canopy model with different levels of simplifications [92,93,94,95] and the 3D street canyon model which can describe the geometric characteristics of city blocks [96,97,98,99,100,101,102].
Compared with the non-CFD approach, the CFD approach has seen more applications. Han et al. [103] combined ENVI-MET with TRANSYS to estimate the urban scale cooling load reduction by means of the output data of ENVI-MET simulations. Hsieh et al. [104] employed EnergyPlus and Windperfect to analyze the feedback of heat rejection to air-conditioning load in subtropical climates. Bouyer et al. [105] presented a developed CFD-thermal-radiative coupled simulation tool and tested it on an urban planning project. The CFD program used was Fluent, a commercial CFD software, and the thermal-radiative model was SOLENE, a customized model. Yi and Peng [106] integrated ENVI-MET with DesignBuilder, which uses EnergyPlus as the energy calculation engine, to study the microclimate change for passive building adaption design
6.3. Design vs. As-Built
The ‘design vs. as-built’ issue is another commonly accepted cause for the performance gap of buildings. It can be interpreted as the fact that one or multiple parts of a building are not constructed in accordance with the design. Reasons for such discrepancy are various, such as inappropriate design, inevitable construction uncertainties, and sometimes blunt malpractice. Note that the ‘design vs. as-built’ situation usually occurs in a limited scope. It is very rare that the majority of a building is not constructed in accordance with the design.
Another interpretation of the ‘design vs. as-built’ issue in terms of the building energy performance gap is that the theoretical energy model developed using the design cannot truthfully reflect the actual energy performance even when the building is constructed in exactly the same way as the design. Asdrubali et al. [107] measured the in situ thermal transmittance of some buildings in Italy and compared the results with the theoretical values. A difference ranging from −14% to 43% was found. In another study, Johnston et al. [30] conducted the coheating test for 25 new dwellings in the UK. The measured whole building U value was over 1.6 times greater than that predicted. Since the thermal properties of a building envelope system have a profound impact on the energy performance of the building, these studies confirm that the ‘design vs. as-built’ issue is a major cause for the building energy performance gap.
Stoppel and Leite [13] listed three areas of knowledge on ‘design vs. as-built’ with respect to the building energy performance gap, namely building physical changes between design and construction, the maintenance and repair activities of a building, and actual occupancy and occupant behavior between post-occupancy and what is assumed during design.
7. Solutions: How to Bridge the Performance Gap of Buildings?
As aforementioned, the energy performance gap, as well as other performance gaps, widely exist in buildings. Therefore, an important question to ask is how to bridge these gaps. As far as the building energy performance gap is concerned, effective bridging measures can be loosely grouped into three categories, namely non-technical (managerial) measures, technical measures, and hybrid measures.
7.1. Managerial Measures
Managerial measures acknowledge that the performance gap of buildings is caused partially by the communication and collaboration among building professionals including clients, architects, engineers, consultants, facility managers, building occupants, etc. Therefore, providing better management to the building design, construction, and operation process can effectively reduce the performance gap.
Corry et al. [108] argues that many of the reasons that buildings do not operate as intended could be categorized as information integration issues and information assessment and optimization issues. A semantic web approach was developed as a means to improve the integration of the increasing number of data sources available within the modern building and the more traditional, existing BMS data and therefore, to reduce the building energy performance gap. Demanuele et al. [35] conducted visits to 15 UK schools and concluded that an effective handover and user-education are essential to optimize energy performance and reduce the discrepancy between design estimates and actual energy use. Bordass et al. [109] believed that all parties involved in a building project need to work closely together to achieve the desired performance. It is important to maintain better transparency between intentions and outcomes because it can help to achieve better assumptions, better predictions, better design, better implementation, and better management of both the procurement and the product. Energy certificates might be developed to help identify and close the credibility gaps. Robinson et al. [110] studied a university building and focused on the building-user interaction. Conflicts were identified between satisfying user needs and keeping a building operating at its highest energy efficiency. The root cause was found to lie in the tenant-landlord relationship between different departments in the organization. To address this issue, the role of the organization was analyzed and appropriate recommendations were made to minimize the user influence on the energy performance gap.
7.2. Technical Measures
Technical measures are intended to reduce the performance gap of buildings through taking physical and technical actions. These actions can occur in any stage of the building process, i.e., design, construction, and post-occupancy.
Calì et al. [111] studied occupants’ behavior related to the use of windows in German households and proposed to include the stochastic aspects of occupants’ behavior into building energy performance simulation software to lead to better predictions of building energy consumption and thus, reduce the building energy performance gap. Niu et al. [112] believes that a dominant reason for the building performance gap lies in the occupancy information uncertainty. Conventional approaches of obtaining occupancy information rely on post-occupancy evaluation statistics. However, before the building is occupied, the interaction between design choices and occupant behavior is not fully understood. Therefore, they developed a virtual reality integrated approach, which can improve occupancy information integrity during design and help to close the performance gap. Grossmann et al. [113] presented a methodology for estimating ‘rebound effects’, a term similar to building energy performance gaps, in non-residential buildings. The interviews conducted in the research effort indicated that user behavior changes such as the operation of heating and ventilation systems could lead to the reduction of the building energy performance gap. Mehta [74] suggested to use on-site weather data to increase the accuracy of building energy simulation and reduce the building energy performance gap. Installing an on-site weather station and collecting temperature, relative humidity, solar radiation, wind direction, and wind speed will help create the most accurate custom weather file. Göçer et al. [114] argued that to reduce the gap between predicted and actual energy performance of buildings, we need to have more realistic input parameters in energy models. Herrando et al. [34] concluded that potential mistakes made during the building energy modeling and software limitations increase the building energy performance gap. A series of suggestions were made to improve the simulation software including improvement in the surface area graphic implementation, default usage profiles, data implementation, and the possibility of implementing the energy consumption of specific equipment. Cecconi et al. [115] believes that the building energy performance gap is clearly connected to biased assumptions in modeling, especially in the initial design phase. Therefore, a probabilistic modeling approach was proposed to improve simulation reliability and robustness with respect to variability in occupancy patterns. Burman et al. [37] proposed a framework to integrate a measurement and verification plan into the Energy Performance of Buildings Directive (EPBD), European Directive 2002/91/EC to ensure measured energy performance was consistent with the intended performance under identical operating conditions. Menezes et al. [31] states that the POE (post-occupancy evaluation) can help understand how occupants and facilities managers interact with the built environment. The information gained from the POE can assist in predicting more realistic energy consumption and consequently reduce the building energy performance gap.
Johnston et al. [30] carried out building fabric thermal performance tests for three dwellings in the UK and found that they performed very close to as predicted. Therefore, it was concluded that careful design coupled with the implementation of appropriate quality control system, such as those required to attain Passivhaus certification, may be conducive to delivering dwellings that bridge the gap between measured and predicted fabric performance. Baborska-Narozny and Stevenson [29] studied continuous mechanical ventilation in housing and pointed out that reducing the gap between design intention and actual performance and use of continuous mechanical ventilation partly depends on the improvement of the continuous MV model to allow for a better match with inhabitants needs.
7.3. Hybrid Measures
Hybrid measures combine managerial measures with technical measures to offer a holistic approach to bridge the performance gap of buildings. Gupta and Kapsali [50] organized recommendations to reduce the building energy performance gap into different stages including design, construction and commissioning, and handover and training. In the design stage, it is recommended (1) to have an open discussion between industry, government, and academia, (2) to integrate the heating and ventilation systems and controls strategy early in the design process, (3) to carefully provide space for heat exchangers and pumps, and (4) to have intuitive, labeled, properly designed, and readily accessible control interfaces. In the construction and commissioning stage, recommendations include robust detailing of joints, junctions, and thresholds, accurate ‘as-built’ models, etc. In the handover and training stage, occupants need to be trained through a graduated and extended handover. Providing occupants with feedback on the relationship between daily activities, habits, and energy bills and showing them ways to actively reduce fuel bills could be attractive. Fedoruk et al. [40] identified several needs to reduce the building energy performance gap by reviewing the performance of the Center for Interactive Research on Sustainability building at the University of British Columbia in Vancouver, Canada. These needs are: to examine detailed energy flows and operational sequences, to understand system boundaries better, to ensure contractual arrangements with consultants cover the full range of work required to achieve the design intent, to look at performance metrics that do not misleadingly aggregate important building information, to focus on stakeholder communication, and to incorporate intentional feedback into all stages of the project life cycle. The Green Construction Board and Buildings Working Group of Arup [50] discussed how to close the building energy performance gap in detail. Actionable items were grouped into design, construction and commissioning, and operation. Gupta and Gregg [106] evaluated the energy and environmental performance of a sustainably-designed but under-utilized institutional building in the UK. By examining the causes of the building energy performance gap, the authors concluded that a willing and knowledgeable person should be assigned to lead the sustainable effort and help to obtain the as-designed performance, which can close the energy gap. This person is called and serves as the sustainability champion. The facility manager and this sustainability champion can work together to develop a technically detailed but user friendly operation, management, and building user guide. This guide can ensure efficient equipment use and minimized energy consumption, well informed maintenance of equipment and building sub-systems, and well-scheduled and properly performed seasonal commissioning. These tools and approaches are essential for facility managers.
8. Conclusions and Future Research Directions
8.1. Conclusions
The performance gap of buildings typically means the difference between the predicted performance in the design stage and the actual measured performance in the post-occupancy stage. The gap can occur in a variety of performance aspects, among which energy performance is the most important one.
The magnitude of the building energy performance gap is the most fundamental question in the field. By examining the reported data from more than 20 sources, it is clear that the building energy performance gap factually exists. However, the numbers differ from each other significantly. No correlation can be easily established between the magnitude of the performance gap and the commonly used building parameters.
The quantification of the performance gap of buildings involves predicting the performance in the design stage and physically measuring it in the post-occupancy stage. Performance prediction in the design stage is achieved through simplified calculation or dynamic simulation. Performance measurement in the post-occupancy stage can be conducted by installing sensors, metering, and accessing utility bills.
Many causes can lead to the performance gap of buildings. Occupant behavior, micro-climate, and ‘design vs. as-built’ are three major causes. Efforts have been made to understand these causes and develop techniques to model them more accurately in the design stage.
To bridge the performance gap of buildings, non-technical (managerial) measures and technical measures are equally important. Since a building is a complex project with many professionals involved, encouraging communication and collaboration, managing the whole building process more effectively, and educating occupants to operate the building in a more responsible manner can all contribute to reducing the performance gap of buildings.
The undeniable existence of the performance gap has many real-world implications and can be interpreted in different ways. One of the implications is that we should form a realistic understanding of the capabilities and limitations of the detailed building performance modeling programs. After several decades of research, these building performance modeling programs have become very complex and powerful. However, when being used in predicting the actual building performance, significant gaps still exist. To blame this gap solely on the modeling programs is not fair. A more justifiable and productive view is to accept the limitations and continue developing these programs to better capture the complicated essences of building performance.
8.2. Future Research Directions
It is clear that the research conducted on the performance gap of buildings has been fruitful and yet unsolved problems remain. One of the most pressing problems is to better understand the magnitude of the performance gap and its correlation with some important parameters such as climate, building type, energy system, etc. Adopting a standard methodology to quantify and report the performance gap would be helpful. More data need to be collected and meta-analysis should be conducted.
Developing more reliable and accurate models to account for some of the most important contributors to the performance gap of buildings, such as occupant behavior, is another worthy research effort. On the post-occupancy side, providing an effective monitoring and performance optimization system in building operation is essential to reduce the gap. A secondary gain from having such a system is fully understanding the complex performance matrix of the building.
Most of the works reviewed consider the building energy performance on a yearly basis. However, it is actually time dependent, which means that the gap has seasonal, monthly, daily, and even hourly changes. To date, this characteristic of time dependence has not been adequately studied and therefore warrants future research.
Last but not least, the study of non-technical measures to bridge the performance gap of buildings should not be neglected. Encouraging communication and collaboration among building professionals and better management of the whole building process can go a long way in reducing the performance gap of buildings. The research should shed light on how to achieve exactly that.
Author Contributions
Conceptualization, X.S.; methodology, X.S.; validation, X.S., B.S., J.Z., C.W., Z.T., X.J., and X.Z.; investigation, X.S.; data curation, X.S.; writing—original draft preparation, X.S.; writing—review and editing, X.S. and B.S.
Funding
This research was funded by the Ministry of Science and Technology of China, grant number 2016YFC0700102, and the Scientific Research Foundation of Graduate School of Southeast University, grant number YBJJ1702.
Conflicts of Interest
The authors declare no conflict of interest.
References
- Available online: https://www.usgbc.org/LEED/ (accessed on 20 July 2017).
- Available online: http://www.breeam.com/ (accessed on 20 July 2017).
- Ye, L.; Cheng, Z.; Wang, Q.; Lin, W.; Ren, F. Overview on Green Building Label in China. Renew. Energy 2013, 53, 220–229. [Google Scholar] [CrossRef]
- Available online: http://www.ibec.or.jp/CASBEE/english/ (accessed on 20 July 2017).
- Wilde, P.D. The gap between predicted and measured energy performance of buildings: A framework for investigation. Autom. Constr. 2014, 41, 40–49. [Google Scholar] [CrossRef]
- Cohen, R.; Standeven, M.; Bordass, B.; Leaman, A. Assessing building performance in use 1: The Probe process. Build. Res. Inf. 2001, 29, 85–102. [Google Scholar] [CrossRef]
- Bordass, B.; Cohen, R.; Standeven, M.; Leaman, A. Assessing building performance in use 2: Technical performance of the Probe buildings. Build. Res. Inf. 2001, 29, 103–113. [Google Scholar] [CrossRef]
- Bordass, B.; Cohen, R.; Standeven, M.; Leaman, A. Assessing building performance in use 3: Energy performance of the Probe buildings. Build. Res. Inf. 2001, 29, 114–128. [Google Scholar] [CrossRef]
- Leaman, A.; Bordass, B. Assessing building performance in use 4: The Probe occupant surveys and their implications. Build. Res. Inf. 2001, 29, 129–143. [Google Scholar] [CrossRef]
- Bordass, B.; Leaman, A.; Ruyssevelt, P. Assessing building performance in use 5: Conclusions and implications. Build. Res. Inf. 2001, 29, 144–157. [Google Scholar] [CrossRef]
- Al-Zubaidy, M. A literature evaluation of the energy efficiency of Leadership in Energy and Environment Design (LEED) certified buildings. Am. J. Civ. Eng. Archit. 2015, 3, 1–7. [Google Scholar]
- Turner, C.; Frankel, M. Energy Performance of LEED for New Construction Buildings; Final Report; U.S. Green Building Council: Washington, DC, USA, 2008. [Google Scholar]
- Stoppel, C.; Leite, F. Evaluating building energy model performance of LEED buildings: Identifying potential sources of error through aggregate analysis. Energy Build. 2013, 65, 185–196. [Google Scholar] [CrossRef]
- Cropp, J.; Lee, A.; Castor, S. Evaluating results for LEED buildings in an energy efficiency program. In Proceedings of the 2014 ACEEE Summer Study on Energy Efficiency in Buildings, Pacific Grove, CA, USA, 17 August 2014. [Google Scholar]
- Tincher, T. Post-Occupancy Energy Efficiency Evaluation of a LEED Platinum Federal Government Facility. Master’s Thesis, University of Nevada, Las Vegas, NV, USA, 2014. [Google Scholar]
- Newsham, G.; Mancini, S.; Birt, B. Do LEED-certified buildings save energy? Yes, but…. Energy Build. 2009, 41, 897–905. [Google Scholar] [CrossRef] [Green Version]
- Scofield, J. Do LEED-certified buildings save energy? Not really…. Energy Build. 2009, 41, 1386–1390. [Google Scholar] [CrossRef]
- Lee, W.; Burnett, J. Benchmarking energy use assessment of HK-BEAM, BREEAM, and LEED. Build. Environ. 2008, 43, 1882–1891. [Google Scholar] [CrossRef]
- Lee, W. Benchmarking energy use of building environmental assessment schemes. Energy Build. 2012, 45, 326–334. [Google Scholar] [CrossRef]
- Lee, W.; Yik, F.; Burnett, J. Assessing energy performance in the latest versions of Hong Kong Building Environmental Assessment Method (HK-BEAM). Energy Build. 2007, 39, 343–354. [Google Scholar] [CrossRef]
- Ahmad, M.; Mourshed, M.; Mundow, D.; Sisinni, M.; Rezgui, Y. Building energy metering and environmental monitoring—A state-of-the-art review and directions for future research. Energy Build. 2016, 120, 85–102. [Google Scholar] [CrossRef]
- Stazi, F.; Naspi, F.; D’Orazio, M. A literature review on driving factors and contextual events influencing occupants’ behaviours in buildings. Build. Environ. 2017, 118, 40–66. [Google Scholar] [CrossRef]
- Yan, D.; O’Brien, W.; Hong, T.; Feng, X.; Gunay, H.B.; Tahmassebi, F.; Mahdavi, A. Occupant behavior modeling for building performance simulation: Current state and future challenges. Energy Build. 2015, 107, 264–278. [Google Scholar] [CrossRef] [Green Version]
- Gunay, H.; O’Brien, W.; Beausoleil-Morrison, I. A critical review of observation studies, modeling, and simulation of adaptive occupant behaviors in offices. Build. Environ. 2013, 70, 31–47. [Google Scholar] [CrossRef]
- Harish, V.; Kumar, A. A review on modeling and simulation of building energy systems. Renew. Sustain. Energy Rev. 2016, 56, 1272–1292. [Google Scholar] [CrossRef]
- Foucquier, A.; Robert, S.; Suard, F.; Stephan, L.; Jay, A. State of the art in building modelling and energy performances prediction: A review. Renew. Sustain. Energy Rev. 2013, 23, 272–288. [Google Scholar] [CrossRef]
- Vasquez-Hernandez, A.; Alvarez, M. Evaluation of buildings in real conditions of use: Current situation. J. Build. Eng. 2017, 12, 26–36. [Google Scholar] [CrossRef]
- Olivia, G.; Christopher, T. In-use monitoring of buildings: An overview and classification of evaluation methods. Energy Build. 2015, 86, 176–189. [Google Scholar] [CrossRef]
- Baborska-Narozny, M.; Stevenson, F. Continuous mechanical ventilation in housing—Understanding the gap between intended and actual performance and use. Energy Procedia 2015, 83, 167–176. [Google Scholar] [CrossRef]
- Johnston, D.; Miles-Shenton, D.; Farmer, D. Quantifying the domestic building fabric ‘performance gap’. Build. Serv. Eng. Res. Technol. 2015, 36, 614–627. [Google Scholar] [CrossRef] [Green Version]
- Menezes, A.; Cripps, A.; Bouchlaghem, D.; Buswell, R. Predicted vs. actual energy performance of non-domestic buildings, Using post-occupancy evaluation data to reduce the performance gap. Appl. Energy 2012, 97, 355–364. [Google Scholar] [CrossRef]
- Calì, D.; Osterhage, T.; Streblow, R.; Müller, D. Energy performance gap in refurbished German dwellings: Lesson learned from a field test. Energy Build. 2016, 127, 1146–1158. [Google Scholar] [CrossRef]
- Peterson, S.; Hviid, C. The European energy performance of building directive: Comparison of calculated and actual energy use in a Danish office building. In Proceedings of the Building Simulation and Optimization Conference, Loughborough, UK, 10–11 September 2012. [Google Scholar]
- Herrando, M.; Cambra, D.; Navarro, M.; Cruz, L.D.L.; Millán, G.; Zabalza, I. Energy performance certification of faculty buildings in Spain: The gap between estimated and real energy consumption. Energy Convers. Manag. 2016, 125, 141–153. [Google Scholar] [CrossRef]
- Demanuele, C.; Tweddell, T.; Davies, M. Bridging the gap between predicted and actual energy performance in schools. In Proceedings of the World Renewable Energy Congress XI, Abu Dhabi, UAE, 25–30 September 2010. [Google Scholar]
- Fokaides, P.; Maxoulis, C.; Panayiotou, G.; Neophytou, M.; Kalogirou, S. Comparison between measured and calculated energy performance for dwellings in a summer dominant environment. Energy Build. 2011, 43, 3099–3105. [Google Scholar] [CrossRef]
- Burman, E.; Mumovic, D.; Kimpian, J. Towards measurement and verification of energy performance under the framework of the European directive for energy performance of buildings. Energy 2014, 77, 153–163. [Google Scholar] [CrossRef] [Green Version]
- Magalhães, S.; Leal, V. Characterization of thermal performance and nominal heating gap of the residential building stock using the EPBD-derived databases: The case of Portugal mainland. Energy Build. 2014, 70, 169–179. [Google Scholar] [CrossRef]
- Hens, H.; Parijs, W.; Deurinck, M. Energy consumption for heating and rebound effects. Energy Build. 2010, 42, 105–110. [Google Scholar] [CrossRef] [Green Version]
- Fedoruk, L.; Cole, R.; Robinson, J.; Cayuela, A. Learning from failure: Understanding the anticipated-achieved building energy performance gap. Build. Res. Inf. 2015, 43, 756–763. [Google Scholar] [CrossRef]
- Marjanovic-Halburd, L.; Korolija, I.; Liddia, R.; Wright, A. Operational rating vs asset rating vs detailed simulation. In Proceedings of the International Conference on Improving Energy Efficiency in Commercial Buildings, Frankfurt, Germany, 16–18 March 2016. [Google Scholar]
- Tronchin, L.; Fabbri, K. A Round Robin Test for buildings energy performance in Italy. Energy Build. 2010, 42, 1862–1877. [Google Scholar] [CrossRef]
- Stoppel, C.; Leite, F. Comparing predicted to actual energy consumption of LEED-certified dormitory buildings: An aggregated analysis. In Proceedings of the ICSDEC (International Conference on Sustainable Design, Engineering, and Construction) Conference, Fort Worth, TX, USA, 7–9 November 2012. [Google Scholar]
- Pegg, I.; Cripps, A.; Kolokotroni, M. Post-occupancy performance of five low-energy schools in the UK. ASHRAE Trans. 2007, 113, 3–13. [Google Scholar]
- UCL (University College London) Energy Institute. Summary of Audits Performed on CarbonBuzz. Available online: www.carbonbuzz.org (accessed on 20 July 2017).
- Green Construction Board, Buildings Working Group. The Performance Gap: Causes & Solutions; Technical Report; ARUP: London, UK, 2013. [Google Scholar]
- Galvin, R. Making the ‘rebound effect’ more useful for performance evaluation of thermal retrofits of existing homes: Defining the ‘energy savings deficit’ and the ‘energy performance gap’. Energy Build. 2014, 69, 515–524. [Google Scholar] [CrossRef]
- Binks, J. Closing the loop. Office tower simulation assumptions vs reality. In Proceedings of the 12th Conference of International Building Performance Simulation Association, Sydney, Australia, 14–16 November 2011. [Google Scholar]
- Salehi, M.; Cavka, B.; Fedoruk, L.; Frisque, A.; Whitehead, D.; Bushe, W. Improving the performance of a whole-building energy modeling tool by using post-occupancy measured data. In Proceedings of the 13th Conference of International Building Performance Simulation Association, Chambéry, France, 25–28 August 2013. [Google Scholar]
- Gupta, R.; Kapsali, M. Evaluating the ‘as-built’ performance of an eco-housing development in the UK. Build. Serv. Eng. Res. Technol. 2016, 37, 220–242. [Google Scholar] [CrossRef]
- Ballarini, I.; Corrado, V. Application of energy rating methods to the existing building stock: Analysis of some residential buildings in Turin. Energy Build. 2009, 41, 790–800. [Google Scholar] [CrossRef]
- CEN/TR 15615:2008: Explanation of the General Relationship between Various European Standards and the Energy Performance of Building Directive (EPBD)—Umbrella Document. Available online: https://www.evs.ee/products/cen-tr-15615-2008 (accessed on 5 October 2018).
- DIN-V-4108-6. Thermal Protection and Energy Economy in Buildings—Part 6: Calculation of Annual Heat and Annual Energy Use; German Institute for Standardization: Berlin, Germany, 2003.
- CEN. Energy Performance of Buildings—Calculation of Energy Use for Space Heating and Cooling; EN ISO 13790:2008; European Committee for Standardization: Brussels, Belgium, 2008. [Google Scholar]
- CIBSE. Building Energy Code 1: Energy Demands and Targets in Heated and Ventilated Buildings; Chartered Institute of Building Services Engineers: London, UK, 1998. [Google Scholar]
- Coakley, D.; Raftery, P.; Keane, M. A review of methods to match building energy simulation models to measured data. Renew. Sustain. Energy Rev. 2014, 37, 123–141. [Google Scholar] [CrossRef]
- Kaplan, M.; McFerran, J.; Janse, J.; Pratt, R. Reconciliation of a DOE-2.1C model with monitored end-use data for a small office building. ASHRAE Trans. 1992, 96, 983–993. [Google Scholar]
- Bronson, D.; Hinchey, S.; Haberl, J.; O’Neal, D. A procedure for calibrating the DOE-2 simulation programme to non-weather-dependent measured data. In Proceedings of the ASHRAE Winter Meeting, Anaheim, CA, USA, 25–29 January 1992. [Google Scholar]
- Carroll, W.; Hitchcock, R. Tuning simulated building descriptions to match actual utility data: Methods and implementation. ASHRAE Trans. 1993, 99, 928–934. [Google Scholar]
- Soebarto, V. Calibration of hourly energy simulations using hourly monitored data and monthly utility records for two case study buildings. In Proceedings of the 4th International IBPSA, Prague, Czech Republic, 8–10 September 1997. [Google Scholar]
- Haberl, J.; Bou-Saada, T. Procedures for calibrating hourly simulation models to measured building energy and environmental data. J. Sol. Energy Eng. 1998, 120, 193–204. [Google Scholar] [CrossRef]
- Lunneberg, T. Improving simulation accuracy through the use of short-term electrical end-use monitoring. In Proceedings of the 6th International IBPSA Conference, Kyoto, Japan, 13–15 September 1999. [Google Scholar]
- Agami, R.; Itzhak, M.; Chanin, P. Calibrating detailed building energy simulation programs with measured data—Part I: General methodology (RP-1051). HVAC&R Res. 2007, 13, 221–241. [Google Scholar]
- Agami, R.; Itzhak, M.; Chanin, P. Calibrating detailed building energy simulation programs with measured data—Part II: Application to three case study office buildings General methodology (RP-1051). HVAC&R Res. 2007, 13, 243–265. [Google Scholar]
- Raftery, P.; Keane, M.; O’Donnell, J. Calibrating whole building energy models: An evidence-based methodology. Energy Build. 2011, 43, 2356–2364. [Google Scholar] [CrossRef]
- Coakley, D.; Raftery, P.; Molloy, P. Calibration of whole building energy simulation models: Detailed case study of a naturally ventilated building using hourly measured data. In Proceedings of the Building Simulation & Optimization, Loughborough, UK, 10–11 September 2012. [Google Scholar]
- Manke, J.; Hittle, D.; Hancock, C. Calibrating building energy analysis model using short term test data. J. Sol. Energy Eng. 1996. [Google Scholar]
- Clarke, J.; Strachan, P.; Pernot, C. An approach to the calibration of building energy simulation models. ASHRAE Trans. 1993, 99, 917–927. [Google Scholar]
- Mehta, C. A Case Study in Actual Building Performance and Energy Modeling with Real Weather Data. Master’s Thesis, Ryerson University, Toronto, ON, Canada, 2013. [Google Scholar]
- Available online: http://www.annex66.org (accessed on 20 July 2017).
- Available online: http://www.annex53.org (accessed on 20 July 2017).
- Warren, P.; Parkins, L. Window-opening behaviour in office buildings. Build. Serv. Eng. Res. Technol. 1984, 5, 89–101. [Google Scholar] [CrossRef]
- Haldi, F.; Robinson, D. On the behaviour and adaptation of office occupants. Build. Environ. 2008, 43, 2163–2177. [Google Scholar] [CrossRef]
- Roetzel, A.; Tsangrassoulis, A.; Dietrich, U.; Busching, S. A review of occupant control on natural ventilation. Renew. Sustain. Energy Rev. 2010, 14, 1001–1013. [Google Scholar] [CrossRef]
- Wang, C.; Yan, D.; Jiang, Y. A novel approach for building occupancy simulation. Build. Simul. 2011, 4, 149–167. [Google Scholar] [CrossRef]
- Nicol, J. Characterising occupant behaviour in buildings: Towards a stochastic model of occupant use of windows, lights, blinds, heaters and fans. In Proceedings of the 7th Conference of International Building Performance Simulation Association, Rio de Janeiro, Brazil, 13–15 August 2001. [Google Scholar]
- O’Doherty, J.; Lyons, S.; Tol, R. Energy-using appliances and energy-saving features: Determinants of ownership in Ireland. Appl. Energy 2008, 85, 650–662. [Google Scholar] [CrossRef] [Green Version]
- Reinhart, C. Lightswitch-2002: A model for manual and automated control of electric lighting and blinds. Sol. Energy 2004, 77, 15–28. [Google Scholar]
- Rijal, H.; Tuohy, P.; Humphreys, M.; Nicol, J.; Samuel, A.; Clarke, J. Using results from field surveys to predict the effect of open windows on thermal comfort and energy use in buildings. Energy Build. 2007, 39, 823–836. [Google Scholar] [CrossRef]
- Dong, B.; Andrews, B.; Lam, K.P.; Höynck, M.; Zhang, R.; Chiou, Y.; Benitez, D. An information technology enabled sustainability testbed (ITEST) for occupancy detection through an environmental sensing network. Energy Build. 2010, 42, 1038–1046. [Google Scholar] [CrossRef]
- Zhang, Y.; Barrett, P. Factors influencing occupants’ blind-control behaviour in a naturally ventilated office building. Build. Environ. 2012, 54, 137–147. [Google Scholar] [CrossRef]
- Zhou, X.; Yan, D.; Feng, X.; Deng, G.; Jian, Y.; Jiang, Y. Influence of household air-conditioning use modes on the energy performance of residential district cooling systems. Build. Simul. 2016, 9, 429–441. [Google Scholar]
- Tanimoto, J.; Hagishima, A.; Sagara, H. A methodology for peak energy requirement considering actual variation of occupants’ behavior schedules. Build. Environ. 2008, 43, 610–619. [Google Scholar] [CrossRef]
- Andrews, C.; Yi, D.; Krogmann, U.; Senick, J.; Wener, R. Designing buildings for real occupants: An agent-based approach. IEEE Trans. Syst. Man Cybern. Part A Syst. Hum. 2011, 41, 1077–1091. [Google Scholar] [CrossRef]
- Available online: http://www.worldweather.org/en/home.html (accessed on 10 August 2017).
- Akbari, H.; Kolokotsa, D.A. Three decades of urban heat islands and mitigation technologies research. Energy Build. 2016, 133, 834–842. [Google Scholar] [CrossRef]
- Gago, E.; Roldan, J.; Pacheco-Torres, R.; Ordóñez, J. The city and urban heat islands: A review of strategies to mitigate adverse effects. Renew. Sustain. Energy Rev. 2013, 25, 749–758. [Google Scholar] [CrossRef]
- Pyrgou, A.; Castaldob, V.; Pisello, A.; Cotana, F.; Santamouris, M. On the effect of summer heatwaves and urban overheating on building thermal-energy performance in central Italy. Sustain. Cities Soc. 2017, 28, 187–200. [Google Scholar] [CrossRef]
- Kong, F.; Sun, C.; Liu, F.; Yin, H.; Jiang, F.; Pu, Y.; Cavan, G.; Skelhorn, C.; Middel, A.; Dronova, I. Energy saving potential of fragmented green spaces due to their temperature regulating ecosystem services in the summer. Appl. Energy 2016, 183, 1428–1440. [Google Scholar] [CrossRef]
- Santamouris, M.; Cartalis, C.; Synnefa, A.; Kolokotsa, D. On the impact of urban heat island and global warming on the power demand and electricity consumption of buildings—A review. Energy Build. 2015, 98, 119–124. [Google Scholar] [CrossRef]
- Yang, X.; Zhao, L. Impacts of Urban Microclimate on Building Energy Performance: A Review of Research Methods. Build. Sci. 2015, 31, 1–7. (In Chinese) [Google Scholar]
- Salamanca, F.; Krpo, A.; Martille, A.; Clappier, A. A new building energy model coupled with an urban canopy parameterization for urban climate simulations—Part I. Formulations, verification, and sensitivity analysis of the model. Theor. Appl. Climatol. 2010, 99, 331–344. [Google Scholar] [CrossRef]
- Salamanca, F.; Krpo, A.; Martille, A.; Clappier, A. A new building energy model coupled with an urban canopy parameterization for urban climate simulations—Part II. Validation with one dimension off-line simulations. Theor. Appl. Climatol. 2010, 99, 331–344. [Google Scholar] [CrossRef]
- Bueno, B.; Norford, L.; Pigeon, G.; Britter, R. Combining a detailed building energy model with a physically-based urban canopy model. Bound.-Layer Meteorol. 2011, 140, 471–489. [Google Scholar] [CrossRef]
- Bueno, B.; Norford, L.; Pigeon, G.; Britter, R. A resistance-capacitance network model for the analysis of the interactions between the energy performance of buildings and the urban climate. Build. Environ. 2012, 54, 116–125. [Google Scholar] [CrossRef]
- Flor, F.; Dominguez, S. Modelling microclimate in urban environment sand assessing its influence on the performance of surrounding buildings. Energy Build. 2004, 36, 403–413. [Google Scholar] [CrossRef]
- Gros, A.; Bozonnet, E.; Inard, C. Cool materials impact at district scale—Coupling building energy and microclimate models. Sustain. Cities Soc. 2014, 13, 254–266. [Google Scholar] [CrossRef]
- Allegrini, J.; Dorer, V.; Carmeliet, J. Influence of the urban microclimate in street canyons on the energy demand for space cooling and heating of buildings. Energy Build. 2012, 55, 823–832. [Google Scholar] [CrossRef]
- Yaghoobian, N.; Kleissl, J. An indoor—Outdoor building energy simulator to study urban modification effects on building energy use—Model description and validation. Energy Build. 2012, 54, 407–417. [Google Scholar] [CrossRef]
- He, J.; Hoyano, A.; Asawa, T. A numerical simulation tool for predicting the impact of outdoor thermal environment on building energy performance. Appl. Energy 2006, 86, 1596–1605. [Google Scholar] [CrossRef]
- Kruger, E.; Pearlmutte, D.; Rasia, F. Evaluating the impact of canyon geometry and orientation on cooling loads in a high-mass building in a hot dry environment. Appl. Energy 2010, 87, 2068–2078. [Google Scholar] [CrossRef]
- Kesten, D.; Tereci, A.; Strzalka, A. A method to quantify the energy performance in urban quarters. HVAC&R Res. 2012, 18, 100–111. [Google Scholar]
- Han, S.; Mun, S.; Hun, J. Changes of the micro-climate and building cooling load due to the green effect of a restored steam in Seoul, Korea. In Proceedings of the 10th International Building Performance Simulation Association Conference and Exhibition, Beijing, China, 3–6 September 2007; pp. 1131–1138. [Google Scholar]
- Hsieh, C.; Aramaki, T.; Hanaki, K. The feedback of heat rejection to air conditioning load during the nighttime in subtropical climate. Energy Build. 2007, 39, 1175–1182. [Google Scholar] [CrossRef]
- Bouyer, J.; Inard, C.; Musy, M. Microclimate coupling as a solution to improve building energy simulation in an urban context. Energy Build. 2011, 43, 1549–1559. [Google Scholar] [CrossRef]
- Yi, C.; Peng, C. Microclimate change outdoor and indoor coupled simulation for passive building adaptation design. Procedia Comput. Sci. 2014, 32, 691–698. [Google Scholar] [CrossRef]
- Asdrubali, F.; D’Alessandro, F.; Baldinelli, G.; Bianchi, F. Evaluating in situ thermal transmittance of green buildings masonries—A case study. Case Stud. Constr. Mater. 2014, 1, 53–59. [Google Scholar] [CrossRef] [Green Version]
- Corry, E.; Pauwels, P.; Hu, S.; Keane, M.; O’Donnell, J. A performance assessment ontology for the environment and energy management of buildings. Autom. Constr. 2015, 57, 249–259. [Google Scholar] [CrossRef]
- Bordass, B.; Cohen, R.; Field, J. Energy performance of non-domestic buildings: Closing the credibility gap. In Proceedings of the 3rd International Conference on Improving Energy Efficiency in Commercial Buildings; 2004. Available online: http://www.usablebuildings.co.uk/Pages/Unprotected/EnPerfNDBuildings.pdf (accessed on 5 October 2018).
- Robinson, J.; Taylor, P.; Foxon, T. Performance gap analysis case study of a non-domestic building. Eng. Sustain. 2016, 169, 31–38. [Google Scholar] [CrossRef] [Green Version]
- CalÌ, D.; Andersen, R.K.; Müller, D.; Olesen, B.W. Analysis of occupants’ behavior related to the use of windows in German households. Build. Environ. 2016, 13, 54–69. [Google Scholar] [CrossRef]
- Niu, S.; Pan, W.; Zhao, Y. A virtual reality integrated design approach to improving occupancy information integrity for closing the building energy performance gap. Sustain. Cities Soc. 2016, 27, 275–286. [Google Scholar] [CrossRef]
- Grossmann, D.; Galvin, R.; Weiss, J.; Madlener, R.; Hirschl, B. A methodology for estimating rebound effects in non-residential public service buildings: Case study of four buildings in Germany. Energy Build. 2016, 111, 455–467. [Google Scholar] [CrossRef]
- Göçer, Ö.; Hua, Y.; Göçer, K. Completing the missing link in building design process: Enhancing post-occupancy evaluation method for effective feedback for building performance. Build. Environ. 2015, 89, 14–27. [Google Scholar] [CrossRef]
- Cecconi, F.; Manfren, M.; Tagliabue, L.; Ciribini, A.; Angelis, E. Probabilistic behavioural modeling in building performance simulation. Energy Build. 2017, 148, 128–141. [Google Scholar] [CrossRef]
- Gupta, R.; Gregg, M. Empirical evaluation of the energy and environmental performance of a sustainably-designed but under-utilised institutional building in the UK. Energy Build. 2016, 128, 68–80. [Google Scholar] [CrossRef]
Figure 1.
The reported ratios between the calculated energy consumption and the measured energy consumption of the 21 research works reviewed.
Figure 1.
The reported ratios between the calculated energy consumption and the measured energy consumption of the 21 research works reviewed.


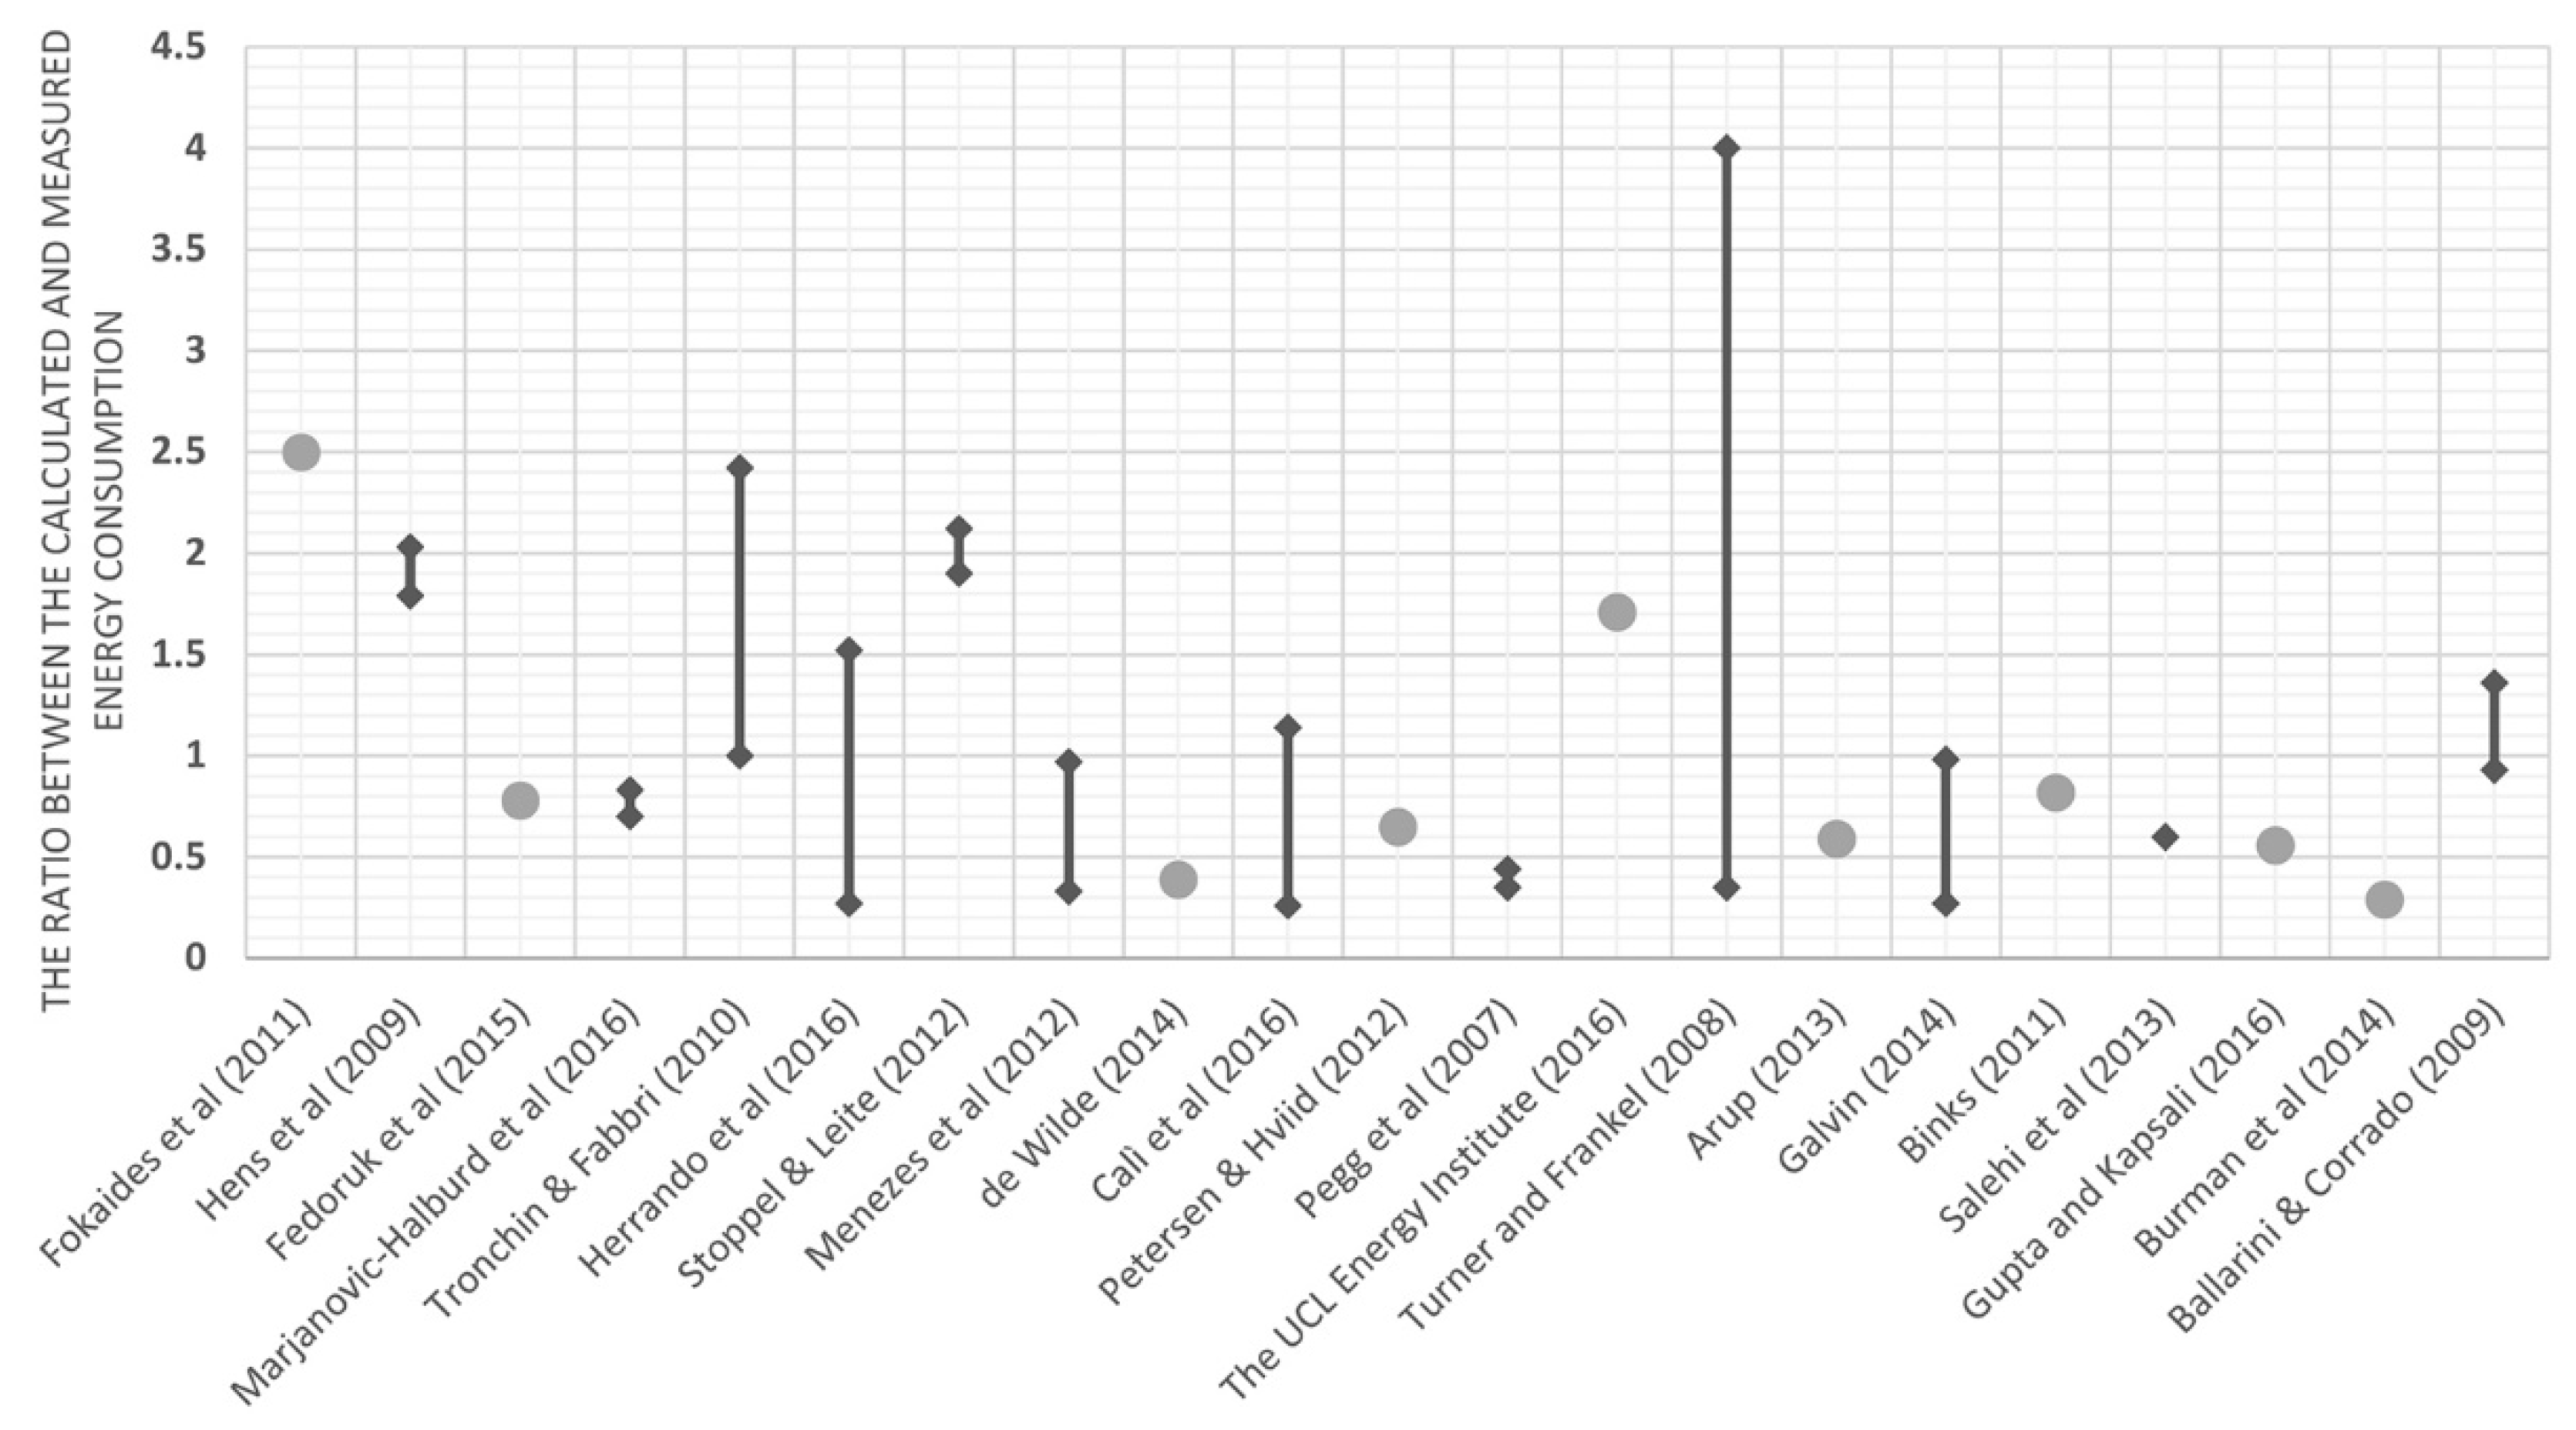
Table 1.
The core literature reviewed in each section.
| Category | Reference information | |
|---|---|---|
| Relevant reviews | Wilde [5]; Ahmad et al. [21]; Stazi et al. [22]; Yan et al. [23]; Gunay and O’Brien [24]; Harish and Kumar [25]; Foucquier et al. [26]; Vasquez-Hernandez and Alvarez [27]; Olivia and Christopher [28] | |
| Definition of the gap | Wilde [5]; Baborska-Narozny and Stevenson [29]; Johnston et al. [30]; Menezes et al. [31]; Calì et al. [32]; Peterson and Hviid [33]; Herrando et al. [34]; Demanuele et al. [35]; Fokaides et al. [36]; Burman et al. [37] | |
| Magnitude of the gap | Wilde [5]; Turner and Frankel [12]; Menezes et al. [31]; Calì et al. [32]; Petersen and Hviid [33]; Herrando et al. [34]; Fokaides et al. [36]; Burman et al. [37]; Magalhães and Leal [38]; Hens et al. [39]; Fedoruk et al. [40]; Marjanovic-Halburd et al. [41]; Tronchin and Fabbri [42]; Stoppel and Leite [43]; Pegg et al. [44]; UCL (University College London) Energy Institute [45]; Green Construction Board and Buildings Working Group of Arup [46]; Galvin [47]; Binks [48]; Salehi et al. [49]; Gupta and Kapsali [50]; Ballarini and Corrado [51] | |
| Determination of the gap | Wilde [5]; Turner and Frankel [12]; Ahmad et al. [21]; Menezes et al. [31]; Calì et al. [32]; Peterson and Hviid [33]; Herrando et al. [34]; Demanuele et al. [35]; Fokaides et al. [36]; Magalhães and Leal [38]; Hens et al. [39]; Fedoruk et al. [40]; Marjanovic-Halburd et al. [41]; Tronchin et al. [42]; Stoppel and Leite [43]; Pegg et al. [44]; UCL (University College London) Energy Institute [45]; Green Construction Board and Buildings Working Group of Arup [46]; Galvin [47]; Salehi et al. [49]; Gupta and Kapsali [50]; CEN/TR [52]; DIN-V-4108-6 [53]; CEN [54]; CIBSE [55]; Coakley et al. [56]; Kaplan et al. [57]; Bronson et al. [58]; Carroll and Hitchcock [59]; Soebarto [60]; Haberl and Bou-Saada [61]; Lunneberg [62]; Agami et al. [63]; Agami et al. [64]; Raftery et al. [65]; Coakley et al. [66]; Manke et al. [67]; Clarke et al. [68] | |
| Causes of the gap | Occupant behavior | Yan et al. [23]; Menezes et al. [31]; Mehta [69]; http://www.annex66.org [70]; http://www.annex53.org [71]; Warren and Parkins [72]; Haldi and Robinson [73]; Roetzel et al. [74]; Wang et al. [75]; Nicol [76]; O’Doherty et al. [77]; Reinhart [78]; Rijal et al. [79]; Dong et al. [80]; Zhang and Barrett [81]; Zhou et al. [82]; Tanimoto et al. [83]; Andrews et al. [84] |
| Micro-environment | http://www.worldweather.org/en/home.html [85]; Akbari and Kolokotsa [86]; Gago et al. [87]; Pyrgou et al. [88]; Kong et al. [89]; Santamouris et al. [90]; Yang and Zhao [91]; Salamanca et al. [92]; Salamanca et al. [93]; Bueno et al. [94]; Bueno et al. [95]; Flor and Dominguez [96]; Gros et al. [97]; Allegrini et al. [98]; Yaghoobian and Kleissl [99]; He et al. [100]; Kruger et al. [101]; Kesten et al. [102]; Han et al. [103]; Hsieh et al. [104]; Bouyer et al. [105]; Yi and Peng [106] | |
| Design vs. as-built | Stoppel and Leite [13]; Johnston et al. [30]; Asdrubali et al. [107] | |
| Solutions to bridge the gap | Baborska-Narozny and Stevenson [29]; Johnston et al. [30]; Menezes et al. [31]; Herrando et al. [34]; Demanuele et al. [35]; Burman et al. [37]; Fedoruk et al. [40]; Green Construction Board and Buildings Working Group of Arup [46]; Gupta and Kapsali [50]; Mehta [69]; Corry et al. [108]; Bordass et al. [109]; Robinson et al. [110]; Calì et al. [111]; Niu et al. [112]; Grossmann et al. [113]; Göçer et al. [114]; Cecconi et al. [115]; Gupta and Gregg [116] | |
Table 2.
Literature reviewed with reported magnitudes of the building energy performance gap.
| Reference | Building type | Country | Period | Energy items included | Lower limit of the reported gap | Upper limit of the reported gap | Average value of the reported gap |
|---|---|---|---|---|---|---|---|
| Fokaides et al. [36] | Residential | Cyprus | Yearly (two years) | Electricity, heating oil, and gas | - | 4 | 2.5 |
| Magalhães and Leal [38] | Residential | Portugal | Yearly | Heating, cooling, domestic hot water | - | - | 22.1 for space heating, 38.3 for space cooling |
| Hens et al. [39] | Residential | Belgium | Yearly | Heating | 1.79 | 2.03 | - |
| Fedoruk et al. [40] | Academic/Research | Canada | Yearly (from April 2012 to March 2013) | Space conditioning, domestic hot water, lighting, plug loads | - | - | 0.78 |
| Marjanovic-Halburd et al. [41] | Office | UK | Yearly (2004) | Heating, cooling, lighting, domestic hot water | 0.7 | 0.83 | - |
| Tronchin and Fabbri [42] | Residential | Italy | Yearly | Electricity, natural gas | 1 | 2.42 | - |
| Herrando et al. [34] | Academic/Research | Spain | Yearly | Heating, cooling, lighting, natural gas | 0.27 | 1.52 | - |
| Stoppel and Leite [43] | Dormitory | USA | Yearly | Heating, cooling, lighting (both interior and exterior), domestic hot water, receptacle equipment, interior fans | 1.9 | 2.12 | - |
| Menezes et al. [31] | Office | UK | Yearly | Heating, cooling, lighting, small power, catering equipment | 0.33 | 1 | - |
| Wilde [5] | Academic/Research | UK | Yearly (from 2011 to 2012) | HVAC electricity, facility electricity, gas | - | - | 0.39 |
| Calì et al. [32] | Residential | Germany | Yearly (from 2011 to 2014) | Heating, domestic hot water | 0.26 | 1.14 | - |
| Petersen and Hviid [33] | Office | Denmark | Yearly (2010) | Heating (including space heating and domestic hot water), cooling, lighting, ventilation fans, building operation services | - | - | 0.65 |
| Pegg et al. [44] | School | UK | Yearly | Heating, cooling, lighting, fans, pumps, small power, gas | 0.35 | 0.44 | - |
| The UCL Energy Institute [45] | Office | UK | Yearly | Total electricity | - | - | 1.71 |
| Turner and Frankel [12] | Various | Presumably USA | Yearly | Total energy | 0.35 | 4.0 | - |
| Arup [46] | Office | Unknown | Yearly | Cooling, fans, pumps, heating gas, domestic hot water gas | - | - | 0.59 |
| Galvin [47] | Residential | Germany | Yearly | Heating | 0.27 | 0.98 | - |
| Binks [48] | Office | Australia | Yearly | Heating and cooling electricity, space heating gas | - | - | 0.82 |
| Salehi et al. [49] | Academic/Research | Canada | 8 months | Space conditioning, lighting, fans, plug loads | 0.54 | 0.6 | - |
| Gupta and Kapsali [50] | Residential | UK | Yearly | Total electricity | - | - | 0.56 |
| Burman et al. [37] | School | UK | Two years (2011–2013) | Space conditioning, small power, server room load, external lights, lifts | - | - | 0.29 |
| Ballarini and Corrado [51] | Residential | Italy | Yearly | Heating, domestic hot water | 0.93 | 1.36 | - |
© 2019 by the authors. Licensee MDPI, Basel, Switzerland. This article is an open access article distributed under the terms and conditions of the Creative Commons Attribution (CC BY) license (http://creativecommons.org/licenses/by/4.0/).
Share and Cite
MDPI and ACS Style
Shi, X.; Si, B.; Zhao, J.; Tian, Z.; Wang, C.; Jin, X.; Zhou, X. Magnitude, Causes, and Solutions of the Performance Gap of Buildings: A Review. Sustainability 2019, 11, 937. https://0-doi-org.brum.beds.ac.uk/10.3390/su11030937
AMA Style
Shi X, Si B, Zhao J, Tian Z, Wang C, Jin X, Zhou X. Magnitude, Causes, and Solutions of the Performance Gap of Buildings: A Review. Sustainability. 2019; 11(3):937. https://0-doi-org.brum.beds.ac.uk/10.3390/su11030937
Chicago/Turabian StyleShi, Xing, Binghui Si, Jiangshan Zhao, Zhichao Tian, Chao Wang, Xing Jin, and Xin Zhou. 2019. "Magnitude, Causes, and Solutions of the Performance Gap of Buildings: A Review" Sustainability 11, no. 3: 937. https://0-doi-org.brum.beds.ac.uk/10.3390/su11030937
Note that from the first issue of 2016, this journal uses article numbers instead of page numbers. See further details here.