Energy Analysis, and Carbon and Water Footprint for Environmentally Friendly Farming Practices in Agroecosystems and Agroforestry

 ,
,
Abstract
:1. Introduction
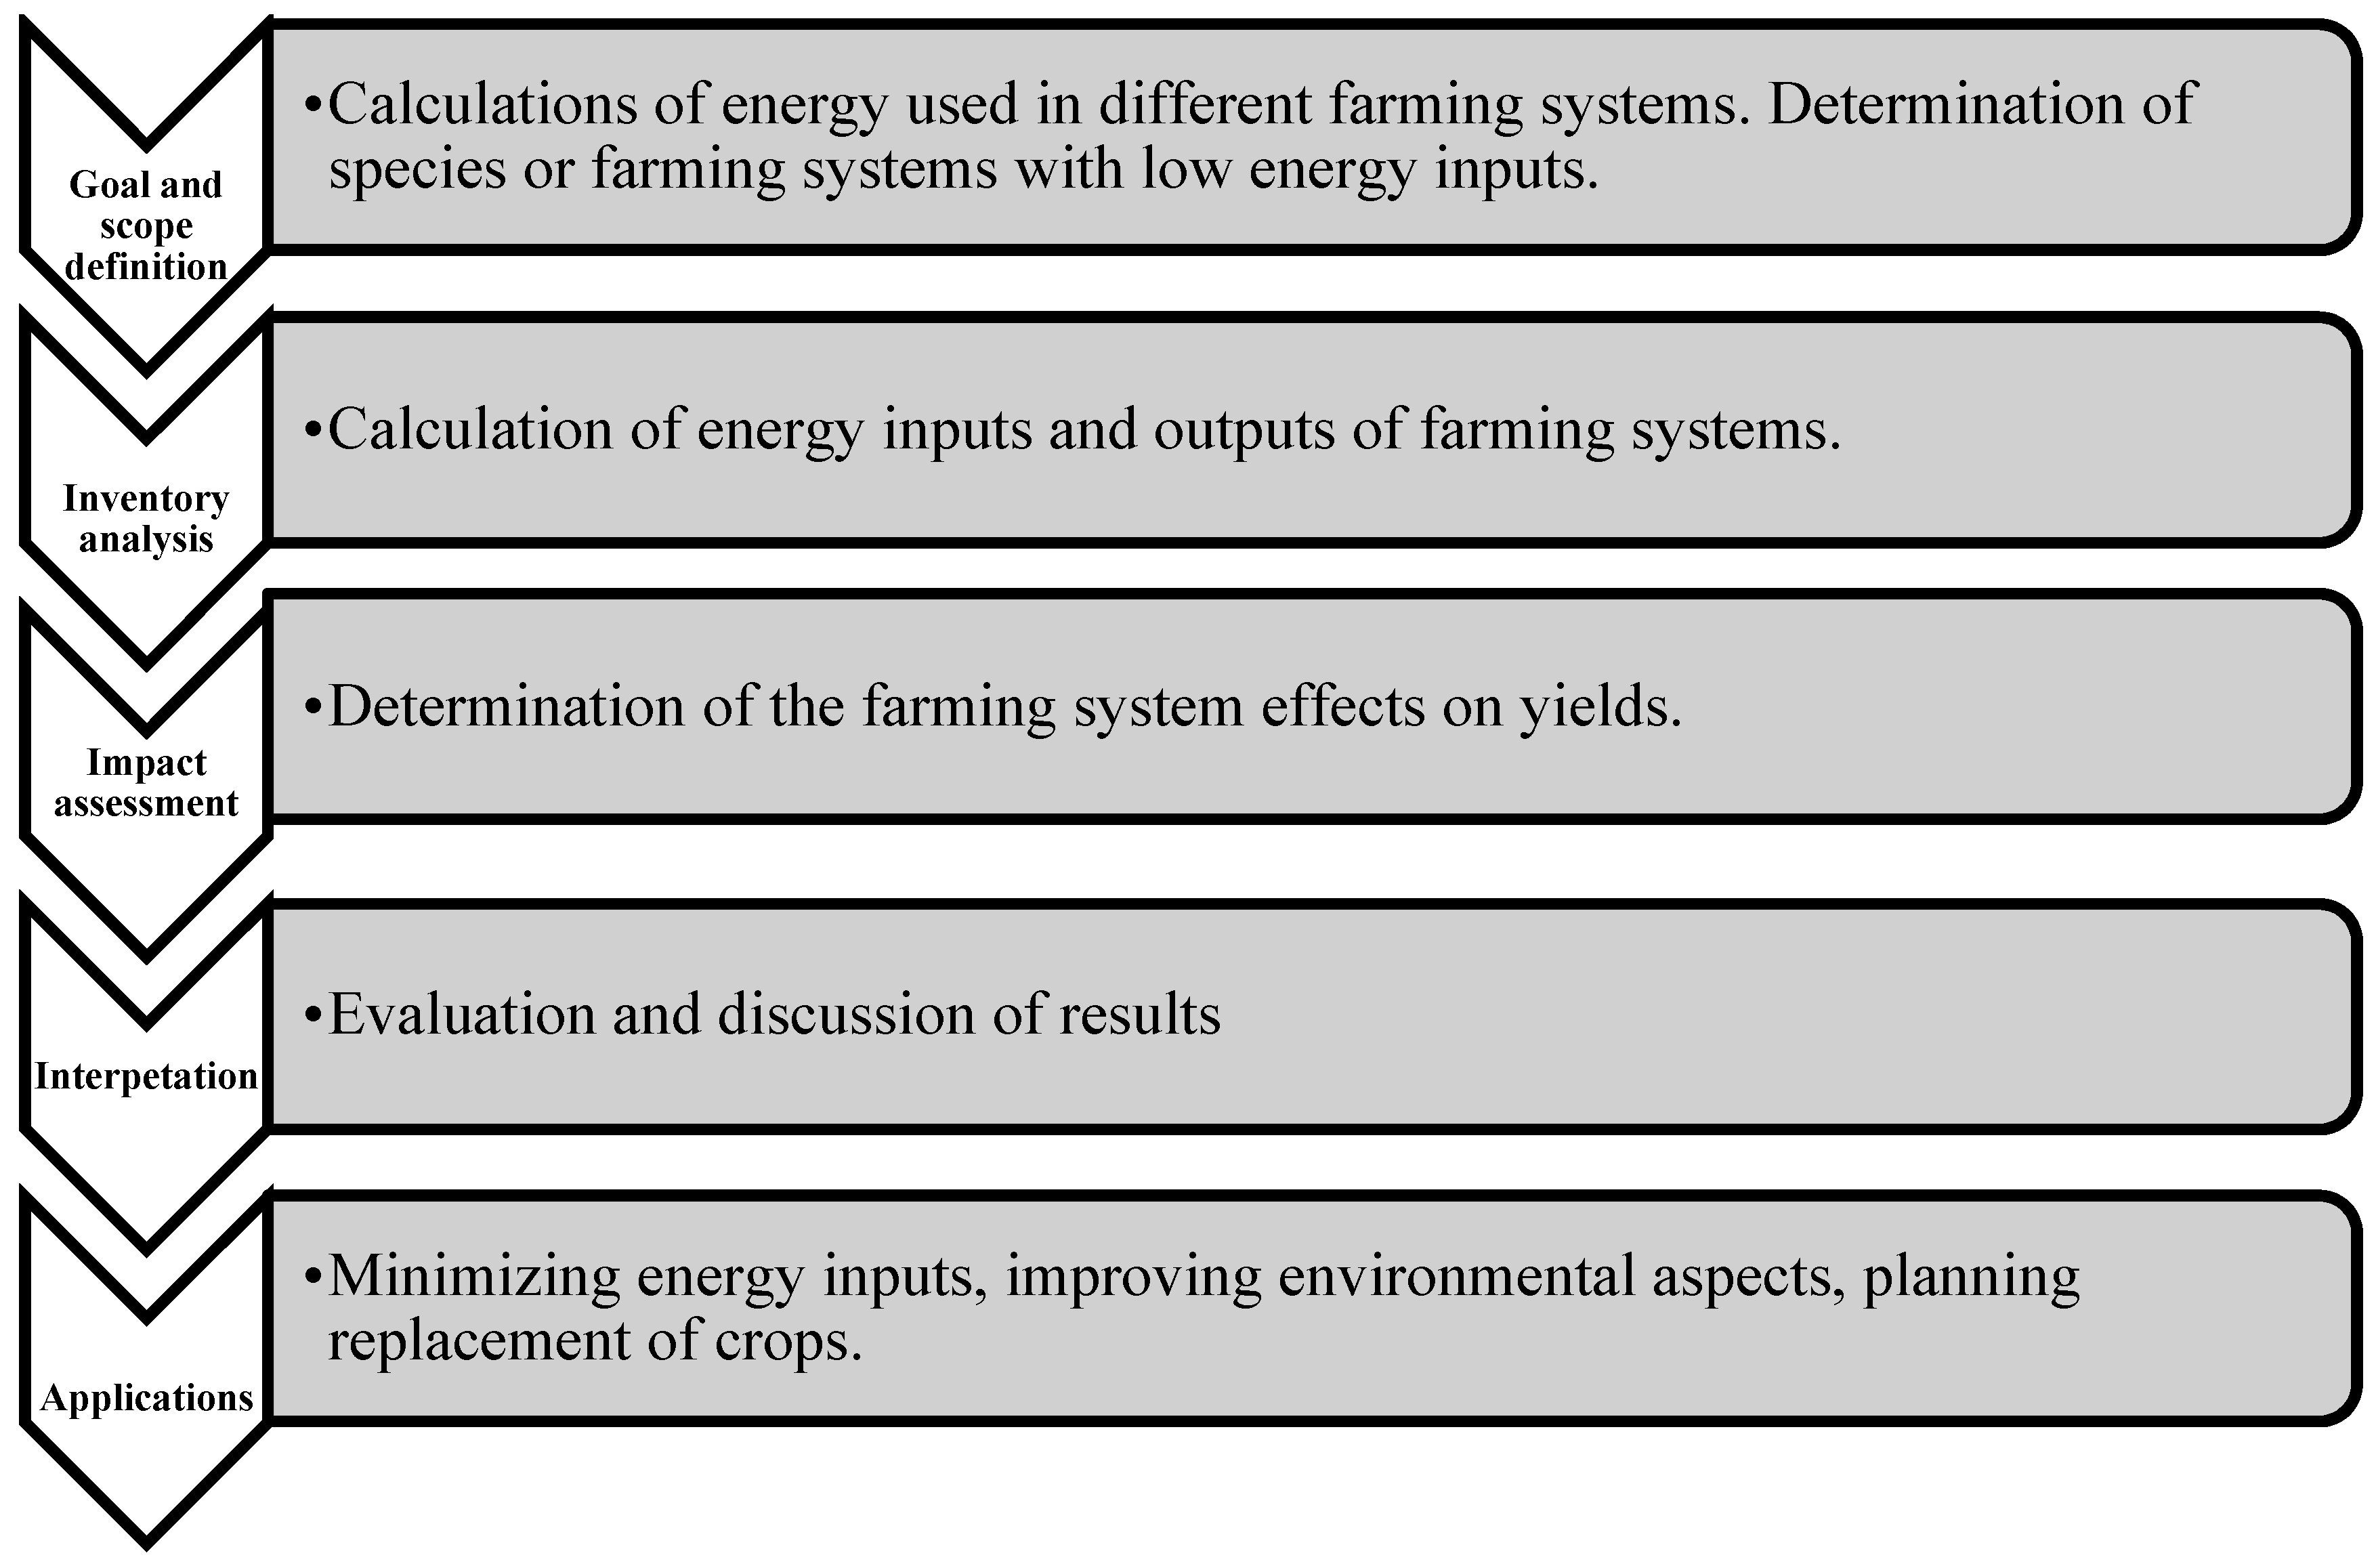
2. Energy in Agroecosystems
Energy Analysis
3. Greenhouse Gas Emissions and Water Use in Agroecosystems
3.1. The Concept of Carbon and Water Footprint
3.2. Carbon and Water Footprint in Agroecosystems
4. A Method for Measuring Energy Use, Carbon and Water Footprint—the Life Cycle Assessment
5. Conclusions
Author Contributions
Funding
Acknowledgments
Conflicts of Interest
References
- Cardinael, R.; Chevallier, T.; Cambou, A.; Béral, C.; Barthès, B.G.; Dupraz, C.; Durand, C.; Kouakou, E.; Chenu, C. Increased soil organic carbon stocks under agroforestry: A survey of six different sites in France. Agric. Ecosyst. Environ. 2017, 236, 243–255. [Google Scholar] [CrossRef]
- Papanastasis, V.P. Agroforestry; Ziti Press: Thessaloniki, Greece, 2015; p. 192. (In Greek) [Google Scholar]
- Food and Agriculture Organization (FAO). Agroforestry. Available online: http://www.fao.org/forestry/agroforestry/80338/en/ (accessed on 5 February 2019).
- Garrett, H.E.; Rietveld, W.J.; McGraw, R.F. Alley cropping practices. North American agroforestry: An integrated science and practice. Agrofor. Syst. 2002, 54, 83–85. [Google Scholar]
- Garrity, D.P. Agroforestry and the achievement of the millennium development goals. Agrofor. Syst. 2004, 61, 5–17. [Google Scholar]
- Williams-Guillen, K.; Perfecto, I.; Vandermeer, J. Bats limit insects in a tropical agroforestry system. Science 2008, 320, 70. [Google Scholar] [CrossRef] [PubMed]
- Nair, P.K.R.; Kumar, B.M.; Nair, V.D. Agroforestry as a strategy for carbon sequestration. J. Plant Nutr. Soil Sci. 2009, 172, 10–23. [Google Scholar] [CrossRef]
- Kumar, B.M.; Nair, P.R. Carbon Sequestration Potential of Agroforestry Systems: Opportunities and Challenges; Springer Science and Business Media: Luxemburg, 2011; Volume 8, pp. 43–60. [Google Scholar]
- Nair, P.K.R. Climate change mitigation: A low-hanging fruit of agroforestry. In Agroforestry-The future of Global Land Use; Kumar, B.M., Nair, P.R., Eds.; Springer: Dordrecht, The Netherlands, 2012; pp. 31–67. [Google Scholar]
- Partey, S.T.; Frith, O.B.; Kwaku, M.Y. Comparative life cycle analysis of producing charcoal from bamboo, teak, and acacia species in Ghana. Int. J. Life Cycle Ass. 2017, 22, 758–766. [Google Scholar] [CrossRef]
- Pragya, N.; Sharma, N.; Gowda, B. Biofuel from oil-rich tree seeds: Net energy ratio, emissions saving and other environmental impacts associated with agroforestry practices in Hassan district of Karnataka, India. J. Clean. Prod. 2017, 164, 905–917. [Google Scholar] [CrossRef]
- Thamo, T.D.; Addai, D.J.; Pannell, D.J.; Robertson, M.J.; Thomas, D.T.; Young, J.M. Climate change impacts and farm-level adaptation: Economic analysis of a mixed cropping–livestock system. Agric. Syst. 2017, 150, 99–108. [Google Scholar] [CrossRef]
- Waldron, A.; Garrity, D.; Malhi, Y.; Girardin, C.; Miller, D.C.; Seddon, N. Agroforestry Can Enhance Food Security While Meeting Other Sustainable Development Goals. Trop. Conserv. Sci. 2017, 10, 1–6. [Google Scholar] [CrossRef]
- Smith, J.; Pearce, B.D.; Wolfe, M.S. A European perspective for developing modern multifunctional agroforestry systems for sustainable intensification. Renew. Agric. Food Syst. 2012, 27, 323–332. [Google Scholar] [CrossRef]
- Torres, C.M.M.E.; Jacovine, L.A.G.; Nolasco de Olivera, N.S.; Fraisse, C.W.; Soares, C.P.B.; de Castro Neto, F. Greenhouse Gas Emissions and carbon sequestration by agroforestry systems in southeastern Brazil. Sci. Rep. UK 2017, 7, 16738. [Google Scholar] [CrossRef]
- World Agroforestry Centre. Agroforestry to Meet the Paris Agreement. 2017. Available online: http://blog.worldagroforestry.org/index.php/2017/11/29/agroforestry-to-meet-the-paris-agreement/ (accessed on 5 February 2019).
- Intergovernmental Panel on Climate Change (IPCC). Climate Change 2014: Mitigation of Climate Change. Contribution of Working Group III to the Fifth Assessment Report of the Intergovernmental Panel on Climate Change; Cambridge University Press: Cambridge, UK, 2014. [Google Scholar]
- Fluck, R.C. Energy in Farm Production; Elsevier Science Publishers: Amsterdam, The Netherlands, 1992. [Google Scholar]
- Li, T.X.; Balezentis, T.; Makutenie, E.D.; Streimikiene, D.; Krisciukaitiene, I. Energy-related CO2 emission in European Union agriculture: driving forces and possibilities for reduction. Appl. Energy 2016, 180, 682–694. [Google Scholar] [CrossRef]
- Kaltsas, A.M.; Mamolos, A.P.; Tsatsarelis, C.A.; Nanos, G.D.; Kalburtji, K.L. Energy budget in organic and conventional olive groves. Agric. Ecosyst. Environ. 2007, 122, 243–251. [Google Scholar] [CrossRef]
- Kavargiris, S.E.; Mamolos, A.P.; Tsatsarelis, C.A.; Nikolaidou, A.E.; Kalburtji, K.L. Energy resources’ utilization in organic and conventional vineyards: energy flow, greenhouse gas emissions and biofuel production. Biomass Bioenergy 2009, 33, 1239–1250. [Google Scholar] [CrossRef]
- Michos, M.C.; Mamolos, A.P.; Menexes, G.C.; Tsatsarelis, C.A.; Tsirakoglou, V.M.; Kalburtji, K.L. Energy inputs, outputs and greenhouse gas emissions in organic, integrated and conventional peach orchards. Ecol. Indic. 2012, 13, 22–28. [Google Scholar] [CrossRef]
- Michos, M.C.; Menexes, G.C.; Kalburtji, K.L.; Tsatsarelis, C.A.; Anagnostopoulos, C.D.; Mamolos, A.P. Could energy flow in agro-ecosystems be used as a “tool” for crop and farming system replacement? Ecol. Indic. 2017, 73, 247–253. [Google Scholar] [CrossRef]
- Litskas, V.D.; Karaolis, C.S.; Menexes, G.C.; Mamolos, A.P.; Koutsos, T.M.; Kalburtji, K.L. Variation of energy flow and greenhouse gas emissions in vineyards located in Natura 2000 sites. Ecol. Indic. 2013, 27, 1–7. [Google Scholar] [CrossRef]
- Hulsbergen, K.J.; Feil, B.; Biermann, S.; Rathke, G.W.; Kalk, W.D.; Diepenbrock, W. A Method of Energy Balancing in Crop Production and its Application in a Long-term Fertilizer Trial. Agric. Ecosyst. Environ. 2001, 86, 303–321. [Google Scholar] [CrossRef]
- Kizilaslan, H. Input–output energy analysis of cherries production in Tokat Province of Turkey. Appl. Energy 2009, 86, 1354–1358. [Google Scholar] [CrossRef]
- Eurostat. Final Energy Consumption by Sector and Fuel. 2014. Available online: https://www.eea.europa.eu/data-and-maps/indicators/final-energy-consumption-by-sector-9/assessment-1#tab-related-briefings (accessed on 5 February 2019).
- Michos, M.C.; Menexes, G.C.; Mamolos, A.P.; Tsatsarelis, C.A.; Anagnostopoulos, C.D.; Tsaboula, A.D.; Kalburtji, K.L. Energy flow, carbon and water footprints in vineyards and orchards to determine environmentally favourable sites in accordance with Natura 2000 perspective. J. Clean. Prod. 2018, 187, 400–408. [Google Scholar] [CrossRef]
- Taxidis, E.T.; Menexes, G.C.; Mamolos, A.P.; Tsatsarelis, C.A.; Anagnostopoulos, C.D.; Kalburtji, K.L. Comparing organic and conventional olive groves relative to energy use and greenhouse gas emissions associated with the cultivation of two varieties. Appl. Energy 2015, 149, 117–124. [Google Scholar] [CrossRef]
- Jianbo, L. Energy balance and economic benefits of two agroforestry systems in northern and southern China. Agric. Ecosyst. Environ. 2006, 116, 255–262. [Google Scholar] [CrossRef]
- Lin, H.C.; Huber, J.; Hülsbergen, J. Energy use efficiency of organic and agroforestry farming systems. Ökobilanzierung. 2013. Available online: http://orgprints.org/21660/1/21660_LIn.pdf (accessed on 5 February 2019).
- Chen, G.Q.; Jiang, M.M.; Chen, B.; Yang, Z.F.; Lin, C. Emergy analysis of Chinese agriculture. Agric. Ecosyst. Environ. 2006, 115, 161–173. [Google Scholar] [CrossRef]
- Ozkan, B.; Fert, C.; Karadeniz, C.F. Energy and cost analysis for greenhouse and open-field grape production. Energy 2007, 32, 1500–1504. [Google Scholar] [CrossRef]
- Kehagias, M.C.; Michos, M.C.; Menexes, G.C.; Mamolos, A.P.; Tsatsarelis, C.A.; Anagnostopoulos, C.D.; Kalburtji, K.L. Energy equilibrium and Carbon dioxide, Methane, and Nitrous oxide-emissions in organic, integrated and conventional apple orchards related to Natura 2000 site. J. Clean. Prod. 2015, 91, 89–95. [Google Scholar] [CrossRef]
- Unakıtan, G.; Aydın, B. A comparison of energy use efficiency and economic analysis of wheat and sunflower production in Turkey: A case study in Thrace Region. Energy 2018, 149, 279–285. [Google Scholar] [CrossRef]
- Eurostat. Greenhouse Gas Emission Statistics. 2017. Available online: http://ec.europa.eu/eurostat/statistics explained/index.php/Greenhouse_gas_emission_statistics (accessed on 5 February 2019).
- Bryngelsson, D.; Wirsenius, S.; Hedenus, F.; Sonesson, U. How can the EU climate targets be met? A combined analysis of technological and demand-side changes in food and agriculture. Food Policy 2016, 59, 152–164. [Google Scholar] [CrossRef] [Green Version]
- Weidema, B.P.; Thrane, M.; Christensen, P.; Schmidt, J.; Løkke, S. Carbon footprint. A catalyst for life cycle assessment? J. Ind. Ecol. 2008, 12, 3–6. [Google Scholar] [CrossRef]
- Alluvione, F.; Moretti, B.; Sacco, D.; Grignani, C. EUE (energy use efficiency) of cropping systems for a sustainable agriculture. Energy 2016, 36, 4468–4481. [Google Scholar] [CrossRef]
- European Climate Foundation. Available online: http://www.roadmap2050.eu/attachments/files/Roadmap2050-AllData-MinimalSize.pdf (accessed on 5 February 2019).
- Paris Agreement. 2015. Available online: http://unfccc.int/paris_agreement/items/9485.php (accessed on 20 July 2018).
- Litskas, V.D.; Mamolos, A.P.; Kalburtji, K.L.; Tsatsarelis, C.A.; Kiose-Kampasakali, E. Energy flow and greenhouse gas emissions in organic and conventional sweet cherry orchards located in or close to Natura 2000 sites. Biomass Bioenergy 2011, 35, 1302–1310. [Google Scholar] [CrossRef]
- Adewale, C.; Reganold, J.P.; Higgins, S.; Evans, R.D.; Carpenter-Boggs, L. Improving carbon foot-printing of agricultural systems: Boundaries, tiers, and organic farming. Environ. Impact Assess. Rev. 2018, 71, 41–48. [Google Scholar] [CrossRef]
- Baah-Acheamfour, M.; Chang, S.X.; Bork, E.W.; Carlyle, C.N. The potential of agroforestry to reduce atmospheric greenhouse gases in Canada: Insight from pairwise comparisons with traditional agriculture, data gaps and future research. For. Chron. 2017, 93, 180–189. [Google Scholar] [CrossRef] [Green Version]
- Mutuo, P.K.; Cadisch, G.; Albrecht, A.; Palm, C.A.; Verchot, L. Potential of agroforestry for carbon sequestration and mitigation of greenhouse gas emissions from soils in the tropics. Nutr. Cycl. Agroecosyst. 2005, 71, 43–54. [Google Scholar] [CrossRef]
- Mosquera-Losada, M.R.; Freese, D.; Rigueiro-Rodríguez, A. Carbon sequestration in European agroforestry systems. In Carbon Sequestration Potential of Agroforestry Systems; Kumar, B.M., Nair, P.K.R., Eds.; Springer: Dordrecht, The Netherlands; Berlin, Germany, 2011; pp. 43–59. [Google Scholar]
- Rigueiro-Rodríguez, A.; López-Díaz, M.L.; Mosquera-Losada, M.R. Organic matter and chromium evolution in herbage and soil in a Pinus radiata silvopastoral system in northwest Spain after sewage sludge and lime application. Commun. Soil Sci. Plant Anal. 2011, 42, 1551–1564. [Google Scholar] [CrossRef]
- Gordon, A.M.; Thevathasan, N.V. How much carbon can be stored in Canadian agroecosystems using a silvopastoral approach? In Silvopastoralism and Sustainable Land Management; Mosquera-Losada, M.R., McAdam, J., Rigueiro-Rodríguez, A., Eds.; CABI Publishing: Wallingford, UK, 2006; pp. 210–219. [Google Scholar]
- Hoekstra, A.Y. Water footprint assessment: evolvement of a new research field. Water Resour. Manag. 2017, 31, 3061–3081. [Google Scholar] [CrossRef]
- Steinfeld, H.P.; Gerber, P.; Wassenaar, T.; Castel, V.; Rosales, M.; Haan, C.D. Livestock’s Long Shadow: Environmental Issues and Options; Food and Agriculture Organization of the United Nations: Rome, Italy, 2006; pp. 131–150. [Google Scholar]
- Mekonnen, M.M.; Hoekstra, A.Y. Global Anthropogenic Phosphorus Loads to Freshwater and Associated Grey Water Footprints and Water Pollution Levels: A High-Resolution Global Study. Water Resour. Res. 2018, 54, 345–358. [Google Scholar] [CrossRef] [Green Version]
- Evans, A.E.; Mateo-Sagasta, J.; Qadir, M.; Boelee, E.; Ippolito, A. Agricultural water pollution: key knowledge gaps and research needs. Curr. Opin. Environ. Sustain. 2019, 36, 20–27. [Google Scholar] [CrossRef]
- Bernués, A.; Ruiz, R.; Olaizola, A.; Villalba, D.; Casasús, I. Sustainability of pasture-based livestock farming systems in the European Mediterranean context: Synergies and trade-offs. Livest. Sci. 2011, 139, 44–57. [Google Scholar] [CrossRef]
- Rodríguez-Ortega, T.; Bernués, A.; Olaizola, A.M.; Brown, M.T. Does intensification result in higher efficiency and sustainability? An emergy analysis of Mediterranean sheep-crop farming systems. J. Clean. Prod. 2016, 144, 171–179. [Google Scholar] [CrossRef]
- East, A.J. What is a Carbon Footprint? An Overview of Definitions and Methodologies. Vegetable Industry Carbon Footprint Scoping Study, Sydney, Australia, 26 September 2008. 2008. Available online: http://vegiecarbontool.com/uploads/Discussion%20Paper%201_What%20is%20a%20carbon%20footprint.pdf (accessed on 5 February 2019).
- Hoekstra, A.Y.; Chapagain, A.K.; Aldaya, M.M.; Mekonnen, M.M. Water Footprint Manual: State of the Art 2009; Water Footprint Network: Enscheda, The Netherlands, 2009. [Google Scholar]
- World Wildlife Fund (WWF). 2010 Living Planet Report; WWF: Gland, Switzerland, 2010. [Google Scholar]
- Wiedmann, T.; Minx, J. A Definition of ‘Carbon Footprint’; Technical Report; ISA Research and Consulting: Durham, UK, 2007. [Google Scholar]
- Kelly, L.M.; Shepson, P.B.; Strim, B.P.; Karion, A.; Sweeney, C.; Gurney, K.R. Aircraft-based measurements of the carbon footprint of Indianapolis. Environ. Sci. Technol. 2009, 43, 7816–7823. [Google Scholar]
- World Business Council for Sustainable Development and World Resource Institute (WRI/WBCSD). The Greenhouse Gas Protocol: A Corporate Accounting and Reporting Standard Revised Edition; World Business Council for Sustainable Development and World Resource Institute: Geneva, Switzerland, 2004. [Google Scholar]
- Carbon Trust. Carbon Footprint Measurement Methodology, Version 1.3; Carbon Trust: London, UK, 2007. [Google Scholar]
- British Standards Institution (BSI). Guide to PAS 2050: How to Assess the Carbon Footprint of Goods and Services; British Standards Institution: London, UK, 2008. [Google Scholar]
- Zafiriou, P.; Mamolos, A.P.; Menexes, G.C.; Siomos, A.S.; Tsatsarelis, C.A.; Kalburtji, K.L. Analysis of energy flow and greenhouse gas emissions in organic, integrated and conventional cultivation of white asparagus by PCA and HCA: cases in Greece. J. Clean. Prod. 2012, 29, 20–27. [Google Scholar] [CrossRef]
- Intergovernmental Panel on Climate Change (IPCC). Software for National Gas Inventories, Intergovernmental Panel on Climate Change. 2006. Available online: https://www.ipcc-nggip.iges.or.jp/public/2006gl/ (accessed on 5 February 2019).
- Akiyama, H.; Yan, X.; Yagi, K. Evaluation of effectiveness of enhanced- efficiency fertilizers as mitigation options for N2O and NO emissions from agricultural soils: meta-analysis. Glob. Chang. Biol. 2010, 16, 1837–1846. [Google Scholar] [CrossRef]
- Escribano, M.; Moreno, G.; Eldesouky, A.; Horrillo, A.; Gaspar, P.; Mesías, F.J. Carbon footprint in dehesa agroforestry systems. In Proceedings of the 4th European Agroforestry Conference, Agroforestry as Sustainable Land Use, Nijmegen, The Netherlands, 28–30 May 2018; pp. 401–405. [Google Scholar]
- Eldesouky, A.; Mesias, F.J.; Elghannam, A.; Escribano, M. Can extensification compensate livestock greenhouse gas emissions? A study of the carbon footprint in Spanish agroforestry systems. J. Clean. Prod. 2018, 200, 28–38. [Google Scholar] [CrossRef]
- Ibidhi, R.; Ben Salem, H. Water footprint assessment of sheep farming systems based on farm survey data. Animal 2019, 407–416. [Google Scholar] [CrossRef]
- Naranjo-Merino, A.C.; Ortíz-Rodriguez, O.O.; Villamizar-G, A.R. Assessing Green and Blue Water Footprints in the Supply Chain of Cocoa Production: A Case Study in the Northeast of Colombia. Sustainability 2018, 10, 38. [Google Scholar] [CrossRef]
- Dalgaard, R.; Schmidt, J.; Flysjö, A. Generic model for calculating carbon footprint of milk using four different life cycle assessment modelling approaches. J. Clean. Prod. 2014, 73, 146–153. [Google Scholar] [CrossRef]
- Paolotti, L.; Boggia, A.; Castellini, C.; Rocchi, L.; Rosati, A. Combining livestock and tree crops to improve sustainability in agriculture: A case study using the Life Cycle Assessment (LCA) approach. J. Clean. Prod. 2016, 131, 351–363. [Google Scholar] [CrossRef]
- Schweinle, J.; Rödl, A.; Börjesson, P.; Neary, D.G.; Langeveld, J.W.A.; Berndes, G.; Cowie, A.; Ahlgren, S.; Margni, M.; Gaudreault, C.; et al. Assessing the Environmental Performance of Biomass Supply Chains: Methods, Results, Challenges and Limitations, IEA Bioenergy, Task 43 Report. 2015, p. 121. Available online: http://www.fs.fed.us/rm/pubsjournals/2015/rmrs 2015 schweinle j001.pdf (accessed on 5 February 2019).
- International Standardization Organization (ISO). Environmental Management-Life Cycle Assessment-Principles and Framework; ISO-Norm 14040:2006; European Committee for Standardization: Brussels, Belgium, 2006. [Google Scholar]
- International Standardization Organization (ISO). Environmental Management-Life Cycle Assessment-Requirements and Guidelines; ISO-Norm 14044:2006; European Committee for Standardization: Brussels, Belgium, 2006. [Google Scholar]
- International Standardization Organization (ISO). Carbon Footprint of Products—Requirements and Guidelines for Quantification and Communication; ISONorm 14067:2013; European Committee for Standardization: Brussels, Belgium, 2013. [Google Scholar]
- Pandey, D.; Agrawal, M.; Pandey, J. Carbon footprint: Current methods of estimation. Environ. Monit. Assess. 2011, 178, 135–160. [Google Scholar] [CrossRef]
- Hoekstra, A.Y.; Chapagain, A.K. Globalization of Water: Sharing the Planet’s Freshwater Resources; Wiley-Blackwell: Hoboken, NJ, USA, 2008; pp. 12–15. [Google Scholar]
- Ababaei, B.; Etedali, H.R. Estimation of water footprint components of Iran’s wheat production: comparison of global and national scale estimates. Environ. Process. 2014, 1, 193–205. [Google Scholar] [CrossRef]
- Hoekstra, A.Y.; Chapagain, A.K.; Aldaya, M.M.; Mekonnen, M.M. The Water Footprint Assessment Manual: Setting the Global Standard; Earth Scan: London, UK, 2011. [Google Scholar]
- Recanati, F.; Arrigoni, A.; Scaccabarozzi, G.; Marveggio, D.; Melià, P.; Dotelli, G. LCA Towards Sustainable Agriculture: The Case Study of Cupuaçu Jam from Agroforestry. Procedia CIRP 2018, 69, 557–561. [Google Scholar] [CrossRef]
- Roy, P.; Nei, D.; Orikasa, T.; Xu, Q.; Okadome, H.; Nakamura, N.; Shiina, T. A review of life cycle assessment (LCA) on some food products. J. Food Eng. 2009, 90, 1–10. [Google Scholar] [CrossRef]
- Finkbeiner, M.; Inaba, A.; Tan, R.B.H.; Christiansen, K.; Klüppel, H.J. The new international standards for life cycle assessment: SO 14040 and ISO 14044. Int. J. Life Cycle Ass. 2006, 11, 80–85. [Google Scholar] [CrossRef]
- Finnveden, G.; Hauschild, M.Z.; Ekvall, T.; Guinιe, J.; Heijungs, R.; Hellweg, S.; Koehler, A.; Pennington, D.; Suh, S. Recent developments in Life Cycle Assessment. J. Environ. Manag. 2009, 91, 1–21. [Google Scholar] [CrossRef] [Green Version]
- Intergovernmental Panel on Climate Change (IPCC). Greenhouse Gas Inventory Reference Manual; Three Volumes; Intergovernmental Panel on Climate Change, Technical Support Unit: London, UK, 1997. [Google Scholar]
- EMEP/CORINAIR. Atmospheric Emissions Inventory Guidebook. Group 10: Agriculture, 3rd ed.; European Environment Agency: Copenhagen, Denmark, 2007. [Google Scholar]
- Mekonnen, M.M.; Hoekstra, A.Y. The green, blue and grey water footprint of crops and derived crop products. Hydrol. Earth Syst. Sci. 2011, 15, 1577–1600. [Google Scholar] [CrossRef] [Green Version]
- Mekonnen, M.M.; Hoekstra, A.Y. Water footprint benchmarks for crop production: A first global assessment. Ecol. Indic. 2014, 46, 214–223. [Google Scholar] [CrossRef] [Green Version]
- International Standardization Organization (ISO). Environmental Management—Water Footprint—Principles, Requirements and Guidelines; ISO 14046:2014; European Committee for Standardization: Brussels, Belgium, 2014. [Google Scholar]
- Erickson, P.; Owen, A.; Dawkins, E. Low-Greenhouse-Gas Consumption Strategies and Impacts on Developing Countries. 2012. Available online: https://www.sei.org/publications/low-greenhouse-gas-consumption-strategies-and-impacts-on-developing-countries/ (accessed on 5 February 2019).
- Chapagain, A.; James, K. The Water and Carbon Footprint of Household Food and Drink Waste in the UK; Waste and Resources Action Programme (WRAP): Banbury, UK, 2011. [Google Scholar]
- Hoekstra, A.Y. Water Neutral: Reducing and Offsetting the Impacts of Offsetting Water Footprints. UNESCO-IHE Value of Water Research Report Series No. 28. 2008. Available online: https://ris.utwente.nl/ws/portalfiles/portal/5148071/Report28-WaterNeutral.pdf (accessed on 5 February 2019).
- Hoekstra, A.Y. The Water Footprint of Modern Consumer Society; Routledge: London, UK, 2013. [Google Scholar]


| Food Product | kg CO2-eq kg−1 |
|---|---|
| Beef Meat | 30.4 |
| Eggs | 4.81 |
| Pork meat | 4.36 |
| Olive oil | 3.9 |
| Chicken | 3.83 |
| Rice | 1.8 |
| Legumes | 1.13 |
| Bread | 0.98 |
| Sugar | 0.47 |
| Potato | 0.16 |
| Tomato (open-field) | 0.15 |
| Apple | 0.07 |
© 2019 by the authors. Licensee MDPI, Basel, Switzerland. This article is an open access article distributed under the terms and conditions of the Creative Commons Attribution (CC BY) license (http://creativecommons.org/licenses/by/4.0/).
Share and Cite
Platis, D.P.; Anagnostopoulos, C.D.; Tsaboula, A.D.; Menexes, G.C.; Kalburtji, K.L.; Mamolos, A.P. Energy Analysis, and Carbon and Water Footprint for Environmentally Friendly Farming Practices in Agroecosystems and Agroforestry. Sustainability 2019, 11, 1664. https://0-doi-org.brum.beds.ac.uk/10.3390/su11061664
Platis DP, Anagnostopoulos CD, Tsaboula AD, Menexes GC, Kalburtji KL, Mamolos AP. Energy Analysis, and Carbon and Water Footprint for Environmentally Friendly Farming Practices in Agroecosystems and Agroforestry. Sustainability. 2019; 11(6):1664. https://0-doi-org.brum.beds.ac.uk/10.3390/su11061664
Chicago/Turabian StylePlatis, Dimitrios P., Christos D. Anagnostopoulos, Aggeliki D. Tsaboula, Georgios C. Menexes, Kiriaki L. Kalburtji, and Andreas P. Mamolos. 2019. "Energy Analysis, and Carbon and Water Footprint for Environmentally Friendly Farming Practices in Agroecosystems and Agroforestry" Sustainability 11, no. 6: 1664. https://0-doi-org.brum.beds.ac.uk/10.3390/su11061664