The Differential Effect of Exploration and Exploitation on Work Performances

1
College of Business Administration, Hongik University, Seoul 04066, Korea
2
School of Business, Hanyang University, Seoul 04763, Korea
*
Author to whom correspondence should be addressed.
Sustainability 2019, 11(7), 2074; https://0-doi-org.brum.beds.ac.uk/10.3390/su11072074
Submission received: 14 February 2019
/
Revised: 29 March 2019
/
Accepted: 2 April 2019
/
Published: 8 April 2019
(This article belongs to the Section Economic and Business Aspects of Sustainability)
Abstract
:In organizations, the role of ambidexterity is becoming critical these days. Flexibility that enables creativity and innovation in work is also important for survival in a wildly competitive market and flexibility determines the economic sustainability of business enterprises. Drawing on the ambidexterity of exploration and exploitation, we believe that there is a fit between each of them and certain tasks, i.e., operational or dynamic works. Thus, the current study will investigate the individual levels of exploratory and exploitative work capability. Most importantly, the complementary relationship between exploration and exploitation and its differential influence on work performance will be specifically evaluated. The current study results show that if the complementary fit of exploration and exploitation is appropriate for the tasks at hand, performance will increase.
1. Introduction
Google is representative of an ambidextrous organization. Its employees work on exploratory or innovative projects of their own at the rate of 20% and on exploitative or operational corporate projects at the rate of 80% of their time and effort. Flexibility incurs trade-offs with expertise: “As expertise is acquired, flexibility may be lost” [1]. Experts are more cognitively entrenched than novices, and hence, they conform to their densely structured schemata, resulting in less adaptive or creative solutions [2]. Expertise does not try to search outside the domain when it is necessary in a dynamic environment to pursue innovation. Adaptability is regarded as flexibility considering more change, which has a certain direction [3]. The adaptability and flexibility of an organization and its employees are critical to a corporation’s sustainability in an unlimited competitive market of highly connected business ecosystems.
The pattern of work is a critical subject in which practitioners and scholars are becoming interested. That is, it is necessary to study how we should work for the success of an organization since that becomes more important than whether we will reach our goal or not. Organizational learning determines strategic orientation and performance in corporations. It has two patterns of learning, exploratory vs. exploitative, such that the former represents innovation, external search, integration, global adaptation, and a flexible process of innovation, and the latter represents incrementation, internal search, automation, local adaptation, and an efficient process of operation [4].
The two types have been studied largely in the context of organizations, not the individual level of employee capability. Further, the different types of employees’ work capabilities have been the focus of recent research, and yet, there are still few of them we can find. Thus, the current study will investigate the individual level of exploratory and exploitative work capability. Most importantly, the complementary relationship between exploration and exploitation and its differential influence on work performance will be specifically evaluated.
2. Theoretical Background
2.1. Ambidextrous Organization
There are two contradictory streams of organizational learning perspective: The ambidextrous vs. the idiosyncratic organization, in other words, ambidexterity vs. punctuated equilibrium or flexible vs. stabilized. In the first perspective, an organization should have two learning processes simultaneously, exploratory and exploitative learning. In the latter, an organization is stabilized into one of the learning mechanisms, resulting in either an exploratory or an exploitative organization. Punctuated equilibrium is a paradigm that embraces the importance of transition and alternation between exploration and exploitation. Gersick [5] explicated punctuated equilibrium from and applied to six domains, which resulted in a generally accepted paradigm in organizational development. In the paradigm, alternation between long periods of incremental change and brief periods of revolution results in equilibrium. Process management or organizational routinization increases exploitative innovation but decreases exploratory innovation [6]. However, in the ambidextrous organizational form, the process management does not dampen exploratory innovation. The existence of the dual structure of exploitation and exploration has been proven to adapt to rapid innovation.
Benner and Tushman’s study [6] has been cited and extended for more than a decade and has resulted in great acceptance of the proposition that an adaptive organization should have an ambidextrous structure that enables exploitative and exploratory innovation. In the changing, turbulent, and competitive business environment, a stabilized organization will not adapt and survive. Exploration and exploitation have interactive as well as independent and exclusive features. Although it is easy to understand that each has an opposite impact on organizations and individuals, the interaction between them has meaningful influences [7,8]. The two are well known to lead to the most productive organization when they simultaneously exist, and this is referred to as an “ambidextrous” organization.
Ambidexterity has been regarded as a firm’s ability to simultaneously explore and exploit; it enables a firm to adapt over time and eventually survive in an ultimately competitive market [8]. Rapid change in an organization requires new innovation for competition, which is generally led by a technological evolution. In fact, the interchangeability between exploration and exploitation is essential to ambidextrous organizations.
Drawing on the ambidexterity of exploration and exploitation, we believe that there is a fit between both of them and certain tasks, i.e., operational or dynamic works. Work that requires an individual’s operational capability will need his/her exploitative skills to accomplish the work, and work that requires an individual’s dynamic capability will need his/her exploratory skills. Even though the two types of work might transit each other many times while they proceed to accomplish the corresponding work [9], we presume that the larger proportion of the work will be determined by the type of task: Exploitive capability will be mainly posited in ambidexterity when he/she is performing operational capability work, exploratory capability will be mainly posited in ambidexterity when he/she is performing dynamic capability work. The switching pattern is contextual because it arises from the features of its organizational context where contextual ambidexterity is the behavioral capacity to simultaneously demonstrate alignment (i.e., coherence among all the patterns of activities in the business unit) and adaptability (i.e., the capacity to reconfigure activities in the business unit quickly to meet changing demands in the task environment) across an entire business unit [10].
2.2. Complementary Fit (Incongruence) in Work Ambidexterity
The supplementary congruence is usually hypothesized in organizational ambidexterity where a balanced amount of exploration and exploitation in every level (i.e., whether both are low or high) will increase performance. However, there are the opposite practices that show that complementary incongruence is presented in a certain organizational setting such as an innovative process or adaptive stage. This has been called the “exploration and exploitation paradox” in organizational studies, and although there have been theoretical and empirical debates, it seems to be still controversial. Contributing to the differentiation–integration tension, findings reveal that firms use a mix of integration and differentiation tactics to manage the paradoxes [11].
In the working pattern, we presumed complementary incongruence where, for a certain type of performance, a more proportioned exploration in the ambidextrous spectrum will increase the performance (i.e., diverging incongruence), or a more proportioned exploitation in ambidexterity will increase the corresponding performance (i.e., converging incongruence). They should be flexibly transitional in different proportions of complementary incongruence in ambidextrous (i.e., the simultaneous existence of both exploration and exploitation) work.
In an ambidextrous organization, the transitioning of both processes is the core of its flexibility. The exploitative and exploratory processes need to be integrated (vs. differentiated), and the two are transitional, alternating and switching with each other in sequence or in a repeating cycle simultaneously as well. In addition, the working individual needs to be ambidextrous and to have a transitional capability to alternate between the two processes of exploration and exploitation in order to make an organization ambidextrous. We propose that workers should also be able to transit between exploratory and exploitative work flexibly in order to enable work ambidexterity. The validation of the transitional effect of work patterns will suggest how the work setting should be designed for the future.
2.3. Dimensions of Work Performance
Further, performance has various dimensions such as proficiency, adaptability, or proactivity [12]. Previous studies on the impact of Information Systems (IS) on performance usually have only focused on operational performance such as proficiency [6,13,14]. However, many invaluable operations in an organization need creative, proactive, flexible, self-managed, innovative capabilities to solve new, complex, vague, or multi-variate problems that usually do not have simple or right answers, to confront the chaotic business market [15,16,17,18]. In the current study, we included all the above dimensions of work performance to validate the effect of the use pattern of IS on each dimension.
2.4. Hypotheses
2.4.1. First-Order Effect of Work Exploration and Work Exploitation on Performance
Before we tested the role of complementary incongruence in ambidexterity, we primarily hypothesized and tested the first-order effect of exploration and exploitation on each type of performance. Following the logic of ambidexterity, both dimensions need to play simultaneous roles to enhance work performance. However, we differentially decomposed the effect of both such that exploitation will increase operational capabilities such as proficiency, and exploration will increase adaptational capabilities such as adaptability and proactivity.
Hypothesis 1a (H1a).
Work exploitation will increase proficiency more than work exploration will.
Hypothesis 1b (H1b).
Work exploration will increase adaptivity more than work exploitation will.
Hypothesis 1c (H1c).
Work exploration will increase proactivity more than work exploitation will.
2.4.2. Converging Work Ambidexterity
The IS ambidexterity in individual performance will present a complementary fit to both operational (i.e., proficiency) and dynamic (i.e., adaptability and proactivity) capabilities. Exploitative work will have a positive effect on operational capability, and the impact will increase concavely while the converging incongruence increases. Exploratory work will have a positive effect on dynamic capability, and the impact will increase concavely while the diverging incongruence increases.
Converging ambidexterity refers to a complementary fit (congruence) where exploitation posits an increasingly gradual ratio in a certain state of ambidexterity. For instance, when a worker exploits more than he or she explores and as the proportion of exploitation overruns exploration, we define this state as a converging ambidexterity of work. The converging ambidexterity will increase the operational capability. Specifically, the exploitative work will increase operational capability in a concave relationship [19] where the improvement in operation capability will peak after a certain duration of time, and then it will become slow and moderate.
Hypothesis 2a (H2a).
In work ambidexterity, proficiency will increase along converging incongruence where exploitation is greater than exploration in the incongruence line of exploration = −exploitation.
In terms of response surface analysis: 1. The response surface of proficiency will have a positive curvature along the line of exploration = −exploitation, i.e., y = −x; 2. the slope along the line of exploration = −exploitation (i.e., y = −x) is negative; and 3. there exists a lateral shift of the y = −x line to exploitation > exploration.
2.4.3. Diverging Work Ambidexterity
In contrast, diverging work ambidexterity is when the proportion of work exploration exceeds work exploitation. We hypothesize that the performance related to explorative work such as adaptive or proactive work will require the worker to use the work exploratively in adapting to the work at hand. While they work on tasks without exact answers or structure and it is an innovative or creative job, then they also need to use work in a way they have not used it before. The more capable they are of exploring the work in a new way to find new knowledge, the higher the possibility they will discover how to accomplish the proactive job.
Hypothesis 2b (H2b).
In work ambidexterity, adaptivity will increase along diverging incongruence where exploration is greater than exploitation in the incongruence line of exploration = −exploitation.
In terms of response surface analysis: 1. The response surface of proficiency will have a positive curvature along the line of exploration = −exploitation, i.e., y = −x; 2. the slope along the line of exploration = −exploitation (i.e., y = −x) is positive; and 3. there exists a lateral shift of the y = −x line to the zone of exploitation < exploration.
Hypothesis 2c (H2c).
In work ambidexterity, proactivity will increase along diverging incongruence where exploration is greater than exploitation in the incongruence line of exploration = −exploitation.
In terms of response surface analysis: 1. The response surface of proficiency will have a positive curvature along the line of exploration = −exploitation, i.e., y = −x; 2. the slope along the line of exploration = −exploitation (i.e., y = −x) is positive; and 3. there exists lateral shift of the y = −x line to the zone of exploitation < exploration.
3. Methodology
3.1. Data Collection
We implemented an online survey to recruit participants who are employed in companies and have various jobs. Three hundred employees responded to the survey, the demographic descriptions of which are shown in Table 1. In Table 2, we present the intercorrelations of variables measured by the survey. Measures are presented in Table 3.
3.2. Analytical Strategy
As an analytic tool for testing our hypotheses, we used polynomial regression and a response surface test recommended by Edwards and Parry [20] that has been widely used in research on person–environment fit. This method allows for examining more precisely the interaction relationship or (in)congruence effect between two variables on the outcome variable [20].
We tested our hypotheses by regressing each type of performance (i.e., proficiency, adaptive behavior, or proactive behavior) on the set of control variables and five polynomial terms: Two linear terms (i.e., work exploration and work exploitation) and three high-order terms (i.e., the squared term of work exploration, the squared term of work exploitation, and the product term of work exploration and work exploitation). In addition, we modeled the scale-centered value of work exploration and work exploitation to reduce multicollinearity and facilitate the interpretation of the results. The relationship between component X (work exploration), component Y (work exploitation), and outcome Z (either proficiency, adaptive behavior, or proactive behavior) can be described with following equation:
Z = b0 + b1X + b2Y + b3 X2 + b4XY + b5Y2 + e.
According to Edwards and Parry (1993), to examine the complementary fit effect, the results of polynomial regression should satisfy the following conditions: First, when high-order terms are included in polynomial equations, the explanation of dependent variables is significantly increased. Second, among high-order terms (b3, b4, or b5), any one of them has a significant regression coefficient. Furthermore, based on these results, this equation has significant results in the response surface test on a three-dimension graph. Following Edwards and Cable (2009), for testing the complementary fit or incongruence effect, the surface test should meet the following criteria: The slope of the congruence line (Y = X) a1 is positive, the curvature of the incongruence line (Y = −X) a4 is negative, and both are statistically significant. When these conditions are satisfied, there should be an upward curvature along the line of incongruence (Y = −X) on the three-dimensional graph.
4. Results
Main variables, descriptive statistics, values of control variables, and correlations among the study variables are presented in Table 2. As anticipated in the study, it was observed that there are significant correlations—ranging from 0.11 up to 0.71—between work exploration and work exploitation in each of the three types of performance.
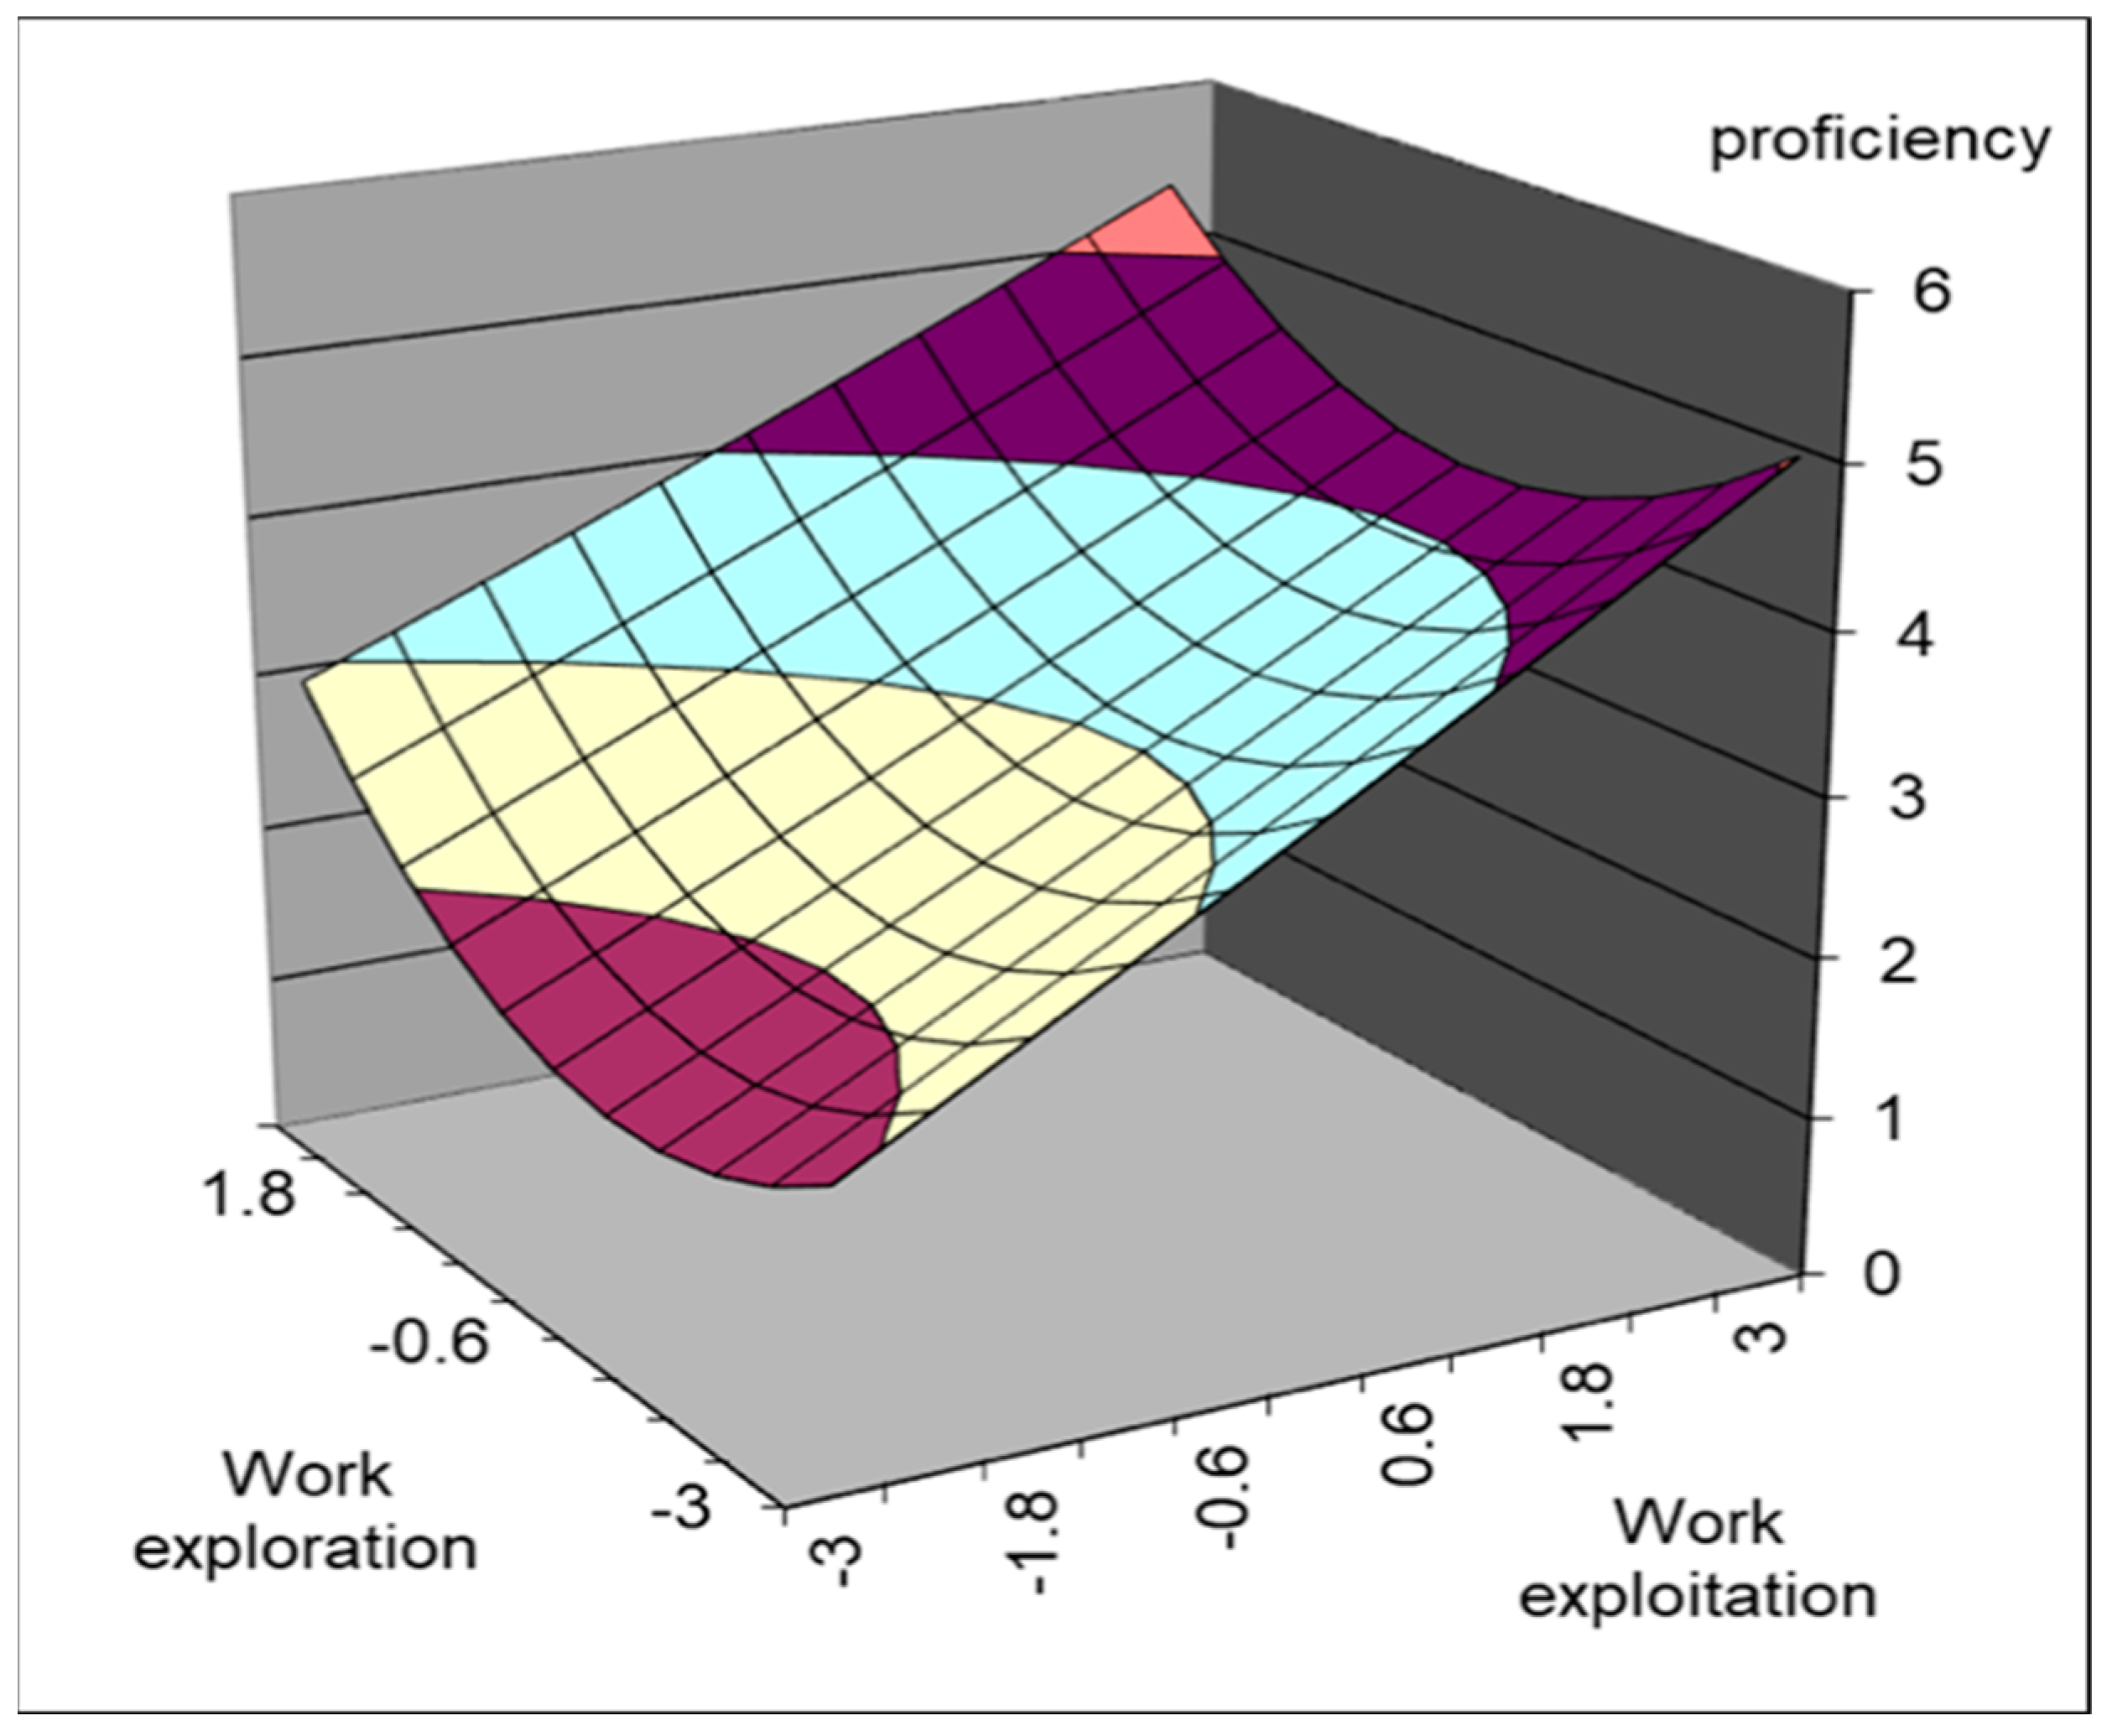
For proficiency, hypotheses 1a and 2a were tested by using polynomial regression. The results are shown in Table 4. In Model 1, control variables were inserted; in Model 2, main effects were examined; and in Model 3, high-order terms for work exploration and work exploitation were inserted in sequence. First, for main effects, both work exploration (β = 0.14 p < 0.05) and work exploitation (β = 0.46, p < 0.001) were found to predict proficiency positively and significantly (see Model 2). Furthermore, we conducted the difference score test to examine the relative effect size between the two coefficients. According to the results, the difference score was significant (value = 0.32, p < 0.001), which supports hypothesis 1a. When high-order terms were included, this equation’s explanation on proficiency was significantly increased (ΔR2 = 0.08, p < 0.01); also, one of the high-order terms was statistically significant in predicting proficiency (work exploration2 = 0.23, p < 0.001) (see Model 3). Based on these results, the response-surface test on the three-dimensional graph shows that the surface was concave. As depicted in Figure 1, along the Y = X (work exploitation = work exploration) lines, the slope had a significantly positive value of 0.55, and the curvature of the Y = −X (work exploitation = −work exploration) line was significantly positive (a4 = 0.13, p < 0.001). These results indicated that proficiency is higher when IT exploration and IT exploitation become differential and decreased when IT exploration and IT exploitation become similar (i.e., supporting H2a). However, because there was a lateral shift (a5) along the Y = −X line, the value was −1.23, and it differed from 0, the highest proficiency does appear to lean on specific corners. Therefore, hypothesis 2a was fully supported.
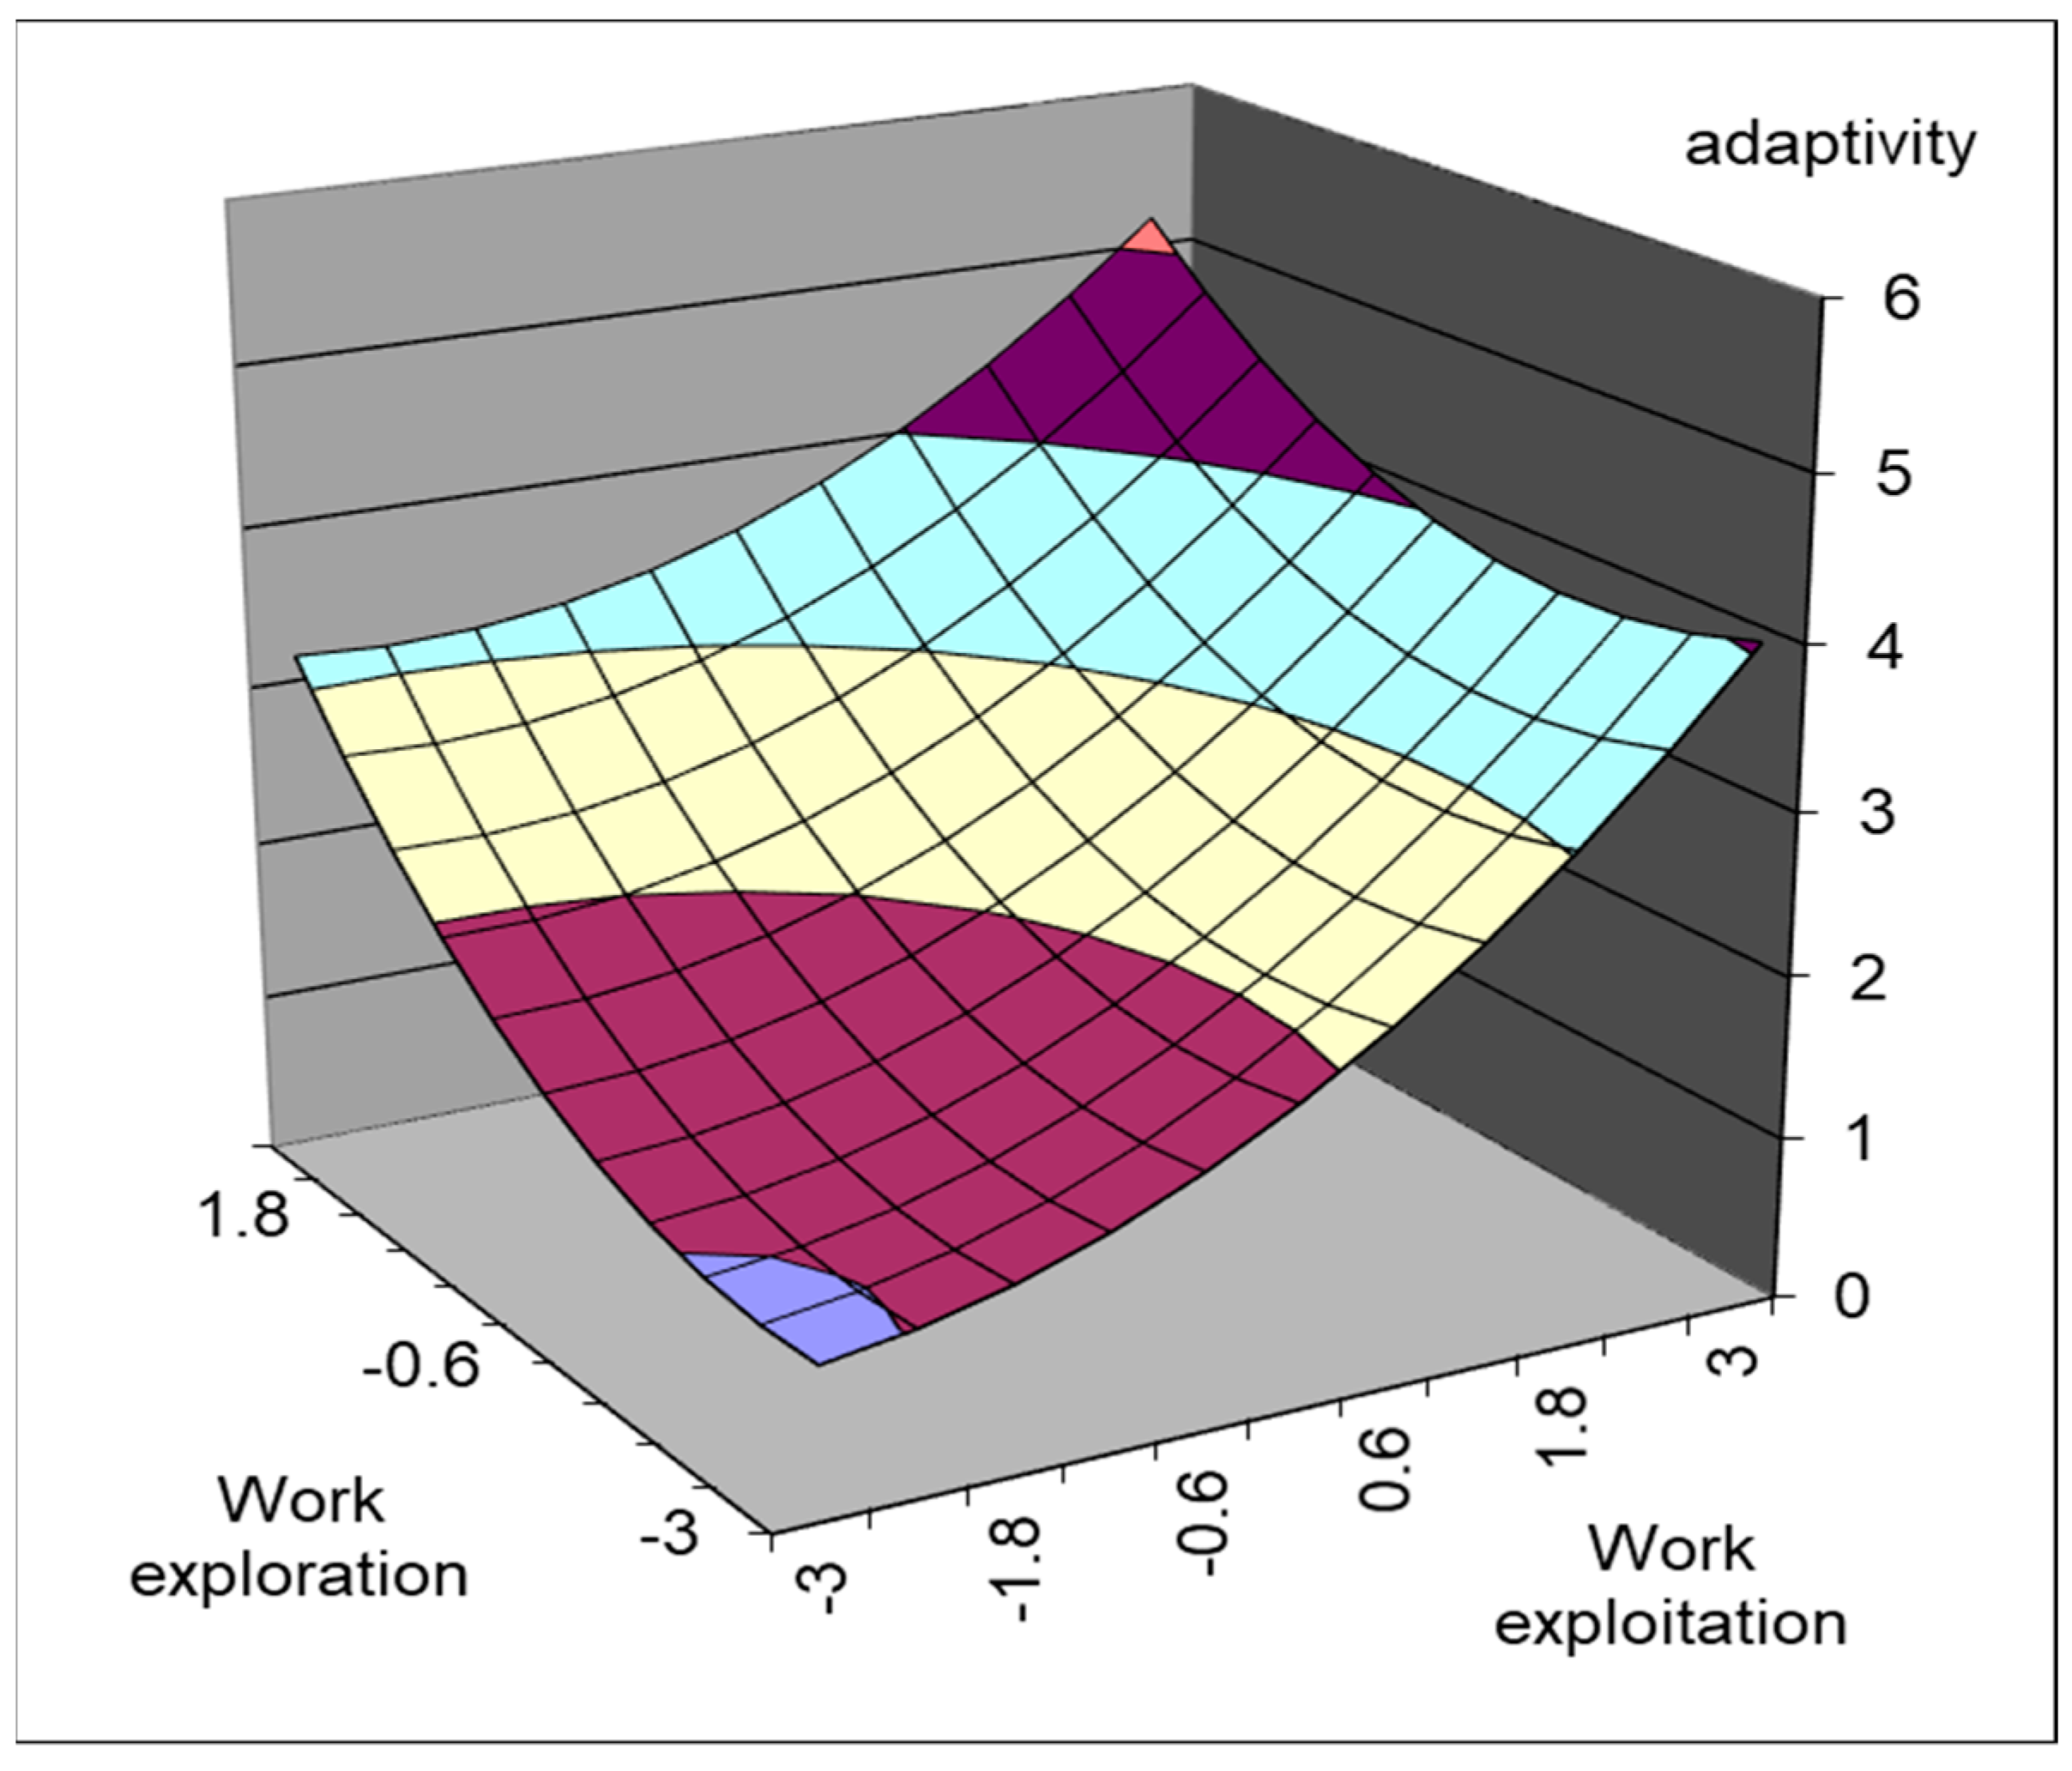
For adaptive behavior, hypotheses 1b and 2b were validated through the same procedure. The results are shown in Table 5. First, looking at the main effects (see Model 6), it was found that both work exploration (β = 0.34, p < 0.001) and work exploitation (β = 0.41, p < 0.001) predicted adaptive performance positively and significantly, and the difference test between the two coefficients was not significant (value = 0.07, t = 0.00), which shows that both work activities have same size of explanation for adaptive performance. Thus, hypothesis 1b was rejected. Hence, as shown in Model 6, the findings indicate that the equation that added high-order terms explains adaptive behavior marginally significantly (ΔR2 = 0.01, p < 0.10), and among three of the higher terms, the squared term of work exploration (β = 0.15, p < 0.01) was statistically significant (see Model 6). Furthermore, in the results of the response surface test, only the slope of the Y = X line was significant (a1 = 0.71, p < 0.001). There was no significant curvature for supplementary fit, which indicates a linear relationship wherein an employee’s adaptive performance is greater than employees’ activities when both work exploration and work exploitation are high than when both of them are low (see Figure 2). In addition, the slope of the Y = −X line was not significant (a3 = 0.15, p = n.s), and the curvature of the Y = −X line was significant (a4 = 0.17, p < 0.001). The complementary fit effect was observed (i.e., supporting H2b). Overall, lateral shift (a5) was negative (−0.43), and it did not differ from 0, a perfect incongruence effect was observed, and the highest proficiency does not appear to lean on specific corners in the three-dimensional graph of Figure 2. These partially support hypothesis 2b.
For proactive behavior, hypotheses 1c and 2c were also assessed by the same procedure. The results are shown in Table 6. For the main effect, both work exploration (β = 0.53, p < 0.001) and work exploitation (β = 0.23, p < 0.001) positively predicted proactive behavior, and the results of the difference test of the two coefficients was significant (value = 0.30, t = −5.89). These suggest that the work exploration has a relatively stronger effect size on proactive behavior than Information Technology (IT) exploitation does, supporting hypothesis 1c.
In polynomial regression, after including the high-order terms, the variance of proactive behaviors was not significantly increased (see Model 9). Even though the polynomial term was added in the model, each coefficient was not statistically significant, and neither was the R2 changed for the whole regression model. Therefore, the conditions for the surface response test were not fulfilled, and the graphs are not provided. Overall, hypothesis 2c was not supported.
5. Discussion and Conclusions
The role of ambidexterity in organizations is becoming critical these days. With the help of information technologies, tasks in work settings have been rapidly automated and standardized. At the same time, the flexibility to enable creativity and innovation in work is also important for survival in a wildly competitive market. There is an inertia in which workers do their jobs as they always have to accomplish the optimal short-term productivity, which many organizations have long practiced.
Our study has proven that there exists a differential effect of exploratory vs. exploitative work styles on work performance, such that operational performance (i.e., proficiency) improves more through exploitative work and dynamic capabilities (i.e., adaptability or proficiency) are enhanced more through exploratory work. In addition, we verified that the two work styles are complementary based on the existence of ambidexterity in the styles; that is, workers implement their jobs with both but at a differential ratio. Those who work ambidextrously work within a flexible exchange of both styles as well as in appropriate proportion, depending on the type of work required. This type of worker will perform well in any organization. The results also indicate that the flexible exchange of work styles increases the possibility of a corporation’s survival and sustainability in competitive business ecosystems.
It is easy to see ambidextrous organizations as out of order, malfunctioning, or confusing, at least in the early stage. However, they have huge potential for a sustainable competitive advantage with out-of-the-box solutions to unclear problems, innovative products, or creative marketing. The current study results show that if the complementary fit of exploration and exploitation, which is the ambidexterity of the working pattern, is appropriate for the tasks at hand, performance will increase. In future research, the results of this study could be expanded to various settings in the work environment and to individual characteristics of employees, and this will lead to an understanding of how innovation can be developed in a structured, ambidextrous organization.
Author Contributions
H.K. contributed to conceptualization, investigation, resources, Writing—Original Draft preparation, Writing—Review and Editing, and funding acquisition; and M.K. contributed to methodology, software, validation, formal analysis, data curation, and visualization.
Funding
This work was supported by the Ministry of Education of the Republic of Korea and the National Research Foundation of Korea (NRF-2015S1A5A2A03048360) and Hongik University Research Fund.
Conflicts of Interest
The authors declare no conflict of interest.
References
- Lewandowsky, S.; Little, D.; Kalish, M.L. Knowledge and expertise. Handb. Appl. Cogn. 2007, 830109, 125–155. [Google Scholar]
- Dane, E. Reconsidering the trade-off between expertise and flexibility: A cognitive entrenchment perspective. Acad. Manag. Rev. 2010, 35, 579–603. [Google Scholar]
- Kane, G.C.; Alavi, M. Information technology and organizational learning: An investigation of exploration and exploitation processes. Organ. Sci. 2007, 18, 796–812. [Google Scholar] [CrossRef]
- Mithas, S.; Rust, R.T. How information technology strategy and investments influence firm performance: conjecture and empirical evidence1. MIS Q. 2016, 40, 223–245. [Google Scholar] [CrossRef]
- Gersick, C.J.G. Revolutionary change theories: A multilevel exploration of the punctuated equilibrium paradigm. Acad. Manag. Rev. 1991, 16, 10–36. [Google Scholar] [CrossRef]
- Benner, M.J.; Tushman, M.L. Exploitation, exploration, and process management: The productivity dilemma revisited. Acad. Manag. Rev. 2003, 28, 238–256. [Google Scholar] [CrossRef]
- He, Z.-L.; Wong, P.-K. Exploration vs. exploitation: An empirical test of the ambidexterity hypothesis. Organ. Sci. 2004, 15, 481–494. [Google Scholar] [CrossRef]
- O’Reilly, C.A.; Tushman, M.L. Ambidexterity as a dynamic capability: Resolving the innovator’s dilemma. Res. Organ. Behav. 2008, 28, 185–206. [Google Scholar] [CrossRef]
- Gupta, A.K.; Smith, K.G.; Shalley, C.E. The interplay between exploration and exploitation. Acad. Manag. J. 2006, 49, 693–706. [Google Scholar] [CrossRef]
- Gibson, C.B.; Birkinshaw, J. The antecedents, consequences, and mediating role of organizational ambidexterity. Acad. Manag. J. 2004, 47, 209–226. [Google Scholar]
- Andriopoulos, C.; Lewis, M.W. Exploitation-exploration tensions and organizational ambidexterity: Managing paradoxes of innovation. Organ. Sci. 2009, 20, 696–717. [Google Scholar] [CrossRef]
- Griffin, M.A.; Neal, A.; Parker, S.K. A new model of work role performance: Positive behavior in uncertain and interdependent contexts. Acad. Manag. J. 2007, 50, 327–347. [Google Scholar] [CrossRef]
- Lee, O.-K.; Sambamurthy, V.; Lim, K.H.; Wei, K.K. How does IT ambidexterity impact organizational agility? Inf. Syst. Res. 2015, 26, 398–417. [Google Scholar] [CrossRef]
- Cao, Q.; Gedajlovic, E.; Zhang, H. Unpacking organizational ambidexterity: Dimensions, contingencies, and synergistic effects. Organ. Sci. 2009, 20, 781–796. [Google Scholar] [CrossRef]
- Benner, M.J.; Tushman, M. Process management and technological innovation: A longitudinal study of the photography and paint industries. Adm. Sci. Q. 2002, 47, 676–707. [Google Scholar] [CrossRef]
- 1Teece, D.J. Explicating dynamic capabilities: The nature and microfoundations of (sustainable) enterprise performance. Strateg. Manag. J. 2007, 28, 1319–1350. [Google Scholar]
- Taylor, A.; Greve, H.R. Superman or the fantastic four? Knowledge combination and experience in innovative teams. Acad. Manag. J. 2006, 49, 723–740. [Google Scholar] [CrossRef]
- Baum, J.A.; Singh, J.V. Evolutionary Dynamics of Organizations; Oxford University Press: Oxford, UK, 1994. [Google Scholar]
- Zhou, K.Z.; Wu, F. Technological capability, strategic flexibility, and product innovation. Strateg. Manag. J. 2010, 31, 547–561. [Google Scholar] [CrossRef]
- Edwards, J.R.; Parry, M.E. On the use of polynomial regression equations as an alternative to difference scores in organizational research. Acad. Manag. J. 1993, 36, 1577–1613. [Google Scholar]
Figure 1.
Surface graph of the fit between work exploration and work exploitation predicting proficiency. Note. X = work exploration; Y = work exploitation.
Figure 1.
Surface graph of the fit between work exploration and work exploitation predicting proficiency. Note. X = work exploration; Y = work exploitation.

Figure 2.
Surface graph of the fit between employees and supervisors predicting adaptive behavior. Note. X = work exploration; Y = work exploitation.
Figure 2.
Surface graph of the fit between employees and supervisors predicting adaptive behavior. Note. X = work exploration; Y = work exploitation.


Table 1.
Descriptive statistics.
| Gender | Male | Female | ||||
|---|---|---|---|---|---|---|
| % | 49% | 51% | ||||
| n | 147 | 153 | ||||
| Age | 20s | 30s | 40s | 50s | 60s | |
| % | 29% | 50% | 15% | 5% | 1% | |
| n | 87 | 149 | 46 | 16 | 2 | |
| Job | Sales | Engineering | Administration | Management | Professional | Government |
| % | 13% | 2% | 55% | 8% | 23% | 1% |
| n | 38 | 5 | 164 | 23 | 68 | 2 |
Table 2.
Intercorrelations.
| Variables | M | SD | 1 | 2 | 3 | 4 | 5 | 6 | 7 | 8 | 9 | 10 | 11 | 12 |
|---|---|---|---|---|---|---|---|---|---|---|---|---|---|---|
| 1. Industry—IT | 0.16 | 0.37 | - | |||||||||||
| 2. Industry—Service | 0.32 | 0.46 | 0.29 *** | - | ||||||||||
| 3. Firm size | 0.34 | 0.47 | −0.04 | −0.04 | - | |||||||||
| 4. Age | 33.82 | 7.76 | 0.02 | −0.01 | −0.03 | - | ||||||||
| 5. Job level | 0.58 | 0.49 | −0.15 ** | 0.03 | 0.02 | −0.48 *** | - | |||||||
| 6. Task type 1 | 0.17 | 0.37 | −0.05 | −0.08 | −0.12 * | 0.03 | 0.01 | - | ||||||
| 7. Task type 2 | 0.10 | 0.30 | −0.14 * | −0.29 *** | −0.03 | −0.10 + | 0.07 | −0.15 ** | - | |||||
| 8. Work exploration | 4.16 | 1.18 | 0.11 + | 0.01 | 0.01 | 0.03 | −0.19 ** | −0.04 | 0.03 | (0.82) | ||||
| 9. Work exploitation | 4.88 | 0.93 | 0.04 | 0.02 | 0.05 | 0.03 | −0.14 * | 0.02 | −0.09 | 0.25 *** | (0.71) | |||
| 10. Proficiency | 5.35 | 0.96 | 0.03 | −0.04 | 0.08 | 0.02 | −0.14 * | −0.12 * | −0.13 * | 0.17 *** | 0.49 *** | (0.86) | ||
| 11. Adaptivity | 5.01 | 0.96 | 0.05 | 0.01 | 0.05 | −0.07 | −0.06 | −0.00 | −0.07 | 0.36 *** | 0.47 *** | 0.56 *** | (0.84) | |
| 12. Proactivity | 4.61 | 1.12 | 0.03 | −0.07 | 0.12 * | −0.09 | −0.02 | −0.12 * | −0.06 | 0.52 *** | 0.35 *** | 0.43 *** | 0.54 *** | (0.88) |
Note. N = 300. Firm size: (1 = above 300 employees, 0 = others). Job level: (1 = non-manager, 0 = manager). Numbers in parentheses represent reliability. + p < 0.10, * p < 0.05, ** p < 0.01, *** p < 0.001.
Table 3.
Measures.
| Construct | Items | Measure | Reference |
|---|---|---|---|
| Work Exploitation | WET2 WET3 WET4 | To what extent did you, last year, engage in work-related activities that can be characterized as follows: Activities which you carry out as if it were routine Activities which serve existing (internal) customers with existing services/products Activities of which it is clear to you how to conduct them | Mom et al., 2009 |
| Work Exploration | WER1 WER2 WER3 | To what extent did you, last year, engage in work-related activities that can be characterized as follows: Searching for new possibilities with respect to products/services, processes, or markets Evaluating diverse options with respect to products/services, processes, or markets Focusing on strong renewal of products/services or processes | Mom et al., 2009 |
| Performance-Proficiency | PROF1 PROF2 PROF3 | For all items, participants were asked to rate how often they had carried out the behavior over the past month on a scale ranging from 1 (“very little”) to 5 (a “great deal”). I carried out the core parts of my job well I completed my core tasks well using the standard procedures I ensured my tasks were completed properly | Griffin et al., 2007 |
| Performance-Adaptability | ADAP1 ADAP2 ADAP3 | I adapted well to changes in core tasks I coped with changes to the way I have to do your core tasks I learned new skills to help me adapt to changes in my core tasks | Griffin et al., 2007 |
| Performance-Proactivity | PROA1 PROA2 PROA3 | I initiated better ways of doing my core tasks I come up with ideas to improve the way in which my core tasks are done I made changes to the way my core tasks are done | Griffin et al., 2007 |
Table 4.
Results of the polynomial regression analyses on proficiency.
| Proficiency | |||
|---|---|---|---|
| Variables | Model 1 | Model 2 | Model 3 |
| Control variables | |||
| Industry 1 (= IT) | −0.02(0.16) | −0.04(0.14) | −0.03(0.14) |
| Industry 2 (= Service) | −0.01(0.13) | −0.05(0.11) | −0.04(0.11) |
| Firm size (= above 300 employees) | 0.06(0.12) | 0.04(0.10) | 0.04(0.10) |
| Age | −0.07(0.01) | −0.04(0.01) | −0.03(0.00) |
| Job level (= non-manager) | −0.16(0.13) * | −0.08(0.12) | −0.08(0.11) |
| Task type 1 (= Professional) | −0.13(0.15) * | −0.15(0.13) ** | −0.15(0.13) ** |
| Task type 2 (= Sales) | −0.15(0.19) * | −0.11(0.17) * | −0.10(0.17) + |
| Linear terms | |||
| Work exploration | 0.14(0.04) * | 0.14(0.05) * | |
| Work exploitation | 0.47(0.05) *** | 0.46(0.06) *** | |
| Polynomial terms | |||
| Work exploration 2 | 0.23(0.03) *** | ||
| Work exploration * Work exploitation | −0.03(0.04) | ||
| Work exploitation 2 | 0.01(0.04) | ||
| R2 | 0.26 | 0.29 | 0.37 |
| ΔR2 | 0.03 ** | 0.08 ** | |
| F | 12.77 *** | 12.49 *** | 13.69 *** |
| Response Surface Tests | |||
| Slope of the work exploration = Work exploitation line (a1 = b1 + b2) | 0.55 *** | ||
| Curvature of the work exploration = Work exploitation line (a2 = b3 + b4 + b5) | 0.09 *** | ||
| Slope of the work exploration = −Work exploitation line (a3 = b1 − b2) | 0.33 *** | ||
| Curvature of the work exploration = −Work exploitation line (a4 = b3 − b4 + b5) | 0.13 *** | ||
| Lateral of shift (a5 = −(b2 − b1)/2(b3 − b4 + b5)) | −1.23 | ||
Note. N = 300. Numbers in parentheses represent standard errors of estimates. + p < 0.10, * p < 0.05, ** p < 0.01, *** p < 0.001.
Table 5.
Results of the polynomial regression analyses on adaptive behavior.
| Variables | Model 4 | Model 5 | Model 6 |
|---|---|---|---|
| Control variables | |||
| Industry 1 (= IT) | 0.04(0.16) | 0.00(0.14) | 0.00(0.14) |
| Industry 2 (= Service) | 0.06(0.13) | 0.02(0.11) | 0.02(0.11) |
| Frim size (= above 300 employees) | 0.06(0.12) | 0.03(0.10) | 0.03(0.10) |
| Age | −0.15(0.01) * | −0.11(0.01) + | −0.11(0.00) + |
| Job level (= non-manager) | −0.12(0.13) + | 0.00(0.12) | −0.00(0.11) |
| Task type 1 (= Professional) | 0.00(0.15) | 0.00(0.13) | 0.01(0.13) |
| Task type 2 (= Sales) | −0.09(0.20) | −0.06(0.17) | −0.05(0.17) |
| Linear terms | |||
| Work exploration | 0.41(0.04) *** | 0.34(0.05) *** | |
| Work exploitation | 0.34(0.05) *** | 0.41(0.06) *** | |
| Polynomial terms | |||
| Work exploration2 | 0.15(0.03) ** | ||
| Work exploitation * Work exploration | −0.05(0.04) | ||
| Work exploitation2 | 0.11(0.04) + | ||
| R2 | 0.29 | 0.41 | 0.42 |
| ΔR2 | 0.12 *** | 0.01 + | |
| F | 13.76 *** | 18.29*** | 15.18 *** |
| Response Surface Tests | |||
| Slope of the work exploration = Work exploitation line (a1 = b1+ b2) | 0.71 *** | ||
| Curvature of the work exploration = Work exploitation line (a2 = b3 + b4 + b5) | 0.11 | ||
| Slope of the work exploration = −Work exploitation line (a3 = b1 − b2) | 0.15 | ||
| Curvature of the work exploration = −Work exploitation line (a4 = b3 − b4 + b5) | 0.17 *** | ||
| Lateral of shift (a5 = −(b2 − b1)/2(b3 − b4 + b5)) | −0.43 | ||
Note. N = 300. Numbers in parentheses represent standard errors of estimates. + p < 0.10, * p < 0.05, ** p < 0.01, *** p < 0.001.
Table 6.
Results of the polynomial regression analyses on proactive behavior.
| Proactivity | |||
|---|---|---|---|
| Variables | Model 7 | Model 8 | Model 9 |
| Control variables | |||
| Industry 1 (= IT) | −0.01(0.19) | −0.07(0.15) | −0.07(0.15) |
| Industry 2 (= Service) | −0.06(0.15) | −0.10(0.12) | −0.10(0.12) + |
| Frim size (= above 300 employees) | 0.10(0.14) + | 0.07(0.11) | 0.07(0.11) |
| Age | −0.14(0.01) * | −0.10(0.01) + | −0.09(0.00) |
| Job level (= non-manager) | −0.08(0.15) | 0.07(0.13) | −0.07(0.13) |
| Task type 1 (= Professional) | −0.12(0.18) * | −0.11(0.14) * | −0.12(0.14) * |
| Task type 2 (= Sales) | −0.07(0.23) | −0.07(0.19) | −0.06(0.19) |
| Linear terms | |||
| Work exploration | 0.53(0.06) *** | 0.53(0.05) *** | |
| Work exploitation | 0.23(0.06) *** | 0.23(0.06) *** | |
| Polynomial terms | |||
| Work exploration2 | 0.08(0.03) | ||
| Work exploration * Work exploitation | −0.08(0.04) | ||
| Work exploitation2 | 0.05(0.04) | ||
| R2 | 0.26 | 0.29 | 0.37 |
| ΔR2 | 0.03 | 0.08 | |
| F | 12.77 *** | 12.49 *** | 13.69 *** |
| Response Surface Tests | |||
| Slope of the work exploration = Work exploitation line (a1 = b1 + b2) | N/A | ||
| Curvature of the work exploration = Work exploitation line (a2 = b3 + b4 + b5) | N/A | ||
| Slope of the work exploration = −Work exploitation line (a3 = b1 − b2) | N/A | ||
| Curvature of the work exploration = −Work exploitation line (a4 = b3 − b4 + b5) | N/A | ||
| Lateral of shift (a5 = −(b2 − b1)/2(b3 − b4 + b5)) | N/A | ||
Note. N = 300. Numbers in parentheses represent standard errors of estimates. + p < 0.10, * p < 0.05, ** p < 0.01, *** p < 0.001.
© 2019 by the authors. Licensee MDPI, Basel, Switzerland. This article is an open access article distributed under the terms and conditions of the Creative Commons Attribution (CC BY) license (http://creativecommons.org/licenses/by/4.0/).
Share and Cite
MDPI and ACS Style
Kang, H.; Kim, M. The Differential Effect of Exploration and Exploitation on Work Performances. Sustainability 2019, 11, 2074. https://0-doi-org.brum.beds.ac.uk/10.3390/su11072074
AMA Style
Kang H, Kim M. The Differential Effect of Exploration and Exploitation on Work Performances. Sustainability. 2019; 11(7):2074. https://0-doi-org.brum.beds.ac.uk/10.3390/su11072074
Chicago/Turabian StyleKang, Hyunjeong, and Mihee Kim. 2019. "The Differential Effect of Exploration and Exploitation on Work Performances" Sustainability 11, no. 7: 2074. https://0-doi-org.brum.beds.ac.uk/10.3390/su11072074
Note that from the first issue of 2016, this journal uses article numbers instead of page numbers. See further details here.