Article

The Spatial Evolution of Geoeconomic Pattern among China and Neighboring Countries since the Reform and Opening-Up

1
Institute of Geographic Sciences and Natural Resources Research, Key Laboratory of Regional Sustainable Development Modeling, CAS, Beijing 100101, China
2
School of Resources and Environment, University of Chinese Academy of Sciences, Beijing 100049, China
*
Author to whom correspondence should be addressed.
Sustainability 2019, 11(7), 2168; https://0-doi-org.brum.beds.ac.uk/10.3390/su11072168
Submission received: 31 January 2019 / Revised: 4 April 2019 / Accepted: 4 April 2019 / Published: 11 April 2019

Abstract

:
The rise of China has had a profound impact on the world and regional political and economic pattern since the reform and opening-up. This paper studies the impact of China’s development on the evolution of the surrounding geo-pattern from the perspective of geoeconomics. Based on the sensitivity and vulnerability of asymmetric interdependence, trade and investment indicators are selected to construct a quantitative model to measure the relative economic dependence between China and neighboring countries. This paper analyzes the degree, types and trends of relative economic dependence and the relationship between economic interdependence and political relations, and investigates the surrounding geoeconomic cooperation. The results are shown as follows: (1) Since 2010, all neighboring countries have had relative economic dependence on China. China’s geoeconomic position in the surrounding area has radically transformed. (2) Since the reform and opening-up, the relative economic dependence of neighboring countries on China has been rising, from negative to positive and from low to high. After 2003, the types of relative economic dependence have gradually shifted from dual low and trade-compensative dependence to dual high and trade-oriented dependence. (3) Trade was the dominant factor in the relative economic dependence of most neighboring countries on China, and it was also the main factor contributing to China’s economic advantages over great powers in the neighborhood. The majority of neighboring countries’ investment dependence on China increased faster than their trade dependence, and the growth of their relative economic dependence will gradually turn to investment in the future. (4) The improvement of political relations between China and neighboring countries provides a foundation for the development of economic relations, and economic relations have the “inertia” of resisting political risks. The deepening of economic ties is conducive to friendly and stable political relations. (5) China’s peripheral geoeconomic strategy focuses on cooperation rather than competition. One of the goals of geoeconomics is the pursuit of joint economic benefits.

1. Introduction

With the end of the Cold War and development of economic globalization, international relations are increasingly determined by economic competition [1] and geoeconomics was born with the development of geopolitics [2,3]. In 1990, Edward Luttwak first proposed geoeconomics [4]. Economic benefits and economic relations have gradually replaced political and military confrontation, and geoeconomics has received attention. Inspired by geography, international politics, economics and strategy, geoeconomics wields economic power to fulfill geostrategy [5], playing a key role in the reconstruction of contemporary political geographic space [6]. Economic means are increasingly becoming the main way for many states to utilize power and achieve strategic goals. Economic blockades and sanctions, as the means of inter-country strikes, are more highly prioritized and frequent than military operations in practice due to the fact that they cost less and present fewer challenges to the international order. In addition to the conventional political discourse and military power, economic strength is increasingly concerned during the pursuit of power. Geoeconomics is becoming the core of policy analysis and formulation [7,8]. Based on geographical factors, geoeconomics concentrates on how to influence international relations and seek national interests through the interaction between economics and politics. Geoeconomics has been developed recently, and the current studies pay attention to exploring the origin and evolution, defining concepts, developing connotations and discussing paradigms, and probe into research orientation and content combined with case studies [9,10,11,12,13,14,15,16,17,18,19,20,21,22]. Most studies are principally based on qualitative analysis, and quantitative methods [23,24,25] are few. The interaction between economic relations and political relations is one of the main research topics of geoeconomics. This subject can be studied quantitatively from the perspective of economic interdependence.
With the world becoming increasingly closely associated due to globalization, the economic interests of countries have penetrated each other, and the cost of conflict has increased. Economic interdependence becomes a stabilizer for political relations [26]. However, economic globalization is not smooth and homogeneous, and the asymmetry of interdependence among countries may be conducive to the utilization of power. Keohane and Nye [27], neoliberal scholars of international politics, regarded economic disparity in the asymmetrical interdependence among countries as one of the sources of state power, and believed that interdependence was not necessarily a win-win situation for both parties. They also believed that the actant with less dependency frequently utilized interdependence to bargain on certain issues. The asymmetry of economic interdependence forms bargaining potency with regard to economic and other issues. The greater the asymmetry is, the stronger the bargaining potency of the country with less dependence will be. When the economic dependence of a country is sufficiently small, the cost of economic sanctions imposed on other countries is correspondingly small, which means the country has the capacity to impose practical economic sanctions. Revealing the connection between economic relations and state power, economic interdependence theories are coincident with geoeconomic research to a certain extent and provide significant materials and approaches for this paper.
Since 2015, China has been the world’s largest trading nation, the second largest source and destination of foreign direct investment (FDI) and the second largest consumer market. China has progressively developed into a hub of global commodity and capital flows. As the continuous consolidation of the external attributes of economic issues, China focuses on giving play to economic advantages so as to enhance its discourse power. Geographical proximity is a key element affecting geoeconomics. The mutual trust of neighboring regions gained by ethnic and cultural similarities promotes the formation of long-term economic relations. China’s economic globalization and expansion of discourse power have always been inseparable from neighboring regions, and China’s rise is changing the regional geopolitical and geoeconomic pattern. Therefore, the peripheral region is the emphasis of China’s geoeconomic research. The studies of China’s geoeconomics concentrate on mutual benefits [28]. In the geoeconomic era, openness, cooperation, mutual benefit and development have become the consensus, and a win-win situation is the ideal state pursued among countries. The study of the geoeconomic pattern among China and neighboring countries requires a re-examination of economic cooperation–competition and the interaction between economics and politics from the perspective of interdependence. In this paper, the relative economic dependence based on asymmetric interdependence between China and neighboring countries is estimated through the method in Section 2, and the degree and evolution of relative economic dependence since 1984 are presented in Section 3. The types and trends of relative economic dependence and the interaction between economic interdependence and political relations are discussed in Section 4. Most current studies focus on discrete regions of China’s neighborhood, while this paper investigates the overall periphery around China.

2. Materials and Methods

2.1. Evaluation of Relative Economic Dependence Based on Asymmetric Interdependence

Keohane and Nye put forward two variables to analyze complex interdependence [27]. Sensitivity measures the impact of changes of one actant on other actants, and vulnerability refers to the cost of an actor’s adjustment to effectively adapt to external changes. The biggest difference between the two variables is that sensitivity does not bring about policy changes, which reflects the cost of maintaining mutual relations, and vulnerability leads to policy changes, which emphasizes the cost of terminating mutual relations. Du (2016) [25] constructed China’s economic power model on the basis of Keohane and Nye’s theory, and used bilateral trade as indexes to analyze the asymmetry of interdependence between China and other countries. Trade and investment are the main aspects of economic relations between countries, thus this paper references the method of the model and introduces investment indicators into the calculation.
The trade sensitivity of a country to another is defined as:
S T i j = T i j T i T i j T j
where T i j is the total trade between country i and j, and T i and T j are the total trade of country i and j, respectively. S T i j is the trade sensitivity of country i to j. If S T i j > 0, it indicates that country i is sensitive to j. If S T i j < 0, it indicates that country j is sensitive to i. If S T i j = 0, two countries are sensitive to each other symmetrically.
The trade vulnerability of a country to another is defined as:
V T i j = T i j G i T i j G j
where G i and G j are the GDP of country i and j, respectively, and V T i j is the trade vulnerability of country i to j. If V T i j > 0, it indicates that country i is vulnerable to j. If V T i j < 0, it indicates that country j is vulnerable to i. If V T i j = 0, the two countries are vulnerable to each other symmetrically.
Since 2003, China’s outward foreign direct investment (OFDI) has grown rapidly. In 2015, China’s OFDI flows ranked second in the world, and its OFDI exceeded inward foreign direct investment (IFDI) for the first time, with the result that China reached the stage of net capital export. FDI has become an indispensable engine for China’s economic development, and the role of OFDI in China’s economic interdependence is remarkable; therefore, the measure of economic interdependence needs to introduce investment variables.
The investment sensitivity of a country to another is given as follows:
S I i j = I j i I i I i j I j
where I i j is the OFDI stock from country i to j, and I j i is the OFDI stock from country j to i. I i and I j are the IFDI stock of country i and j, respectively, and S I i j is the investment sensitivity of country i to j. If S I i j > 0, it indicates that country i is sensitive to j. If S I i j < 0, it indicates that country j is sensitive to i. If S I i j = 0, the two countries are sensitive symmetrically. The reason why FDI adopts stock other than flows is that, firstly, the FDI of previous years still has an effect. Secondly, fluctuations of flows are too large to reflect the investment relations precisely.
The investment vulnerability of a country to another is given as:
V I i j = I j i G i I i j G j
where V I i j is the investment vulnerability of country i to j. If V I i j > 0, it indicates that country i is vulnerable to j. If V I i j < 0, it indicates that country j is vulnerable to i. If V I i j = 0, the two countries are vulnerable symmetrically.
By integrating Equations (1)–(4), the relative economic dependence of a country on another is as follows:
E D i j = W S T × S T i j + W V T × V T i j + W S I × S I i j + W V I × V I i j
where E D i j is the relative economic dependence of country i on j. Acquired through the information entropy method, W S T , W V T , W S I , W V I are the weights of trade sensitivity, trade vulnerability, investment sensitivity and investment vulnerability, respectively, and they are diverse according to different countries, see Appendix A. The value range of relative economic dependence (ED) is (−1, 1), and if E D i j > 0 , it indicates that country i has relative economic dependence on country j. The larger the value is, the greater the dependence will be. If E D i j < 0 , it indicates that country j has relative economic dependence on country i, and the smaller the value is, the greater the dependence will be. If E D i j = 0 , the two countries are interdependent symmetrically.
According to the indicators, economic dependence can be divided into trade dependence and investment dependence. The relative trade dependence of a country on another is as follows:
T D i j = W S T × S T i j + W V T × V T i j
The relative investment dependence of a country on another is as follows:
I D i j = W S I × S I i j + W V I × V I i j
The value range and meaning of relative trade dependence (TD) and relative investment dependence (ID) are the same as those of ED.

2.2. Evaluation of Index Weight Based on the Information Entropy Method

The information entropy method is derived from information theory. In a social system, information entropy is equivalent to thermodynamic entropy in its mathematical meaning, which refers to the disorder of information. It is generally believed that the larger the information entropy, the more balanced the system structure, and the higher the disorder of information, and the smaller the utility of information. Therefore, the index weight can be calculated according to the entropy value which refers to the degree of variation of each index value.
The proportion of the jth index in the ith year is given as:
Y i j = X i j i = 1 m X i j
where m is the number of years. If the initial data units are different, standardization is required.
The information entropy of the jth index is as follows:
e j = 1 ln m i = 1 m ( Y i j ln Y i j )
The weight of the jth index is given as:
W j = 1 e j j = 1 n ( 1 e j )
where n is the number of indexes.

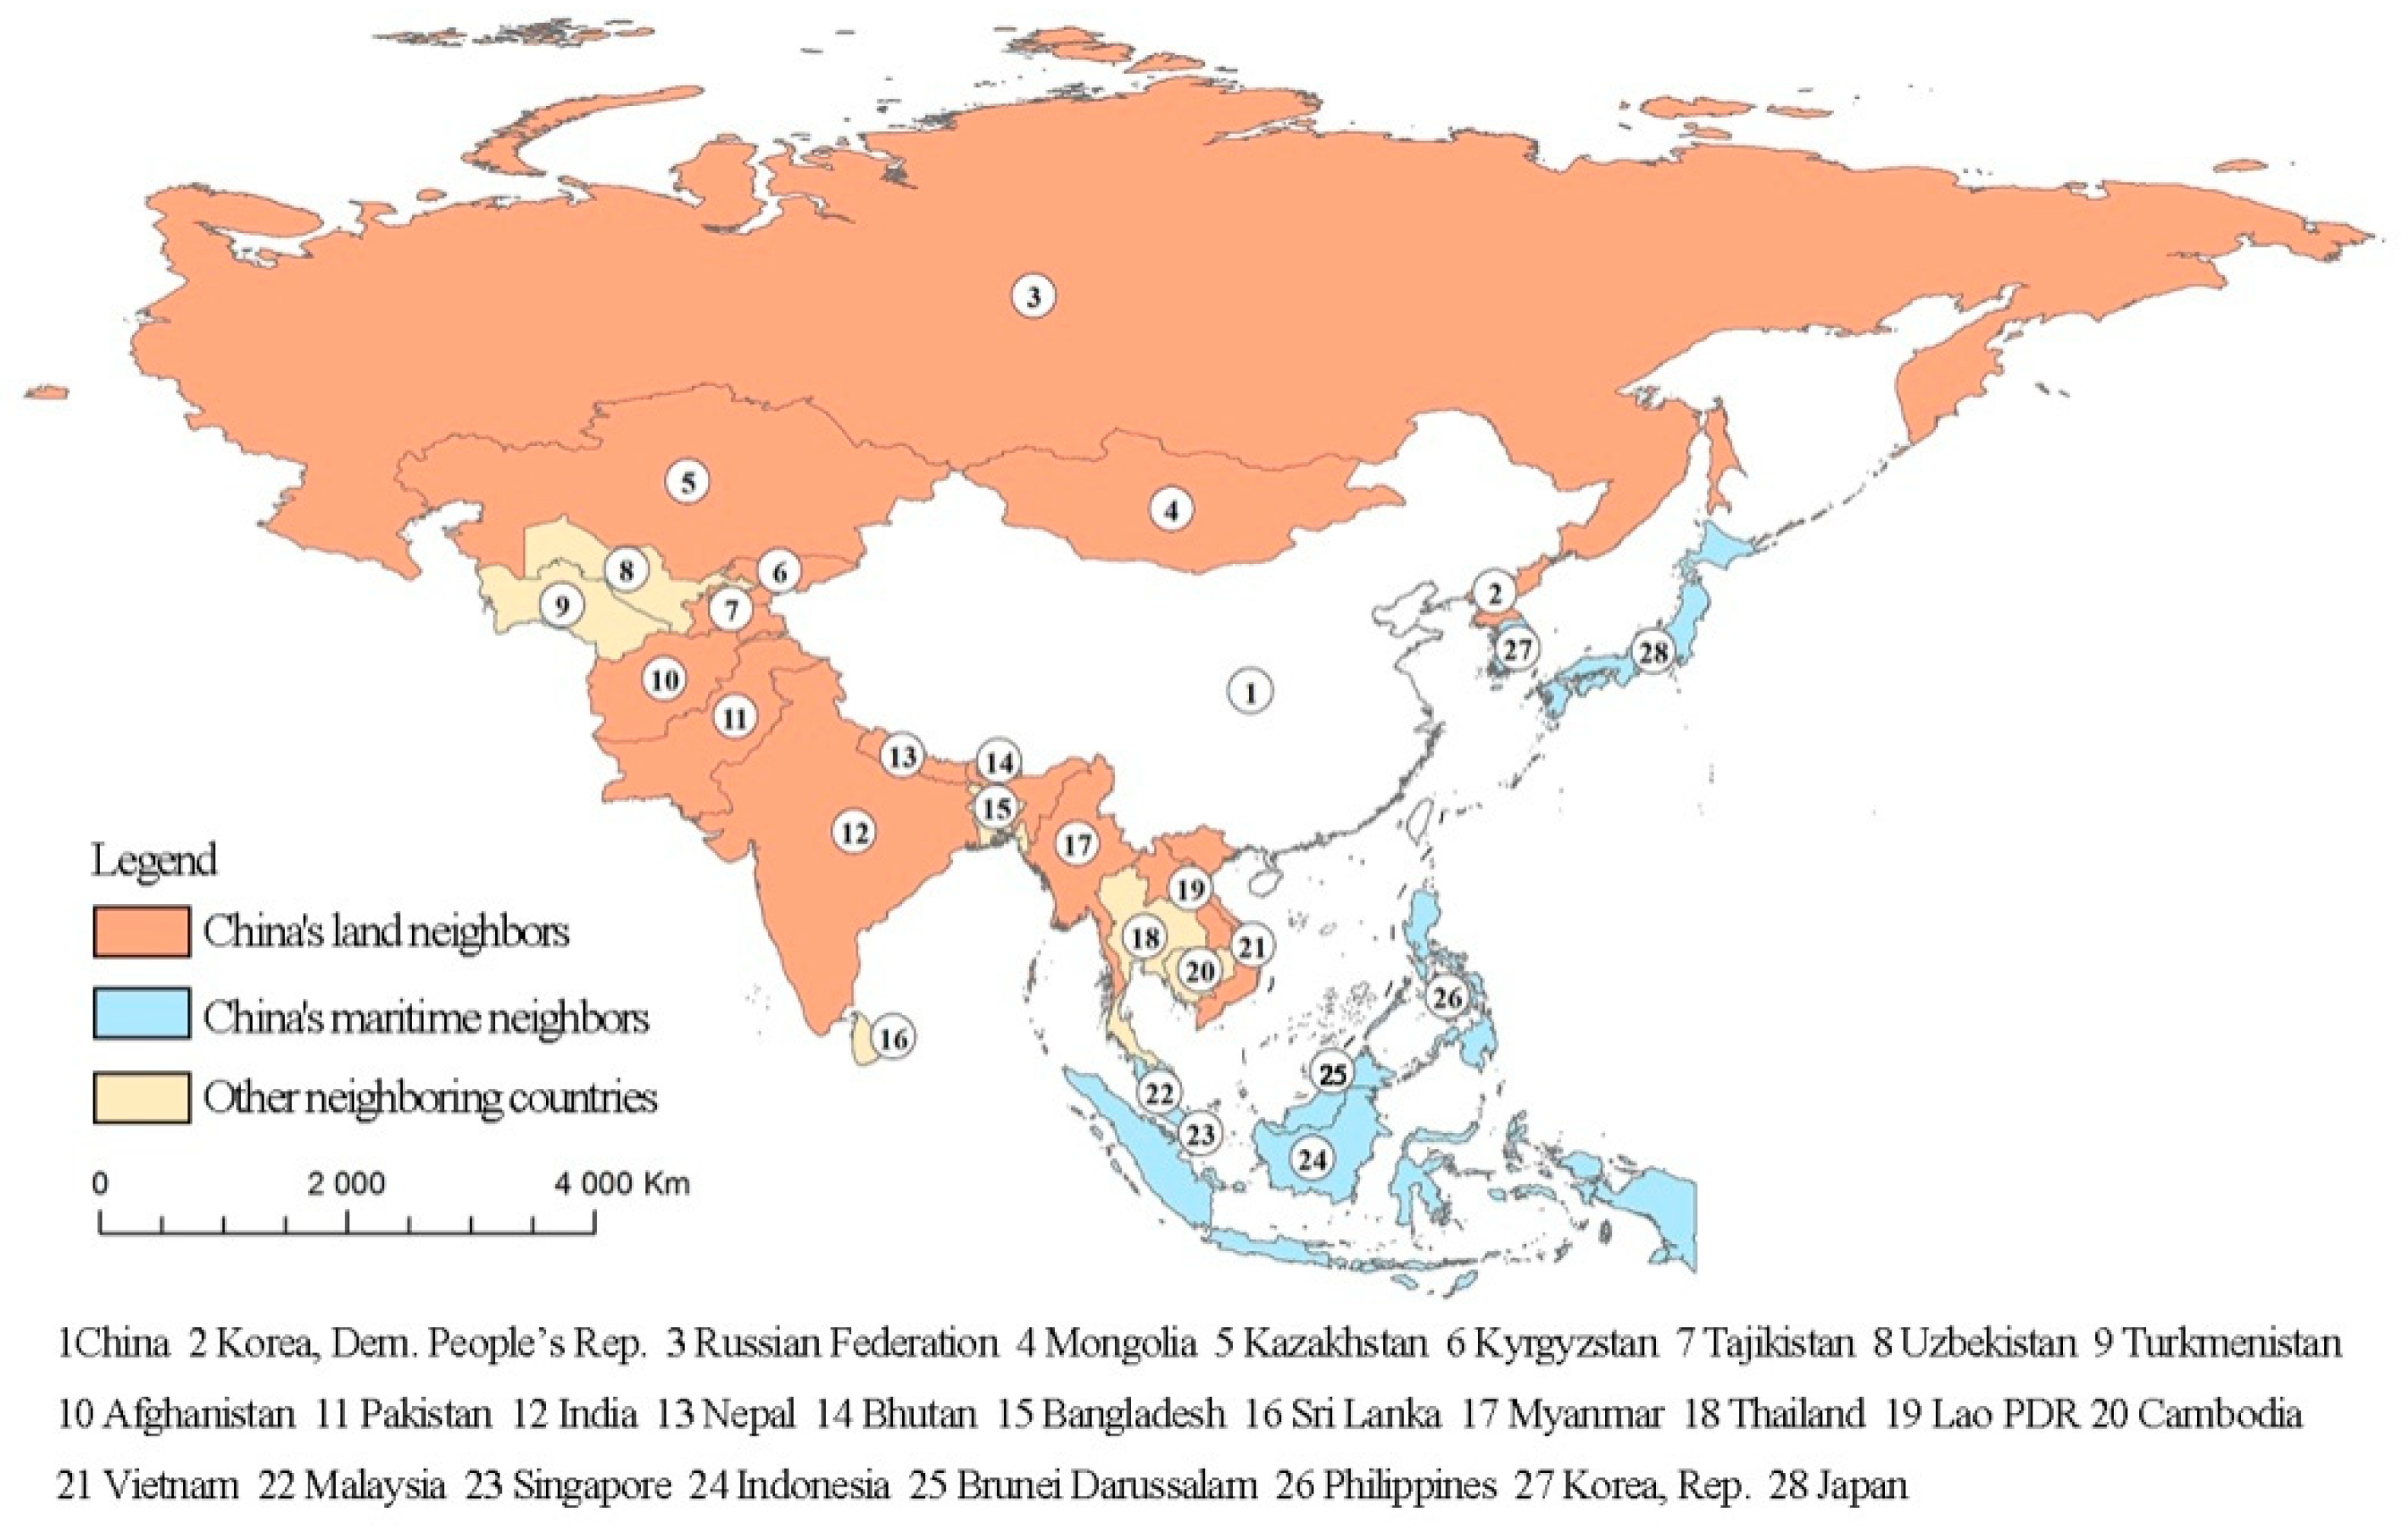
2.3. Research Scope and Data Sources

A total of 27 of China’s neighboring countries were studied in this paper, these included: East Asian countries (North Korea, South Korea, Japan and Mongolia), Central Asian countries (Kazakhstan, Kyrgyzstan, Tajikistan, Uzbekistan and Turkmenistan), South Asian countries (Afghanistan, Pakistan, India, Nepal, Bhutan, Bangladesh and Sri Lanka), Association of Southeast Asian Nations (ASEAN) members (Myanmar, Laos, Vietnam, Thailand, Cambodia, Philippines, Malaysia, Indonesia, Brunei and Singapore) and Russia, see Figure 1. The time span is from 1984 to 2016.
GDP is from the World Bank and the United Nations Statistics Division. The total trade of all countries and bilateral trade between China and neighboring countries were obtained from the UN Comtrade database. The IFDI stock comes from United Nations Conference on Trade and Development (UNCTAD)’s “World Investment Report”. China’s OFDI stock in various countries is from the “Statistical Bulletin of China’s Outward Foreign Direct Investment” published by the Ministry of Commerce, and IFDI stock is obtained from the National Bureau of Statistics. Due to the availability of China’s OFDI, the relative investment dependence is not calculated before 2003, so that ED is equal to TD.

3. Results

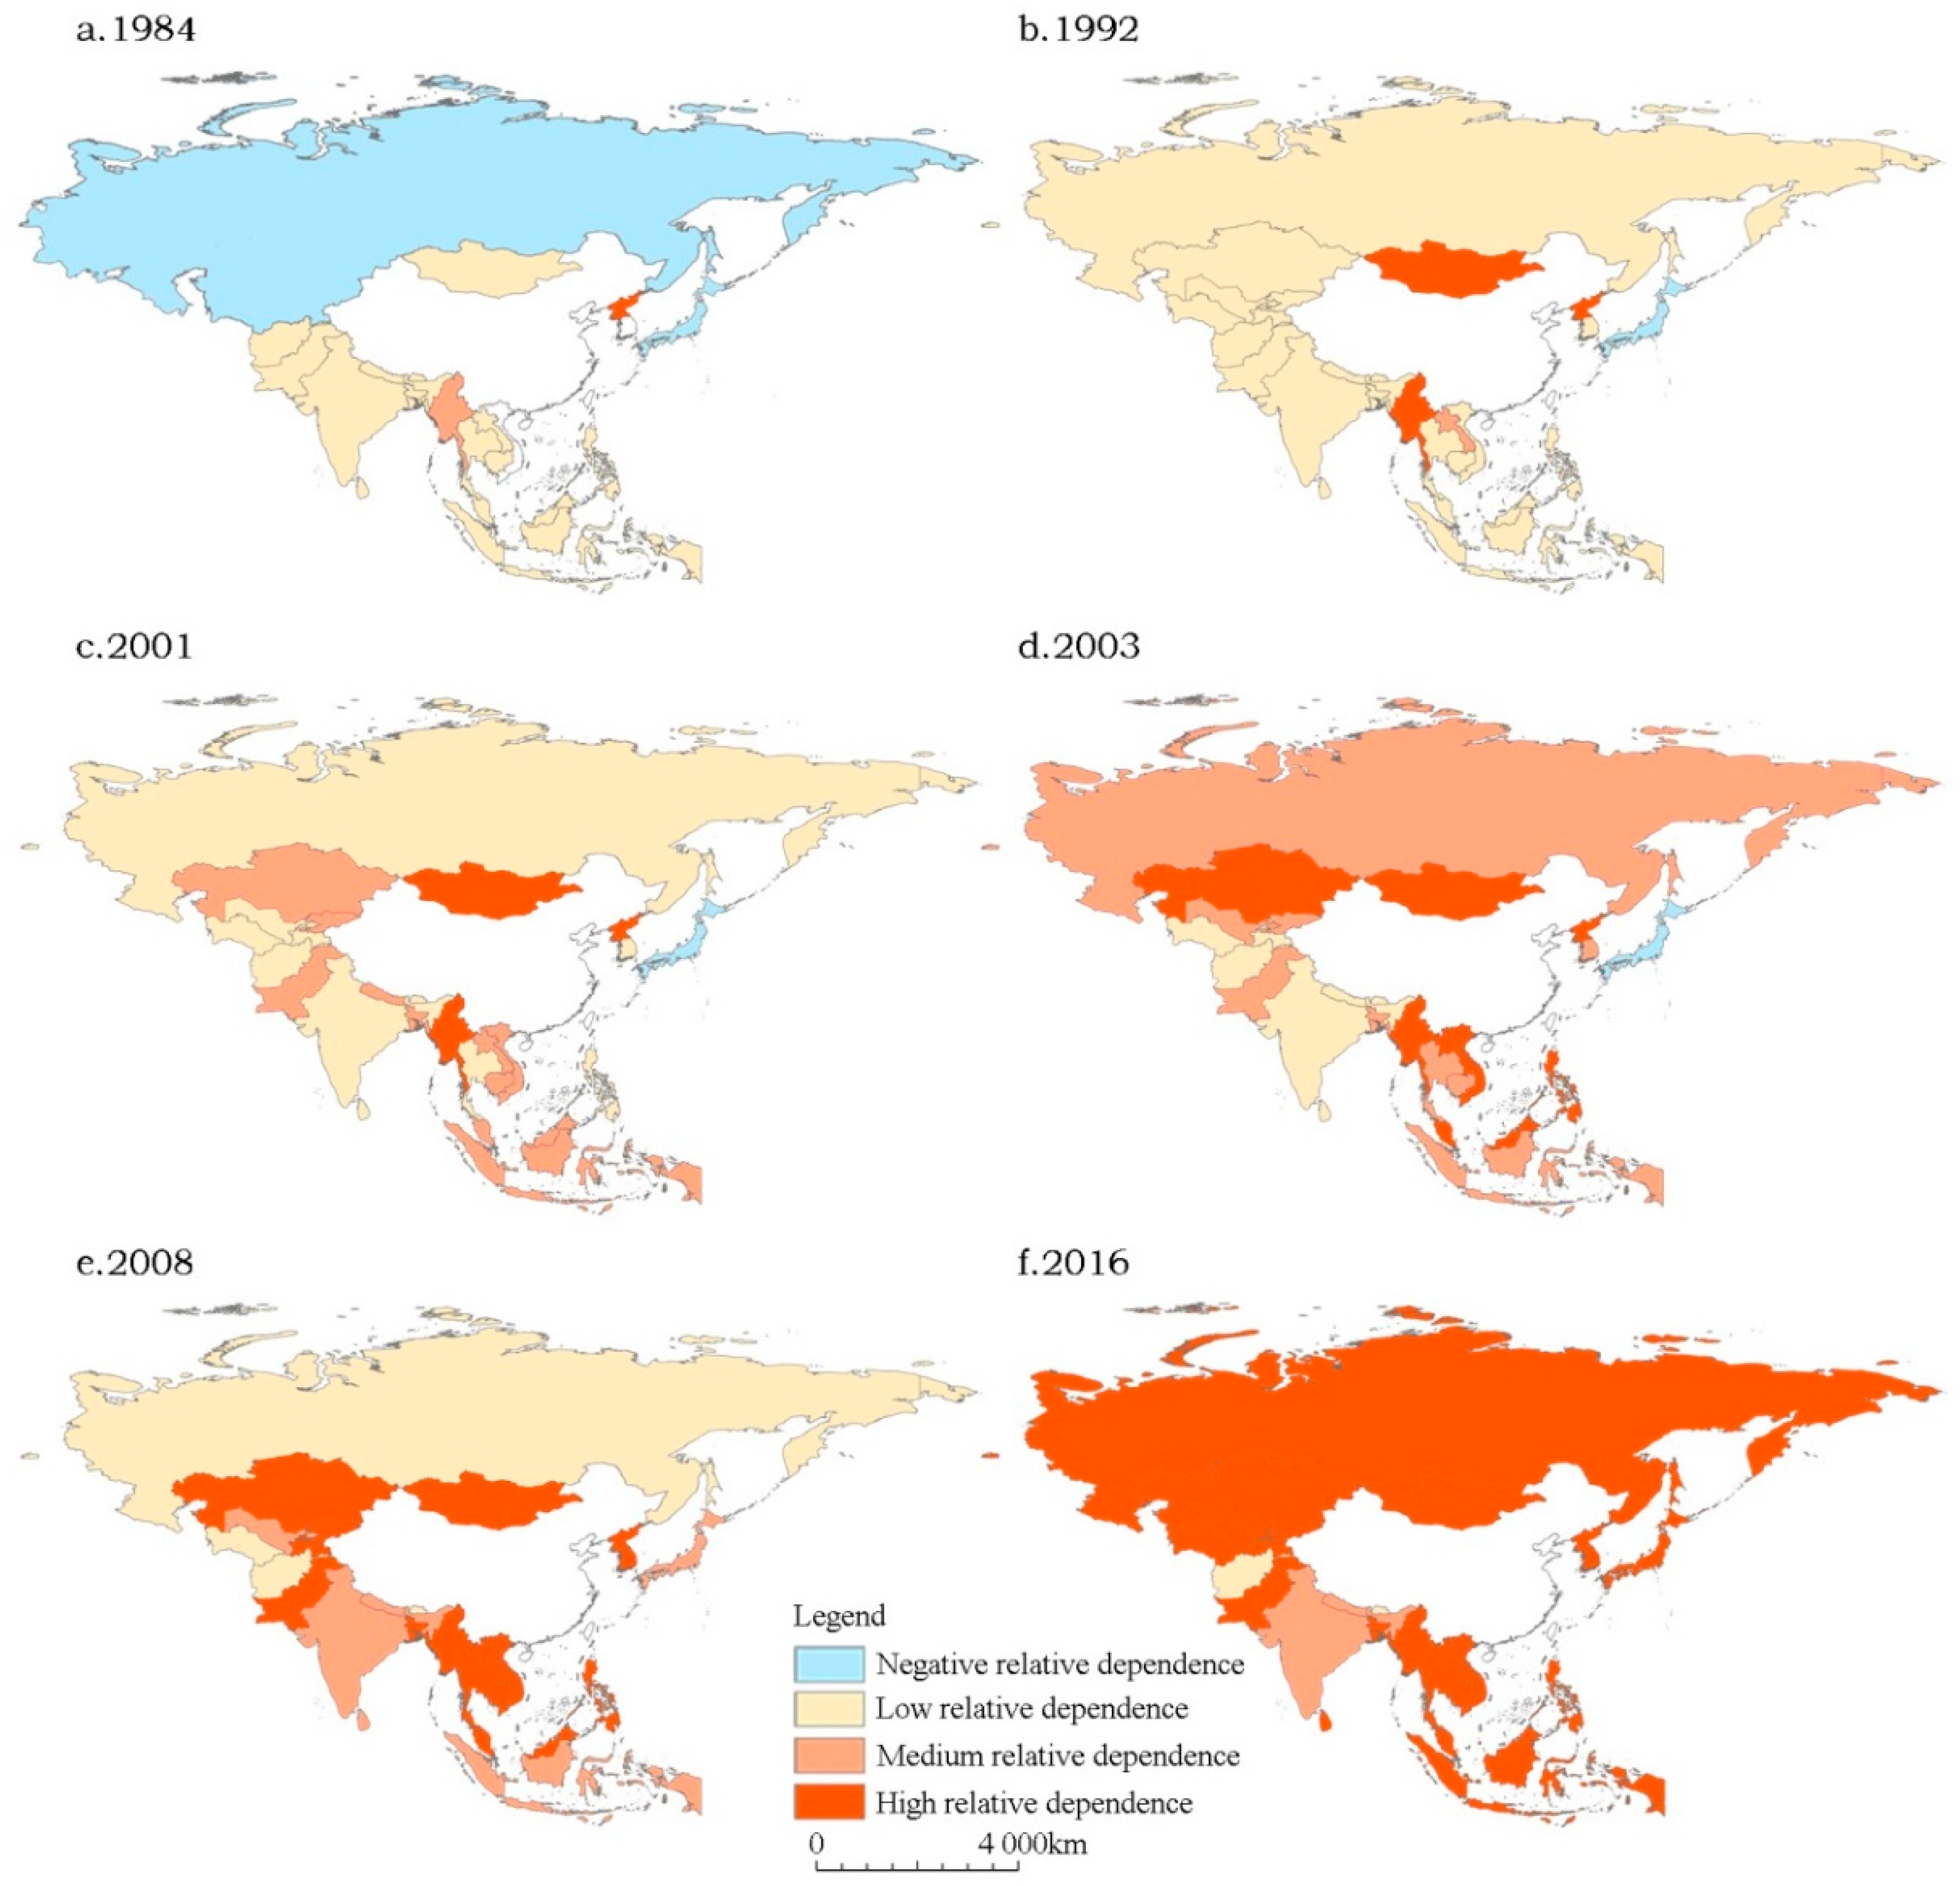
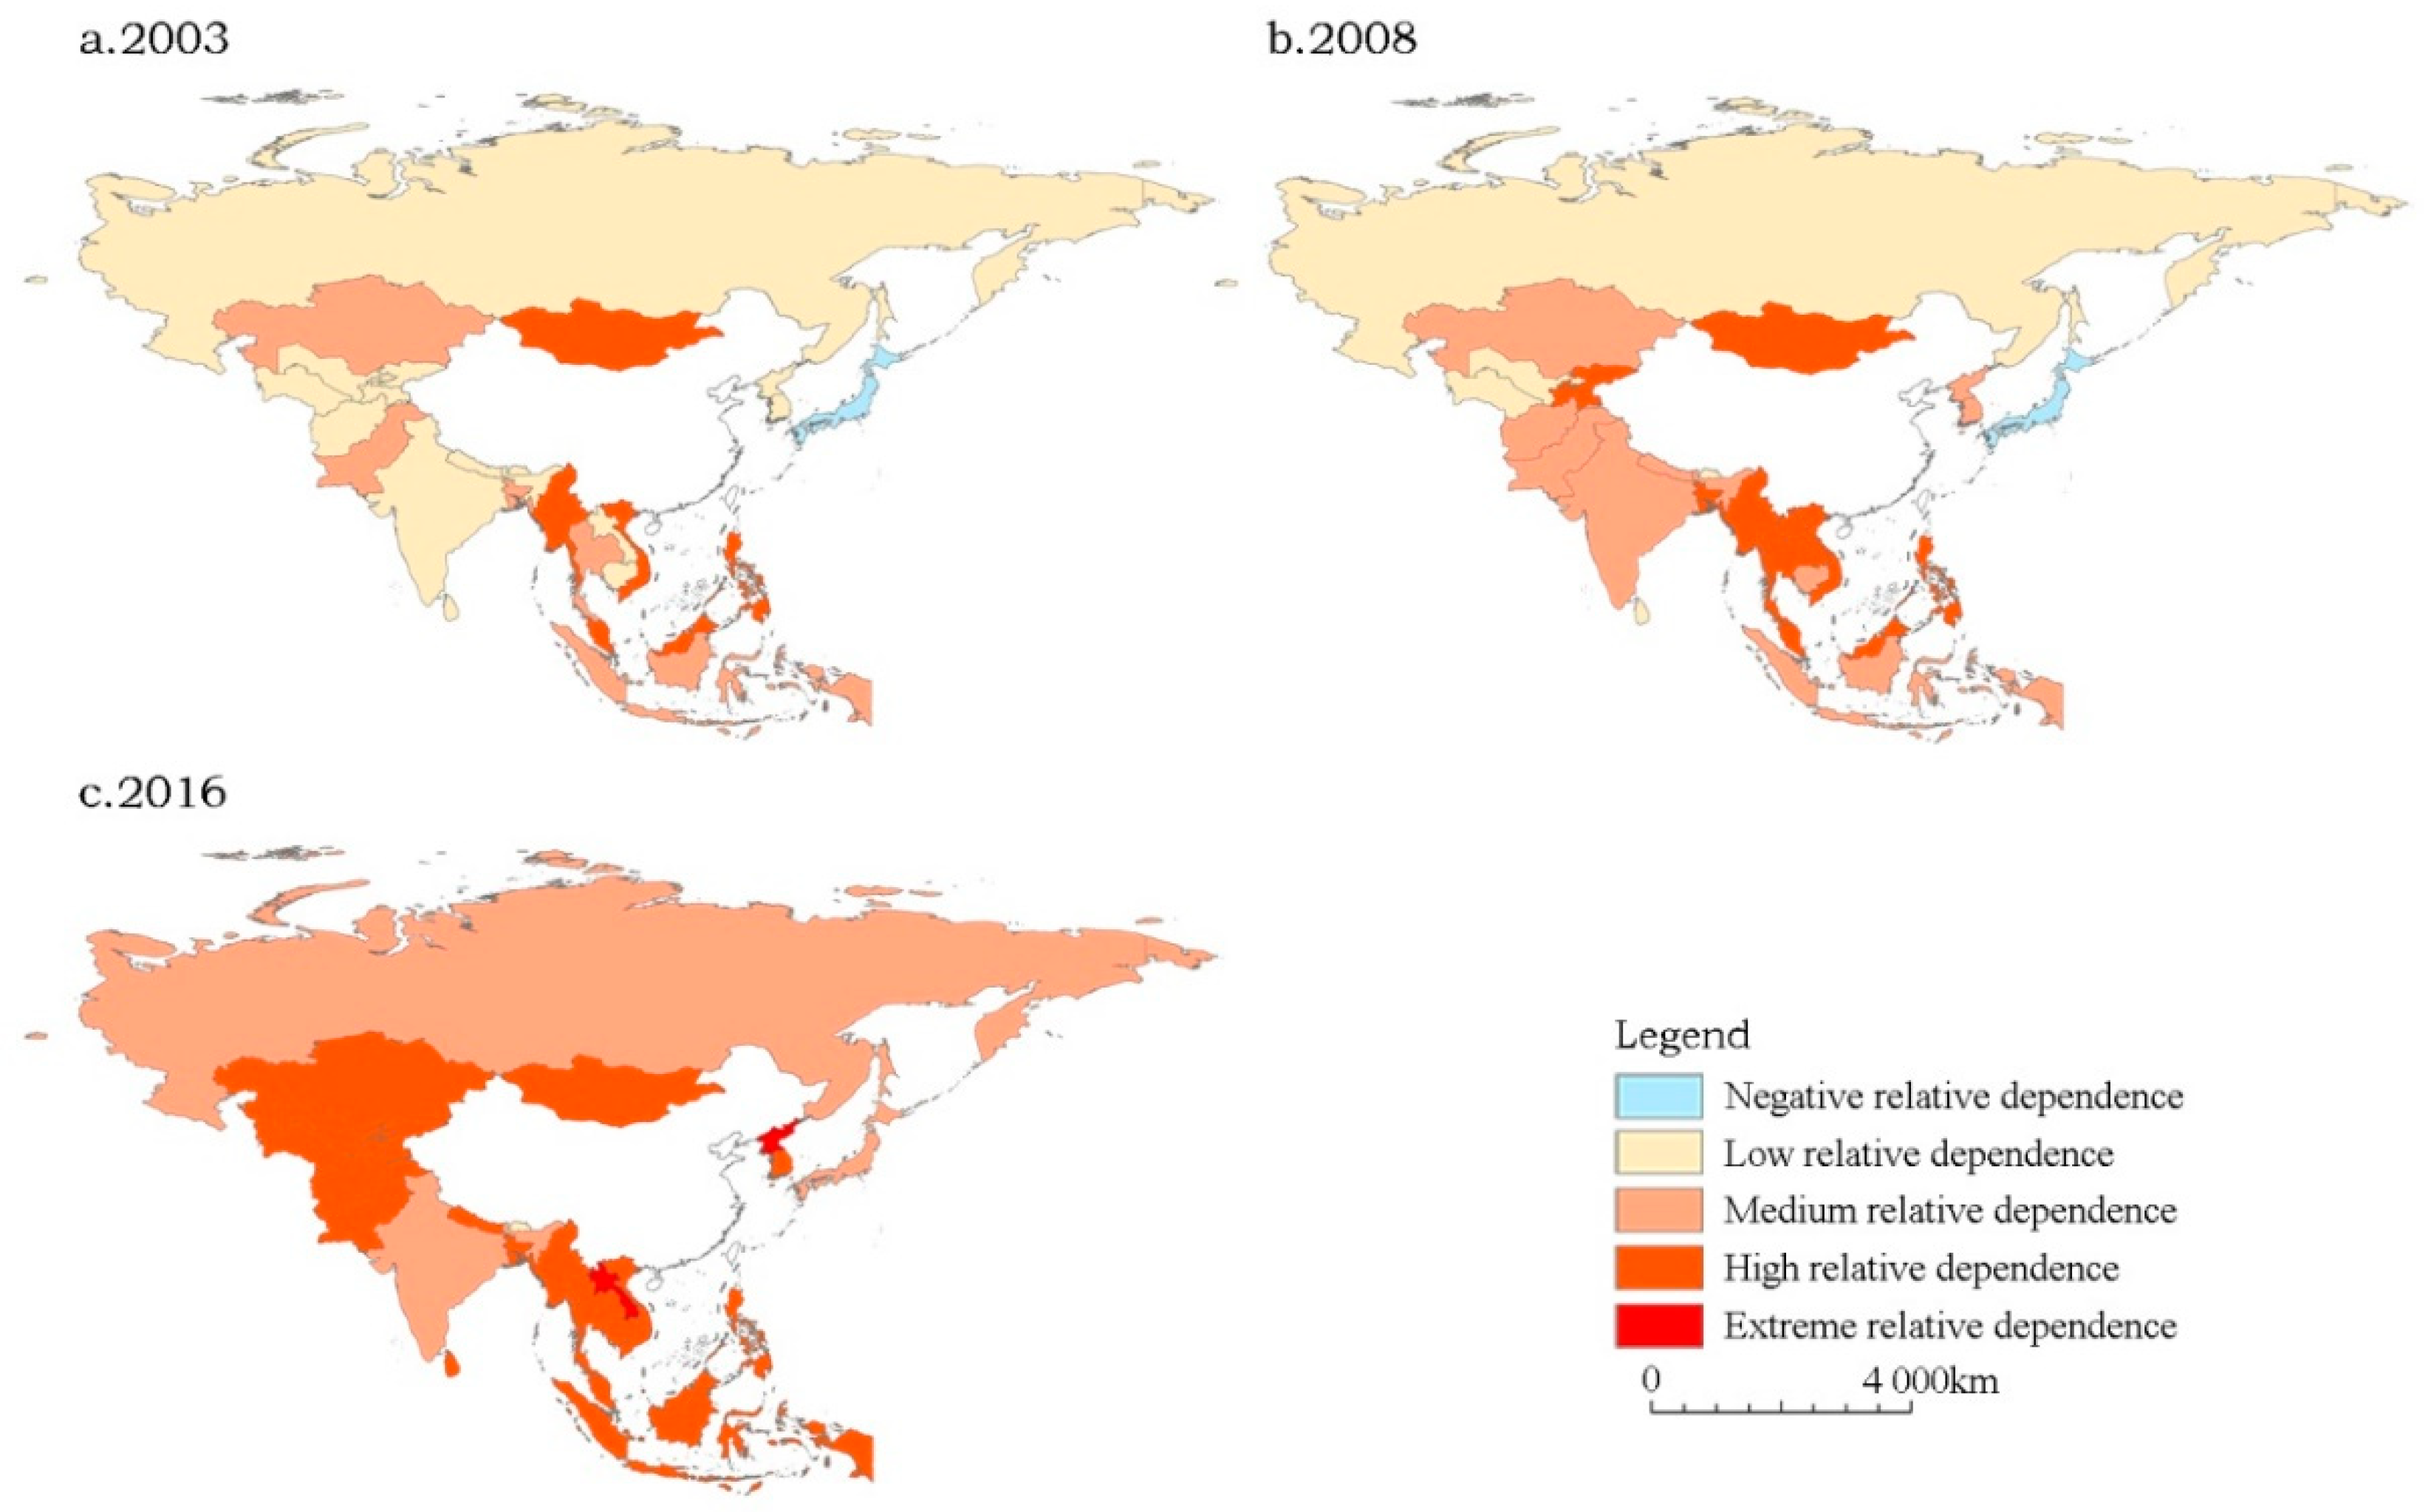
3.1. The Pattern of Relative Economic Dependence of Neighboring Countries on China

According to Du (2016) [25] and the result values of relative economic dependence, the economic dependence levels of neighboring countries on China are divided into five groups, see Table 1.
In 1984, among 22 neighboring countries, the relative trade dependence of Japan and the Soviet Union on China was negative. South Korea and Vietnam had no trade contacts with China. The relative trade dependence of North Korea and Myanmar was 0.11 and 0.06, which was medium dependence, and the remaining 16 countries have low dependence on China, see Figure 2. In 2003, among 27 neighboring countries, the relative economic dependence of Japan on China was −0.03, while 15 countries showed low dependence and six countries had medium dependence. Only five countries were highly dependent on China and yet the values were slightly larger than 0.1, see Figure 3. In 2016, among the 27 neighboring countries, Bhutan’s relative economic dependence on China was 0.003, which was low dependence. Japan, Russia, India, Singapore and Brunei were moderately dependent on China, and the relative economic dependence of Laos and North Korea on China was over 0.8, which was extreme dependence. The remaining 19 countries were highly dependent on China, see Figure 3. Over the past 40 years, the relative economic dependence of neighboring countries on China has enhanced in various degrees and transformed from negative to positive and from low to high.

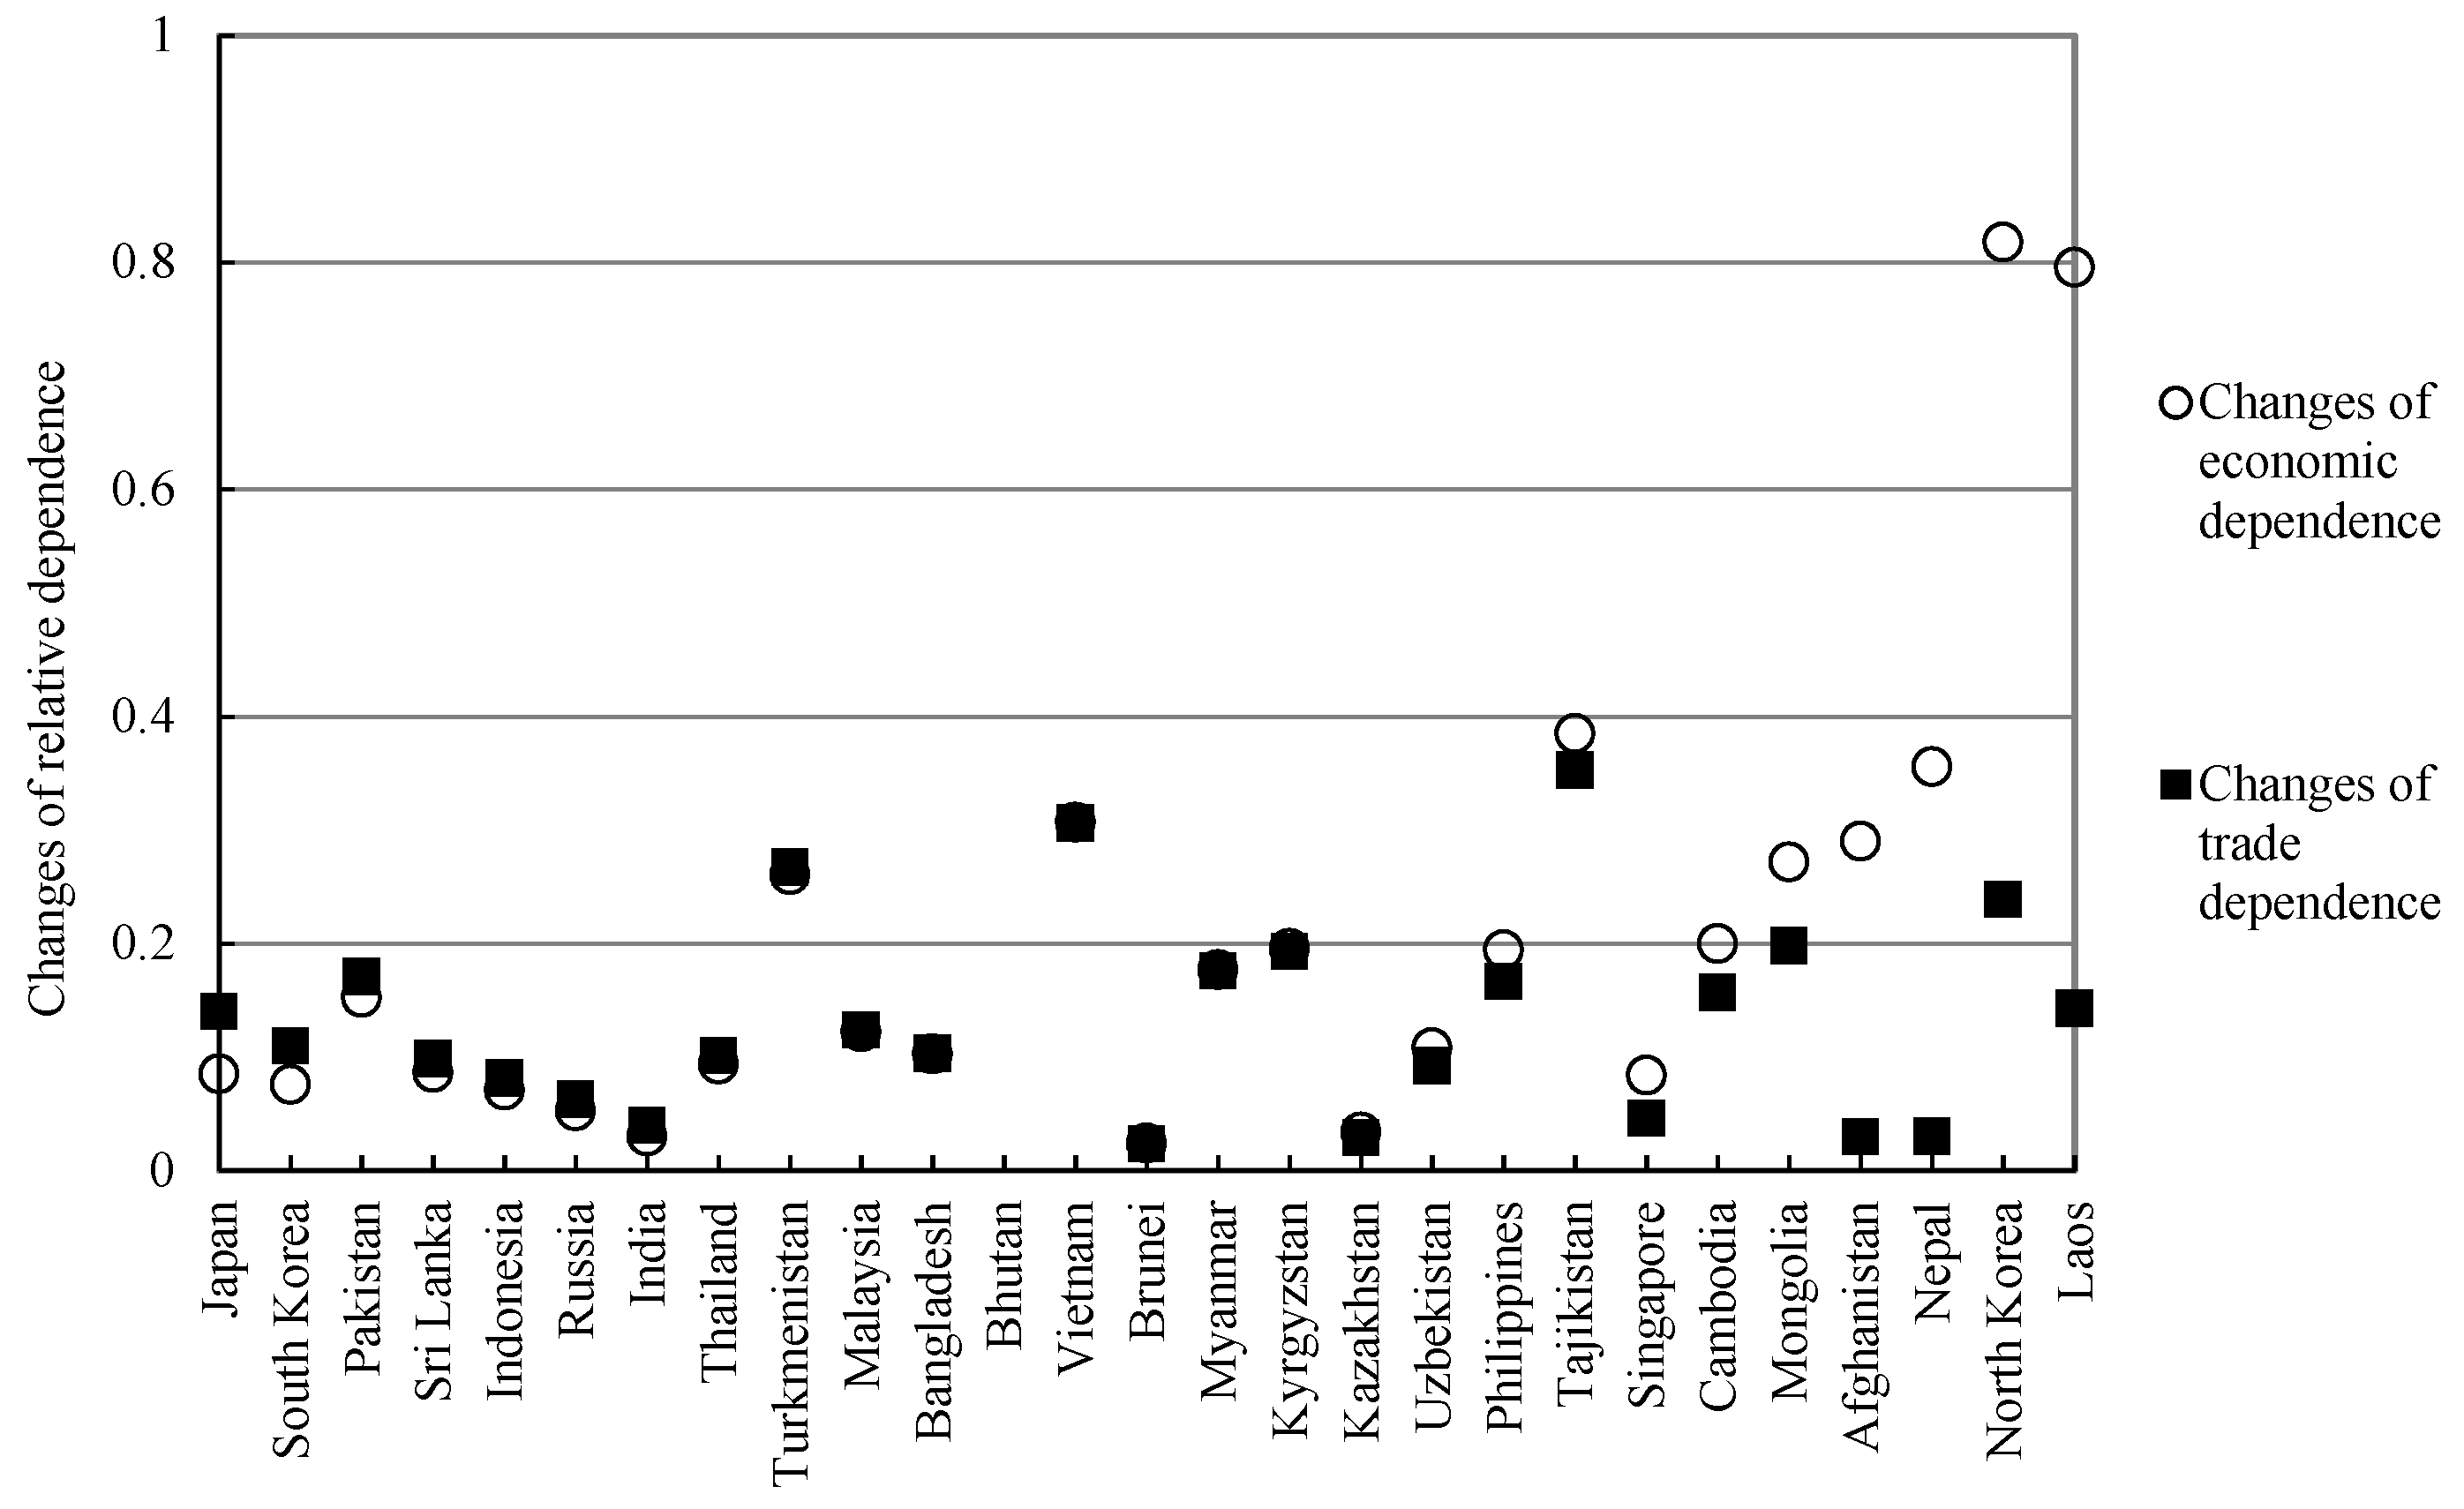
3.2. The Evolution of Relative Economic Dependence of Neighboring Countries on China

According to the Table 2, in 1984, China had relative trade dependence on Japan and the Soviet Union, with values of 0.19 and 0.01, respectively. China had a high dependence on Japan and was in a weak position with regard to trade with Japan and the Soviet Union. China’s relative economic dependence on Japan in the next 30 years decreased, and the asymmetric interdependence situation between China and Japan was reversed in 2010, when Japan had low relative economic dependence on China, with a value of 0.02. At that time, the relative economic dependencies of neighboring countries on China were all positive, and the economic status of China had undergone a fundamental transformation. By 2016, Japan’s relative economic dependence on China had risen to 0.14, which was high dependence.
After the disintegration of the Soviet Union in 1991, the relative trade dependence of Russia and Central Asian countries on China turned from negative to positive. Since then, Russia’s relative economic dependence on China has increased from low to medium, reaching 0.09 in 2016. From 2008 to 2010, Russia’s relative economic dependence fell from 0.03 to 0.02, because the financial crisis and the fall of international oil prices lead to a 50% shrink of bilateral trade between China and Russia; thus, Russia’s relative trade dependence on China fell from 0.05 to 0.03. Since 2010, China has become Russia’s chief trade partner. After the Ukrainian crisis in 2014, Western sanctions against Russia prompted Sino-Russian relations to improve. The bilateral trade between China and Russia in 2016 increased by 22% compared with that of 2008, and Russia’s relative trade dependence on China reached 0.11. Meanwhile, China’s OFDI stock in Russia also boosted rapidly, from US$2.8 billion in 2010 to US$13 billion in 2016. Consequently, Russia’s relative investment dependence on China rose from 0.005 to 0.03.
From 1984 to 2008, India’s relative economic dependence on China increased from 0.001 to 0.05, switching from low dependence to medium dependence. Since then, India’s relative economic dependence on China has increased slowly, reaching 0.06 in 2016, because the bilateral trade between China and India grew from US$51.8 billion to US$70.2 billion, which was small compared to the GDP of the two countries. Although China’s OFDI stock in India boosted from US$200 million to US$3.1 billion, it accounted for merely 1% of India’s gross IFDI stock. China and India have few economic ties.
Before 1992, China and South Korea didn’t establish diplomatic relations, and the two countries were isolated from each other. From 1992 to 2005, South Korea’s relative economic dependence on China rose from 0.002 to 0.05, switching from low dependence to medium dependence. By 2010, South Korea’s relative economic dependence on China had risen rapidly to 0.09, mainly because bilateral trade nearly doubled from US$111.9 billion to US$207.1 billion, so South Korea’s relative trade dependence on China accelerated from 0.10 to 0.16. In 2016, South Korea reached high relative economic dependence on China, with a value of 0.12. The bilateral trade has increased by 22% from 2010 to 2016, and South Korea’s relative trade dependence on China reached 0.19, while China’s OFDI stock in South Korea increased from US$600 million to US$4.2 billion; therefore, South Korea’s relative investment dependence on China rose from −0.07 to −0.02.
From 1984 to 2003, Singapore’s relative trade dependence on China grew from 0.05 to 0.15, rising from low dependence to high dependence, with bilateral trade increasing by 13 times. In 2003, Singapore’s relative economic dependence on China was only 0.01, which was low dependence, because Singapore’s OFDI stock in China reached US$17.4 billion while China’s OFDI stock in Singapore was less than US$200 million, and Singapore’s investment sensitivity and vulnerability to China were −0.03 and −0.01, respectively. The comparative advantage in the investment sector lowered Singapore’s economic dependence on China. By 2016, Singapore’s relative economic dependence on China had risen to 0.09, when China’s OFDI stock in Singapore reached US$33.4 billion, and Singapore’s relative investment dependence on China reached 0.08. China’s status in the investment field was reversed.
From 1984 to 2016, Mongolia’s relative economic dependence on China rose from 0.002 to 0.38, reaching high dependence. In 2016, due to the Dalai Lama’s visit to Mongolia, China adopted economic restrictions on Mongolia. Consequently, bilateral trade fell by 14%, and China’s OFDI flows to Mongolia dropped to US$80 million, which was a significant decrease compared with the US$500 million in 2014. At that moment, Mongolia’s domestic economic situation was severe. The decline of commodity prices in the international market led to economic growth close to zero, and the government debt was as high as 80% of GDP. The high debt and excessive dependence on the mining industry caused a sharp fall of the monetary exchange rate and a series of market crashes. In addition, in 2013, investment law and mining contracts were revised, which restricted foreign investment, so foreign capital avoided the risk and evacuated. Therefore, although bilateral trade between China and Mongolia decreased, Mongolia’s relative economic dependence on China increased.
Laos’ relative economic dependence on China grew rapidly, rising from a low dependence of 0.02 in 1984 to an extreme dependence of 0.82 in 2016. China’s OFDI stock in Laos boosted from US$0.2 billion in 2003 to US$5.5 billion in 2016, and the share rose from less than 2% to over 90%. Laos’ relative investment dependence on China rose from 0.01 to 0.87, which was the dominant factor for the increase in Laos’ economic dependence. From 1984 to 2015, Myanmar’s relative economic dependence on China rose from 0.06 to 0.33, reaching high dependence. Then, it fell to 0.29 in 2016, largely because bilateral trade fell by 19%. China–Myanmar border trade affected by the conflict in North Myanmar and China’s reduced demand for agricultural products such as Myanmar’s rice caused Myanmar’s exports to China to fall by 25% year-on-year. In 2003, the relative economic dependence of Vietnam, Philippines and Malaysia on China all reached 0.11, and increased to 0.42, 0.30, and 0.23, respectively, in 2016. The three countries already had high relative economic dependence on China and the dependence had been growing. Brunei’s relative economic dependence on China rose from 0.001 in 1984 to 0.13 in 2015, but fell to 0.08 in 2016. This was, essentially, because bilateral trade decreased from US$1.5 billion in 2015 to US$0.7 billion in 2016, and China’s exports to Brunei decreased by US$0.9 billion, causing Brunei’s relative trade dependence on China to drop from 0.14 to 0.08.
From 2010 to 2015, Nepal’s relative economic dependence on China rapidly deepened from 0.07 to 0.49, mainly because China’s OFDI stock in Nepal increased from US$20 million to US$300 million, and their share increased from 7% to 50%. China’s OFDI flow to Nepal in 2016 was US$−0.5 billion, primarily, because of the intervention of India which resulted in part of infrastructure investment in Nepal being suspended. Nepal’s relative economic dependence fell to 0.37 because of the withdrawal of Chinese capital. In 2016, all neighboring countries had medium or higher relative economic dependence on China except Bhutan. Due to the very close relationship between Bhutan and India, Bhutan had not established diplomatic relations with China, and had no investment cooperation with China, and bilateral trade was low. Bhutan’s relative economic dependence on China was simply 0.003 in 2016.

4. Discussion

4.1. The Types of Relative Economic Dependence

Trade is a significant aspect of bilateral economic ties, and trade dependence is a significant part of economic dependence. However, high trade dependence does not mean that the overall economic dependence is high, and the consideration of diverse economic factors will generate different economic dependencies. The types of relative economic dependence (ED) are classified based on relative trade dependence (TD) and relative investment dependence (ID), see Table 3.
Dual negative dependence means that China has relative trade and investment dependence on these countries, and China has absolute economic disadvantages over such countries. In 2003, only Japan had comparative advantages over China in both fields, see Table 4. After 2005, there were no such countries in the neighborhood.
Trade compensative dependence means these countries have relative trade and economic dependence on China and China has relative investment dependence on them. Comparative advantages in the trade sector compensate for China’s investment disadvantages and cause China to have economic advantages over such countries. In 2003, there were seven countries that pertained to this type, of which only South Korea remained in 2016, and Japan switched from dual negative dependence to this type.
Dual low dependence means these countries have low relative dependence on China in both trade and investment fields, and China has weak economic advantages over such countries. In 2003, there were 13 countries of this type, of which only Bhutan remained in 2016, and India and Brunei transformed from trade compensative dependence to this type.
Investment-oriented dependence means these countries have high relative investment dependence and low relative trade dependence on China. China has strong economic advantages over such countries and this is mainly because of investment. In 2003, there were no such neighboring countries. In 2016, Afghanistan and Nepal changed from dual low dependence to investment-oriented dependence.
Trade-oriented dependence means these countries have high relative trade dependence and low relative investment dependence on China. China has strong economic advantages over such countries and this mainly comes from trade. The number of neighboring countries in this type was six in 2003, which expanded to 11 in 2016.
Dual high dependence means these countries have high relative dependence on China in both trade and investment fields, and China has absolute economic advantages over such countries. In 2003, there were no such countries in the neighborhood. By 2016, nine countries had pertained to this type.
Trade depleted dependence means these countries have relative investment dependence on China, while China has relative trade and economic dependence on them. The trade disadvantages deplete China’s investment advantages and put China in a weak economic status. Investment depleted dependence is the opposite of trade depleted dependence, and investment compensative dependence is the opposite of trade compensative dependence. Since 2003, there have been no neighboring countries of these three types.
From 2003 to 2016, both relative trade and investment dependence of neighboring countries on China had increased, and the types of relative economic dependence had gradually turned from dual low and trade compensative dependence to dual high and trade-oriented dependence, see Table 4.

4.2. The Trends of Relative Economic Dependence

Since 2003, neighboring countries’ trade with China and IFDI from China have increased rapidly, and the relative trade and investment dependencies on China have risen correspondingly, but the growth of trade and investment have shown differences. Therefore, the relative trade and investment dependence have also changed differently. In 2003, Afghanistan’s relative trade dependence on China was less than its relative economic dependence, see Figure 2 and Figure 3, while the other 26 countries were the opposite. By 2016, countries like Afghanistan had expanded to include Afghanistan, Nepal, Tajikistan, Cambodia, Laos and North Korea. To these countries’ relative economic dependence on China, the contribution of investment dependence was greater than trade dependence. Combining with the types of relative economic dependence above, with trade compensative dependence, Japan and South Korea’s relative economic dependence on China was due to trade and reduced by investment factors. As for countries with investment-oriented dependence such as Afghanistan and Nepal and countries with dual high dependence such as Tajikistan, Cambodia, Laos and North Korea, investment reinforced their relative economic dependence on China on the basis of trade. For the remaining 19 neighboring countries, the joint role of trade and investment formed their relative economic dependence on China and the contribution of trade was greater. It can be found that by 2016, the relative economic dependence of neighboring countries on China had been primarily due to trade.
As for the variation of relative dependence, see Figure 4, for 15 neighboring countries including Vietnam, Brunei, Myanmar, Kyrgyzstan, Kazakhstan, Uzbekistan, Philippines, Tajikistan, Singapore, Cambodia, Mongolia, Afghanistan, Nepal, North Korea and Laos, the growth of their relative economic dependence on China was larger than the growth of their relative trade dependence from 2003 to 2016, that is, the growth of investment dependence contributed more than the growth of trade dependence. For 11 other countries, except Bhutan, trends were to the contrary because these countries with better economic situations had wider IFDI sources and their investment dependence on China increased at a slower rate. In 2016, China had already become the largest trade partner of 20 neighboring countries and the second largest trade partner of three countries including Laos, Sri Lanka and Nepal, see Figure 5, and the remaining four countries (Kazakhstan, Afghanistan, Bhutan and Brunei) had frequent commercial intercourse with China, too. Given that China’s trade relations with neighboring countries were very close and China’s OFDI was growing continually and have considerable potential in the future, most neighboring countries’ relative trade dependence on China was larger than their relative investment dependence, while their investment dependence grew faster than trade dependence. Trade was the principal factor that contributed to China’s relative economic advantages over the neighboring powers, and FDI would be the dominant factor for the growth of the relative economic dependence of the rest countries on China.

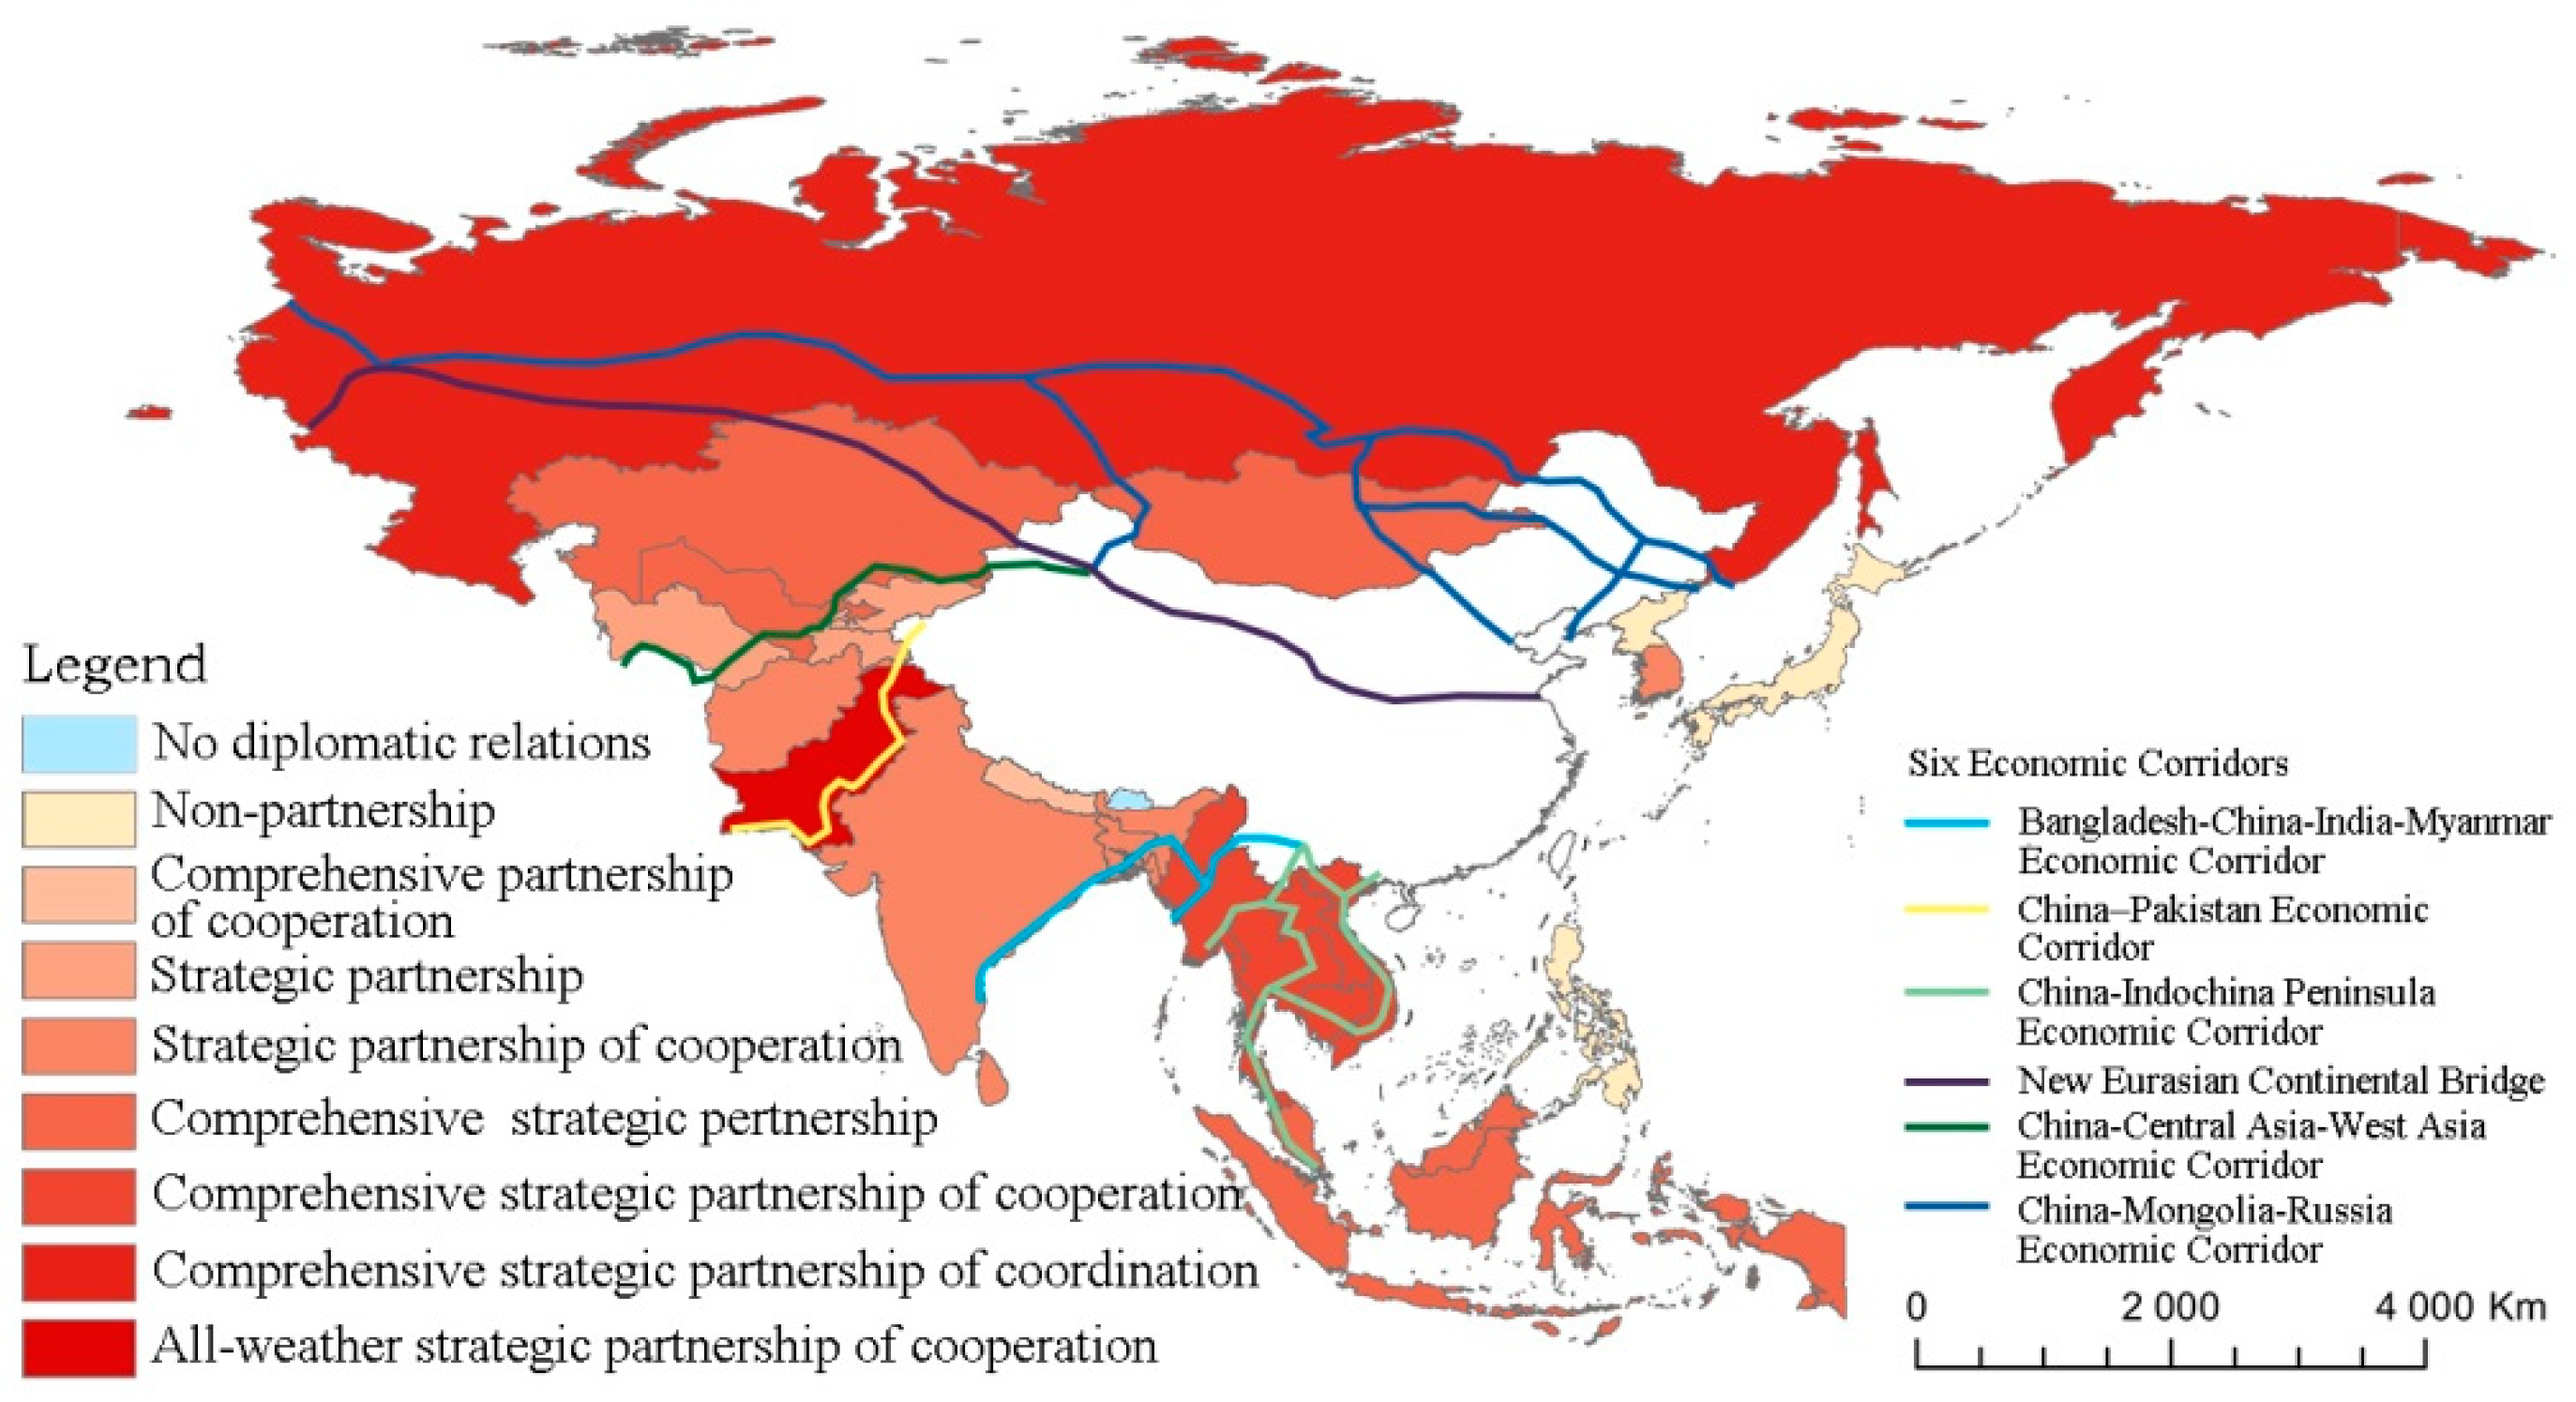
4.3. The Relationship between Economic Interdependence and Political Relations

The asymmetric economic interdependence relies on economic ties between the two countries and is hidden behind this normal relationship. It has certain bargaining power on political issues and is a significant part of a country’s strength, but it shouldn’t be regarded as an overt authority and pursued deliberately. Economic interaction firstly attaches significance to domestic benefit, and economic interdependence is a by-product of the natural economy. Although China is in an advantageous position with regard to its economic interdependence with neighboring countries, absolute economic ties are deepening and common interests are increasing. Deliberate pursuit of relative economic dependence may instead cause an impact on domestic economic development. One country’s geoeconomic influence will naturally increase based on its economic development. Therefore, the normal interaction between economic interdependence and political relations is analyzed below, and the geoeconomic environment around “the Belt and Road” is investigated.
Bilateral political relations can be referred to by the level of partnership between China and neighboring countries. The “People’s Daily” categorized the relationship into three basic models in 1998: partnership, alliance, and non-alliance and non-partnership. China has no legal allies, and partnership plays a significant role in China’s diplomacy. Partnership is a relationship of mutual respect, seeking common ground while reserving differences and win-win cooperation. Up to 2016, China had established variant levels of partnership with 81 of the 173 countries with which China had established diplomatic relations. There are more than ten expressions of China’s foreign partnerships, and the bilateral political relations between China and neighboring countries can be divided into nine grades accordingly, see Figure 6. Twenty-two of the surrounding 27 countries had established partnerships with China, among which the China–Pakistan all-weather strategic partnership of cooperation was at the top, followed by the China–Russia comprehensive strategic partnership of coordination, and once more, the comprehensive strategic partnership of cooperation with Indo–China Peninsula countries. China–India and China–South Korea strategic partnerships of cooperation ranked in fifth. Japan, North Korea, Philippines and Brunei had not established partnerships with China. The strategic relationship of mutual benefit between China and Japan focuses more on economic relations than political relations. The friendship, cooperation and mutual assistance between China and North Korea is built on the basis of history. Although the North Korean nuclear test and the international political environment had caused Sino-North Korea relations to cool, the interests of the two countries are still in solidarity. In 2018, the Sino–Philippine relationship was upgraded to comprehensive strategic cooperation. Bhutan was the sole neighboring country that had not established diplomatic relations with China.
Changes in bilateral political relations have a direct positive impact on economic ties. When bilateral political relations improve, that often contributes to the development of economic relations. For instance, China was Pakistan’s largest trade partner and source of IFDI. Sino–Russian relations escalated after the Ukraine crisis, so that China’s OFDI stock in Russia increased by 50% in 2016 compared with that of 2014, and Russia had become China’s largest source of oil imports. Due to the large volume of China’s economy, when the bilateral economic ties deepened, the relative economic dependence of the other country on China often increased. However, the absolute economic interdependence also deepened, which is in favor of friendly and stable political relations. When bilateral political relations get cold, it may bring about retrogression of economic relations, such as the divestment of transnational enterprises and trade restrictions. For example, the issue of Diaoyu Islands and the deployment of Terminal High Altitude Area Defense (THAAD) had caused China–Japan and China–South Korea economic relations to cool. The trade between China and Japan, as well as South Korea, has decreased, and tourism has also been affected. However, the negative impacts of political relations on economic relations are relatively small within a certain range. The economic interdependence between China and neighboring countries has generally been steadily increasing and has not been largely affected by the fluctuations of political relations. The deeper the economic ties, the greater the potential for resisting political risks, and the stronger the “inertia” of forward development. Economic operation is not directly governed by political relations. The “cold politic relations and hot economic relations” between China and Japan are a typical example.
The influence of economic interdependence on political relations is implicit and subtle. Bilateral political relations do not necessarily converge with economic relations, but they will be affected. Economic interdependence contributes to the stability of political relations. For instance, Mongolia and the Philippines’ relations with China have fluctuated. In November 2016, the Dalai Lama visited Mongolia, which resulted in China delaying dialogue with Mongolia on loans, mining cooperation and other financial affairs, and imposed additional fees on some goods from Mongolia. At that time, 80% of Mongolia’s exports were into China, and investment from China accounted for 30% of Mongolia’s IFDI stock. Failing to sustain the economic losses, Mongolia stated that it firmly supported the one-China policy and rejected the Dalai’s re-entry into Mongolia. This is an example of economic interdependence to maintain political stability. Since the 1980s, the Philippines had been in dispute with China on the issue of the South China Sea, and the bilateral relationship had been tense. After 2016 when Duterte was at the helm of the state, bilateral relations improved. Economic interdependence and common economic interests between China and the Philippines played a significant underlying role.

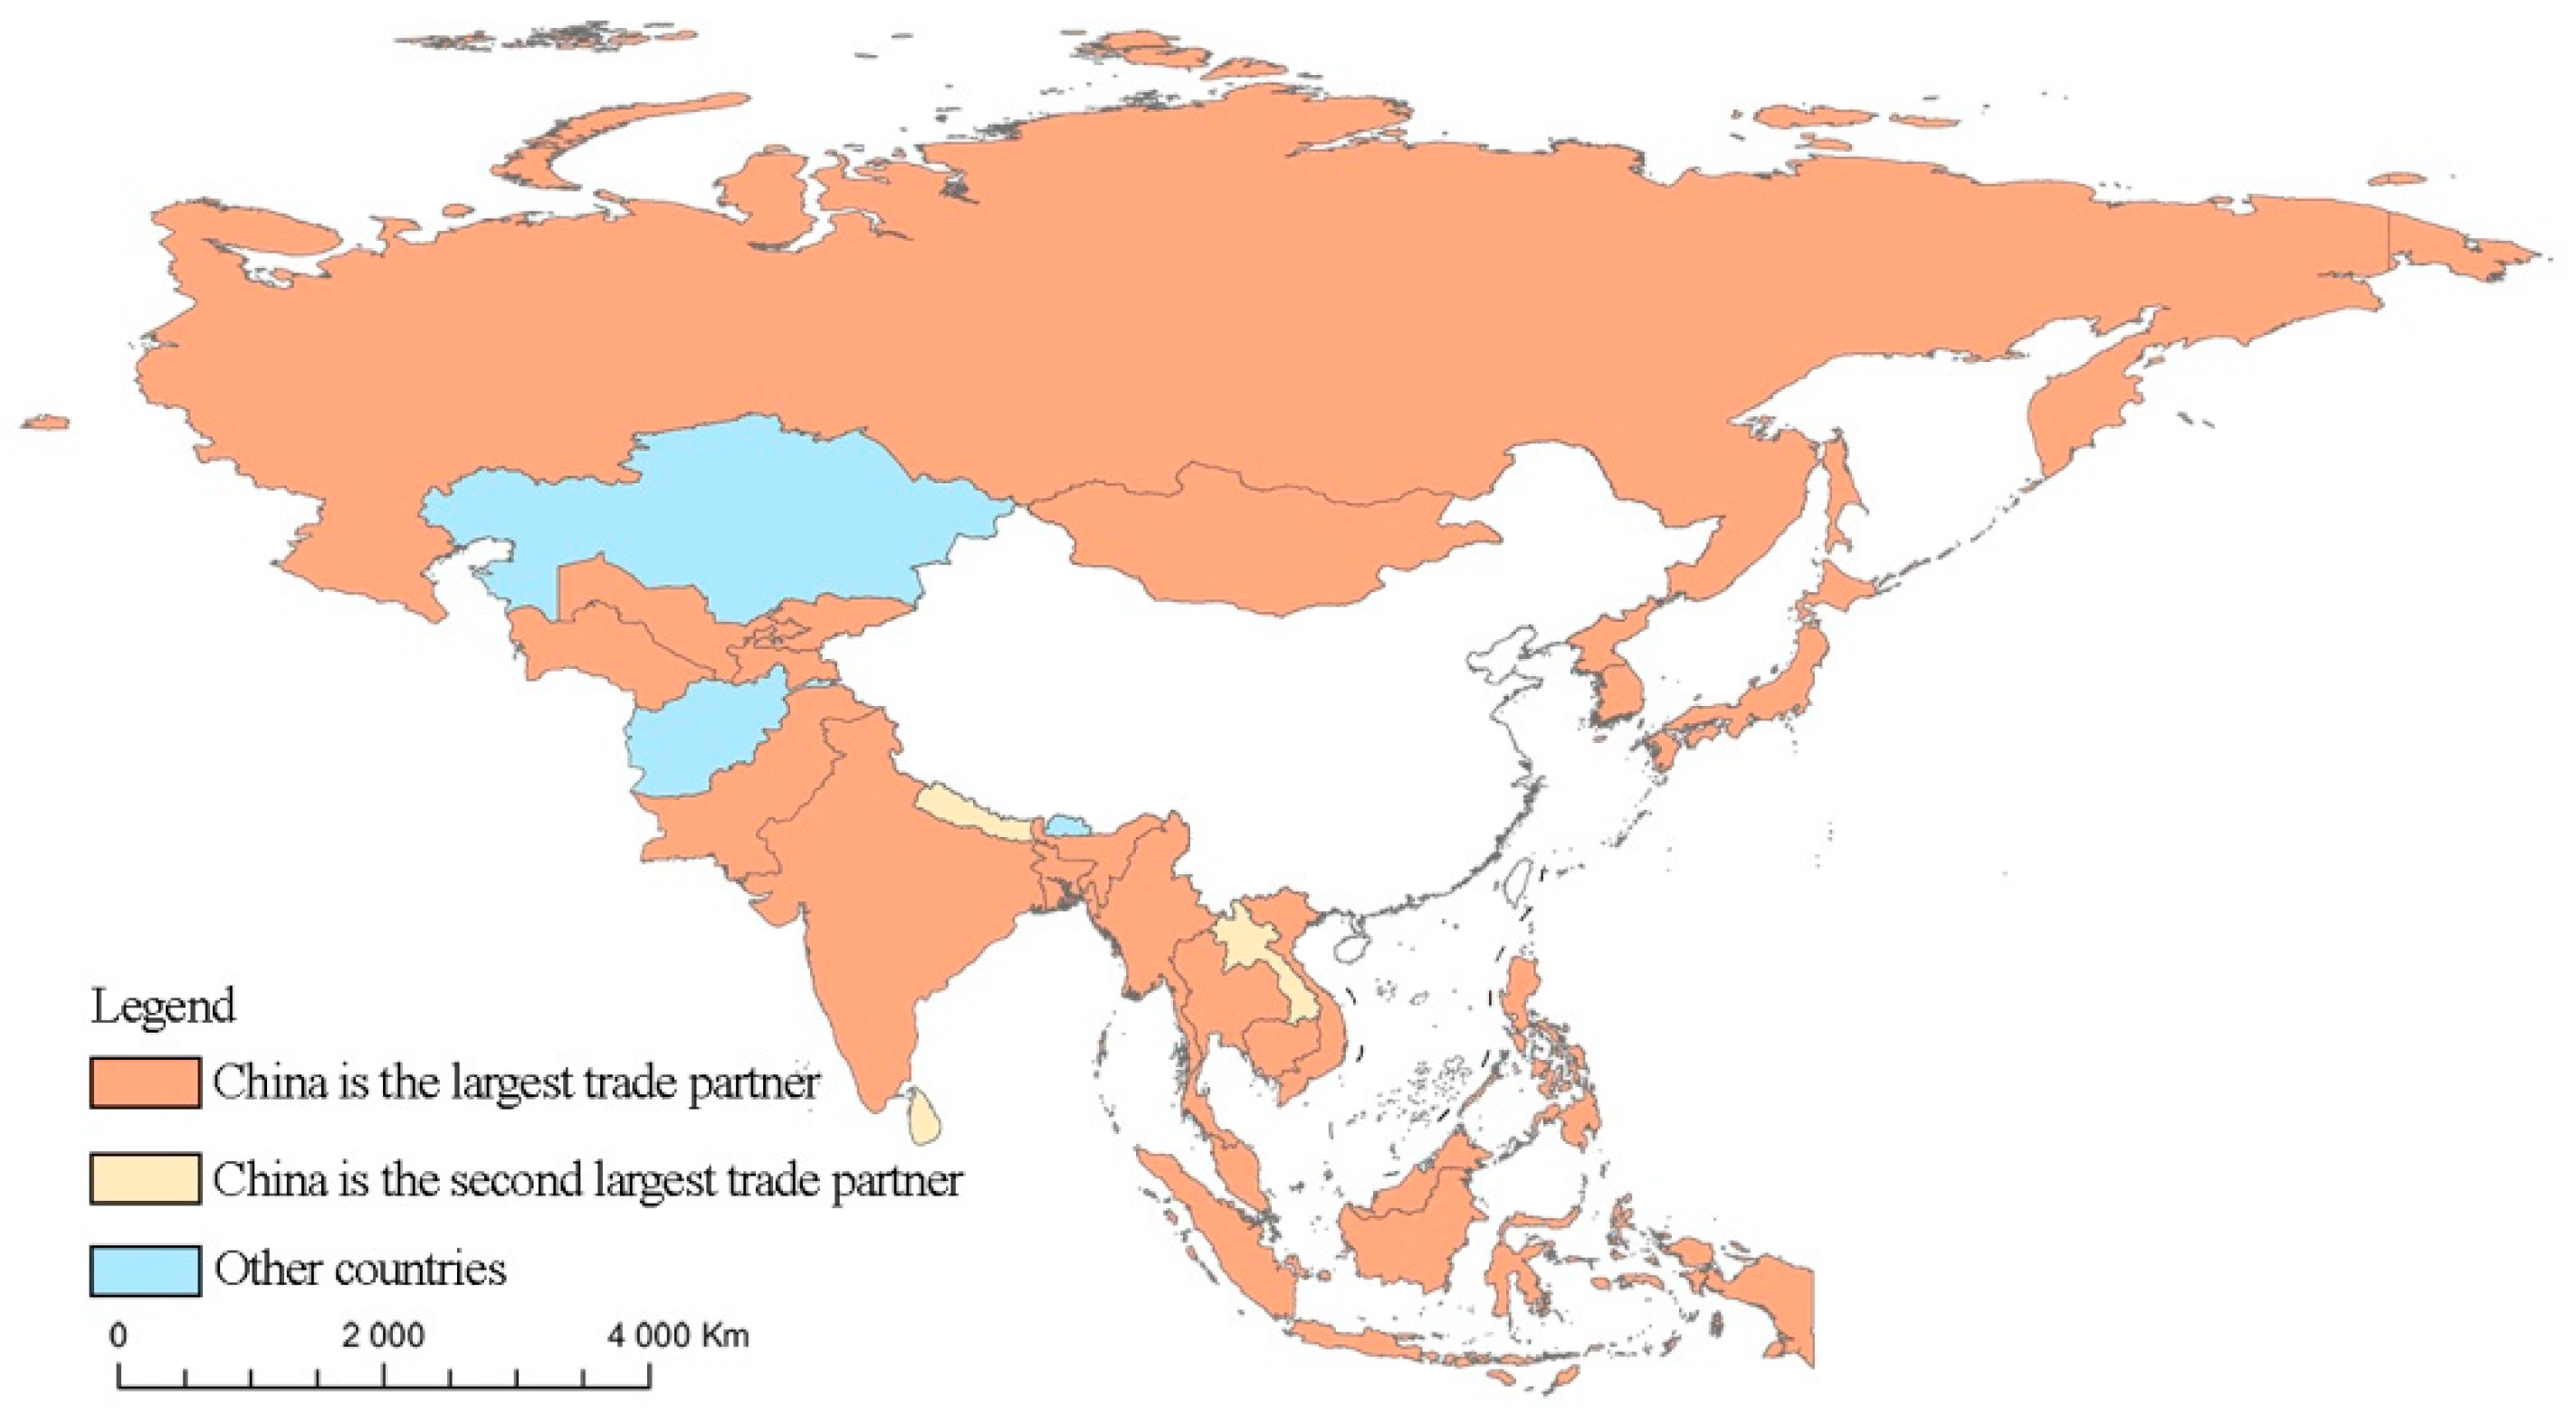
4.4. Peripheral Economic Cooperation

As analyzed previously, for China, the interaction between political and economic relations tends to be benign, with the two promoting each other rather than constraining each other. Political mutual trust could sustain economic cooperation and economic ties could promote the development of closer political relations. The transformation of Sino–Philippine relations is strong proof of this. China’s geoeconomic development focuses on mutually beneficial cooperation, and regional economic integration is its goal. China and neighboring countries pursue cooperation and development accompanied by competition, and carry out international dialogues in wider fields, and continuously strengthen economic and trade contacts so as to fulfill regional economic integration. Border space and foreign cooperation carriers (ports, corridors, border and overseas cooperation zones, etc.) are the key points for China to realize regional economic cooperation. By establishing open platforms such as treaty ports, economic corridors, border cooperation zones and overseas parks, the cross-border circulation of resources, capital, commodities and tourism can be controlled to achieve mutual economic benefits.
The adjacent countries such as the Indo–China Peninsula countries, Central Asian countries, Mongolia, Afghanistan and Pakistan had high relative economic dependence on China, see Figure 3, and their partnerships with China were also close, see Figure 6. Geographical factors like historical relations, geographical proximity, convenient transportation and cooperative carriers created these countries’ close political and economic contact with China, and also provided the construction of six economic corridors, see Figure 6, with a favorable geoeconomic environment. The six economic corridors are the starting points for “the Belt and Road Initiative”. “The Belt and Road Initiative”, which is an improved mode of regional economic cooperation [29], caters to China’s economic transformation and industrial upgrading, as well as infrastructure construction and economic growth of countries along the route. Win-win development is the target pursued consistently, and during this process, regional connectivity will be promoted and the cooperative relationship will be deepened. Relying on the node cities and cooperative zones, the six economic corridors from “dots” to “lines” were built, extending from neighboring countries to West Asia, North Africa and Europe, promoting the interconnection of countries along the route and accelerating regional economic integration. Taking the China–Pakistan Economic Corridor as an example: First, the construction of the corridor will not bring about financial problems to Pakistan. Less than 20% of the funds are Pakistan’s loans, and the rest are China’s direct investment and gratuitous aids. Second, during the five years of corridor construction, 22 projects have been inspected and accepted, greatly improving Pakistan’s electricity supply and other infrastructure, and creating tens of thousands of local jobs. Third, the construction of the Gwadar Port at the end of the corridor has attracted investment from third-party countries and brought new economic growth points to Pakistan. In 2019, Saudi Arabia confirmed an investment of US$10 billion in a petrochemical complex in Gwadar Port. The six corridors will influence the geoeconomic pattern along the route and a friendly geoeconomic environment is also needed as a guarantee of the corridors’ construction.

5. Conclusions

(1) In the geographical plate of the west coast of the Pacific Ocean and the east of the Eurasian continent, there is a certain geoeconomic rivalry between China and Japan. Japan had been a frontrunner for more than 30 years after China’s reform and opening-up. After 2010, China’s position had transformed in the asymmetrical economic interdependence. Since then, all neighboring countries, including Japan, had relative economic dependence on China, and China’s geoeconomic status had been reversed fundamentally.
(2) Since the reform and opening-up, the relative economic dependence of neighboring countries on China had continued to increase, switching from negative to positive and from low to high. The relative economic dependence of adjacent countries including ASEAN countries, Central Asian countries, Mongolia, Afghanistan and Pakistan was particularly high. Since 2003, the types of relative economic dependence had transformed from dual low and trade compensative dependence to dual high and trade-oriented dependence.
(3) By 2016, the relative economic dependence of most neighboring countries on China had been primarily due to trade, and their investment dependence on China would grow faster than trade dependence in the future. Trade was the main factor contributing to China’s relative economic advantages over great powers in the neighborhood, while the growth of most other countries’ relative economic dependence would gradually turn to investment.
(4) Bilateral political relations and economic relations between China and neighboring countries do not show convergence. The improvement of political relations provides a foundation for the development of economic relations, and economic relations have the “inertia” of resisting political risks. The impact of economic interdependence on political relations is implicit and subtle. The deepening of economic ties is conducive to friendly and stable political relations.
(5) China’s peripheral geoeconomic strategy focuses on cooperation rather than competition. Political mutual trust could sustain economic cooperation and economic ties could promote the development of closer political relations. One of the goals of geoeconomics is the pursuit of joint economic benefits.
The discussion of geoeconomic relations in this paper is limited to total trade and investment. The follow-up study could be about trade structure, strategic resources and key technology, tariff barriers, foreign aid, and Chinese Yuan (CNY) internationalization. In addition, interstate relations are a complex network, and this paper doesn’t consider the multilateral relations among intra-area countries and extraterritorial dominant countries. In the future, these aspects need to be analyzed so as to further clarify the geoeconomic pattern and evolution among China and neighboring countries.

Author Contributions

Conceptualization, D.L. and M.C. and Y.L.; Methodology, Y.L. and Z.D; Formal analysis, Y.L. and M.C.; Writing—original draft preparation, Y.L. and Z.Z.; Writing—review and editing, M.C. and Y.L.; Visualization, Y.L.; Funding acquisition, D.L. and M.C.

Funding

This research was funded by [National Natural Science Foundation of China] grant number [41530634] And The APC was funded by [National Natural Science Foundation of China] grant number [41822104].

Conflicts of Interest

The authors declare no conflict of interest.

Appendix A

Table A1. Weights of the variables in various countries.
CountryWeights of Trade SensitivityWeights of Trade VulnerabilityWeights of Investment SensitivityWeights of Investment Vulnerability
Afghanistan0.0229170.0048510.9603340.011897
Bangladesh0.8059390.1811100.0128886.24 × 10−5
Bhutan0.5665470.43345300
Brunei Darussalam0.5596170.3405240.0786450.021214
Cambodia0.1280960.1747260.3556180.341561
India0.5292980.3102850.1571250.003291
Indonesia0.6257260.0439330.3048360.025504
Japan0.4517200.2244940.3205360.003249
Kazakhstan0.3294850.2324570.2385080.199550
North Korea0.0135000.0116340.9744590.000408
South Korea0.3135290.3819730.3013320.003167
Kyrgyzstan0.2096210.1875380.3100180.292822
Lao PDR0.0606110.0247910.7604350.154163
Malaysia0.5937310.3507610.0482450.007263
Mongolia0.2063980.1081970.3304130.354991
Myanmar0.3980250.1708910.3730200.058064
Nepal0.0246620.0041480.9695670.001623
Pakistan0.5856070.0387380.3671550.008500
Philippines0.9100680.0743270.0150360.000569
Russian Federation0.5436390.1055770.3307990.019985
Singapore0.1188420.0845400.1544980.642120
Sri Lanka0.4460770.0429690.5004220.010532
Tajikistan0.3453910.1623650.4130150.079229
Thailand0.4813340.4358240.0681030.014739
Turkmenistan0.7013880.2759840.0167290.005899
Uzbekistan0.3361590.0245420.6197310.019569
Vietnam0.2082730.7691370.0170190.005570

References

  1. Csurgai, G. The Increasing Importance of Geoeconomics in Power Rivalries in the Twenty-First Century. Geopolitics 2018, 23, 38–46. [Google Scholar] [CrossRef]
  2. Parker, G. Geopolitics: Past, Present and Future; CroomHelm: London, UK, 1998. [Google Scholar]
  3. Nye, J.S. Soft Power: The Means to Success in World Politics; PublicAffairs: New York, NY, USA, 2004. [Google Scholar]
  4. Luttwak, E.N. From Geopolitics to Geo-economics: Logic of Conflict, Grammar of Commerce. Natl. Interest 1990, 20, 17–23. [Google Scholar]
  5. Wigell, M. Conceptualizing regional powers’ geoeconomic strategies: Neo-imperialism, neo-mercantilism, hegemony, and liberal institutionalism. Asia Eur. J. 2016, 14, 135–151. [Google Scholar] [CrossRef]
  6. Cowen, D.; Smith, N. After Geopolitics? From the Geopolitical Social to Geoeconomics. Antipode 2009, 41, 22–48. [Google Scholar] [CrossRef]
  7. Grosse, T.G. Geoeconomic Relations Between the EU and China: The Lessons from the EU Weapon Embargo and From Galileo. Geopolitics 2014, 19, 40–65. [Google Scholar] [CrossRef]
  8. Vihma, A. Geoeconomic Analysis and the Limits of Critical Geopolitics: A New Engagement with Edward Luttwak. Geopolitics 2018, 23, 1–21. [Google Scholar] [CrossRef]
  9. Mercille, J. The radical geopolitics of US foreign policy: Geopolitical and geoeconomic logics of power. Political Geogr. 2008, 27, 570–586. [Google Scholar] [CrossRef]
  10. Sparke, M.; Sidaway, J.D.; Bunnell, T. Triangulating the borderless world: Geographies of power in the Indonesia-Malaysia-Singapore growth Triangle. Trans. Inst. Br. Geogr. 2004, 29, 485–498. [Google Scholar] [CrossRef]
  11. Sparke, M. American empire and globalisation: Postcolonial speculations on neocolonial enframing. Singap. J. Trop. Geogr. 2003, 24, 373–389. [Google Scholar] [CrossRef]
  12. Smith, N. American Empire: Roosevelt’s Geographer and the Prelude to Globalization; University of California Press: Berkeley, CA, USA, 2003. [Google Scholar]
  13. Morrissey, J. Closing the Neoliberal Gap: Risk and Regulation in the Long War of Securitization. Antipode 2011, 43, 874–900. [Google Scholar] [CrossRef]
  14. Morrissey, J. Geoeconomics in the Long War. Antipode 2017, 49, 94–113. [Google Scholar] [CrossRef]
  15. Domosh, M. Geoeconomic Imaginations and Economic Geography in the Early Twentieth Century. Ann. Assoc. Am. Geogr. 2013, 103, 944–966. [Google Scholar] [CrossRef]
  16. Pollard, J.S.; Sidaway, J.D. Editorial: Euroland—Economic, cultural and political geographies. Trans. Inst. Br. Geogr. 2002, 27, 7–10. [Google Scholar] [CrossRef]
  17. Giordano, B. Euro(sceptic)land: A response to Pollard and Sidaway. Trans. Inst. Br. Geogr. 2002, 27, 514–517. [Google Scholar] [CrossRef]
  18. Pollard, J.S.; Sidaway, J.D. Nostalgia for the future: The geoeconomics and geopolitics of the Euro. Trans. Inst. Br. Geogr. 2002, 27, 518–521. [Google Scholar] [CrossRef]
  19. Sidaway, J.D. Asia Europe United States: The geoeconomics of uncertainty. Area 2005, 37, 373–377. [Google Scholar] [CrossRef]
  20. Moisio, S. Towards Geopolitical Analysis of Geoeconomic Processes. Geopolitics 2018, 23, 22–29. [Google Scholar] [CrossRef]
  21. Chacko, P.; Jayasuriya, K. A capitalising foreign policy: Regulatory geographies and transnationalised state projects. Eur. J. Int. Relat. 2018, 24, 82–105. [Google Scholar] [CrossRef]
  22. Lee, S.O.; Wainwright, J.; Glassman, J. Geopolitical economy and the production of territory: The case of US-China geopolitical-economic competition in Asia. Environ. Plan. A 2018, 50, 416–436. [Google Scholar] [CrossRef]
  23. Warf, B. The geopolitics/geoeconomics of military base closures in the USA. Political Geogr. 1997, 16, 541–563. [Google Scholar] [CrossRef]
  24. Wang, S.; Zhu, A.; Ge, Y.; Liu, Y.; Xue, X. The Spatio-Temporal Evolution of Geo-Economic Relationships between China and ASEAN Countries: Competition or Cooperation? Sustainability 2017, 9, 1064. [Google Scholar] [CrossRef]
  25. Du, D.B.; Duan, D.Z.; Yang, W.L. Spatial evolution pattern of Chinese economic power based on the sensitivity and vulnerability of states interdependence. Acta Geogr. Sin. 2016, 71, 1741–1751. [Google Scholar]
  26. Taylor, P.J.; Flint, C. Political Geography: World-Economy, Nation-State and Locality; Pearson Education Lim: Harlow, UK, 2007. [Google Scholar]
  27. Keohane, R.O.; Nye, J.S. Power and Interdependence; Longman: London, UK, 2011. [Google Scholar]
  28. An, N.; Zhu, H. A critical geopolitical analysis of “East Turkistan violence and terrorism” activities in China. Acta Geogr. Sin. 2015, 70, 1650–1663. [Google Scholar]
  29. Liu, W.D.; Dunford, M.; Gao, B.Y. A discursive construction of the Belt and Road Initiative: From neo-liberal to inclusive globalization. J. Geogr. Sci. 2018, 28, 1199–1214. [Google Scholar] [CrossRef]
Figure 1. China and neighboring countries. Source: Drawn by authors.
Sustainability 11 02168 g001
Figure 2. The pattern and evolution of neighboring countries’ relative trade dependence on China from 1984 to 2016. Source: Drawn by authors.
Sustainability 11 02168 g002
Figure 3. The pattern and evolution of neighboring countries’ relative economic dependence on China from 2003 to 2016. Source: Drawn by authors.
Sustainability 11 02168 g003
Figure 4. Changes in neighboring countries’ relative economic and trade dependence on China from 2003 to 2016. Note: The change of each country’s relative dependence refers to the numerical difference between the value in 2016 and value in 2003. Source: Drawn by authors.
Sustainability 11 02168 g004
Figure 5. Trade relations between China and neighboring countries in 2016. Source: Drawn by authors.
Sustainability 11 02168 g005
Figure 6. Partnerships between China and neighboring countries in 2016. Source: Drawn by authors.
Sustainability 11 02168 g006
Table 1. Grading of relative economic dependence.
Magnitude of EDED < 00 < ED ≤ 0.050.05 < ED ≤ 0.10.1 < ED ≤ 0.5ED > 0.5
Degree of EDNegative dependenceLow dependenceMedium dependenceHigh dependenceExtreme dependence
Source: Drawn by authors.
Table 2. Values of relative economic dependence of neighboring countries on China.
Country198420032016
TDTDEDTDED
Afghanistan0.0032730.0108320.0220340.0405090.312175
Bangladesh0.0236510.0659930.0659930.1690840.168977
Bhutan3.88 × 10−50.0044180.0043110.0029020.002845
Brunei0.0008070.0570450.0513840.0805290.075664
Cambodia0.0007890.0684420.0360050.2253710.235996
India0.0010940.041420.0283320.0810590.058655
Indonesia0.0026100.0768490.0539760.1581320.124955
Japan−0.190880−0.00499−0.028750.1351570.056477
Kazakhstan/0.1312560.0743110.1601480.108253
North Korea0.1055950.2184630.0065290.4573020.824486
South Korea00.0770710.0426490.186780.118582
Kyrgyzstan/0.0644040.0383240.2576180.233908
Lao PDR0.0186670.1105590.0215330.2532770.817342
Malaysia0.0081400.1335010.1092140.2573340.231647
Mongolia0.0022750.2948140.1069560.4928850.378871
Myanmar0.0631660.1992440.1118640.3749920.289115
Nepal0.0225180.044990.0132370.075190.369112
Pakistan0.0285820.0885840.0576880.2594540.210326
Philippines0.0180100.1077380.1063760.2743920.301105
Russia/0.0505120.0334660.1133760.086077
Singapore0.0477530.1484830.0101390.1945170.094448
Sri Lanka0.0251480.0416120.0218550.1400330.108246
Tajikistan/0.0237110.0217690.3763620.406704
Thailand0.0119420.0713240.0648510.1725040.15878
Turkmenistan/0.0135170.0132160.2808110.273875
Uzbekistan/0.0544150.0228520.1465970.130983
Vietnam00.1100990.1082440.4162470.415059
USSR−0.011440////
Source: Drawn by authors.
Table 3. Classification of relative economic dependence.
TD < 0
(Negative Dependence)
0 < TD ≤ 0.1
(Low Dependence)
TD > 0.1
(High Dependence)
ID < 0
(Negative Dependence)
Dual negative dependenceTrade compensative dependence (ED > 0)
Investment depleted dependence (ED < 0)
Trade compensative dependence (ED > 0)
Investment depleted dependence (ED < 0)
0 < ID ≤ 0.1
(Low Dependence)
Investment compensative dependence (ED > 0)
Trade depleted dependence (ED < 0)
Dual low dependenceTrade-oriented dependence
ID > 0.1
(High Dependence)
Investment compensative dependence (ED > 0)
Trade depleted dependence (ED < 0)
Investment-oriented dependenceDual high dependence
Source: Drawn by authors.
Table 4. Types of neighboring countries’ relative economic dependence on China from 2003 to 2016.
Type20032016
Dual high dependence Uzbekistan, Kyrgyzstan, Tajikistan, Pakistan, Cambodia, Laos, Myanmar, North Korea, Mongolia (9 countries)
Trade-oriented dependenceVietnam, Laos, Myanmar, North Korea, Mongolia, Kazakhstan (6 countries)Russia, Kazakhstan, Turkmenistan, Sri Lanka, Bangladesh, Thailand, Indonesia, Singapore, Malaysia, Philippines, Vietnam (11 countries)
Investment-oriented dependence Afghanistan, Nepal (2 countries)
Dual low dependenceRussia, Turkmenistan, Tajikistan, Uzbekistan, Kyrgyzstan, Pakistan, Afghanistan, Sri Lanka, Nepal, Bangladesh, Bhutan, Cambodia, Thailand (13 countries)Bhutan, Brunei, India (3 countries)
Trade compensative dependenceIndia, South Korea, Brunei, Indonesia, Philippines, Malaysia, Singapore (7 countries)Japan, South Korea (2 countries)
Dual negative dependenceJapan (1 countries)
Source: Drawn by authors.

