Article

Carbon Emissions, Firm Size, and Corporate Governance Structure: Evidence from the Mining and Agricultural Industries in Indonesia

by
Mohammad Nasih
,
Iman Harymawan
*,
Yuanita Intan Paramitasari
and
Azizah Handayani
Department of Accountancy, Universitas Airlangga, Surabaya 60286, Indonesia
*
Author to whom correspondence should be addressed.
Sustainability 2019, 11(9), 2483; https://0-doi-org.brum.beds.ac.uk/10.3390/su11092483
Submission received: 14 March 2019 / Revised: 16 April 2019 / Accepted: 18 April 2019 / Published: 28 April 2019
(This article belongs to the Section Economic and Business Aspects of Sustainability)

Abstract

:
The purpose of this research was to examine the relationship between firm size, corporate governance, and carbon emission disclosure (CED) in Indonesia, a country with rich natural resources. This study focused on the mining and agricultural industries to better capture the disclosure behavior of companies directly engaged in natural resources. Using a sample of 305 firm-year observations of listed firms in Indonesia spanning from 2011 to 2016, the results show that larger firms and firms with larger board sizes are more likely to have higher disclosure on CED. We also showed that firms with a higher percentage of independent commissioners and directors are less likely to disclose information related to carbon emissions. These findings indicate that a greater number of commissioners and directors sitting on the board will stimulate a firm’s decision to make a higher number of disclosures related to carbon emissions. However, the increased percentage of independent commissioners and directors will cause more conservative disclosure outcomes to the firms. In addition, firms in the mining industry are more likely to have a higher level of CED relative to firms in the agricultural industry. These findings remained robust even after we corrected the standard errors.

1. Introduction

Behind the accelerating pace and success of the world economy, there is the unavoidable adverse effect of a decrease in environmental quality in line with the rapid growth of industry, carbon retention, and other greenhouse gases which gradually increase over time [1]. The Intergovernmental Panel on Climate Change (IPCC)—an institution formed as a result of collaboration between the United Nations and the World Meteorological Organization—is devoted to dealing with climate change problems. For the years 1906 to 2005, IPCC has gathered clear evidence that global temperatures have been increasing by an average of about 0.74 °C, with land temperatures higher than the oceans, and in the last 50 years, the average temperature has doubled compared to the last 100 years [2]. In 2005, Indonesia was the fourth largest contributor to the world’s per capita emissions after China, the USA, and the European Union [3]. According to the Ministry of Energy and Mineral Resources (2012), these emissions are mostly produced from mining and agricultural industry. The mining industry sector, such as oil, coal, and gas, uses 70% fossil energy from the total energy consumed. The mining industry is the biggest contributor to carbon emissions in developing countries, including Indonesia. Without exception, the agricultural industry also has contributed to the high carbon level growth of a 54% increase in total greenhouse gas (GHG) emissions since the year 2000.
To define the GHG emission totals, this study takes the definition from the World Bank website in the section of World Developments Indicators that expresses GHG totals in CO2 equivalent using the GWP100 metric of the Second Assessment Report of the IPCC. However, total greenhouse gas emissions in kt of CO2 equivalent are from the composition of CO2 totals obtained from biomass burning and all anthropogenic CH4 sources, N2O sources, and also F-gases (HFCs, PFCs, and SF6). This is leading to an increase in the Earth’s surface temperature, and to related effects on the climate and sea level.
Carbon dioxide (CO2) makes up the largest share of the greenhouse gases contributing to global warming and climate change. Emissions of CO2 come from burning oil, coal, and gas for energy use, burning wood and waste materials, and from industrial processes such as cement production. Data for carbon dioxide emissions include gases from fossil fuel combustion and cement manufacture, but exclude emissions from land use, such as deforestation. The burning of carbon-based fuels since the industrial revolution has rapidly increased concentrations of atmospheric carbon dioxide, increasing the rate of global warming and causing anthropogenic climate change. It is also a major source of ocean acidification, since it dissolves in water to form carbonic acid. This phenomenon leads to an increase in the Earth’s surface temperature and to related effects on the climate and rises in sea level [4].
Due to the damaging effect on the environment, people from diverse professions, such as scientists, politicians, and business leaders have become concerned about the worsening gradual condition of the Earth and effect of global warming. The Kyoto Protocol—an environmental agreement, agreed upon and signed by the world leaders in 1997 and also by many of the parties to the United Nations Framework Convention on Climate Change (UNFCCC)—is working towards curbing CO2 emissions globally.
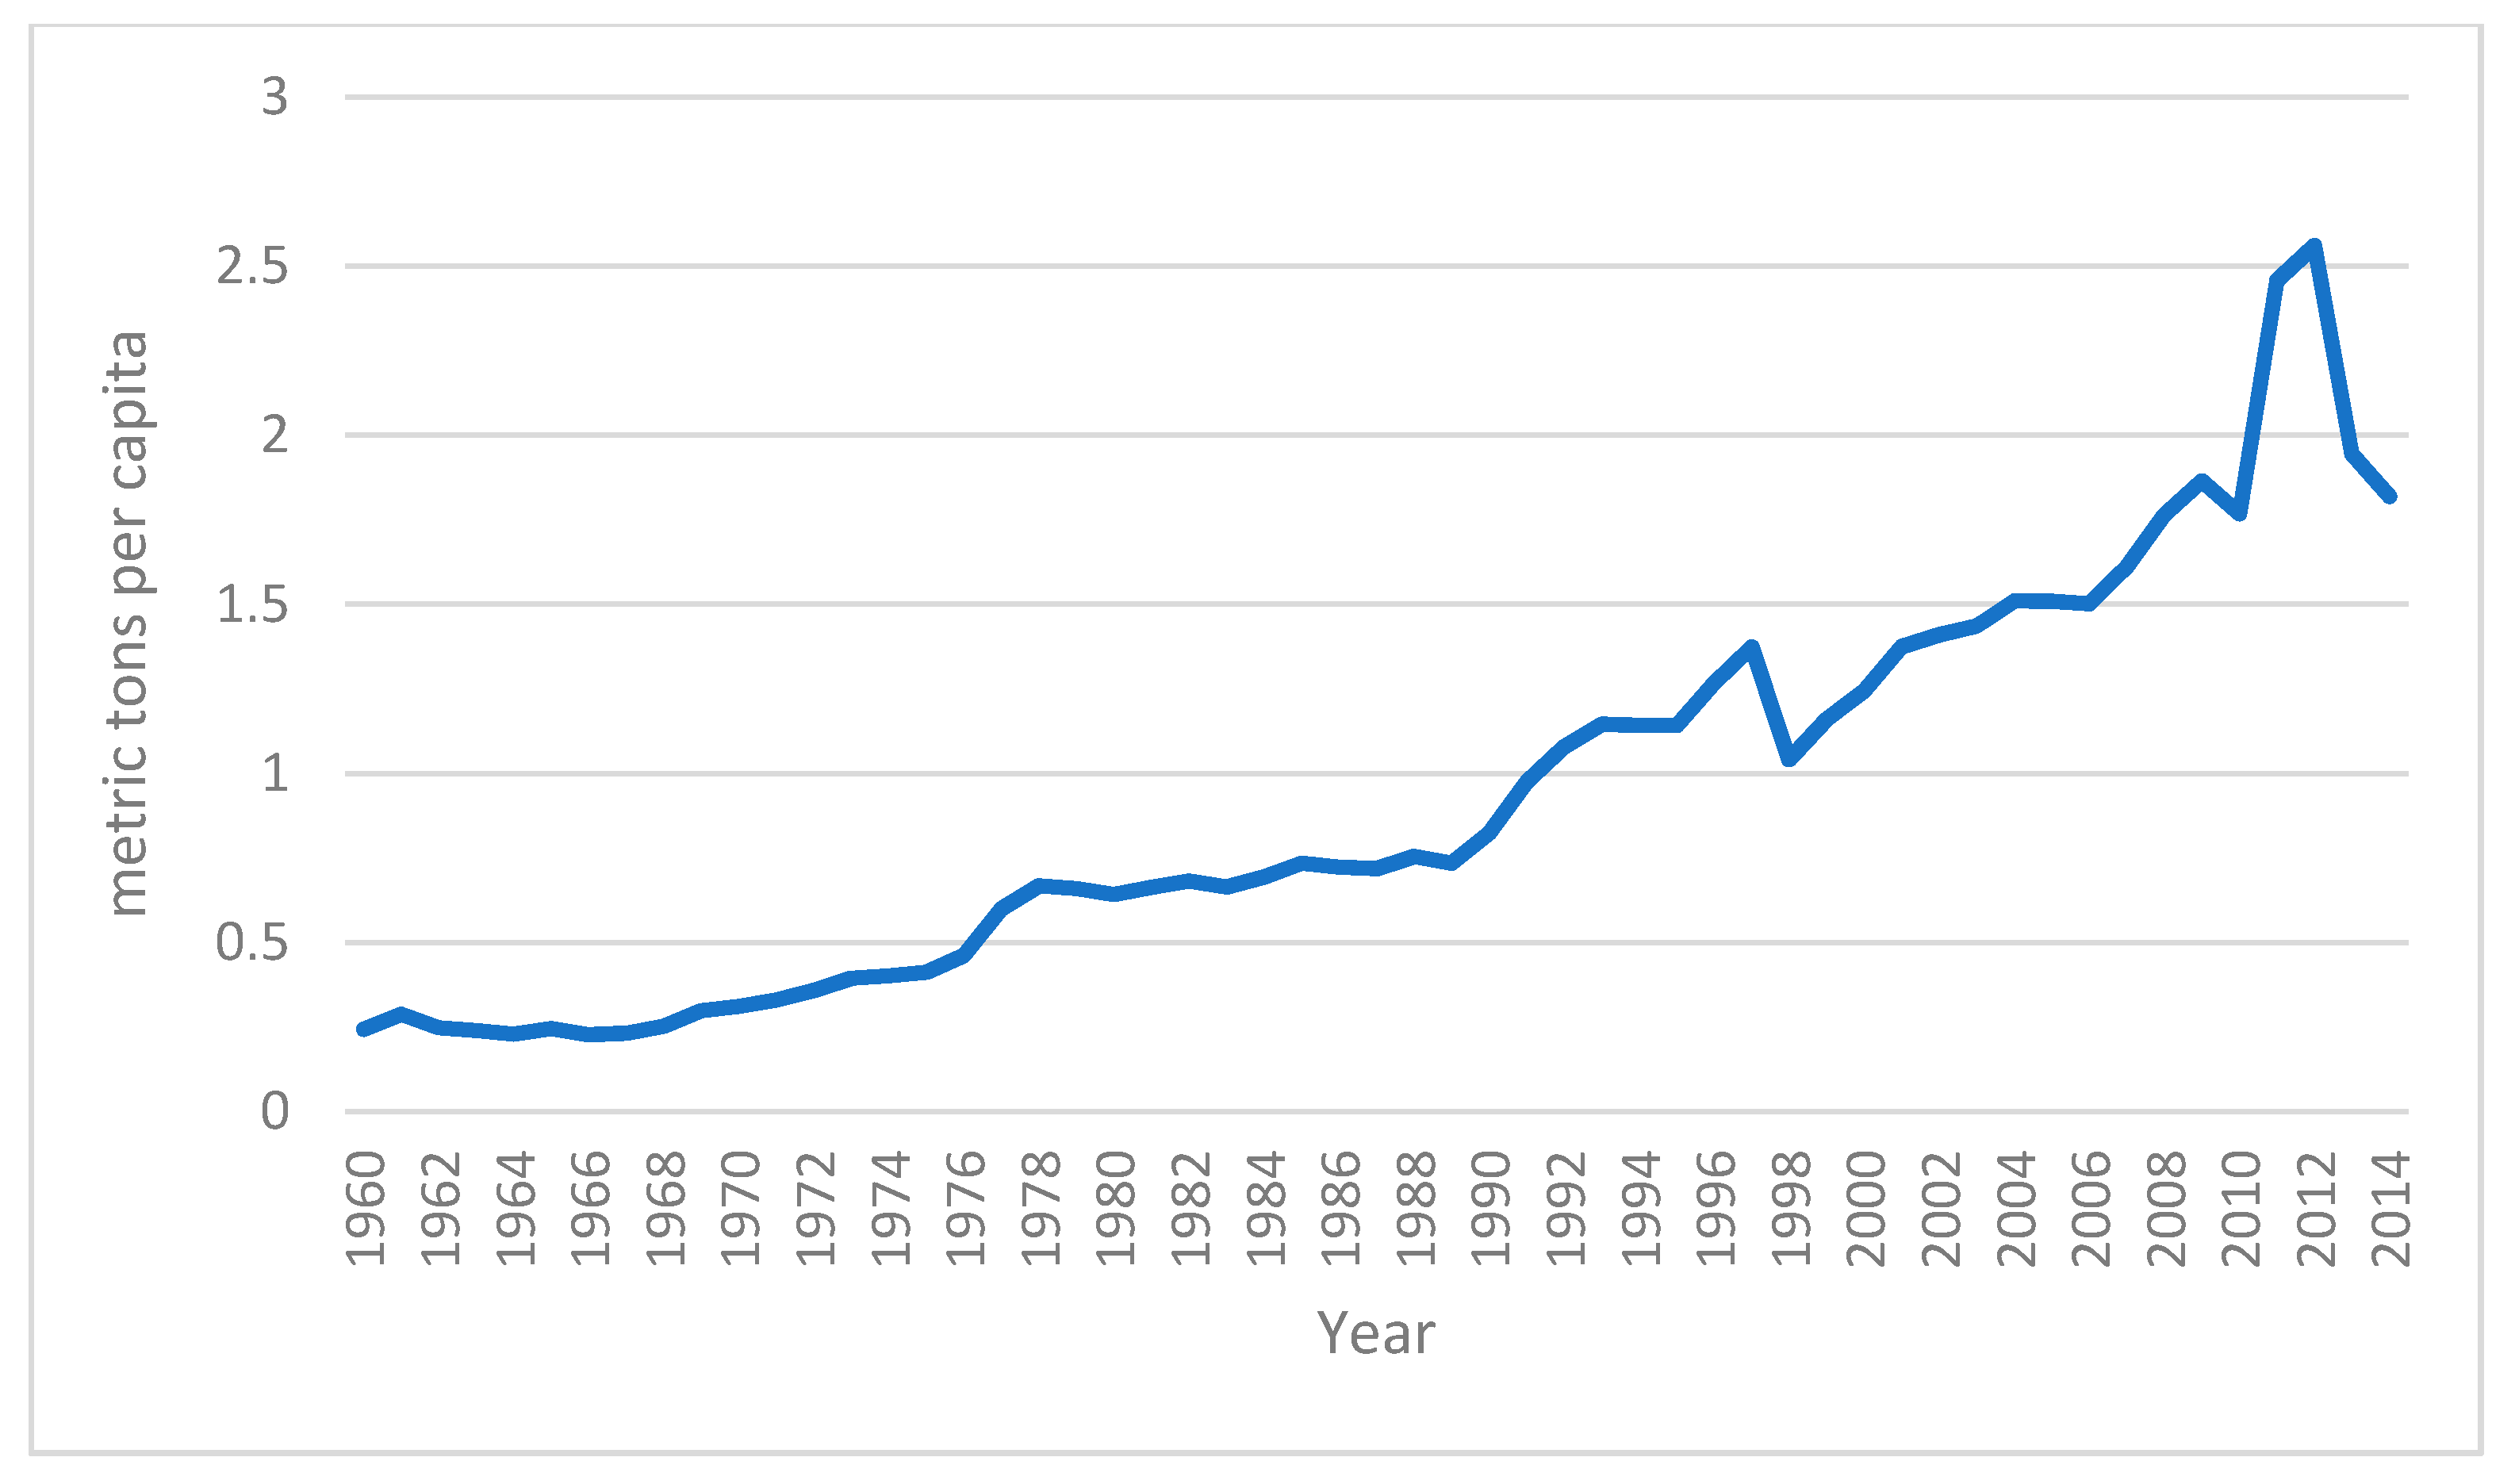
Figure 1 below is obtained from the World Development Indicators issued by the World Bank and shows the trend of Indonesia’s CO2 emissions (metric tons per capita), provided from the years 1960 until 2014. From 1970, CO2 emissions in Indonesia increased year by year. They reached a peak in the year 2012, but the trend has shown a decline since around 2013. The World Resources Institute (WRI) official website states that, in 2014, Indonesia’s rank as the world largest contributor country to carbon emissions has plunged to the 6th place after the United States, the European Union, China, India, and Russia, better than in 2005, when Indonesia ranked 4th as the largest contributor to the world’s per capita emissions after China, the USA, and the European Union.
The declining trend is probably caused by the government’s increasing urge to reduce carbon emissions by encouraging companies engaged in the industries with the highest contributions of carbon emissions to intensify their carbon emission management practices and disclose carbon emissions to the public. This urge is a form of realization for Indonesia as one of the countries that signed the Kyoto Protocol, and can be seen in the legislation that has been made, namely Law No. 17 in the year 2004 in which Indonesia ratified the Kyoto Protocol, which contained an agreement to reduce GHG (greenhouse gases) emission on a global scale. There are also other regulations that encourage GHG emission reduction, i.e., (1) Law No. 6, year 1994, wherein Indonesia ratified the convention on climate change; (2) Law No. 32, year 2009, concerning environmental protection and management; (3) Law No. 31, year 2009, concerning protection and management of the environment; (4) Presidential Regulation No. 61, year 2011, concerning the national action plan for the reduction of greenhouse gases, in which it was also stated that companies should participate in efforts to reduce GHGs; and (5) Presidential Regulation No. 71 year 2011 concerning the implementation of national greenhouse gas inventories.
Indonesia’s commitment was also shown by President Susilo Bambang Yudhoyono in his address to state leaders at the G-20 meeting in Pittsburgh, United States, 25 September 2009, in which he stated that Indonesia is voluntarily committed to reducing greenhouse gas (GHG) emissions by 26% by 2020 from Business as Usual (BAU) level by its own efforts, and reaching 41% if it gets international support [5,6,7]. This commitment was conveyed mainly because Indonesia was determined to implement sustainable development as stated in the national development plan. The 2010–2014 Medium Term Development Plan states that sustainable development is mainstreaming, which means that every sector must implement sustainable development into policies and programs. The President’s commitment then becomes an important source of momentum to emphasize sectoral targets and programs that contribute to reducing emissions. With the commitment to reducing GHG emissions, Indonesia hopes that its voluntary action will drive other countries, especially developing countries, to reduce global GHG emissions. As a result, firms in given industries that are conducive to generating CO2 emissions in their processes are now strongly encouraged to reduce and disclose carbon dioxide emissions to the public as part of the government’s sustainable development commitment.
Responding to this issue, this research paper will examine the factors that support the firms to disclose their carbon emissions. We used a sample of 305 firms listed on the Indonesian Stock Exchange (IDX) from the years 2011 to 2016. Those 305 firms were active in the sectors of Mining and Agricultural industry, both of which massively contribute to carbon emissions. This research is an extension of the research conducted by Gonzalez-Gonzalez and Zamora Ramirez (2016) entitled “Voluntary carbon disclosure by Spanish companies: an empirical analysis.” The difference between these studies has several points.
First, the research sample used in the Gonzalez-Gonzalez and Zamora Ramirez (2016) study was 48 companies in Spain registered in the FT500, DJSI, IBEX35 index [8], while this study specifically focuses on mining and agricultural companies, numbering 305 firms listed on the Indonesian Stock Exchange (IDX) from the years 2011 to 2016. We chose to focus on those industries as they are categorized as industry sectors in Indonesia that are sensitive to environmental issues, largely in carbon emissions.
Secondly, the research period used by Gonzalez-Gonzalez and Zamora Ramirez (2016) began in 2015 [8], whereas this research period runs from 2011 to 2016. The reason for the selection of the year period is that the latest regulation was made in 2011, namely, Presidential Regulation No. 71 year 2011, concerning the implementation of national greenhouse gas inventories. Additionally, as we can see in Figure 1, Indonesia reached a higher level of CO2 emissions in the year 2012, but then the trend starts to show a decline in the next year; however, the tail of the graph in 2014 seems to indicate that the decline will occur gradually in the following year. Hence, we added the next two years, as we believe that there will be a decline throughout 2016. Therefore, we presume the years 2011–2016 to be the impactful period of transition.
Third, the research conducted by Gonzalez-Gonzalez and Zamora Ramirez (2016) used variables of social pressure (firm size), market pressure (leverage), and pressure of the interests of shareholders (registered in the FT500, DJSI, IBEX35 index) [8]. Based on the background of the problem above, we are interested in conducting research that aims to determine the influence of the firm size, corporate governance structure, and industry characteristics on carbon emission disclosure in the mining and agricultural companies listed on the Indonesian Stock Exchange (IDX) for the period of 2011 to 2016.
The compelling issue that this study provides is the prediction about board independence in voluntary carbon emission disclosures. Prior studies have mainly expected that having an independent board would positively influence and encourage carbon emission disclosure to a higher level. This study adds new evidence to the literature, as we document that the influence of having a greater proportion of independence is not always significantly positive on voluntary disclosure. On the contrary, it can be significantly negative, depending on industry sector and the corporate governance behavior of that particular country. Therefore, our results can inform policymakers about the capture of the mining and agricultural industries in Indonesia in terms of complying with the government’s sustainable development policies and program to reduce and disclose carbon emissions.
The remainder of this study is structured as follows: Section 2 develops the research hypotheses; Section 3 describes the sample and variables, along with the methodology; Section 4 specifies the empirical models and presents the main results; Section 5 summarizes the study and presents concluding remarks.

2. Theoretical Background and Hypothesis Development

2.1. Theoretical Background

Stakeholders, particularly investors, should take a look at information on firms’ pollution performance (i.e., pollution reduction policies and strategies). It is expected that those investors are able to properly assess and review the operating and market performance of the pertinent firms. As a consequence, it is critical that firms are strongly suggested to disclose reliable and comprehensive pollution-related information, for instance, their pollution-related activities, pollution-related expenditures, strategies, and goals to reduce pollution, and future plans to deal with the problem. Some countries have established and developed mandatory pollution disclosure requirements in some form or another. However, most countries urge disclosure of pollution information voluntarily. It is propounded that voluntary pollution disclosure will convey good intentions in market economies. Furthermore, it will facilitate the investors’ reaching investment decisions. Additionally, company managers should be prompted to disclose pollution information on a voluntary basis to convey positive signals on the firm’s future performance. Additionally, the disclosure may show that the firms take their social and pollution responsibility seriously, as well generating a positive image among consumers [9].
Carbon emissions disclosure in Indonesia remains a voluntary disclosure. Nevertheless, companies that carry out carbon emissions disclosures have several considerations, including gaining conformity from stakeholders and contriving threats, particularly for those companies who produce greenhouse gases, such as increase in operating costs, decrease in demand, reputational risk, legal proceedings, fines, and penalties [10,11,12,13]. Therefore, the appropriate approach for those intentions is the stakeholder theory. Moreover, these firms are also seeking an equilibrium between economic, environmental, social, and legal requirements, as Indonesia’s government has set some regulations that raise the required commitment to reducing GHGs. This corresponds to the approach of boosted legitimacy; companies can become more legitimate as they gain more attention in terms of societal norms and social values by participating in the government appeals.

2.1.1. Stakeholder Theory

Stakeholder theory takes the perspective that a company is not an entity that is merely efficacious for its own interest; the company must also provide benefits to its stakeholders. The company will look for various ways that it can seek satisfaction for its stakeholders when contributing to economic resources that are important to the company, as the going concern of the company is dependent on the stakeholders. The disclosure of carbon emissions is a form of communication between the company and its stakeholders to garner support. With disclosure, the company is trying to show its social responsibility to the stakeholders [14].

2.1.2. Legitimacy Theory

In legitimacy theory, there is a relationship between the company and the community, which is regulated by the government. The important thing about legitimacy theory for organizations is the limitation of the norms and social values by the company desiring to convince groups of people that they are paying attention to the environment. This theory is able to explain the motivation behind environmental disclosures by an organization. Environmental disclosure is corporate social responsibility in an effort to obtain legitimacy from social community groups where the company is established, and an attempt to maximize the company’s financial assets in the long run. The legitimacy that the company wants from the community groups is that the company’s operating activities are seen to be in accordance with the community’s norms and values based on the applicable provisions [15]. Thus, the company can get more attention in terms of a society’s norms and social values, which is expected to make the company more legitimate.

2.2. Hypothesis Development

The first institutional environmental indicator that we examined was the firm size. Firm size is associated with the total assets of firms, which portray the firms’ resources. Firm size also moderates customer integration, business performance, and operational performance, which depicts the company’s capability [16]. Some studies have indicated that firm size also influences environmental disclosure level. Aguilar-Fernández and Otegi-Olaso (2018), who obtained a sample from the database of companies complying with the Global Reporting Initiative (GRI), found that firm size has positive value in sustainability inclusion. Greater sustainability value can be found in larger firms, and such firms tend to deliver more environmental metrics in their annual report [17]. The larger firms are more likely to be exposed to larger markets and the broad range of pressure by stakeholders that demands they gain more prestige in regard to contemporary social needs. These firms also have more resources and tend to invest more in different forms of environmental disclosure, such as socio-environmental accounting systems, fair trade certifications, and better working conditions, as well as to attract powerful environmental stakeholders [18,19,20,21,22,23,24].
On the contrary, small firms’ budgets are mostly insufficient to perform such environmental activities, as such, likely undermining their intention to provide environmental disclosure to the stakeholders. This is in line with the study done by Badulescu et al. (2018), who found that there is no significant influence on the socially responsible environmental actions on the firm size and even age of small and medium-size enterprises (SMEs) in developing countries [25]. SMEs have a particular tendency in terms of reduction of financial distress risk to engage in socially responsible actions [26]. Thus, we predict that the larger firms will have more chances and intention to conduct carbon emission disclosure at a much more appropriate level than small firms.
Hypothesis 1:
Larger firms will have a higher level of carbon emission disclosure.
The second institutional environmental indicator is corporate governance, which discusses the size and composition of the corporate board. The board size indicates the commitment of the corporate board to disclosing carbon emissions. Kassinis and Vafeas (2002) determined that firms that are susceptible to being prosecuted for environmental violations will benefit from having a larger board size [27]. Firms with a larger board will have the opportunity for recruit more skillful and knowledgeable directors, as they need more advice [28,29]. De Villiers et al. (2011) showed that environmental performance is higher in firms that have larger boards; meaning that there will be a larger representation of active CEOs and more legal experts on board [30]. These directors are capable of managing environmental issues better, as they will have a more extensive perspective of the long-term benefits that the company will gain from a transparent environmental disclosure. Larger boards are more likely to allocate critical financial resources to pursuing more environmental initiatives. The advantageousness of larger board size is also shown in Yanto et al. (2017) who found that carbon emission disclosure (CED) is positively influenced by board size. Board size is also an important determinant of PROPER rating—Corporate Performance Evaluation Program—a program that is effective in ameliorating companies’ transparency in managing carbon emissions [31]. As such, we propose the hypothesis that larger board size is much more likely to produce a greater level of carbon emission disclosure.
Hypothesis 2a:
Firms with a larger board size will have a higher level of carbon emission disclosure.
Simultaneously, vast prior studies have determined a positive relationship between board independence and levels of environmental disclosure, as the presence of independent board members in a corporate board can mitigate agency conflict and result in better monitoring, which leads to better management. Notwithstanding, the advantages of having an independent board can be also effectively gained if there is the participation of institutional investors in corporate ownership, as they can increase firm value and make monitoring activities more effective—improving corporate governance practices—and have a positive influence on voluntary disclosure [32,33,34,35,36]. Unfortunately, in Indonesia, the presence of institutional ownership is relatively weaker than in other countries, even though there is a higher level of ownership concentration [37]; thus, institutional ownership is unable to play an important role in improving corporate governance practice. This was shown by Baysinger and Butler (1985), who found that boards with a higher proportion of independent commissioners and directors may lead to excessive monitoring [38]. Goodstein et al. (1994) also found that having a greater proportion of independent board members can prevent the firm from engaging in strategic actions [39]. Eng and Mak (2003), whose research subject was firms listed on the Stock Exchange of Singapore (SES), sought to determine the impact of ownership structure and board composition on voluntary disclosure. They reported that aggregate voluntary disclosure and the proportion of independent board members are negatively associated. This is possibly because outside directors in Singapore are mostly elected by the blockholders to represent their interests and are able to acquire information directly, rather than through public disclosure. They found that independent directors in Singapore play a more substitutive role than a complementary role to voluntary disclosure [40].
Therefore, looking at Indonesia’s board conservatism behavior and supported by some contrasting research results, we foresee that firms in the mining and agricultural sectors in Indonesia who have greater representation of independent board members will be less likely to disclose their carbon emissions.
Hypothesis 2b:
Firms with a greater percentage of independent board members will have lower levels of carbon emission disclosure.
The third institutional environmental indicator in our research is the industry characteristic—specifically firms in the mining industry. This variable is considered as its number in our sample was double that of firms in the agricultural industry (see Table 1). When raising the issue of carbon emission disclosures, there will clearly therefore be an emphasis on firms in the mining industry. Mining industries such as oil, coal, and gas are the biggest contributors to carbon emissions in developing countries, especially in Indonesia, which was in 2005 ranked fourth and in 2014 ranked sixth in the world’s largest per capita contributors to emissions after China, the USA, and the European Union [3,41]. For this reason, firms in the mining industry are strongly suggested to implement carbon management practices, such as adopting clean technologies as an integral part of the process and disclosing their carbon emissions in an annual report [6,7,42,43]. This suggestion appeared as the Indonesian government signed various international environmental agreements in regard to the global warming effect. As a consequence, firms in the industries that are sensitive to environmental issues do not have any choice other than to try to comply with the voluntary carbon emission disclosure—this is also partly in response to greater scrutiny by powerful stakeholders who are aware of the environmental issues [23,44,45,46,47]. Bob Kamandanu, President Director of PT. Berau Coal, even admitted that all companies engaged in the mining sector wish to ensure they do not develop a bad reputation in society and among stakeholders [48]. Consistent with Brown (2011), there is great pressure to disclose carbon emissions to avoid negative perceptions by outside stakeholders [49]. Hence, we firmly believe that the mining industry will disclose its carbon emissions at a higher level.
Hypothesis 3:
Firms in the mining industry will have a higher level of carbon emission disclosure.

3. Data and Research Methodology

In this study, we used all firms from mining and agricultural industries that were listed on the Indonesia Stock Exchange (IDX) spanning the period 2011 to 2016 as our sample. We required no missing data for all variables used in this study. Our final sample consisted of 305 firm-year observations. Table 1 presents the distribution of samples by year for both the mining and agricultural industries. It shows that, for the period 2011 to 2016 in Indonesia, the number of firms operating in the mining industry was greater than the number of firms in the agricultural industry.
To test the hypotheses, we employed several univariate and multivariate analysis methods. We used descriptive statistics to present the basic information related to each variable in this study. For univariate analysis, we employed a correlation matrix (Pearson correlation) to examine the relationship between each variable. With regard to multivariate analysis, we used ordinary least squared (OLS) regression and applied correct standard error to deal with the heteroscedasticity issue. We employed three regression equations as follows:
To test the relationship between firm size and CED:
C E D t = α + β 1 F I R M S I Z E t + β 2 P R O F I T t + β 3 L E V E R A G E t + Y E A R   F I X E D   E F F E C T S          + ε
To test the relationship between corporate governance structure and CED:
C E D t = α + β 1 B O A R D S I Z E + β 2 % I N D C O M t + β 3 % I N D D I R t + β 4 F I R M S I Z E t           + β 5 P R O F I T t + β 6 L E V E R A G E t + Y E A R   F I X E D   E F F E C T S + ε
To test the relationship between industry and CED:
C E D t = α + β 1 M I N I N G t + β 2 B O A R D S I Z E + β 3 % I N D C O M t + β 4 % I N D D I R t         + β 5 F I R M S I Z E t + β 6 P R O F I T t + β 7 L E V E R A G E t         + Y E A R   F I X E D   E F F E C T S + ε
Our dependent variable was carbon emissions disclosure (CED). We hand-collected this data from the annual and sustainability reports. We followed Choi et al. (2013) in using a content analysis approach to construct this variable. Choi et al. (2013) developed some checklists given by the CDP (Carbon Disclosure Project) which were provided in the form of information request sheet. The information request sheet was used to determine how high or low the voluntary disclosures related to climate change and carbon emissions are carried out by the company were. There were five broad categories in determining the level of carbon emissions disclosure, namely: climate change (CC), greenhouse gas (GHG), energy consumption (EC), reduction and cost (RC), and accountability of cost and carbon emissions (ACC) [50]. Each category included several items. There were 18 total items. The checklists are available in Table A1.
We employed three interesting (independent) variables in this study. Our first interesting variable was firm size (FIRMSIZE). Firm size describes the number of assets owned by a company, which can be in the form of financial and non-financial assets. The independent variable in this study was the company size, which was calculated using natural logarithms (ln); because the total value of a company’s assets might have a value of millions or even billions of rupiahs, the total value requires simplification by converting it into logarithms.
The second independent variable was corporate governance structures. We addressed two issues on governance, firstly the size of the board of directors (BOARDSIZE), and second the level of independence (%INDDIR and %INDCOM). The BOARDSIZE is the total number of both directors and commissioners on the board. The %INDDIR is the number of independent directors divided by the total number of directors in the board. The %INDCOM is the number of independent commissioners divided by total number of commissioners on the board. In addition, we also constructed a dummy variable (MINING) to differentiate between firms in the mining and agricultural industry. MINING was defined 1 if the firm belonged to the mining industry, otherwise it was 0.
In addition, we controlled for leverage (LEVERAGE) and profitability (PROFIT) for the regression analysis. LEVERAGE is the ratio between total liabilities and total assets, which indicates the percentage of the creditors’ funds used to finance company assets [50]. Leverage is a measurement of financial ratios calculated as total debt divided by total assets. Leverage is represented by a percentage. PROFIT is information related to financial performance [50]. The greater the company’s profit, the stronger the company’s ability to generate earnings. Profitability can be measured by a variety of sizes, e.g., ROA, ROE, ROI, NPM (net profit margin). The pertinent formula in this study is measured using ROA.

4. Results and Analysis

Table 2 presents the descriptive statistics for all variables in this study. For CED, some firms did not disclose any information related to carbon emissions. The maximum score for disclosure was 17 out of 18 criteria. The maximum number of the board was 20 persons (directors and commissioners). The median of %INDCOM was 0.333, or, 33% of the commissioners were independent (median). The maximum value of %INDDIR was 0.667, or, the maximum percentage of independent commissioners was 67%. From this table, we can see that 70.2% of the observations were in the mining industry.
Table 3 presents the Pearson correlation matrix for all variables in this study. FIRMSIZE had a positive and significant correlation to the CED. In other words, larger firms will disclose more on carbon emissions. The coefficient of BOARDSIZE was 0.384 and significant at the 1% level. This indicates that firms with a larger number of people on their boards will have a higher level of carbon emissions disclosure (CED). Interestingly, both %INDDIR and %INDCOM had negative and positive correlations to CED. These indicate that a lower percentage of both independent directors and commissioners will have a higher level of carbon emissions disclosure. In addition, based on correlation matrix results, there were no significant correlations between MINING and CED. Table 4 displays the mean difference between firms in the mining and agricultural industries. The finding shows that there was no significant difference in CED between the firms in these groups. Moreover, firms in the agricultural industry tended to have a larger number of people on their boards and more profitability than firms from the mining industry.
Table 5 presents the results of the regression for firm size (FIRMSIZE), corporate governance (BOARDSIZE, %INDDIR, and %INDCOM), and industry (MINING) to carbon emissions disclosure (CED). We controlled for fraction of debt to equity (LEVERAGE), profitability (PROFIT), and year-fixed effects in all specifications in this table. In specifications 1 and 2, we examined the relationship between firm size and the level of carbon emission disclosure. Based on prior findings, we predicted that firms with higher sizes would have a positive association to carbon emissions disclosure. In the first specification, we tested the first hypothesis using ordinary least square (OLS) regression. We found that the coefficient of FIRMSIZE was 2.238 and significant to the 1% level (t = 9.38). This finding indicates that firms with higher size are more likely to have a higher level of carbon emissions disclosure. This finding was robust even after we corrected the standard error in specification 2.
In specifications 3 and 4, we tested whether corporate governance had a significant impact on CED. We employed two issues of governance, namely the size of the board and the percentage of independent directors (or commissioners), to better capture of the relationship between corporate governance structures and emission disclosure. To examine hypothesis 2a, we used the total number of directors and commissioners as a proxy for board size. We predicted that a larger board would lead companies to disclose more on carbon emissions. As shown in Table 5, specification 3, the coefficient of BOARDSIZE was 0.212 and was significant to the 10% level (t = 1.67). This shows that firms with larger board size are more likely to disclose more information related to carbon emissions.
In the second issue for governance, we examined whether the level of independence of the commissioners and directors affects the CED or not. We used the percentage of the number of independent commissioners and directors, scaled by the size of the boards. Interestingly, we found that the coefficients of %INDCOM and %INDDIR were −7.250 and −3.864, respectively. Both proxies were significant, to the 1 and 10% level, respectively. These results indicate that firms with a higher percentage of independent commissioners and directors are less likely to disclose information on carbon emissions. These findings imply that independent boards are more conservative when it comes to disclosing carbon-emission-related information to the stakeholders. Overall, those governance proxies increased the explanatory power of the research model by around 5% from the basic model. We found similar results (hypotheses 2a and 2b) even after we corrected the standard error (specification 4).
In addition, we examined whether the industry characteristic affected the firms’ disclosure of carbon emissions behavior. We added one dummy variable (MINING) to the model to capture whether firms in the mining industry have a different pattern of CED than firms in the agricultural industry. Since the mining industry has a higher scale and probability of producing carbon emissions, we predicted that firms in the mining industry would disclose more information on carbon emissions. In this study, we have not discussed whether disclosure is due to stakeholders’ pressure or voluntarily provided by the firms. We found that the coefficient of MINING was 2.370 and was significant to the 1% level (t = 3.53). This finding indicates that firms in the mining industry are likely to disclose more information related to carbon emissions. The finding was also robust after we corrected standard error. Overall, industry information increased the explanatory power by around 8% (R-squared from 26.2% to 34.2%) compared to the basic regression model (specification 1).

5. Conclusions and Suggestions

Indonesia’s 2010–2014 Medium Term Development Plan aims to achieve sustainable development for reducing carbon emissions, thus, every industry sector must implement sustainable development into their policies and programs, such as voluntary action to reduce global GHG emissions. Our contribution to the literature is that we have examined how the influence of firm size, corporate governance structure, and industry characteristics affect the level of voluntary carbon emission disclosure in response to Indonesia’s commitment to the program of emission reduction.
Based on the results and analysis in Section 4, we find that the relationship between disclosure of carbon emissions and firm size has a positive and significant effect on the carbon emissions disclosure. In accordance with the legitimacy theory, larger firms are very vulnerable to higher pressure from the community and stakeholders, so they have a greater tendency to perform a higher level of carbon emissions disclosure to make the firms seem more legitimate in accordance with norms and values, based on applicable provisions regulated by the government.
Furthermore, larger firms make it possible to establish a larger board size; as we discovered, a larger board size has a positive impact on carbon emission disclosure, which is executed at a higher level. A larger board size enables firms to have a broad commissioners and directors’ way of thinking, as they seek to attain transparency to their stakeholders. This finding is also in conformity with stakeholder theory, which says that the company will seek satisfaction for its stakeholders when it contributes to economic resources that are important to the company, as the going concern of the company is dependent on the stakeholders.
However, still adrift on the corporate governance structure, we got an interesting result that is in contrast to most prior studies. Interestingly, we found that corporate boards whose independent board percentage was greater are somehow less likely to disclose more information on carbon emissions. As the situation stands in Indonesia, independent boards are more conservative on disclosing carbon-emission-related information to their stakeholders, and there is a lack of institutional ownership in Indonesia to improve corporate governance practices. Lastly, we found that that firms in the mining industry are more likely to disclose more information related to carbon emissions. We acknowledge that carbon emissions disclosures in this study are based on the authors’ own observations, and it is not yet known whether there really is a reduction of carbon in the companies’ activities. Examining the actual carbon emission reduction of the firms will extend the knowledge of the existing literature.

Author Contributions

Conceptualization, M.N., I.H. and A.H.; Data curation, A.H.; Formal analysis, Y.I.P. and A.H.; Methodology, I.H.; Software, I.H.; Supervision, M.N. and I.H.; Validation, M.N. and I.H.; Visualization, Y.I.P.; Writing—original draft, A.H.; Writing—review & editing, Y.I.P. All authors have read and approved the final manuscript.

Funding

This research receives partial funding from the World Class Tahir Professorship.

Conflicts of Interest

The authors declare that there is no conflict of interest.

Appendix A

Table A1. Checklist carbon emission disclosure information.
CategoryItemsNotes
1. Climate Change (CC): Risks and Opportunities CC1Assessment/Description of risks (regulations, both special and general) relating to climate change and actions seized or to be seized as a risk management step.
CC2Assessment/Description of financial, business, and opportunities implications for climate change both now and in the future.
2. Greenhouse Gases (GHG): Accounting for Greenhouse Gas Emissions GHG1Describe the methods utilized in calculating greenhouse gas (GHG) emissions.
GHG2Continuity of external verification of the quantity of greenhouse gas (GHG) emissions.
GHG3Total greenhouse gas emissions—metric tons of CO2—that are produced.
GHG4Disclosure of scope 1, 2 and 3 directly on greenhouse gas emissions.
GHG5Disclosure of the greenhouse gas emissions that come from resources (e.g., electricity, coal).
GHG6Disclosure of greenhouse gas emissions that come from the facilities or segment level.
GHG7Comparison of greenhouse gas emissions with the prior year.
3. Energy Consumption (EC) EC1Total energy devoured.
EC2The quantity of energy used that comes from renewable resources.
EC3Disclosures based on type, facility, or segment.
4. Reduction and Cost (RC)RC1Explain the planning or strategies in reducing greenhouse gas emissions.
RC2Specifications of the level of reduction of greenhouse gas emissions and the targets per year.
RC3Emission reductions and costs are borne or to be provided.
RC4Costs of future emissions included in capital planning.
5. Accountability of Cost and Carbon Emission (ACC)ACC1Indications where the board of the committee or executive body has responsibility for activities concomitant to climate change.
ACC2Describe the mechanism made by the board or other executive bodies by reviewing the sustainability of the company concerning climate change.

References

  1. Martinez, L.H. Post industrial revolution human activity and climate change: Why the United States must implement mandatory limits on industrial greenhouse gas emmissions. J. Land Use Environ. Law 2005, 403–421. [Google Scholar]
  2. IPCC—Intergovernmental Panel on Climate Change. Climate Change 2007: Synthesis Report. 2007. Available online: http://www.ipcc.ch/pdf/assessmentreport/ar4/wg2/ar4_wg2_full_report.pdf (accessed on 2 April 2019).
  3. Freedman, M.; Jaggi, B. Global Warming Disclosures: Impact of Kyoto Protocol across Countries. J. Int. Financ. Manag. Account. 2011, 22, 46–90. [Google Scholar] [CrossRef]
  4. World Development Indicators. Indonesia’s CO2 Emissions (Metric Tons per Capita). Available online: https://data.worldbank.org/indicator/EN.ATM.CO2E.PC?end=2014&locations=ID&start=1960&vie=chart (accessed on 3 April 2019).
  5. Ministry of Energy and Mineral Resources. Transport Sector, Assessment of Greenhouse Emissions; Ministry of Energy and Mineral Resources: Jakarta, Indonesia, 2012. (In Indonesia)
  6. National Development Planning Agency. One Year Report on the Implementation of National Action Plan for Greenhouse Gases and Regional Action Plan for Greenhouse Gases; BAPPENAS: Jakarta, Indonesia, 2012. Available online: http://ranradgrk.bappenas.go.id/rangrk/admincms/downloads/publications/Laporan_Satu_Tahun_Pelaksanaan_RAN-GRK_RAD-GRK.pdf (accessed on 3 April 2019). (In Indonesia)
  7. PEACE. Indonesia and Climate Change: Current Status and Policy. 2007. Available online: http://siteresources.worldbank.org/INTINDONESIAINBAHASA/Resources/Environment/ClimateChange_Full_BH.pdf (accessed on 3 April 2019). (In Indonesia).
  8. Gonzalez-Gonzalez, J.M.; Zamora Ramírez, C. Voluntary carbon disclosure by Spanish companies: An empirical analysis. Int. J. Clim. Chang. Strateg. Manag. 2016, 8, 57–79. [Google Scholar] [CrossRef]
  9. Jaggi, B.; Freedman, M.; Martin, C. Global warming, Kyoto Protocol, and the need for corporate pollution disclosures in India: A case study. Int. J. Bus. Hum. Technol. 2011, 1, 60–67. [Google Scholar]
  10. Berthelot, S.; Robert, A.-M. Climate Change Disclosures: An Examination of Canadian Oil and Gas Firms. Issues Soc. Environ. Account. 2011, 5, 106–123. [Google Scholar] [CrossRef] [Green Version]
  11. Brammer, S.; Pavelin, S. Voluntary Environmental Disclosures by Large UK Companies. J. Bus. Financ. Account. 2006, 33, 1168–1188. [Google Scholar] [CrossRef]
  12. Luo, L.; Lan, Y.-C.; Tang, Q. Corporate Incentives to Disclose Carbon Information: Evidence from the CDP Global 500 Report. J. Int. Financ. Manag. Account. 2012, 23, 93–120. [Google Scholar] [CrossRef]
  13. Prado-Lorenzo, J.; Rodríguez-Domínguez, L.; Gallego-Álvarez, I.; García-Sánchez, I. Factors influencing the disclosure of greenhouse gas emissions in companies world-wide. Manag. Decis. 2009, 47, 1133–1157. [Google Scholar] [CrossRef]
  14. Lu, Y.; Abeysekera, I.; Cortese, C. Corporate social responsibility reporting quality, board characteristics and corporate social reputation. Pac. Account. Rev. 2015, 27, 95–118. [Google Scholar] [CrossRef]
  15. Deegan, C. Organizational legitimacy as a motive for sustainability reporting. Sustain. Account. Account. 2007, 127–149. [Google Scholar] [CrossRef]
  16. Hermawan, A.; Aisyah, I.S.; Gunardi, A.; Putri, W.Y. Going green: Determinants of carbon emission disclosure in manufacturing companies in Indonesia. Int. J. Energy Econ. Policy 2018, 8, 55–61. [Google Scholar]
  17. Aguilar-Fernández, M.; Otegi-Olaso, J. Firm Size and the Business Model for Sustainable Innovation. Sustainability 2018, 10, 4785. [Google Scholar] [CrossRef]
  18. Al-Tuwaijri, S.A.; Christensen, T.E.; Hughes, K. The relations among environmental disclosure, environmental performance, and economic performance: A simultaneous equations approach. Account. Organ. Soc. 2004, 29, 447–471. [Google Scholar] [CrossRef]
  19. Clarkson, P.M.; Li, Y.; Richardson, G.D.; Vasvari, F.P. Revisiting the relation between environmental performance and environmental disclosure: An empirical analysis. Account. Organ. Soc. 2008, 33, 303–327. [Google Scholar] [CrossRef]
  20. De Villiers, C.; van Staden, C.J. Where firms choose to disclose voluntary environmental information. J. Account. Public Policy 2011, 30, 504–525. [Google Scholar] [CrossRef]
  21. Hackston, D.; Milne, M.J. Some determinants of social and environmental disclosures in New Zealand companies. Account. Audit. Account. 1996, 9, 77–108. [Google Scholar] [CrossRef]
  22. Patten, D.M. Intra-industry environmental disclosures in response to the Alaskan oil spill: A note on legitimacy theory. Account. Organ. Soc. 1992, 17, 471–475. [Google Scholar] [CrossRef]
  23. Patten, D.M. The relation between environmental performance and environmental disclosure: A research note. Account. Organ. Soc. 2002, 27, 763–773. [Google Scholar] [CrossRef]
  24. Arvidsson, S. Communication of Corporate Social Responsibility: A Study of the Views of Management Teams in Large Companies. J. Bus. Eth. 2010, 96, 339–354. [Google Scholar] [CrossRef]
  25. Badulescu, A.; Badulescu, D.; Saveanu, T.; Hatos, R. The Relationship between Firm Size and Age, and Its Social Responsibility Actions—Focus on a Developing Country (Romania). Sustainability 2018, 10, 805. [Google Scholar] [CrossRef]
  26. Gangi, F.; Meles, A.; Monferrà, S.; Mustilli, M. Does Corporate Social Responsibility Help the Survivorship of SMEs and Large Firms? Glob. Financ. J. 2018, in press. Available online: https://0-www-sciencedirect-com.brum.beds.ac.uk/science/article/pii/S1044028317304106 (accessed on 3 April 2019).
  27. Kassinis, G.; Vafeas, N. Corporate boards and outside stakeholders as determinants of environmental litigation. Strateg. Manag. J. 2002, 23, 399–415. [Google Scholar] [CrossRef] [Green Version]
  28. Coles, J.; Daniel, N.; Naveen, L. Boards: Does one size fit all? J. Financ. Econ. 2008, 87, 329–356. [Google Scholar] [CrossRef]
  29. Dalton, D.R.; Daily, C.M. What’s wrong with having friends on the board? Across Board 1999, 36, 28–32. [Google Scholar]
  30. De Villiers, C.; Naiker, V.; van Staden, C.J. The Effect of Board Characteristics on Firm Environmental Performance. J. Manag. 2011, 37, 1636–1663. [Google Scholar] [CrossRef]
  31. Yanto, H.; Hasan, I.; Fam, S.F.; Raeni, R. Strengthening PROPER Implementation to Improve Transparency in Managing Carbon Emission among Indonesian Manufacturing Companies. Int. J. Bus. Manag. Sci. 2017, 7, 219–236. [Google Scholar]
  32. Ajinkya, B.; Bhojraj, S.; Sengupta, P. The Association between Outside Directors, Institutional Investors and the Properties of Management Earnings Forecasts. J. Account. Res. 2005, 43, 343–376. [Google Scholar] [CrossRef]
  33. Bushee, B.J.; Noe, C.F. Corporate Disclosure Practices, Institutional Investors, and Stock Return Volatility. J. Account. Res. 2000, 38, 171. [Google Scholar] [CrossRef] [Green Version]
  34. Chung, K.H.; Zhang, H. Corporate Governance and Institutional Ownership. J. Financ. Quant. Anal. 2011, 46, 247–273. [Google Scholar] [CrossRef]
  35. Gillan, S.L.; Starks, L.T. Corporate Governance, Corporate Ownership, and the Role of Institutional Investors: A Global Perspective. J. Appl. Financ. 2003, 13, 4–22. [Google Scholar] [CrossRef]
  36. Karamanou, I.; Vafeas, N. The Association between Corporate Boards, Audit Committees, and Management Earnings Forecasts: An Empirical Analysis. J. Account. Res. 2005, 43, 453–486. [Google Scholar] [CrossRef]
  37. Darmadi, S.; Sodikin, A. Information disclosure by family-controlled firms. Asian Rev. Account. 2013, 21, 223–240. [Google Scholar] [CrossRef]
  38. Baysinger, B.D.; Butler, H.N. Corporate Governance and the Board of Directors: Performance Effects of Changes in Board Composition. J. Law Econ. Organ. 1985, 1, 101–124. [Google Scholar] [CrossRef]
  39. Goodstein, J.; Gautam, K.; Boeker, W. The effects of board size and diversity on strategic change. Strateg. Manag. J. 1994, 15, 241–250. [Google Scholar] [CrossRef]
  40. Eng, L.L.; Mak, Y.T. Corporate governance and voluntary disclosure. J. Account. Public Policy 2003, 22, 325–345. [Google Scholar] [CrossRef]
  41. WRI Indonesia. Making Big Ideas Happen; World Resources Institute: Jakarta, Indonesia, 2018; Available online: http://www.wri-indonesia.org/ (accessed on 3 April 2019).
  42. Herold, D.M.; Lee, K.-H. The influence of internal and external pressures on carbon management practices and disclosure strategies. Aust. J. Environ. Manag. 2018, 26, 63–81. [Google Scholar] [CrossRef]
  43. Herold, D.M.; Farr-Wharton, B.; Lee, K.-H.; Groschopf, W. The interaction between institutional and stakeholder pressures: Advancing a framework for categorising carbon disclosure strategies. Bus. Strat. Dev. 2018. [Google Scholar] [CrossRef]
  44. Adams, C.A.; Hill, W.-Y.; Roberts, C.B. Corporate Social Reporting Practices in Western Europe: Legitimating Corporate Behavior? Br. Account. Rev. 1998, 30, 1–21. [Google Scholar] [CrossRef]
  45. Deegan, C.; Gordon, B. A Study of the Environmental Disclosure Practices of Australian Corporations. Account. Bus. Res. 1996, 26, 187–199. [Google Scholar] [CrossRef]
  46. Halme, M.; Huse, M. The influence of corporate governance, industry and country factors on environmental reporting. Scand. J. Manag. 1997, 13, 137–157. [Google Scholar] [CrossRef]
  47. Yu, G.; Kwon, K.-M.; Lee, J.; Jung, H. Exploration and Exploitation as Antecedents of Environmental Performance: The Moderating Effect of Technological Dynamism and Firm Size. Sustainability 2016, 8, 200. [Google Scholar] [CrossRef]
  48. Oxford Business Group. The Report: Indonesia 2008; Oxford Business Group: Oxford, UK, 2008; Available online: https://books.google.co.id/books?id=uW2XV5i1OvYC&printsec=frontcover&hl=id#v=onepage&q&f=false (accessed on 3 April 2019).
  49. Brown, J.L. The Spread of Aggressive Corporate Tax Reporting: A Detailed Examination of the Corporate-Owned Life Insurance Shelter. Account. Rev. 2011, 86, 23–57. [Google Scholar] [CrossRef] [Green Version]
  50. Choi, B.B.; Lee, D.; Psaros, J. An analysis of Australian company carbon emission disclosures. Pac. Account. Rev. 2013, 25, 58–79. [Google Scholar] [CrossRef]
Figure 1. Indonesia’s CO2 emissions (metric tons per capita). Source: World Development Indicators—data.worldbank.org.
Sustainability 11 02483 g001
Table 1. Firm distribution (N = 305).
YearTotalMiningAgricultural
N#%#%
2011443375%1125%
2012513670.59%1529.41%
2013523669.23%1630.77%
2014533667.92%1732.08%
2015523669.23%1630.77%
2016533769.81%1630.19%
Total30521470.16%9129.84%
Table 2. Descriptive statistics of research variables (N = 305).
VariablesMeanMinimumP25P50P75Maximum
CED3.0890.0000.0000.0000.00017.000
BOARDSIZE9.6104.0007.00010.00012.00020.000
%INDCOM0.3740.0000.3330.3330.5000.667
%INDDIR0.0980.0000.0000.0000.2000.667
MINING0.7020.0000.0001.0001.0001.000
FIRMSIZE22.20415.99321.29522.23023.39625.196
PROFIT2.384−70.470−1.4202.5608.21045.730
LEVERAGE0.4920.0060.3130.4710.6462.998
Table 3. Pearson’s test correlation of research variables (N = 305).
Variables[1][2][3][4][5][6][7]
[1] CED1.000
[2] BOARDSIZE0.384 ***1.000
(0.000)
[3] %INDCOM−0.185 ***−0.0851.000
(0.001)(0.140)
[4] %INDDIR−0.196 ***−0.218 ***0.219 ***1.000
(0.001)(0.000)(0.000)
[5] MINING0.076−0.178 ***−0.0230.0041.000
(0.185)(0.002)(0.693)(0.944)
[6] FIRMSIZE0.472 ***0.564 ***0.015−0.105 *−0.160 ***1.000
(0.000)(0.000)(0.798)(0.066)(0.005)
[7] PROFIT0.137 **0.174 ***−0.069−0.105 *−0.0540.104 *1.000
(0.017)(0.002)(0.228)(0.067)(0.347)(0.069)
[8] LEVERAGE−0.0260.0400.0230.0340.0520.108 *−0.357 ***
(0.645)(0.483)(0.684)(0.558)(0.370)(0.061)(0.000)
Significance level * 10% ** 5% *** 1%.
Table 4. Firms’ characteristics between mining and agricultural firms (N = 305).
VariablesMining FirmsAgricultural FirmsCoef.t-Value
CED3.3972.3631.0351.328
BOARDSIZE9.27110.407−1.136 ***−3.140
PINDCOM0.3720.379−0.007−0.395
PINDDIR0.0980.0970.0010.071
FIRMSIZE22.05022.568−0.518 ***−2.815
PROFITABILITY1.9633.376−1.413−0.942
LEVERAGE0.5020.4690.0320.898
Significance level: 10%; * 5%; *** 1%.
Table 5. Results of regression of firm size, corporate governance, and industry on carbon emissions disclosure.
VariablesPredictedCarbon Emissions Disclosure (CED)
Sign(1)(2)(3)(4)(5)(6)
MINING+ 2.370 ***2.384 ***
(3.53)(3.53)
BOARDSIZE+ 0.212 *0.223 *0.261 **0.273 **
(1.67)(1.76)(2.09)(2.19)
%INDCOM −7.250 ***−7.690 ***−7.001 ***−7.444 ***
(−3.18)(−3.35)(−3.26)(−3.42)
%INDDIR −3.864 *−5.052 **−3.568 *−4.819 **
(−1.94)(−2.30)(−1.78)(−2.20)
FIRMSIZE+2.238 ***2.244 ***1.954 ***1.879 ***2.031 ***1.953 ***
(9.38)(9.47)(7.45)(7.07)(7.97)(7.51)
PROFIT+0.0250.0200.0080.0160.0080.016
(1.04)(0.85)(0.32)(0.63)(0.32)(0.65)
LEVERAGE−3.709 ***−3.875 ***−3.369 **−3.176 **−3.709 ***−3.505 ***
(−2.67)(−2.98)(−2.52)(−2.39)(−2.76)(−2.61)
CONSTANT −44.914 ***−44.900 ***−37.659 ***−36.342 ***−41.474 ***−40.164 ***
(−9.08)(−9.00)(−7.61)(−7.23)(−8.48)(−8.04)
Year-dummies IncludedIncludedIncludedIncludedIncludedIncluded
Robust SE NoYesNoYesNoYes
r2 0.2600.2620.3060.3120.3350.342
N 315315305305305305
t statistics in parentheses. * p < 0.1, ** p < 0.05, *** p < 0.01

