Study on Structural Characteristics of China’s Passenger Airline Network Based on Network Motifs Analysis


1
School of Geographical Sciences, Northeast Normal University, Changchun, Jilin 130024, China
2
College of Jang Ho Architecture, Northeastern University, Shenyang, Liaoning 110169, China
3
Department of Geography and Geosciences, University of Louisville, Louisville, KY 40292, USA
4
Department of Geography and Geoinformation Science, University of Illinois Urbana-Champaign, IL 61801, USA
*
Author to whom correspondence should be addressed.
Sustainability 2019, 11(9), 2484; https://0-doi-org.brum.beds.ac.uk/10.3390/su11092484
Submission received: 24 March 2019
/
Revised: 24 April 2019
/
Accepted: 24 April 2019
/
Published: 28 April 2019
(This article belongs to the Special Issue Toward Sustainability: Transport Geography and Mobility)
Abstract
:The air passenger transport network system is an important agent of social and economic connections between cities. Studying on the airline network structure and providing optimization strategies can improve the airline industry sustainability evolution. As basic building blocks of broad networks, the concept of network motifs is cited in this paper to apply to the structural characteristic analysis of the passenger airline network. The ENUMERATE SUBGRAPHS (G, k) algorithm is used to identify the motifs and anti-motifs of the passenger airline network in China. A total of 37 airline companies are subjected to motif identification and exploring the structural and functional characteristics of the airline networks corresponding to different motifs. These 37 airline companies are classified according to the motif concentration curves into three development stages, which include mono-centric divergence companies at the low-level development stage, transitional companies at the intermediate development stage, and multi-centric and hierarchical companies at the advanced development stage. Finally, we found that adjusting the number of proper network motifs is useful to optimize the overall structure of airline networks, which is profitable for air transport sustainable development.
1. Introduction
Passenger aviation plays a unique role in the global transportation system, facilitating the high-speed carriage of people over long distances. Efficient passenger airline networks are crucial for long-term air transport sustainable development. Based on the complex network theory, the air transportation system can be viewed as a spatial network where the nodes are airports and the edges are air routes or flights. In this theoretical framework, many studies on airline network were carried out using complex network models or methods and many valuable findings were revealed. A number of these studies focused on the overall structure of the airline network, like the small-world [1], the scale-free distribution [2], community structures [3], or hub-and-spoke organizational patterns [4]. Thus, this kind of study can be categorized as a structure-oriented perspective [5]. In other studies, scholars mainly raised questions from the perspective of nodes and their relationships, like the investigation of centrality measures [6], clustering [7], or assortativity [8], etc. This group of studies can be categorized as a node-oriented perspective. In spite of the many research findings from existing studies, more research on the air transport network form new perspectives are still needed. In this context, we try to apply a combined “structure-node” concept, namely network motifs, to analyze the microcosmic organization of the airline network, hoping to make some novel discoveries and provide new insights in understanding the air transportation system.
The concept of a network motif was proposed by Shen-Orr et al. in their study on the transcriptional regulation network of Escherichia coli [9]. Network motifs are basic building blocks in networks. They are defined as the interconnection mode that has recurrence frequencies in the real network much higher than those in a randomized network. Shen-Orr et al. found that each network motif had a specific function in determining gene expression and motif structure can illustrate the entire transcriptional network of the organism. Furthermore, their team member Milo et al. found that network motifs ubiquitously exist in universal classes of the network such as biochemical, neurobiological, ecological, and engineering networks [10]. To be a high-order network connection mode, network motifs are crucial for understanding the basic structures that control and modulate many complex system behaviors [11]. Later, the network motif was widely applied to network function studies in different disciplines. For example, Reigl et al. found that there were some over-presented motifs that may perform stereotypical functions in the C. elegans nervous system [12]. Sporns and Kötter identified the characteristic network building blocks that are the structural and functional brain network motifs in neuroanatomical data [13]. Itzkovitz and Alon studied the network motifs that arise solely from geometric constraints [14]. Valverde and Solé analyzed a large set of software class diagrams to learn about the condition of network motifs in computational graphs [15]. Ohnishi et al. specified the network motifs of the inter-firm network to clarify production mechanisms and economic functions [16]. City network consists of the flows of population, commodities, information, and capital, and city network studies always embody transportation [17], economy [18,19] and the society [20], among which air transportation network is a common and important research focus. Research on the structure of air passenger transport network is helpful in understanding, and more importantly, optimizing the structures of the urban system and inter-city transportation system, as well as their sustainable development.
The ENUMERATE SUBGRAPHS (G, k) (ESU) algorithm, a widely used method, was employed to identify the three-node and four-node motifs and anti-motifs of the passenger airline network in China including 37 Chinese airline companies. In addition to the topological characteristic, function, classification, concentration, and combination of motifs, the network organization mode and developing stages of the passenger airline networks were analyzed based on motifs and other ancillary information. Finally, a motif-based optimizing strategy was proposed.
2. Data and methods
2.1. Data
Open big data have been used broadly in transport network analysis [21]. The data of China’s passenger airline network were compiled from the Ctrip.com, which is one of the largest travel websites in China [22,23,24]. The study area is limited to the mainland of China excluding Hong Kong, Macao, and Taiwan. All routes data we considered are from the scheduled domestic timetable for one week from July 2, 2015, to July 8, 2015. We used python to crawl the flight information including departure airport, arrival airport, departure city, arrival city and airline company from https://flights.ctrip.com/. In 2015, there were 37 airline companies in China. As there is only a few flights follow a “circle” pattern [3] and the purpose of this paper is analyzing the topological structure of the Chinese passenger airline network, the network was treated as unweighted and undirected.
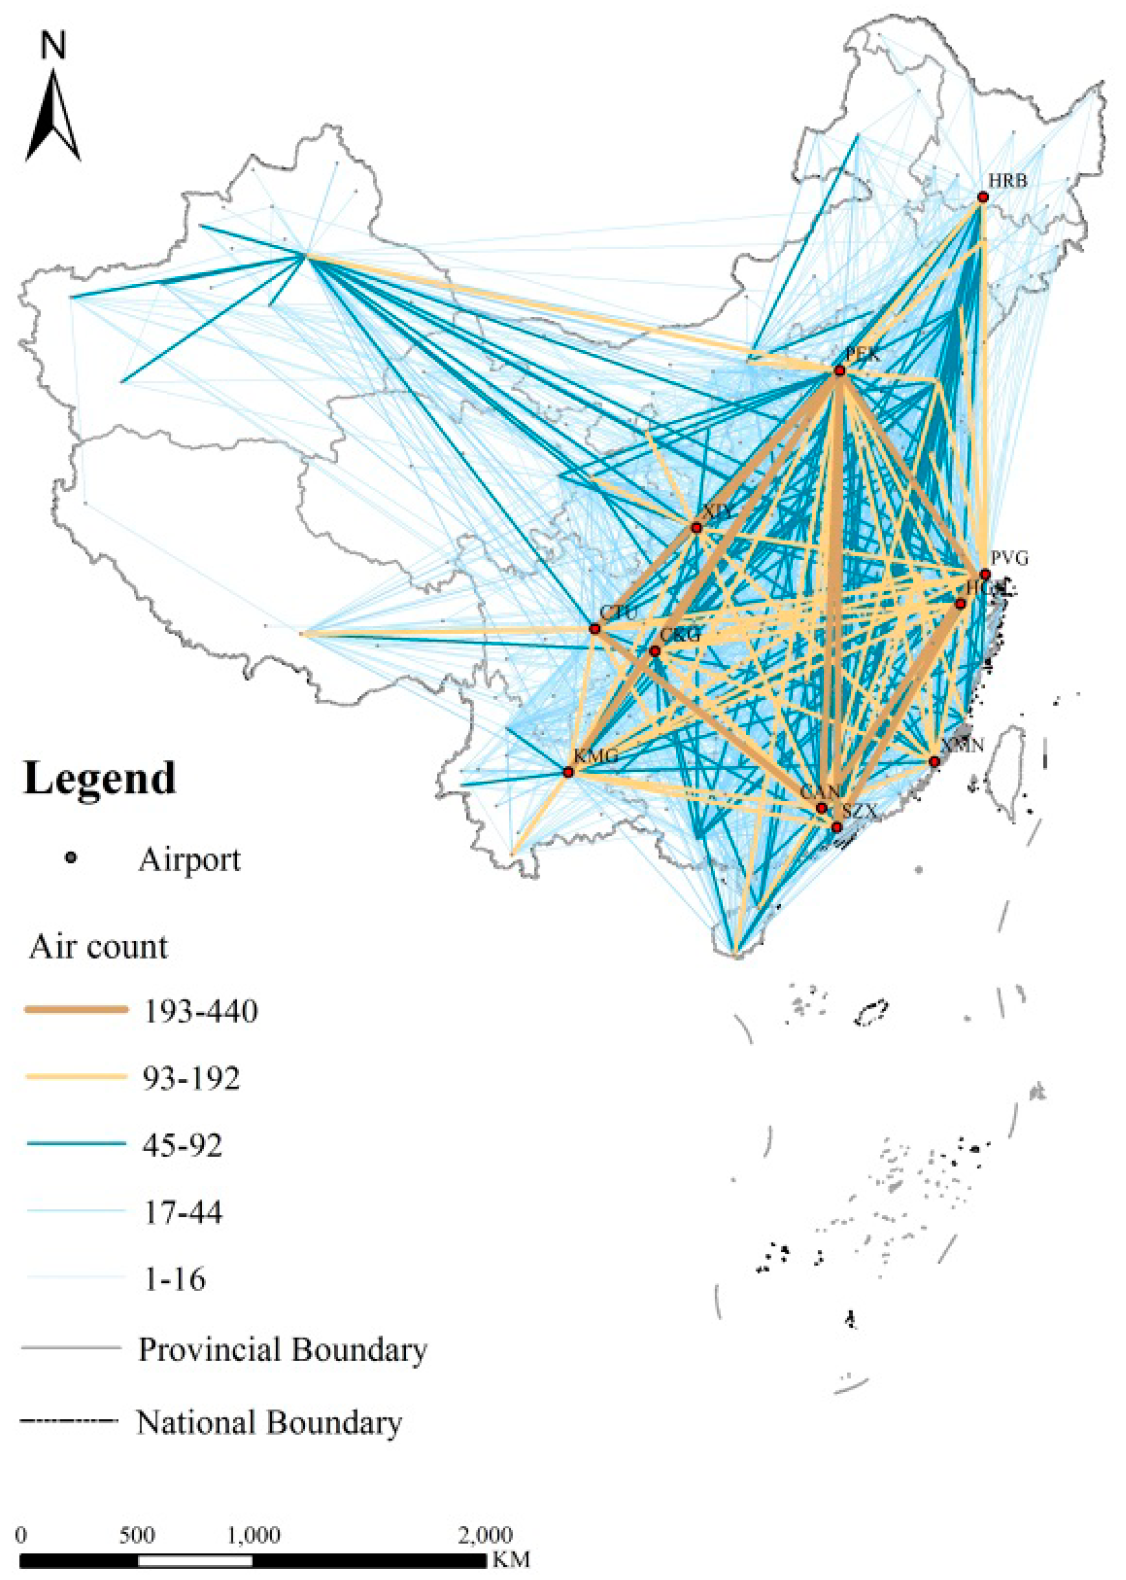
The nodes in the network represent airports, and links were created if any two airports are connected by a direct passenger flight. This network can be represented as an adjacency matrix (An×n), that aij = 1 if a flight link exists between a city-pair (i and j), otherwise, aij = 0. This method of network establishment is similar to previous works [25,26,27]. If some flights shared the same flight code when they were operated through strategic cooperation, they were combined as one flight [28]. The flights operating under code-sharing agreements but not flying the actual flights were not considered. If there are two airports in the same city (like Beijing, Shanghai), the two airports were combined into one node. Figure 1 shows the structure of China’s passenger airline network that contains 206 nodes and 2095 edges. The width of edges differentiates the number of flights along with each link.
2.2. Methods
2.2.1. Motif Analysis
Network motifs are basic interactive subgraphs whose frequencies in a real network are significantly higher than those in a randomized network, while those occurring less frequently than randomized network are called anti-motifs [9,10,13,29]. Network motif can be a useful tool to observe the local relationship pattern in the airline network [30].
The randomized networks have the same single-node characteristics as real networks, which means that each node in a randomized network has the same number of incoming and outgoing edges as the corresponding node has in a real network.
1. Frequency of motif
For a given subgraph S with n nodes, the number of times it appears in the real network is n(S), and the total number of times that all subgraphs with n nodes appear in the real network is N; then, the appearance frequency of the subgraph S is:
If the subgraph S is the motif of the network, this frequency is called the frequency of the motif, or the motif concentration.
2. Value P of motif
Value P refers to the probability that the number of times that the motif M appears in the random network is bigger than that in the real network. A smaller value of P indicates greater importance of the motif in the network. When the probability P is lower than a cutoff value (in this paper is 0.01), the occurrence times of subgraphs in the network are deemed to be significantly higher than in a randomized network, and the subgraphs can be seen as “network motifs” [10].
3. Value Z of motif
For a motif, the number of times it appears in the real network is , and the number of times it appears in the random network is ; the mean of is and the standard deviation is ; then, the value Z of the motif in the real network is:
Generally, the statistical significance of the motif is evaluated by calculating the value Z. In the case Z > 0, the subgraph is a motif; in the case Z < 0, the subgraph is an anti-motif. Value Z can be used to measure the importance of the motif. A higher value of Z indicates greater importance of the motif in the network.
This paper identified motifs in China’s passenger airline network through the Rand-ESU algorithm using the analysis tool FANMOD [31,32]. The ENUMERATE SUBGRAPHS (G, k) (ESU) algorithm specifies that starting from a peak v in the input network, the peaks adjacent to certain peaks whose subscript is bigger than v and does not belong to VSubgraph are added into VExtention. According to the method of enumerating by virtue of the tree structure and sampling the subgraphs, a gradual extension of the subgraph from the subgraph with the scale of 1 ensures that each subgraph is searched for only once and no meaningless subgraphs are generated. In the process of enumerating subgraphs (ESU) through the Rand-ESU algorithm, judging whether to continue expanding a certain subgraph based on probability can greatly improve the efficiency of the algorithm and can also expand the search scale to 14 peaks, indicating that this is a highly effective method.
2.2.2. Network Analysis
To assess the heterogeneity and hierarchy of network nodes in 37 airline company networks, average degree and Zipf index were employed to assist the analysis.
1. Average degree
The degree of a node refers to the number of all connected edges of the node in the network, and the average degree refers to the average value of degrees of all nodes in the whole network. In this study, the average degree of each airline company indicates that the average value of all airports’ degrees in the company’s network.
2. Zipf law
Zipf’s law is one of the little quantitative and reproducible regularities found in economics. Zipf index was used to describe city sizes in 1949, and the size distributions of cities are power laws with a specific exponent, meaning that the probability of attaining a certain size x is proportional to x−τ. The τ was thus called Zipf index [33]. Zipf’s law also holds in many other scientific fields [34]. In this article, the degrees of nodes of each airline company were ranked by size, and they all essentially followed a power law distribution under exponential regression. Their power exponents of them were seen as their Zipf index.
3. Characteristics of Motifs of China’s Passenger Airline Network
3.1. Motifs of China’s Passenger Airline Network
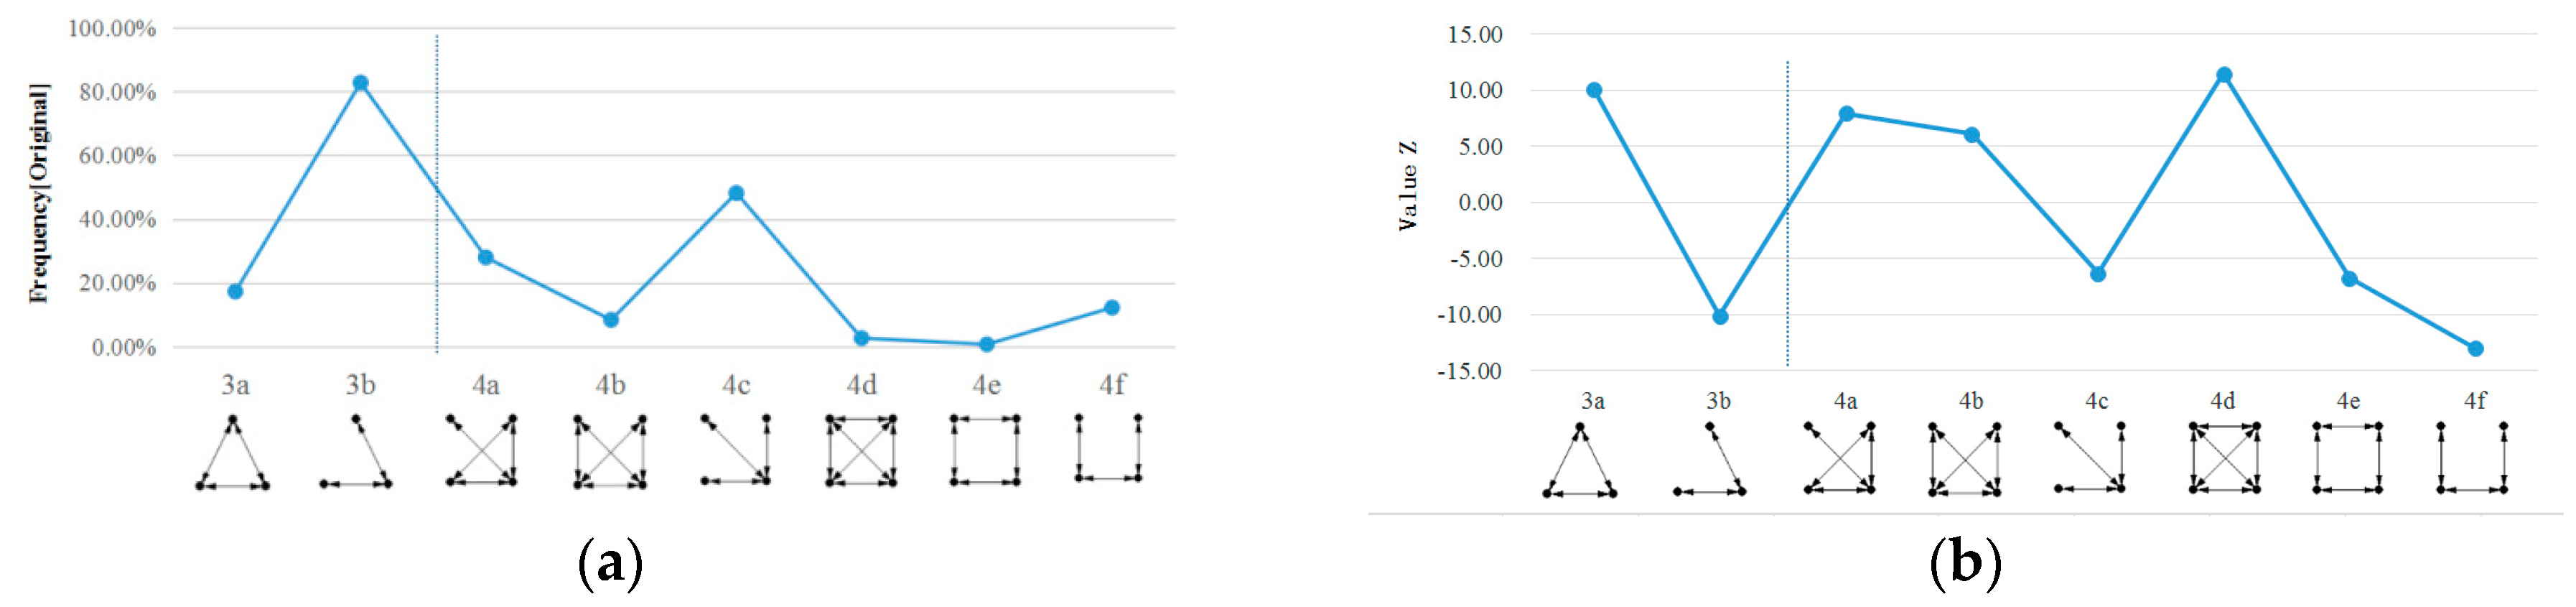
In order to examine the micro functional structure of China’s passenger airline network, we scanned for all possible three-node and four-node undirected subgraphs. We got one three-node motif (3a), one three-node anti-motif (3b), three four-node motifs (4a, 4b and 4d), and three four-node anti-motifs (4c, 4e, and 4f) in the network. Table 1 summarizes basic parameters of all motifs and anti-motifs including the subgraph shape, the frequency of the motifs appearing in the real network (Frequency [Original]), the average frequency of the subgraphs appearing in the random network (rMean-Freq [Random]), Z values of the motifs, and P values of the motifs.
Considering the three-node subgraphs, motif 3a is a triangular structure formed by three mutually connected airports, while anti-motif 3b is a V-shaped structure formed by the connection between one airport and two disconnected airports. 3a is a structural building block of China’s passenger airline network by Milo’s definition [10]. According to the previous study [35], the airline network with a high concentration of motif 3a (triangular-shape) means higher clustering characteristics than those with a high concentration of anti-motif 3b (V-Shape).
The frequencies of the subgraphs 4a, 4b, and 4d in China’s passenger airline network are higher than those in the random network, which means they are the four-node motifs. Motif 4a is characterized by mutual connection of three airport nodes while one of them connects with a fourth airport that is not connected with the other two airports. The number of connected edges in this motif is 4. The topological structure of Motif 4b is that two of the airports are each connected with three airports, while the other two airports are not mutually connected and each linked with only two airports. Thus the number of connected edges is 5. All four nodes of Motif 4d are connected mutually, and the number of connected edges is 6. From 4a to 4b to 4d, the number of connected edges increases gradually, coupled with more complex connecting structure and gradually reduced frequency. Motif 4d has the highest value Z (Z = 11.474) among all 4-node motifs, showing the highest significance level.
The frequency of subgraphs 4c, 4e and 4f appearing in the airline network is lower than in the random network (P > 0.01, Z < 0), so these three subgraphs are anti-motifs. The anti-motif 4c is in the star shape formed by connections between one airport node and three disconnected nodes. In the computer network topology, the star-shaped topological structure has one center node, and all other nodes are connected with the center node through their respective routes, forming a radiating structure. This structure has advantages of simple structure, management convenience, and concentrated control, but also has weakness of poor network sharing capacity and low use ratio of network routes [36]. Anti-motif 4f shows a chain structure formed by four airport nodes connected in sequence. Anti-motif 4e with an extremely low appearing shows an end-to-end loop connection. The loop network is poor to expand. Anti-motifs, 4c, 4e, and 4f are not able to represent the important structural and functional characteristics of the network.
Figure 2 contains the original frequency and value Z distribution curves of subgraphs in China’s passenger airline network. It can be seen that the frequency of the three-node anti-motif 3b and the four-node anti-motif 4c appearing in the network is high, and 3b and 4c have a common structural characteristic that one airport node is connected with multiple disconnected nodes to form a star shape. Such structures have a higher appearance frequency in the network, but they cannot be the building blocks of the motifs. Motifs 4a, 4b, and 4d have a common characteristic of further connection based on the looped structure. At the same time, each node of motifs 4b and 4d is connected with at least another two nodes to form a mesh topology with higher reliability and more complex structure. Moreover, motifs 4a, 4b, and 4d all have more connected edges than other subgraphs with the same number of nodes. The airline network differs from the railway network and other ground transportation networks that require physically constructed routes. The air transportation network is serviced by air routes, and it has higher efficiency due to its greater number of potential connections and the flexibility of establishing them.
The network subgraphs are a part of the overall network, and the n-node subgraphs are formed by (n-1) nodes connected in a particular combination [10]. According to the structural characteristics of motifs and anti-motifs of China’s passenger airline network, motifs 4a, 4b, and 4d contain the triangular structure of motif 3a, while anti-motifs 4c, 4e, and 4f contain the V-shaped structure of anti-motif 3b, which reflect the combination relationship among the motifs and the anti-motifs.
Motifs can represent the characteristics of functional structures of the real network. Motifs of the airline network (subgraphs 3a, 4a, 4b, and 4d) show common characteristics of more stable topological structures and more complete connection, which reflects the stability of the overall structure of China’s passenger airline network. Thus, these motifs are advantageous subgraph structures of the airline network. Anti-motifs are not the main structures of the real network and cannot represent the structural characteristics of the real network. Anti-motifs (subgraphs 3b, 4c, 4e, and 4f) of the airline network show characteristics of lower levels of connection and weaker interaction, so they are generally the disadvantageous subgraph structure of the airline network.
3.2. Motifs of Networks of the Airline Companies
Based on 37 China’s airline companies in 2015, the unweighted and undirected China’s passenger airline network was diagramed into 37 airline networks. The 37 networks were subjected to motif detection one by one using the FANMOD tool.
Table 2 shows all motifs and anti-motifs of airline companies. The airline companies’ abbreviations (IATA codes) were listed in Table 2. In Table 2, if a company owns some subgraphs as motifs, the corresponding subgraphs are marked a “√” under it. If a company owns some subgraphs as anti-motifs, the table cells under the relevant subgraphs show blank. Considering the small scale and the simple and disordered airline route network of 9Air Co. Ltd., no motif was generated. After eliminating 9Air Co. Ltd., 36 airline companies remained for motif analysis.
The degree distribution reveals important information about the heterogeneity of the nodes [37]. Hubs are located in the highest hierarchical level, with many more linkages than the regular spoke nodes [38]. According to previous studies, the hub of every airline company is identified according to the degree. In this article, when a node’s degree is higher than the sum of triple standard deviations of the degrees and the average degree in the network, it will be considered as a hub. At the same time, the degree distribution of the airports was used to fit the rank-size curve and calculate the Zipf index, which can help uncover levels of the hierarchy of node degrees [39]. For comparison, some basic information about airline networks and motif characteristics were summarized in Table 2.
As shown in Table 2, 26 of the 36 airline companies have independent motifs 3a, and 10 companies have independent motifs 3b. Each airline company has only one of motifs 3a or 3b, indicating that these two motifs can respectively reflect the structural characteristics of different types of airline companies. More airline companies have the topologically stable, 3-node motifs 3a with the triangular structure. Motif 3a can manifest the common characteristics of networks of the majority of airline companies. From Table 2 we can see that most companies with a large network scale, multi-hubs, and Zipf index higher than 1 have motif 3a. The number of airline companies with motifs 3b is small. These companies generally have a small network scale, a small number of routes, and small average degree and Zipf index (smaller than 0.9). Motifs 3b could represent the characteristic structure of small, immature airline companies.
Thirty-one airline companies have motifs 4a, accounting for the vast majority, which fits with the characteristics of motifs of China’s passenger airline network. Motifs 4a can be viewed as a common characteristic motif of companies. Topologically, motifs 4a are combinations of motifs 3a and 3b, thereby having characteristics of both. A similar number of airline companies have motifs 4b, 4c, and 4d, respectively, approximately accounting for one third to one-fourth of the total number of airline companies. These three motifs manifest different class characteristics of airline companies. Most companies having motifs 4b and 4d are multi-hub networks with large scale, high network average degree, and Zipf index, and have been established for a long period of time. Thus, motifs 4b and 4d can represent the structural and functional characteristics of larger and mature airline networks. Most airline companies with motifs 4c have a small scale, low network average degree, and small Zipf index have been established for a short period of time, and have only one or no hub. An extremely small number of airline companies (2-3 companies) have motifs 4e and 4f. Motifs 4e and 4f are in looped structures and chain-shaped structures, and airline companies with these two kinds of motifs have a very small scale.
This indicates that network motifs can reflect the structural and functional characteristics of the airline network. Table 3 summarizes the structural characteristics of the motifs of China’s passenger airline network.
4. Classification of China’s Air Passenger Transport Companies Based on Motif Concentration Curve
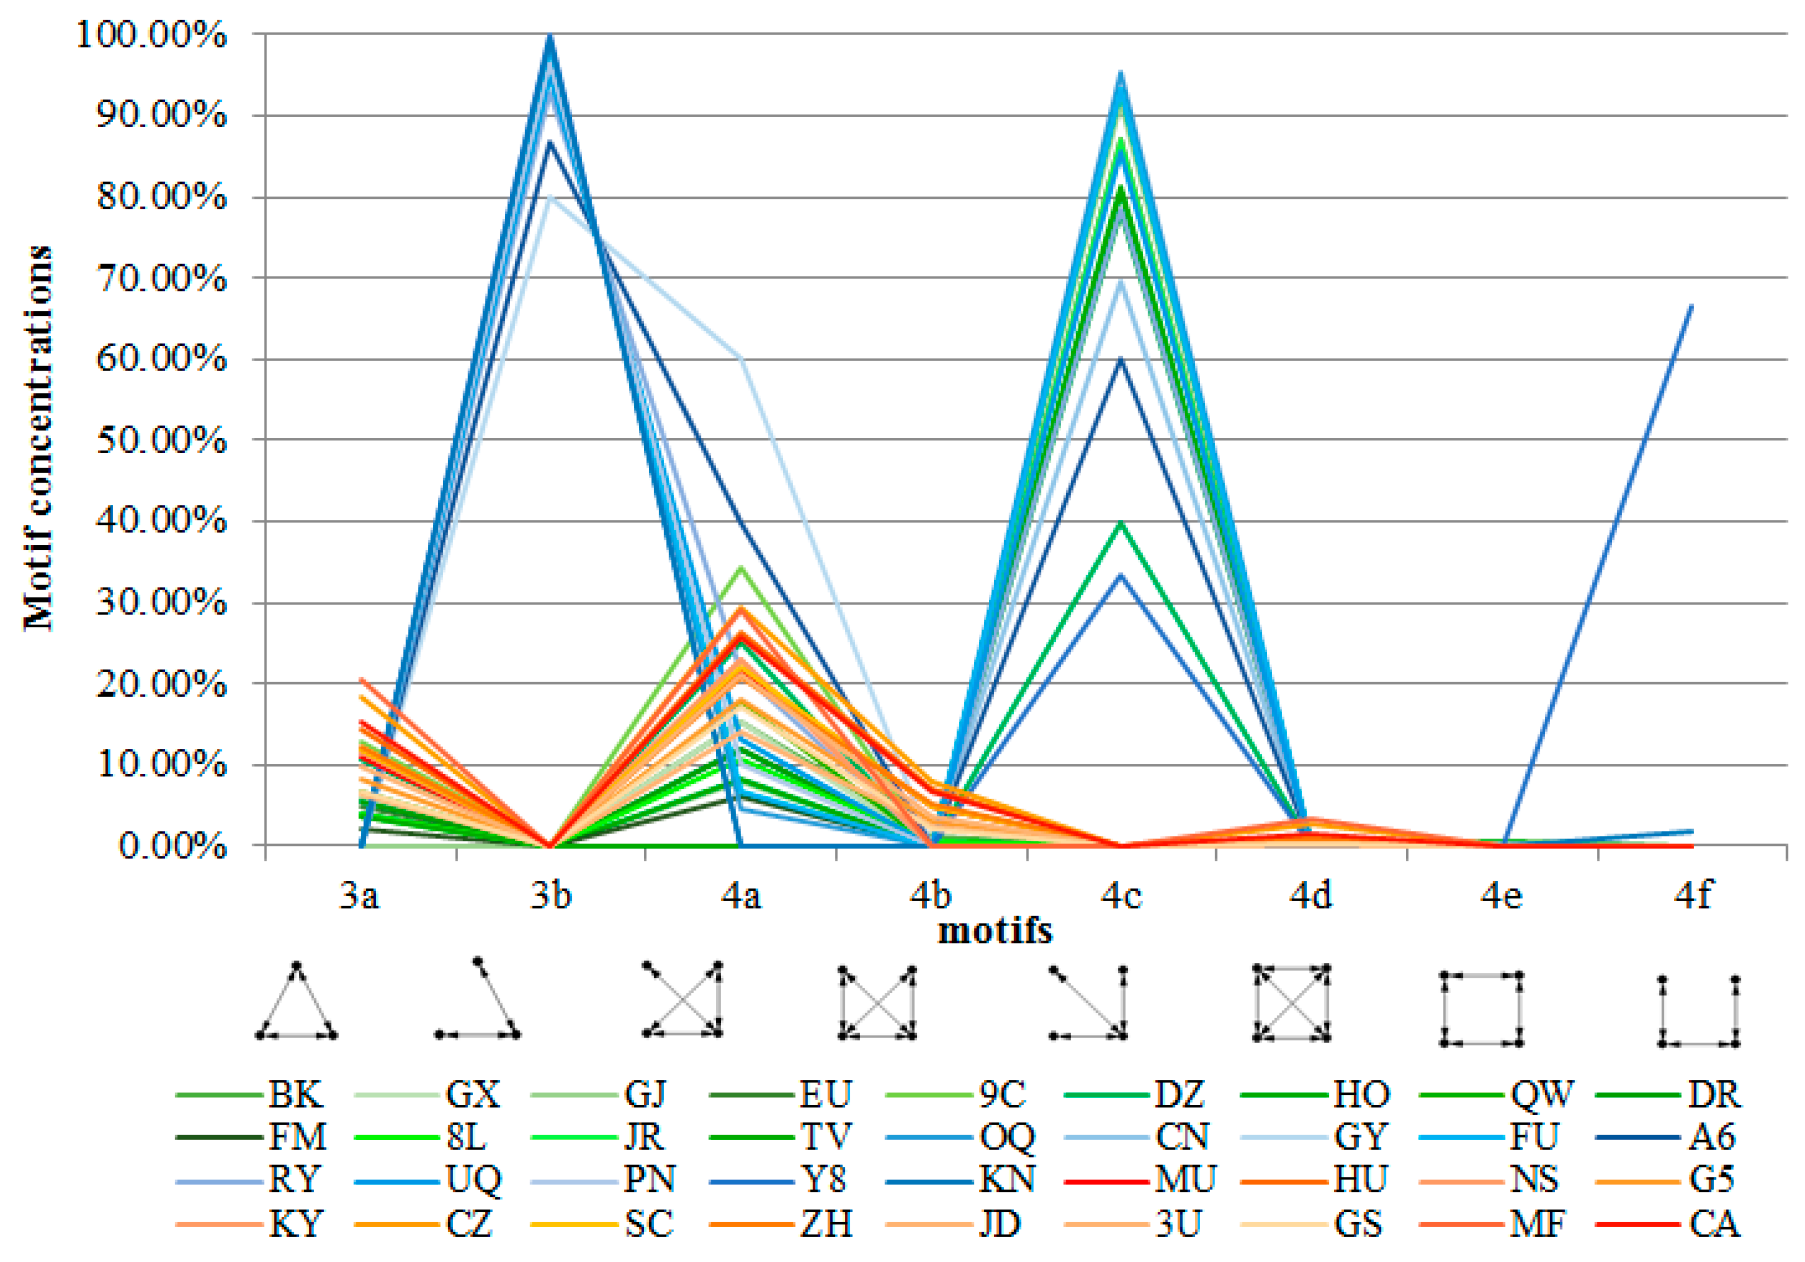
When only the frequency of the motifs appearing in the real network is considered, the motif concentration characteristic curve (Figure 3) of different airline companies can be drawn by connecting the frequency of different motifs of the same airline company. It can be seen that the curves of the companies with similar structural characteristics follow similar trends. Therefore, the airline companies can be classified according to the motif concentration curves.
According to Figure 3, China’s airline companies can be roughly classified into three types.
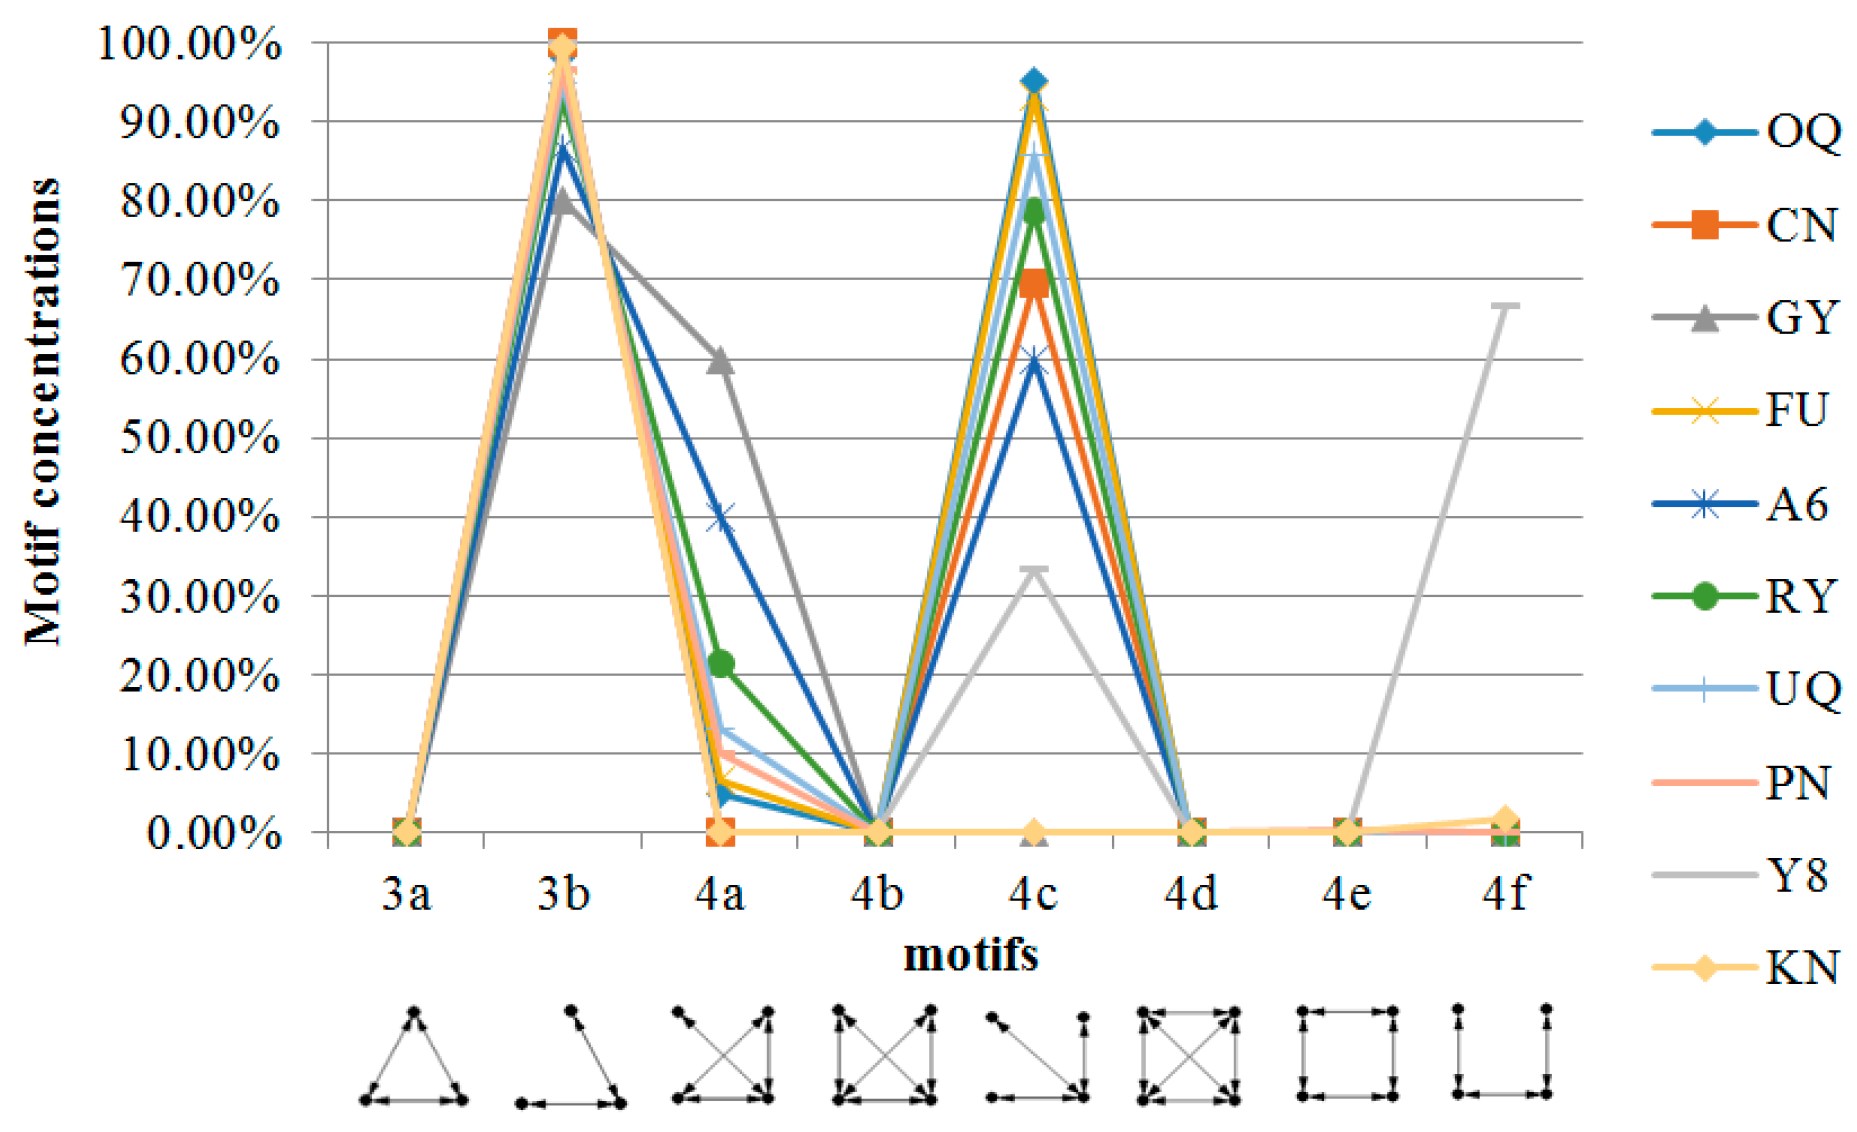
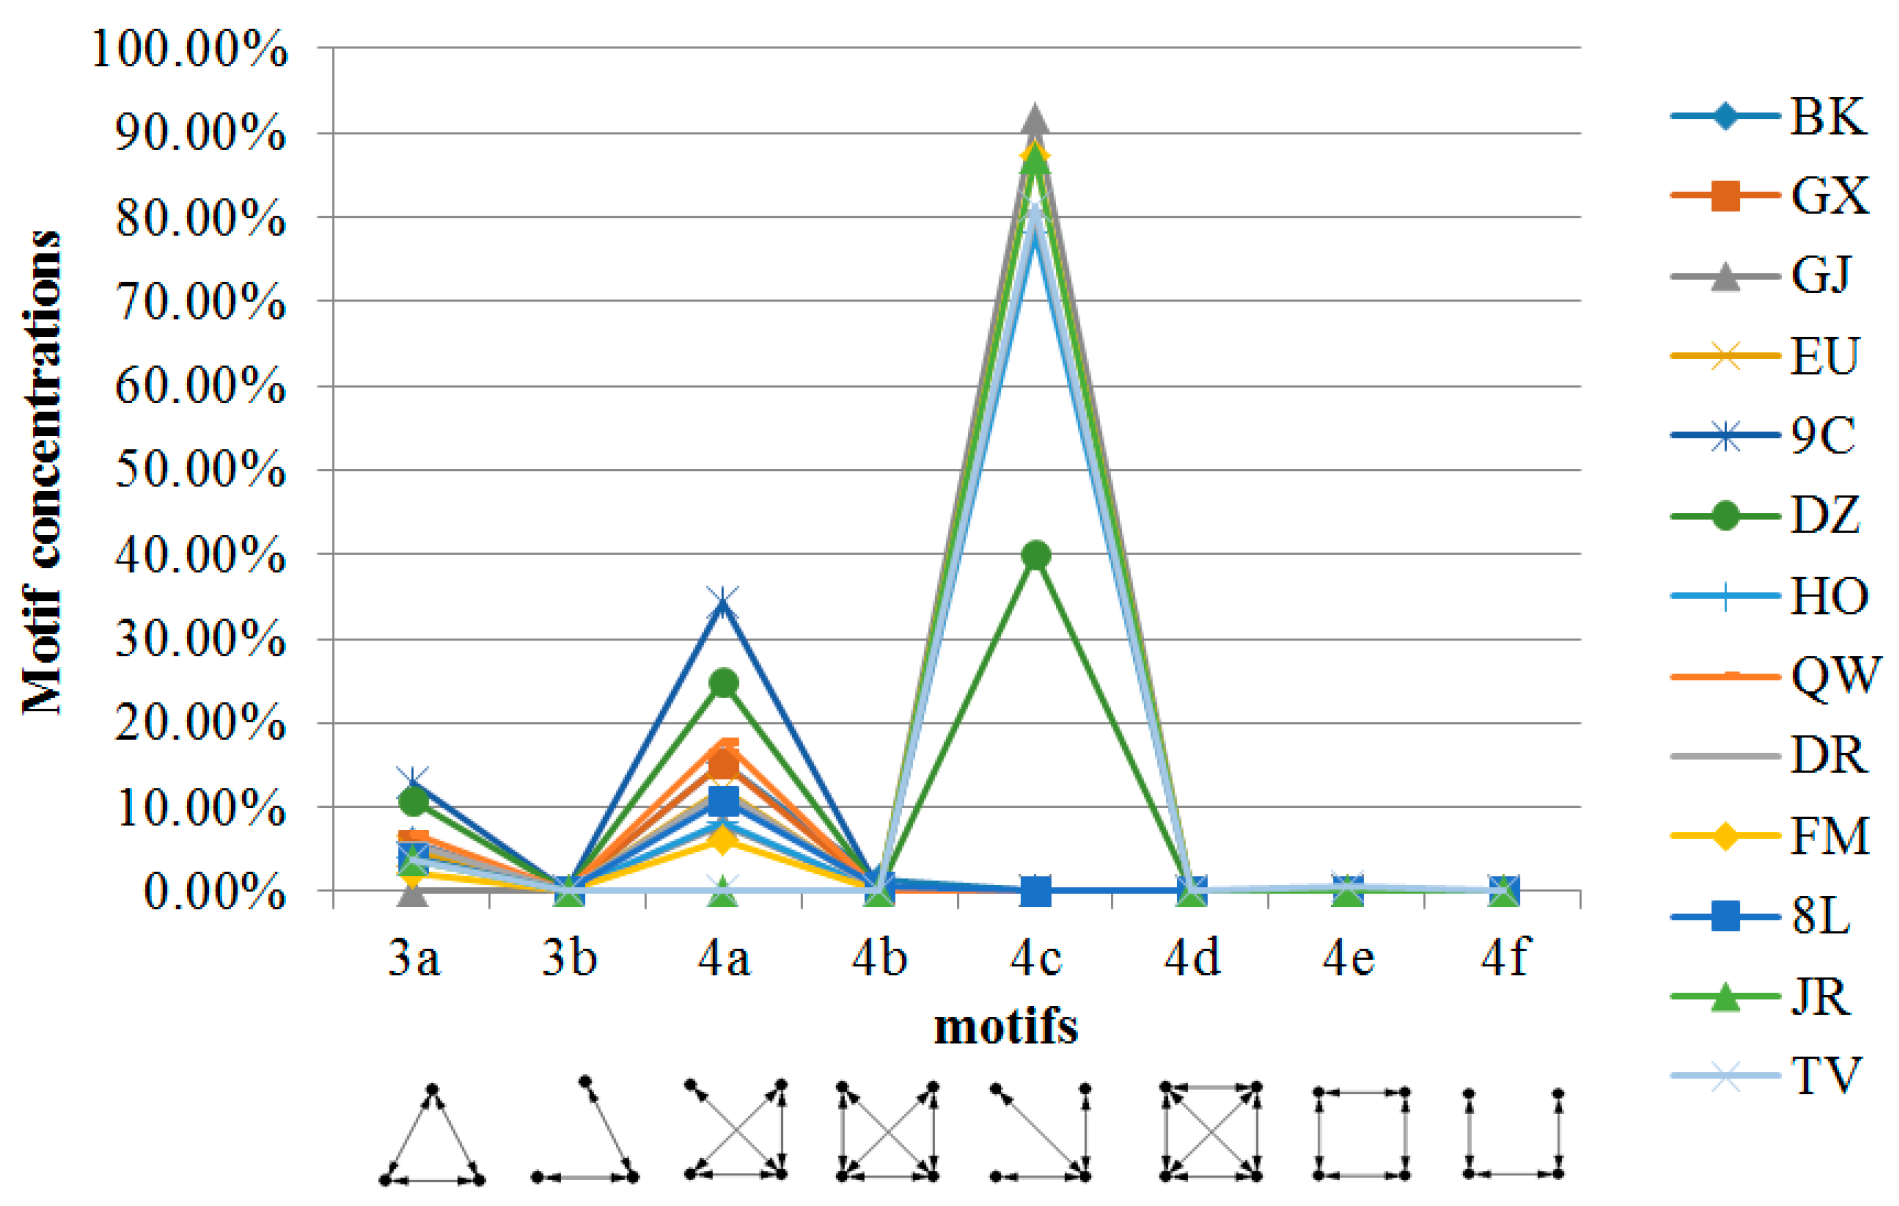
Type I. The motif concentration curves of type I airline companies are shown in Figure 4. Most of these concentration curves have two obvious peaks at motifs 3b and 4c, one high value at motif 4a, zero at motifs 3a, 4b, and 4d, and a small number of specific values at motifs 4e and 4f. A total of 10 airline companies belong to type I. Most of these companies are young, have a small number of route edges (smaller than 30 for the majority), a small average network degree (smaller than 2.5 for the majority), obvious regionalization service of routes, and 1 or 0 hub. The structural characteristics of networks of type I companies are mono-centric divergence, with dominating star-shaped motifs 3b and 4c. The network characteristics of these airline companies indicate a low level of development.
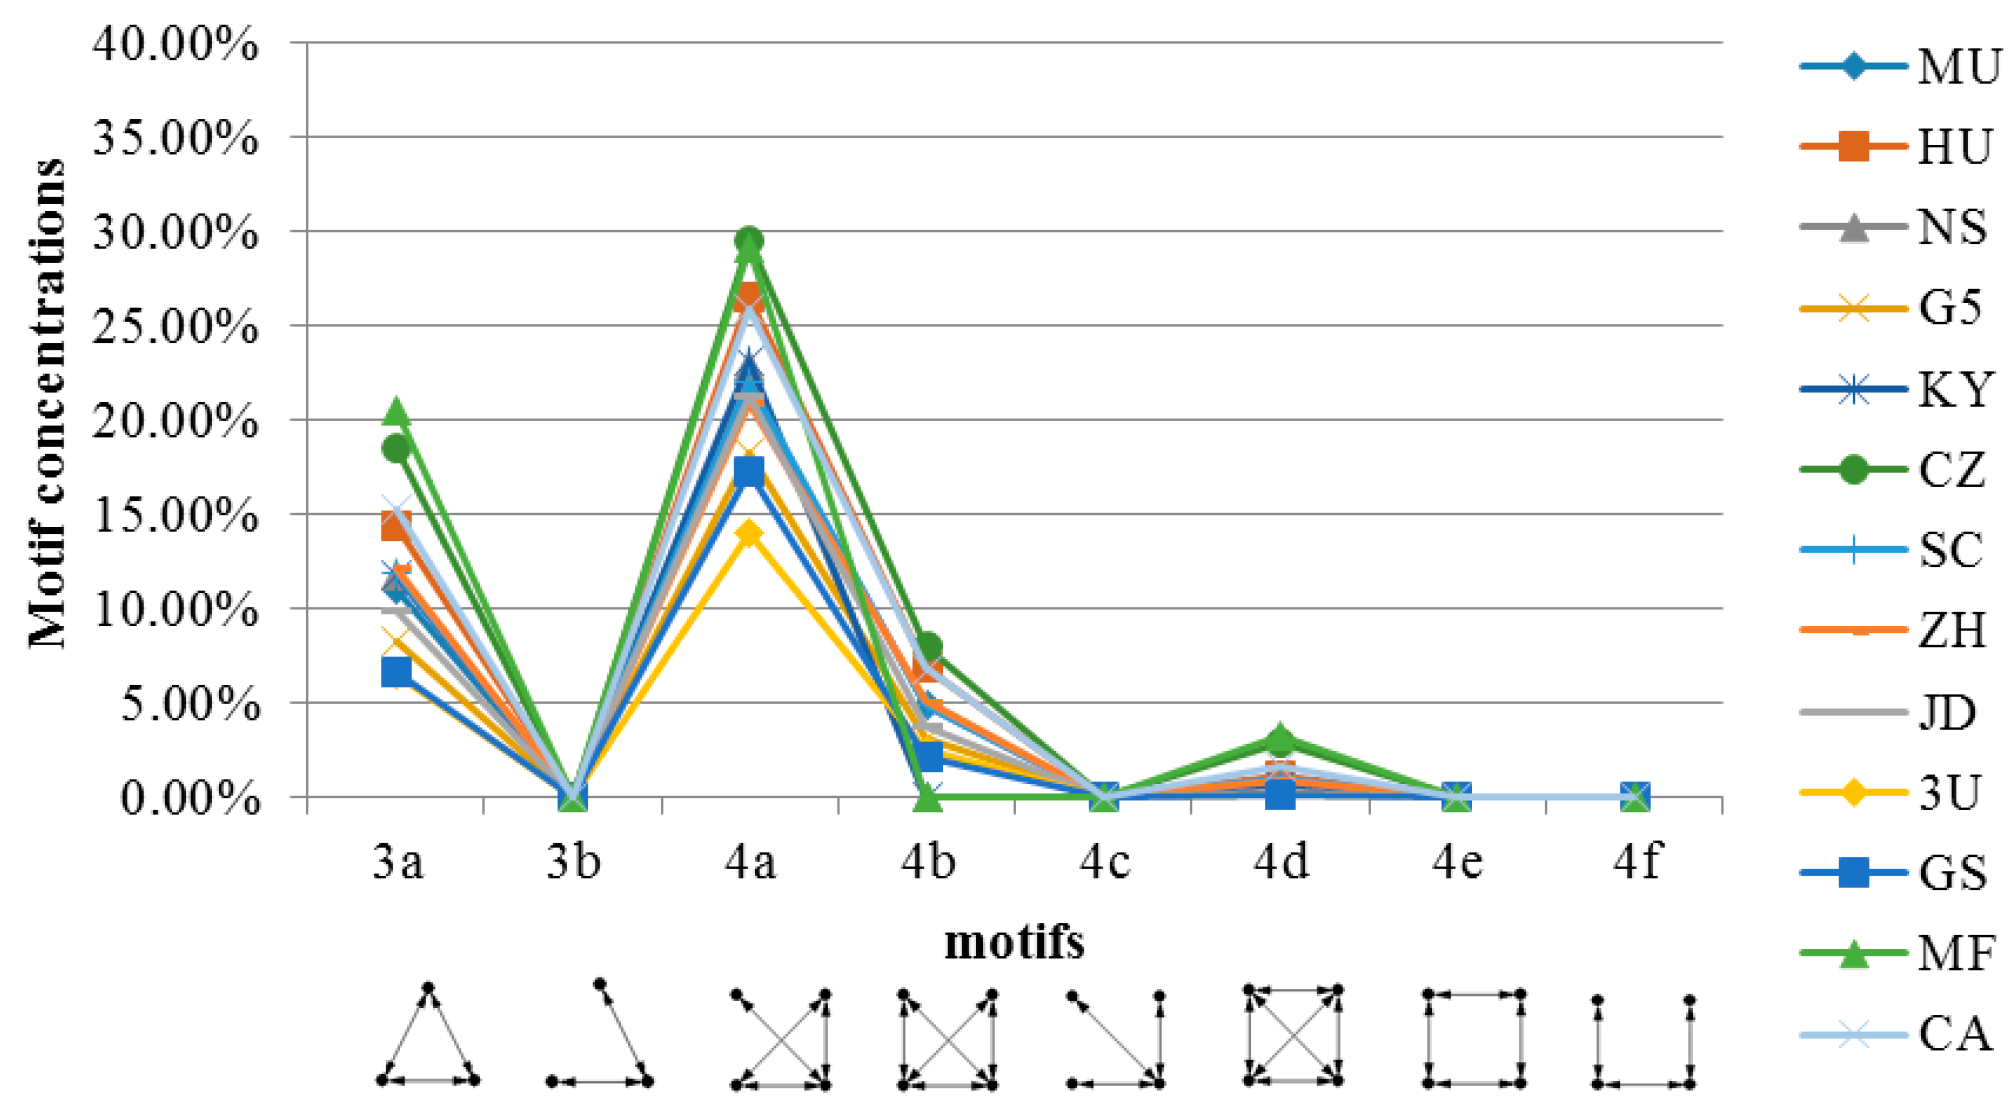
Type II. The characteristics of the motif concentration curves, shown in Figure 5, are that most companies have two peaks at motifs 3a and 4a, as well as zero at motifs 3b, 4b, and 4d, while some companies have characteristic motifs 4c. The three-node motifs of type II airline companies are motifs 3a, which have more stable topological structures compared with the V-shaped three-node motifs of type I companies. Half of these airline companies operate as low-cost airlines, including Guangxi Beibu Gulf Airlines, Spring Airlines, Ruili Airlines, Lucky Air, Joy Air, and Tibet Airlines. Compared with type I companies, these type II companies have a richer network structural hierarchy, a larger scale, and a higher average network degree (2.5–5). However, structural performance is inferior to the airline network of type III companies. The structural characteristic of type II companies may be considered to be at the transitional development stage.
Type III. The motif concentration curves of these airline companies show a low peak (Figure 6). The peaks appear at motifs 3a and 4a; motifs 4b and 4d still have certain values; zero appear at 3b, 4c, 4e, and 4f. The net-shaped motifs 4b and 4d are characteristic motifs of mature networks, with more complex and reliable topological structure. Type II and III airline companies have the same three-node motifs, but their four-node motif curves are different, which verifies that the network classification can be refined by motif curves of high-level networks [40]. The majority of type III airline companies have a large number of route edges (bigger than or far bigger than 120 for each), multi-hubs in the network, high Zipf index (bigger than 0.9), high network degree (bigger than 5), and a long history of operation. Thus, these companies are most mature, including China’s three flagship airlines―Air China, China Southern, and China Eastern. Their service networks and markets reach out to the entire mainland of China.
After combining the concentration curves of these three types of airline companies, it can be seen that in the development process of the airline networks from low to high and becoming more mature, the three-node V-shaped motifs 3b disappear gradually and are replaced by the triangular motif 3a. As to the four-node motifs, the star-shaped motif 4c diminishes gradually and finally disappears as the net-shaped motifs 4b and 4d appear. This transforming relationship displays certain conservation rule (Similar findings were reported in Reference [40]), i.e., low-level airline networks tend to have motifs 3b and 4c, while mature airline networks tend to have motifs 3a, 4b, and 4d. When one kind of network motif disappears, another kind of motif with the same number of nodes would appear in its place.
There is a correspondence between the trends of the motif concentration curves and the structural characteristics and the development stages of airline networks. Type I motif curves correspond to single-centric divergent airline companies at a low stage of development, type II motif curves correspond to transitional airline companies at the intermediate development stage, while type III motif curves correspond to multi-centric and hierarchical airline companies at the mature development stage. The motifs with a higher level of connection correspond to mature airline companies.
5. Optimization Mechanism of China’s Passenger Airline Network Based on Motif Analysis
Airline networks at different development stages have different types of motifs. Thus from a developing or evolving perspective, transforming the types of disadvantageous motifs in and adjusting the topology of some airline’s networks by increasing the number of advantageous motifs can be considered. Network motifs can provide an optimized strategy for the development of airline companies, no matter the companies with a large or small scale. This could help optimize network structures and improve the sustainability of the airline networks and the airline industry.
Airline companies at the low development stage of network structure tend to have motifs 3b and 4c. These two kinds of motifs are corresponding to “point-to-point” and “Single-hub-and-spoke” structural pattern of the airline network (Figure 7). Very few airline companies have motifs 4e and 4f, the structure of which is similar to the linear structure of the airline network. Study proves that the network that combines the point-to-point structure and the “Single-hub-and-spoke” is the most cost-effective [41], and this kind of network generally corresponds to airline networks with a small scale. When operation cost and variable cost are low enough, the “point-to-point” networks can provide more services [42]. “Linear” networks are actually derivatives of the “point-to-point” networks, and they are generally applicable to the small-scale air transport market, especially branch lines. While linear networks improve passenger load of airplanes, addition of passengers is conducted midway, leading to the lack of stability and difficulty in forming economies of scale [43]. These small-scale and low-cost companies could increase the connectivity between network branch lines and the number of motifs 3a, 4a, 4b, and 4d to enrich the network hierarchy.
In contrast, airline companies with highly developed networks have characteristic motifs with a higher connection level of connections, such as motifs 3a and 4a in type II companies and motifs 4b and 4d in type III companies. In real-world operation, airline companies generally adopt mixed airline networks. For example, airline companies operate direct flights in non-hub cities based on the hub-and-spoke network. The multi-hub-and-spoke network is the dominant pattern of hub-and-spoke airline networks, under which several hub airports are connected to form the main line, and the hub airports and non-hub airports are connected to form branch lines [43]. Motifs 3a and 4a are similar to non-hub connection based on the hub-and-spoke pattern, and motifs 4b and 4d can be viewed as the further connection of the branch line or the multi-hub-and-spoke pattern. The addition of motifs 3a, 4a, 4b, 4d, and other more sufficiently connected motifs can increase the maturity of the airline networks and improve the network hierarchy (e.g., a system containing national hubs, and regional hubs) complexity, and stability. Of course, all of these complex developmental strategies are subject to airlines’ assessment of their specific focuses on different regions and different sets of routes in the national air passenger market. The variations between airlines, which are caused by a number of variables such as geography, historical ties, airline merging, competition, etc., also influence what strategies are adopted by the airlines and where and what types of hubs are located in their networks.
6. Conclusions and Discussions
6.1. Conclusions
In this paper, the motifs and anti-motifs of China’s passenger airline network were identified by using ENUMERATE SUBGRAPHS (G, k) (ESU) algorithm and the FANMOD tool. Additionally, 37 Chinese air passenger transport companies were classified according to the motif concentration curves, to explore the structure and evolution of China’s passenger airline network. Finally, some strategies of the passenger airline network ware proposed for airlines to develop and optimize their networks. Major research findings are as follows:
(1) From observation and comparative analysis of the development characteristics and motifs structure of airline companies, we found that different motifs could reflect various structural and functional characteristics of the airline networks. And network motifs of Chinese passenger airlines can be grouped into common motifs, motifs with mature network characteristics, and motifs with immature network characteristics.
(2) There is a conservation relationship between the airline network motifs with the same number of nodes. In other words, the disappearance of a kind of motif is accompanied by the appearance of another kind of motifs, such as conservation between motifs 3a and 3b, between 4b and 4d, and between 4c, 4e, and 4f. However, the contents of the motif will change significantly with the growth of airline networks. Thus, the development stages of different air companies can be determined based on their motif concentration curves. Accordingly, 37 China’s airline companies in 2015 were divided into 3 types (stages): Mono-centric divergence companies at the low-level development stage, transitional companies at the intermediate development stage, and multi-centric and hierarchical companies at the advanced development stage.
(3) The overall structure of airline networks could be optimized by raising the structural competency of advantageous motifs and reforming those structure types of disadvantageous motifs.
6.2. Discussions
Different from previous network analysis methods, motif analysis neither emphasizes the overall structural organization nor focuses on the role of nodes, but rather consider the microcosmic organization structure. It is not only a synthesis of but also a supplement to the previous perspectives. This study demonstrated that the network motif is applicable and effective in the analysis of airline networks. New insights, such as determining the network organization mode and airline network development stages are provided by this research, which can serve as a reference for the optimization of the airline network.
With the development of airline networks, the concentration of network motifs may vary significantly. Because of the conservation between motifs with same number nodes, the development stage of the air passenger transport companies can be divided effectively and scientifically based on the types of motifs (motif concentration curves). Compared with only considering the number of routes or the scale of airline companies, this method is more effective in evaluating and differentiating the development stages of airline networks.
The organization modes like “hub-and-spoke” or “point-to-point” have received widespread attention, which is also considered as competitive strategies. However, there is no pure organizational mode in practice. Airline companies often adopt a mixed strategy. This is especially true for those transitional airline networks. Motif analysis could be helpful in carrying out a quantitative analysis of the network organization modes. Motifs can be regarded as a microstructural element, and the macrostructure of the airline networks like “hub-and-spoke” mode is reflected by the content of its feature motifs. Adjusting the structural patterns of the networks based on motif analysis is more stereoscopic compared with node-based network pattern adjustment. Adjusting the content of different network motifs and increasing the network hierarchy and complexity can serve as a new way for optimizing the structure patterns of airline networks and promoting the sustainable development of the aviation industry. In short, motif analysis provides us with a new analytical tool in the understanding of the passenger airline network.
In passenger airline network, some nodes (like hubs) play key roles due to their important geographical location, economic development level, and other reasons. Apparently, the motifs containing these nodes are supposed to be more prominent. But they are not given specific consideration in this paper, which will be explored in future research. In addition, this paper only discussed the topological characteristics of the networks. Now that the passenger airline network is kind of geo-embedded network, more attention will be paid to the geographical properties, such as ground transportation, economy, and population in future studies. Additionally, we might want to explore how to define and identify the geographical motifs.
Author Contributions
Conceptualization, Y.W.; methodology, Y.W.; data curation, Y.J.; writing—original draft preparation, Y.J.; writing—review and editing, W.S.; visualization, K.Y.; supervision, C.X.; funding acquisition, C.X.
Funding
This research was funded by National Natural Science Foundation (NSF) of China, grant number: No. 41871162; No.41630749.
Conflicts of Interest
The authors declare no conflict of interest.
References
- Hsu, C.I.; Shih, H.H. Small-world network theory in the study of network connectivity and efficiency of complementary international airline alliances. J. Air Transp. Manag. 2008, 14, 123–129. [Google Scholar] [CrossRef]
- Zhang, L.; Lu, N. Structural Behavioral Study on the General Aviation Network Based on Complex Network. IOP Conf. Ser. Mater. Sci. Eng. 2017, 274, 012097. [Google Scholar] [CrossRef] [Green Version]
- Guimerà, R.; Mossa, S.; Turtschi, A.; Amaral, L. The worldwide air transportation network: Anomalous centrality, community structure, and cities’ global roles. Proc. Natl. Acad. Sci. USA 2005, 102, 7794–7799. [Google Scholar] [CrossRef] [PubMed]
- O’Kelly, M.E. A geographer’s analysis of hub-and-spoke networks. J. Transp. Geogr. 1998, 6, 171–186. [Google Scholar] [CrossRef]
- Jiang, Y.; Jiang, J.C. Understanding social networks from a multiagent perspective. IEEE Trans. Parallel Distrib. Syst. 2014, 25, 2743–2759. [Google Scholar] [CrossRef]
- Dang, Y.; Peng, L. Hierarchy of air freight transportation network based on centrality measure of complex networks. J. Transp. Syst. Eng. Inf. Technol. 2012, 12, 109–114. [Google Scholar] [CrossRef]
- Li, W.; Cai, X. Statistical analysis of airport network of China. Phys. Rev. E 2004, 69, 046106. [Google Scholar] [CrossRef] [PubMed] [Green Version]
- Bagler, G. Analysis of the airport network of India as a complex weighted network. Phys. A Stat. Mech. Appl. 2008, 387, 2972–2980. [Google Scholar] [CrossRef] [Green Version]
- Shen-Orr, S.S.; Milo, R.; Mangan, S.; Alon, U. Network motifs in the transcriptional regulation network of Escherichia coli. Nat. Genet. 2002, 31, 64–68. [Google Scholar] [CrossRef]
- Milo, R.; Shen-Orr, S.; Itzkovitz, S.; Kashtan, N.; Chklovskii, D.; Alon, U. Network motifs: Simple building blocks of complex networks. Science 2002, 298, 824–827. [Google Scholar] [CrossRef]
- Benson, A.R.; Gleich, D.F.; Leskovec, J. Higher-order organization of complex networks. Science 2016, 353, 163–166. [Google Scholar] [CrossRef] [Green Version]
- Reigl, M.; Alon, U.; Chklovskii, D.B. Search for computational modules in the C. elegans brain. BMC Biol. 2004, 2, 25. [Google Scholar] [CrossRef]
- Sporns, O.; Kötter, R.J.P.B. Motifs in brain networks. PLoS Biol. 2004, 2, 1910–1918. [Google Scholar] [CrossRef]
- Itzkovitz, S.; Alon, U. Subgraphs and network motifs in geometric networks. Phys. Rev. E 2005, 71, 026117. [Google Scholar] [CrossRef] [Green Version]
- Valverde, S.; Solé, R.V. Network motifs in computational graphs: A case study in software architecture. Phys. Rev. E 2005, 72, 026107. [Google Scholar] [CrossRef]
- Ohnishi, T.; Takayasu, H.; Takayasu, M. Network motifs in an inter-firm network. J. Econ. Interact. Coord. 2010, 5, 171–180. [Google Scholar] [CrossRef]
- Yang, J.; Guo, A.; Li, X.; Huang, T. Study on spatial-temporal differentiation of transportation accessibility and spatial equality in China. Sustainability 2018, 10, 2943. [Google Scholar] [CrossRef]
- Yang, J.; Bao, Y.J.; Zhang, Y.Q.; Li, X.M.; Ge, Q.S. The impact of accessibility on house prices based on a geographically weighted regression model. Chin. Geogr. Sci. 2018, 28, 505–515. [Google Scholar] [CrossRef]
- Derudder, B.; Cao, Z.; Liu, X.; Shen, W.; Dai, L.; Zhang, W.; Caset, F.; Witlox, F.; Taylor, P.J. Changing Connectivities of Chinese Cities in World City Network, 2010–2016. Chin. Geogr. Sci. 2018, 28, 183–201. [Google Scholar] [CrossRef]
- Xi, G.L.; Zhen, F.; He, J.L.; Gong, Y.H. City Networks of Online Commodity Services in China: Empirical Analysis of Tmall Clothing and Electronic Retailers. Chin. Geogr. Sci. 2018, 28, 231–246. [Google Scholar] [CrossRef]
- Xia, J.H.; Yang, J.; Liu, J. Spatio-temporal theories, technologies and applications for transport and urban planning. J. Spat. Sci. 2018, 63, 199–201. [Google Scholar] [CrossRef]
- Ye, Q.; Law, R.; Gu, B. The impact of online user reviews on hotel room sales. Int. J. Hosp. Manag. 2009, 28, 180–182. [Google Scholar] [CrossRef] [Green Version]
- Leung, D.; Law, R.; Lee, H.A. The perceived destination image of Hong Kong on Ctrip.com. Int. J. Tour. Res. 2011, 13, 124–140. [Google Scholar] [CrossRef]
- Shao, T.; Kenney, M. Ctrip: China’s Online Travel Platform—Local Giant or Global Competitor? The Research Institute of the Finnish Economy: Helsinki, Finland, 2018; p. 58. [Google Scholar] [CrossRef]
- Du, W.B.; Zhou, X.L.; Lordan, O.; Wang, Z.; Zhao, C.; Zhu, Y.B. Analysis of the Chinese airline network as multi-layer networks. Transp. Res. Part E 2016, 89, 108–116. [Google Scholar] [CrossRef]
- Lordan, O.; Sallan, J.M.; Escorihuela, N.; Gonzalez-Prieto, D. Robustness of airline route networks. Phys. A Stat. Mech. Appl. 2016, 445, 18–26. [Google Scholar] [CrossRef] [Green Version]
- Hossain, M.M.; Alam, S.A. Complex network approach towards modeling and analysis of the Australian airport network. J. Air Transp. Manag. 2017, 60, 1–9. [Google Scholar] [CrossRef]
- Huang, J.; Wang, J.E. A comparison of indirect connectivity in Chinese airport hubs 2010 vs 2015. J. Air Transp. Manag. 2017, 65, 29–39. [Google Scholar] [CrossRef]
- Baskerville, K.; Paczuski, M. Subgraph ensembles and motif discovery using an alternative heuristic for graph isomorphism. Phys. Rev. E Stat. Nonlinear Soft Matter Phys. 2006, 74, 051903. [Google Scholar] [CrossRef]
- Du, W.B.; Zhang, M.Y.; Zhang, Y.; Cao, X.B.; Zhang, J. Delay causality network in air transport systems. Transp. Res. Part E Logist. Transp. 2018, 118, 466–476. [Google Scholar] [CrossRef]
- Wernicke, S. A faster algorithm for detecting network motifs. In International Workshop on Algorithms in Bioinformatics; Casadio, R., Myers, G., Eds.; Springer: Berlin/Heidelberg, Germany, 2005. [Google Scholar]
- Wernicke, S.; Rasche, F. FANMOD: A tool for fast network motif detection. Bioinformatics 2006, 22, 1152–1153. [Google Scholar] [CrossRef]
- Zipf, G.K. Human Behavior and the Principle of Least Effort; Addison-Wesley: Reading, MA, USA, 1949. [Google Scholar]
- Adamic, L.A.; Huberman, B.A. Zipf’s law and the Internet. Glottometrics 2002, 3, 143–150. [Google Scholar]
- Newman, M.E. The structure of scientific collaboration networks. Proc. Natl. Acad. Sci. USA 2001, 98, 404–409. [Google Scholar] [CrossRef] [Green Version]
- Besaw, L.M.; Wu, J.C.; Chang, C.Y.; Smith, D.D.; Kean, M.J. Graphic Display of Network Topology. U.S. Patent 5,276,789, 4 January 1994. [Google Scholar]
- Cook, A.; Blom, H.A.; Lillo, F.; Mantegna, R.N.; Micciche, S.; Rivas, D.; Vázquez, R.; Zanin, M. Applying complexity science to air traffic management. J. Air Transp. Manag. 2015, 42, 149–158. [Google Scholar] [CrossRef] [Green Version]
- O’Kelly, M.E. Network hub structure and resilience. Netw. Spat. Econ. 2015, 15, 235–251. [Google Scholar] [CrossRef]
- Crespo, J.; Suire, R.; Vicente, J. Lock-in or lock-out?: How structural properties of knowledge networks affect regional resilience. J. Econ. Geogr. 2013, 14, 199–219. [Google Scholar] [CrossRef]
- Milo, R.; Itzkovitz, S.; Kashtan, N.; Levitt, R.; Shen-Orr, S.; Ayzenshtat, I.; Sheffer, M.; Alon, U. Superfamilies of evolved and designed networks. Science 2004, 303, 1538–1542. [Google Scholar] [CrossRef]
- Wojahn, O.W. Airline network structure and the gravity model. Transp. Res. Part E Logist. Transp. Rev. 2001, 37, 267–279. [Google Scholar] [CrossRef]
- Yetiskul, E.; Matsushima, K.; Kobayashi, K. Airline network structure with thick market externality. Res. Transp. Econ. 2005, 13, 143–163. [Google Scholar] [CrossRef]
- Jin, F.; Wang, C. Hub and spoke system and China aviation network organization. Geogr. Res. 2005, 24, 774–784. (In Chinese) [Google Scholar] [CrossRef]
Figure 1.
China’s passenger airline network in 2015.

Figure 2.
Characteristic curve graph of motifs or anti-motifs of China’s passenger airline network. (a) The original frequency curves of China’s passenger airline network. (b) The value Z distribution curves of China’s passenger airline network.
Figure 2.
Characteristic curve graph of motifs or anti-motifs of China’s passenger airline network. (a) The original frequency curves of China’s passenger airline network. (b) The value Z distribution curves of China’s passenger airline network.

Figure 3.
Motif concentration curves of airline companies.

Figure 4.
Motif concentration curves of type I airline companies.

Figure 5.
Motif concentration curves of type II airline companies.

Figure 6.
Motif concentration curves of type III airline companies.

Figure 7.
Comparison between motifs and structural patterns of airline networks.


Table 1.
Statistic information of motifs/anti-motifs of China’s passenger airline network.
| ID | Subgraph Shape | Frequency [Original] | rMean-Freq [Random] | Value Z | Value P | Subgraph Type |
|---|---|---|---|---|---|---|
| 3a |  | 17.260% | 12.314% | 10.079 | 0 | Motif |
| 3b |  | 82.740% | 87.686% | −10.079 | 1 | Anti-motif |
| 4a |  | 27.949% | 18.533% | 7.953 | 0.001 | Motif |
| 4b |  | 8.358% | 7.220% | 6.100 | 0 | Motif |
| 4c |  | 48.139% | 52.695% | −6.326 | 0.996 | Anti-motif |
| 4d |  | 2.650% | 1.356% | 11.474 | 0 | Motif |
| 4e |  | 0.690% | 3.527% | −6.710 | 0.998 | Anti-motif |
| 4f |  | 12.214% | 16.670% | −13.021 | 1 | Anti-motif |
Table 2.
Statistics of network motif conditions of airline companies in China’s passenger airline network.
Table 2.
Statistics of network motif conditions of airline companies in China’s passenger airline network.
| ID | Airline Company | Edges | Nodes | Foundation | Average Degree | Zipf | Hubs | Motifs or Anti-Motifs | |||||||
|---|---|---|---|---|---|---|---|---|---|---|---|---|---|---|---|
| 3a | 3b | 4a | 4b | 4c | 4d | 4e | 4f | ||||||||
 |  |  |  |  |  |  |  | ||||||||
| 1 | Air China (CA) | 770 | 139 | 1988 | 11.159 | 1.259 | 3 | √ | √ | √ | √ | ||||
| 2 | Beijing Capital Airlines (JD) | 176 | 59 | 2010 | 5.966 | 1.019 | 2 | √ | √ | √ | √ | ||||
| 3 | Chengdu Airlines (EU) | 72 | 42 | 2010 | 3.429 | 0.637 | 1 | √ | √ | ||||||
| 4 | China Eastern Airlines (MU) | 951 | 178 | 1988 | 10.807 | 1.198 | 4 | √ | √ | √ | √ | ||||
| 5 | China Express Airlines (G5) | 331 | 99 | 2006 | 6.755 | 0.999 | 3 | √ | √ | √ | √ | ||||
| 6 | China Southern Airlines (CZ) | 930 | 155 | 1995 | 12.078 | 1.245 | 4 | √ | √ | √ | √ | ||||
| 7 | China United Airlines (KN) | 64 | 54 | 1984 | 2.415 | 0.686 | 1 | √ | √ | √ | |||||
| 8 | Chongqing Airlines (OQ) | 27 | 24 | 2007 | 2.250 | 0.69 | 1 | √ | √ | √ | |||||
| 9 | Colorful Guizhou Airlines (CY) | 7 | 6 | 2015 | 2.333 | 0.677 | 0 | √ | √ | ||||||
| 10 | Donghai Airlines (DZ) | 28 | 19 | 2002 | 2.947 | 0.848 | 1 | √ | √ | ||||||
| 11 | Fuzhou Airlines (FU) | 26 | 22 | 2014 | 2.364 | 0.782 | 1 | √ | √ | √ | |||||
| 12 | Grand China Airlines (CN) | 17 | 20 | 2007 | 1.700 | 0.666 | 0 | √ | √ | ||||||
| 13 | Guangxi Beibu Gulf Airlines (GX) | 52 | 32 | 2015 | 3.355 | 0.709 | 1 | √ | √ | ||||||
| 14 | Hainan Airlines (HU) | 371 | 91 | 1993 | 8.244 | 1.169 | 1 | √ | √ | √ | √ | ||||
| 15 | Hebei Airlines (NS) | 253 | 58 | 2010 | 8.877 | 0.942 | 1 | √ | √ | √ | |||||
| 16 | Hongtu Airlines (A6) | 8 | 7 | 2014 | 2.286 | 0.769 | 0 | √ | √ | √ | |||||
| 17 | Jiangxi Airlines (RY) | 10 | 9 | 2014 | 2.222 | 0.866 | 0 | √ | √ | √ | |||||
| 18 | Joy Air (JR) | 107 | 58 | 2008 | 3.754 | 0.855 | 1 | √ | √ | √ | |||||
| 19 | Juneyao Airlines (HO) | 120 | 57 | 2005 | 4.286 | 0.89 | 1 | √ | √ | √ | √ | ||||
| 20 | Kunming Airlines (KY) | 270 | 65 | 2009 | 8.438 | 0.995 | 1 | √ | √ | √ | |||||
| 21 | Lucky Air (8L) | 83 | 48 | 2004 | 3.532 | 0.72 | 1 | √ | √ | √ | |||||
| 22 | 9Air (AQ) | 6 | 6 | 2014 | 2.000 | - | 0 | - | - | - | - | - | - | - | - |
| 23 | Okay Airways (BK) | 73 | 48 | 2005 | 3.042 | 0.802 | 2 | √ | √ | √ | |||||
| 24 | Qingdao Airlines (QW) | 25 | 18 | 2013 | 2.778 | 0.671 | 1 | √ | √ | ||||||
| 25 | Ruili Airlines (DR) | 26 | 20 | 2014 | 2.600 | 0.675 | 1 | √ | √ | √ | |||||
| 26 | Shandong Airlines (SC) | 565 | 131 | 1999 | 8.692 | 1.2 | 3 | √ | √ | √ | √ | ||||
| 27 | Shanghai Airlines (FM) | 110 | 67 | 1985 | 3.333 | 0.709 | 1 | √ | √ | √ | |||||
| 28 | Shenzhen Airlines (ZH) | 533 | 116 | 1992 | 9.434 | 1.276 | 3 | √ | √ | √ | √ | ||||
| 29 | Sichuan Airlines (3U) | 313 | 98 | 1986 | 6.454 | 1.001 | 2 | √ | √ | √ | √ | ||||
| 30 | Spring Airlines (9C) | 32 | 23 | 2004 | 2.909 | 0.574 | 1 | √ | √ | ||||||
| 31 | Tianjin Airlines (GS) | 225 | 91 | 2009 | 5.000 | 0.943 | 3 | √ | √ | √ | √ | ||||
| 32 | Tibet Airlines (TV) | 80 | 48 | 2010 | 3.404 | 0.964 | 1 | √ | √ | √ | |||||
| 33 | Urumqi Air (UQ) | 17 | 14 | 2014 | 2.429 | 0.893 | 1 | √ | √ | √ | |||||
| 34 | Western Airlines (PN) | 66 | 40 | 2006 | 3.300 | 0.836 | 1 | √ | √ | √ | |||||
| 35 | Xiamen Airlines (MF) | 754 | 120 | 1984 | 12.672 | 1.277 | 1 | √ | √ | √ | |||||
| 36 | Yangtze River Airline (Y8) | 4 | 5 | 2002 | 1.600 | 0.765 | 0 | √ | √ | √ | |||||
| 37 | Zhejiang Loong Airlines (GJ) | 58 | 39 | 2011 | 2.974 | 0.743 | 1 | √ | √ | √ | |||||
Table 3.
Structural characteristics of motifs of China’s passenger airline network.
| Motif | Structural Characteristics | Combination and Upgrade Relations | Number of Airlines | Definition of the Motifs |
|---|---|---|---|---|
 | Triangular, ring | Minimum building block | 26/36 | Common motif; Advantageous motif |
 | Star, chain | Minimum building block | 10/36 | Characteristic motif of immature network; disadvantageous motif |
 | Mesh | Combination of 3a and 3b | 31/36 | Common motif; Advantageous motif |
 | Mesh | Combination of 3a Upgrade of 4a | 12/36 | Characteristic motif of mature network; advantageous motif |
 | Star | Combination of 3b | 13/36 | Characteristic motif of small network scale; disadvantageous motif |
 | Fully connected | Combination of 3a Upgrade of 4a and 4b | 15/36 | Characteristic motif of mature network; advantageous motif |
 | Quadrangle, Ring | Combination of 3b | 3/36 | Highly specific motif; disadvantageous motif |
 | Chain | Combination of 3b | 2/36 | Highly specific motif; disadvantageous motif |
© 2019 by the authors. Licensee MDPI, Basel, Switzerland. This article is an open access article distributed under the terms and conditions of the Creative Commons Attribution (CC BY) license (http://creativecommons.org/licenses/by/4.0/).
Share and Cite
MDPI and ACS Style
Jin, Y.; Wei, Y.; Xiu, C.; Song, W.; Yang, K. Study on Structural Characteristics of China’s Passenger Airline Network Based on Network Motifs Analysis. Sustainability 2019, 11, 2484. https://0-doi-org.brum.beds.ac.uk/10.3390/su11092484
AMA Style
Jin Y, Wei Y, Xiu C, Song W, Yang K. Study on Structural Characteristics of China’s Passenger Airline Network Based on Network Motifs Analysis. Sustainability. 2019; 11(9):2484. https://0-doi-org.brum.beds.ac.uk/10.3390/su11092484
Chicago/Turabian StyleJin, Ying, Ye Wei, Chunliang Xiu, Wei Song, and Kaixian Yang. 2019. "Study on Structural Characteristics of China’s Passenger Airline Network Based on Network Motifs Analysis" Sustainability 11, no. 9: 2484. https://0-doi-org.brum.beds.ac.uk/10.3390/su11092484
Note that from the first issue of 2016, this journal uses article numbers instead of page numbers. See further details here.