Coupling a Building Energy Simulation Tool with a Microclimate Model to Assess the Impact of Cool Pavements on the Building’s Energy Performance Application in a Dense Residential Area


Abstract
:1. Introduction
- The increase of solar reflectance can be achieved through various techniques including: (a) the addition of light color aggregates [27], (b) the use of light colored paints that are highly reflective in the visible wavelengths [28,29], (c) the use of light-colored pigments on coatings so as to increase the solar reflectance in the near-infrared wavelengths [30,31] and (d) the creation of thermochromic coatings, that thermally respond to the conditions of the outside environment, changing reversibly their color as the outside Tair rises [32]. In the current study, existing experimental results of the second and the third category will be further used for the analysis (see Section 3: Materials and Methods)
- Cool materials, presenting high albedo values, can be also implemented in the components of the building envelope, involving roofs and vertical facades. Yet, the assessment of such applications is out of the scope of this study and only the high albedo pavements (i.e., applications on the urban ground surfaces) will be examined.
Aim of the Study
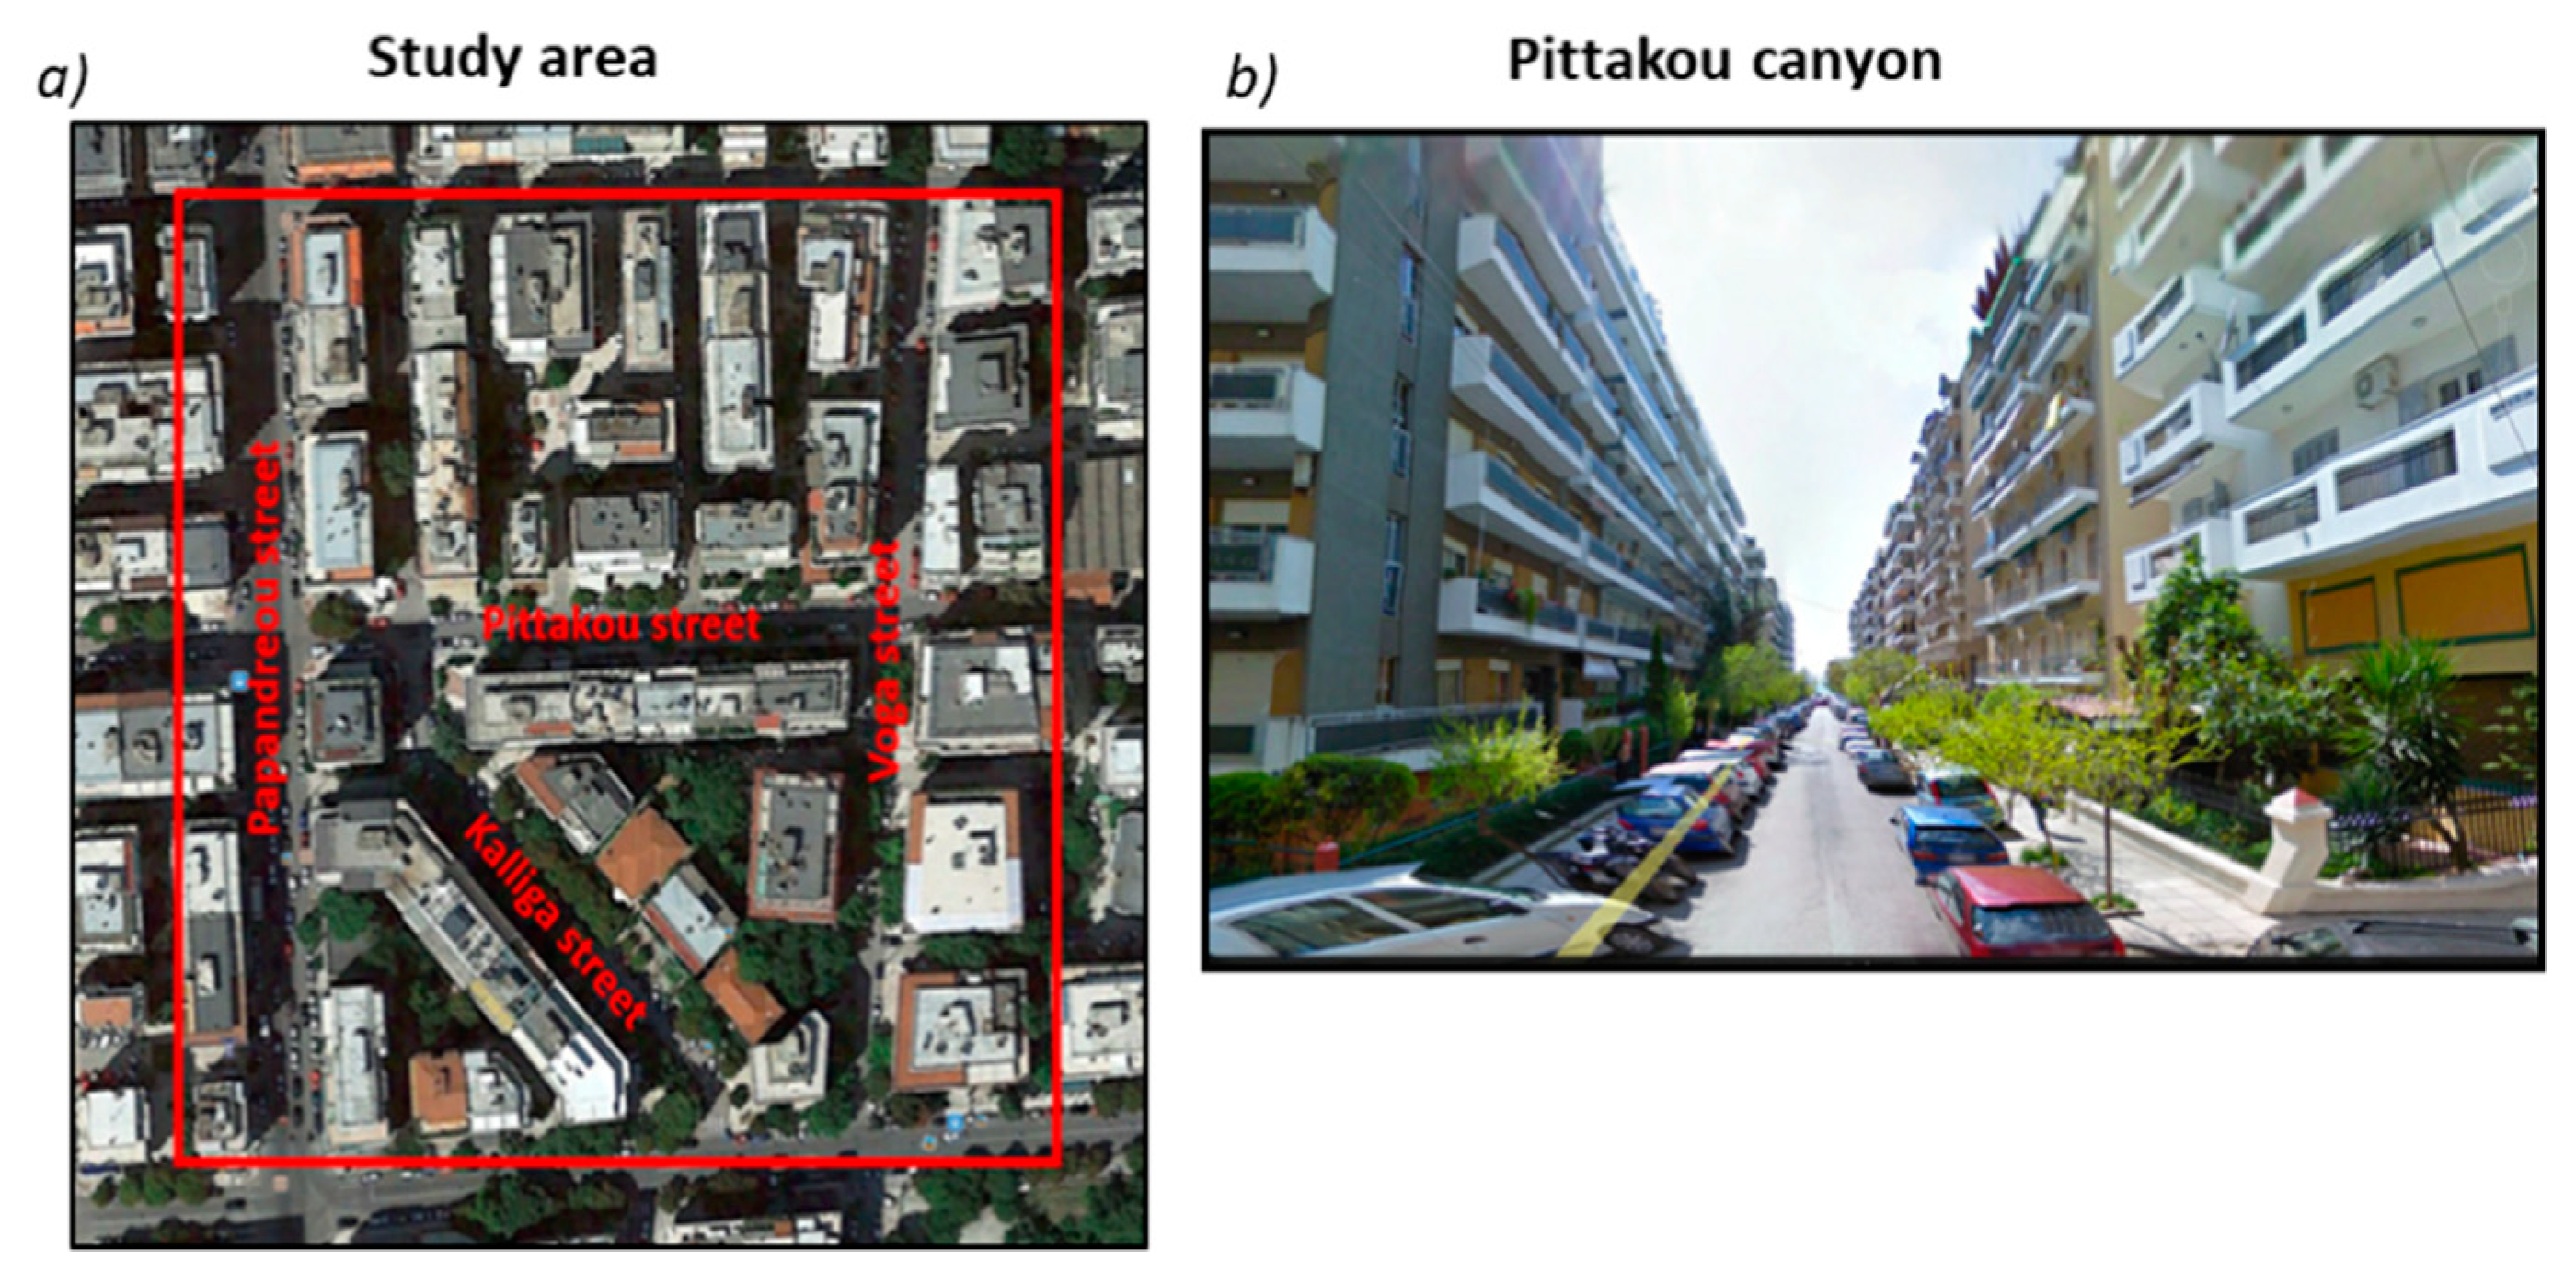
2. Case Study Area
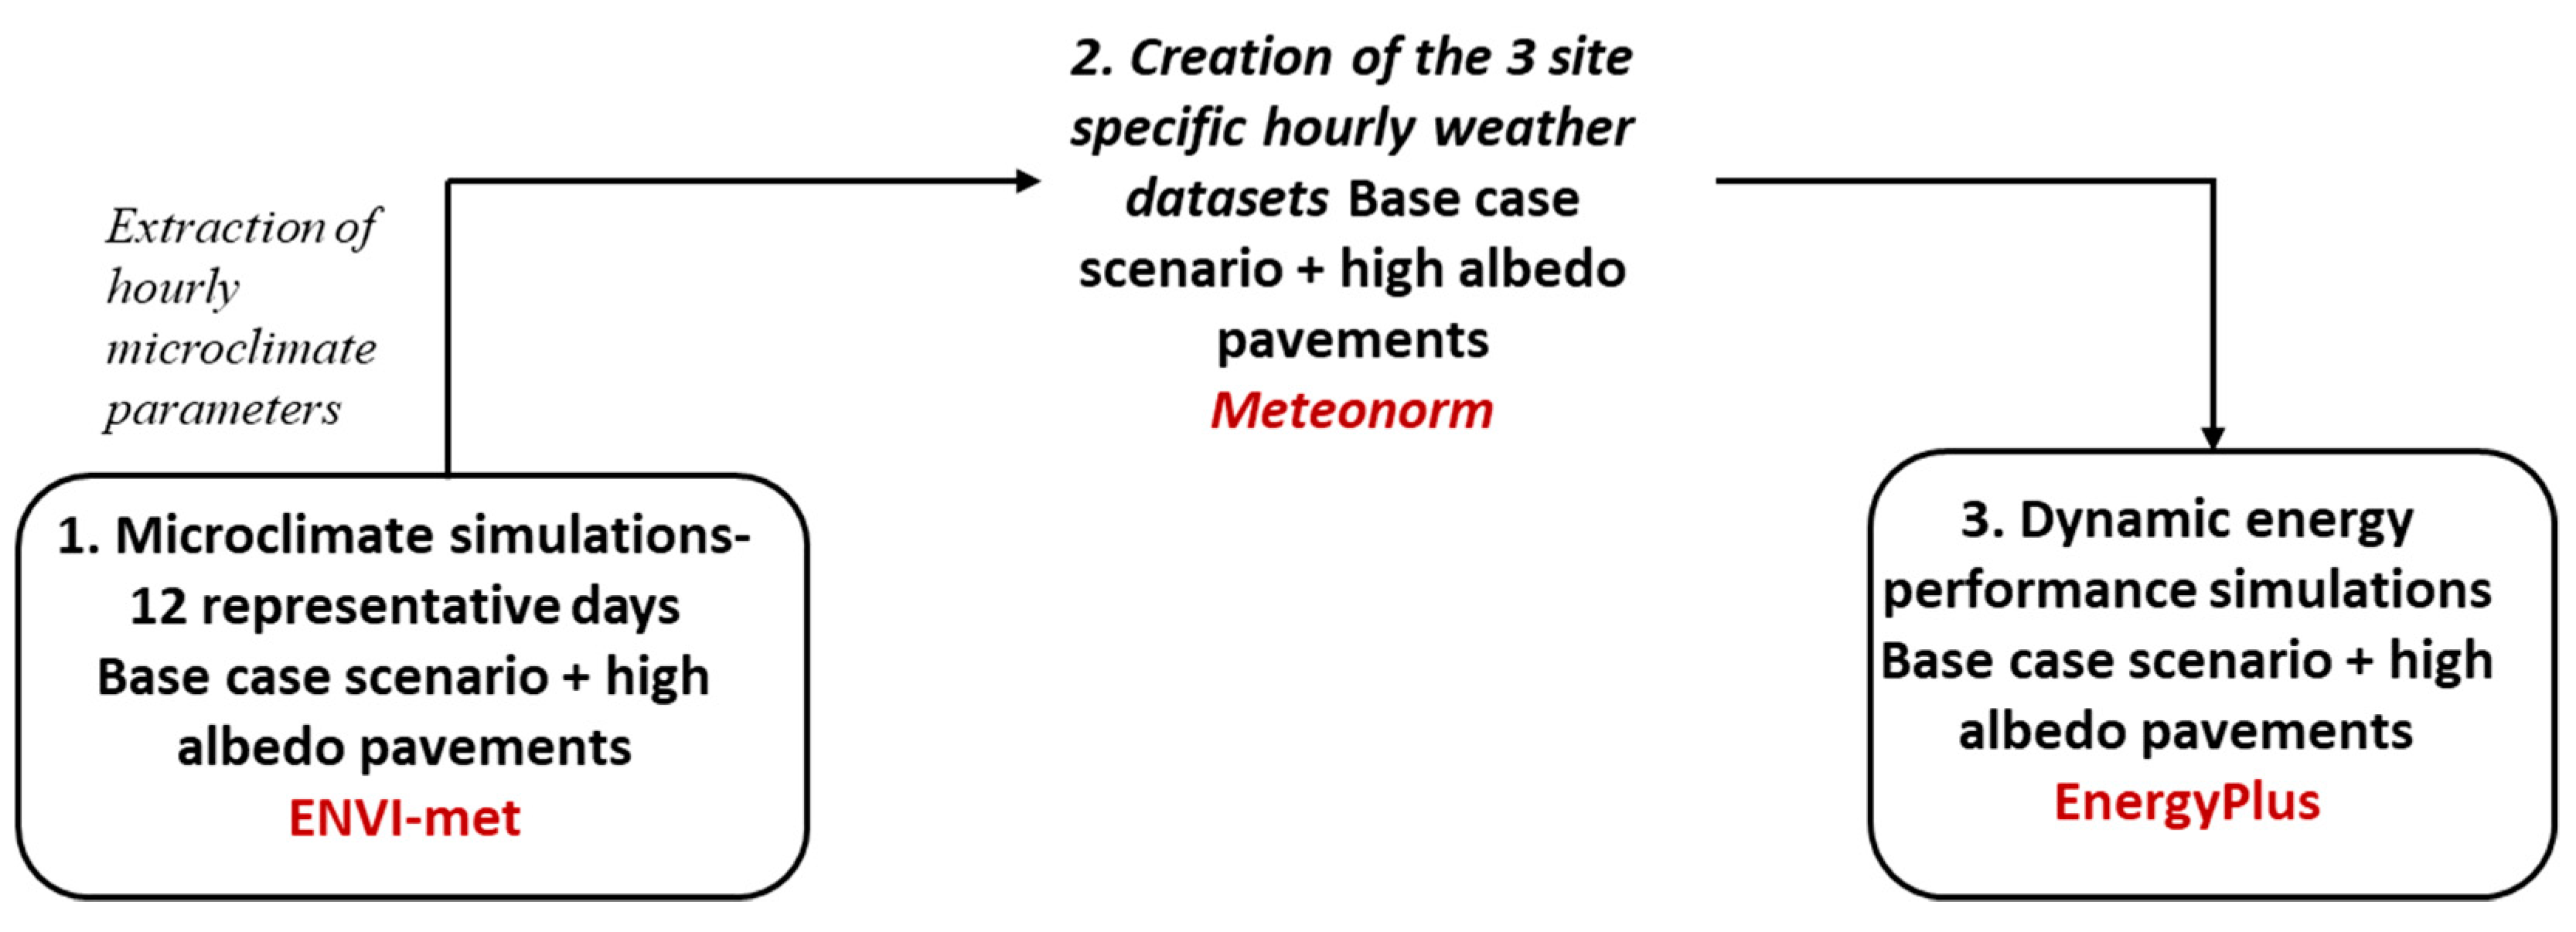
3. Materials and Methods
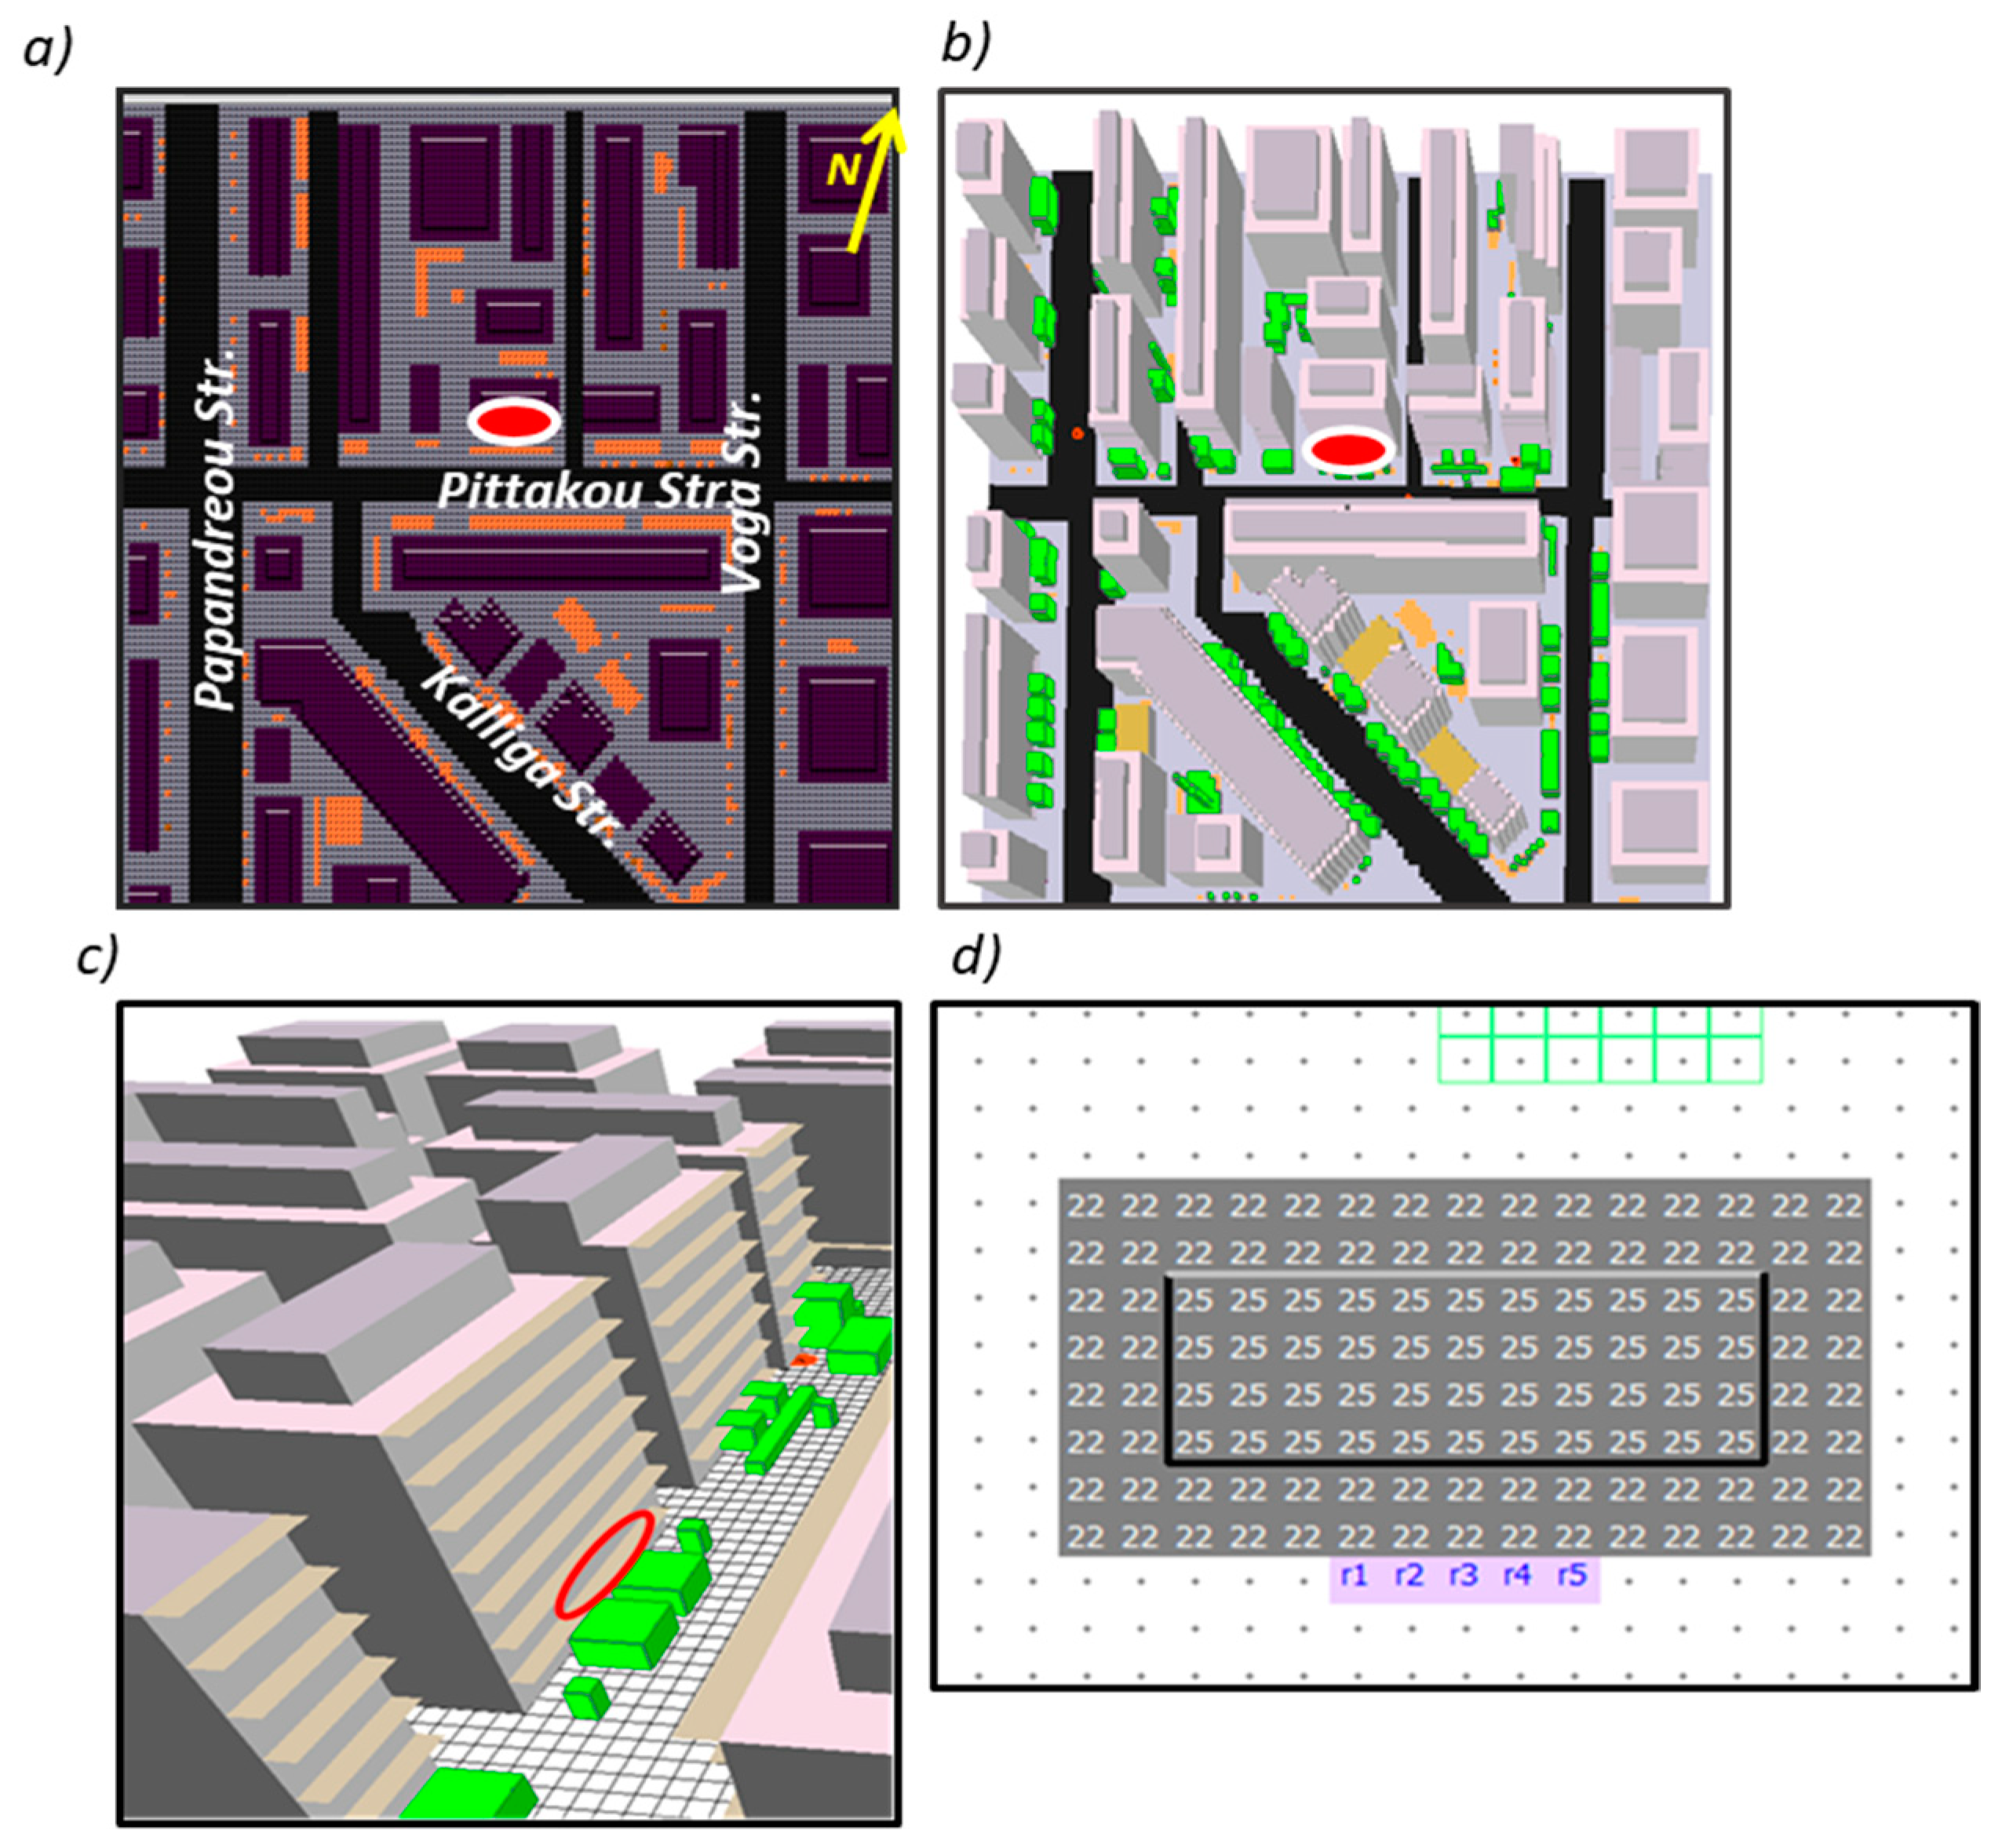
3.1. Modeling the Urban Microclimate of the Case Study Area in ENVI-met.v.4 and Extraction of the Microclimate Parameters
- BC-Base case scenario: Base case scenario, in which the urban ground surfaces are covered by conventional asphalt and concrete pavements, the albedo of which is set to 0.12 and 0.30 respectively. The adopted values are based on the existing literature (see Table 1)
- Des.CM-Design cool materials scenario: the conventional asphalt and concrete pavements are replaced with the corresponding cool ones, having their design albedo values of 0.40 and 0.70 respectively. The considered design values of cool materials’ albedo are the initial ones before any weathering phenomena whereas the adopted values are based on the existing literature (see Table 1). In the current research, changes on the albedo value are considered to be due to the overlaying of thin light-colored topping as an extra layer over the existing pavements.
- Aged.CM-Aged cool materials scenario: the high albedo asphalt and pavements are considered to have lost their initial reflectivity by 40% and 15% respectively, due to the weathering and ageing process (values based on the observations of Lontorfos et al. [58]).
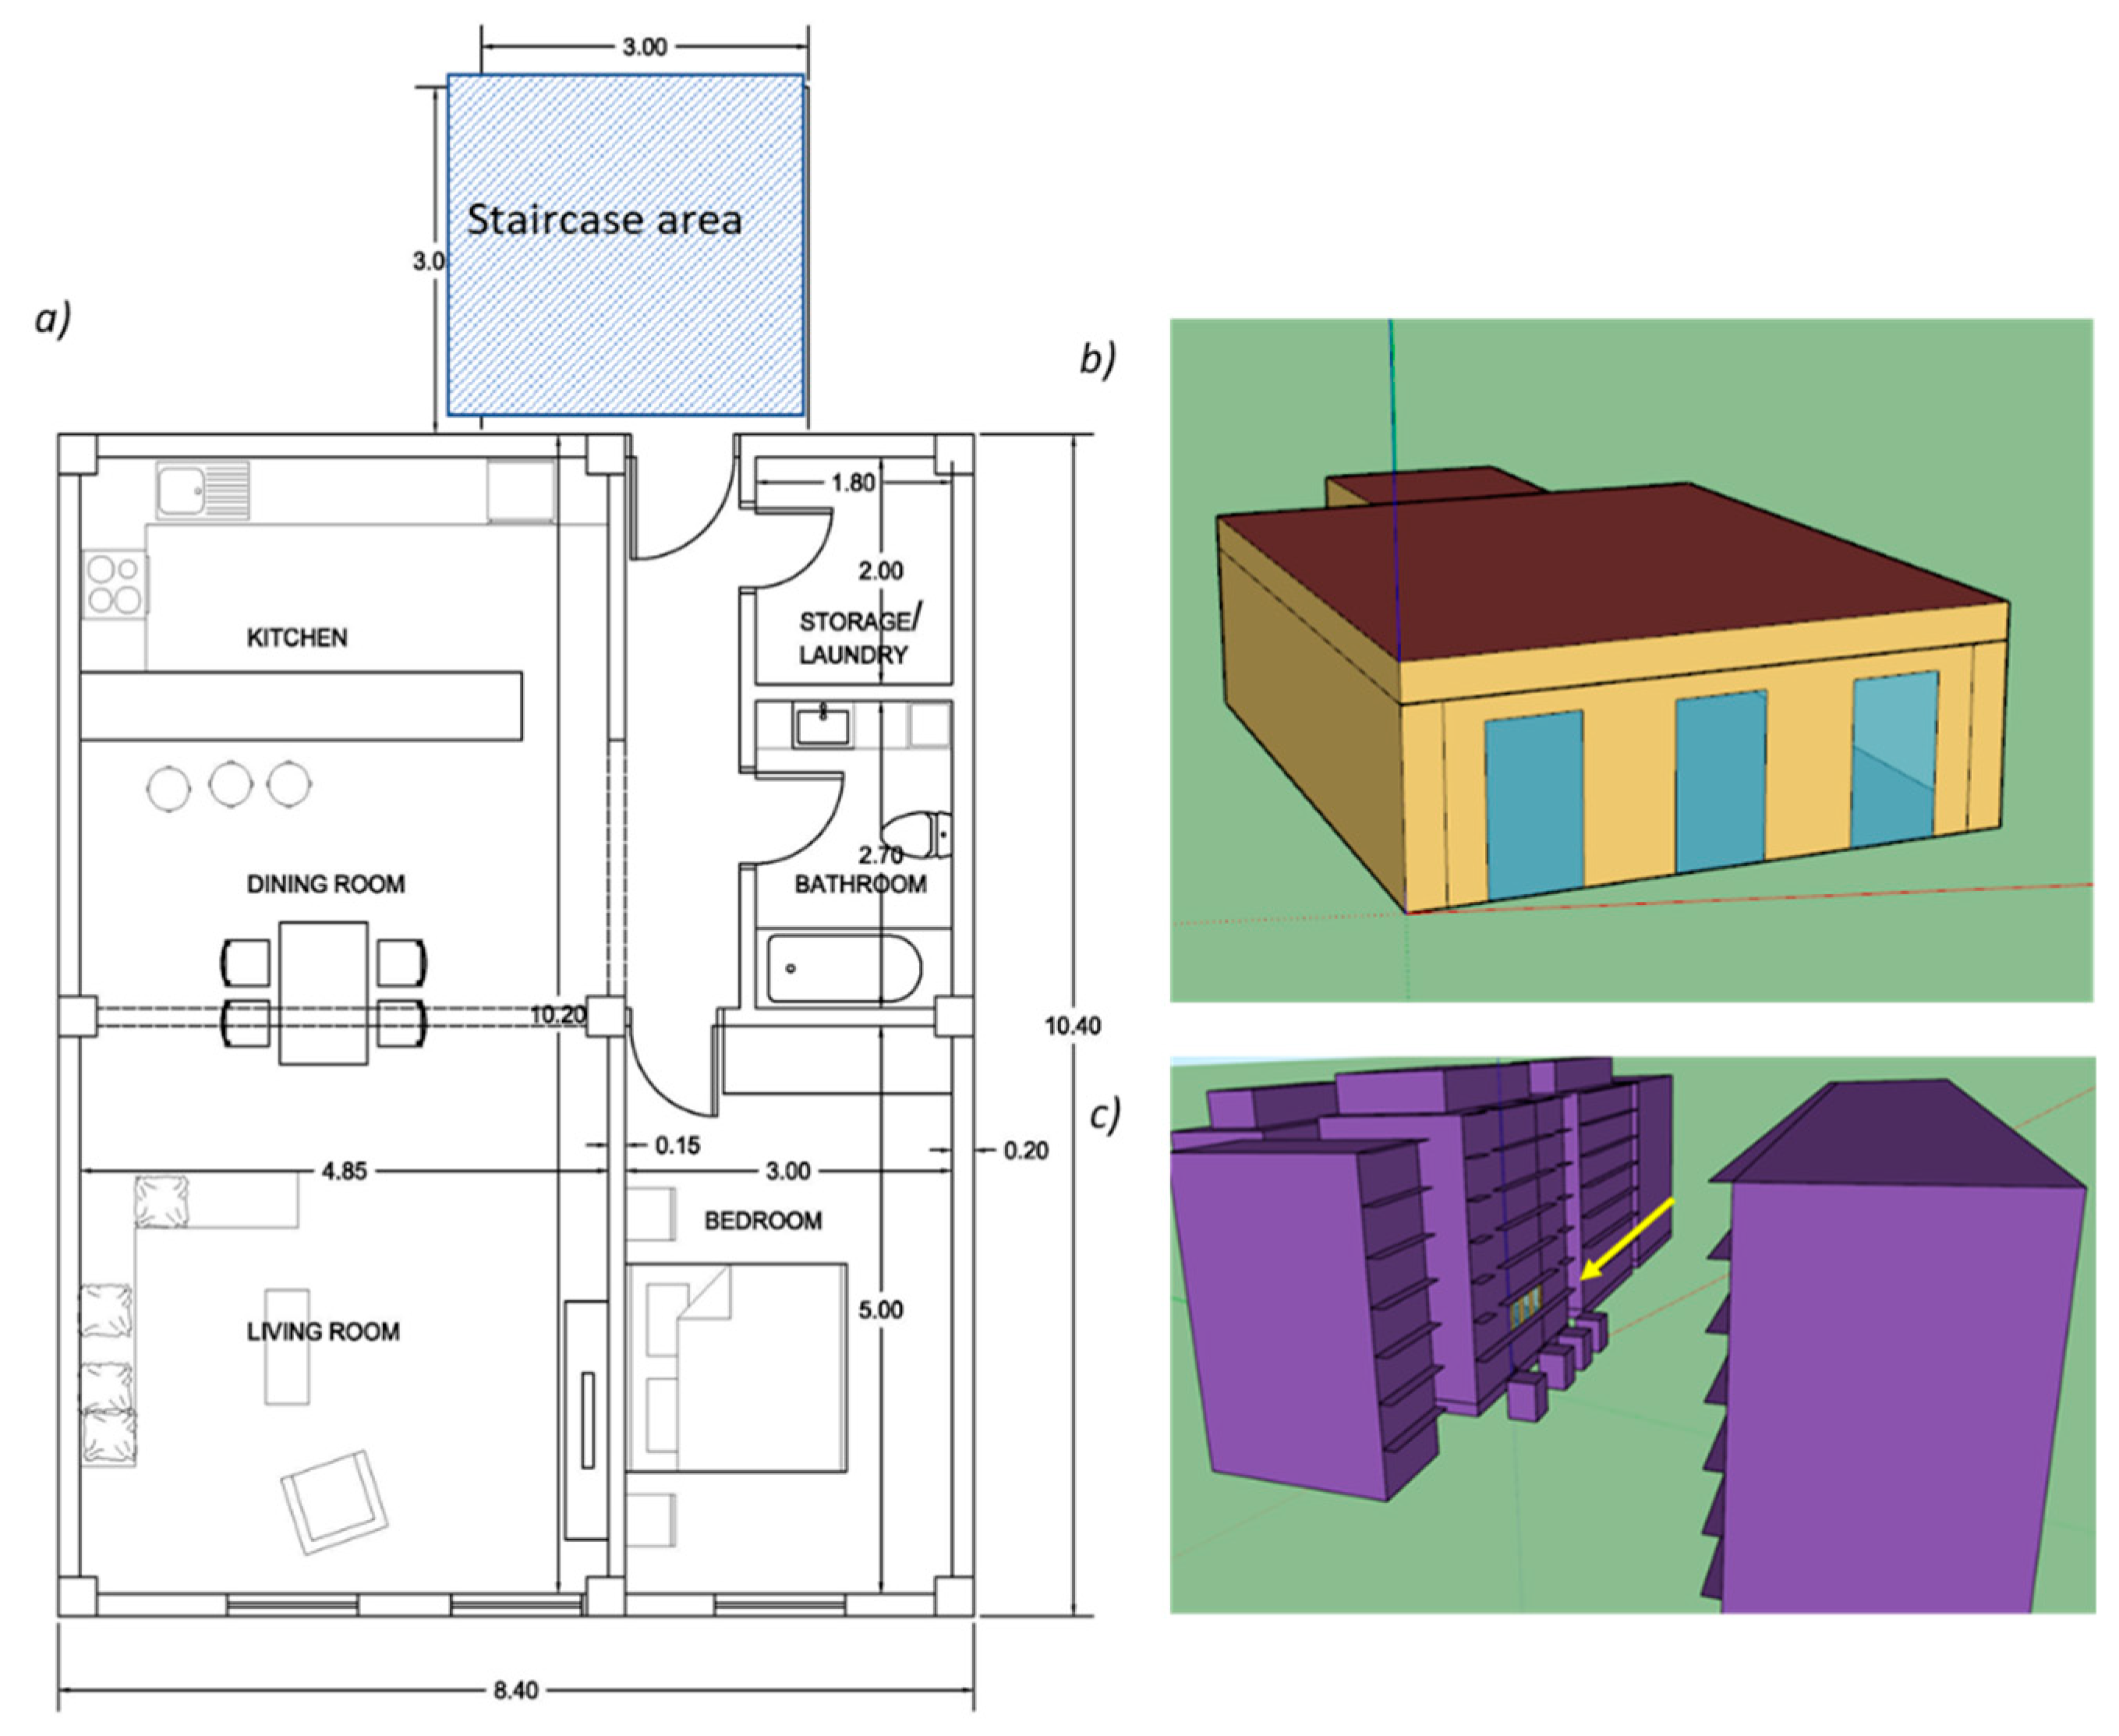
3.2. Development of the Thermal Model of the Examined Building Unit in the EnergyPlus Model and Dynamic Energy Performance Simulations Using the USWDs
4. Results and Discussion
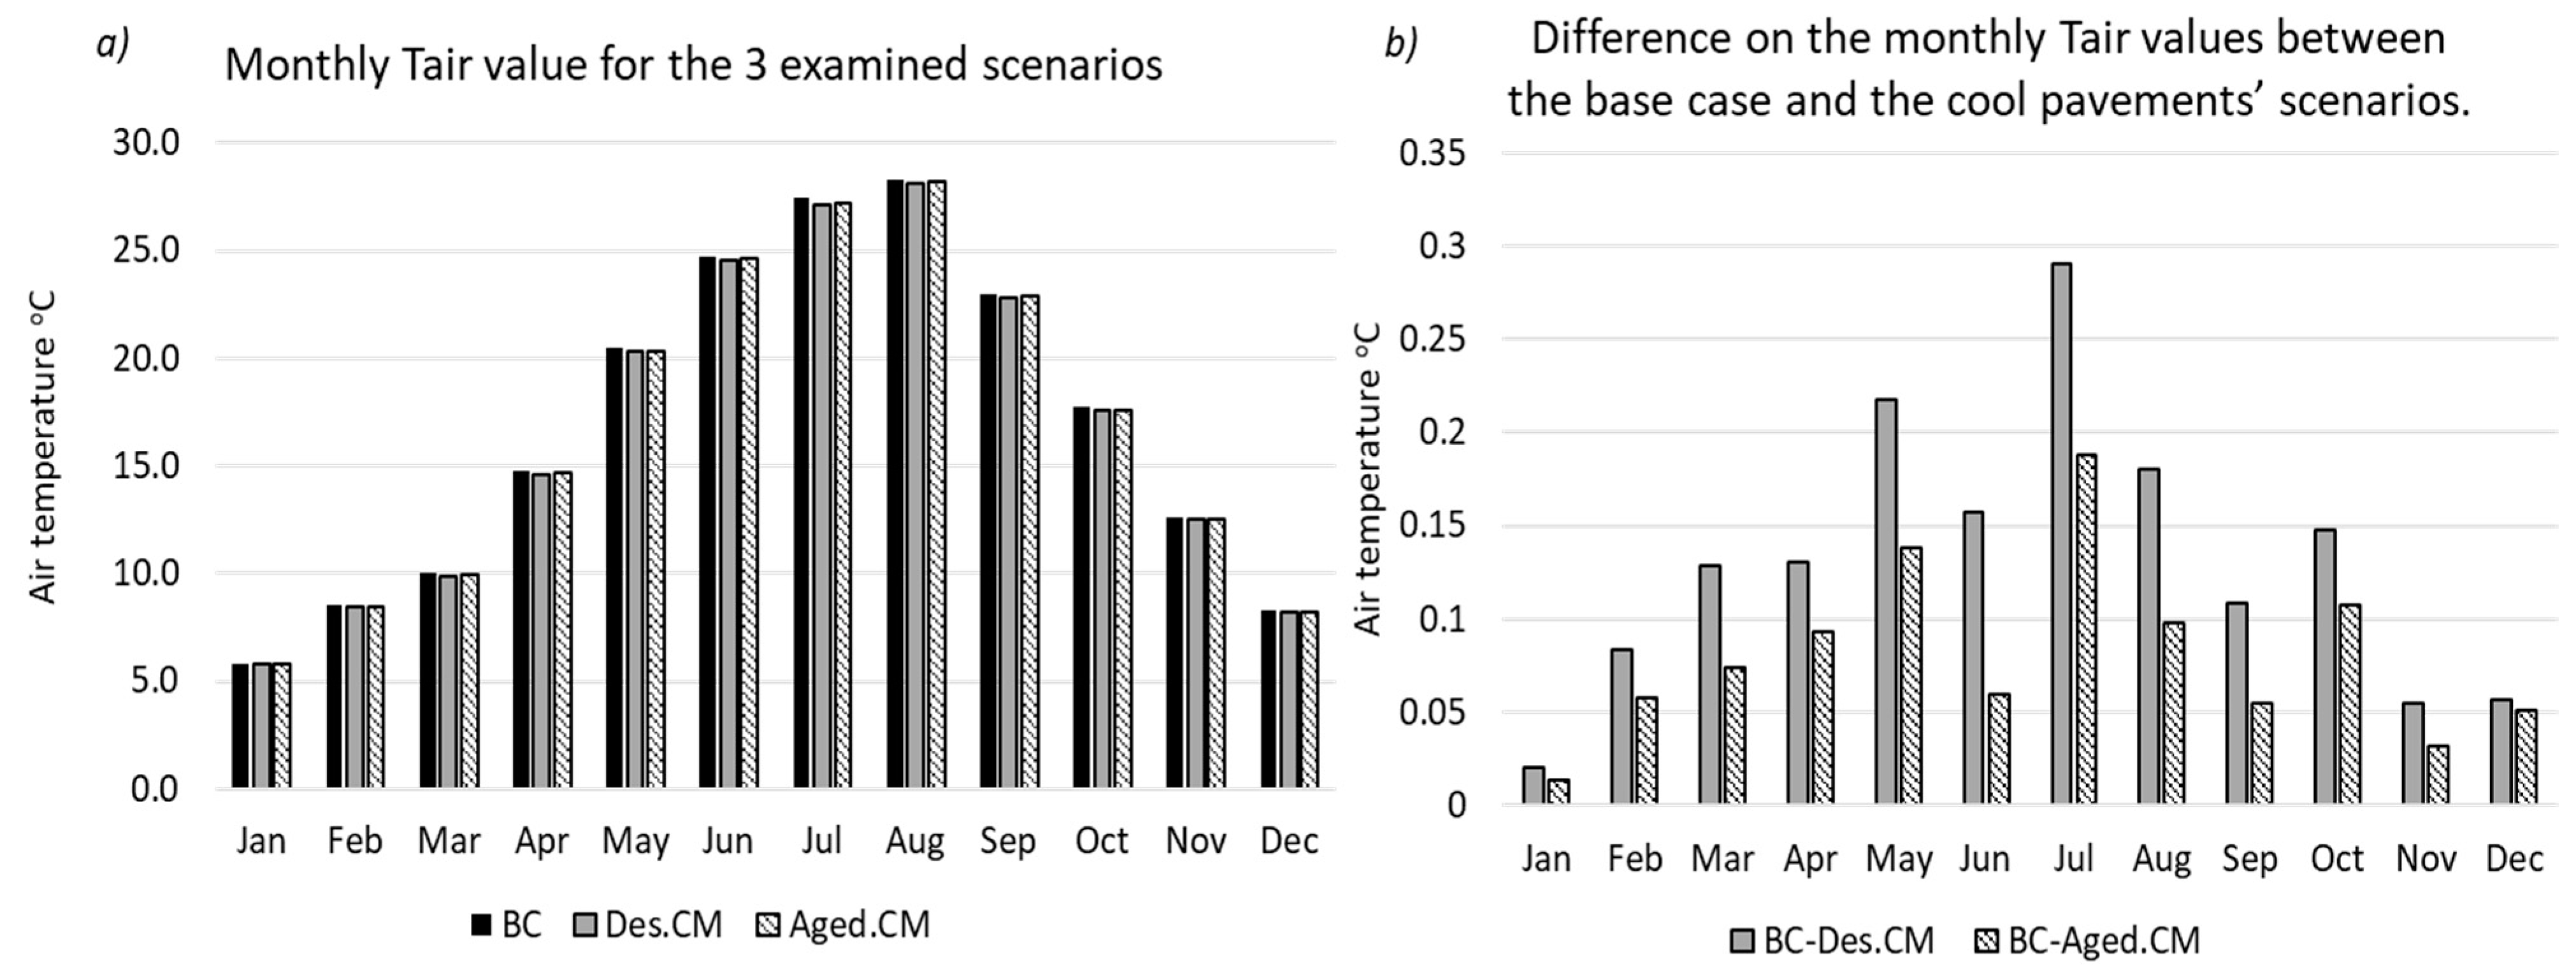
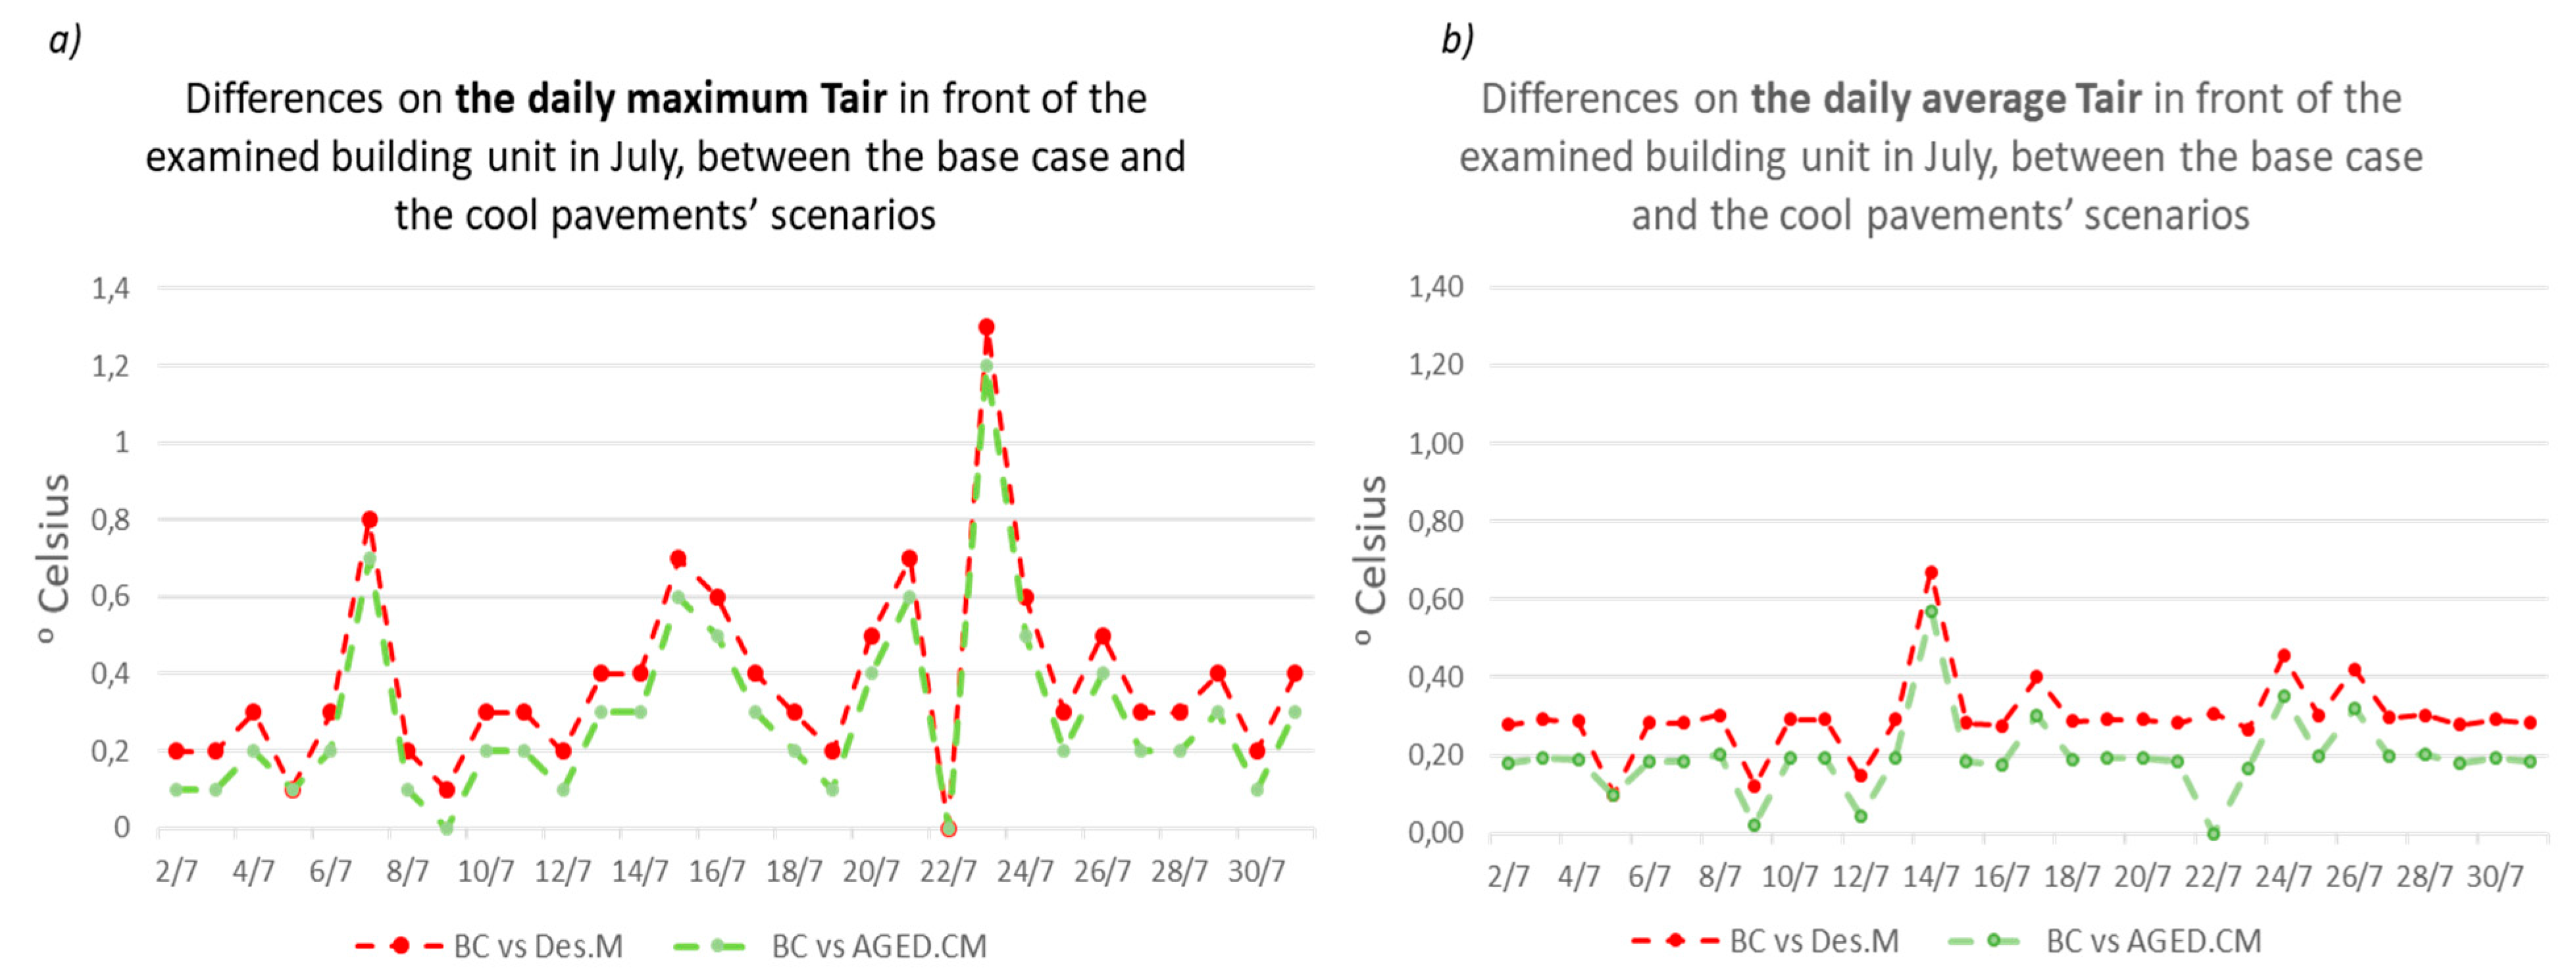
4.1. Effect of the High Albedo Materials on the Average Monthly Air Temperature
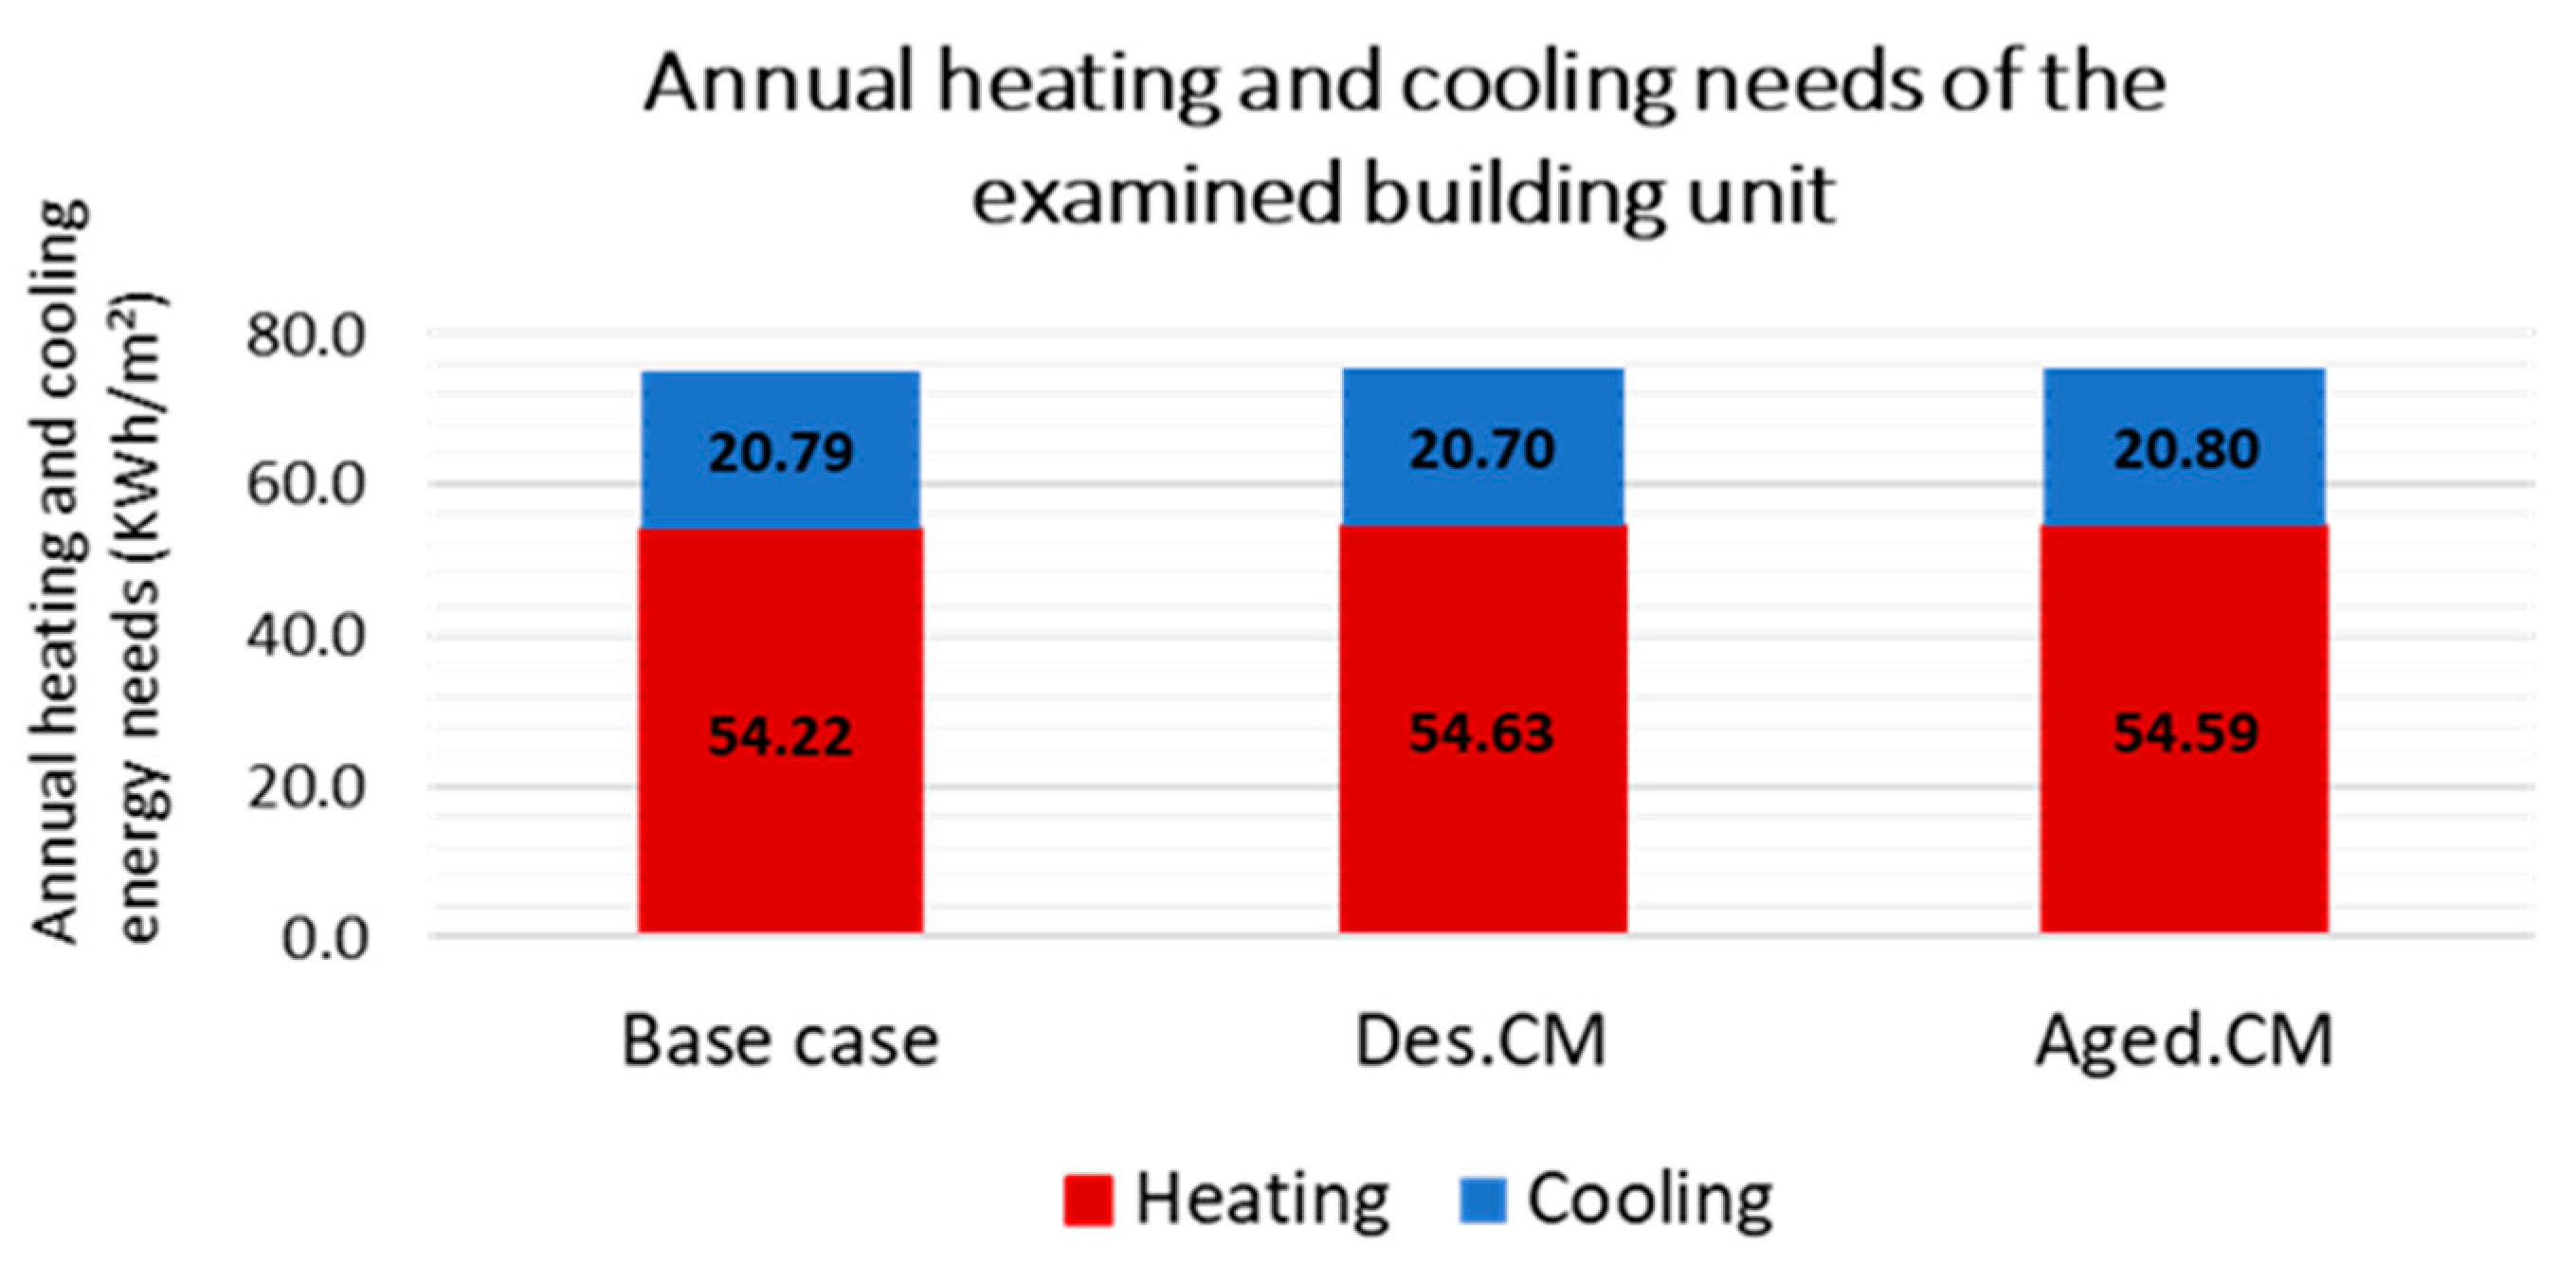
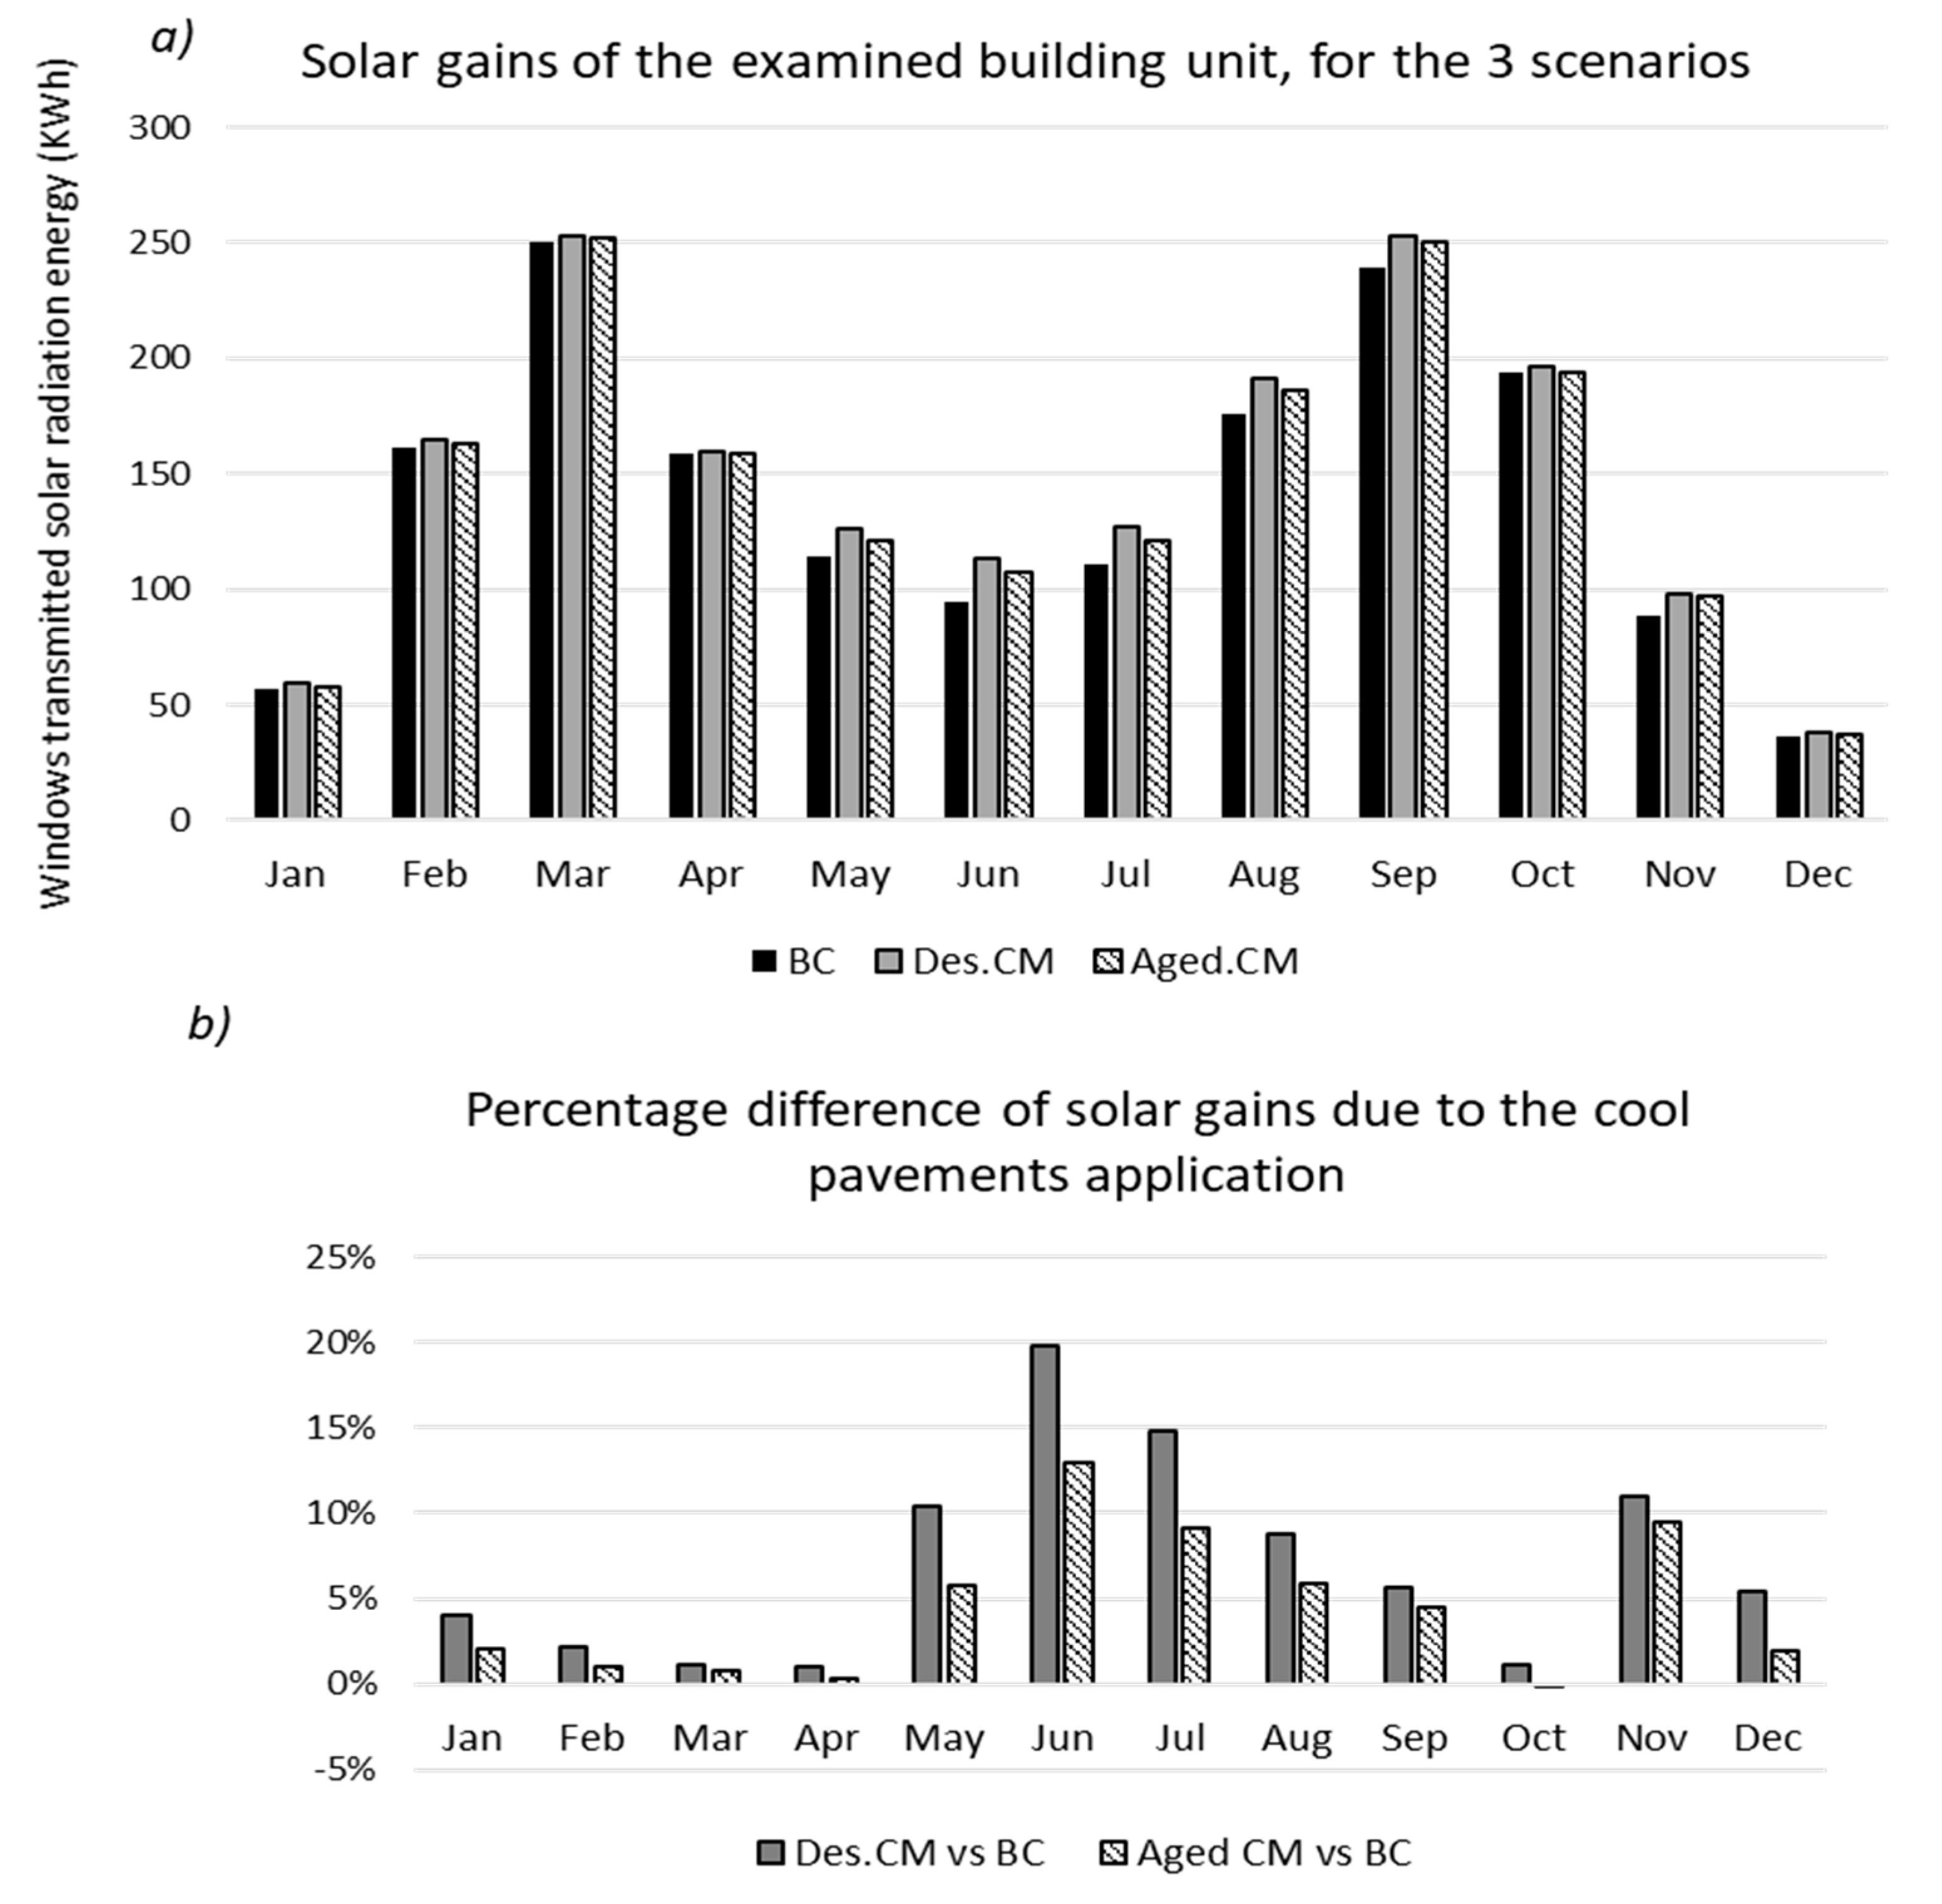
4.2. Effect of the High Albedo Pavements on the Building Unit’s Heating and Cooling Energy Needs
5. Conclusions
Author Contributions
Funding
Acknowledgments
Conflicts of Interest
References
- Rizwan, A.M.; Dennis, L.Y.; Chunho, L. A review on the generation, determination and mitigation of Urban Heat Island. J. Environ. Sci. 2008, 20, 120–128. [Google Scholar] [CrossRef]
- Grimmond, S. Urbanization and global environmental change: Local effects of urban warming. Geogr. J. 2007, 173, 83–88. [Google Scholar] [CrossRef]
- O’Malley, C.; Piroozfar, P.; Farr, E.R.; Pomponi, F. Urban Heat Island (UHI) mitigating strategies: A case-based comparative analysis. Sustain. Cities Soc. 2015, 19, 222–235. [Google Scholar] [CrossRef]
- Santamouris, M. Analyzing the heat island magnitude and characteristics in one hundred Asian and Australian cities and regions. Sci. Total Environ. 2015, 512, 582–598. [Google Scholar] [CrossRef] [PubMed]
- Stewart, I.D. A systematic review and scientific critique of methodology in modern urban heat island literature. Int. J. Climatol. 2011, 31, 200–217. [Google Scholar] [CrossRef]
- Stathopoulou, M.; Cartalis, C. Daytime urban heat islands from Landsat ETM+ and Corine land cover data: An application to major cities in Greece. Sol. Energy 2007, 81, 358–368. [Google Scholar] [CrossRef]
- Giannaros, T.M.; Melas, D. Study of the urban heat island in a coastal Mediterranean City: The case study of Thessaloniki, Greece. Atmos. Res. 2012, 118, 103–120. [Google Scholar] [CrossRef]
- Papamanolis, N. The main characteristics of the urban climate and the air quality in Greek cities. Urban Clim. 2015, 12, 49–64. [Google Scholar] [CrossRef]
- Sarrat, C.; Lemonsu, A.; Masson, V.; Guedalia, D. Impact of urban heat island on regional atmospheric pollution. Atmos. Environ. 2006, 40, 1743–1758. [Google Scholar] [CrossRef]
- Lai, L.-W.; Cheng, W.-L. Air quality influenced by urban heat island coupled with synoptic weather patterns. Sci. Total Environ. 2009, 407, 2724–2733. [Google Scholar] [CrossRef] [PubMed]
- Ali-Toudert, F.; Mayer, H. Numerical study on the effects of aspect ratio and orientation of an urban street canyon on outdoor thermal comfort in hot and dry climate. Build. Environ. 2006, 41, 94–108. [Google Scholar] [CrossRef]
- Chen, L.; Ng, E. Simulation of the effect of downtown greenery on thermal comfort in subtropical climate using PET index: A case study in Hong Kong. Archit. Sci. Rev. 2013, 56, 297–305. [Google Scholar] [CrossRef]
- Taleghani, M.; Berardi, U. The effect of pavement characteristics on pedestrians’ thermal comfort in Toronto. Urban Clim. 2018, 24, 449–459. [Google Scholar] [CrossRef]
- Fanchiotti, A.; Carnielo, E.; Zinzi, M. Impact of cool materials on urban heat islands and on buildings comfort and energy consumption. In Proceedings of the ASES Conference, Denver, CO, USA, 9–12 October 2017. [Google Scholar]
- Kolokotroni, M.; Zhang, Y.; Watkins, R.J.S.E. The London heat island and building cooling design. Sol. Energy 2007, 81, 102–110. [Google Scholar] [CrossRef]
- Street, M.; Reinhart, C.; Norford, L.; Ochsendorf, J. Urban heat island in Boston–An evaluation of urban air-temperature models for predicting building energy use. In Proceedings of the BS2013: 13th Conference of International Building Performance Simulation Association, Chambéry, France, 26–28 August 2013; pp. 1022–1029. [Google Scholar]
- Tsikaloudaki, K.; Laskos, K.; Bikas, D. On the establishment of climatic zones in Europe with regard to the energy performance of buildings. Energies 2011, 5, 32–44. [Google Scholar] [CrossRef]
- Kapsomenakis, J.; Kolokotsa, D.; Nikolaou, T.; Santamouris, M.; Zerefos, S. Forty years increase of the air ambient temperature in Greece: The impact on buildings. Energy Convers. Manag. 2013, 74, 353–365. [Google Scholar] [CrossRef]
- Jentsch, M.F.; Bahaj, A.S.; James, P.A. Climate change future proofing of buildings—Generation and assessment of building simulation weather files. Energy Build. 2008, 40, 2148–2168. [Google Scholar] [CrossRef]
- Akbari, H.; Cartalis, C.; Kolokotsa, D.; Muscio, A.; Pisello, A.L.; Rossi, F.; Santamouris, M.; Synnefa, A.; Wong, N.H.; Zinzi, M. Local climate change and urban heat island mitigation techniques—The state of the art. J. Civ. Eng. Manag. 2016, 22, 1–16. [Google Scholar] [CrossRef]
- Santamouris, M. Regulating the damaged thermostat of the cities—Status, impacts and mitigation challenges. Energy Build. 2015, 91, 43–56. [Google Scholar] [CrossRef]
- Santamouris, M. Using cool pavements as a mitigation strategy to fight urban heat island—A review of the actual developments. Renew. Sustain. Energy Rev. 2013, 26, 224–240. [Google Scholar] [CrossRef]
- Qin, Y. A review on the development of cool pavements to mitigate urban heat island effect. Renew. Sustain. Energy Rev. 2015, 52, 445–459. [Google Scholar] [CrossRef]
- Santamouris, M.; Synnefa, A.; Karlessi, T. Using advanced cool materials in the urban built environment to mitigate heat islands and improve thermal comfort conditions. Sol. Energy 2011, 85, 3085–3102. [Google Scholar] [CrossRef]
- Synnefa, A.; Dandou, A.; Santamouris, M.; Tombrou, M.; Soulakellis, N. On the use of cool materials as a heat island mitigation strategy. J. Appl. Meteorol. Climatol. 2008, 47, 2846–2856. [Google Scholar] [CrossRef]
- Synnefa, A.; Santamouris, M.; Livada, I. A study of the thermal performance of reflective coatings for the urban environment. Sol. Energy 2006, 80, 968–981. [Google Scholar] [CrossRef]
- Doulos, L.; Santamouris, M.; Livada, I. Passive cooling of outdoor urban spaces. The role of materials. Sol. Energy 2004, 77, 231–249. [Google Scholar] [CrossRef]
- Uemoto, K.L.; Sato, N.M.; John, V.M. Estimating thermal performance of cool colored paints. Energy Build. 2010, 42, 17–22. [Google Scholar] [CrossRef]
- Pacheco-Torgal, F.; Labrincha, J.; Cabeza, L.; Granqvist, C.G. Eco-Efficient Materials for Mitigating Building Cooling Needs: Design, Properties and Applications; Woodhead Publishing: Cambridge, UK, 2015. [Google Scholar]
- Synnefa, A.; Santamouris, M.; Apostolakis, K. On the development, optical properties and thermal performance of cool colored coatings for the urban environment. Sol. Energy 2007, 81, 488–497. [Google Scholar] [CrossRef]
- Kinouchi, T.; Yoshinaka, T.; Fukae, N.; Kanda, M. 4.7 Development of cool pavement with dark colored high albedo coating. Target 2003, 50, 40. [Google Scholar]
- Karlessi, T.; Santamouris, M.; Apostolakis, K.; Synnefa, A.; Livada, I. Development and testing of thermochromic coatings for buildings and urban structures. Sol. Energy 2009, 83, 538–551. [Google Scholar] [CrossRef]
- Li, H.; Harvey, J.; Kendall, A. Field measurement of albedo for different land cover materials and effects on thermal performance. Build. Environ. 2013, 59, 536–546. [Google Scholar] [CrossRef]
- Pomerantz, M.; Pon, B.; Akbari, H.; Chang, S. The Effect of Pavements’ Temperatures on Air Temperatures in Large Cities; LBNL-43442; Lawrence Berkeley National Laboratory: Berkeley, CA, USA, 2000. [Google Scholar]
- Sen, S.; Roesler, J. Aging albedo model for asphalt pavement surfaces. J. Clean. Prod. 2016, 117, 169–175. [Google Scholar] [CrossRef]
- Santero, N.J.; Masanet, E.; Horvath, A. Life-cycle assessment of pavements Part II: Filling the research gaps. Resour. Conserv. Recycl. 2011, 55, 810–818. [Google Scholar] [CrossRef]
- Levinson, R.; Akbari, H. Effects of composition and exposure on the solar reflectance of portland cement concrete. Cem. Concr. Res. 2002, 32, 1679–1698. [Google Scholar] [CrossRef]
- Chatzidimitriou, A.; Yannas, S. Microclimate development in open urban spaces: The influence of form and materials. Energy Build. 2015, 108, 156–174. [Google Scholar] [CrossRef]
- Synnefa, A.; Karlessi, T.; Gaitani, N.; Santamouris, M.; Assimakopoulos, D.; Papakatsikas, C. Experimental testing of cool colored thin layer asphalt and estimation of its potential to improve the urban microclimate. Build. Environ. 2011, 46, 38–44. [Google Scholar] [CrossRef]
- Bretz, S.; Akbari, H.; Rosenfeld, A. Practical issues for using solar-reflective materials to mitigate urban heat islands. Atmos. Environ. 1998, 32, 95–101. [Google Scholar] [CrossRef]
- Salata, F.; Golasi, I.; de Lieto Vollaro, A.; de Lieto Vollaro, R. How high albedo and traditional buildings’ materials and vegetation affect the quality of urban microclimate. A case study. Energy Build. 2015, 99, 32–49. [Google Scholar] [CrossRef]
- Kyriakodis, G.; Santamouris, M. Using reflective pavements to mitigate urban heat island in warm climates-Results from a large scale urban mitigation project. Urban Clim. 2017, 34, 326–339. [Google Scholar] [CrossRef]
- Emmanuel, R.; Fernando, H. Urban heat islands in humid and arid climates: Role of urban form and thermal properties in Colombo, Sri Lanka and Phoenix, USA. Clim. Res. 2007, 34, 241–251. [Google Scholar] [CrossRef]
- Wang, Y.; Berardi, U.; Akbari, H. Comparing the effects of urban heat island mitigation strategies for Toronto, Canada. Energy Build. 2016, 114, 2–19. [Google Scholar] [CrossRef]
- Taleghani, M.; Sailor, D.; Ban-Weiss, G.A. Micrometeorological simulations to predict the impacts of heat mitigation strategies on pedestrian thermal comfort in a Los Angeles neighborhood. Environ. Res. Lett. 2016, 11, 024003. [Google Scholar] [CrossRef]
- Tsoka, S.; Tsikaloudaki, K.; Theodosiou, T. Urban space’s morphology and microclimatic analysis: A study for a typical urban district in the Mediterranean city of Thessaloniki, Greece. Energy Build. 2017, 156, 96–108. [Google Scholar] [CrossRef]
- Salata, F.; Golasi, I.; de Lieto Vollaro, R.; de Lieto Vollaro, A. Urban microclimate and outdoor thermal comfort. A proper procedure to fit ENVI-met simulation outputs to experimental data. Sustain. Cities Soc. 2016, 26, 318–343. [Google Scholar] [CrossRef]
- Alchapar, N.L.; Correa, E.N. The use of reflective materials as a strategy for urban cooling in an arid “OASIS” city. Sustain. Cities Soc. 2016, 27, 1–14. [Google Scholar] [CrossRef]
- Tsoka, S.; Theodosiou, T.; Tsikaloudaki, K.; Flourentzou, F. Modeling the performance of cool pavements and the effect of their aging on outdoor surface and air temperatures. Sustain. Cities Soc. 2018, 42, 276–288. [Google Scholar] [CrossRef]
- Santamouris, M.; Haddad, S.; Saliari, M.; Vasilakopoulou, K.; Synnefa, A.; Paolini, R.; Ulpiani, G.; Garshasbi, S.; Fiorito, F. On the energy impact of urban heat island in Sydney: Climate and energy potential of mitigation technologies. Energy Build. 2018, 166, 154–164. [Google Scholar] [CrossRef]
- Salvati, A.; Roura, H.C.; Cecere, C. Assessing the urban heat island and its energy impact on residential buildings in Mediterranean climate: Barcelona case study. Energy Build. 2017, 146, 38–54. [Google Scholar] [CrossRef]
- Akbari, H.; Taha, H.J.E. The impact of trees and white surfaces on residential heating and cooling energy use in four Canadian cities. Energy 1992, 17, 141–149. [Google Scholar] [CrossRef]
- Kolokotsa, D.; Gobakis, K.; Papantoniou, S.; Georgatou, C.; Kampelis, N.; Kalaitzakis, K.; Vasilakopoulou, K.; Santamouris, M. Development of a web based energy management system for University Campuses: The CAMP-IT platform. Energy Build. 2016, 123, 119–135. [Google Scholar] [CrossRef]
- Yang, X.; Zhao, L.; Bruse, M.; Meng, Q. An integrated simulation method for building energy performance assessment in urban environments. Energy Build. 2012, 54, 243–251. [Google Scholar] [CrossRef]
- Gros, A.; Bozonnet, E.; Inard, C. Cool materials impact at district scale—Coupling building energy and microclimate models. Sustain. Cities Soc. 2014, 13, 254–266. [Google Scholar] [CrossRef]
- Charisi, S.; Waszczuk, M.; Thiis, T. Determining building-specific wind pressure coefficients to account for the microclimate in the calculation of air infiltration in buildings. Adv. Build. Energy Res. 2019, 1–22. [Google Scholar] [CrossRef]
- Gaitani, N.; Burud, I.; Thiis, T.; Santamouris, M. High-resolution spectral mapping of urban thermal properties with Unmanned Aerial Vehicles. Build. Environ. 2017. [Google Scholar] [CrossRef]
- Lontorfos, V.; Efthymiou, C.; Santamouris, M. On the time varying mitigation performance of reflective geoengineering technologies in cities. Renew. Energy 2018, 115, 926–930. [Google Scholar] [CrossRef]
- Bazzaz, M.; Darabi, M.K.; Little, D.N.; Garg, N. A straightforward procedure to characterize nonlinear viscoelastic response of asphalt concrete at high temperatures. Transp. Res. Rec. J. Transp. Res. Board 2018, 2672, 481–492. [Google Scholar] [CrossRef]
- World Maps of Koppen-Geiger Climate Classification. Available online: http://koeppen-geiger.vu-wien.ac.at/present.htm (accessed on 20 March 2019).
- Yoshino, H.; Hong, T.; Nord, N.; Annex, I.E. IEA EBC annex 53: Total energy use in buildings—Analysis & evaluation methods. Energy Build. 2007, 152, 124–136. [Google Scholar]
- Gobakis, K.; Kolokotsa, D. Coupling building energy simulation software with microclimatic simulation for the evaluation of the impact of urban outdoor conditions on the energy consumption and indoor environmental quality. Energy Build. 2017, 157, 101–115. [Google Scholar] [CrossRef]
- Tsoka, S.; Tolika, K.; Theodosiou, T.; Tsikaloudaki, K.; Bikas, D. A method to account for the urban microclimate on the creation of ‘typical weather year’datasets for building energy simulation, using stochastically generated data. Energy Build. 2018, 165, 270–283. [Google Scholar] [CrossRef]
- Huttner, S. Further Development and Application of the 3D Microclimate Simulation ENVI-Met; Johannes Gutenberg University Mainz: Mainz, Germany, 2012. [Google Scholar]
- ISO. Building Materials and Products-Hygrothermal Properties-Tabulated Design Values and Procedures for Determining Declared and Design Thermal Values (ISO 10456: 2007); CEN: Geneva, Switzerland, 2007. [Google Scholar]
- Tsoka, S.; Tsikaloudaki, A.; Theodosiou, T. Analyzing the ENVI-met microclimate model’s performance and assessing cool materials and urban vegetation applications—A review. Sustain. Cities Soc. 2018. [Google Scholar] [CrossRef]
- Crawley, D.B.; Lawrie, L.K.; Winkelmann, F.C.; Buhl, W.F.; Huang, Y.J.; Pedersen, C.O.; Strand, R.K.; Liesen, R.J.; Fisher, D.E.; Witte, M.J. EnergyPlus: Creating a new-generation building energy simulation program. Energy Build. 2001, 33, 319–331. [Google Scholar] [CrossRef]
- Loutzenhiser, P.; Manz, H.; Felsmann, C.; Strachan, P.; Frank, T.; Maxwell, G. Empirical validation of models to compute solar irradiance on inclined surfaces for building energy simulation. Sol. Energy 2007, 81, 254–267. [Google Scholar] [CrossRef]
- Coakley, D.; Raftery, P.; Keane, M. A review of methods to match building energy simulation models to measured data. Renew. Sustain. Energy Rev. 2014, 37, 123–141. [Google Scholar] [CrossRef]
- Fumo, N.; Mago, P.J.; Chamra, L.M. Energy and economic evaluation of cooling, heating, and power systems based on primary energy. Appl. Therm. Eng. 2009, 29, 2665–2671. [Google Scholar] [CrossRef]
- Griffith, B.; Crawley, D. Methodology for analyzing the technical potential for energy performance in the US commercial buildings sector with detailed energy modeling. In Proceedings of the Simbuild, Cambridge, UK, 2–4 August 2006; Volume 2. [Google Scholar]
- Eskin, N.; Türkmen, H. Analysis of annual heating and cooling energy requirements for office buildings in different climates in Turkey. Energy Build. 2008, 40, 763–773. [Google Scholar] [CrossRef]
- Crawley, D.; Winkelmann, F.; Lawrie, L.; Pedersen, C. EnergyPlus: A new-generation building energy simulation program. In Proceedings of the FORUM-PROCEEDINGS, Washington, DC, USA, 9–11 May 2001; pp. 575–580. [Google Scholar]
- Documentation, E. EnergyPlus Manual, Version 2; United States Department of Energy: Washington, DC, USA, 2007. [Google Scholar]
- Sousa, J. Energy simulation software for buildings: Review and comparison. In Proceedings of the International Workshop on Information Technology for Energy Applicatons-IT4Energy, Lisabon, Portugal, 6–7 September 2012. [Google Scholar]
- TOTEE20701-1/2017. Technical Guides of the Recast of the Hellenic Thermal Regulation of the Energy Assessment of Buildings. 2017. Available online: http://portal.tee.gr/portal/page/portal/SCIENTIFIC_WORK/GR_ENERGEIAS/kenak/files/TOTEE_20701-1_2017_TEE_1st_Edition.pdf (accessed on 20 March 2019). (In Greek).
- TOTEE20701-2/2017. Technical Guides of the Recast of the Hellenic Thermal Regulation of the Energy Assessment of Buildings. 2017. Available online: http://portal.tee.gr/portal/page/portal/SCIENTIFIC_WORK/GR_ENERGEIAS/kenak/files/TOTEE_20701-2_2017_TEE_1st_Edition.pdf (accessed on 20 March 2019). (In Greek).
- Tsoka, S.; Litserinou, E.; Tsikaloudaki, A. Evaluating the effect of cool materials on microclimatic variables under different meteorological conditions. In Application in the city of Thessaloniki. In Proceedings of the 3rd International Conference on Changing Cities, Syros, Delos, Mykonos Islands, Greece, 26–30 June 2017. [Google Scholar]
- Agoris, D.; Tigas, K.; Giannakidis, G.; Siakkis, F.; Vassos, S.; Vassilakos, N.; Kilias, V.; Damassiotis, M. An analysis of the Greek energy system in view of the Kyoto commitments. Energy Policy 2004, 32, 2019–2033. [Google Scholar] [CrossRef]


| Material | Solar reflectance/albedo values | Ref. |
|---|---|---|
| New, black conventional asphalt | 0.04–0.06 | [24,33] |
| Aged conventional asphalt (after the first months of use: oxidization of the binder and the corresponding exposure of the aggregates) | 0.10–0.15 | [23,24,34] |
| New cast, conventional grey concrete pavements | 0.25–0.50 | [33,35,36] |
| Aged conventional grey pavements (after the first months of exposure: weathering and abrasion) | 0.19–0.40 | [37,38] |
| Cool white toping on asphalt | 0.30–0.45 | [24,39,40] |
| Cool yellow thin layer asphalt | 0.35–0.44 | [24,39] |
| Cool colored concrete pavements | 0.45–0.70 | [24] |
| Energy savings (percentage difference %) | ||
|---|---|---|
| Heating | Cooling | |
| Des. Cool materials vs. Base case | 0.8% | −0.5% |
| Aged Cool materials vs. Base case | 0.7% | 0.0% |
© 2019 by the authors. Licensee MDPI, Basel, Switzerland. This article is an open access article distributed under the terms and conditions of the Creative Commons Attribution (CC BY) license (http://creativecommons.org/licenses/by/4.0/).
Share and Cite
Tsoka, S.; Tsikaloudaki, K.; Theodosiou, T. Coupling a Building Energy Simulation Tool with a Microclimate Model to Assess the Impact of Cool Pavements on the Building’s Energy Performance Application in a Dense Residential Area. Sustainability 2019, 11, 2519. https://0-doi-org.brum.beds.ac.uk/10.3390/su11092519
Tsoka S, Tsikaloudaki K, Theodosiou T. Coupling a Building Energy Simulation Tool with a Microclimate Model to Assess the Impact of Cool Pavements on the Building’s Energy Performance Application in a Dense Residential Area. Sustainability. 2019; 11(9):2519. https://0-doi-org.brum.beds.ac.uk/10.3390/su11092519
Chicago/Turabian StyleTsoka, Stella, Katerina Tsikaloudaki, and Theodoros Theodosiou. 2019. "Coupling a Building Energy Simulation Tool with a Microclimate Model to Assess the Impact of Cool Pavements on the Building’s Energy Performance Application in a Dense Residential Area" Sustainability 11, no. 9: 2519. https://0-doi-org.brum.beds.ac.uk/10.3390/su11092519