Article

Groundwater Quality Assessment for Sustainable Drinking and Irrigation

1
Department of Water Engineering, Faculty of Agriculture, University of Tabriz, Tabriz 51666-16471, Iran
2
Department of Environmental Sciences, Universiti Putra Malaysia, Serdang 43400, Malaysia
3
Faculty of Health, Queensland University of Technology, Victoria Park Road, Queensland 4059, Australia
4
Kando Kalman Faculty of Electrical Engineering, Obuda University, 1034 Budapest, Hungary
5
Institute of Structural Mechanics, Bauhaus Universität-Weimar, D−99423 Weimar, Germany
6
Institute of Research and Development, Duy Tan University, Da Nang 550000, Vietnam
7
Department for Management of Science and Technology Development, Ton Duc Thang University, Ho Chi Minh City 758307, Vietnam
8
Faculty of Information Technology, Ton Duc Thang University, Ho Chi Minh City 758307, Vietnam
9
Alba Regia Technical Faculty, Obuda University, 8000 Szekesfehervar, Hungary
10
Department of Civil and Environmental Engineering, Hong Kong Polytechnic University, Hung Hom, Hong Kong, China
*
Author to whom correspondence should be addressed.
Sustainability 2020, 12(1), 177; https://0-doi-org.brum.beds.ac.uk/10.3390/su12010177
Submission received: 7 November 2019 / Revised: 18 December 2019 / Accepted: 20 December 2019 / Published: 24 December 2019

Abstract

:
Identification and management of the groundwater quality are of utmost importance for maintaining freshwater resources in arid and semi-arid areas, which is essential for sustainable development. Based on the quality of the groundwater in various areas, local policymakers and water resource managers can allocate the usage of resources for either drinking or agricultural purposes. This research aims to identify suitable areas of water pumping for drinking and agricultural harvest in the Tabriz aquifer, located in East Azerbaijan province, northwest Iran. A groundwater compatibility study was conducted by analyzing Electrical conductivity (EC), total dissolved solids (TDS), Chloride (Cl), Calcium (Ca), Magnesium (Mg), Sodium (Na), Potassium (K), Sulfate (SO4), Total hardness (TH), Bicarbonate (HCO3), pH, carbonate (CO3), the and Sodium Adsorption Ratio (SAR) obtained from 39 wells in the time period from 2003 to 2014. The Water Quality Index (WQI) and irrigation water quality (IWQ) index are respectively utilized due to their high importance in identifying the quality of water resources for irrigation and drinking purposes. The WQI index zoning for drinking classified water as excellent, good, or poor. The study concludes that most drinking water harvested for urban and rural areas is ‘excellent water’ or ‘good water’. The IWQ index average for the study area is reported to be in the range of 25.9 to 34.55. The results further revealed that about 37 percent (296 km2) of groundwater has high compatibility, and 63 percent of the study area (495 km2) has average compatibility for agricultural purposes. The trend of IWQ and WQI indexes demonstrates that groundwater quality has been declining over time.

1. Introduction

Freshwater resources are very limited. Less than one percent of the earth’s water resources are suitable for human consumption. Therefore, freshwater resources must be managed and protected [1]. Regulating and limiting freshwater usage for agricultural purposes has been one of the main efforts of local and national governments to protect this precious resource for sustainable development. However, farming remains a major segment of the worldwide economy [2]. Farming is notable as the biggest client of crisp water and a notable reason for the debasement of surface and groundwater assets and quality [2]. Groundwater assets are vital for financial improvement, particularly in parched and semi-bone-dry areas [3]. The quality of water is identified as the normal, physical, and compound condition of the water, as well as any adjustment that may have been initiated by anthropogenic action [4,5,6,7]. The groundwater quality is the consequence of every one of those procedures and responses that follow up on water from the minute it is first gathered until the time it is stored in a well, which is regularly controlled by different physicochemical attributes [8].
The combined effects of population growth and extreme utilization of groundwater have triggered broad exhaustion and corruption of groundwater assets [9]. Moreover, it is clear that the quality of agricultural water has an influence on the quality of the soil and accordingly on the harvests which are developed. Interest in farming areas and the producing items through these farms has advanced quickly in the most recent century due to population growth. What is more, specialists have mentioned that some elements, such as more urban areas, more industrialized spaces, inadequate management of the lands, and ecological contamination have forced extra weight onto the production of agricultural items [10,11]. Therefore, viable exploitation of both the farming area and the irrigation water has turned into a crucial part, if not the essential goal, of several agrarian improvement and administration designs. Hence, evaluating the quality of groundwater is imperative. A conventional assessment of groundwater quality is straightforward, but requires a point by point process considering the individual parameters [12]. Therefore, it is not adequate for obtaining a precise representation of water quality. Hence, water quality indexes have been produced for attaining water quality information in an effectively expressible and justifiable configuration [13,14]. Typically, the nature of a water system sources is related to its (a) saltiness level, (b) penetration or porousness danger, (c) particular poisonous ions quality, (d) trace elements harmfulness, and (e) different various influences on defenseless products. It should be noted that these dangers or negative effects could develop simultaneously, which makes water assessments harder to complete [15]. Simsek and Gunduz [15] suggested an irrigation water quality (IWQ) list to characterize water system quality which was based on the five risk groups that were specified above for harvests.
The IWQ index is a strategy in which there is a linear blending of the water system quality factors that affect soil quality and harvest yield in a negative way [16]. Numerous analysts have used this index to achieve irrigation water system goals in light of diverse hydrochemical parameters due to its easiness of use, particularly for nontechnical personnel [17,18,19,20]. The key water quality index (WQI) was created by choosing and presenting an accumulation function [21]. The WQI index has been utilized for qualitative zoning of the aquifers for drinking purposes and also for determining the ideal locations for drinking water wells in a lots of research works such as those of Effendi and Wardiatno [22], Chen et al. [23], Bodrud-Doza et al. [24], Fijani et al. [25], Schneider et al. [26], Khan and Qureshi [27], and Oyinkuro and Rowland [28].
A Geographical Information System (GIS) is a capable instrument for putting away, controlling, examining, and mapping spatial information for making decisions in multiple regions at one time, which helps to address relevant fundamental issues [29]. Many studies, such as Narany et al. [18] and Manap et al. [30] have effectively used GIS for demonstrating the distribution of water quality parameters. GIS is vital to preserving the sustainability of the studied aquifer’s quality because groundwater in the study area is mostly used for agriculture and for rural and urban drinking purposes. Therefore, to achieve a better understanding of procedures and the current form of groundwater quality in the study area, the following objectives were defined:
  • Identifying areas of aquifer feeding
  • Determining the WQI in the aquifer
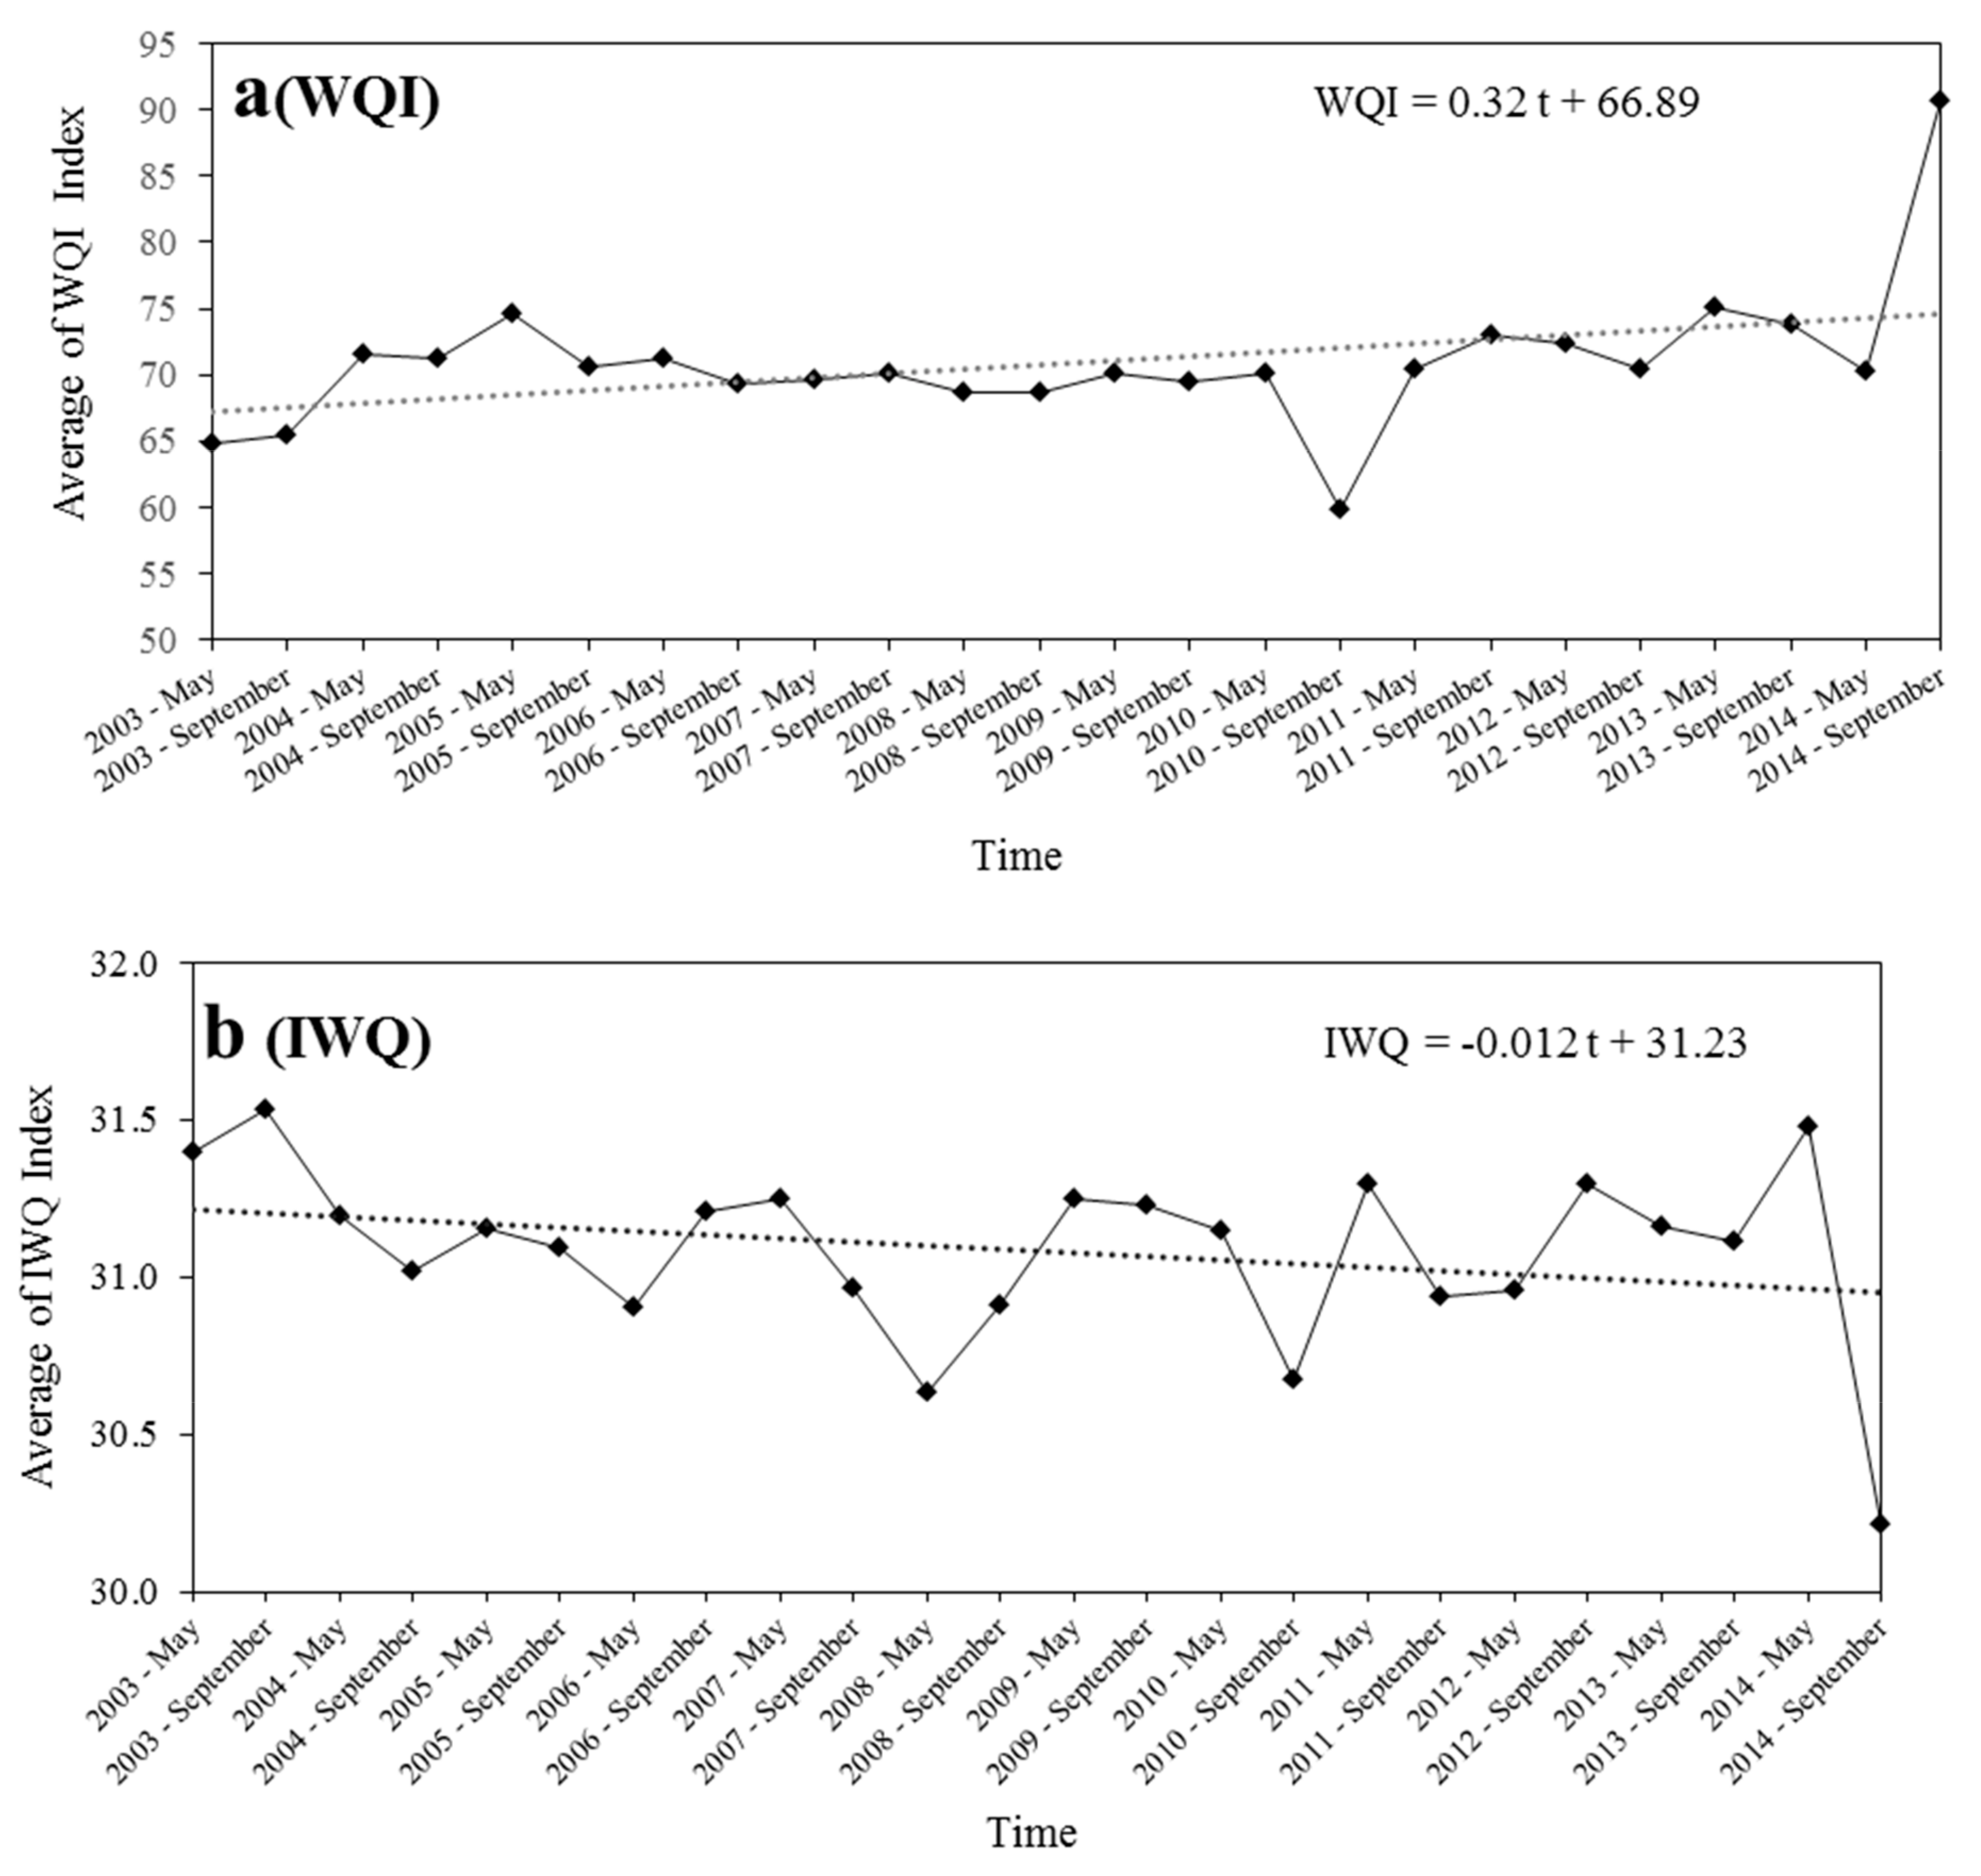
  • Investigating the alterations in WQI for drinking water through the statistical period
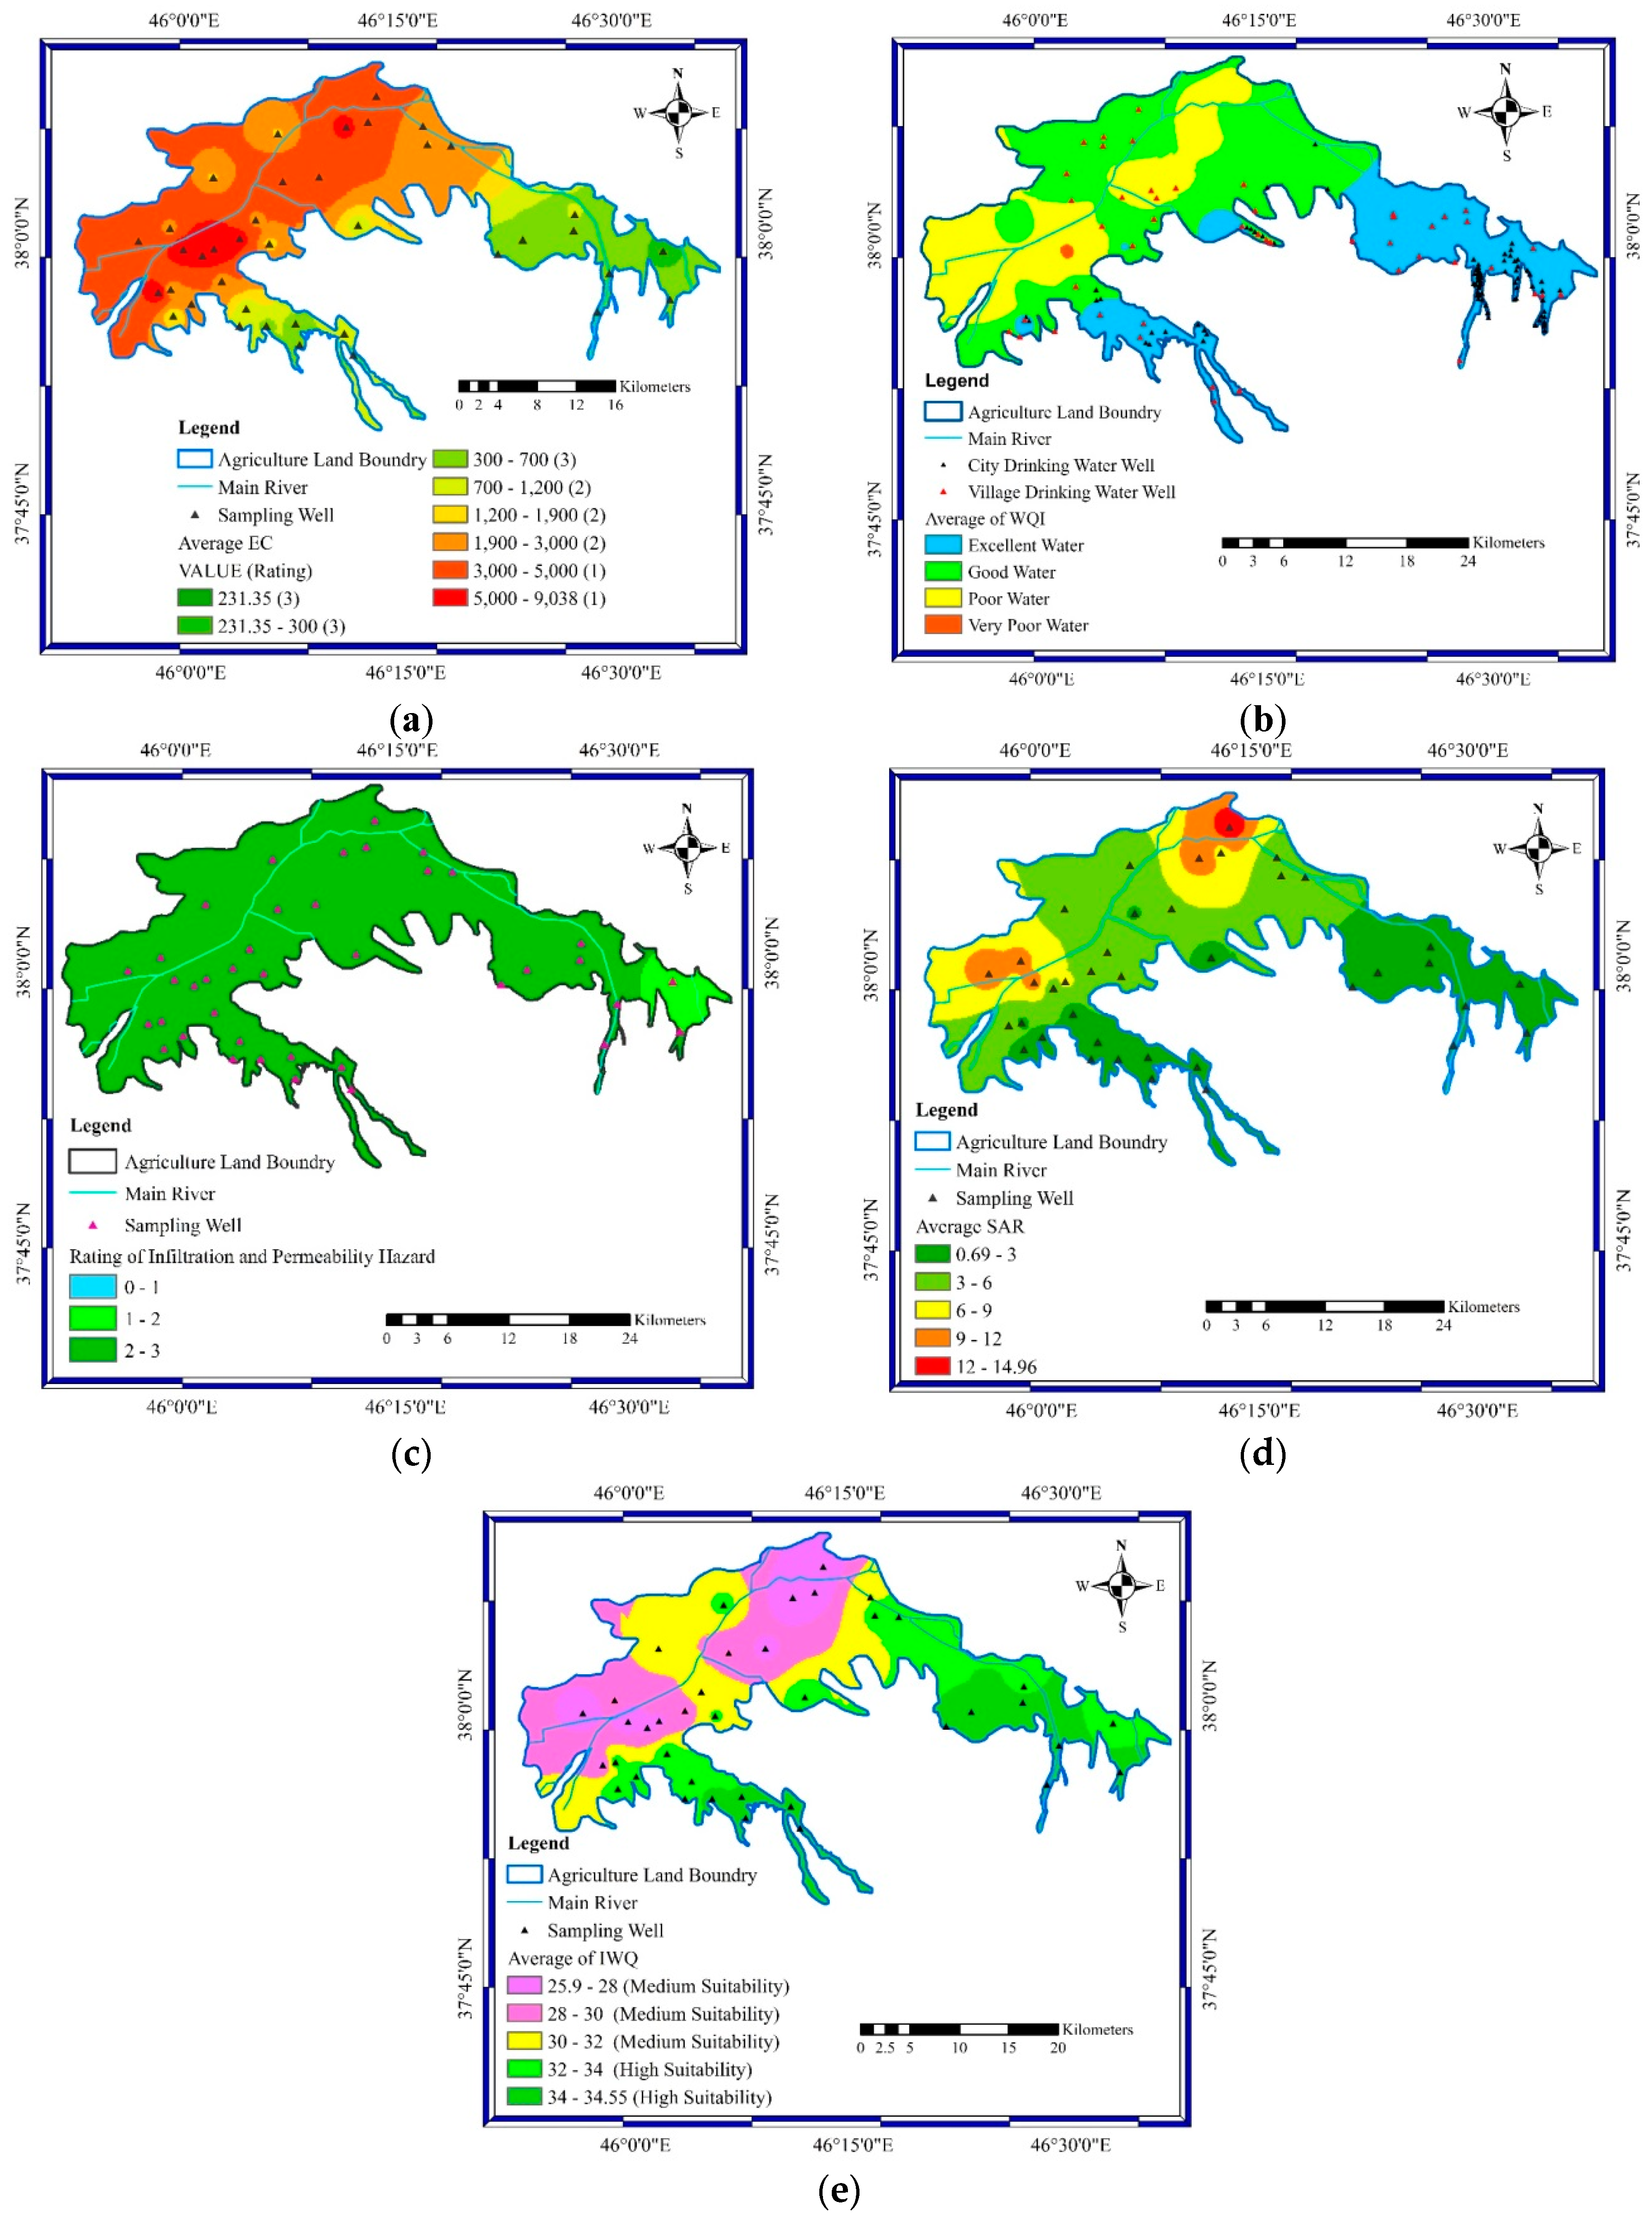
  • Checking the water quality status in tapping drinking wells and determining suitable locations for extracting drinking water
  • determining the IWQ in the aquifer
  • Investigating the variations in WQI for agricultural water during the statistical period
  • Checking water quality status in the agricultural wells and determining appropriate and inappropriate locations for extracting agricultural water.

2. Materials and Methods

2.1. Water Quality

The form and the amount of the dissolved elements in the irrigation water are used to identify the water quality. Generally, salinity, specific ion toxicity, trace element toxicity, and miscellaneous effects on sensitive crops are utilized to evaluate the quality of irrigation water [31].
In general, under the condition of high electrical conductivity, crops can face physiological drought. Usually, waters with EC values lower than 700 μS/cm are categorized as suitable irrigation waters. Salinity and the sodium adsorption ratio (SAR) are the two common factors that affect infiltration. The SAR value of irrigation water is computed as:
S A R = N a + C a + + + M g + + 2
where, [Na+], [Ca++], and [Mg++] stand for the concentration of sodium, calcium, and magnesium particles in water, respectively [32]. A grouping of the EC-SAR paradigm was exploited to survey the possible risk of penetration in the soil [15]. It has been reported that a high sodium surface is created when the dirt is flooded by waters of high sodium concentration, which debilitates the structure of the soil. The soil compresses, and after that, it is scattered into minor elements its pores are affected. Another essential parameter is the content of clay in the soil. When the SAR value is high, it negatively affects the soil structure because it causes the soil mud particles to scatter [15].
Several ions, including sodium, chloride, and boron, are toxic for plants when their concentration becomes high in water or soil. At the moment when the concentrations of the ions in plants are expected to cause harm or decrease production, they are thought to be toxic. The degree of toxicity varies based on the plant type, and it also depends on the uptake of ions. Lasting and enduring types of crops are in more danger from this kind of toxicity than plants that are harvested within one year [32]. Chloride ion can originate in the water system, and if it collects in plants, then it can diminish yields [2]. Chloride at low concentrations is highly valuable in crops. However, if the concentration values become higher than 140 mg/L then toxicity starts to develop. Signs of damage include the burning of leaves or the drying of leaf tissue. Toxic sodium concentrations are discreetly troublesome compared to the clearly poisonous quality of other particles. Regular toxicity manifestations on the plants include the burning of leaves or dead tissues along the outside edges of leaves. This is in contrast with the side effects of toxic chloride concentration, which ordinarily start from the development of unusual leaf tips [32].
It is a fact that plants and creatures generally need trace elements in low concentrations, but higher amounts of these elements are poisonous for plants and even for people. Arsenic, selenium, and chromium could become an abundant danger to groundwater supplies [20]. Several practices, such as anthropogenic exercises, farming procedures, and utilization of nitrogen fertilizers cause an increase in the nitrate of groundwater [2]. The alkalinity of water is associated with pH levels.

2.2. Irrigation Groundwater Quality Index (IWQ Index)

The hydrochemical parameters employed for evaluating the irrigation water quality are selected according to Ayers and Westcot [32] as well as Simsek and Gunduz [15]. The minimum and maximum weights of 1 and 5 have been allocated to pH and EC based on their importance for irrigation water quality. Moreover, different weights between 1 and 5 were considered for other hazards, which have miscellaneous effects on sensitive crops, due to the significance of their effects on irrigation water quality. Furthermore, the rating scale was altered from 1 indicating a low suitability for irrigation, to 3 as high suitability for irrigation, for every single parameter [15,20]. The suggested IWQ index, which assesses the joint effect of quality parameters, was calculated using Equations (2) and (3)
W i = w N i = 1 N R i
I W Q I n d e x = W i
where W is the involvement of each one of the five previously mentioned hazards including salinity, infiltration, specific ion toxicity, trace element toxicity, and miscellaneous effects. w is the weight of each hazard, N is the total number parameters, and R is the rating value.
Based on the availability of water quality data, four risk groups focused salinity, infiltration, and permeability, particularly ion toxicity and miscellaneous impacts to sensitive cops, were implemented to determine the quality of the aquifer used for agricultural water provision in the study zone.
After the estimation of the index value, an appropriate examination was done in light of the three unique classes given in Table 1. As can be seen from Table 1, the IWQ lower than 19 was specified as low, between 19 and 32 as medium, and higher than 32 as high. The qualities were gotten using several rating factors (i.e., 1, 2, and 3) for every parameter without changing its measuring coefficients, thereby yielding three diverse values for indexes (i.e., 39, 26 and 13). The average of these values was utilized to set the upper and lower limits, which were utilized as a part of every specific classification [15].

2.3. Water Quality Index (WQI Index)
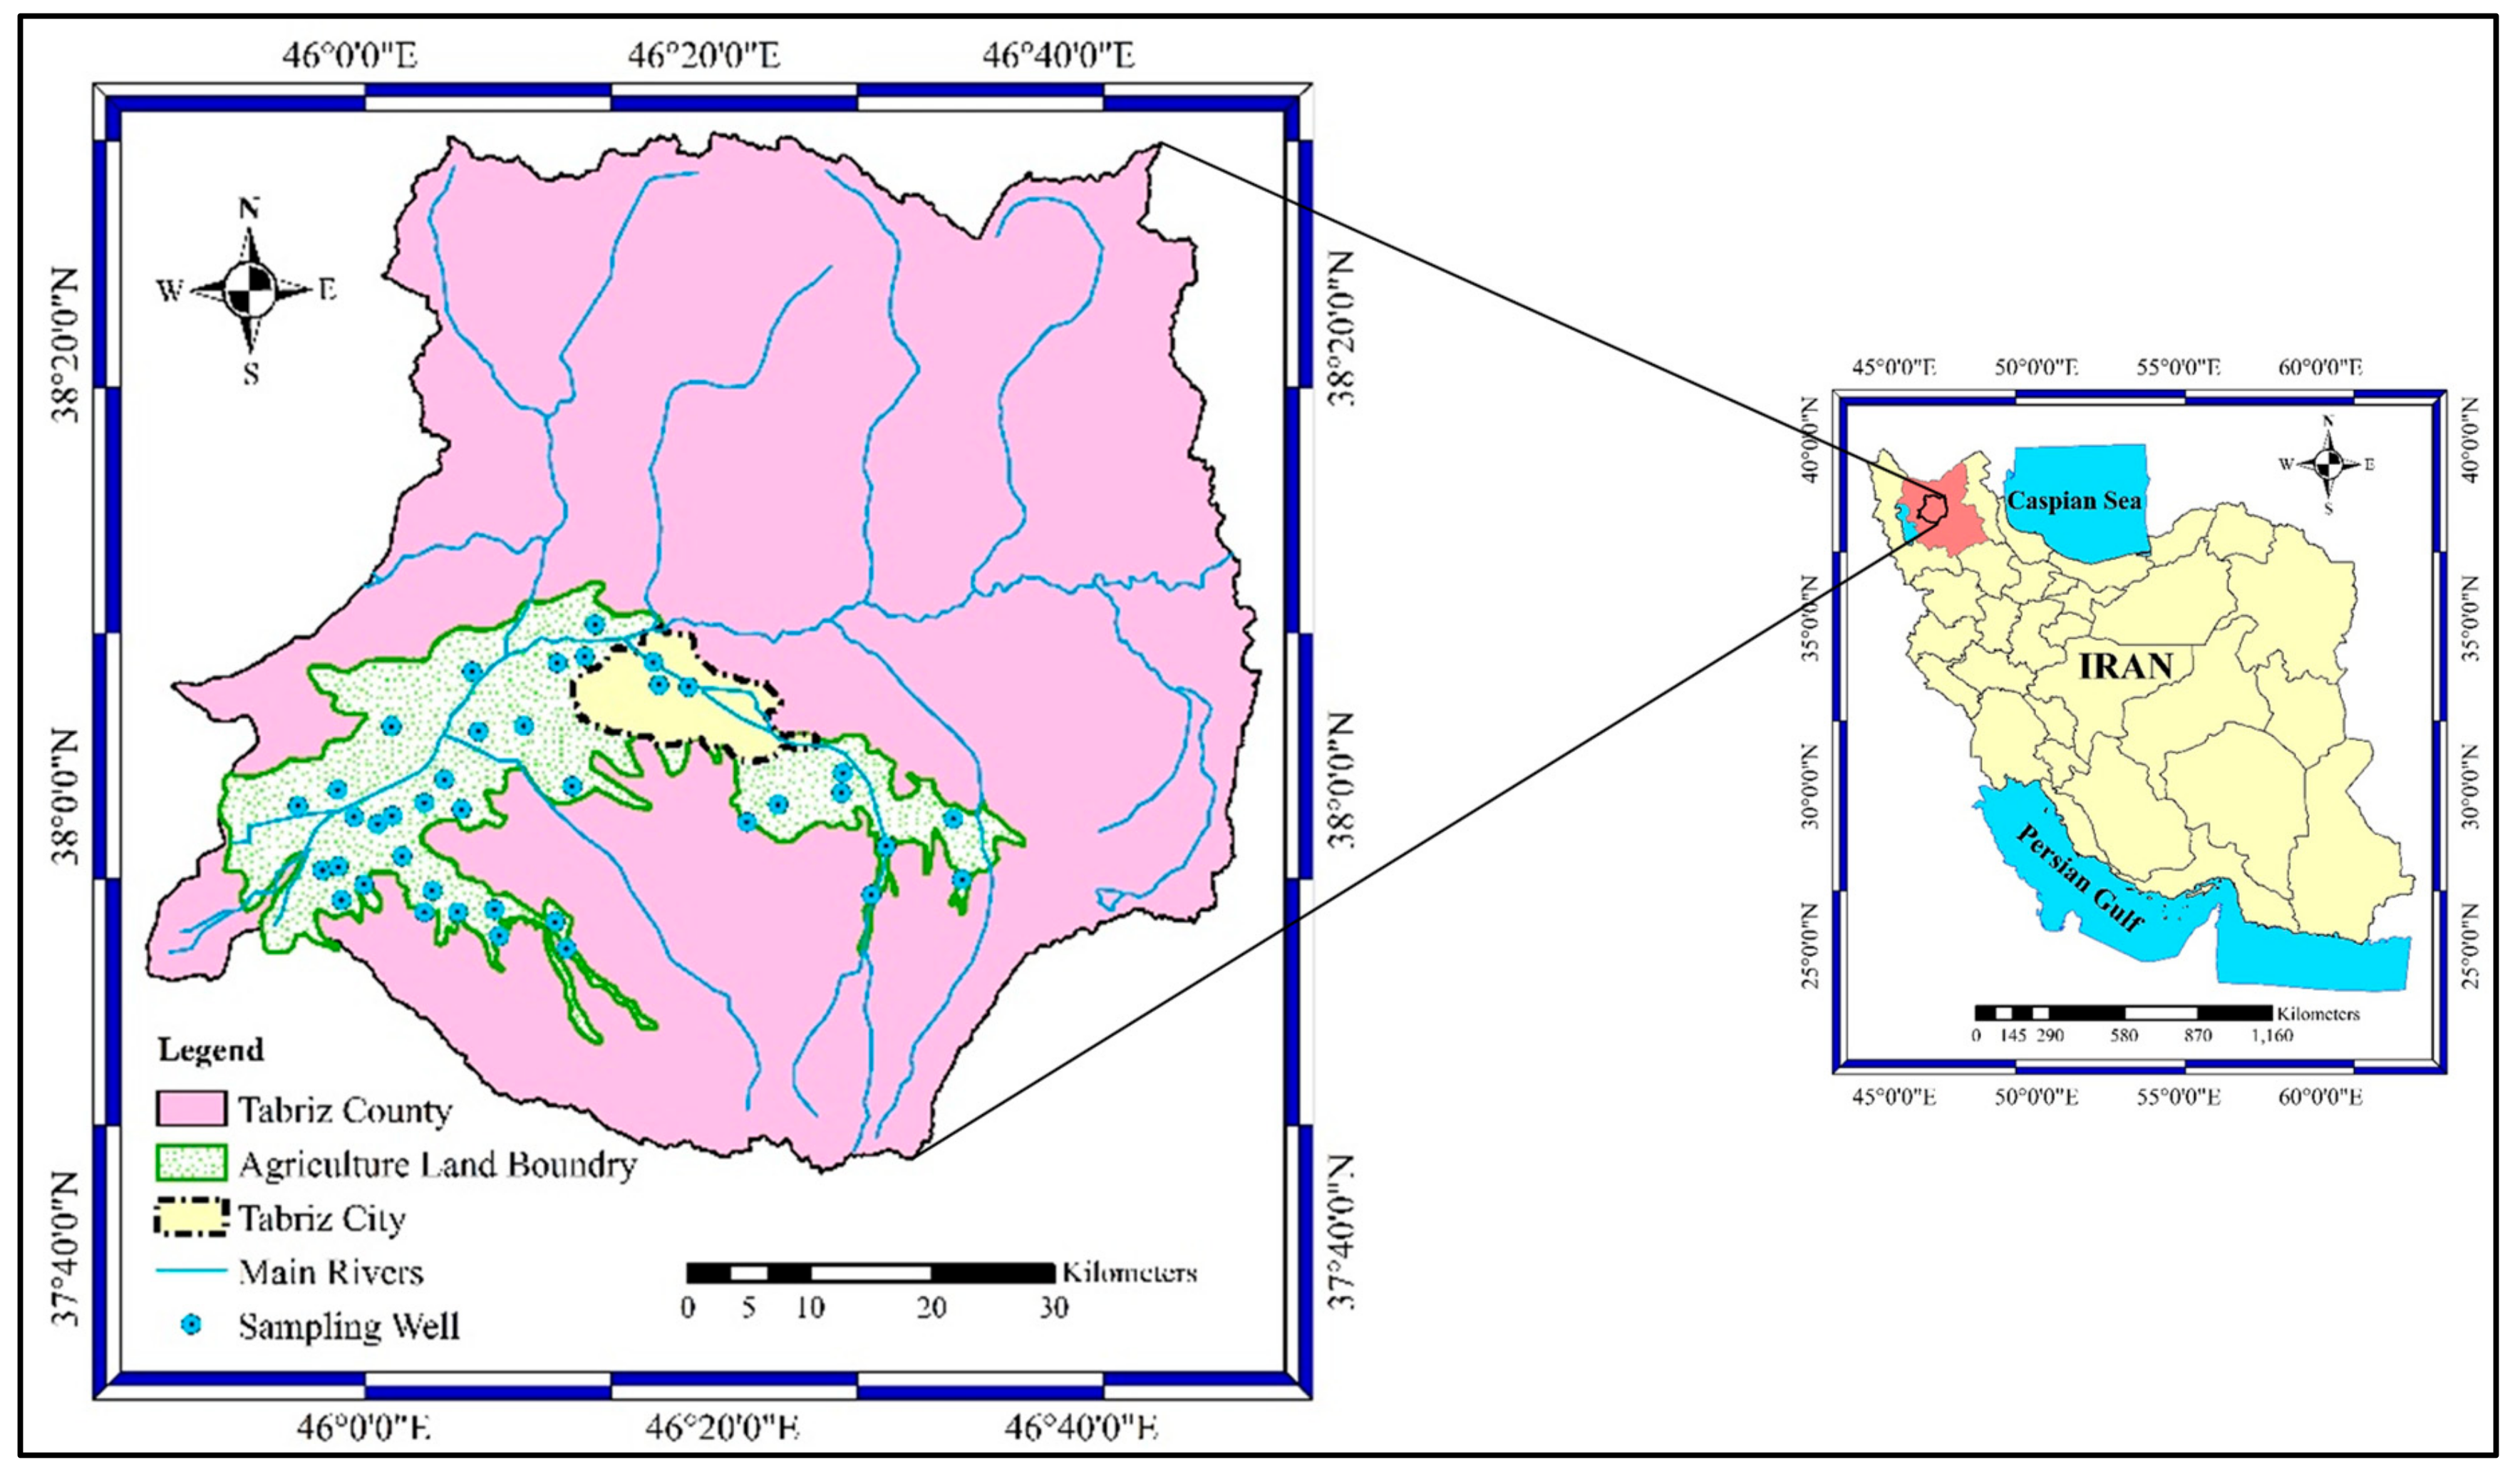
Horton [33] was the first to represent the quality of groundwater by using indices. WQI is among the numerous tools available for representing the data on the nature of water [34]. WQI is characterized as a rating that indicates the impact of several parameters on the general nature of water [35]. In that capacity, it is a significant marker for the evaluation and administration of groundwater. WQI is assessed in light of the appropriateness of groundwater for human utilization.
Three stages are carried out for calculating WQI. In the initial step, the weight (Wi) of each water quality parameter is measured due to its significance for drinking water. The relative weight (Wi) is obtained by Equation (4) using the following formula [36]:
W i = w i i = 1 n w i
In the formula above, n is the number of parameters. In the second step, a rating of quality (qi) is ascertained for every parameter, and the ratio of its individual standard value is measured based on the rules from the WHO [37]:
q i = C i S i × 100 .
In the formula above, Ci is the concentration of chemical parameters for water samples which is expressed in mg/L, and Si is the WHO’s standard of drinking water for every substance parameter in mg/L. In the third step, the WQI is measured as [38]:
W Q I = i = 1 n W i q i .
As presented in Table 2, values of WQI are usually processed and then grouped into five excellent, good, poor, very poor, and inappropriate classes of water for drinking [14]. Twelve parameters were included in calculating WQI by the weighted arithmetic technique. Every parameter has a weight as for its significance for drinking, where 5 represents the total dissolved solids (TDS) and EC, the weight of 4 is allocated to SO4 and TH, the weight of 3 is allocated to pH, Cl, and Na, and the weight of 2 is appointed to K, Mg, Ca, CO3, and HCO3.

2.4. Study Area

The study area is Tabriz plain aquifer situated in East Azerbaijan province, Iran, with an area of 791 km2 (Figure 1). Most of the surface of the area is used to cultivate apples, pears, apricots, peaches, cherries, green beans, leek, spinach, and squash. About 40 percent (50 million cubic meters) of the drinking water of Tabriz city (with a population of 1.7 million) is also provided from the same aquifer. The mean yearly precipitation of Tabriz is nearly 290 mm, which is very low compared with the world normal, which is 800 mm. The average temperature is 12.5 °C, and as indicated by the De Martonne aridity index, the district of study can be categorized as a semiarid territory [40,41]. Water assets of the aquifers start from rainfall and proceed through the streams, while groundwater spills out of encompassing mountains. The water system also returns wasted waters from cities and from industry. Generally, there are three harvesting types in the study area, including harvests for supplying urban water, rural water, and agriculture water. The number of urban, rural, and agricultural water harvesting wells in the study area is 81, 50, and 3884, respectively. To provide the best quality drinking water, Tabriz’s drinking water wells are embedded at the entry of the groundwater flows of the aquifer. Water depth in the area fluctuates between 1.5 and 186 m, and the overall average is 21 m. Most of the groundwater flow entering the aquifer is from the southern and southeastern highlands [42,43]. The highest water level is 2049.56 m, and the lowest is at 1262.8 m from sea level.

2.5. Data Collection

Electrical conductivity (EC), total dissolved solids (TDS), Chloride (Cl), Calcium (Ca), Magnesium (Mg), Sodium (Na), Potassium (K), Sulfate (SO4), Total hardness (TH), Bicarbonate (HCO3), pH, carbonate (CO3), and Sodium Adsorption Ratio (SAR) data were obtained twice in May and September from 39 wells in the time period 2003 to 2014 (Figure 1). In the study area, only two measurements of water quality were performed in May with the highest groundwater level and in September with the lowest level. Moreover, the mentioned parameters were selected based on their effectiveness for irrigation and drinking purposes. A total of 936 samples were utilized for analysis. Brief statistical parameters of each well in the studied period are presented in Table 3.

3. Results and Discussion

The WQI index was computed 24 times in May and September between 2003 and 2014, respectively. The minimum value for the WQI index was equal to 12.14 and the maximum value was equal to 300.53. The regression equation between the WQI index and time (t) was obtained in order to assess WQI index general procedures in each of the wells studied (Table 4).
According to Table 4, the WQI index value has decreased in 19 wells, while in other wells, an increasing trend can be seen. The decreased WQI index procedure shows an increase in drinking groundwater, while an increasing trend indicates a reduction of drinking groundwater quality. Out of the 936 samples obtained from 39 wells in the period between 2003 to 2014, 497 water samples were categorized as ‘excellent water’, 217 water samples were classified as ‘good water’, 188 water samples were classified as ‘poor water’, 31 water samples were classified as ‘very poor water’, and three water samples were classified as ‘unsuitable water for drinking’. The average value of the WQI index was determined after calculating the area of Thiessen polygons for each of the 39 studied wells based on the area affected by each of the wells. Figure 2a displays the average WQI index in the study area during the statistical period. According to this figure, the WQI index of the area has an increasing trend. The quality of groundwater for drinking has decreased over time. Despite the decline in the quality of drinking groundwater, the average WQI index of aquifer still is in the ‘good water’ class over the study time. Therefore, a serious and distributive risk of inappropriate water quality cannot be confirmed for the aquifer, which is supplying both urban and rural water.
Geographical distributions of studied parameters in the study area, based on sampling data from 39 wells, are illustrated in Figure 3. It should be noted that the distribution figures were pictured using the inverse distance weighting (IDW) interpolation method. The IDW is one of the extensively utilized interpolation techniques for different engineering problems (e.g., [44,45,46]). The IDW estimates specific parameters based on nearby locations. Moreover, it was mentioned before that the number of urban water harvesting wells in the study area is 81. Also, due to the fact that the groundwater quality has a decreasing trend according to Table 1 and Table 2, it can be determined from Figure 2 that the groundwater quality was decreasing as the WQI increased and the IWQ decreased during the studied time period. So, based on classification results, 70 out of 81 wells supplying urban drinking water were classified as ‘excellent water’, and the rest of the wells were classified as ‘good water’ (Figure 3a). A total of 27 out of 50 wells supplying rural drinking water were classified as ‘excellent water’, 19 were marked as ‘good water’, and four wells had ‘poor water’. According to the results, the overall conditions of urban drinking water wells are very good. But the situation for four rural drinking water wells is not appropriate, meaning the positions of these wells or the water source of the villages covered by these wells should be changed. Therefore, generally, the position of the urban and rural water wells has been found to have been chosen carefully. It is recommended that drinking water be supplied from the South and Eastern areas of the study range, which are the main areas feeding the aquifer and have a very high water quality.
Salinity and permeability and infiltration hazard weights equal to 5 and 4, respectively, have the greatest impact on the agricultural water quality index. It should be noted that these mentioned weights are based on the standards and rules of WHO [37]. The spatial distribution of the electrical conductivity average measured in 39 wells is shown in Figure 3b. Aquifer feeding regions, which mostly include the south and eastern parts of the study area, have the lowest amount of EC, and closer to the center of the study area, there is an increase in the EC values (Figure 3b). Mosaedi et al. [47] showed that the central regions of Tabriz plain have high salinity, and the eastern regions have low salinity. The quality of underground water in the central regions of Tabriz plain is more undesirable than in the aquifer feeding areas [48].
Furthermore, 18% of the total area has an EC amount less than 700 (μs/cm) (143 km2), 48% of the area has more EC than 3000 (μs/cm) (380 km2), and 34% (268 km2) has an EC between 700 and 3000 (μs/cm).
The highest and lowest average amount of SAR is 0.69 and 14.96 (Figure 3c), respectively. The SAR amount is low in the aquifer feed zone as well as the EC, and it increases closer to the north and west of the aquifer.
Studies have shown that groundwater quality in the aquifer feeding areas of Tabriz plain is better than in other areas of this plain [48,49,50].
The study area is classified as hazardous from the infiltration and permeability aspect (Figure 3d). The increased amount of EC and SAR values in a region can neutralize the negative effects of each parameter. Therefore, due to the large quantities of EC and SAR in the central, northern, and western regions of the study area, the infiltration and permeability hazards in these areas are low. According to Figure 3d, the an average of 4.21 percent of the area (33 km2) was rated as 1 to 2, and 95.79 percent (758 km2) of the region was rated as 2 to 3. In fact, agricultural water in this area is not a limiting factor for infiltration and permeability hazards.
The IWQ index for the 24 measurements of May and September 2003 and 2014 were calculated in the study. The IWQ lowest index value was 21, and the maximum was 35. The area IWQ index average was calculated based on the area of Thiessen polygons corresponding to each of the wells. The IWQ index change trend over time is shown in Figure 2b. Based on this figure, the IWQ index is suitable over time in terms of climate adaptation for farming in the area. A very small negative IWQ indicator over time indicates the sustainability of groundwater quality for agricultural purposes in the study area as well. To maintain the quality of the aquifer, necessary measures should be taken in order to eliminate the negative trend, and then progress to a positive trend for the IWQ index. The values of IWQ vary from 25.9 to 34.55 for the whole region (Figure 3e). According to the abovementioned ranges, the values of IWQ in Figure 3e suggest that about 37 percent (296 km2) of groundwater in the study area has a high compatibility and the remaining 63 percent (495 km2) has a moderate adaptation for agricultural purposes. The results also show that 2227 agricultural wells have groundwater with medium suitability, and 1657 agricultural wells have groundwater with high suitability.

4. Conclusions

Identification and management of the groundwater quality are important for maintaining the freshwater resources in arid and semi-arid areas, which are essential for sustainable development. Based on the quality of the groundwater in various areas, local policymakers and water resource managers can allocate resources for either drinking or agricultural purposes. This research aims to identify suitable areas of water pumping for drinking and agricultural harvest in the Tabriz aquifer, located in East Azerbaijan province, northwest Iran. This study used indicators for evaluating the quality of groundwater. The WQI and IWQ indexes offer suitable areas for harvesting drinking and agricultural water, respectively. The suitability of water taken from wells in the study area based on the type of application is also determined using these indexes. The results showed that in terms of consistency, most urban and rural water wells were classified as ‘excellent water’ and ‘good water’. Due to the agricultural water compatibility zoning map in the study area, there is no low suitability range, and the area has high and medium suitability groundwater for agricultural purposes. The WQI and IWQ index changes over time in the study area show a decrease in groundwater quality for drinking and agriculture purposes, respectively. Water contamination can be controlled by limiting natural, farming run-off and urban land utilization.

Author Contributions

Conceptualization, E.A., M.I., S.S. (Saeed Samadianfard); Data curation, E.A., M.I., S.S. (Saeed Samadianfard); Formal analysis, E.A., M.I., S.S. (Saeed Samadianfard); Investigation, A.M., N.N., M.F.R., S.S. (Shahaboddin Shamshirband), E.H., K.C.; Methodology, E.A., M.I., S.S. (Saeed Samadianfard); Project administration, A.M., Resources, S.S. (Shahaboddin Shamshirband), E.H., K.C.; Software, E.A., M.I., S.S. (Saeed Samadianfard), N.N., S.S. (Shahaboddin Shamshirband), E.H., K.C. E.H; Supervision, S.S. (Shahaboddin Shamshirband), E.H., K.-W.C.; Validation, E.A., M.I., S.S. (Saeed Samadianfard); Visualization, E.A., M.I., S.S. (Saeed Samadianfard); Writing—original draft, E.A., M.I., S.S. (Saeed Samadianfard), M.F.R; Writing—review & editing, A.M., N.N., S.S. (Shahaboddin Shamshirband), E.H., K.-W.C.; M.F.R. All authors have read and agreed to the published version of the manuscript.

Funding

This research was funded by University of Tabriz, grant number S/103.

Acknowledgments

The support of the University of Tabriz Research Affairs Office is acknowledged.

Conflicts of Interest

The authors declare no conflict of interest.

References

  1. Hashmi, I.; Farooq, S.; Qaiser, S. Chlorination and water quality monitoring within a public drinking water supply in Rawalpindi Cantt (Westridge and Tench) area, Pakistan. Environ. Monit. Assess. 2009, 158, 393–403. [Google Scholar] [CrossRef] [PubMed]
  2. FAO. Water Quality for Agriculture; Food and Agriculture Organization of the United Nations: Rome, Italy, 1994. [Google Scholar]
  3. Tlili-Zrelli, B.; Azaza, F.H.; Gueddari, M.; Bouhlila, R. Geochemistry and quality assessment of groundwater using graphical and multivariate statistical methods. A case study: Grombalia phreatic aquifer (Northeastern Tunisia). Arab. J. Geosci. 2013, 6, 3545–3561. [Google Scholar] [CrossRef]
  4. Venkateswaran, S.; Vijay Prabhu, M.; Mohammed Rafi, M.; Vallel, L.K. Assessment of groundwater quality for irrigational use in Cumbum Valley, Madurai District, Tamil Nadu, India. Nat. Environ. Pollut. Technol. 2011, 10, 207–212. [Google Scholar]
  5. Jafar Ahamed, A.; Loganathan, K.; Ananthakrishnan, S. A comparative evaluation of groundwater suitability for drinking and irrigation purposes in Pugalur area, Karur district, Tamilnadu, India. Arch. Appl. Sci. Res. 2013, 5, 213–223. [Google Scholar]
  6. Khan, R.A.; Juahir, H.; Yusoff, M.K.; Zain, S.M.; Hanida, T.I.T. Using Principal Component Scores and Artificial Neural Networks in Predicting Water Quality Index; INTECH Open Access Publisher: Rijeka, Croatia, 2012; Volume 271, pp. 283–300. [Google Scholar]
  7. Salahat, M.; Al-Qinna, M.; Mashal, K.; Hammouri, M. Identifying major factors controlling groundwater quality in semiarid area using advanced statistical techniques. Water Resour. Manag. 2014, 28, 3829–3841. [Google Scholar] [CrossRef]
  8. Arumugam, K.; Elangovan, K. Hydrochemical characteristics and groundwater quality assessment in Tirupur region, Coimbatore district, Tamil Nadu, India. Environ. Geol. 2009, 58, 1509–1520. [Google Scholar] [CrossRef]
  9. Amiri, V.; Rezaei, M.; Sohrabi, N. Groundwater quality assessment using entropy weighted Water Quality Index (EWQI) in Lenjanat, Iran. Environ. Earth Sci. 2014, 72, 3479–3490. [Google Scholar] [CrossRef]
  10. Tanji, K.K. Agricultural Salinity Assessment and Management, American Society of Civil Engineers; Manuals and Reports on Engineering Practice Number; American Society of Civil Engineers: New York, NY, USA, 1990; Volume 71, 619p. [Google Scholar]
  11. Kwiatkowski, J.; Marciak, L.C.; Wentz, D.; King, C.R. Salinity Mapping for Resource Management within the County of Wheatland, Alberta, Conservation and Development Branch, Alberta Agriculture; Food and Rural Development: Edmonton, AB, Canada, 1995; 22p. [Google Scholar]
  12. Mohebbi, M.R.; Saeedi, R.; Montazeri, A.; Azam Vaghefi, K.; Labbafi, S.; Oktaie, S.; Abtahi, M.; Mohagheghian, A. Assessment of water quality in groundwater resources of Iran using a modified drinking water quality index (DWQI). Ecol. Indic. 2013, 30, 28–34. [Google Scholar] [CrossRef]
  13. Saeedi, M.; Abessi, O.; Sharifi, F.; Meraji, M. Development of groundwater quality index. Environ. Monit. Assess. 2010, 163, 327–335. [Google Scholar] [CrossRef]
  14. Ramakrishnaiah, C.R.; Sadashivaiah, C.; Ranganna, G. Assessment of water quality index for the groundwater in Tumkur Taluk, Karnataka State, India. J. Chem. 2009, 6, 523–530. [Google Scholar] [CrossRef] [Green Version]
  15. Simsek, C.; Gunduz, O. IWQ index: A GIS-integrated technique to assess irrigation water quality. Environ. Monit. Assess. 2007, 128, 277–300. [Google Scholar] [CrossRef] [PubMed]
  16. Adhikari, P.; Shukla, M.K.; Mexal, J.G.; Sharma, P. Assessment of the soil physical and chemical properties of desert soils irrigated with treated wastewater using principal component analysis. Soil Sci. 2011, 176, 356–366. [Google Scholar] [CrossRef]
  17. Debels, P.; Figueroa, R.; Urrutia, R.; Niell, X. Evaluation of water quality in the Chillan River (Central Chile) physicochemical parameters and modified water quality index. Environ. Monit. Assess. 2005, 110, 301–322. [Google Scholar] [CrossRef] [PubMed]
  18. Narany, T.S.; Ramli, M.F.; Aris, A.Z.; Sulaiman, W.N.A.; Fakharian, K. Spatiotemporal variation of groundwater quality using integrated multivariate statistical and geostatistical approaches in Amol–Babol plain, Iran. Environ. Monit. Assess. 2014, 186, 5797–5815. [Google Scholar] [CrossRef] [PubMed]
  19. Negm, A.M.; Armanuos, A.M. GIS-Based Spatial Distribution of Groundwater Quality in the Western Nile Delta, Egypt. In The Handbook of Environmental Chemistry; Springer: Cham, Germany, 2016. [Google Scholar] [CrossRef]
  20. Narany, T.S.; Ramli, M.F.; Fakharian, K.; Aris, A.Z. A GIS-index integration approach to groundwater suitability zoning for irrigation purposes. Arab. J. Geosci. 2016, 9, 1–15. [Google Scholar] [CrossRef]
  21. Simos, F.S.; Moriera, A.B.; Bisinoti, M.C.; Gimenez, S.M.N.; Yabe, M.J.S. Water Quality Index as a simple indicator of aquaculture effects on aquatic bodies. Ecol. Ind. 2008, 8, 476–484. [Google Scholar] [CrossRef]
  22. Effendi, H.; Wardiatno, Y. Water quality status of Ciambulawung River, Banten Province, based on pollution index and NSF-WQI. Procedia Environ. Sci. 2015, 24, 228–237. [Google Scholar] [CrossRef] [Green Version]
  23. Chen, Z.; Zhu, Z.; Yin, L.; Wei, S.; Deng, L. The changing water quality characteristics from urban drinking water sources in Guangdong, China. Water Resour. Manag. 2015, 29, 987–1002. [Google Scholar] [CrossRef]
  24. Bodrud-Doza, M.; Islam, A.R.M.T.; Ahmed, F.; Samiran, D.; Narottam, S.; Safiur Rahman, M. Characterization of groundwater quality using water evaluation indices, multivariate statistics and geostatistics in central Bangladesh. Water Sci. 2016, 30, 19–40. [Google Scholar] [CrossRef] [Green Version]
  25. Fijani, E.; Moghaddam, A.A.; Tsai, F.T.C.; Tayfur, G. Analysis and assessment of hydrochemical characteristics of Maragheh-Bonab Plain aquifer, Northwest of Iran. Water Resour. Manag. 2017, 31, 765–780. [Google Scholar] [CrossRef]
  26. Schneider, V.E.; Marques, R.V.; Bortolin, T.A.; Cemin, G.; Dos Santos, G.M. Monitoring and assessment of surface water quality in Taquari-Antas Watershed, South Brazil—Region with intensive pig farming. Environ. Monit. Assess. 2016, 188, 617. [Google Scholar] [CrossRef] [PubMed]
  27. Khan, A.; Qureshi, F.R. Groundwater Quality Assessment through Water Quality Index (WQI) in New Karachi Town, Karachi, Pakistan. Asian J. Water Environ. Pollut. 2018, 15, 41–46. [Google Scholar] [CrossRef]
  28. Oyinkuro, O.A.; Rowland, E.D. Spatial Groundwater Quality assessment by WQI and GIS in Ogbia LGA of Bayelsa State, Nigeria. Asian J. Phys. Chem. Sci. 2018, 4, 1–12. [Google Scholar] [CrossRef]
  29. Nampak, H.; Pradhan, B.; Manap, M.A. Application of GIS based data driven evidential belief function model to predict groundwater potential zonation. J. Hydrol. 2014, 513, 283–300. [Google Scholar] [CrossRef]
  30. Manap, M.A.; Nampak, H.; Pradhan, B.; Lee, S.; Sulaiman, W.N.A.; Ramli, M.F. Application of probabilistic-based frequency ratio model in groundwater potential mapping using remote sensing data and GIS. Arab. J. Geosci. 2014, 7, 711–724. [Google Scholar] [CrossRef]
  31. Wilcox, L.V. Classification and Use of the Irrigation Waters; Circular No. 969; U.S. Department of Agriculture: Washington, DC, USA, 1955; 19p.
  32. Ayers, R.S.; Westcot, D.W. Water Quality for Agriculture; FAO Irrigation and Drainage Paper No. 29, Rev. 1; U.N. Food and Agriculture Organization: Rome, Italy, 1985. [Google Scholar]
  33. Horton, R.K. An index number system for rating water quality. J. Water Pollut. Control Fed. 1965, 37, 300–306. [Google Scholar]
  34. Naik, S.; Purohit, K.M. Studies on water quality of river Brahmaniin Sundargarh district, Orissa. Indian J. Environ. Ecoplan. 2001, 5, 397–402. [Google Scholar]
  35. Sahu, P.; Sikdar, P.K. Hydrochemical framework of the aquifer in and around East Calcutta wetlands, West Bengal. Indian Environ. Geol. 2008, 55, 823–835. [Google Scholar] [CrossRef]
  36. Singh, D.F. Studies on the water quality index of some major rivers of Pune, Maharashtra. Proc. Acad. Environ. Biol. 1992, 1, 61–66. [Google Scholar]
  37. WHO. Hardness in Drinking-Water Background Document for Development of who Guidelines for Drinking—Water Quality; World Health Organization: Geneva, Switzerland, 2011; 19p. [Google Scholar]
  38. Tiwari, T.N.; Mishra, M.A. A preliminary assignment of water quality index of major Indian rivers. Indian J. Environ. Prot. 1985, 5, 276–279. [Google Scholar]
  39. Ketata-Rokbani, M.; Gueddari, M.; Bouhlila, R. Use of geographical information system and water quality index to assess groundwater quality in El Khairat deep aquifer (Enfidha, Tunisian Sahel). Iran. J. Energy Environ. 2011, 2, 133–144. [Google Scholar]
  40. Zarghami, M.; Akbariyeh, S. System dynamics modeling for complex urban water systems: Application to the city of Tabriz, Iran. Resour. Conserv. Recycl. 2012, 60, 99–106. [Google Scholar] [CrossRef]
  41. Vaezihir, A.; Tabarmayeh, M. Total vulnerability estimation for the Tabriz aquifer (Iran) by combining a new model with DRASTIC. Environ. Earth Sci. 2015, 74, 2949–2965. [Google Scholar] [CrossRef]
  42. Asghari Moghaddam, A.; Allaf Najib, M. Hydrogeologic characteristics of the alluvial tuff aquifer of northern Sahand Mountain slopes, Tabriz, Iran. Hydrogeol. J. 2006, 14, 1319–1329. [Google Scholar] [CrossRef]
  43. Barzegar, R.; Moghaddam, A.A.; Tziritis, E. Hydrogeochemical features of groundwater resources in Tabriz plain, northwest of Iran. Appl. Water Sci. 2017, 7, 3997–4011. [Google Scholar] [CrossRef]
  44. Gong, G.; Mattevada, S.; O’Bryant, S.E. Comparison of the accuracy of kriging and IDW interpolations in estimating groundwater arsenic concentrations in Texas. Environ. Res. 2014, 130, 59–69. [Google Scholar] [CrossRef]
  45. Harman, B.I.; Koseoglu, H.; Yigit, C.O. Performance evaluation of IDW, Kriging and multiquadric interpolation methods in producing noise mapping: A case study at the city of Isparta, Turkey. Appl. Acoust. 2016, 112, 147–157. [Google Scholar] [CrossRef]
  46. Huang, F.; Liu, D.; Tan, X.; Wang, J.; Chen, Y.; He, B. Explorations of the implementation of a parallel IDW interpolation algorithm in a Linux cluster-based parallel GIS. Comput. Geosci. 2011, 37, 426–434. [Google Scholar] [CrossRef]
  47. Mosaedi, A.; Sough, M.G.; Sadeghi, S.H.; Mooshakhian, Y.; Bannayan, M. Sensitivity analysis of monthly reference crop evapotranspiration trends in Iran: A qualitative approach. Theor. Appl. Climatol. 2017, 128, 857–873. [Google Scholar] [CrossRef]
  48. Barzegar, R.; Moghaddam, A.A.; Kazemian, N. Assessment of heavy metals concentrations with emphasis on arsenic in the Tabriz plain aquifers, Iran. Environ. Earth Sci. 2015, 74, 297–313. [Google Scholar] [CrossRef]
  49. Mosavi, A.; Ozturk, P.; Chau, K.W. Flood prediction using machine learning models: Literature review. Water 2018, 10, 1536. [Google Scholar] [CrossRef] [Green Version]
  50. Jeihouni, M.; Toomanian, A.; Shahabi, M.; Alavipanah, S.K. Groundwater quality assessment for drinking purposes using GIS modelling (case study: City of Tabriz). Int. Arch. Photogramm. Remote Sens. Spat. Inf. Sci. 2014, 40, 163. [Google Scholar] [CrossRef] [Green Version]
Figure 1. The geographical position of the study area with sites of sampled wells.
Sustainability 12 00177 g001
Figure 2. Moderate, and gradual changes in the WQI (a) and IWQ (b) indexes in the entire study area.
Sustainability 12 00177 g002
Figure 3. Geographical distribution of studied parameters in the study area ((a): WQI, (b): EC, (c): SAR, (d): infiltration and permability hazard and (e): IWQ).
Sustainability 12 00177 g003
Table 1. The evaluation limits of the IWQ index.
IWQ IndexSuitability of Water for Irrigation
<19Low
19–32Medium
>32High
Table 2. Water quality classification based on WQI value [39].
Classification of Drinking Water Quality
WQI RangeClassType of Water
below 50IExcellent water
50–100IIGood water
100–200IIIPoor water
200–300IVVery poor water
above 300VWater unsuitable for drinking
Table 3. The statistical properties of the qualitative parameters in Tabriz plain aquifer during the period between 2003 to 2014.
ParametersUnitMinMaxAverageStandard Devision
SO4(mg/L)0.0822.134.764.52
Cl(mg/L)0.20102.5015.0520.47
HCO3(mg/L)0.5810.974.052.07
Co3(mg/L)0.001.030.120.19
pH-6.359.457.910.58
EC(µmho/cm)186.5511,560.002393.272406.94
K(mg/L)0.000.780.230.16
Na(mg/L)0.4448.2510.8512.58
Mg(mg/L)0.2522.604.974.76
Ca(mg/L)0.8050.007.939.34
TH(mg/L)31.353625.00620.24682.19
TDS(mg/L)111.937514.001550.231563.50
SAR-0.4024.833.913.89
Table 4. The linear regression equation between the WQI index and time from 2003 to 2014.
Well NumberRegression EquationCorrelation CoefficientWell NumberRegression EquationCorrelation Coefficient
1WQI = 1.6939t + 15.3550.5521WQI = −0.2128t + 28.5050.40
2WQI = 0.2421t + 18.0940.9422WQI = −0.3667t + 24.6430.55
3WQI = −0.2941t + 49.4470.6323WQI = 1.0321t + 44.4510.84
4WQI = −0.0729t + 19.4880.6124WQI = 0.1134t + 17.2920.36
5WQI = 0.3631t + 15.2720.7125WQI = −0.9066t + 171.890.49
6WQI = 3.0499t + 7.83920.8226WQI = −1.3891t + 149.530.63
7WQI = 3.288t + 171.850.8327WQI = −1.5646t + 97.0940.71
8WQI = 3.1769t + 21.5630.6928WQI = −5.2218t + 210.010.73
9WQI = −0.7188t + 77.8030.5729WQI = 0.0781t + 45.1260.08
10WQI = 3.4849t + 109.040.9830WQI = −0.3709t + 64.8420.50
11WQI = −0.0508t + 19.4390.2631WQI = 1.149t + 19.4740.93
12WQI = −0.038t + 22.0850.5232WQI = −0.3804t + 53.2720.44
13WQI = 1.9223t + 1310.7433WQI = −0.1622t + 17.8450.71
14WQI = −1.3849t + 63.9490.8334WQI = 0.0509t + 16.5050.18
15WQI = 1.2416t + 118.070.6235WQI = −0.9229t + 79.560.66
16WQI = 0.1337t + 23.6770.4736WQI = −3.5949t + 128.410.90
17WQI = 7.9565t + 208.110.7837WQI = −0.1744t + 17.9070.37
18WQI = 1.1912t + 51.9410.8938WQI = −0.0247t + 13.770.10
19WQI = 1.7036t + 66.6140.8839WQI = 2.015t + 98.7160.96
20WQI = 0.1387t + 28.4940.46

