Article

Characteristics of Non-Point Source Pollution under Different Land Use Types

1
College of Agronomy, Northwest A&F University, Xianyang 712100, China
2
Shaanxi Engineering Research Center of Circular Agriculture, Xianyang 712100, China
*
Authors to whom correspondence should be addressed.
Sustainability 2020, 12(5), 2012; https://0-doi-org.brum.beds.ac.uk/10.3390/su12052012
Submission received: 14 February 2020 / Revised: 25 February 2020 / Accepted: 2 March 2020 / Published: 6 March 2020

Abstract

:
Non-point source pollution (NPSP) is a major challenge for current global water resources. The output characteristics of pollutants under different land use types are very important for controlling NPSP. In this study, long-term positioning monitoring and an analysis of rainfall runoff from different land use types were used to evaluate a typical watershed in the water source area of the middle route of the South-to-North Water Diversion Project (MR-SNWDP). The results show significant differences in nitrogen and phosphorus content in the runoff water bodies of various land use types. The nitrogen and phosphorus content in the MR-SNWDP was directly related to rainfall intensity and the fertilization period in the runoff following fertilization of farmland and vegetable plots. This nitrogen and phosphorus content was also observed to be significantly higher in the fertilization period than in other periods. The loss of nitrogen and phosphorus in forestland was greatly affected by rainfall intensity. Nitrogen in runoff comes primarily from farmland and vegetable fields, where its main form is nitrate nitrogen (NN). Vegetable fields are the main source of phosphorus, where its primary form is soluble phosphate (PO43−-P). Nitrogen and phosphorus have a defined incubation period during the dry season. Farmland and vegetable fields receive less rainfall during the dry season and it is difficult to form effective runoff; this allows nitrogen and phosphorus deposition. The runoff formed by the first rainfall at the beginning of the flood season (April or May) will carry a large amount of nitrogen and phosphorus from the soil into water bodies. Therefore, it is crucial to pay careful attention to the season when attempting to control NPSP.

1. Introduction

The middle route of the South-to-North Water Diversion Project (MR-SNWDP) is the largest water diversion project in the world. Currently, non-point source pollution (NPSP) is the most prominent issue affecting water quality in the reservoir area of this project [1]. NPSP can be formed at any time and place, especially when chemical fertilizers and farm manures are used in production and daily life [2]. Because of the insufficient absorption and utilization by plants and improper planting methods in some areas, runoff generated by pollutants from rainfall can bring these pollutants into a water body, seriously affecting the water quality. The 1977 Amendment to the Clean Water Act of the United States defines NPSPs as pollutants that enter the surface and groundwater in a wide, dispersed, and microscopic form. NPSP is regarded as a major contributor to water quality deterioration and has become a major global and regional environmental problem. According to statistics, 30–50% of water sources on the earth’s surface have been affected by NPSP [3]. Approximately 60% of water pollution in the United States is caused by NPSP [4], and 89% of the nitrogen load in the Gulf of Mexico each year comes from NPSP. Eutrophication of European water bodies is also a serious problem. Nitrogen and phosphorus produced by agricultural production activities and imported into the North Sea estuary account for 60% and 25% of the total load, respectively [5]. In the Netherlands, total nitrogen and total phosphorus produced by agricultural NPSP accounts for 50–60% and 40–50% of total water pollution, respectively [6]. In China, water pollution has always been a very serious ecological and environmental problem. Total of 38% of reservoirs and 65% of lakes in China were identified as eutrophic water bodies in 2010 [7]. Controlling NPSP through river basins has become an important task for water environment management research [8]. Li Chongwei et al. [9] showed that the spatial difference of NPSP in the Qiao Reservoir can be attributed to differences in landforms and vegetation. The key to controlling NPSP is to change the spatial distribution of vegetation cover. Different land use types have different effects on NPSPs. Some landscapes can inhibit or absorb pollutants, including woodland and unused land [10,11,12]. Tong et al. [13] studied the hydrological effects of land use in Ohio, and found that different land use types have a significant influence on nitrogen and phosphorus in river water. Kibena et al. [14] analyzed the impact of land use activities on water quality in the upper Manieme River using hydrological response units and buffer analysis to determine the main land use types that affect water quality. A change in land use type will change the landscape pattern under certain conditions. In turn, this affects the entire ecological environment. Differences in the soil nutrient conservation capacity of different land use types and in the absorption and utilization of nitrogen, phosphorus, and other nutrients by vegetation, means that it is important to study the relationship between land use types and runoff water quality. It is also important to consider the source of NPSP in order to control it more effectively.
The state of water resources in the water source area of the MR-SNWDP not only affects the residents in the water source area but also affects the Beijing-Tianjin-Hebei region. It is unclear what kind of land use methods are in the water source area and what the loss characteristics of non-point source pollution are. Therefore, this paper has conducted long-term positioning monitoring and analysis of nitrogen and phosphorus in rainfall runoff of different land use types in a typical watershed in the water source area of the MR-SNWDP in China. This study provides a theoretical basis for the loss of groundwater sources and pollution prevention methods.

2. Materials and Methods
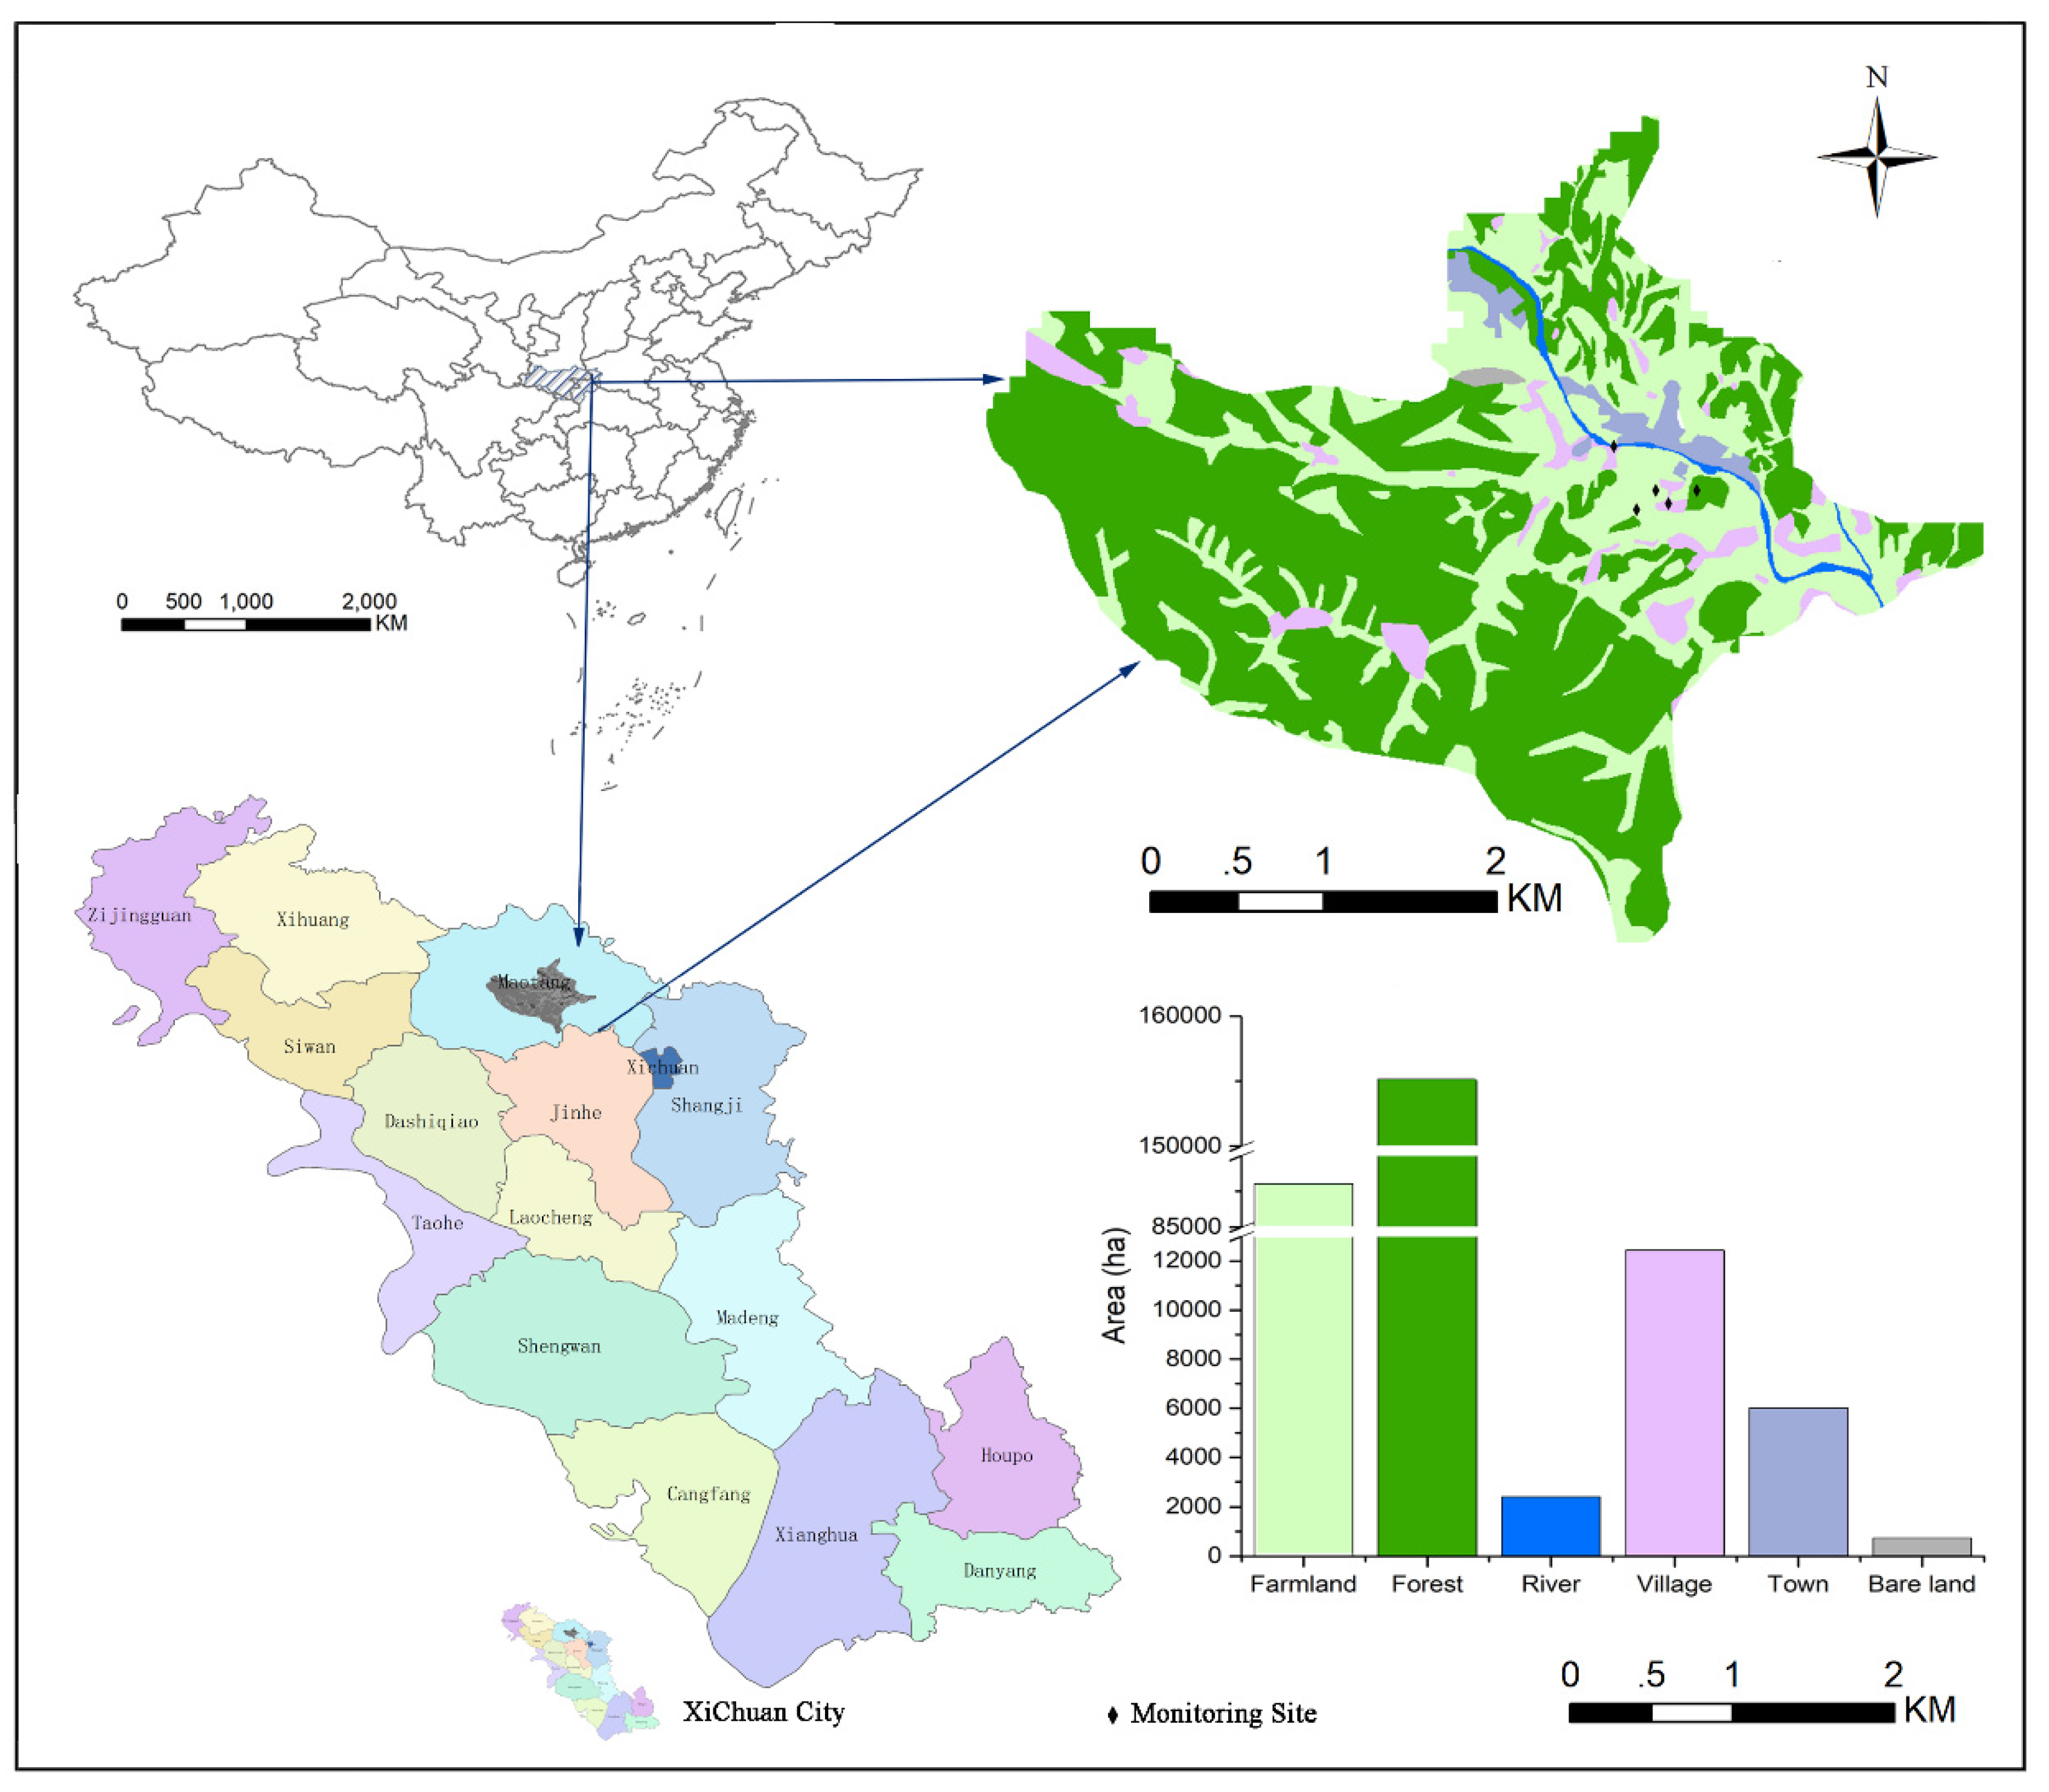
2.1. Study Area

This study was conducted in Maotang Township, Xichuan County, Henan Province, China (Figure 1). Xichuan County is located at the junction of Shaanxi, Hubei, and Henan. The southwest part is adjacent to the low mountains and hills of northern Hubei, and the northeast part belongs to the Nanyang Basin. The total population of the county is about 740,000. The county’s land area is 2820 square kilometers, of which the core water source area of the South-to-North Water Diversion Middle Line area is 2616 square kilometers, accounting for 92.8% of the county’s total land area. There are obvious differences in the distribution of soil types in the water source area. The yellow-brown loam is mainly composed of ten soil types such as lime soil, paddy soil, mortar black soil, and purple soil. The soil layer thickness is generally 30 cm. Land use types in the reservoir area are mainly grassland, shrubs, and woodland, which are 70% of the total area of the reservoir area, and agricultural land accounts for 22% of the total area of the reservoir area. The land use in the reservoir area has the characteristics of a distinct mountainous area, with less farmland, more slopes, more arable land, less mountainous grasslands, moderate soil pH, but poor soil fertility, and agricultural production is more dependent on the chemical fertilizers. Most of the Maotang Township is located in a deep mountainous area. The land use ratio is similar to the rest of the county. The township has 20,000 acres of arable land, 180,000 acres of forest land, and a forest coverage rate of more than 50%. The runoff monitoring point of this study did not have any human intervention in the plantation rows in the forestland, farmland, or vegetable gardens. Furthermore, the planting types, fertilization amounts, and fertilization methods were carried out according to the local farmers’ historical planting habits [15,16,17]. Therefore, the establishment of runoff communities reflects the true situation of NPSP in the sub-watersheds of the reservoir area. The types of runoff monitoring stations in this study included farmland runoff, woodland runoff, vegetable field runoff, well water, and river water stations. The monitoring time was from February 2017 to September 2018, and each monitoring station only tested the water quality from water that can form runoff.
The farmland planting pattern in the township consists of a winter wheat and a summer corn rotation. Corn planting occurs in early May, and wheat planting occurs in early October. The fertilizer applied to planting corn is compound fertilizer and phosphate fertilizer, and the fertilizer applied to wheat is compound fertilizer. Urea is used as top dressing fertilizer. Vegetable fields are planted throughout the year, and primarily consist of garlic seedlings, lettuce, cabbage, and other common vegetables. The fertilizer application to these fields contains farm manure (human and animal manure). The woodland is comprised of a compound forest of shrubs and trees. Well water comes directly from farmers, and the river water originates from the Suohe River in Maotang Township.

2.2. Data Sources

Rainfall data for this study came from the China Meteorological Data Network (http://data.cma.cn/) surface climate data Days China dataset (V3.0), monitoring site for Xixia station (No. 57156). Rainfall levels are classified using runoff monitoring according to rainfall level distribution issued by the National Meteorological Administration (Table 1). The runoff data and water quality monitoring data are measured using fixed-point monitoring. The size of the runoff field is a rectangle of 5 m × 10 m. The slope of the forest land is 30°, and the slope of the farmland and vegetable land is 10°. The total rainfall in 2017 was 1106.1 mm, of which the rainfall during the high water period from June to October was 884.2 mm. The rainfall during this period accounted for 79.9% of the annual precipitation. The total number of runoff monitoring samples used was 122.
In this study, a rainwater collection device was placed at the outlet of the runoff monitoring station. The collection method consisted of sampling farmland runoff, woodland runoff, vegetable field runoff, well water, and river water after each rainfall runoff. This was done using a polyethylene bottle (500 mL) to collect a total of two bottles of water when sampling. Sampling time, rainfall, and runoff were all observed. The collected samples were then frozen and brought back to the laboratory within 48 h to complete the test analysis. The analysis method was the “Water and Wastewater Monitoring and Analysis Method (Fourth Edition)” [18]. Water analysis indicators included total nitrogen (TN), total particulate nitrogen (PN), dissolved total nitrogen (DN), nitrate nitrogen (NN), ammonium nitrogen (AN), total phosphorus (TP), dissolved total phosphorus (DTP), dissolubility organic phosphorus (DOP), soluble phosphorus (PO43−-P), and particulate phosphorus (PP). One of the water samples needed to be filtered through a 0.45 μm filter. Two bottles of water samples were measured each for NN, AN, TN, DN, TP, DTP, and PO43--P using a nitrogen and phosphorus analysis module in a continuous flow analyzer (AutoAnalyzer-3, Norderstedt, Germany). DN, DOP, and PP were calculated using the following equations: DON = DN-AN-NN, DOP = DTP-PO43−-P, and PP = TP-DTP [18,19,20].

2.3. Analytical Methods

In this study, SPSS 19.0 was used for data analysis and Origin 2016 was used for drawing. This research includes five sets of data including farmland, forest land, vegetable field, surface water, and ground water. To study whether there are differences in these data, multiple comparisons should be made between multiple samples. The least significant difference method (LSD) is the simplest method of multiple comparisons to test the mean difference between two groups. LSD used t-test to complete the matching comparison of questions for each group and the test was highly sensitive. Small differences in the mean values of each level might also be detected. Therefore, the LSD of SPSS19.0 was used for a significance test.

3. Results and Discussion

3.1. Spatiotemporal Changes of Nitrogen and Phosphorus at Different Monitoring Sample Points

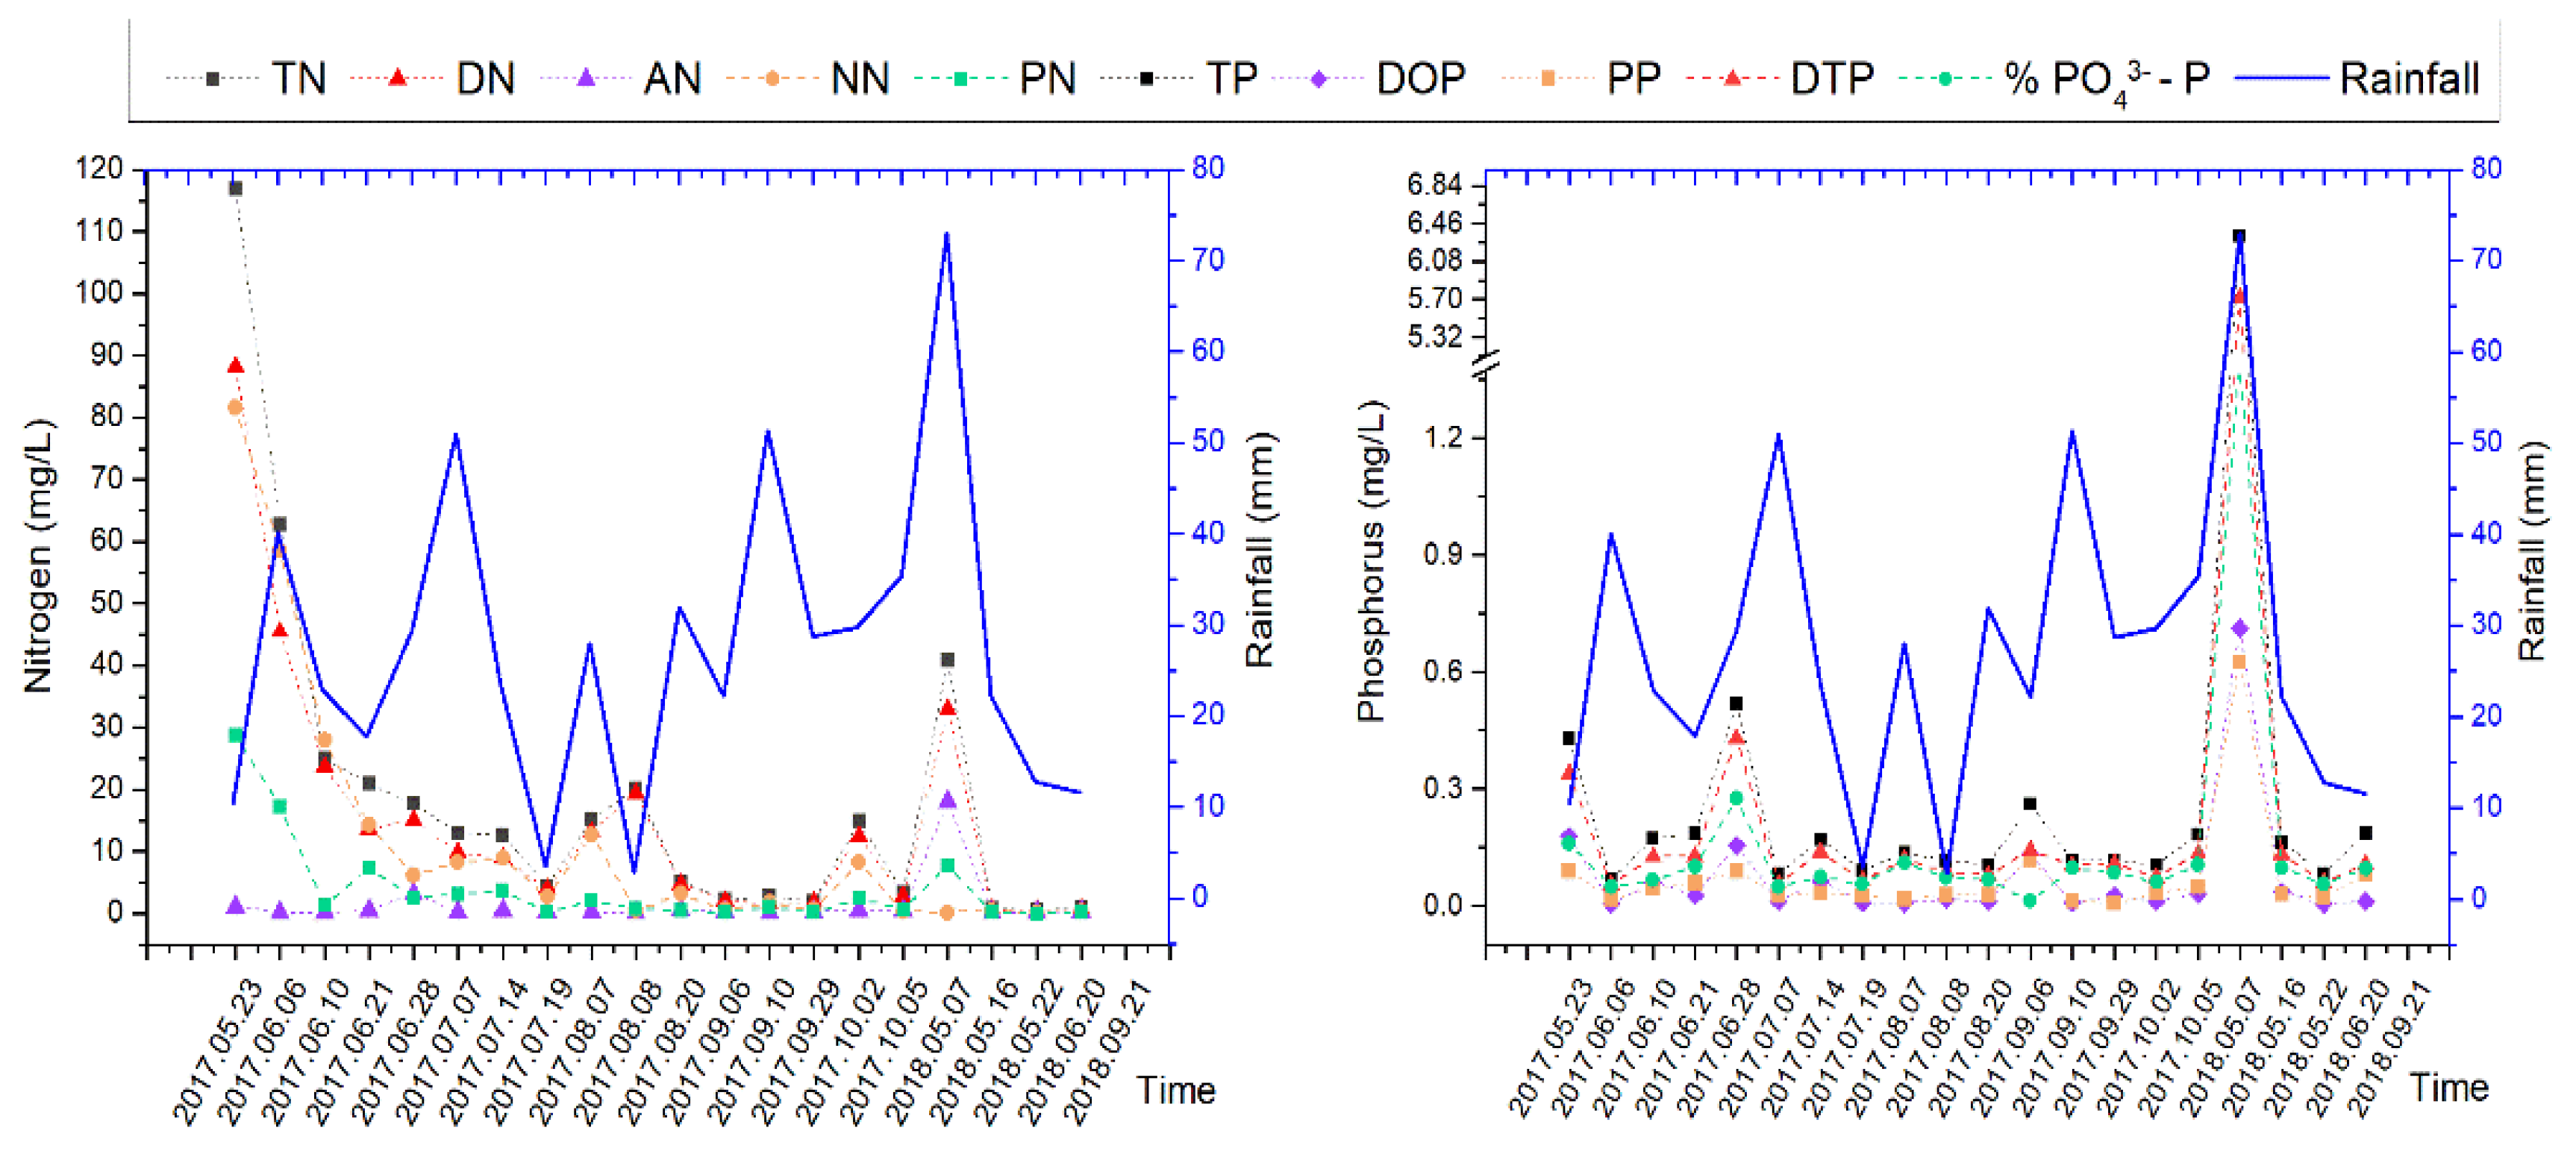
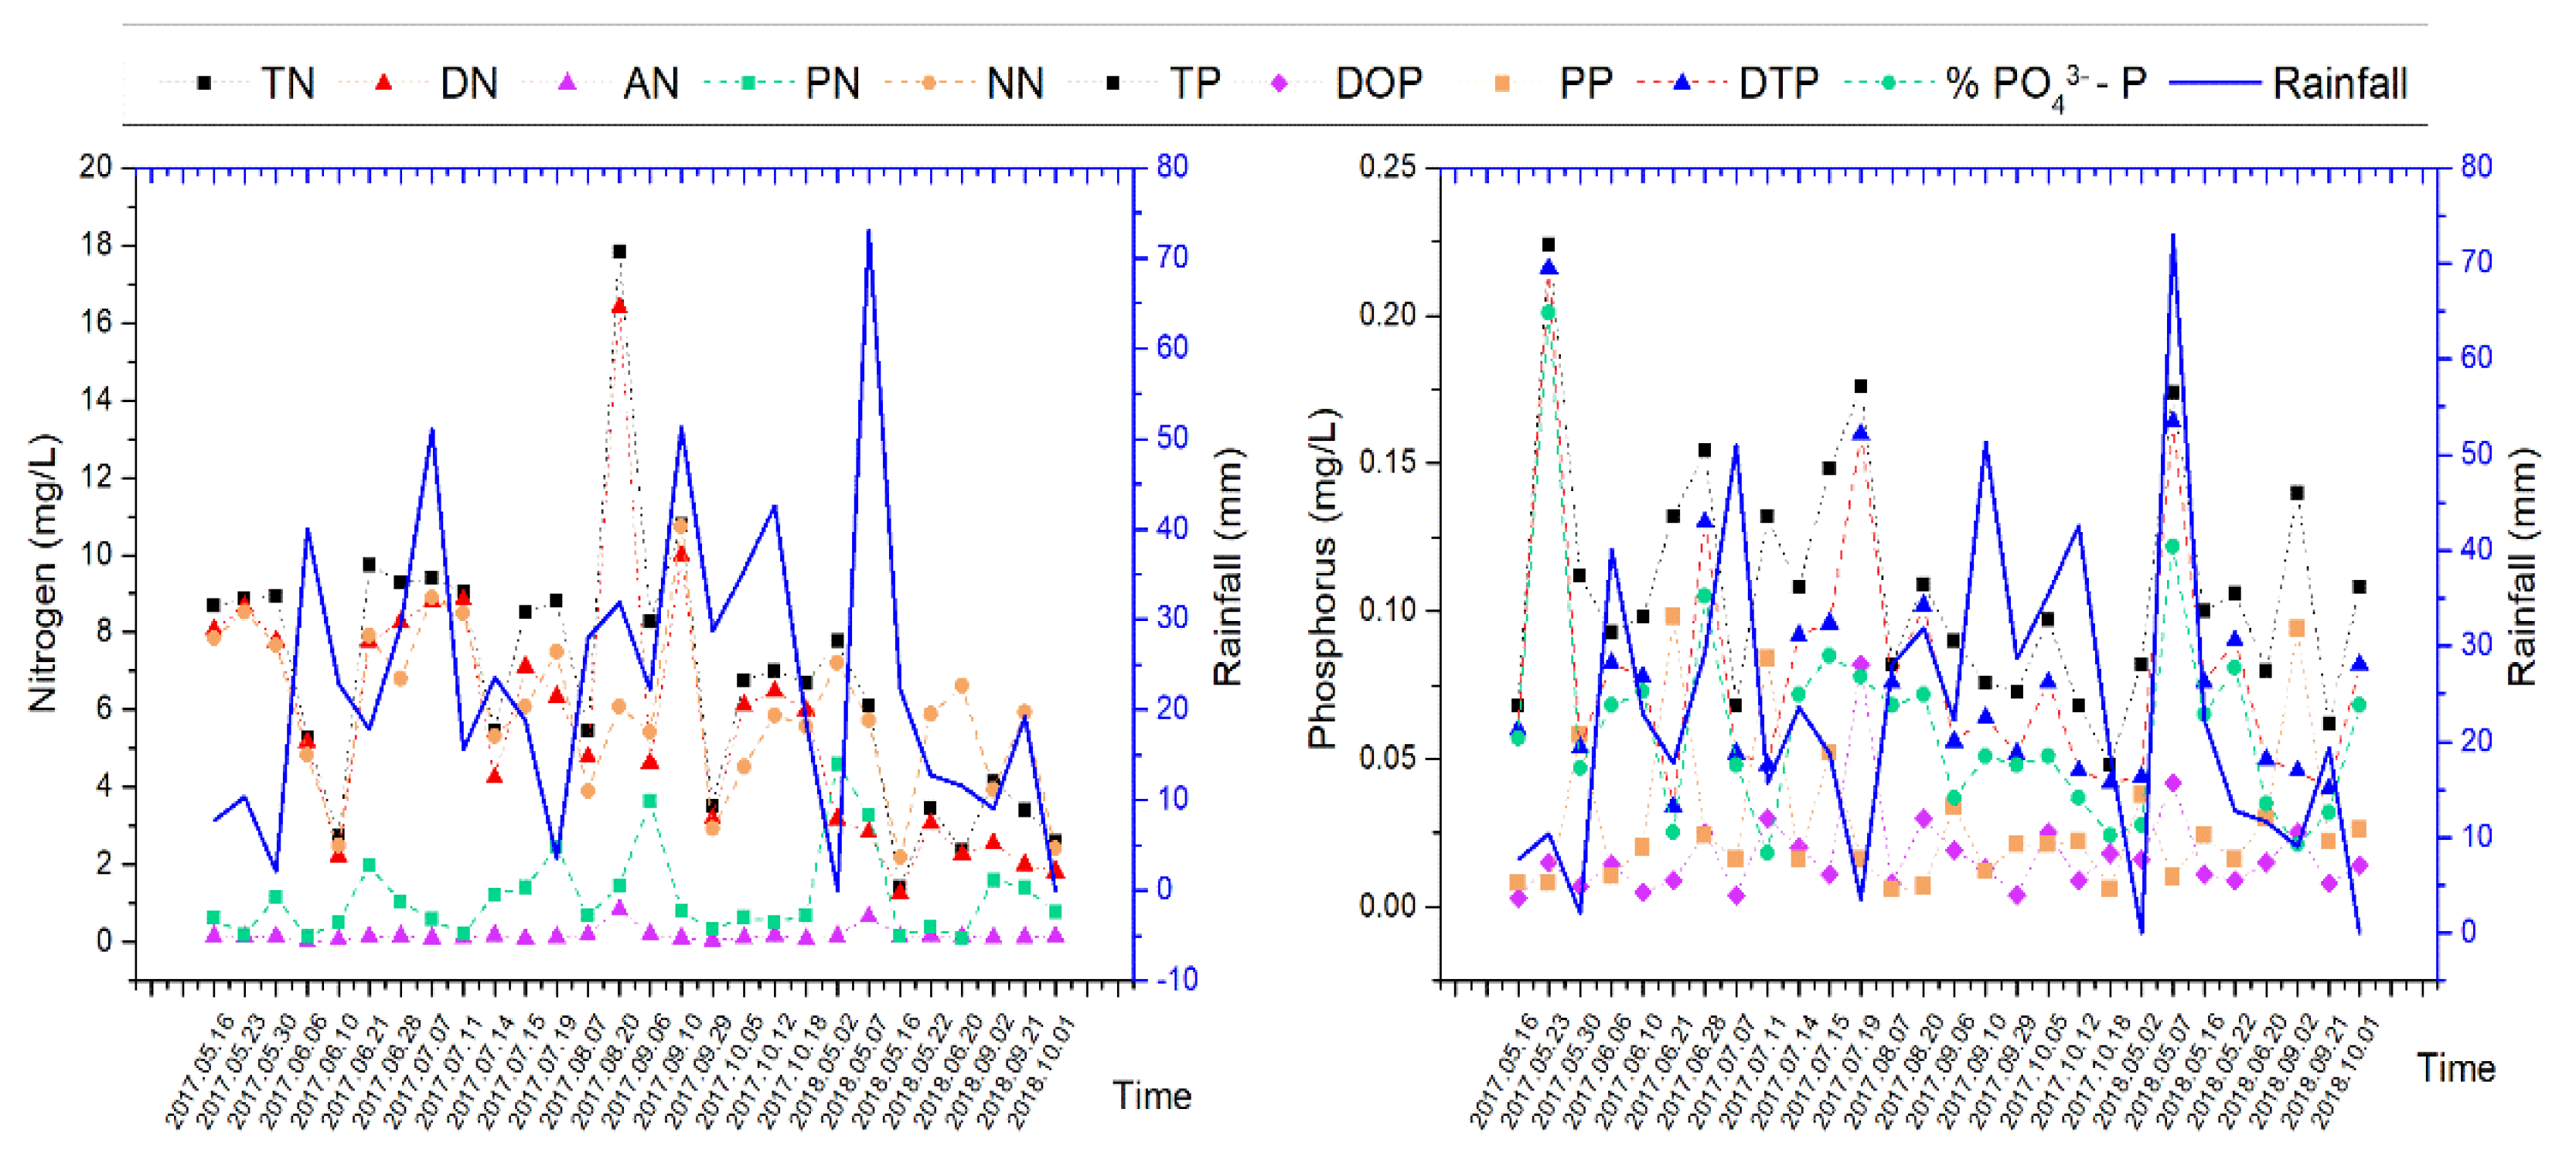
3.1.1. Changes of Nitrogen and Phosphorus in Farmland Runoff Plot

Soils in agricultural plots are susceptible to oxidation under dry farming conditions, which facilitates nitrification. During natural rainfall, nutrients in soil and crop residues migrate to surface runoff. In terms of nitrogen structure, the presence of NN is consistent with the change in total soluble nitrogen. In this study, nitrogen and phosphorus losses in farmland were affected by rainfall in different periods (Figure 2). Among these, the nitrogen concentration in the water body on 23 May 2017 and 7 May 2018 exhibited the maximum values for the year. The rainfall on 23 May 2017 had a high impact on the nitrogen content in the farmland soil. The TN content in the water reached 116.9 mg/L, and the total soluble nitrogen (DN) within the TN reached 88.19 mg/L. The water-soluble fertilizer NN is the main contributor to nitrogen loss in TN in nitrogen, accounting for 69.8% of TN content. This is likely because the spring corn has just been planted in the farmland in early May, and the fertilizers applied by farmers have not yet been used by the vegetation. With the occurrence of rainfall, the nitrogen content in the farmland runoff water continued to decrease until mid-July. The nitrogen in farmland increased with rainfall from mid-July to August. Subsequently, nitrogen loss decreased and stabilized. This is because local farmers will apply quick-acting nitrogen fertilizer to the early stage of grain filling in order to ensure an acceptable yield at a later date [21,22]. As a result of supplementation with external nitrogen elements, rainfall will cause the continuous loss of nitrogen. During the dry season at the beginning of 2018, there was no runoff data prior to May. This was due to the fact that rainfall did not form an effective runoff on farmland at this time [23,24]. Heavy rains occurred in early May and mid-May, causing underutilized nitrogen fertilizer in the wheat field of the farmland to be discharged into the river with runoff. Consequently, the nitrogen content in the farmland decreased sharply.
Phosphorus and nitrogen in farmland display similar trends. Most of the fertilizers applied to winter wheat in the study area were phosphate fertilizers, and a large amount of nitrogen fertilizer was used as topdressing in the later stage. On 29 September 2017, winter wheat had just been planted. The subsequent heavy rain caused a large amount of various types of phosphate fertilizers to be lost in the soil, and the maximum value of total phosphorus in the water reached 6.34 mg/L. There will always be a certain amount of phosphorus loss in the runoff caused by rainfall, and the main loss component of phosphorus is dissolved phosphate (PO43−-P). During the key period of fertilization in this study, the rainfall intensity was found to be both significant and positively correlated with the amount of nitrogen and phosphorus lost. The results of this study are consistent with those of wangjiagou agricultural sub-basin in the Three-Gorges reservoir area [25].

3.1.2. Changes of Nitrogen and Phosphorus in Vegetable Field Runoff Area

The runoff formed during initial monitoring in mid-to-late May 2017 showed that the TN concentration was 43.76 mg/L, and the TP concentration was 6.37 mg/L (Figure 3). These were the highest values observed during the monitoring period. The main forms of nitrogen and phosphorus loss were AN and DTP, accounting for 91.5% of total nitrogen and 84.2% of total phosphorus, respectively. During the dry season, it is difficult for rainfall to form an effective runoff. This causes a large amount of nitrogen and phosphorus to accumulate in the soil. At the same time, the addition of farm manure applied in early spring makes the nitrogen and phosphorus content in rainfall runoff highest in May. In this study, the repeated occurrence of rainfall caused the nitrogen and phosphorus content of vegetable field runoff to decrease to its lowest point around mid-June. In mid-to-late June, 7 August, 6 September, 29 September, and 22 May 2018, nitrogen and phosphorus concentrations in the water body formed significant peaks and troughs. The crest period of rainfall can be seen after fertilization of vegetable fields. Figure 3 shows that the change in nitrogen and phosphorus concentration within the vegetable field runoff is significantly correlated with the fertilization period and rainfall, and the change of nitrogen and phosphorus concentration are significantly consistent with each other in terms of time. Therefore, runoff water quality in the vegetable field is also significantly correlated with rainfall and fertilization [26].
Vegetable gardens are an indispensable part of the life for rural residents in China. Most of the nutrients used for planting are derived from farm manure. Therefore, the pollution caused by runoff in vegetable gardens can be used as a representation of rural animal husbandry and domestic pollution sources. Since there is no clear special period for the fertilization of vegetable fields, the amount of fertilizer applied has a direct relationship with the growth cycle and replacement of vegetables. Studying vegetable fields can help determining the extent of pollution caused by rainfall, aquaculture, and daily life during the runoff period of rainfall in the reservoir area. The pollutant load in the runoff changes with seasonal characteristics and is also affected by the dual effects of human agricultural activities and natural climate.

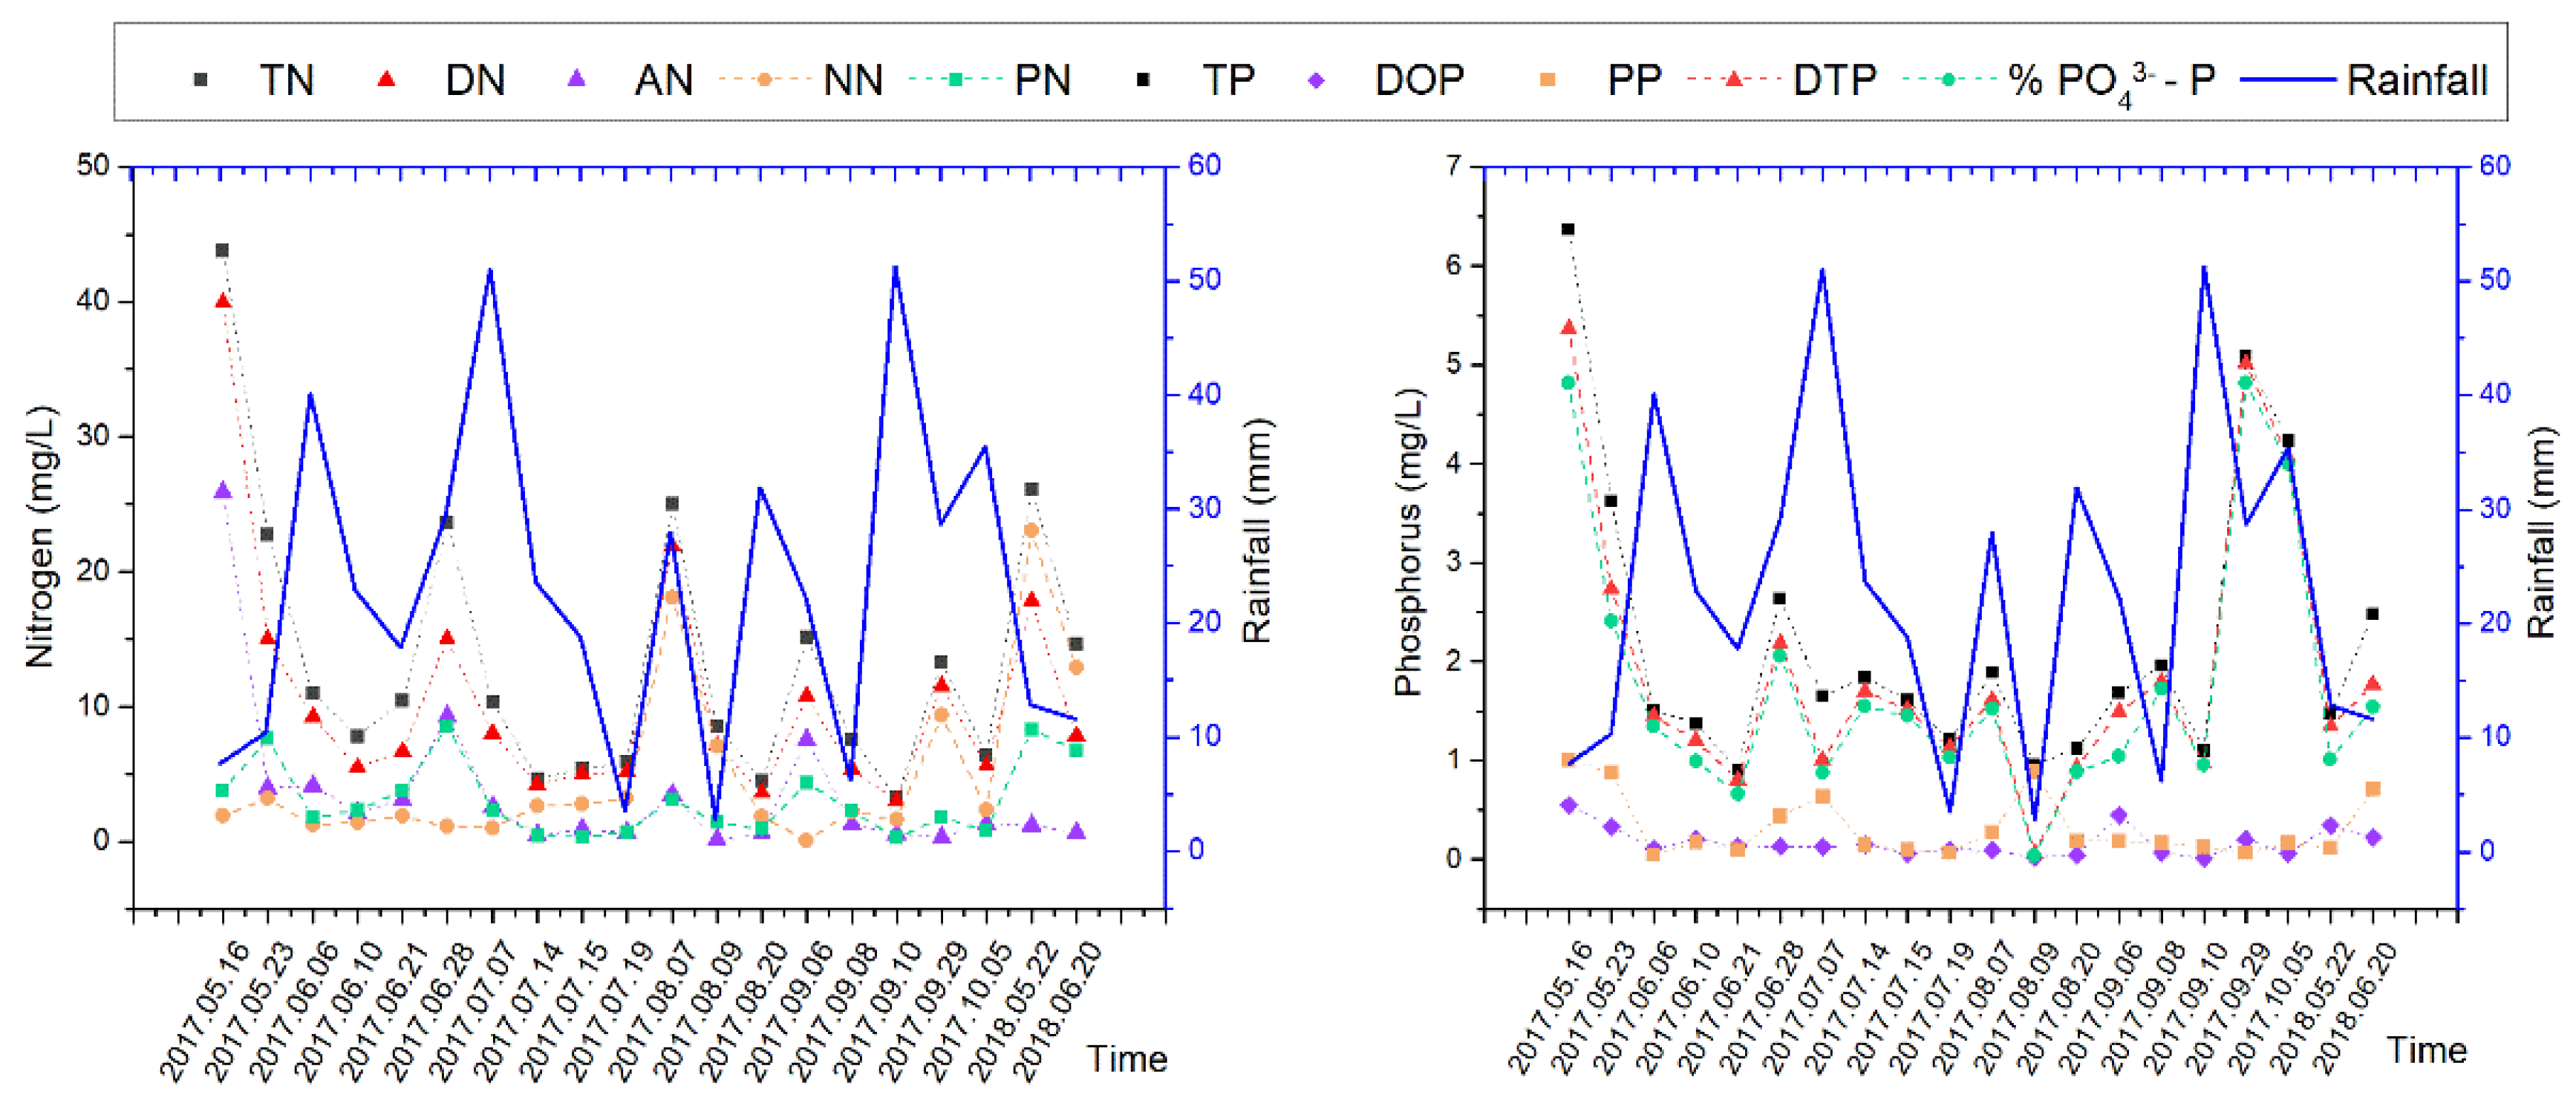
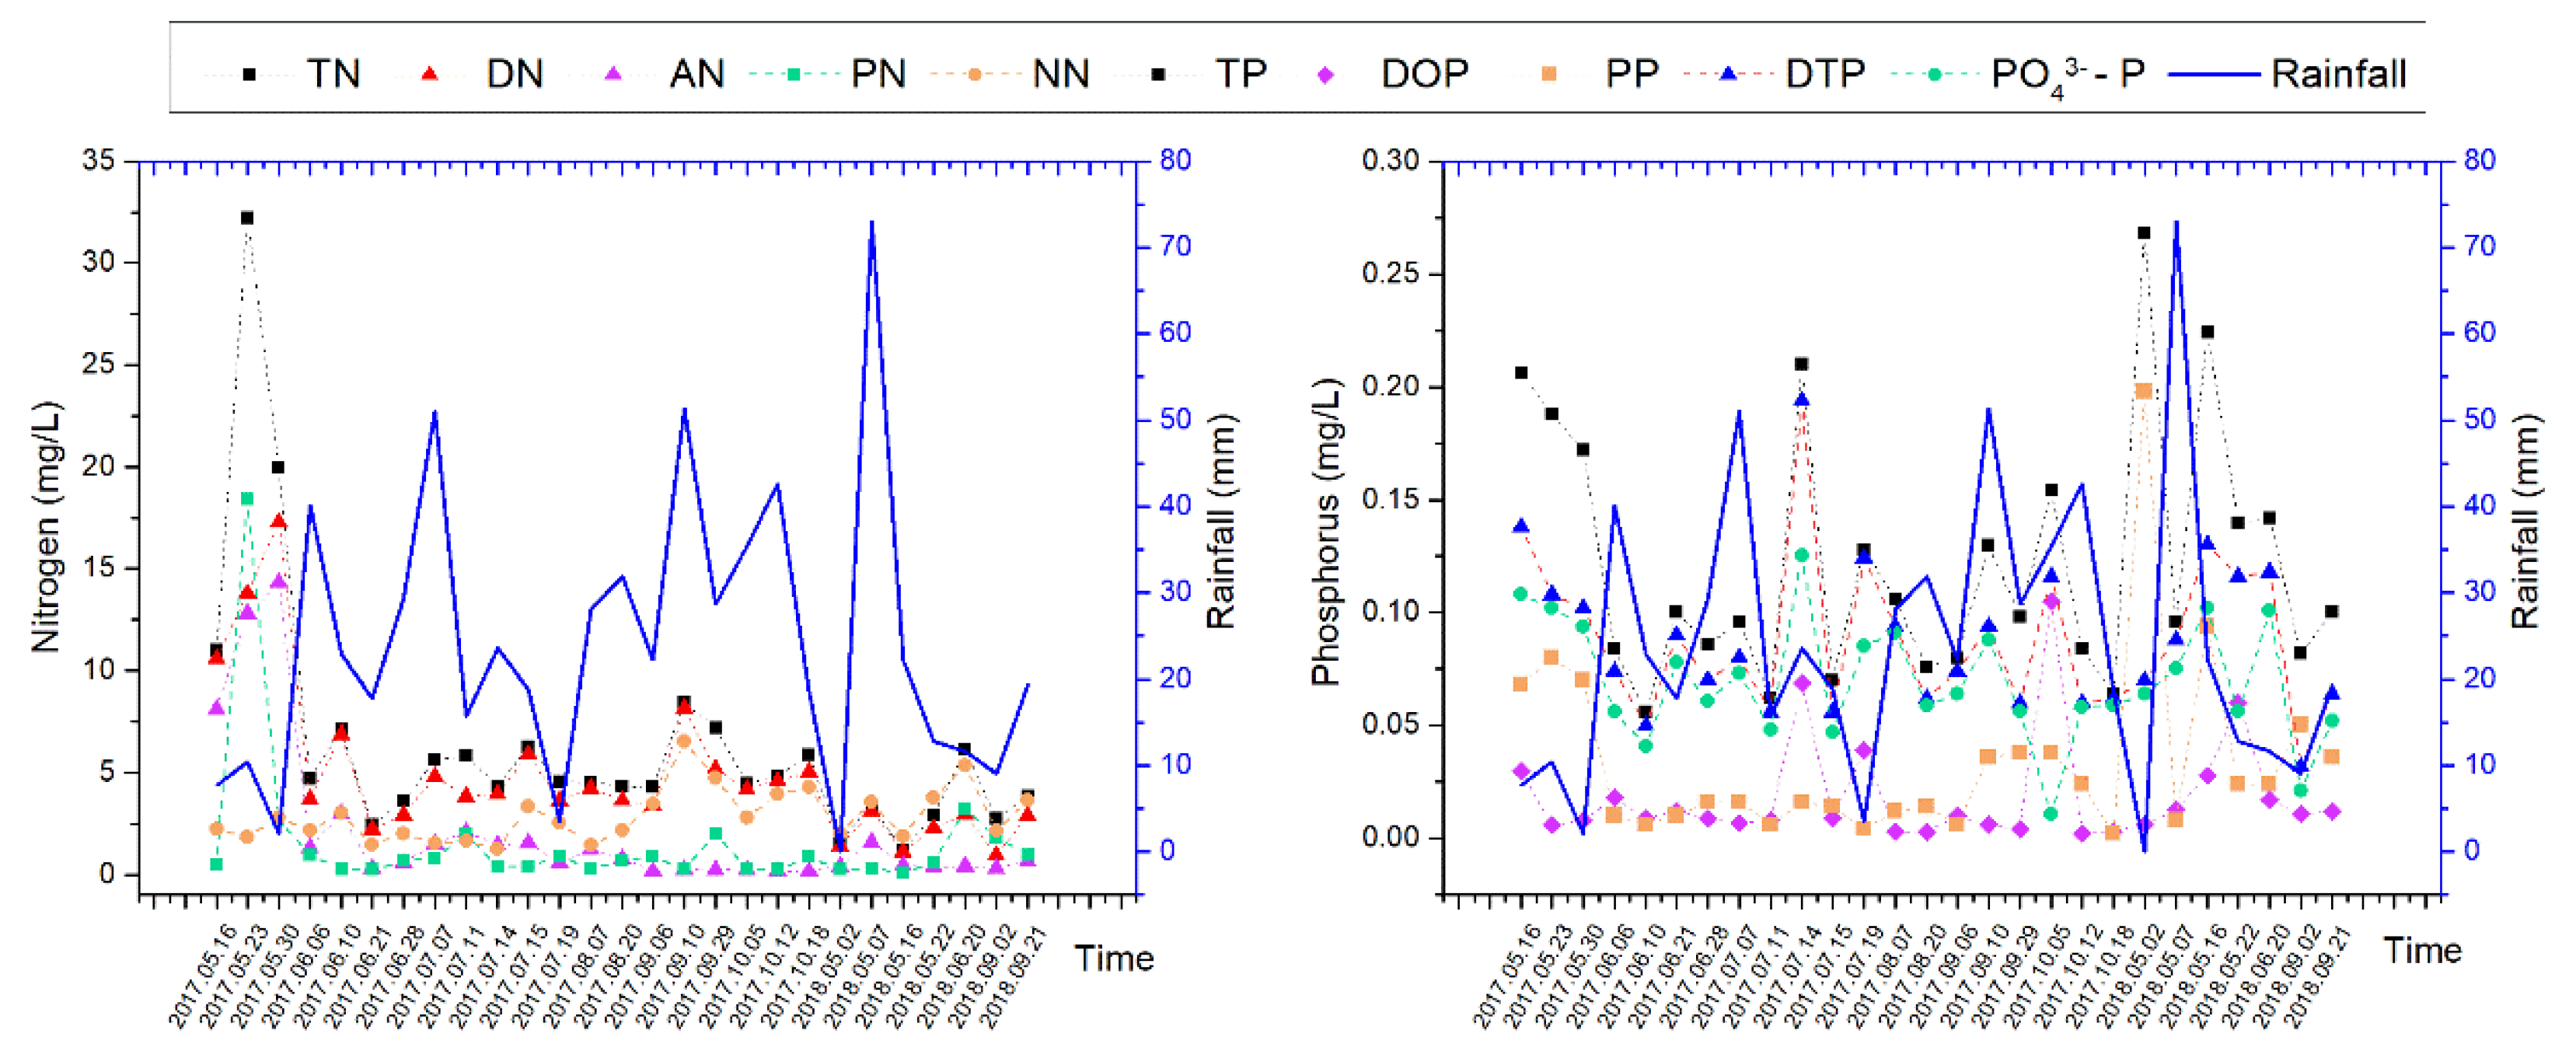
3.1.3. Changes of Nitrogen and Phosphorus in Forest Runoff Plots

The total nitrogen concentration of woodland in this study exhibited four peaks during 2017–2018 (Figure 4). The highest value appeared on 28 June 2017, and its value reached 23.14 mg/L. TN, DN, and AN displayed a consistent change trend, and the main output form was observed to be DN. The change of phosphorus concentration in woodland had three high peaks during the rainfall. The highest primary phosphorus concentration was on 29 September 2017, and the highest value reached was 6.56 mg/L. The trends for TP, PP, and PO43−-P are similar. The main output mode of phosphorus was PO43−-P. Figure 4 shows strong correlation between total nitrogen concentration in forestland and rainfall, and the formation of runoff that comprises the peak and valley of nitrogen and phosphorus concentration in the water quality of forestland monitoring plots can also be seen. When the slope is greater than 17°, the amount of soil erosion with rainfall runoff will increase [27].
Forest land is used as a “sink” for NPSP in most areas, and this causes degradation, buffering, and other effects on NPSPs. The main external sources of nutrients such as nitrogen and phosphorus in woodland runoff communities include the decay of leaves, vegetation, and litter by long-term microorganisms. When rainfall forms runoff, it erodes the forest soil. Subsequently, the surface soil migrates with the runoff, causing the loss of nutrients such as nitrogen and phosphorus. Therefore, forestland can also be used as a “source” of pollution, as it transports nutrients such as nitrogen and phosphorus to the outside world. Forest slope and rainfall conditions (rainfall level, intensity, duration, etc.,) affect soil nutrient loss and loss patterns. A greater runoff strengthens the effect of soil erosion.

3.1.4. Changes of Nitrogen and Phosphorus in Groundwater

Most of the nutrients in well water are formed by the infiltration of surface water into the ground. Except for the high nitrogen content on 20 August 2017 (Figure 5), the nitrogen content concentration was relatively stable at other times in this study. The average values of TN, DN, and NN were 7.03 mg/L, 5.85 mg/L, 6.11 mg/L, respectively. NN is the main component of TN dissolved in water, and there are large differences in the concentration of different kinds of phosphorus in well water. The main phosphorus component in water is DTP. With the formation of rainfall, the phosphorus content in the water fluctuates greatly. DTP in surface runoff easily enters the water body through infiltration after rainfall, and the phosphorus composition and rainfall intensity change significantly as a consequence. The change characteristics of nitrogen and phosphorus in groundwater in this study are similar to those of many groundwater studies [28,29]. Well water is formed by surface water penetrating into the ground, meaning that changes in the nitrogen and phosphorus content of well water can reflect the state of surface water after filtration.

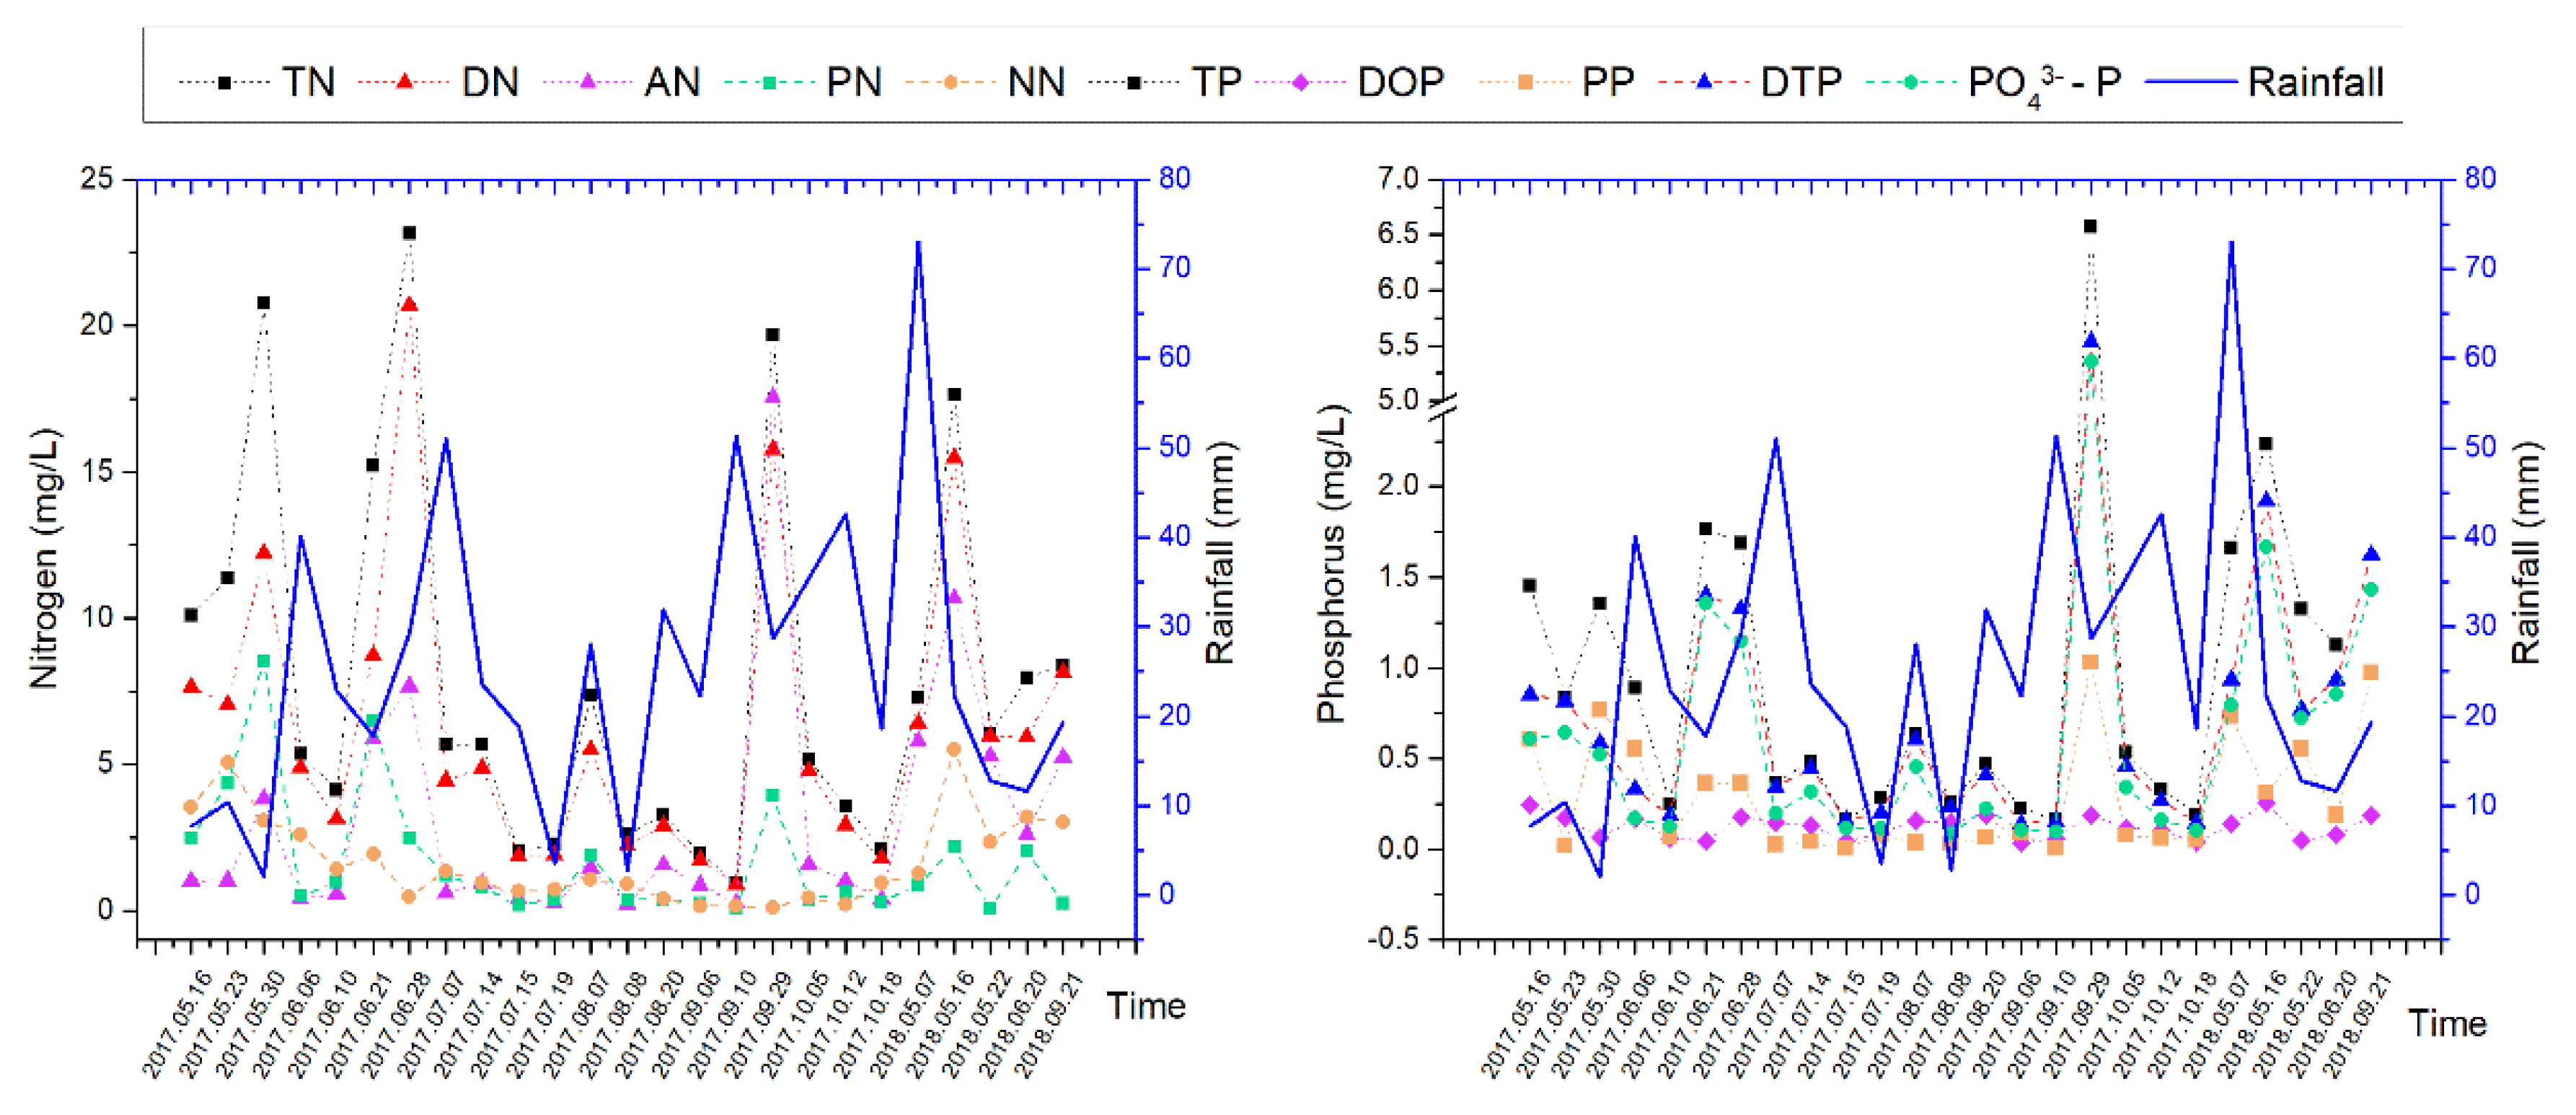
3.1.5. Changes of Nitrogen and Phosphorus in Surface Water

The process of surface runoff caused by rainfall causes the loss of nitrogen and phosphorus [30]. River water in this study is primarily derived from the collection of precipitation in the surrounding woodland and farmland. The water body itself has a self-purification effect, meaning that the change of nitrogen and phosphorus in river water analyzed is also the state of nitrogen and phosphorus after self-purification. The results in Figure 6 indicate that nitrogen in the river showed an extremely high value in mid-to-late May at the beginning of the rainfall, and then fluctuated while also remaining at low levels. The contents of NN and PN are higher than other indicators, with average concentrations of 2.79 mg/L and 1.42 mg/L, respectively. The contents of each component fluctuated greatly during the initial rainfall, but changed smoothly at other times. This is likely due to a lack of effective runoff formed during the dry season, as most of the pollutants flowed into the water body through the initial runoff. However, the initial rainfall was small, limiting the digestion of pollutants and exceeding the self-purification capacity of the water body. Therefore, the first rainfall likely caused the surface water nutrients to reach extremely high values. In subsequent rainfalls, the dual effects of rainfall and the rainfall cycle were likely responsible for keeping the value of nitrogen in a stable state. According to these observations, it appears that phosphorus in surface water has a strong relationship with rainfall and seasonal changes. Similarly, other studies have shown that the surface nitrogen and phosphorus output pathways can be attributed to surface runoff, and the seasonality of the output load is significant [31,32].

3.2. Comparative Study of Water Quality under Different Land Use Types

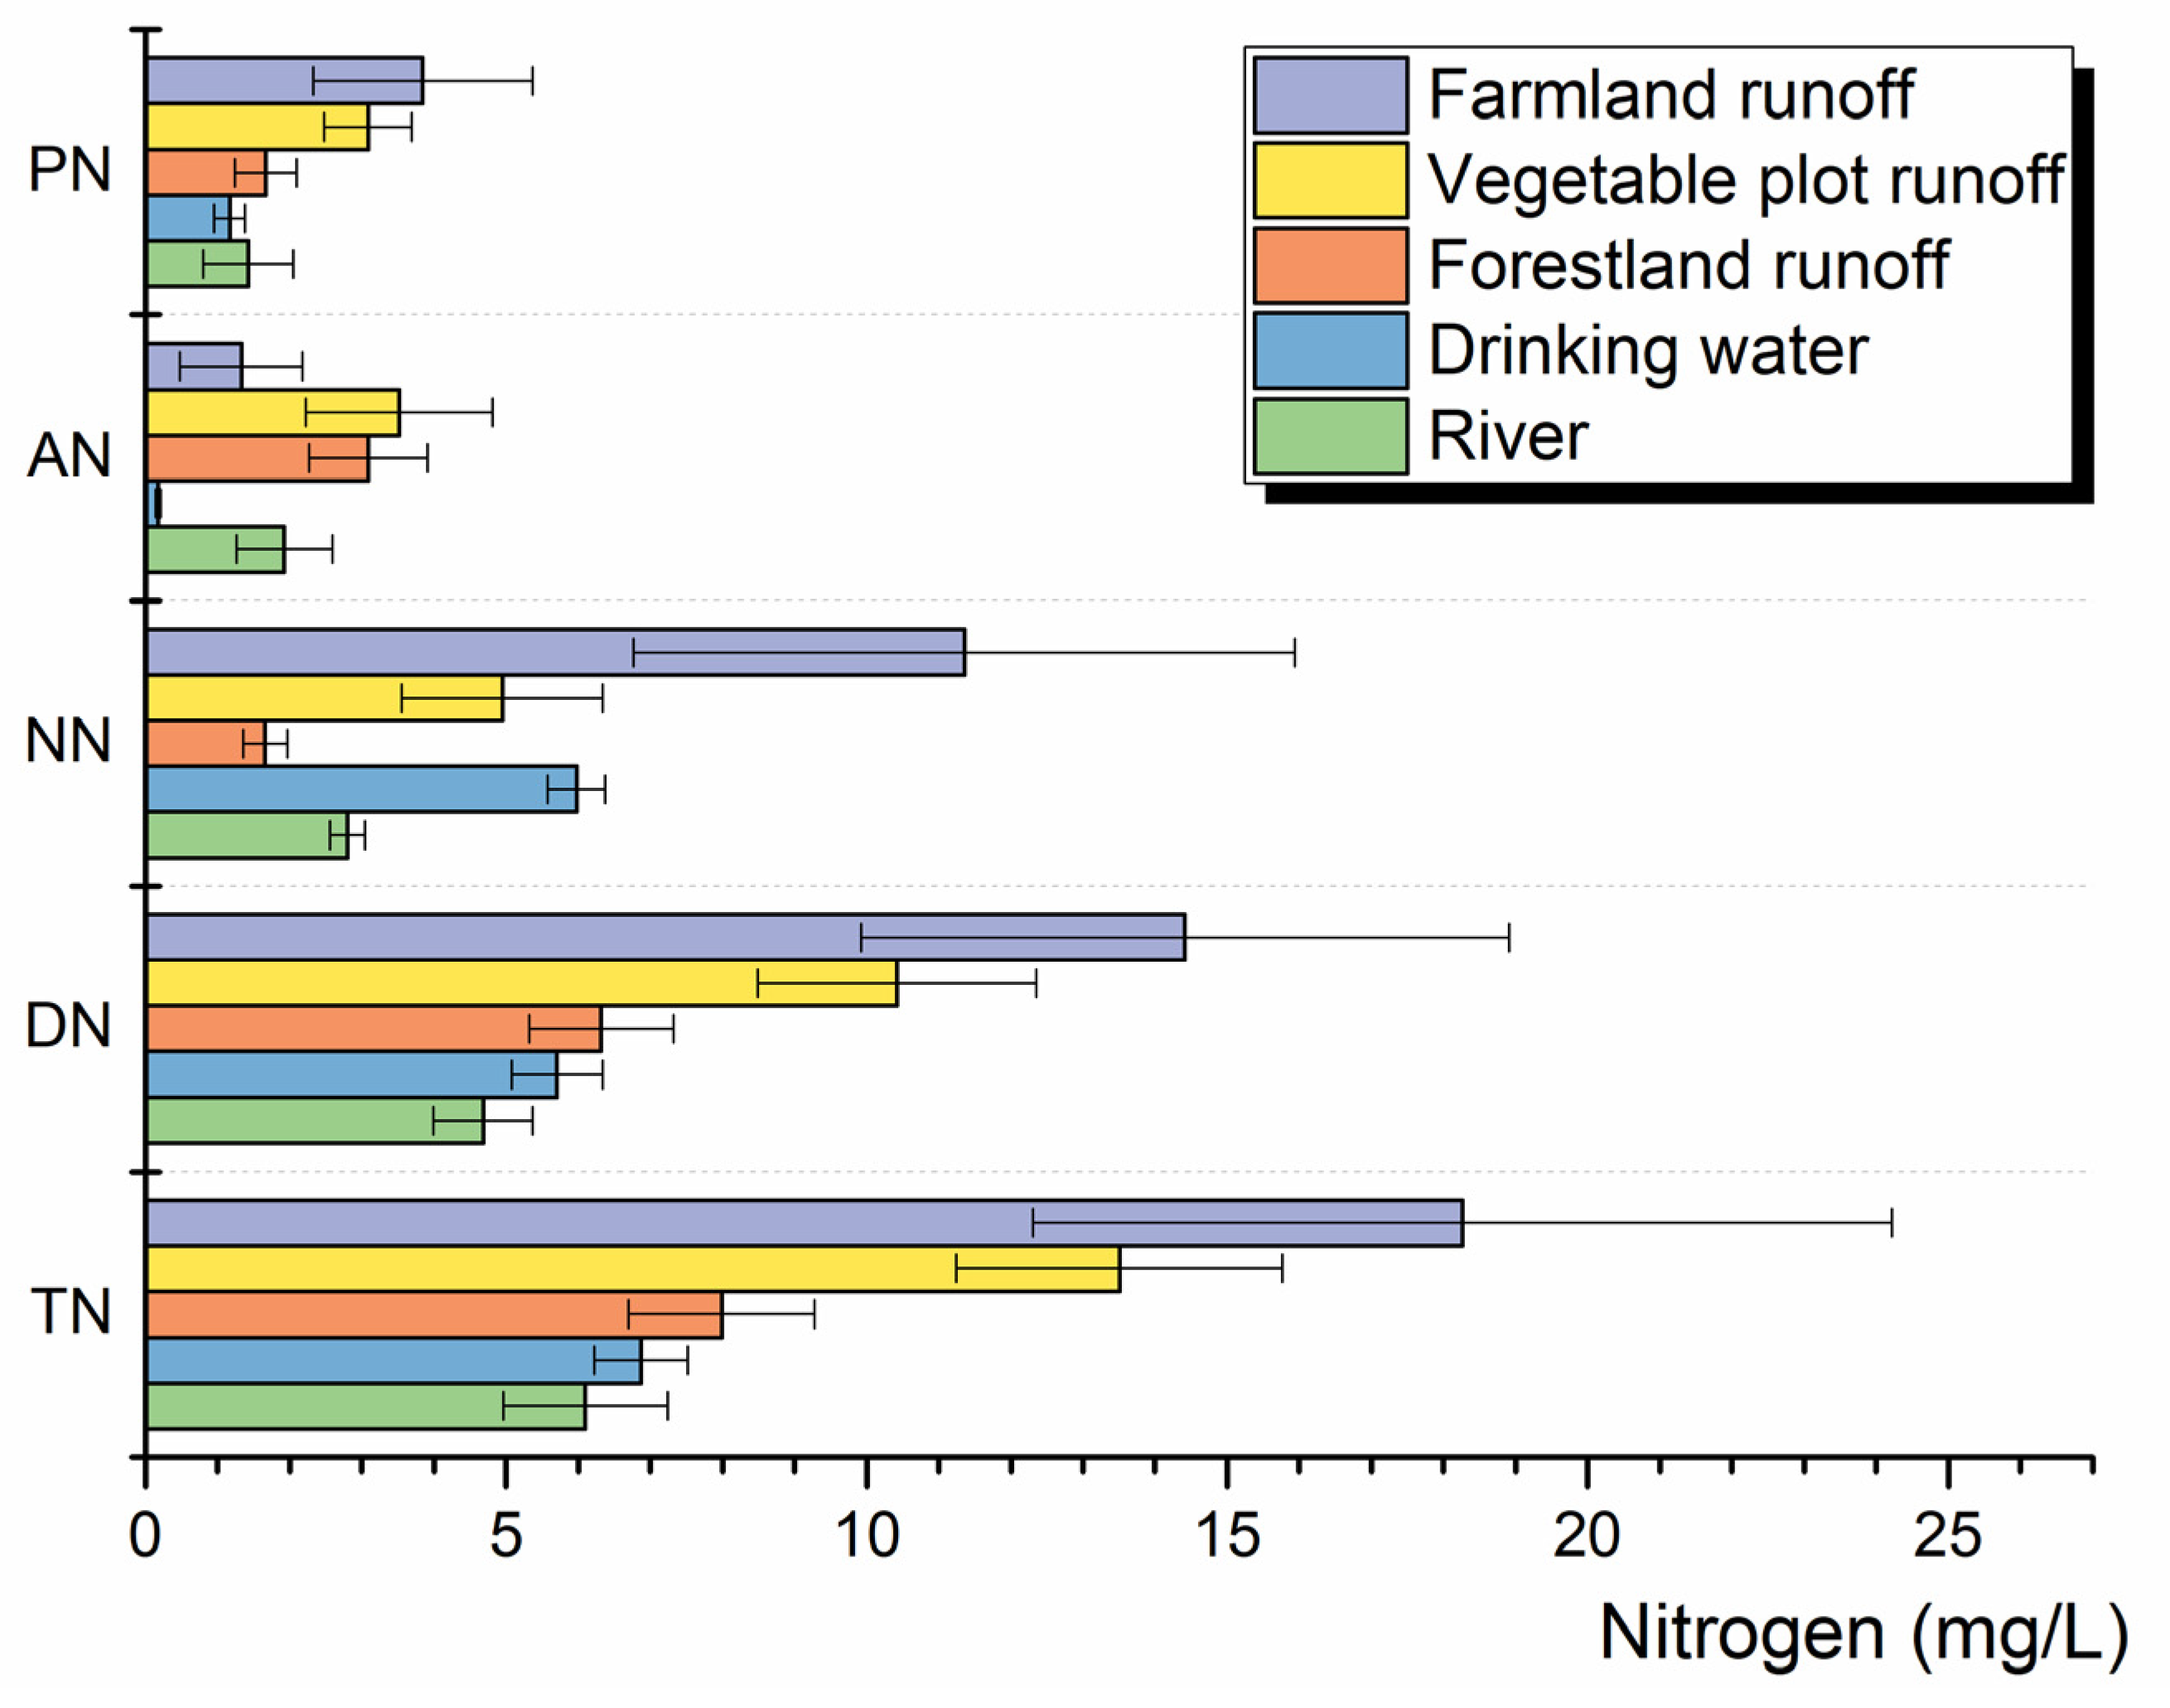
3.2.1. Comparison of Nitrogen Content in Different Land Use Types

In this study, the farmland water body, vegetable fields, woodland, well water, and river water were monitored by long-term runoff in the sub-watershed. The nitrogen concentration of the different types of samples exhibited significant differences (Figure 7). The overall nitrogen concentration levels are ranked as farmland > vegetable field > forestland. This shows that total nitrogen output forms at different points, and is strongly affected by the types of sample points. Different measures should be taken for NPSP source pollution control. The average value of TN in farmland in this study was 18.26 mg/L, and the concentration of TN in farmland runoff was significantly different from TN concentration in forestland, well water, and river water. The average value of vegetable field TN was 13.50 mg/L. This concentration was observed to be significantly different from that of forestland, well water, and river water. Key differences were observed in nitrogen concentrations of different types in the five runoff monitoring sample points. When compared with vegetable fields and farmland, forestland was observed to be more conducive to the buffering, adsorption, and fixation of nitrogen. An appropriate increase in crop cover in farmland and vegetable fields could effectively reduce the amount of nitrogen and phosphorus easily absorbed on eroded soil in surface runoff.
The main source of nitrogen in farmland is the application of chemical fertilizers. In vegetable fields, it is livestock manure and domestic sewage. The main source of nitrogen in forest land is self-replacement in the ecosystem. Nitrogen output from well water and river water is primarily derived from infiltration and runoff. As previously mentioned, the output forms of nitrogen are mainly DN and NN. The high NN concentration of well water is due to the precipitation of nitrogen-containing groundwater into the ground through soil pores and the poor self-purification ability of the groundwater body. This is consistent with the results of significantly higher groundwater nitrogen content in cultivated areas studied by Hallberg [33] and others. AN is unstable and volatile, and it is easy for vegetation to absorb and use AN. As a result, the AN concentration in runoff is typically low. PN is easily adsorbed on the surface of soil and organic matter, so its content in runoff is also usually low.

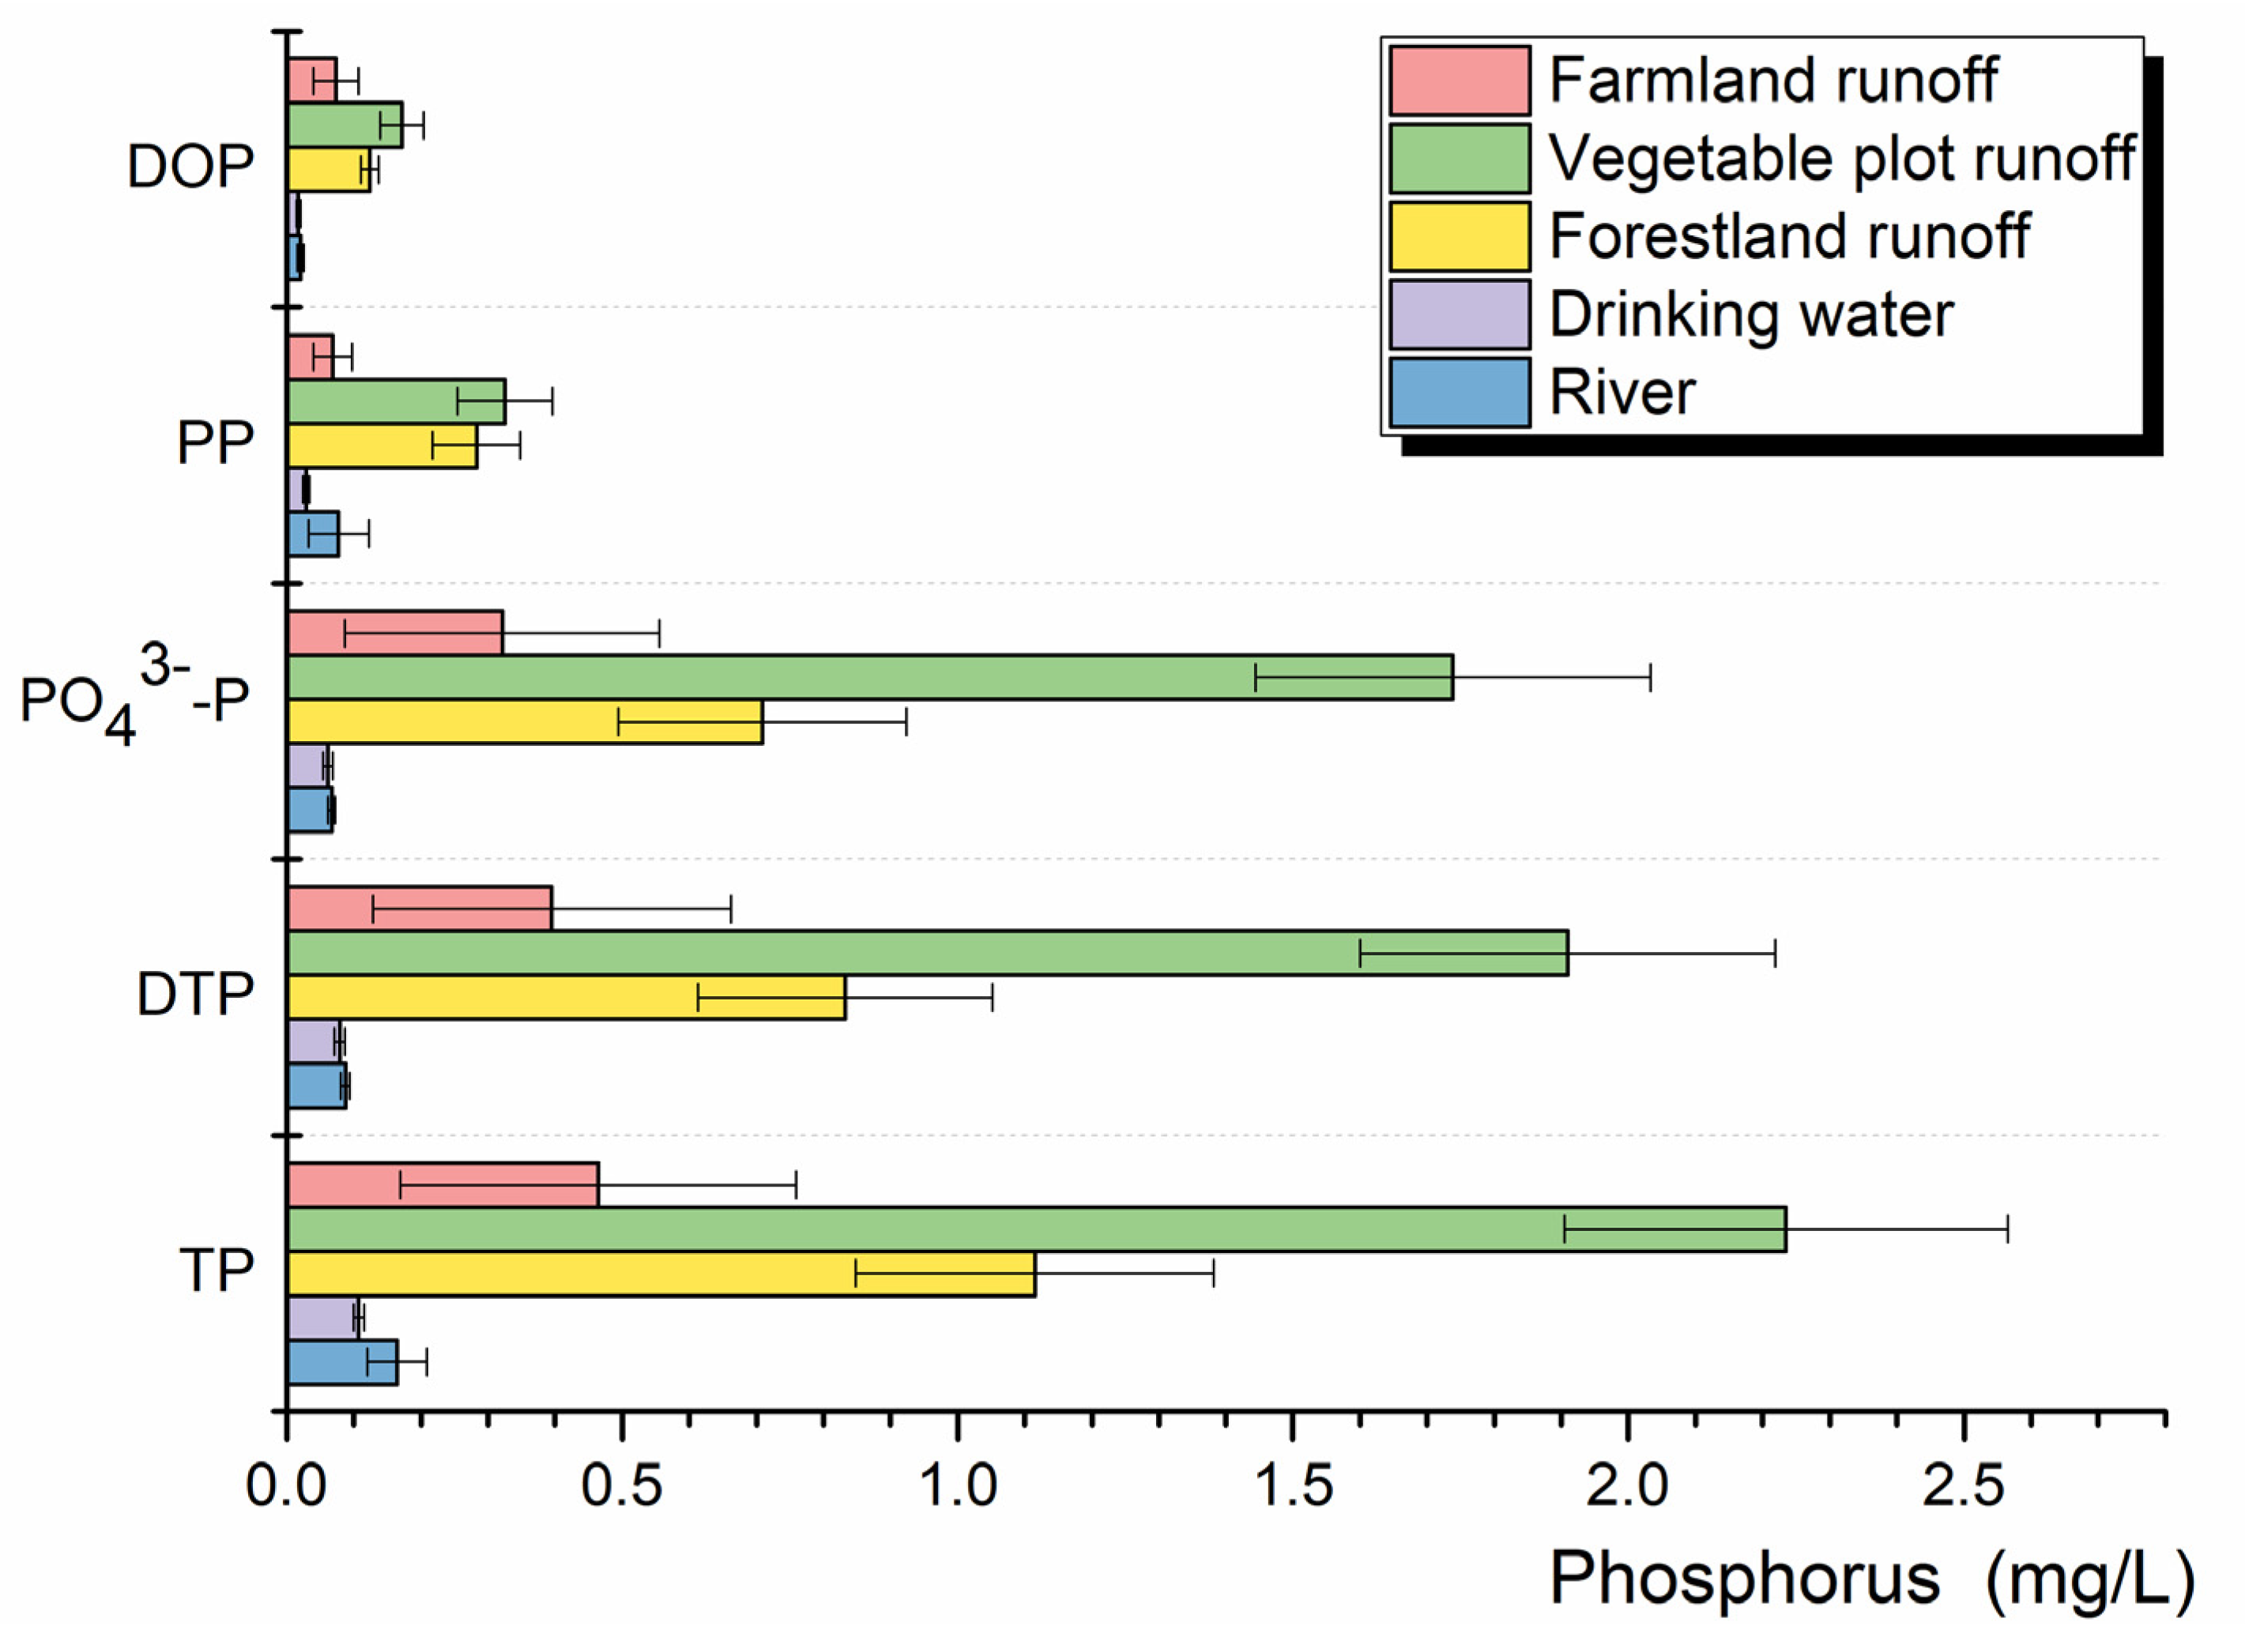
3.2.2. Comparison of Phosphorus Content in Different Land Use Types

The phosphorus and nitrogen concentration in farmland, vegetable land, forestland, well water and river water runoff in the sub-watershed are quite different (Figure 8). The phosphorus content in these land use types are ranked as vegetable land > forest land > farmland. The concentrations of DOP, PP, PO43−-P, DTP, and TP in river water and well water are much lower than those in vegetable, woodland, and farmland runoff. The overall TP, DTP, and PO43−-P of vegetable field runoff are also much higher than those of woodland and farmland runoff. The average TP of vegetable field runoff was 2.23 mg/L, and the TP content of vegetable field was 2 times and 4.82 times that of woodland and farmland runoff, respectively. DTP and PO43−-P in vegetable plots reached 1.91 mg/L and 1.73 mg/L, respectively. DTP and PO43−-P in crop plots were only 0.39 mg/L and 0.32 mg/L, respectively. A medium level of DTP and PO43−-P was observed in forestland. PO43−-P in vegetable, forestland, and farmland accounted for 77.7%, 63.5%, and 69.3% of TP, respectively. Therefore, PO43−-P is the main output method of phosphorus and has an important impact on eutrophication of water bodies. This study is similar to the migration characteristics of phosphorus in the xitiao river along with the amount of rainstorm runoff [34].

4. Conclusions

The output of NPSP has a strong relationship with different land use types, and rainfall has a large impact on the output of NPSP. In this study, the relationship between nitrogen, phosphorus, and rainfall in different runoff communities and the types of output were analyzed, and the nitrogen and phosphorus output of different land use types were compared. The results of our study led to the following conclusions:
(1) Nitrogen and phosphorus loss in runoff plots of different land use types are affected by the rainfall intensity and fertilization periods. Nitrogen and phosphorus content in runoff formed immediately after fertilization in farmland and vegetable plots, and displayed a significant increase. The loss of nitrogen and phosphorus in forestland is directly affected by rainfall intensity. Greater amounts of rainfall result in higher losses of nitrogen and phosphorus.
(2) The main sources of nitrogen in NPSP are farmland and vegetable fields, and the main source of phosphorus is vegetable fields. NN is the primary form of nitrogen loss in NPSP, and NN within farmland runoff accounts for 69.8% of the total nitrogen content. The main component of phosphorus loss in NPSP is PO43−-P, and vegetable fields are the main source of this. The TP content in vegetable fields is 2 times and 4.82 times that of forestland and farmland runoff, respectively. This shows that the nitrogen in NPSP is primarily derived from planting, while most phosphorus originates from domestic sewage and livestock breeding. Overall, agriculture has the greatest impact on water quality.
(3) Nitrogen and phosphorus pollution have a defined incubation period. In the dry season of the reservoir area (November–April), it is difficult for rainfall to form effective runoff. Because of this, underutilized nutrients such as nitrogen and phosphorus will settle in the soil. When the rainy season arrives, nitrogen and phosphorus deposited on the soil will be taken away following the first rainfall runoff. Therefore, controlling NPSP requires effective management of the first runoff generated by rainfall.

Author Contributions

Conceptualization, J.Y. and J.L.; Methodology, J.Y.; Supervision, G.Y.; Validation, Y.F.; Writing—original draft, J.Y. and J.L.; Writing—review and editing, J.Y., G.R., C.R., X.H. and X.W. All authors have read the paper and agreed to publish this version of manuscript.

Funding

This research was funded by National Major Science and Technology Projects of China, grant number 2015FY110400-3.

Conflicts of Interest

The authors declare no conflict of interest.

References

  1. Kuo, Y.-M.; Liu, W.-W.; Zhao, E.; Li, R.; Muñoz-Carpena, R. Water quality variability in the middle and down streams of Han River under the influence of the Middle Route of South-North Water diversion project, China. J. Hydrol. 2019, 569, 218–229. [Google Scholar] [CrossRef]
  2. Carpenter, S.R.; Caraco, N.F.; Correll, D.L.; Howarth, R.W.; Sharpley, A.N.; Smith, V.H. Nonpoint pollution of surface waters with phosphorus and nitrogen. Ecol. Appl. 1998, 8, 559–568. [Google Scholar] [CrossRef]
  3. Zhang, B.-L.; Cui, B.-H.; Zhang, S.-M.; Wu, Q.-Y.; Yao, L. Source apportionment of nitrogen and phosphorus from non-point source pollution in Nansi Lake Basin, China. Environ. Sci. Pollut. Res. 2018, 25, 19101–19113. [Google Scholar] [CrossRef] [PubMed]
  4. Liu, R.M.; Xu, F.; Zhang, P.P.; Yu, W.W.; Men, C. Identifying non-point source critical source areas based on multi-factors at a basin scale with SWAT. J. Hydrol. 2016, 533, 379–388. [Google Scholar] [CrossRef]
  5. Kronvang, B.; Græsbøll, P.; Larsen, S.E.; Svendsen, L.M.; Andersen, H.E. Diffuse nutrient losses in Denmark. Water Sci. Technol. 1996, 33, 81–88. [Google Scholar] [CrossRef]
  6. Zhang, W.L.; Hong-Jie, J.I.; Kolbe, H.; Ai-Guo, X.U. Estimation of Agricultural Non-Point Source Pollution in China and the Alleviating Strategies II. Status of Agricultural Non-Point Source Pollution and the Alleviating Strategies in European and American Countries. Sci. Agric. Sin. 2004, 37, 1018–1025. [Google Scholar]
  7. Huang, J.J.; Lin, X.J.; Wang, J.H.; Wang, H. The precipitation driven correlation based mapping method (PCM) for identifying the critical source areas of non-point source pollution. J. Hydrol. 2015, 524, 100–110. [Google Scholar] [CrossRef]
  8. Du, X.; Su, J.; Li, X.; Zhang, W. Modeling and Evaluating of Non-Point Source Pollution in a Semi-Arid Watershed: Implications for Watershed Management. CLEAN Soil Air Water 2015, 44, 247–255. [Google Scholar] [CrossRef]
  9. Li, C.W.; Hu, J.; Wang, S.; Li, L. The source-sink landscape pattern change and its effect on phosphorus pollution in Yuqiao watershed. Acta Ecol. Sin. 2012, 32, 2430–2438. [Google Scholar]
  10. Guo, S.; Xu, Y.; He, C.; Wu, S.; Ren, C.; Han, X.; Feng, Y.; Ren, G.; Yang, G. Differential responses of soil quality in revegetation types to precipitation gradients on the Loess Plateau. Agric. For. Meteorol. 2019, 276, 107622. [Google Scholar] [CrossRef]
  11. Wang, S.; Fu, B.; Gao, G.; Liu, Y.; Zhou, J. Responses of soil moisture in different land cover types to rainfall events in a re-vegetation catchment area of the Loess Plateau, China. Catena 2013, 101, 122–128. [Google Scholar] [CrossRef]
  12. Zhang, W.; Qiao, W.J.; Gao, D.X.; Dai, Y.Y.; Deng, J.; Yang, G.H.; Han, X.H.; Ren, G.X. Relationship between soil nutrient properties and biological activities along a restoration chronosequence of Pinus tabulaeformis plantation forests in the Ziwuling Mountains, China. Catena 2018, 161, 85–95. [Google Scholar] [CrossRef]
  13. Tong, S.T.Y.; Chen, W.L. Modeling the relationship between land use and surface water quality. J. Environ. Manag. 2002, 66, 377–393. [Google Scholar] [CrossRef] [PubMed]
  14. Kibena, J.; Nhapi, I.; Gumindoga, W. Assessing the relationship between water quality parameters and changes in landuse patterns in the Upper Manyame River, Zimbabwe. Phys. Chem. Earth 2014, 67–69, 153–163. [Google Scholar] [CrossRef]
  15. Fang, S.Q.; Yang, J.; Qiang, Y.F.; Wang, Y.D.; Jian-Chao, X.I.; Feng, Y.Z.; Yang, G.H.; Ren, G.X.; Aamp, N.; University, F. Distribution and environmental risk assessment of fertilizer application on farmland in the water source of the middle route of the South-to-North Water Transfer Project. J. Agro-Environ. Sci. 2018, 37, 124–136. [Google Scholar]
  16. Wang, Y.; Liang, J.; Yang, J.; Ma, X.; Li, X.; Wu, J.; Yang, G.; Ren, G.; Feng, Y. Analysis of the environmental behavior of farmers for non-point source pollution control and management: An integration of the theory of planned behavior and the protection motivation theory. J. Environ. Manag. 2019, 237, 15–23. [Google Scholar] [CrossRef]
  17. Wang, Y.; Yang, J.; Liang, J.; Qiang, Y.; Fang, S.; Gao, M.; Fan, X.; Yang, G.; Zhang, B.; Feng, Y. Analysis of the environmental behavior of farmers for non-point source pollution control and management in a water source protection area in China. Sci. Total Environ. 2018, 633, 1126–1135. [Google Scholar] [CrossRef]
  18. SEPA, C. Methods for Monitoring and Analysis of Water and Wastewater, 4th ed.; China Environmental Science Press: Beijing, China, 2002. [Google Scholar]
  19. Gao, Y.; Zhu, B.; Yu, G.; Chen, W.; He, N.; Wang, T.; Miao, C. Coupled effects of biogeochemical and hydrological processes on C, N, and P export during extreme rainfall events in a purple soil watershed in southwestern China. J. Hydrol. 2014, 511, 692–702. [Google Scholar] [CrossRef]
  20. Zhang, Y.; Wang, S.; Duan, C.; Jiao, L.; Wang, Y.; Gao, Q. Spatial-temporal variations of nitrogen and phosphorus forms in sediment pore-water as affected by submerged plant in Lake Dianchi. J. Lake Sci. 2018, 30, 314–325. [Google Scholar]
  21. Ju, X.T.; Kou, C.L.; Zhang, F.S.; Christie, P. Nitrogen balance and groundwater nitrate contamination: Comparison among three intensive cropping systems on the North China Plain. Environ. Pollut. 2006, 143, 117–125. [Google Scholar] [CrossRef] [Green Version]
  22. Major, J.; Rondon, M.; Molina, D.; Riha, S.J.; Lehmann, J. Maize yield and nutrition during 4 years after biochar application to a Colombian savanna oxisol. Plant Soil 2010, 333, 117–128. [Google Scholar] [CrossRef]
  23. Fang, Q.; Yu, Q.; Wang, E.; Chen, Y.; Zhang, G.; Wang, J.; Li, L. Soil nitrate accumulation, leaching and crop nitrogen use as influenced by fertilization and irrigation in an intensive wheat–maize double cropping system in the North China Plain. Plant Soil 2006, 284, 335–350. [Google Scholar] [CrossRef]
  24. Ju, X.T.; Xing, G.X.; Chen, X.P.; Zhang, S.L.; Zhang, L.J.; Liu, X.J.; Cui, Z.L.; Yin, B.; Christie, P.; Zhu, Z.L. From the Cover: Reducing environmental risk by improving N management in intensive Chinese agricultural systems. Proc. Natl. Acad. Sci. USA 2009, 106, 3041–3046. [Google Scholar] [CrossRef] [Green Version]
  25. Liu, Y. Dynamic Changes of Water Nitrogen and Phosphorus Concentrations in a Typical Small Agricultural Watershed of the Three-Gorges Reservior Region. Master’s Thesis, Southwest University, Chongqing, China, 2014. [Google Scholar]
  26. Johnson, L.; Richards, C.; Host, G.; Arthur, J. Landscape influences on water chemistry in Midwestern stream ecosystems. Freshw. Biol. 1997, 37, 193–208. [Google Scholar] [CrossRef]
  27. Huang, Z.; Han, L.; Zeng, L.; Xiao, W.; Tian, Y. Effects of land use patterns on stream water quality: A case study of a small-scale watershed in the Three Gorges Reservoir Area, China. Environ. Sci. Pollut. Res. 2016, 23, 3943–3955. [Google Scholar] [CrossRef]
  28. Lang, M.; Li, P.; Yan, X. Runoff concentration and load of nitrogen and phosphorus from a residential area in an intensive agricultural watershed. Sci. Total Environ. 2013, 458–460, 238–245. [Google Scholar] [CrossRef] [PubMed]
  29. Chen, X.; Wo, F.; Chen, C.; Fang, K. Seasonal changes in the concentrations of nitrogen and phosphorus in farmland drainage and groundwater of the Taihu Lake region of China. Environ. Monit. Assess. 2010, 169, 159–168. [Google Scholar] [CrossRef] [PubMed]
  30. Luo, P.; He, B.; Duan, W.; Takara, K.; Nover, D. Impact assessment of rainfall scenarios and land-use change on hydrologic response using synthetic Area IDF curves. J. Flood Risk Manag. 2018, 11, S84–S97. [Google Scholar] [CrossRef]
  31. Bronstert, A. Rainfall-Runoff Modeling for Assessing Impacts of Climate and Land Use Change. Encycl. Hydrol. Sci. 2006. [Google Scholar]
  32. Wei, W.; Chen, L.; Fu, B.; Huang, Z.; Wu, D.; Gui, L. The effect of land uses and rainfall regimes on runoff and soil erosion in the semi-arid loess hilly area, China. J. Hydrol. 2007, 335, 247–258. [Google Scholar] [CrossRef]
  33. Hallberg, G.R. The impacts of agricultural chemicals on ground water quality. GeoJournal 1987, 15, 283–295. [Google Scholar] [CrossRef]
  34. Liang, T.; Wang, H.; Zhang, S.; Zhang, X.; Yu, X. Characteristics of phosphorous losses in surface runoff and sediment under different land use in West tiaoxi catchment. Chin. J. Environ. Sci. 2003, 24, 35–40. [Google Scholar]
Figure 1. Location of the study area.
Sustainability 12 02012 g001
Figure 2. The change of nitrogen and phosphorus with rainfall in farmland.
Sustainability 12 02012 g002
Figure 3. The change of nitrogen and phosphorus with rainfall in vegetable field.
Sustainability 12 02012 g003
Figure 4. The change of nitrogen and phosphorus with rainfall in forestland.
Sustainability 12 02012 g004
Figure 5. The change of nitrogen and phosphorus with rainfall in groundwater.
Sustainability 12 02012 g005
Figure 6. The change of nitrogen and phosphorus with rainfall in river.
Sustainability 12 02012 g006
Figure 7. Comparison of water quality nitrogen under different runoff monitoring types.
Sustainability 12 02012 g007
Figure 8. Comparison of phosphorus in water under different runoff monitoring types.
Sustainability 12 02012 g008
Table 1. The basic conditions of runoff monitoring in sub-basins.
CategorySample NumberLongitudeLatitudeGradientRainfall Level
I (<10 mm)II (10–24.9 mm)III (25–49.9 mm)IV (50–99.9 mm)
Farmland21111.391433.201110°4862
Vegetable field20111.393533.202410°41173
Forestland25111.397133.202230°2973
River28111.389633.206161273
Well water28111.394533.201561273

