Effect of Urbanization on Vegetation in Riparian Area: Plant Communities in Artificial and Semi-Natural Habitats


Graduate School of Environmental Studies, Nagoya University, Nagoya 4648601, Japan
*
Author to whom correspondence should be addressed.
Sustainability 2020, 12(1), 204; https://0-doi-org.brum.beds.ac.uk/10.3390/su12010204
Submission received: 28 October 2019
/
Revised: 4 December 2019
/
Accepted: 22 December 2019
/
Published: 25 December 2019
(This article belongs to the Special Issue Biodiversity Conservation and Sustainable Urban Development)
Abstract
:Riparian areas are local hot spots of biodiversity that are vulnerable and easily degraded. Comparing plant communities in habitats with different degrees of urbanization may provide valuable information for the management and restoration of these vulnerable habitats. In this study, we explored the impact of urbanization on vegetation communities between artificial and semi-natural habitats within two rivers with different levels of development. We compared species richness, types of vegetation, and composition patterns of the plants in our study. In artificial habitats, the sites with relatively high levels of urbanization had the highest species richness, while in semi-natural habitats, the highest species richness was recorded in the less urbanized sites. Furthermore, every component of urbanization that contributed to the variation of species richness was examined in the current study. In artificial habitats, the proportion of impervious surface was the strongest predictor of the variation in species richness and was associated with the richness of alien, native, and riparian species. In semi-natural habitats, most of the richness of alien and native species were associated with the distance to the city center, and the number of riparian and ruderal species was significantly related to the proportion of impervious surface. Moreover, we found that a high level of urbanization was always associated with a large abundance of alien and ruderal species in both artificial and in semi-natural habitats. We recommend the methods of pair comparison of multiple rivers to analyze the impact of urbanization on plant species in riparian areas and have suggested various management actions for maintaining biodiversity and sustainability in riparian ecosystems.
1. Introduction
Riparian areas represent one of the most frequently found types of green area in the urban ecosystem. Riparian areas provide a range of essential ecosystem services including flood attenuation, riverbank stabilization, nutrient cycling, groundwater recharge, and providing habitats for plants and animals [1,2]. With the possible exception of ecosystem services, riparian areas increase the aesthetic value of urban and agricultural regions and expand people’s opportunities for outdoor activities. These services are particularly valuable in riparian areas of the world, where humans rely on these services for well-being [3].
In a rapidly urbanizing world, understanding the response of ecosystems to urbanization is needed to ensure that urban areas are planned for the sustainability of residents and nature [4]. With the development of urbanization, urban areas and the human population are increasing rapidly; a combination of processes or drivers including climate change, habitat transformation, fragmentation, specific urban environmental conditions, and human disturbance are confirmed to impact the biodiversity in urban areas [5,6,7]. As an attraction for human development, riparian areas are severely affected by urbanization. Firstly, urbanization within riparian areas increases the area of impervious surface, which decreases the infiltration of rainfall and leads to loss of original riparian habitat [8]. Secondly, urbanization exerts intensive anthropogenic pressure on these areas. These places are highly modified and affected by a large number of human activities [9,10]. Some of the most apparent types of disturbance consists of soil pollution, trampling of vegetation, and soil compaction [11,12]. These disturbances can facilitate the establishment of alien and ruderal species that can become common due to additional nutrient availability and because of the high input of propagules from habitat degradation and fragmentation [13]. Although managing urbanization impacts has become a conservation priority worldwide, the maintenance of riparian areas is often ignored.
Plant species diversity is linked strongly to habitat conditions and is directly mediated by urbanization and anthropogenic disturbance [14,15]. In recent decades, studies on the impact of urbanization on plant species diversity have generally been conducted at large spatial scales [16,17]. The urban–rural gradient is the most commonly used methodology, and it is considered to be a linear transect radiating out from the city core to the altered area [18]. Nevertheless, disentangling the effects of urbanization on riparian systems in an urban–rural gradient is difficult because in reality, this gradient is a complex mosaic of patches, especially when considering riparian areas [19,20]. Besides the urbanization effect, driving factors such as land-use type and landscape structure are widely recognized for their difference between urban and rural areas, and they influence one another mutually [21,22]. Few studies have explicitly examined the variation of plant species in some particular land-use categories in riparian areas. So far, how and to what extent urbanization may influence the vegetation of riparian areas is not well appreciated. For this study, we focused on the effect of urbanization on vegetation in central Japan, a region where most of the cities are developed in the lower reach of rivers. In Japan, the basins of rivers distinctly differ in urbanization level and in the intensity of anthropogenic disturbance [23]. These rivers can flow through metropolises and their satellite cities; thus, the riparian areas have been intensively transformed for the needs of irrigation, drinking water, and recreation of people, and are associated with a large number of residents and immigrant population [24,25]. Several river basins have not been changed by urban sprawl, and just a few small cities and villages are distributed along these rivers. The response of species richness to urbanization among different rivers is still poorly understood, which could hinder the implementation of effective management practices.
Understanding how urbanization influences vegetation in riparian areas is essential because these vegetation communities provide various critical ecosystem services and maintain a high level of biodiversity [1]. Valuable information for the management of these areas can be obtained by comparing the plant species diversity and composition in sites at different levels of urbanization. For this study, we identified the effects of urbanization on riparian vegetation from a novel perspective. This study aimed to analyze plant species within the same land-use type but under different degrees of urbanization. Specifically, we conducted comparisons of artificial (located inside urban area) and semi-natural (located outside urban areas) habitats of two rivers with different degrees of urbanization and development. Our objectives were to
- (1)
- Study the changes in plant species richness and composition in artificial and semi-natural habitats along an urbanization gradient. We expected that the species richness and abundance of alien and ruderal species might benefit from the urbanization.
- (2)
- Analyze which urbanization and environmental variables influence plant species richness and species composition in artificial and semi-natural habitats along an urbanization gradient. We hypothesized that the effects of urbanization factors on vegetation might vary with habitat type and that the dominant factor of plant species would also vary in habitat type.
2. Materials and Methods
2.1. Study Sites
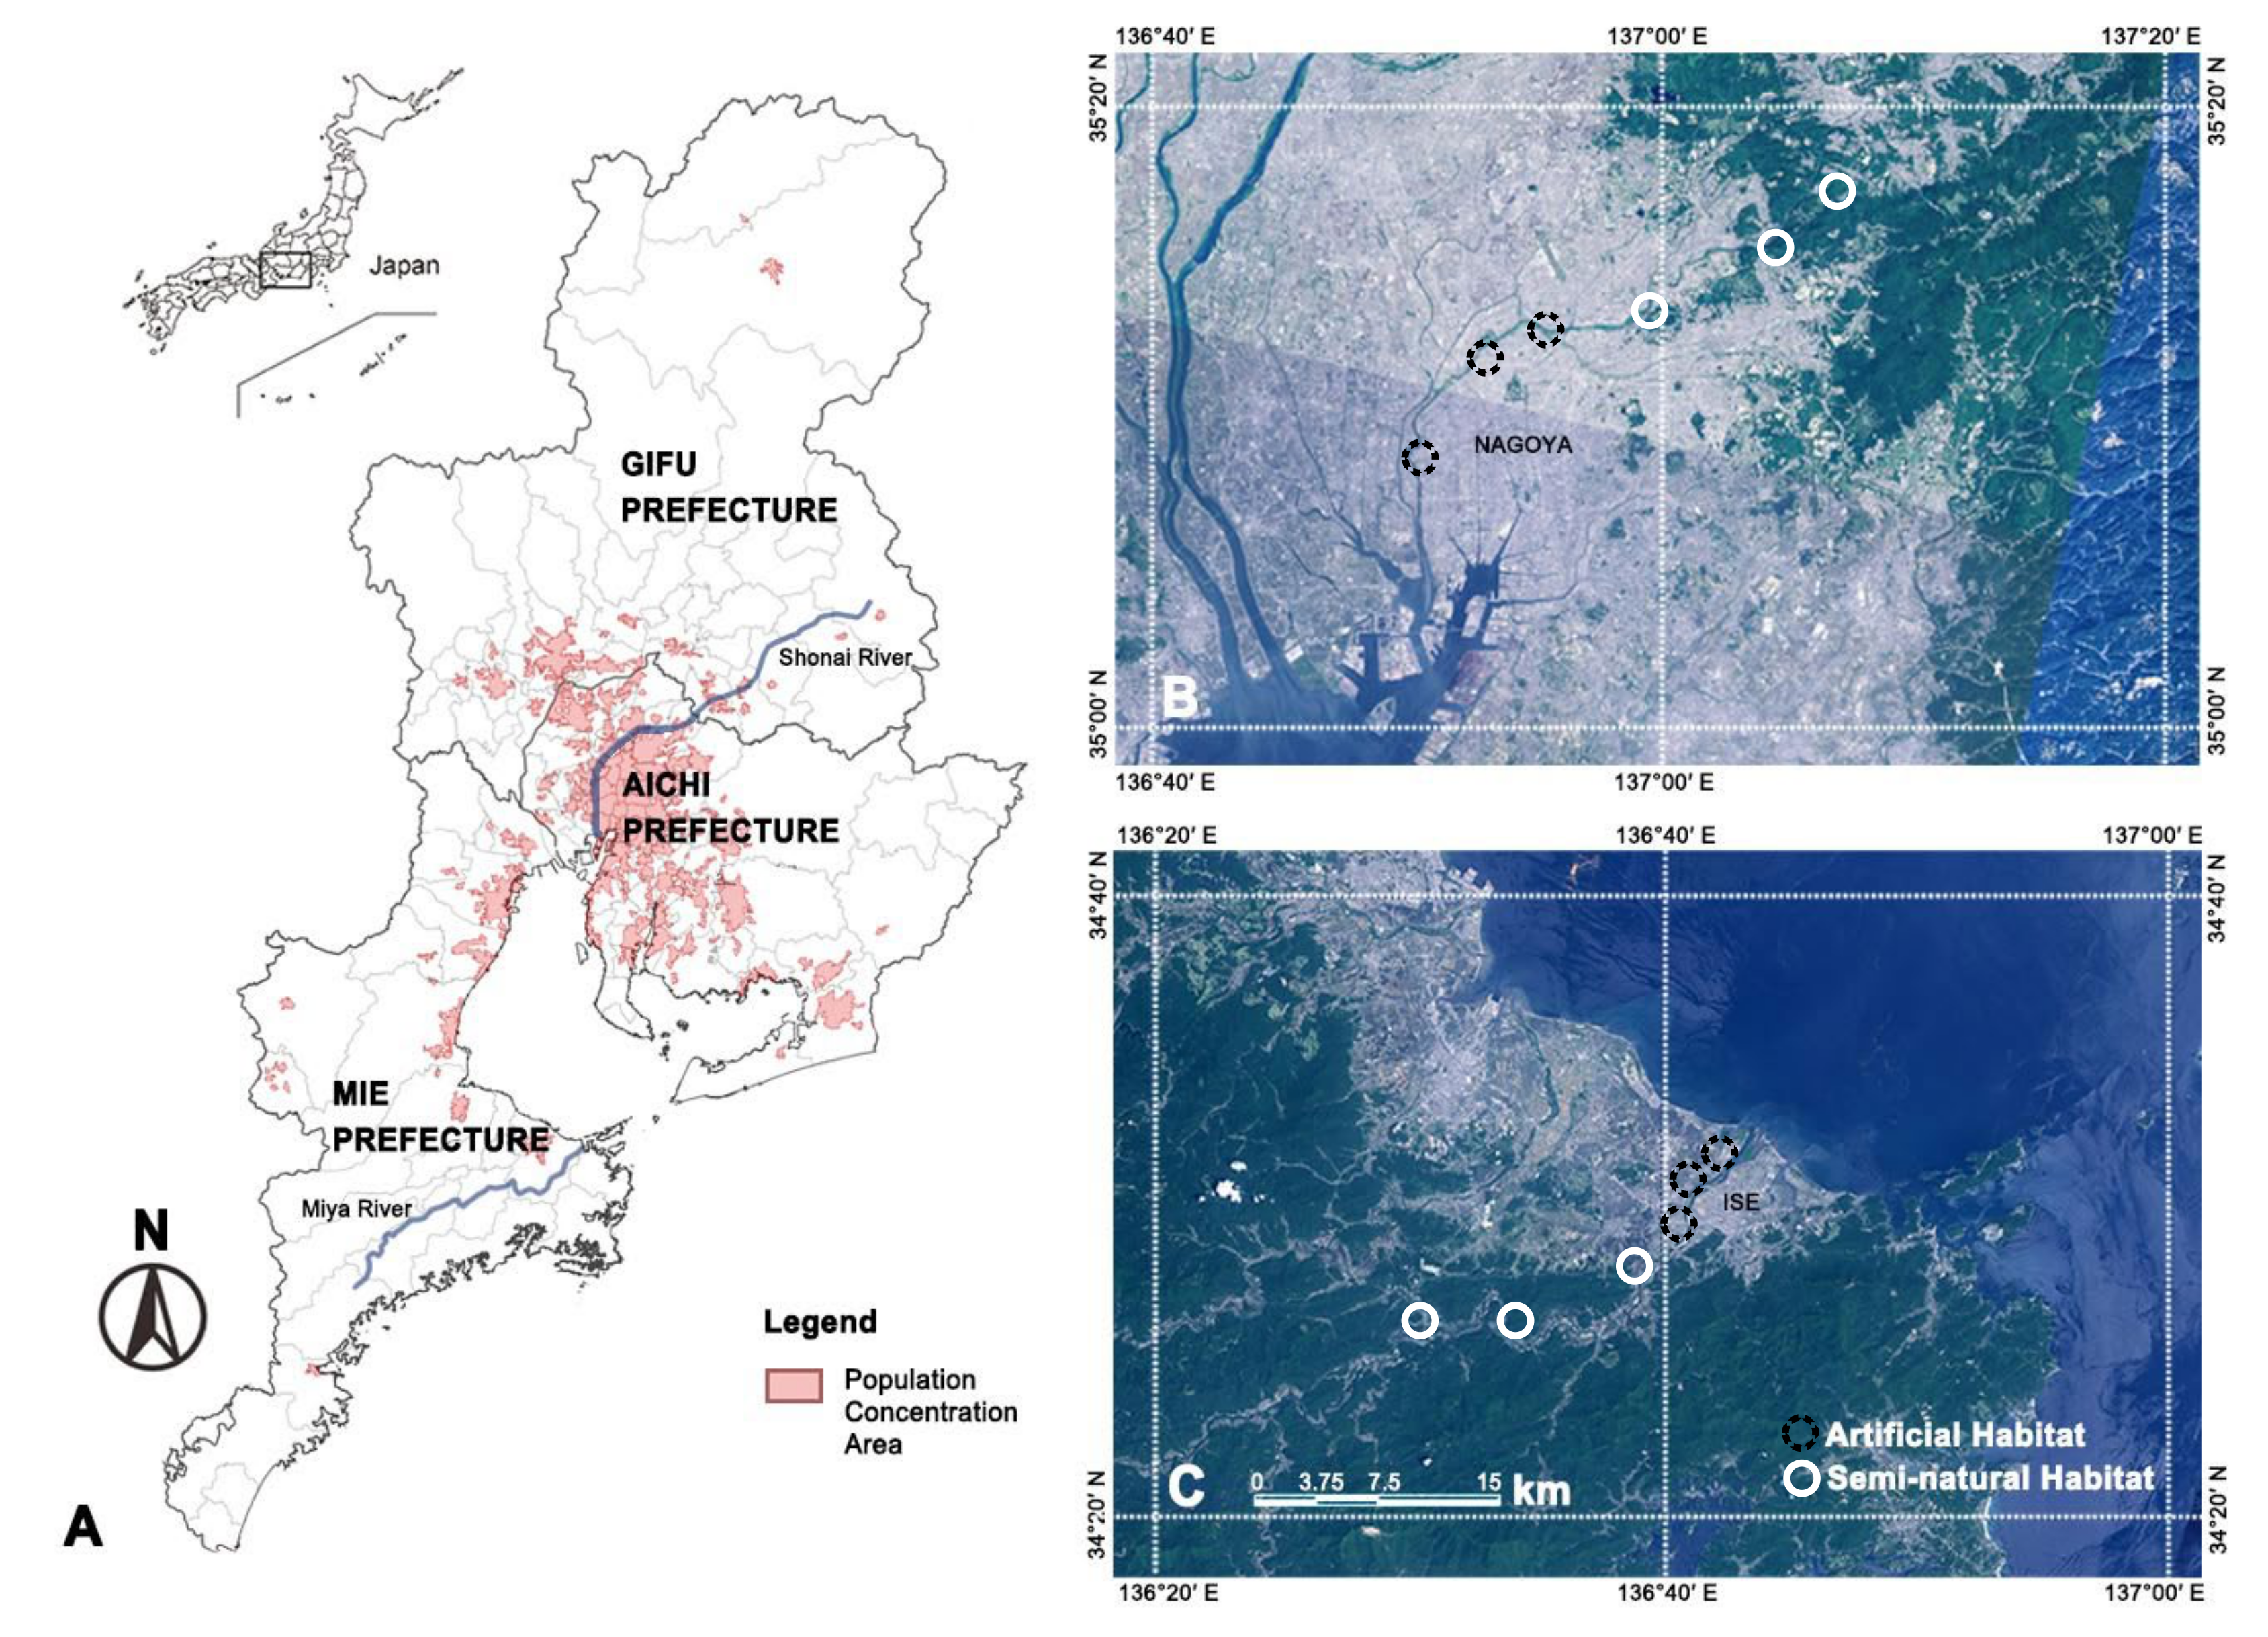
The study was conducted in the central region of Japan. We selected the riparian areas of Shonai River and Miya River for this study (Figure 1). The Shonai and Miya River originate from Mt. Yudachi and Mt. Ōdaigahara, respectively, and both of them flow into the Ise Bay. These two rivers belong to the same climatic region and are characterized by the same regional species pool. The geographical and environmental characteristics of the two rivers are listed in Table 1.
The Shonai River is regarded as one of the most urbanized rivers in Japan. In the basin area of the Shonai River, since the metropolitan city, Nagoya, and its satellite cities are located in the lower and middle reaches, the urbanization process has been remarkably developed since the 1950s. At present, the population of the basin exceeds 2.4 million. In the Moriyama ward of Nagoya City, urbanization development is still underway. In contrast to the Shonai River, the Miya River harbors only one small city (Ise) in its lower reaches, and 140,000 people live in the basin area. The populations in the basins and different land-use types reveal that Shonai and Miya River differ in levels of urbanization.
To explore the effect of urbanization on plant diversity and floristic composition, we selected riparian parks and wastelands as artificial and semi-natural habitats, in order to conduct a comparison of riparian areas of the two rivers.
Riparian parks were located in the city areas of Nagoya and Ise. These parks are close to residential areas and provide open recreational space for people living in the city areas. In order to access easily to the river flow and enjoy river scenery, all of the parks are riparian areas modified by a series of squares, playgrounds, hydrophilic platforms, and trails.
Wastelands were located outside the cities and surrounded by farmland, forest, and other unmanaged lands. They are abandoned and without vegetation management. Most of the wastelands kept their semi-natural appearance and provide habitats for wildlife. Due to the effect of urban sprawl, the wastelands along the Shonai River are fragmented by cities, while the wastelands along the Miya River present a relatively continuous area (Figure 1).
2.2. Vegetation Sampling
We selected three artificial habitats and three semi-natural habitats in each river (Table 2). Field surveys were conducted from 2018 to 2019, between April and July. The waterside lowland and major bed of riparian area were selected as the primary sampling area.
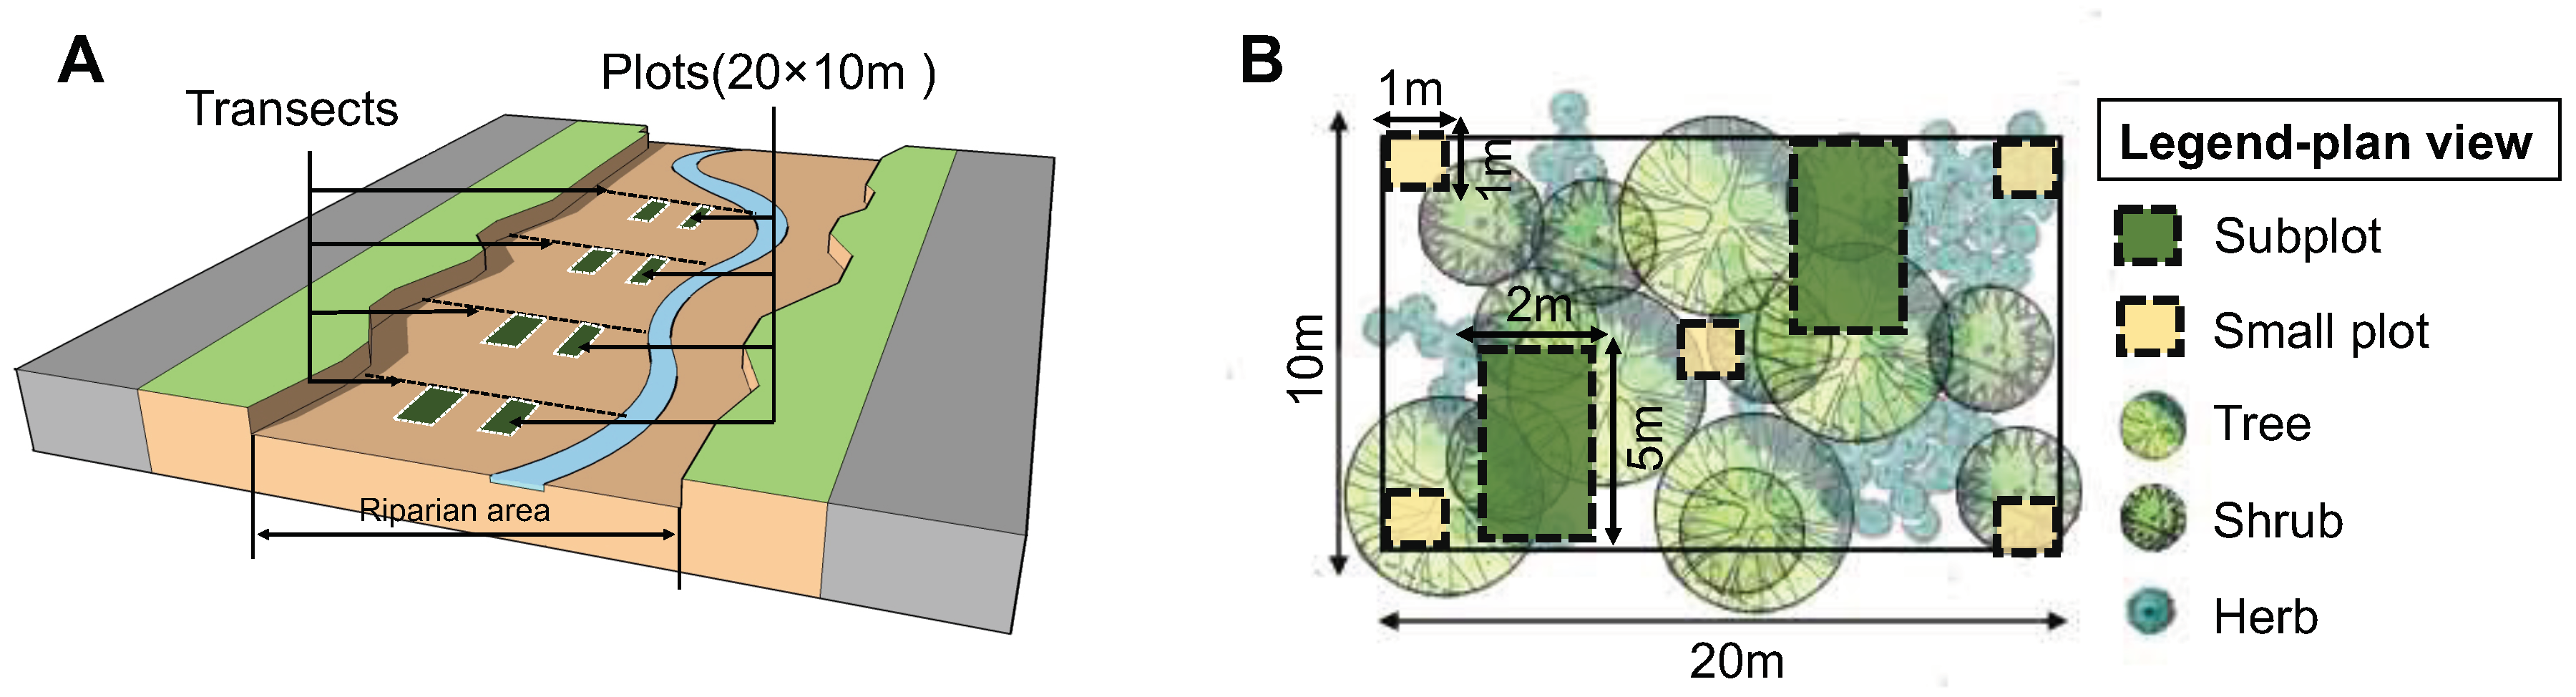
In each sampling site, four transects were established with 200 m intervals vertically to the river (Figure 2). To weaken the marginal effect, we excluded the area within two meters of the rivers. Two 20 × 10 m plots were established systematically, separated by 5 m distance along each transect. We recorded all the tree species in the 20 × 10 m plot, and two subplots of size 5 × 2 m were set for the sampling of shrubs and nested in the 20 × 10 m plot. The herbs were sampled in five small plots of 1 × 1 m and nested randomly in the 20 × 10 m plot.
2.3. Data Collection
In each plot, we measured several variables describing the characteristics of plant communities: the name, density, and coverage of all present plant species. The coverage of each species was measured by visual estimation [26], and the density of each shrub and herb species was measured by recording the number of plants in a 1 × 1 m range. Plant specimens were identified to the species level in the field, and the crop plants were excluded from the record. For the plant species that were not easily identifiable, specimens were collected and brought back to the laboratory, where they were identified by matching with an illustrated handbook of vegetation and preserved herbarium specimens.
According to the literature and field observations, each plant was classified using the following life-history attributes: (1) origins: alien (species introduced after the 19th century, when Japan abandoned its policy of national isolation) or native species [27]; (2) naturalness: riparian (riverside-endemic and hygrophilous species) or ruderal (synanthropic species and weeds, usually appearing with human activity) [28,29,30]; species richness (SR), as the total number of different species represented in an ecological community or habitat [31] was used to account for the diversity of vegetation in our study.
We used an extensive set of predictors to analyze the relationships between different components of urbanization and plant species. We used imperviousness (defined as rigid pavement area, i.e., roads, pavement, and ground, calculated in a 100 m radius from quadrat center within the riparian area), human population density (number of residents per km2 of the district where the sample plot was located), nearest distance to the city center, and traffic density (daily vehicle flow of the nearest road beside the riparian area). We also used other environmental factors known to affect plant diversity, such as climatic and topographic features and proportion of forest in a 100 m radius from each plot center. The data were collected as field measurements, downloaded from the government website, and calculated by ArcGIS 9.3 (ESRI, Redlands, CA, USA). A detailed description of urbanization and other environmental variables is shown in Table 3.
2.4. Statistical Analysis
The statistical analyses in our study included three aspects; all statistical analyses were done in R 3.0.2 (R Core Team 2014, Vienna, Austria).
For the first aspect, we compared the number of species and components of urbanization in different habitat types between two river basins. The differences were tested using the least significant difference (LSD) test in a one-way analysis of variance (ANOVA). The P values were corrected by a multiple-test Holm’s correction procedure. The package “agricolae” was used for LSD test with multiple-test Holm’s correction.
For the second aspect, to explore the relationships between urbanization and species richness, we used a generalized linear model (GLM) to analyze the species richness of the different types of plant with Poisson error distribution for count data. Both urbanization variables and other environmental variables were considered in the models. To avoid possible bias caused by multicollinearity, we conducted a multicollinearity test among all the variables. The results showed that there was no apparent multicollinearity between variables (Kappa value = 36.12). The best-fitting models were determined by corrected Akaike’s information criterion (AICc; adjusted for small sample size in relation to the number of parameters). We also calculated the variable importance for each urbanization variable so that we could compare the effect of each variable on species richness. Variable importance is the sum of the Akaike weights (wAICc), which measures the overall likelihood of interesting parameters appearing in the selected model [32]. The values of variable importance are bounded between 0 (variables excluded from all selected models) to 1 (variables included in all selected models). We calculated the variable importance according to the sum of the Akaike weights base on the criteria (delta AICc ≤ 4). The packages “glm2” and “MASS” were used for GLM, and “MuMIn” was used for model averaging.
For the third aspect, canonical correspondence analysis (CCA) was conducted to find the effect of urbanization and other environmental predictors on plant community composition. CCA is a method for direct gradient analysis which can be used to examine patterns in plots and/or species that have been constrained by a set of environmental variables. We used the abundance in each plot as species data, and for the environmental matrix we used the urbanization (population density, traffic density, distance to the city center, and proportion of impervious surface) and other environmental factors (annual precipitation, mean annual temperature, proportion of forest, altitude, and slope). The package “vegan” was used for CCA. Data from artificial and semi-natural habitats were analyzed separately.
3. Results
3.1. Plant Species Richness in Artificial and Semi-Natural Habitats
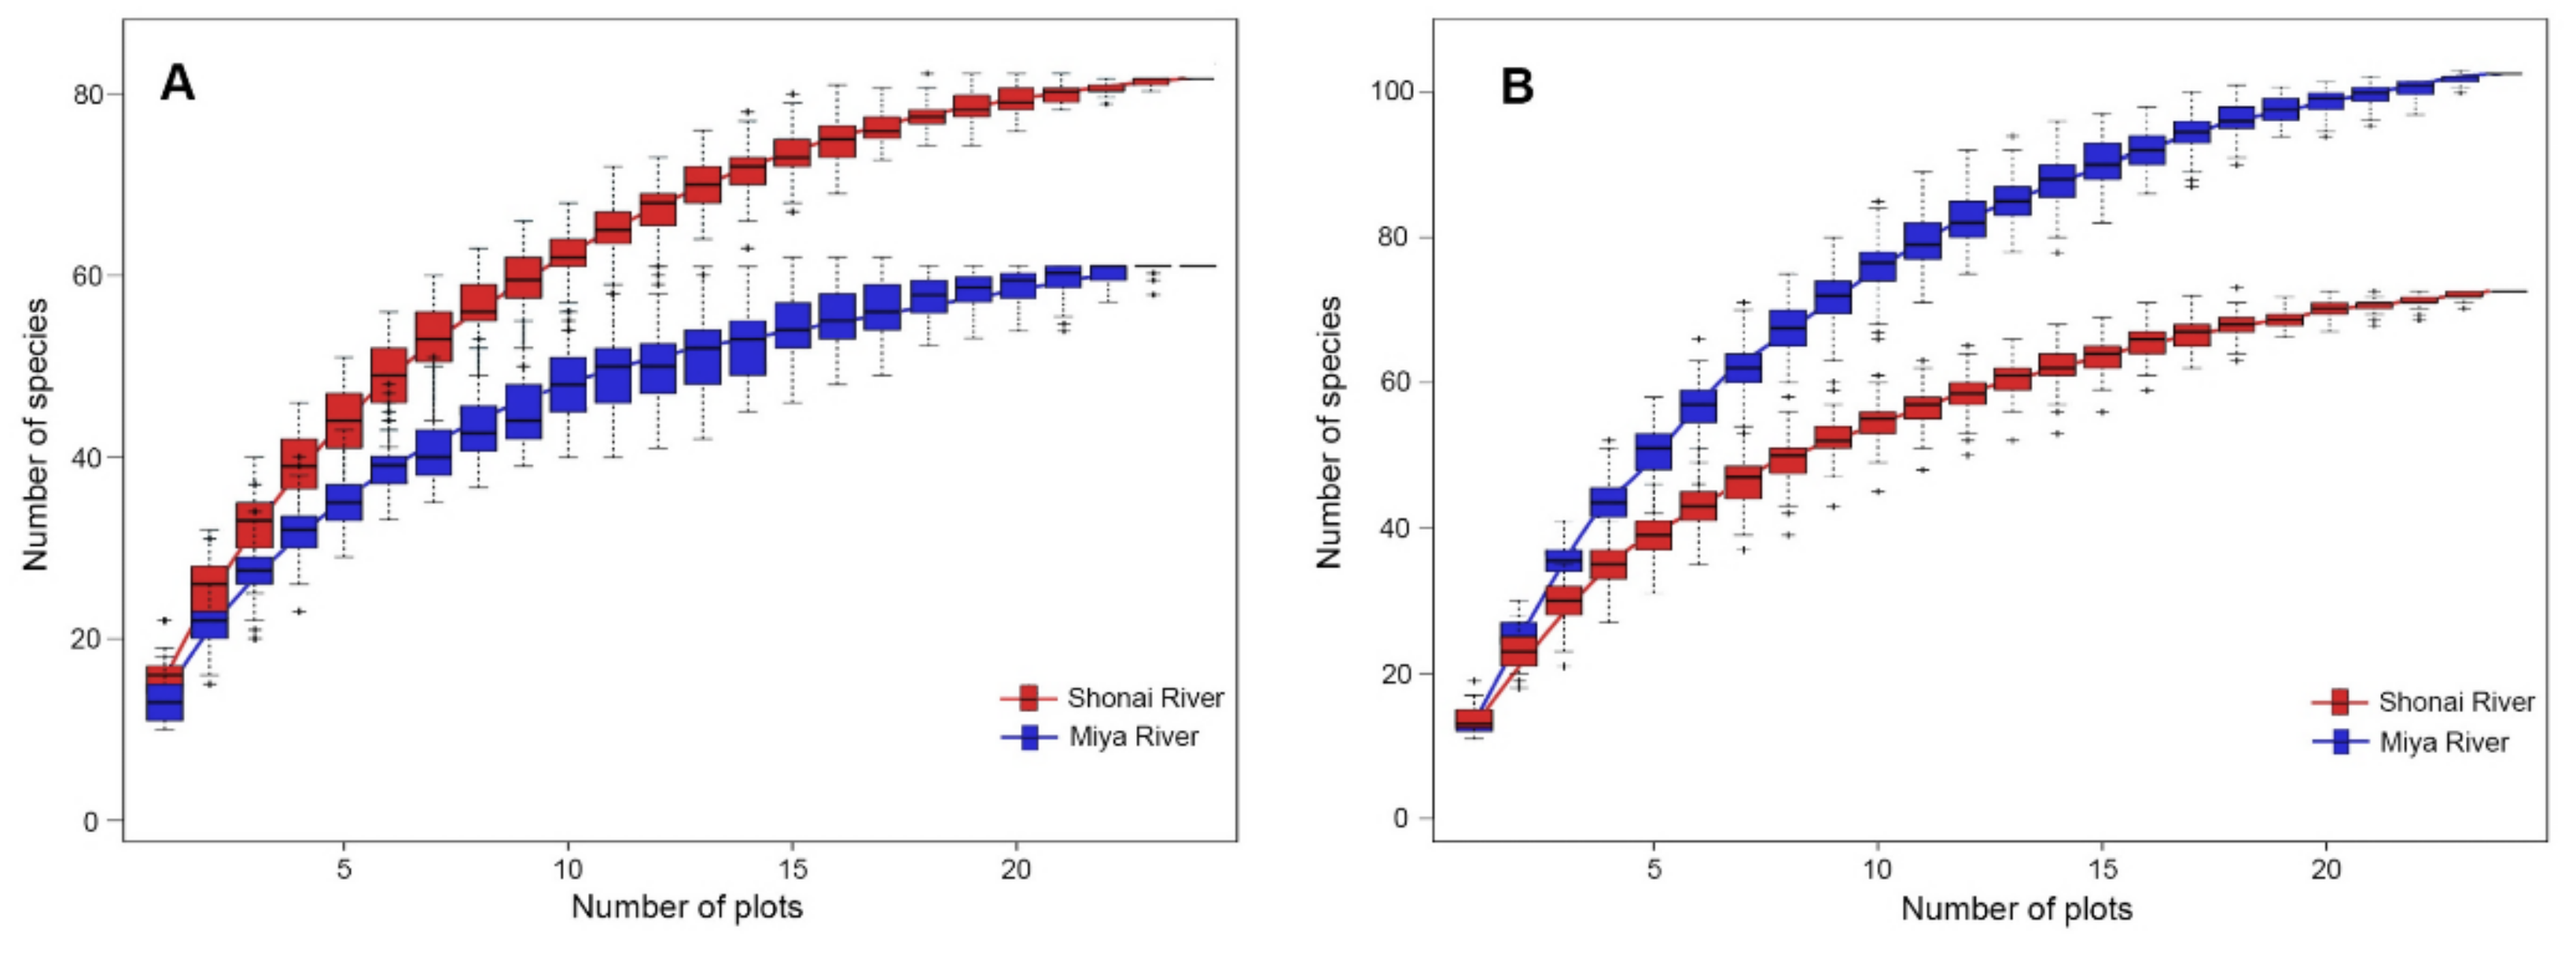
In the current study, the response of species richness to urbanization was observed to vary according to the types of habitat (Figure 3). In artificial habitat, the sites located within the Shonai River basin showed a higher species richness than those within the Miya River basin. Nevertheless, in semi-natural habitat, the sites located within the Miya River basin showed a higher degree of total species richness than the Shonai River.
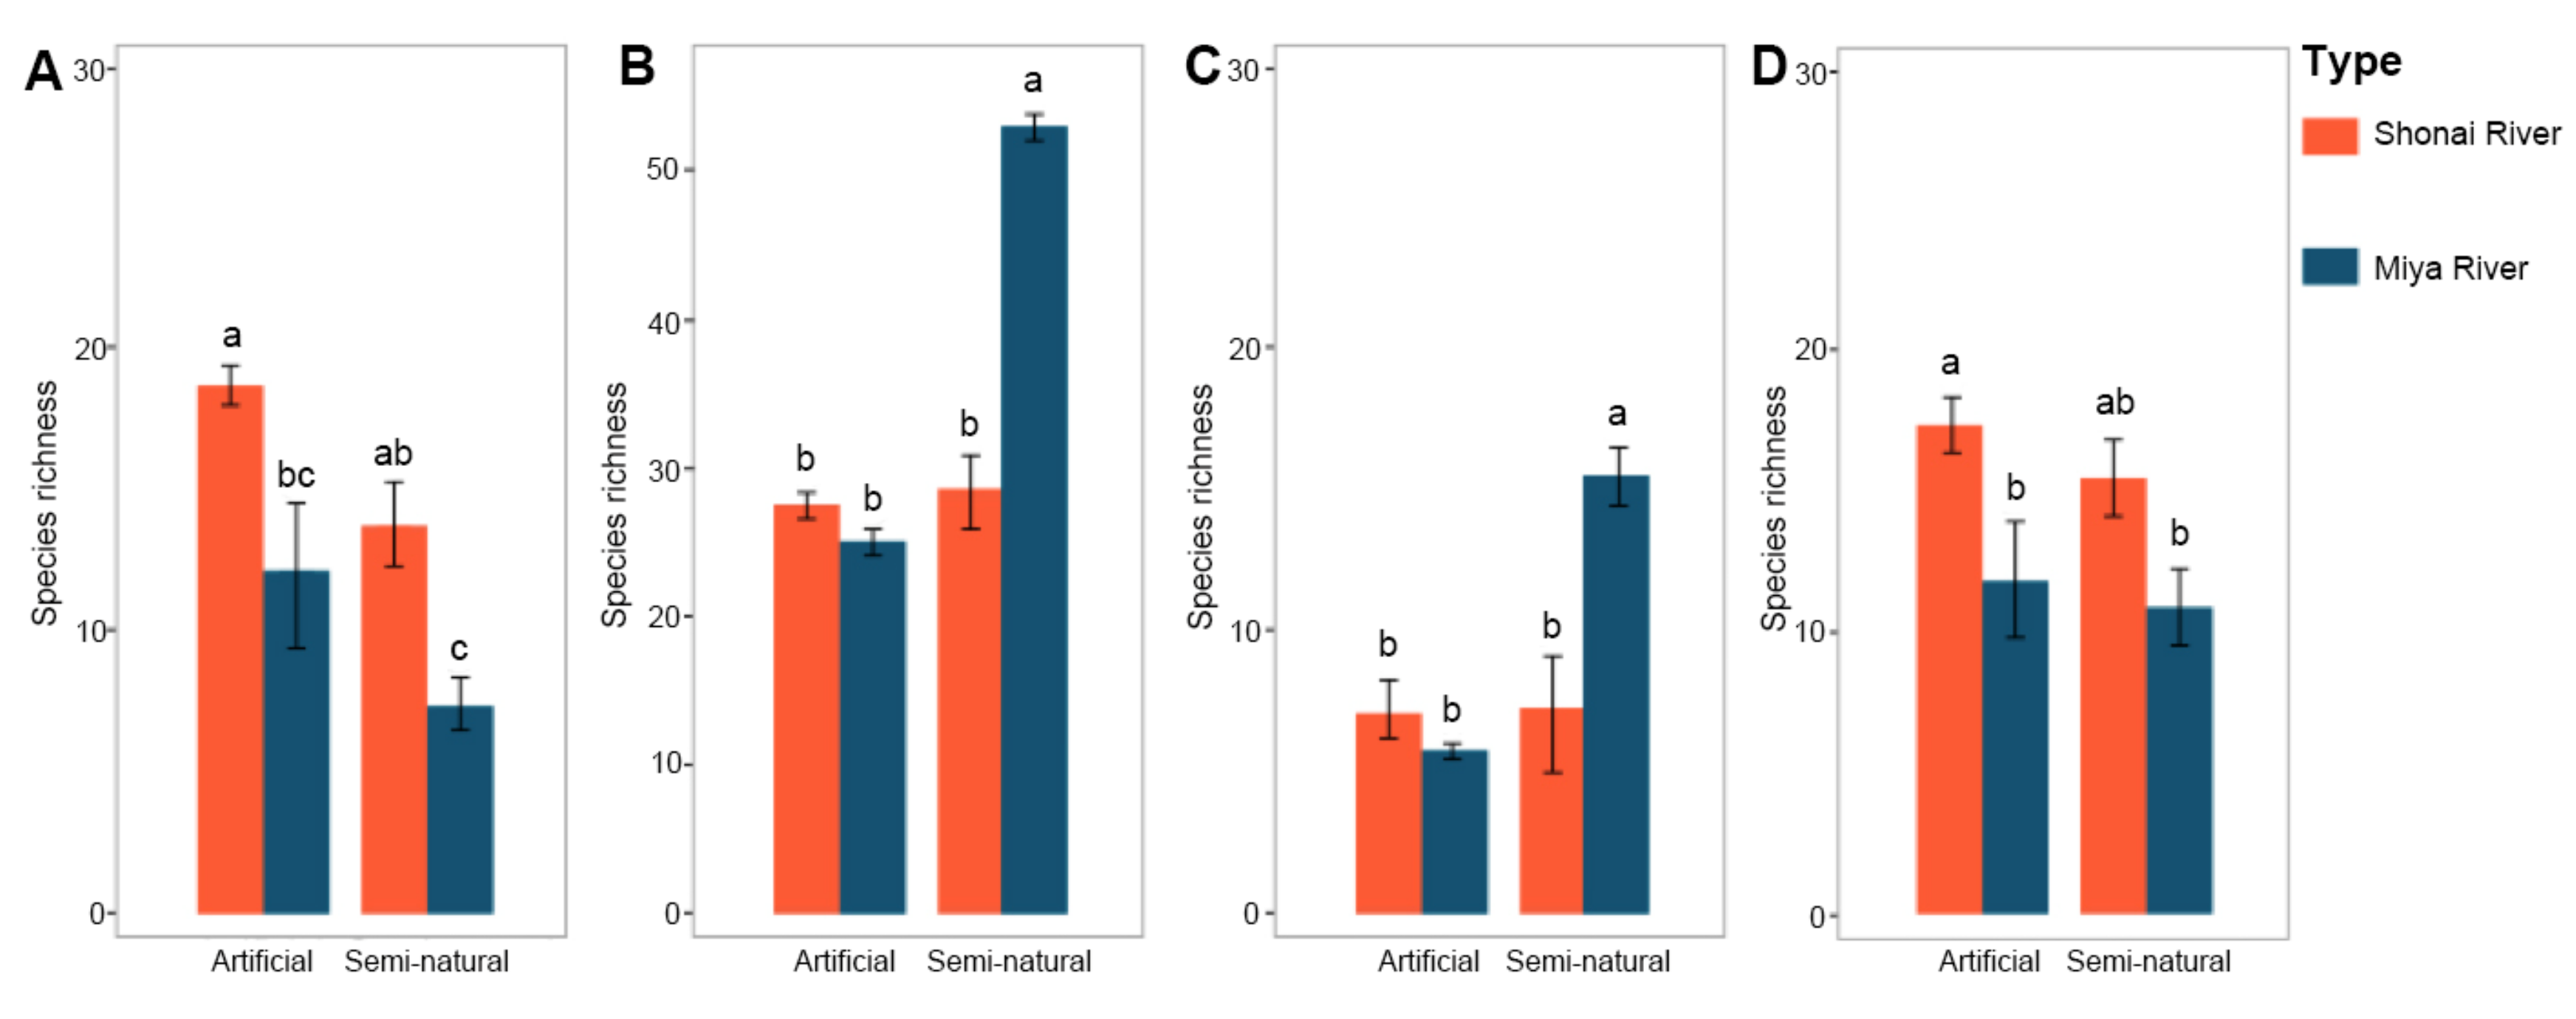
The results of species origins analysis indicated that both alien and native species richness of the Shonai River was higher than those located along the Miya River in artificial habitat (Figure 4). In particular, alien species of the Shonai River showed a significantly higher richness than of the Miya River (ANOVA, p ≤ 0.05). Concerning semi-natural habitat, the number of alien and native species differed significantly between two rivers (ANOVA, p ≤ 0.05). The number of alien species was higher in the wastelands of the Shonai River. However, comparing the richness of native species of two rivers indicated a significantly high richness of the Miya River.
Considering the naturalness of species in the artificial habitat, we found very little difference in riparian species between two rivers (Figure 4). A high richness of ruderal species was found in the sites along Shonai River. In semi-natural habitat, both riparian and ruderal species differed between Shonai and Miya rivers. The number of riparian species showed a significantly high value in the sites of the Miya River (ANOVA, p ≤ 0.05).
3.2. Components of Urbanization
In the different riverside environments, the degree of population and traffic density significantly differed both in artificial and semi-natural habitat (Table 4). However, in the semi-natural habitat, the distance to the city center was associated with a significant difference between two types of habitats, although there was not a similar trend in artificial habitat. Considering the proportion of impervious surface, artificial and semi-natural habitats did not differ significantly, but the mean value of the proportion of impervious surface was slightly higher in artificial habitats compared to semi-natural habitats.
3.3. Effects of Urbanization on Species Richness
Results of GLM analyses revealed that in artificial habitats, the alien species richness was mainly affected by precipitation and proportion of impervious surface (Table 5). The best explanation model for the variation of native species richness included the proportion of impervious surface and traffic density; however, no significant effects were shown within the variables. The richness of riparian species tended to decrease with the increasing impervious surface. Considering the ruderal species richness, the proportion of forest area was shown to be the best predictor.
In semi-natural habitats, the alien species richness was influenced by both the distance to the city center and the proportion of impervious surface (Table 5). The richness of native species was positively affected by distance to the city center; the richness of riparian species tended to decrease with the impervious surface; ruderal species richness was positively influenced by the proportion of impervious surface. Furthermore, the number of ruderal species was affected by the distance to the city center and tended to increase with decreased distance.
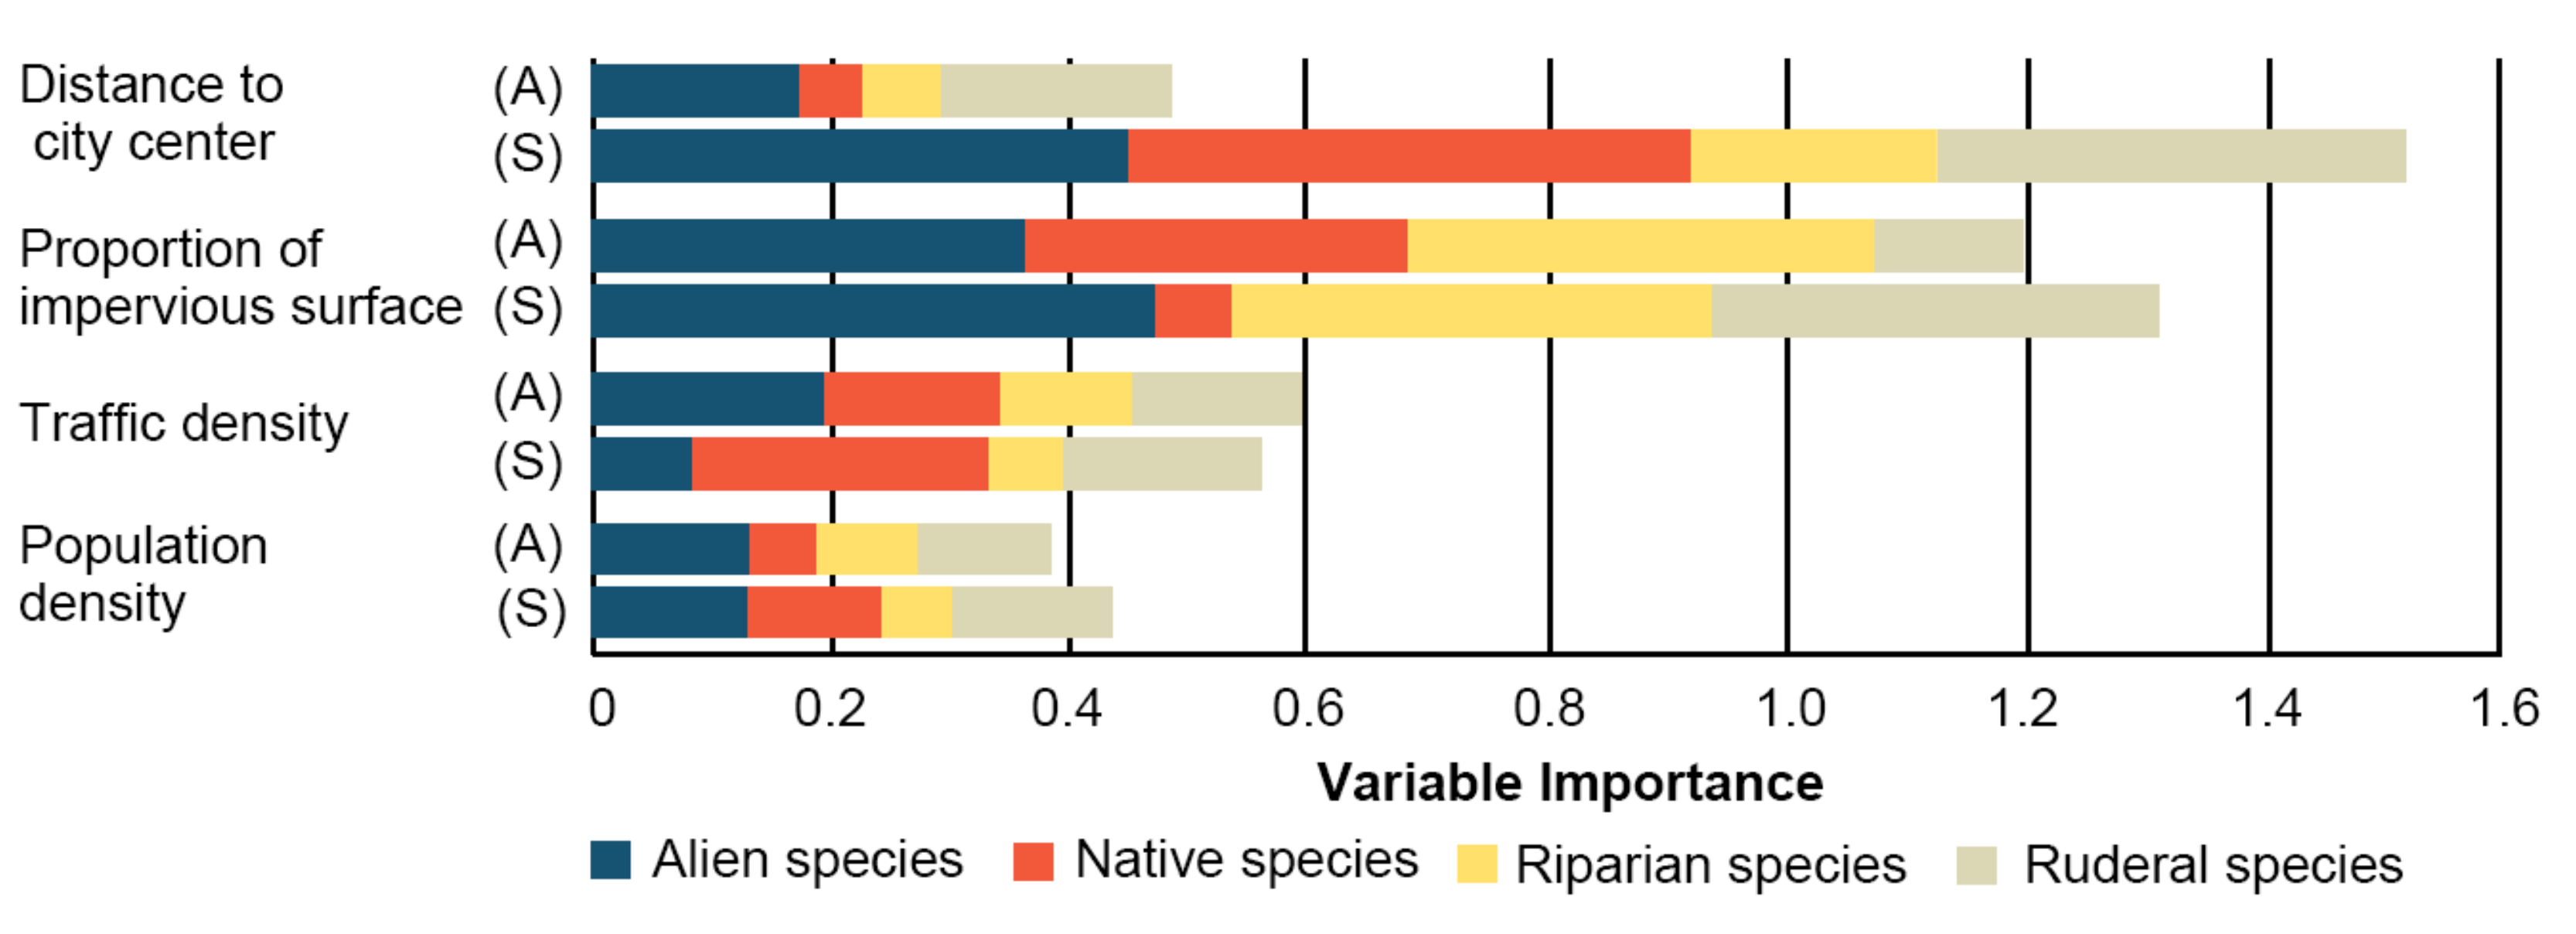
The results of variable importance showed that the dominant component of urbanization contributed to the variation of species richness with habitat and vegetation types (Figure 5). In artificial habitats, among the urbanization factors, the proportion of impervious surface was the best predictor for the variation of the species richness, accounting for about 1.2 variable importance in total. It adequately explained the variation of alien, native, and riparian species richness. However, in semi-natural habitats, distance to the city center was the best predictor for the variation of the species richness and was strongly associated with the variation of the number of alien, native, and ruderal species.
3.4. Effects of Urbanization on Plant Community Composition
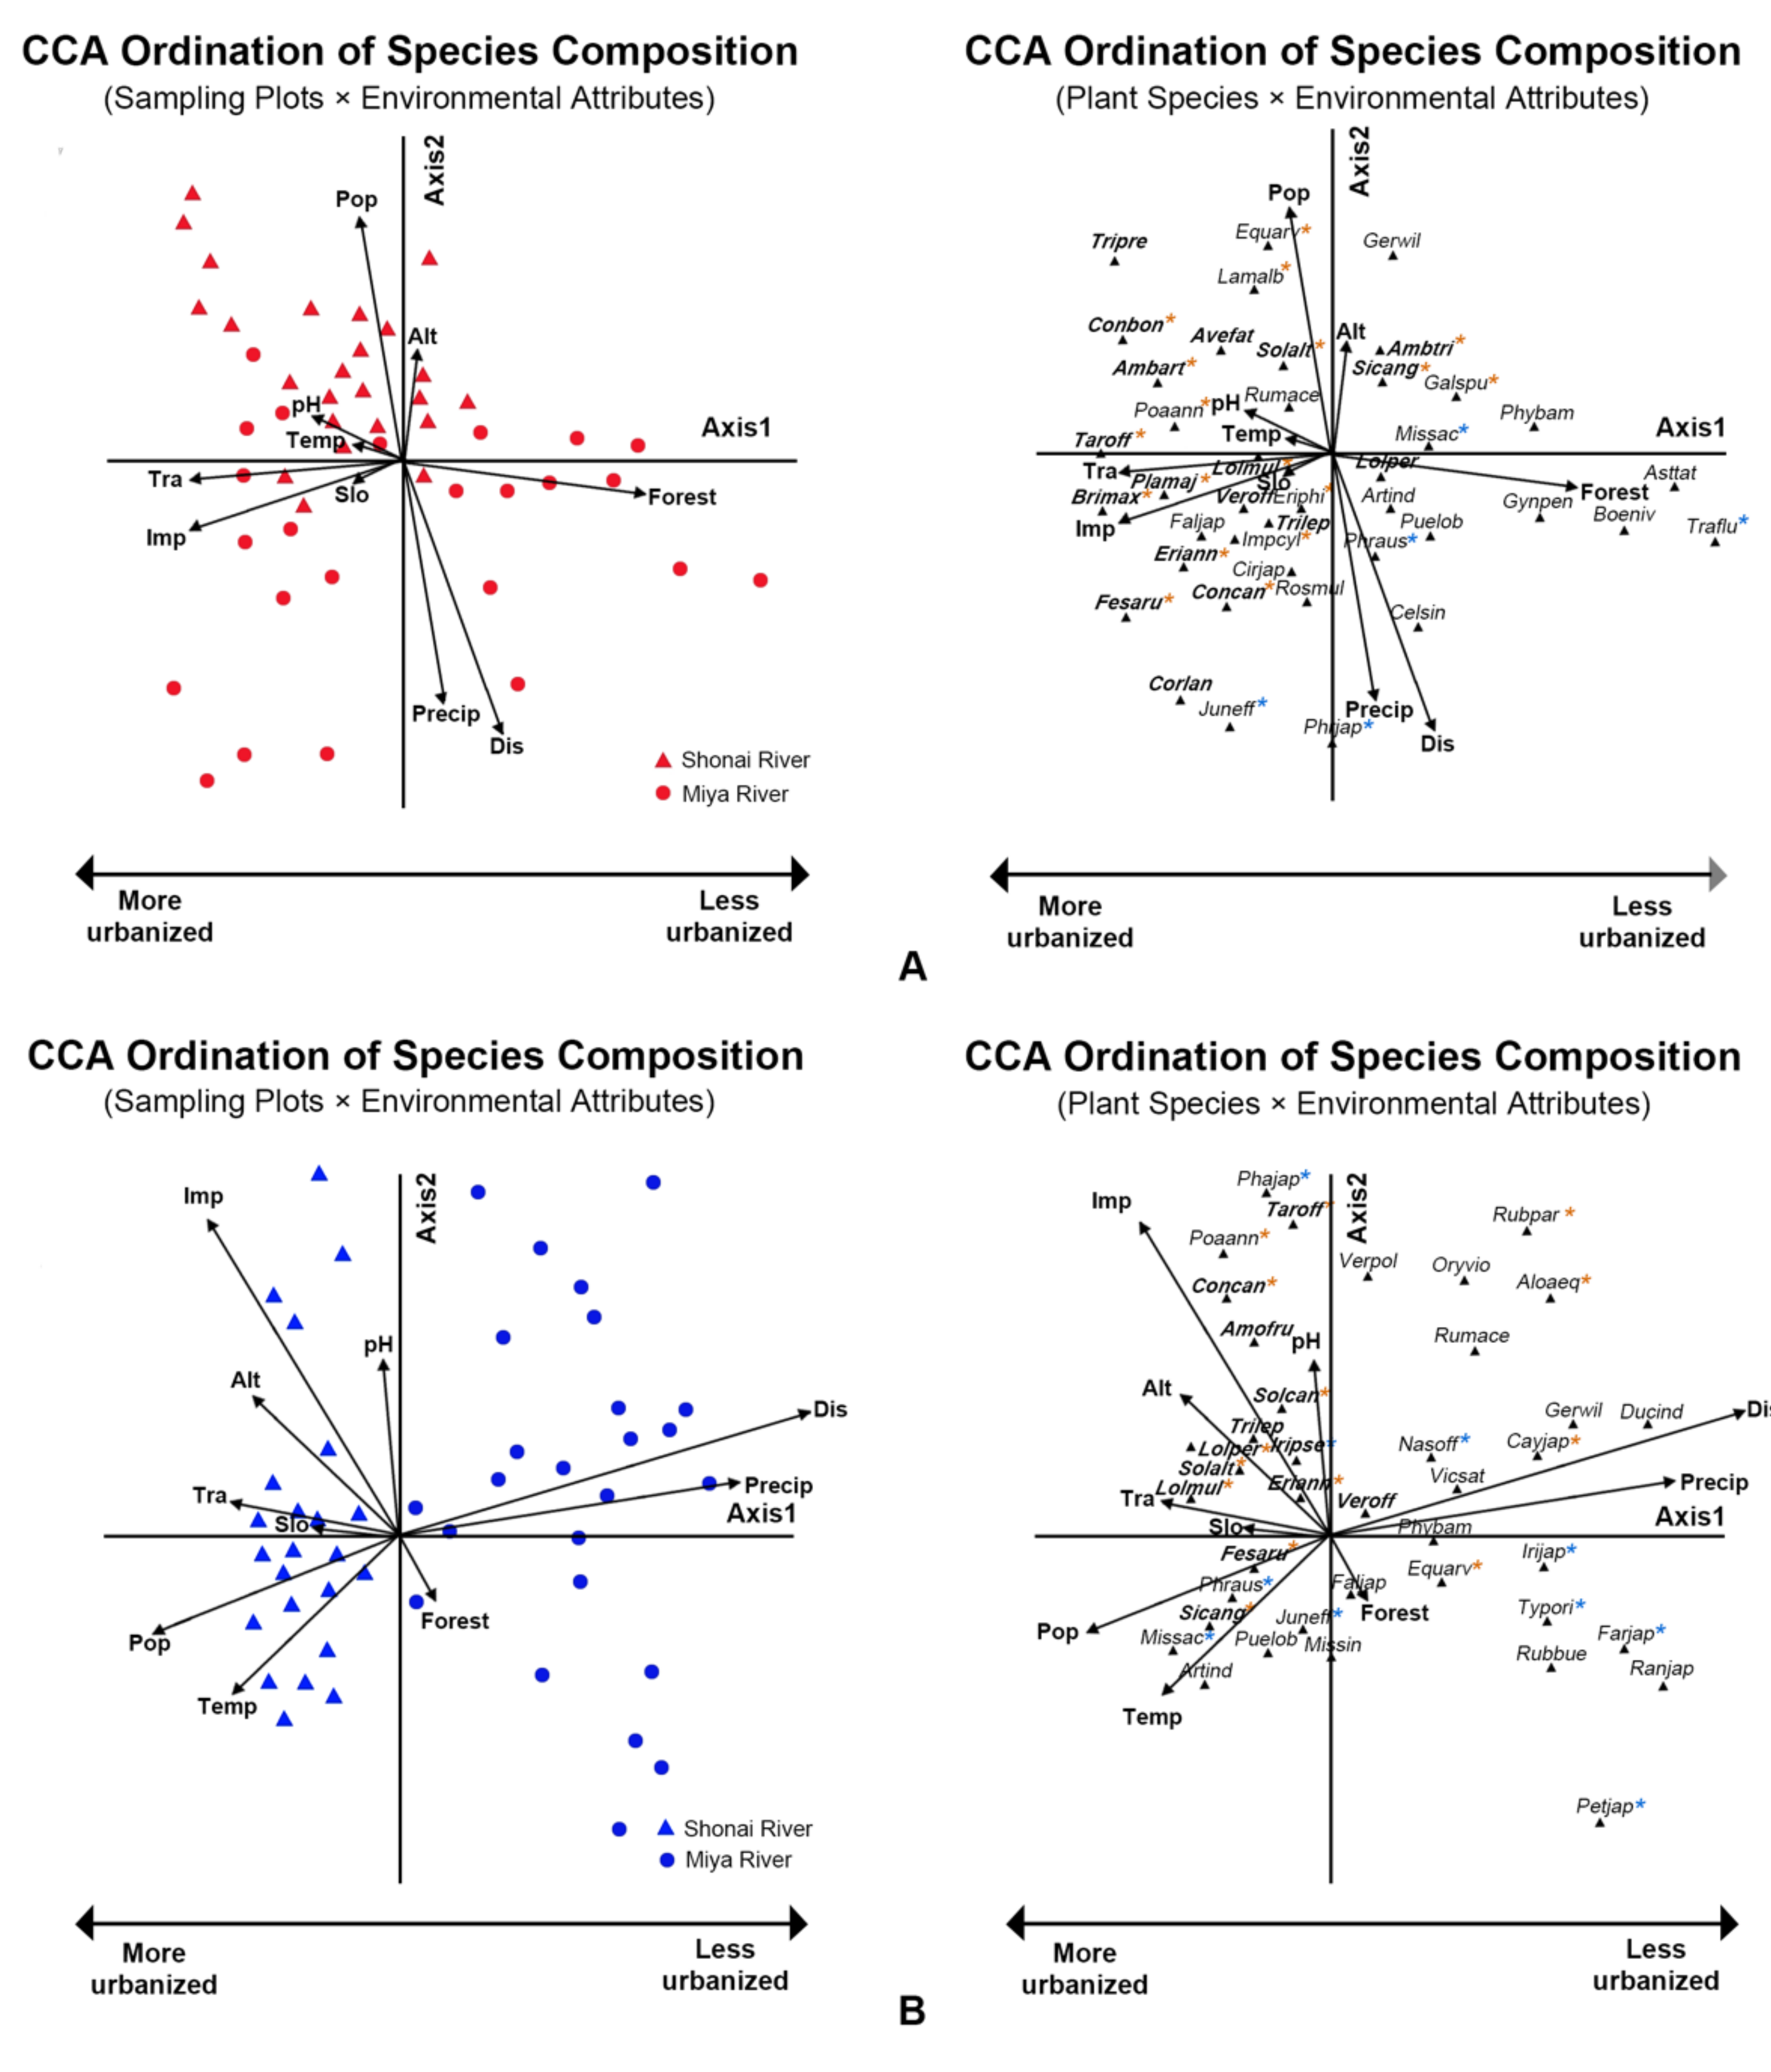
Patterns in species composition of vegetation based on species abundance values entered into the CCA and were related to measures of urbanization intensity, and the resulting diagrams illustrate the fine-scale heterogeneity shown in the artificial and the semi-natural habitats (Figure 6). The total ordination constraint in the CCA of artificial habitats was 6.065, which was the sum of all eigenvalues; 2.517 was constrained and 3.548 remained unconstrained. With regard to the CCA for semi-natural habitats, the total ordination constraint was 9.411; constrained and unconstrained were 4.530 and 4.881, respectively. Results of the correlations between CCA community ordination scores and environmental variables are summarized in Supplementary Materials Table S2. In both artificial and semi-natural habitats, Axis 1 was positively associated with distance to the city center and negatively influenced by the proportion of impervious surface, population, and traffic density, and represented a gradient of more to less urban development (Figure 6; Supplementary Materials Table S2).
The result of CCA in the artificial habitats showed that the sites of two rivers were not a distinct dispersion along the first axis (Figure 6A). The eigenvalue for the first axis was highly significant based on the Monte Carlo permutation test (Axis 1 = 0.46, p = 0.002), implying that the plant species data were well explained by selected environmental variables. The species–environment correlations, indicating the ability of environmental variables to explain the species composition, were 0.85 and 0.73 for Axis 1 and Axis 2, respectively (Table 6). Monte Carlo tests for all canonical axes combined further suggested that the relationship between community composition and environmental factors was significant (p = 0.002). Artificial sites along the Shonai River were positively associated with population density, proportion of impervious surface, traffic density, pH, and mean annual temperature. The plant communities which occurred in the artificial habitat of Miya River always positively related to the distance to the city center, the proportion of impervious surface, mean annual precipitation, and proportion of forest. The urbanization variables were strongly linked by part of environmental variables, further explaining patterns of plant species composition along the Shonai and Miya Rivers. The soil pH and temperature were strongly correlated with impervious surface and traffic density, suggesting that urbanization might affect soil properties and microclimates.
A pattern in species composition was apparent with most alien (e.g., Festuca arundinacea, Lolium multiflorum, Erigeron annuus, Avena fatua, Ambrosia artemisiifolia, Plantago major, Conyza canadensis, Conyza bonariensis, Solidago altissima, Briza maxima, Trifolium repens, and Taraxacum officinale) and ruderal species (e.g., Imperata cylindrica, Poa annua), being associated with the negative, “urbanized” end of Axis 1 and correlated to the impervious surface and traffic density. Native species (e.g., Pueraria lobata, Artemisia indica var. maximowiczii, Phragmites australis and Miscanthus sacchariflorus, and Gynostemma pentaphyllum) were located at the positive end. Species composition on Axis 2 was difficult to interpret, with alien and native species located at both ends (Figure 6A).
In contrast to the artificial habitats, the result of CCA in the semi-natural habitats showed that the sites of two rivers were distinctive along the first axis (Figure 6B). The first axis was significant based on the Monte Carlo permutation test (Axis 1 = 0.66, p = 0.001); the species–environment correlations were 0.95 and 0.82 for Axis 1 and Axis 2, respectively (Table 6). Monte Carlo test for all canonical axes combined suggested that the relationship between species composition and selected environmental factors was highly significant (p = 0.001). Similarly to the CCA results for the artificial habitats, the soil pH was correlated with the impervious surface; the temperature was highly related to the traffic density and population density. In semi-natural habitats, the alien species (e.g., F. arundinacea, L. multiflorum, E. annuus, C. canadensis, S. altissima, T. repens, and T. officinale) also dominated in the more urbanized areas and correlated to the impervious surface, pH, and traffic density; however, the less urbanized plots were characterized almost exclusively by native species (e.g., Iris japonica, Farfugrium japonicum, Geranium wilfordii, Typha orientalis, Vicia sativa, Orychophragmus violaceus, and Phyllostachys bambusoides). The species categorized as both ruderal and native species (e.g., Cayratia japonica, Rubus parvifolius, and Equisetum arvense) also dominated in these less urbanized areas (Figure 6B).
4. Discussion
4.1. Plant Species Richness in Artificial and Semi-Natural Habitats
In artificial habitats, the higher richness of the total species at the sites with a high level of urbanization indicated that the species richness tends to increase with the increase of urbanization. In accordance with the present results, previous studies have demonstrated that relatively high anthropogenic disturbance promotes the coexistence of various types of plants in urban areas [33,34]. In this study, the high species richness of parks along the Shonai River was observed owing to a large number of alien and ruderal species. These observations confirmed that high species richness is associated with the development of urbanization, often as a result of the introduction of non-native species [35,36]. The increase of ruderal species in the parks located along the Shonai River suggested that colonization of ruderal species depended more on the massive artificial disturbances in a megacity. Consistent with our study, many studies have reported that a large number of ruderal plants are always recognized in urban areas with stronger anthropogenic pressure [37,38]. Interestingly, the semi-natural habitats showed opposite trends to the artificial habitats. The better performance of species richness under low-level of urbanization could be due to the characteristics of semi-natural habitat: the range of habitats suitable for native species conservation was probably wider and more continuous in the less-urbanized sites than in the urbanized sites. Thus the loss of plant species could be induced by anthropogenic pressure and habitat fragmentation [39]. This result was also in concordance with earlier research stating that native plant species diversity is relatively high in less disturbed habitats, which might be the result of the existence of multiple dominant species in the less disturbed habitats [40,41]. Additionally, native species diversity can quickly recover after being disturbed, but not if the disturbance was continuous [42,43]. Our finding suggested that semi-natural habitats under a low urbanization intensity could be linked to the relatively high richness of native species and should be managed for the conservation and improvement of the diversity of native species.
4.2. Driving Factors Affecting Different Types of Vegetation
The proportion of impervious surface acted as the best predictor for the variation of species richness in artificial habitats, and this was positively associated with the alien species richness in both artificial and semi-natural habitats. In most of the riparian habitats in Japan, the impervious surfaces are mainly formed by the major beds. The surface of the major beds has been leveled off, promoting the utilization of these major beds as recreation spaces, and footpaths [23]. Following such construction, riparian areas are strongly linked to riparian degradation, alternation of the hydrological and sediment regimes, and intense human recreational activities [41,44]. Thus, alien species could benefit from disturbances of this nature, especially along the riverbanks, since the river corridor is known to be an effective dispersal mechanism [45,46]. Additionally, it is widely assumed that the propagation of alien plants in public spaces and on trails by humans is an important factor for their invasion [47]. Given the efficient propagation of alien species, native species could be influenced by the alien species in numerous ways, including the induced changes in the physical habitats, via competitive suppression, or via some other trophic interaction [48,49]. Surprisingly, our result revealed that the species richness of alien species decreased with the increase in the annual precipitation, and it was contrary to most of the previous studies [50,51]. This result persuaded us to hypothesize that the native species were better adapted to colonizing high rainfall environments than the alien species, since Japan has a typically humid, temperate marine climate. In high rainfall environments, an increase in the biological resistance of the native plant communities might be a reason for the lower richness of the alien species [52]. Nevertheless, despite the significant relationship between the alien species and precipitation, our results might not convincingly predict how species would respond to changes in the environment at a local level within a limited species pool. Further studies in the future could take these variables into account.
In semi-natural habitats, we found the distance to the city center was the most effective predictors for both alien and native species, reflecting the substantial impact of urban expansion on suburban areas. Our result was in line with previous studies revealing a declining trend of alien species from the city center to the suburbs or rural surroundings [53]. This result can be explained by the introduction of humans and the ability of alien species to take advantage of the new resources in those urban areas [41]. Thus, the sites with a relatively short distance to the urban area could be more likely to withstand propagation from the alien species. Moreover, the urban areas provide numerous dispersal corridors that might enhance the spread of alien plants from urban areas to semi-natural habitats [54]. Owing to the high urbanization intensity and rapid urban sprawl, the semi-natural habitats along the Shonai River are surrounded by a number of cities, thus resulting in a relatively short distance to the city and a multi-directional exportation from the cities, leading to an increase in the alien species.
Riparian species are recognized as the plants that were endemic to the riparian areas. It was observed that the proportion of impervious surface was an effective predictor for riparian species both in artificial and semi-natural habitats. As several previous studies have revealed, biodiversity and habitat quality are inversely proportional to the amount of adjacent impervious surface [55]. In recent decades, moist grasslands and gravelly floodplains in Japan have been largely lost to construction activities, which has been linked to urban living and flood control measures [23]. Hence, the loss of habitat could be a major factor contributing to the decrease of riparian plant species. The construction of flood protection measures and recreational spaces also leads to trampling and habitat degradation, while fostering the establishment of undesirable, alien plants, which establish more quickly than other vegetation in these areas [28]. In the current study, some of the riparian species included in the Red Data Book as “vulnerable” were only observed in unchanged riparian areas, such as Veronica undulata, Lespedeza tomentosa, and Epelobium hirsutum.
The ruderal species reportedly tended to occur in intensively altered habitats and were maintained at early successional stages by persistent urban disturbance [56]. In artificial habitats, the richness of ruderal species was only significantly influenced by the proportion of forest. A large forest cover was usually considered to be more resistant to the colonization of ruderal species than a thin forest cover [57,58]. Although the distance to the city center was included in the GLM model, the effect was stronger in the semi-natural habitat. This negative relationship has been aptly explained by the increased habitat diversity and human disturbance at the urban centers [37,38]. Hence, a short distance to the city increases the possibility of the propagation of ruderal plants. The richness of ruderal species richness was also impacted by the proportion of impervious surface in the semi-natural habitats. This result could be explained by the intensity of the habitats modified, in which the ruderal species could occupy the disturbed habitats more quickly owing to their high tolerance for anthropogenic stress situations [59]. Moreover, agricultural activities were significantly related to the occurrence of weeds. Most weeds in agricultural systems are competitively adapted to take over disturbed habitats [60]. Consequently, environments favoring ruderal species include the riparian meadows that are subject to the disturbances like anthropogenic pressure, as well as agricultural buildings and fields.
4.3. Effects on Plant Community Composition
Our result revealed that urbanization has had distinct effects on the flora of the studied artificial and semi-natural habitats. From CCA analyses, we identified the indicator species of the riparian plant community associated with urbanization intensity. Alien species F. arundinacea, L. multiflorum, E. annuus, C. canadensis, S. altissima, and T. officinale were found at the urbanized sites in both the artificial and semi-natural habitats. F. arundinacea and L. multiflorum have been documented as being highly invasive of disturbed riparian areas in Japan. These alien species have escaped from various construction sites in urbanized river basins, where they have been sown to prevent soil erosion [61]. E. annuus, C. canadensis, S. altissima, and T. officinale were widespread and abundant in the disturbed habitats in Japan. These species have a high ability to tolerate competition and strong seed production, and anthropogenic disturbance has promoted the expansion of these species [62,63,64,65,66]. Ruderal species such as P. annua and I. cylindrical were also found to be dominant at the urbanized sites in both the artificial and semi-natural habitats. These species are highly tolerant of urban growing conditions and appear capable of exploiting the anthropogenic disturbance associated with urbanization. Additionally, the results of similar dominant species in the urbanized areas revealed that urbanization could pose a severe risk to biodiversity [56]. The propagation and introduction of a large number of non-native and ruderal plants by human activities in urbanized areas is a well-known consequence of urbanization, and results in floristic homogenization [67]. Many studies have shown that the urbanization process and its associated human disturbance is one of the major drivers of biodiversity homogenization [68,69]. Thus, appropriate suggestions for the management of artificial habitats, such as controlling the construction and expansion of impervious space, are indispensable. However, it is also necessary to take urban riparian areas into consideration when planning urban expansion.
In the semi-natural habitats, distance to the city center had a significant effect on the distribution of plant communities along the Miya River, and these plant communities were dominated by native species. In our research, the places far from the city center were always linked to landscape mosaics like natural floodplains, forests, and villages. This indicated that, compared with the urban residential area, the rural area had a relatively low output of alien species to the surrounding riparian areas [70]. On the other hand, a relatively long distance from the city center could reduce human disturbance and the spread of alien and ruderal species [71]. Although semi-natural habitats are the key areas to maintaining local plant and biodiversity, plant structure is changed under high human pressure. It is important to mention that in semi-natural habitats under high-intensity of urbanization, a considerable number of alien and ruderal species were shown, and the colonization of these species may still be going on. Thus, conservation management should be adopted to avoid the propagation of ruderal and non-native plants, as it is widely known that the cost of taking preventive measures is far lower than that of trying to control these plants when they have become well established. Therefore, the management of the semi-natural habitats should include a designation of selected plots as nature reserves.
Supplementary Materials
The following are available online at https://0-www-mdpi-com.brum.beds.ac.uk/2071-1050/12/1/204/s1, Table S1: Family, species, abbreviation, distribution pattern, and type of all plant species recorded in this study. Notes: AS, artificial habitats along the Shonai River; AM, artificial habitats along the Miya River; SS, semi-natural habitats along the Shonai River; SM, semi-natural habitats along the Miya River; NA, native species; AL, alien species; RU, ruderal species; RA, riparian species. Table S2: Correlations between the environmental variables and the first two axes of the CCA plant species ordination scores in the artificial and semi-natural habitats.
Author Contributions
Conceptualization, Y.C. and Y.N.; Methodology, Y.C. and Y.N.; Software, Y.C.; Validation, Y.C. and Y.N.; Formal analysis, Y.C.; Investigation, Y.C.; Resources, Y.C. and Y.N.; Data Curation, Y.C.; Writing—original draft preparation, Y.C.; Writing—review and editing, Y.C. and Y.N.; Visualization, Y.C.; Supervision, Y.N. All authors have read and agreed to the published version of the manuscript.
Funding
This research received no external funding.
Acknowledgments
We thank two anonymous reviewers for their helpful comments on the manuscript. We are grateful to Noelikanto Ramamonjisoa for fruitful suggestions on an early version of this manuscript. We thank Wenhui Zhang, Chuan Wu, Xiaohui Zhao and Xiaojun Zheng for the field survey.
Conflicts of Interest
The authors declare no conflict of interest.
References
- Naiman, R.; Decamps, H. The Ecology of Interfaces: Riparian Zones. Annu. Rev. Ecol. Syst. 1997, 28. [Google Scholar] [CrossRef] [Green Version]
- Ewel, K.; Cressa, C.; Kneib, R.; Levin, L.; Palmer, M.; Snelgrove, P.; Wall, D. Managing Critical Transition Zones. Ecosystems 2001, 4, 452–460. [Google Scholar] [CrossRef]
- Higgins, S.L.; Thomas, F.; Goldsmith, B.; Brooks, S.J.; Hassall, C.; Harlow, J.; Stone, D.; Völker, S.; White, P. Urban freshwaters, biodiversity and human health and well-being: Setting an interdisciplinary research agenda. Wiley Interdiscip. Rev. Water 2019, 6, 1339. [Google Scholar] [CrossRef]
- Niemelä, J. Urban Ecology: Patterns, Process and Applications; Oxford University Press: New York, NY, USA, 2011. [Google Scholar]
- Hanski, I. Landscape fragmentation, biodiversity loss and the societal response. EMBO Rep. 2005, 6, 388–392. [Google Scholar] [CrossRef] [Green Version]
- Cai, D.; Fraedrich, K.; Guan, Y.; Guo, S.; Zhang, C.; Zhu, X. Urbanization and climate change: Insights from eco-hydrological diagnostics. Sci. Total Environ. 2019, 647, 29–36. [Google Scholar] [CrossRef]
- Cai, D.F.K.; Guan, Y.; Guo, S.; Zhang, C.; Carvalho, L.M.; Zhu, X. Causality of Biodiversity Loss: Climate, Vegetation, and Urbanization in China and America. Sensors 2019, 20, 4499. [Google Scholar] [CrossRef] [Green Version]
- White, M.D.; Greer, K.A. The effects of watershed urbanization on the stream hydrology and riparian vegetation of Los Peñasquitos Creek, California. Landsc. Urban Plan. 2006, 74, 125–138. [Google Scholar] [CrossRef]
- Barnosky, A.D.; Hadly, E.A.; Bascompte, J.; Berlow, E.L.; Brown, J.H.; Fortelius, M.; Getz, W.M.; Harte, J.; Hastings, A.; Marquet, P.A.; et al. Approaching a state shift in Earth’s biosphere. Nature 2012, 486, 52–58. [Google Scholar] [CrossRef]
- Yuan, Z.Y.; Jiao, F.; Li, Y.H.; Kallenbach, R.L. Anthropogenic disturbances are key to maintaining the biodiversity of grasslands. Sci. Rep. 2016, 6, 22132. [Google Scholar] [CrossRef] [Green Version]
- Lundholm, J.T.; Marlin, A. Habitat origins and microhabitat preferences of urban plant species. Urban Ecosyst. 2006, 9, 139–159. [Google Scholar] [CrossRef]
- Cameron, G.N.; Culley, T.M.; Kolbe, S.E.; Miller, A.I.; Matter, S.F. Effects of urbanization on herbaceous forest vegetation: The relative impacts of soil, geography, forest composition, human access, and an invasive shrub. Urban Ecosyst. 2015, 18, 1051–1069. [Google Scholar] [CrossRef]
- Washitani, I. Plant conservation ecology for management and restoration of riparian habitats of lowland Japan. Popul. Ecol. 2001, 43, 189–195. [Google Scholar] [CrossRef]
- Aronson, M.F.J.; La Sorte, F.A.; Nilon, C.H.; Katti, M.; Goddard, M.A.; Lepczyk, C.A.; Warren, P.S.; Williams, N.S.G.; Cilliers, S.; Clarkson, B.; et al. A global analysis of the impacts of urbanization on bird and plant diversity reveals key anthropogenic drivers. Proc. R. Soc. B Biol. Sci. 2014, 281. [Google Scholar] [CrossRef] [PubMed]
- Beninde, J.; Veith, M.; Hochkirch, A. Biodiversity in cities needs space: A meta-analysis of factors determining intra-urban biodiversity variation. Ecol. Lett. 2015, 18, 581–592. [Google Scholar] [CrossRef] [PubMed]
- Porter, E.E.; Forschner, B.R.; Blair, R.B. Woody vegetation and canopy fragmentation along a forest-to-urban gradient. Urban Ecosyst. 2001, 5, 131–151. [Google Scholar] [CrossRef]
- Duguay, S.; Eigenbrod, F.; Fahrig, L. Effects of surrounding urbanization on non-native flora in small forest patches. Landsc. Ecol. 2007, 22, 589–599. [Google Scholar] [CrossRef]
- McDonnell, M.J.; Pickett, S.T.A. Ecosystem Structure and Function along Urban-Rural Gradients: An Unexploited Opportunity for Ecology. Ecology 1990, 71, 1232–1237. [Google Scholar] [CrossRef]
- Naiman, R.J.; Bechtold, J.S.; Drake, D.C.; Latterell, J.J.; O’Keefe, T.C.; Balian, E.V. Origins, Patterns and Importance of Heterogeneity in Riparian Systems. In Ecosystem Function in Heterogeneous Landscapes; Lovett, G.M., Turner, M.G., Jones, C.G., Weathers, K.C., Eds.; Springer: New York, NY, USA, 2005; pp. 279–309. [Google Scholar] [CrossRef]
- Alberti, M.; Botsford, E.; Cohen, A. Quantifying the urban gradient: Linking urban planning and ecology. In Avian Ecology and Conservation in an Urbanizing World; Marzluff, J.M., Bowman, R., Donnelly, R., Eds.; Springer: Boston, MA, USA, 2001; pp. 89–115. [Google Scholar] [CrossRef]
- Gerstner, K.; Dormann, C.F.; Stein, A.; Manceur, A.M.; Seppelt, R. Editor’s Choice: Review: Effects of land use on plant diversity—A global meta-analysis. J. Appl. Ecol. 2014, 51, 1690–1700. [Google Scholar] [CrossRef]
- Amici, V.; Rocchini, D.; Filibeck, G.; Santi, E.; Geri, F.; Landi, S.; Scoppola, A.; Chiarucci, A. Landscape structure effects on forest plant diversity at local scale: Exploring the role of spatial extent. Ecol. Complex. 2015, 21, 52–56. [Google Scholar] [CrossRef]
- Inoue, M.; Nakagoshi, N. The effects of human impact on spatial structure of the riparian vegetation along the Ashida river, Japan. Landsc. Urban Plan. 2001, 53, 111–121. [Google Scholar] [CrossRef]
- Guzy, J.C.; Eskew, E.A.; Halstead, B.J.; Price, S.J. Influence of damming on anuran species richness in riparian areas: A test of the serial discontinuity concept. Ecol. Evol. 2018, 8, 2268–2279. [Google Scholar] [CrossRef] [PubMed] [Green Version]
- Wang, L.; Lyons, J.; Kanehl, P.; Bannerman, R. Impacts of Urbanization on Stream Habitat and Fish Across Multiple Spatial Scales. Environ. Manag. 2001, 28, 255–266. [Google Scholar] [CrossRef] [PubMed]
- Damgaard, C. Estimating mean plant cover from different types of cover data: A coherent statistical framework. Ecosphere 2014, 5, 1–7. [Google Scholar] [CrossRef]
- Muranaka, T. Naturalization and invasion of alien plants in Japan: Relationships among their origin, use and time of introduction. Jpn. J. Conserv. Ecol. 2008, 13, 89–101. [Google Scholar] [CrossRef]
- Miyawaki, S. Invasive alien plant species in riparian areas of Japan: The contribution of agricultural weeds, revegetation species and aquacultural species. Glob. Environ. Res. 2004, 10, 89–101. [Google Scholar]
- Kasahara, Y. The Species Grouping of Wild Herbs, Ruderals, Naturalized Plants, Weeds and Crops on the Basis of Their Habitats. J. Weed Sci. Technol. 1971, 12, 23–27. [Google Scholar] [CrossRef]
- Muranaka, T.; Washitani, I. Alien plant invasions and gravelly floodplain vegetation of the Kinu River. Ecol. Civ. Eng. 2001, 4, 121–132. [Google Scholar] [CrossRef]
- Lawton, J.H. What Do Species Do in Ecosystems? Oikos 1994, 71, 367–374. [Google Scholar] [CrossRef]
- Burnham, K.P.; Anderson, D.R. Model. Selection and Multimodel Inference: A Practical Information—Theoretic Approach; Springer: New York, NY, USA, 2002. [Google Scholar] [CrossRef] [Green Version]
- Stadler, J.; Trefflich, A.; Klotz, S.; Brandl, R. Exotic plant species invade diversity hot spots: The alien flora of northwestern Kenya. Ecography 2000, 23, 169–176. [Google Scholar] [CrossRef]
- Wania, A.; Kühn, I.; Klotz, S. Plant richness patterns in agricultural and urban landscapes in Central Germany—Spatial gradients of species richness. Landsc. Urban Plan. 2006, 75, 97–110. [Google Scholar] [CrossRef]
- Gaertner, M.; Wilson, J.R.U.; Cadotte, M.W.; MacIvor, J.S.; Zenni, R.D.; Richardson, D.M. Non-native species in urban environments: Patterns, processes, impacts and challenges. Biol. Invasions 2017, 19, 3461–3469. [Google Scholar] [CrossRef] [Green Version]
- Pyšek, P.; Jarošík, V.; Hulme, P.E.; Kühn, I.; Wild, J.; Arianoutsou, M.; Bacher, S.; Chiron, F.; Didžiulis, V.; Essl, F.; et al. Disentangling the role of environmental and human pressures on biological invasions across Europe. Proc. Natl. Acad. Sci. USA 2010, 107, 12157. [Google Scholar] [CrossRef] [PubMed] [Green Version]
- Guo, P.; Yu, F.; Ren, Y.; Liu, D.; Li, J.; Ouyang, Z.; Wang, X. Response of Ruderal Species Diversity to an Urban Environment: Implications for Conservation and Management. Int. J. Environ. Res. Public Health 2018, 15, 2832. [Google Scholar] [CrossRef] [PubMed] [Green Version]
- Dubois, J.; Cheptou, P.-O. Effects of fragmentation on plant adaptation to urban environments. Philos. Trans. R. Soc. B Biol. Sci. 2017, 372, 20160038. [Google Scholar] [CrossRef] [PubMed] [Green Version]
- Cousins, S.A.O.; Ohlson, H.; Eriksson, O. Effects of historical and present fragmentation on plant species diversity in semi-natural grasslands in Swedish rural landscapes. Landsc. Ecol. 2007, 22, 723–730. [Google Scholar] [CrossRef]
- Hobbs, R.J.; Huenneke, L.F. Disturbance, Diversity and Invasion: Implications for Conservation. Conserv. Biol. 1992, 6, 324–337. [Google Scholar] [CrossRef] [Green Version]
- McKinney, M.L. Urbanization, Biodiversity and Conservation: The impacts of urbanization on native species are poorly studied, but educating a highly urbanized human population about these impacts can greatly improve species conservation in all ecosystems. Bioscience 2002, 52, 883–890. [Google Scholar] [CrossRef]
- Selmants, P.; Knight, D.H. Understory plant species composition 30–50 years after clearcutting in southeastern Wyoming coniferous forests. For. Ecol. Manag. 2003, 185, 275–289. [Google Scholar] [CrossRef]
- Zhu, J.; Mao, Z.; Hu, L.; Zhang, J. Plant diversity of secondary forests in response to anthropogenic disturbance levels in montane regions of northeastern China. J. For. Res. 2007, 12, 403–416. [Google Scholar] [CrossRef]
- Paul, M.J.; Meyer, J.L. Streams in the Urban Landscape. Annu. Rev. Ecol. Syst. 2001, 32, 333–365. [Google Scholar] [CrossRef]
- Nilsson, C.; Andersson, E.; Merritt, D.M.; Johansson, M.E. Differences in riparian flora between riverbanks and river lakeshores explained by dispersal traits. Ecology 2002, 83, 2878–2887. [Google Scholar] [CrossRef]
- Aronson, M.F.J.; Patel, M.V.; O’Neill, K.M.; Ehrenfeld, J.G. Urban riparian systems function as corridors for both native and invasive plant species. Biol. Invasions 2017, 19, 3645–3657. [Google Scholar] [CrossRef]
- Christen, D.C.; Matlack, G.R. The habitat and conduit functions of roads in the spread of three invasive plant species. Biol. Invasions 2009, 11, 453–465. [Google Scholar] [CrossRef]
- Tilman, D.; Lehman, C. Human-caused environmental change: Impacts on plant diversity and evolution. Proc. Natl. Acad. Sci. USA 2001, 98, 5433–5440. [Google Scholar] [CrossRef] [Green Version]
- Salinitro, M.; Alessandrini, A.; Zappi, A.; Melucci, D.; Tassoni, A. Floristic diversity in different urban ecological niches of a southern European city. Sci. Rep. 2018, 8, 15110. [Google Scholar] [CrossRef] [Green Version]
- Dingaan, M.; Tsubo, M.; Walker, S.; Newby, T. Soil chemical properties and plant species diversity along a rainfall gradient in semi-arid grassland of South Africa. Plant Ecol. Evol. 2017, 150, 35–44. [Google Scholar] [CrossRef]
- Levine, J.M.; Adler, P.B.; Yelenik, S.G. A meta-analysis of biotic resistance to exotic plant invasions. Ecol. Lett. 2004, 7, 975–989. [Google Scholar] [CrossRef] [Green Version]
- Levine, J.M. Species Diversity and Biological Invasions: Relating Local Process to Community Pattern. Science 2000, 288, 852. [Google Scholar] [CrossRef] [Green Version]
- Burton, M.L.; Samuelson, L.J.; Pan, S. Riparian woody plant diversity and forest structure along an urban-rural gradient. Urban Ecosyst. 2005, 8, 93–106. [Google Scholar] [CrossRef]
- Tikka, P.M.; Högmander, H.; Koski, P.S. Road and railway verges serve as dispersal corridors for grassland plants. Landsc. Ecol. 2001, 16, 659–666. [Google Scholar] [CrossRef]
- Yan, Z.; Teng, M.; He, W.; Liu, A.; Li, Y.; Wang, P. Impervious surface area is a key predictor for urban plant diversity in a city undergone rapid urbanization. Sci. Total Environ. 2018, 650. [Google Scholar] [CrossRef] [PubMed]
- McKinney, M.L. Urbanization as a major cause of biotic homogenization. Biological Conservation. Biol. Conserv. 2006, 127, 247–260. [Google Scholar] [CrossRef]
- Charbonneau, N.C.; Fahrig, L. Influence of canopy cover and amount of open habitat in the surrounding landscape on proportion of alien plant species in forest sites. Écoscience 2004, 11, 278–281. [Google Scholar] [CrossRef]
- McAlpine, K.; Lamoureaux, S.; Westbrooke, I. Ecological impacts of ground cover weeds in New Zealand lowland forests. N. Z. J Ecol. 2015, 39, 50–60. Available online: https://newzealandecology.org/nzje/3215 (accessed on 26 March 2017).
- Lososová, Z.; Chytry, M.; Kühn, I.; Hájek, O.; Horáková, V.; Pyšek, P.; Tichý, L. Plant trait patterns in annual vegetation of Central European human-made habitats. Perspect. Plant Ecol. Evol. Syst. 2006, 81, 69–81. [Google Scholar] [CrossRef]
- Grime, J.P. Evidence for the Existence of Three Primary Strategies in Plants and Its Relevance to Ecological and Evolutionary Theory. Am. Nat. 1977, 111, 1169–1194. Available online: http://0-www-jstor-org.brum.beds.ac.uk/stable/2460262 (accessed on 8 October 2019).
- Washitani, I. Invasive Alien Species Problems in Japan: An Introductory Ecological Essay. Glob. Environ. Res. 2004, 8, 1–12. [Google Scholar]
- Patamsytė, J.; Rančelis, V.; Čėsnienė, T.; Kleizaitė, V.; Tunaitienė, V.; Naugžemys, D.; Vaitkūnienė, V.; Žvingila, D. Clonal structure and reduced diversity of the invasive alien plant Erigeron annuus in Lithuania. Cent. Eur. J. Biol. 2013, 8, 898–911. [Google Scholar] [CrossRef]
- Djurdjević, L.; Mitrović, M.; Gajić, G.; Jarić, S.; Kostić, O.; Oberan, L.; Pavlović, P. An allelopathic investigation of the domination of the introduced invasive Conyza canadensis L. Flora-Morphol. Distrib. Funct. Ecol. Plants 2011, 206, 921–927. [Google Scholar] [CrossRef]
- Yura, H. Comparative ecophysiology of Chrysanthemum pacificum Nakai and solidago altissima L. 1. why S. altissima cannot be established on the seashore. Ecol. Res. 1997, 12, 313–323. [Google Scholar] [CrossRef]
- Turner, K.; Lefler, L.; Freedman, B. Plant communities of selected urbanized areas of Halifax, Nova Scotia, Canada. Landsc. Urban Plan. 2005, 71, 191–206. [Google Scholar] [CrossRef]
- Stewart, G.H.; Ignatieva, M.E.; Meurk, C.D.; Buckley, H.; Horne, B.; Braddick, T. URban Biotopes of Aotearoa New Zealand (URBANZ) (I): Composition and diversity of temperate urban lawns in Christchurch. Urban Ecosyst. 2009, 12, 233–248. [Google Scholar] [CrossRef]
- Pino, J.; Font, X.; De Cáceres, M.; Molowny-Horas, R. Floristic homogenization by native ruderal and alien plants in north-east Spain: The effect of environmental differences on a regional scale. Glob. Ecol. Biogeogr. 2009, 18, 563–574. [Google Scholar] [CrossRef]
- Martínez-Ramos, M.; Ortiz-Rodríguez, I.A.; Piñero, D.; Dirzo, R.; Sarukhán, J. Anthropogenic disturbances jeopardize biodiversity conservation within tropical rainforest reserves. Proc. Natl. Acad. Sci. USA 2016, 113, 5323. [Google Scholar] [CrossRef] [PubMed] [Green Version]
- Smart, S.M.; Thompson, K.; Marrs, R.H.; Le Duc, M.G.; Maskell, L.C.; Firbank, L.G. Biotic homogenization and changes in species diversity across human-modified ecosystems. Proc. Biol. Sci. 2006, 273, 2659–2665. [Google Scholar] [CrossRef] [PubMed] [Green Version]
- Štajerová, K.; Šmilauer, P.; Brůna, J.; Pyšek, P. Distribution of invasive plants in urban environment is strongly spatially structured. Landsc. Ecol. 2017, 32, 681–692. [Google Scholar] [CrossRef]
- Alston, K.P.; Richardson, D.M. The roles of habitat features, disturbance, and distance from putative source populations in structuring alien plant invasions at the urban/wildland interface on the Cape Peninsula, South Africa. Biol. Conserv. 2006, 132, 183–198. [Google Scholar] [CrossRef]
Figure 1.
An overview of the Shonai River and Miya River system in Japan (A) and the location of research sites along the Shonai River (B) and the Miya River (C). Notes: the information of the population concentration area was derived from the Geospatial Information Authority of Japan.
Figure 1.
An overview of the Shonai River and Miya River system in Japan (A) and the location of research sites along the Shonai River (B) and the Miya River (C). Notes: the information of the population concentration area was derived from the Geospatial Information Authority of Japan.

Figure 2.
Schematic of vegetation survey method (A) and plan view of a vegetation plot (B).

Figure 3.
Total species richness for the artificial (A) and semi-natural habitats (B). Notes: The red boxes represent the species richness in the habitats with a high level of urbanization (Shonai River), while the blue boxes represent the species richness in the relatively less urbanized habitats (Miya River).

Figure 4.
The number of plant species across habitat types and rivers in alien species richness (A), native species richness (B), riparian species richness (C), and ruderal species richness (D). Shown are means ± standard error. Letters represent significant differences (p ≤ 0.05, the p-values were corrected by the multiple-testing Holm’s correction).

Figure 5.
Variable importance. Shown are variable importance of population density, traffic density, the proportion of impervious surface, and distance to the city center for alien, native, riparian, and ruderal species in artificial (A) and semi-natural (S) habitats.
Figure 5.
Variable importance. Shown are variable importance of population density, traffic density, the proportion of impervious surface, and distance to the city center for alien, native, riparian, and ruderal species in artificial (A) and semi-natural (S) habitats.

Figure 6.
Canonical correspondence analysis (CCA) diagram showing the ordination of species composition in the artificial (A) and semi-natural (B) habitats. Notes: shapes correspond to individual study plots; codes of individual species (Supplementary Material Table S1) show their scores as a function of the first two axes. The direction and length of arrows shows the degree of correlation between plant community types and the variables; species in bold represent alien species; species with yellow and blue “*” represent ruderal and riparian species, respectively.


Table 1.
The geographical and environmental characteristics of the Shonai River and Miya River (information source: Ministry of Land, Infrastructure, Transport, and Tourism, Japan).
Table 1.
The geographical and environmental characteristics of the Shonai River and Miya River (information source: Ministry of Land, Infrastructure, Transport, and Tourism, Japan).
| Shonai River | Miya River | |
|---|---|---|
| Latitude | 35°04′–35°24′ N | 34°10′–34°20′ N |
| Longitude | 136°49′–137°20′ E | 136°14′–136°45′ E |
| Climate zone | Warm, temperate climate | Warm, temperate climate |
| Basin area | 1010 km2 | 920 km2 |
| Length | 96 km | 91 km |
| topography | Inclined from the northeast to the southwest | Inclined from the southwest to the northeast |
| Temperature | 27.8 °C (August) and 4.5 °C (January) | 25.3 °C (August) and 5.1 °C (January) |
| Population | 2,461,000 | 140,000 |
| Altitude | 0–843 m | 0–1695 m |
| Precipitation | 1400–2000 mm | 1700–2500 mm |
| Major Cities | Nagoya, Tajimi, Tasugai | Ise |
| Land use | Forest 44%, agricultural field 16%, urban area 40% | Forest 84%, agricultural field 12%, urban area 4% |
Table 2.
The number of study areas, the number of plots in each study area, the total number of plots, and information about the characteristics of the studied area types.
Table 2.
The number of study areas, the number of plots in each study area, the total number of plots, and information about the characteristics of the studied area types.
| Characteristic | Artificial Habitats | Semi-Natural Habitats |
|---|---|---|
| Number of sampling sites | Shonai River: 3 Miya River: 3 | Shonai River: 3 Miya River: 3 |
| Location of sampling sites | Shonai River: Shonai Greenspace Park, Biwajima Park, Araizeki Park. Miya River: Miyagawatutumi Park, Love River Park, Miyagawashinsui Park. | Shonai River: Sakurasa Cho area, Kanori Cho area, Shimohadagawa Cho area. Miya River: Souchi Cho area, Watarai Cho area, Taiki Cho area. |
| Number of plots in each sampling site | 8 | 8 |
| Total number of plots | 48 | 48 |
Table 3.
Data sources and definitions of predictors, including urbanization and other environmental variables for the plots.
Table 3.
Data sources and definitions of predictors, including urbanization and other environmental variables for the plots.
| Predictor | Definition | Data Source |
|---|---|---|
| Population density | Number of human inhabitants (residents) per km2 | Statistics Bureau of Japan, https://www.stat.go.jp/data/jinsui/new.html (2015) |
| Traffic density | Daily vehicle flow of the nearest road beside the riparian area (cars/day) | Ministry of Land, Infrastructure, Transport, and Tourism, http://www.mlit.go.jp/road/census/h27/index.html (2015) |
| Mean annual temperature | Average value of monthly mean temperatures (°C) | Japan Meteorological Agency, https://www.data.jma.go.jp/obd/stats/etrn/index.php (2018) |
| Annual precipitation | Sum of monthly precipitation (mm) | Japan Meteorological Agency, https://www.data.jma.go.jp/obd/stats/etrn/index.php (2018) |
| Imperviousness | The rigid pavement area in a 100 m radius from plot center within the riparian area (%) | Geospatial Information Authority of Japan, https://www.gsi.go.jp/tizu-kutyu.html |
| Distance to the city center | Distance from plots to the nearest neighbor city center (m) | Geospatial Information Authority of Japan, https://www.gsi.go.jp/tizu-kutyu.html |
| Forest | The proportion of the plot area occupied by trees (%) | Geospatial Information Authority of Japan, https://www.gsi.go.jp/tizu-kutyu.html |
| Altitude and slope | The elevation and degree of inclination in each plot | Measured using GPS and declinometer, respectively |
| pH | The pH of the soil within a depth of 20 cm in each plot | Measured using an electric pH meter |
Table 4.
The characteristics of urbanization factors in artificial habitat (a) and semi-natural habitat (b) of the two rivers. Significant results are in bold (p < 0.05, the p-values were corrected by multiple-test Holm’s correction).
Table 4.
The characteristics of urbanization factors in artificial habitat (a) and semi-natural habitat (b) of the two rivers. Significant results are in bold (p < 0.05, the p-values were corrected by multiple-test Holm’s correction).
| (a) | |||
| Urbanization Factors | Shonai River | Miya River | Difference between Rivers |
| Mean ± SD | Mean ± SD | ||
| Population density | 6707.33 ± 391.40 | 610 | p < 0.001 |
| Proportion of impervious surface | 22.22 ± 2.14 | 20.88 ± 1.62 | p = 0.34 |
| Distance to the city center | 3.33 ± 0.08 | 3.72 ± 0.07 | p = 0.53 |
| Traffic density | 6810.66 ± 337.71 | 4865.83 ± 444.98 | p = 0.002 |
| (b) | |||
| Urbanization Factors | Shonai River | Miya River | Difference between Rivers |
| Mean ± SD | Mean ± SD | ||
| Population density | 2222.67 ± 246.85 | 160 ± 32.48 | p < 0.001 |
| Proportion of impervious surface | 7.7 ± 0.63 | 5.86 ± 0.96 | p = 0.23 |
| Distance to the city center | 4.32 ± 0.19 | 15.49 ± 1.44 | p < 0.001 |
| Traffic density | 3334.54 ± 307.80 | 2083.79 ± 380.27 | p = 0.041 |
Table 5.
Summary of generalized linear models (GLMs) testing the effects of urbanization factors on the richness of alien, native, riparian, and ruderal species in the artificial and semi-natural habitats.
Table 5.
Summary of generalized linear models (GLMs) testing the effects of urbanization factors on the richness of alien, native, riparian, and ruderal species in the artificial and semi-natural habitats.
| Adj.R2 | AIC | Pop. | Imp. | Dis. | Tra. | Temp. | Precip. | Alt. | Slo. | Forest | pH | |
|---|---|---|---|---|---|---|---|---|---|---|---|---|
| Alien Species Richness | ||||||||||||
| Artificial | 0.660 *** | 182.24 | 0.364 | 0.315 | ||||||||
| Semi-natural | 0.646 *** | 144.65 | 0.466 | 0.432 | 0.225 | |||||||
| Native Species Richness | ||||||||||||
| Artificial | 0.287 *** | 205.29 | 0.327 | 0.156 | ||||||||
| Semi-natural | 0.500 *** | 216.17 | 0.464 | |||||||||
| Riparian Species Richness | ||||||||||||
| Artificial | 0.329 *** | 141.90 | 0.397 | |||||||||
| Semi-natural | 0.460 ** | 164.36 | 0.423 | 0.250 | 0.260 | |||||||
| Ruderal Species Richness | ||||||||||||
| Artificial | 0.423 *** | 185.78 | 0.201 | 0.305 | ||||||||
| Semi-natural | 0.566 ** | 175.81 | 0.381 | 0.419 | 0.197 | 0.256 | 0.328 | |||||
Models were run separately for each type of habitat. If an explanatory factor was excluded from the best model, the cell is shown as blank space. Otherwise, the relative importance of the variable is reported. For the significant explanatory variables, a cell shaded blue indicates a positive relationship, and red indicates a negative relationship between the explanatory factors and plant species richness. For the overall model and relative importance of individual factors, significance is shown as: ** p < 0.01, *** p < 0.001. Notes: Pop: human population density, Imp: the proportion of impervious surface, Dis: distance to the city center, Tra: traffic density, Temp: mean annual temperature, Precip: annual rainfall, Alt: altitude, Slo: slope, Forest: the proportion of forest area.
Table 6.
Summary statistics for CCA ordinations.
| Artificial Habitats | Semi-Natural Habitats | |||
|---|---|---|---|---|
| Axis 1 | Axis 2 | Axis 1 | Axis 2 | |
| Eigenvalue | 0.462 | 0.374 | 0.659 | 0.423 |
| Constrained proportion | 0.261 | 0.212 | 0.281 | 0.177 |
| Cumulative proportion | 0.261 | 0.473 | 0.281 | 0.459 |
| Species–environment correlations | 0.859 | 0.737 | 0.946 | 0.828 |
© 2019 by the authors. Licensee MDPI, Basel, Switzerland. This article is an open access article distributed under the terms and conditions of the Creative Commons Attribution (CC BY) license (http://creativecommons.org/licenses/by/4.0/).
Share and Cite
MDPI and ACS Style
Cao, Y.; Natuhara, Y. Effect of Urbanization on Vegetation in Riparian Area: Plant Communities in Artificial and Semi-Natural Habitats. Sustainability 2020, 12, 204. https://0-doi-org.brum.beds.ac.uk/10.3390/su12010204
AMA Style
Cao Y, Natuhara Y. Effect of Urbanization on Vegetation in Riparian Area: Plant Communities in Artificial and Semi-Natural Habitats. Sustainability. 2020; 12(1):204. https://0-doi-org.brum.beds.ac.uk/10.3390/su12010204
Chicago/Turabian StyleCao, Yang, and Yosihiro Natuhara. 2020. "Effect of Urbanization on Vegetation in Riparian Area: Plant Communities in Artificial and Semi-Natural Habitats" Sustainability 12, no. 1: 204. https://0-doi-org.brum.beds.ac.uk/10.3390/su12010204
Note that from the first issue of 2016, this journal uses article numbers instead of page numbers. See further details here.