Wild Bee Conservation within Urban Gardens and Nurseries: Effects of Local and Landscape Management


1
Department of Ecology, Ecosystem Science/Plant Ecology, Technische Universität Berlin, Rothenburgstr. 12, 12165 Berlin, Germany
2
Department of Environmental Studies, University of California, Santa Cruz, 1156 High St., Santa Cruz, CA 95060, USA
3
Department of Entomology, University of California, 900 University Ave, Riverside, CA 92521, USA
*
Author to whom correspondence should be addressed.
Sustainability 2020, 12(1), 293; https://0-doi-org.brum.beds.ac.uk/10.3390/su12010293
Submission received: 30 October 2019
/
Revised: 11 December 2019
/
Accepted: 27 December 2019
/
Published: 30 December 2019
(This article belongs to the Special Issue Biodiversity Conservation and Sustainable Urban Development)
Abstract
:Across urban environments, vegetated habitats provide refuge for biodiversity. Gardens (designed for food crop production) and nurseries (designed for ornamental plant production) are both urban agricultural habitats characterized by high plant species richness but may vary in their ability to support wild pollinators, particularly bees. In gardens, pollinators are valued for crop production. In nurseries, ornamental plants rarely require pollination; thus, the potential of nurseries to support pollinators has not been examined. We asked how these habitats vary in their ability to support wild bees, and what habitat features relate to this variability. In 19 gardens and 11 nurseries in California, USA, we compared how local habitat and landscape features affected wild bee species abundance and richness. To assess local features, we estimated floral richness and measured ground cover as proxies for food and nesting resources, respectively. To assess landscape features, we measured impervious land cover surrounding each site. Our analyses showed that differences in floral richness, local habitat size, and the amount of urban land cover impacted garden wild bee species richness. In nurseries, floral richness and the proportion of native plant species impacted wild bee abundance and richness. We suggest management guidelines for supporting wild pollinators in both habitats.
1. Introduction
Habitat loss due to land use change, such as urbanization, is a leading cause of population declines of wild bees worldwide [1,2,3]. Urbanization leads to local- and landscape-scale changes in habitat structure and composition through the paving of roads and changes in local climate and vegetation, among other factors. These changes may result in the local extirpation of certain arthropod species from urban habitats [4,5,6]. Wild, native bees (Hymenoptera: Anthophila) are critical pollinators of plants in urban [7], agricultural [8], and natural [9] habitats and are thus the targets of numerous conservation efforts. In spite of the negative impacts of urbanization on wild bee populations, urban areas can also serve as refuges for wild bees [10]. Urban habitats can support a diversity of wild bees, but this depends on local (e.g., food and nesting resources) and landscape features (e.g., urban surroundings) [11,12,13,14,15,16,17]. Therefore, it is important to identify which specific features of urban habitats, such as vegetation and ground cover, can positively impact wild bee communities [16,18].
Urban environments are sites where humans facilitate plant communities based on cultural, economic, social, and aesthetic preferences and conditions [19]. For example, local management within urban gardens determines the species abundance, diversity, and spatial distribution of plants, and these features have been linked to wild bee species diversity and abundance [10,20,21,22]. However, the species identity and characteristics of flowering plants are also important for wild bees with certain life histories, such as oligolectic species. For example, native plant species may be more important than just general floral availability for supporting wild bees [15,23]. Native plants are species naturally occurring within an area and have either evolved in or migrated to that area, rather than through introduction by humans [24]. Because they are adapted to a particular environment, native plants may, for example, have more phenological bloom overlap with native bee activity periods and provide higher quality or more easily accessible floral resources than some non-native, ornamental plants. Some studies have found native plant gardens to host a more abundant [25] or compositionally distinct [15,26] bee fauna. Many other studies suggest bees prefer to forage on native plants [27,28,29], though bees in disturbed areas still extensively use exotic plants even if they are not preferred [30]. Thus, in urban habitats with a high richness of both native and exotic plants, the relationship between native plant species richness and wild bee diversity deserves further examination [31].
In addition to food resources, suitable nesting substrates are important to wild bees for reproduction and bee life history strategies [32]. Below- and above-ground nesting substrates are an important environmental filter of bee communities [32]. In urban habitats, nesting resources including bare soil and pithy wood material are critical for supporting ground-nesting and cavity-nesting species [16,33]. Changes in surface soils through urbanization and urban habitat management can impact wild bee richness [13,34] and structure community composition [32] by impacting nesting resource availability [32]. For example, altering soil accessibility through impervious cover or mulch cover is common in urban and agricultural systems, and has been previously correlated with declines in urban bee populations [16]. Although nesting resources are important for bees, they are rarely considered in pollinator studies because bee species exhibit a wide range of specific nesting substrate requirements.
Landscape-scale features surrounding urban areas can also influence the community structure of wild bees within urban habitats [35]. An urban matrix is characterized by the amount and distribution of natural and semi-natural areas within a predominantly built landscape [19]. The amount of urban land use (i.e., impervious cover) in a region generally negatively impacts wild bee abundance and diversity within urban habitats [20], such as in community gardens [16] and dry grasslands [35]. However, bees exhibit mixed responses to urbanization, which suggests that the impacts of urbanization on wild bees warrants further attention [31].
Urban gardens that produce food and ornamental plants support high crop and non-crop plant species richness, which can in turn support a wide range of wild bees with various life histories [36]. Urban gardens can contain hundreds of plant species including planted fruit and vegetable crops and various ornamental cultivars [37] that flower throughout a season [38,39,40]. Gardens also host long-standing perennial native and exotic trees and shrubs that flower consistently throughout the year, which could provide dependable food resources for bees. It is estimated that urban gardens can harbor up to 50 times more abundant and diverse bee communities than other urban habitats such as parks and cemeteries [36]. Indeed, Normandin et al. [41] documented 128 species of bees within community gardens across cities in Canada, and 110 species were documented in urban gardens in New York City [12].
Like gardens, urban and suburban plant nurseries that grow native and exotic ornamental plants for wholesale or retail also contain hundreds of plant taxa. These include native and exotic cultivars at different stages of flowering in almost any given season [42]. Many of these species are attractive to bees. Although researchers have recognized the importance of ornamental plants as forage for bees and other beneficial insects in urban landscapes [22,25,43,44,45,46,47,48,49], interactions between ornamental plants and wild bees have not been widely documented inside nurseries. We know of no studies that have specifically investigated the ability of nurseries themselves to support wild bees. Commonly, studies on nursery plants have instead focused on their significance as sources of exposure to systemic insecticides for bees [50,51,52,53,54]. It is important to consider the role of habitat management and landscape context for a diversity of agricultural habitats, including nurseries, that may promote wild bee conservation in urban and suburban regions.
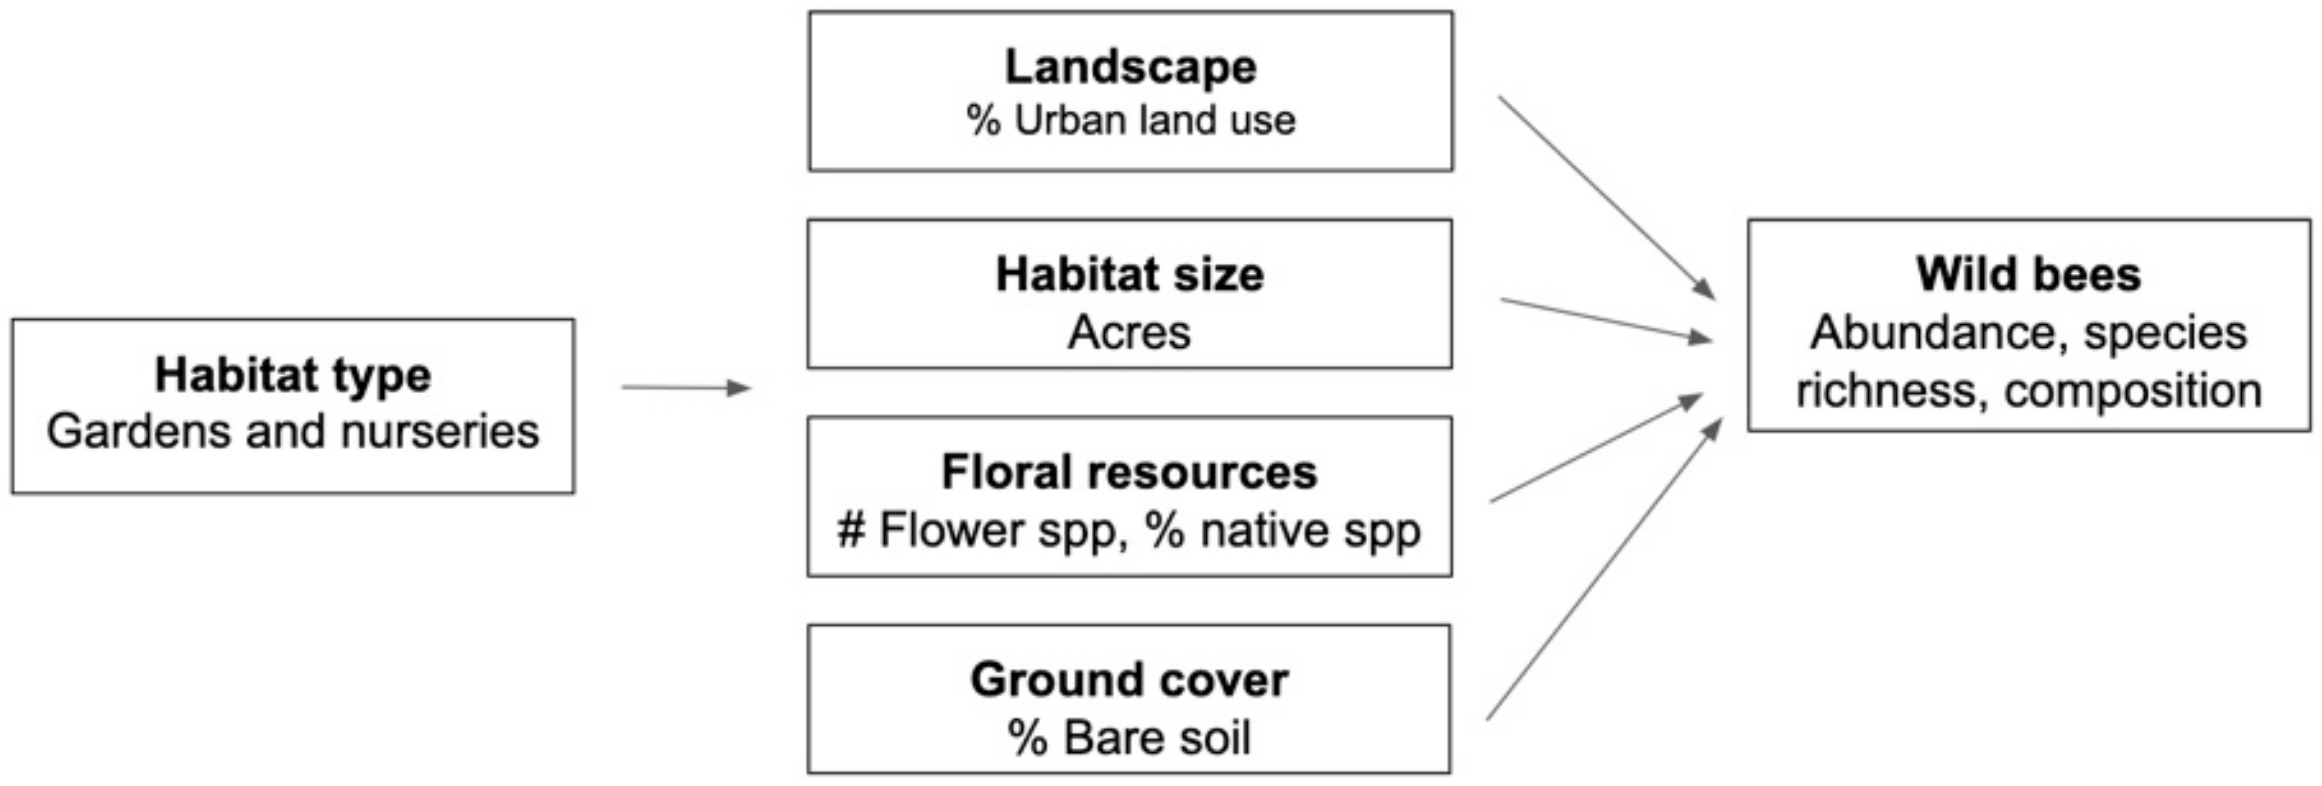
In this study, we compared two datasets, one from urban community gardens and the other from urban and suburban plant nurseries, with the goal of identifying local management practices and landscape-scale features that may support wild bee communities in these agricultural habitats (Figure 1). For both gardens and nurseries, we specifically examined how (1) local habitat management (floral species richness, floral species identity, available bare soil, and habitat area) and (2) the amount of urbanization in the surrounding landscape relate to wild bee abundance, richness, and community composition. We compared and contrasted the results to inform recommendations for urban agricultural habitat management.
2. Materials and Methods
2.1. Study Sites and Sampling Events
Study sites included 19 urban community gardens (henceforth “gardens”) and 11 urban and suburban plant nurseries in California, USA. California is an ideal study system because it is a rapidly urbanizing state with one of the largest populations in the USA, and is also the top state in the country in terms of agricultural and horticultural revenue [55]. Urban regions in California, including the Los Angeles Metropolitan Region, the greater San Francisco Bay Region, and the Monterey Bay Region, are all experiencing population growth and building densification. Yet these regions are also located within a biodiversity hotspot, the California Floristic Province, which harbors thousands of endemic flora and fauna [56]. Both industrial agricultural expansion and urban area expansion are driving habitat loss and pose various challenges for some resident plant and animal species.
Gardens were distributed across the central coast in Monterey (county centroid: 36.2400° N, 121.3100° W), Santa Clara (37.3600° N, 121.9700° W), and Santa Cruz (37.0300° N, 122.0100° W) Counties. The nurseries were located in Los Angeles (34.05° N, 118.24° W), Orange (33.72° N, 117.83° W), San Diego (32.72° N, 117.16° W), and Riverside (33.95° N, 117.34° W) Counties. Sites were surrounded by varying degrees of natural, agricultural, and urban landscapes, resulting in a gradient of urbanization. Gardens were separated by two to 94 km, had been in cultivation predominantly for vegetable and flower crop production for between five to 47 years, and were 0.04 to 1.55 ha in area. Nurseries were separated by 1.3 to 220 km; had been established for over eight years (most over 20); and were considerably larger than gardens, ranging from three to 30 ha in area. Our study nurseries were primarily dominated by containerized (potted) perennial plants. Bedded annual plants were only present at a small number of nurseries, and even then in very low quantities relative to perennials. Therefore, we included species richness of flowering perennial plants as a variable important for supporting wild bees in our analyses. Ornamental grasses (Poaceae) were excluded from the dataset, as common grass cultivars in California are generally not attractive to bees even when in flower.
Gardens were sampled five times between June to September in 2015 (17–19 June, 7–10 July, 1–3 August, 2–4 September, 22–24 September). In each garden, we established a 20 by 20 m study plot (400 m2) at the center of the garden in which to measure local features and collect bee specimens (see Section 2.2 and Section 2.3). Nurseries were sampled from June to November in 2016 (21, 28 June; 8, 12 July; 5, 27 August; 12, 21 September; 7, 18 November) and 2017 (20–30 June; 3, 5, 11, 15, 21–28 July; 15–18 August; 15, 18, 29 September; 2, 20, 23 October). Within each nursery, we established one study plot per hectare of nursery area (up to 12 plots per nursery) in which to measure local features each time we sampled. Each plot was a 15 m radius circle (700 m2), separated from neighboring plots by at least 100 m. The differences in sampling methods in each system were a limitation of our study, but we accounted for this by using the same dataset organization and statistical analytical approach for both datasets.
2.2. Wild Bee Sampling
In both habitat types, we actively collected foraging bees using aerial insect nets between 09:00 and 15:30 h under conditions suitable to bee activity (>13 °C; average of 23 °C across site sampling events). In each garden, two observers collected bees on plants within the 400 m2 study plot for 15 min each. In each nursery, one observer collected bees off of patches of blooming plants both within and outside the 700 m2 study plots, for 30 min on each of two separate days within a 72 h period, both in summer and autumn. In nurseries, we avoided collecting European honey bees (Apis mellifera), even though they were present; in gardens, we collected any type of bee (including honey bees), then later excluded honey bees from all analyses.
We identified bees to species (or morphotaxon for certain genera such as Lasioglossum (Dialictus) where species identification is not feasible) using online resources [57], image databases (e.g., [58,59]), published books, and dichotomous keys [60]. For garden bees, species identifications were verified by researchers trained in bee identification and systematics according to Michener, McGinley, and Danforth [61] (2014 Bee Course, American Museum of Natural History). For nursery bees, species identifications and morphotaxon groupings were verified by a bee taxonomist at the University of California, Riverside Entomology Research Museum. All bee specimens from gardens are stored at the S. M. Philpott Laboratory at the University of California, Santa Cruz. All bee specimens from nurseries are stored at the E. E. Wilson-Rankin Laboratory at the University of California, Riverside.
2.3. Local Habitat Features
Within all gardens and nurseries, at the same time as bee sampling, we collected data on local habitat features. We examined features shared between both habitat types that we predicted would affect wild bee communities. We focused on (1) vegetation, specifically the species richness of perennial plants and the richness of native perennial plants; (2) ground cover management, specifically the amount of bare soil; and (3) habitat size. Slightly different approaches for estimating these variables were employed for the two habitat types due to the difference in their respective areas. For this reason, we did not include measures of floral abundance in our models, as these were calculated very differently between nurseries and gardens. Habitat area for each site was measured in Google Earth [62].
In gardens, we measured habitat size as the total size of the entire garden, in acres. We established a 20 by 20 m sampling plot at the center of the garden. We then randomly placed four 1 by 1 m quadrats in the center plot, and in each we measured groundcover composition, including the percent soil that was bare versus covered (i.e., by woodchips, grass, rock, etc.). This was pooled and averaged for each sampling date for each site. Within the sampling plot, we identified and counted the number of all native trees and shrubs and identified them, noting whether they were currently flowering. In the lab, we confirmed whether each plant was native by cross-referencing the Calflora database (https://www.calflora.org/, The Calflora Database, Berkeley, CA, USA). We calculated percent native richness, a variable indicating the average percent of perennial species that are native, out of all possible species, per sampling event at each site. We also measured species richness of flowering perennial plants as the richness of the total species of perennials within the 20 by 20 m plot averaged across all sampling events.
In nurseries, within each established 700 m2 sampling plot, during each sampling event, we recorded every species of plant currently in bloom and took a panoramic photograph of the entire plot from its center. We used this method instead of the quadrats used in gardens because of the overall large area of the nurseries and because most flower patches in nurseries far exceeded 1 m2. To calculate the percent of bare ground, each panoramic photograph was divided into four quadrants and we estimated the proportion of soil in each quadrant not covered by impermeable materials (weed barrier cloth, gravel, buildings, etc.). Estimates from quadrants were summed to yield values for a whole plot. Species richness of flowering plants and percent native richness were calculated in the same way as they were in gardens.
2.4. Landscape Features
We used ArcGIS [63] and QGIS 3.6.2 [64] with the LecoS (Landscape Ecology Statistics, University of Copenhagen, Copenhagen, Denmark) plugin [65] to calculate the proportion of urban land cover within a 2 km radius buffer around each garden and nursery. This radius encompasses the average flight distances of most wild bees [66]. Land cover classifications were determined using the 2011 and 2016 United States Geological Survey (USGS) National Land Cover Database (NLCD) [67]. We measured urban cover as the sum of the proportions of land cover classes 22, 23, and 24 that represent low, medium, and high intensity impervious land cover, respectively. Although the term “suburban” generally refers to lower levels of urbanization in a landscape compared with “urban”, we treated urban land cover as a continuous variable, and intentionally did not establish a cut-off value for dichotomizing landscapes as either “suburban” or “urban”.
2.5. Statistical Analysis
We tested which local and landscape features in each system predicted wild bee abundance, richness, and community composition. Because sampling methods were slightly different between gardens and nurseries, we analyzed the garden dataset and the nursery dataset separately. This allowed us to test which features for each system predicted abundance, richness, and composition, and then descriptively compared whether there are similarities and differences between habitat types. All statistical analyses were conducted in the R statistical environment [68].
To test which features predicted wild bee species abundance and bee species richness, for both datasets, we constructed generalized linear mixed effect models (GLMMs) using the lme4 package in R [69]. In each model, response variables were the total number of wild bee individuals or the total number of wild bee species per site per sampling event. Predictor variables included species richness of flowering perennial plants, percent native perennial richness, the percent of bare ground, habitat area, and the total proportion of land within 2 km buffers around each site that was classified as urban according to the USGS NLCD (sum of classes 22, 23, and 24). All predictor variables were scaled in the models, and all variance inflation factor (VIF) scores for all variables were close to one, and always less than two to meet model assumptions of non-collinearity among variables. This was done using the function “vif” in the car package in R [70]. All models included site and sampling event as random effects, and all models were fit with a Poisson distribution. Overall, we constructed four GLMMs, for both wild bee abundance and richness in both gardens and nurseries. For each model, we performed model selection to determine which features best explained wild bee abundance and richness. We used the “dredge” function in the MuMIn package in R [71], which uses Akaike Information Criterion (AICc) to determine model fit (lowest AICc indicates better fit; [72]).
To determine whether community composition of wild bees was related to local and landscape features, we pooled the species observed throughout the season for each site. We created a species composition matrix and an environmental matrix. Species that occurred only once overall (singletons) were omitted from this analysis. For both gardens and nurseries, we transformed the species composition matrix using a Hellinger transformation using the “decostand” function in the vegan package [73]. For nurseries, we also transformed the environmental matrix due to axes greater than three. Using these matrices, we calculated the Bray–Curtis distance, a count-based measure of compositional dissimilarity, between communities using the “vegdist” function, and used the “metaMDS” function to transform and visualize community structure in each garden and nursery. We then used a permutational multivariate analysis of variance (permANOVA) using the “adonis” function to determine which local and landscape features relate to community composition. We visualized the plots using the non-metric multidimensional scaling (NMDS) with the “ordiplot” function in vegan, and used the “envfit” function to overlay the local and landscape features used in the analysis to the community ordination.
3. Results
3.1. Abundance and Species Richness of Wild Bees in Gardens and Nurseries
In gardens, we collected a total of 1138 bee individuals comprising 49 species; in nurseries, we collected a total of 242 bee individuals comprising 59 species (Appendix A, Table A1). Gardens and nurseries shared ten species in common. The three most abundant species across all gardens included Bombus vosnesenskii, Halictus tripartitus, and Melissodes robustior. The three most abundant species across all nurseries included Halictus ligatus, Agapostemon texanus, and a morphospecies of Melissodes. No rare or endangered bee species were observed in nurseries. In gardens, we observed a nonnative species of Anthidium. In both gardens and nurseries we documented several cleptoparasitic species, including Sphecodes spp., common cleptoparasites of Halictus, Lassioglossum, and Andrena spp.
3.2. Local- and Landscape-Scale Features in Gardens and Nurseries
Local and landscape features generally differed within gardens and nurseries and between gardens and nurseries (Table 1). In terms of perennial floral richness, nurseries contained, on average, 1.8 times more flowering plant species than gardens. On average, 45% ± 6% of plant species recorded in plots in nurseries were native to California, compared to 28% of plant species recorded in gardens. Gardens and nurseries were similar in the proportion of bare exposed soil in sampling plots (44% ± 6% bare in gardens; 47% ± 9% bare in nurseries). Urban gardens were on average smaller (1.0 ± 0.8 acres) than nurseries (19.3 ± 10.7 acres), and were located in more urbanized landscapes (58% ± 30% urban land within 2 km) than nurseries (31% ± 23%).
3.3. Significance of Local and Landscape Features in Gardens and Nurseries
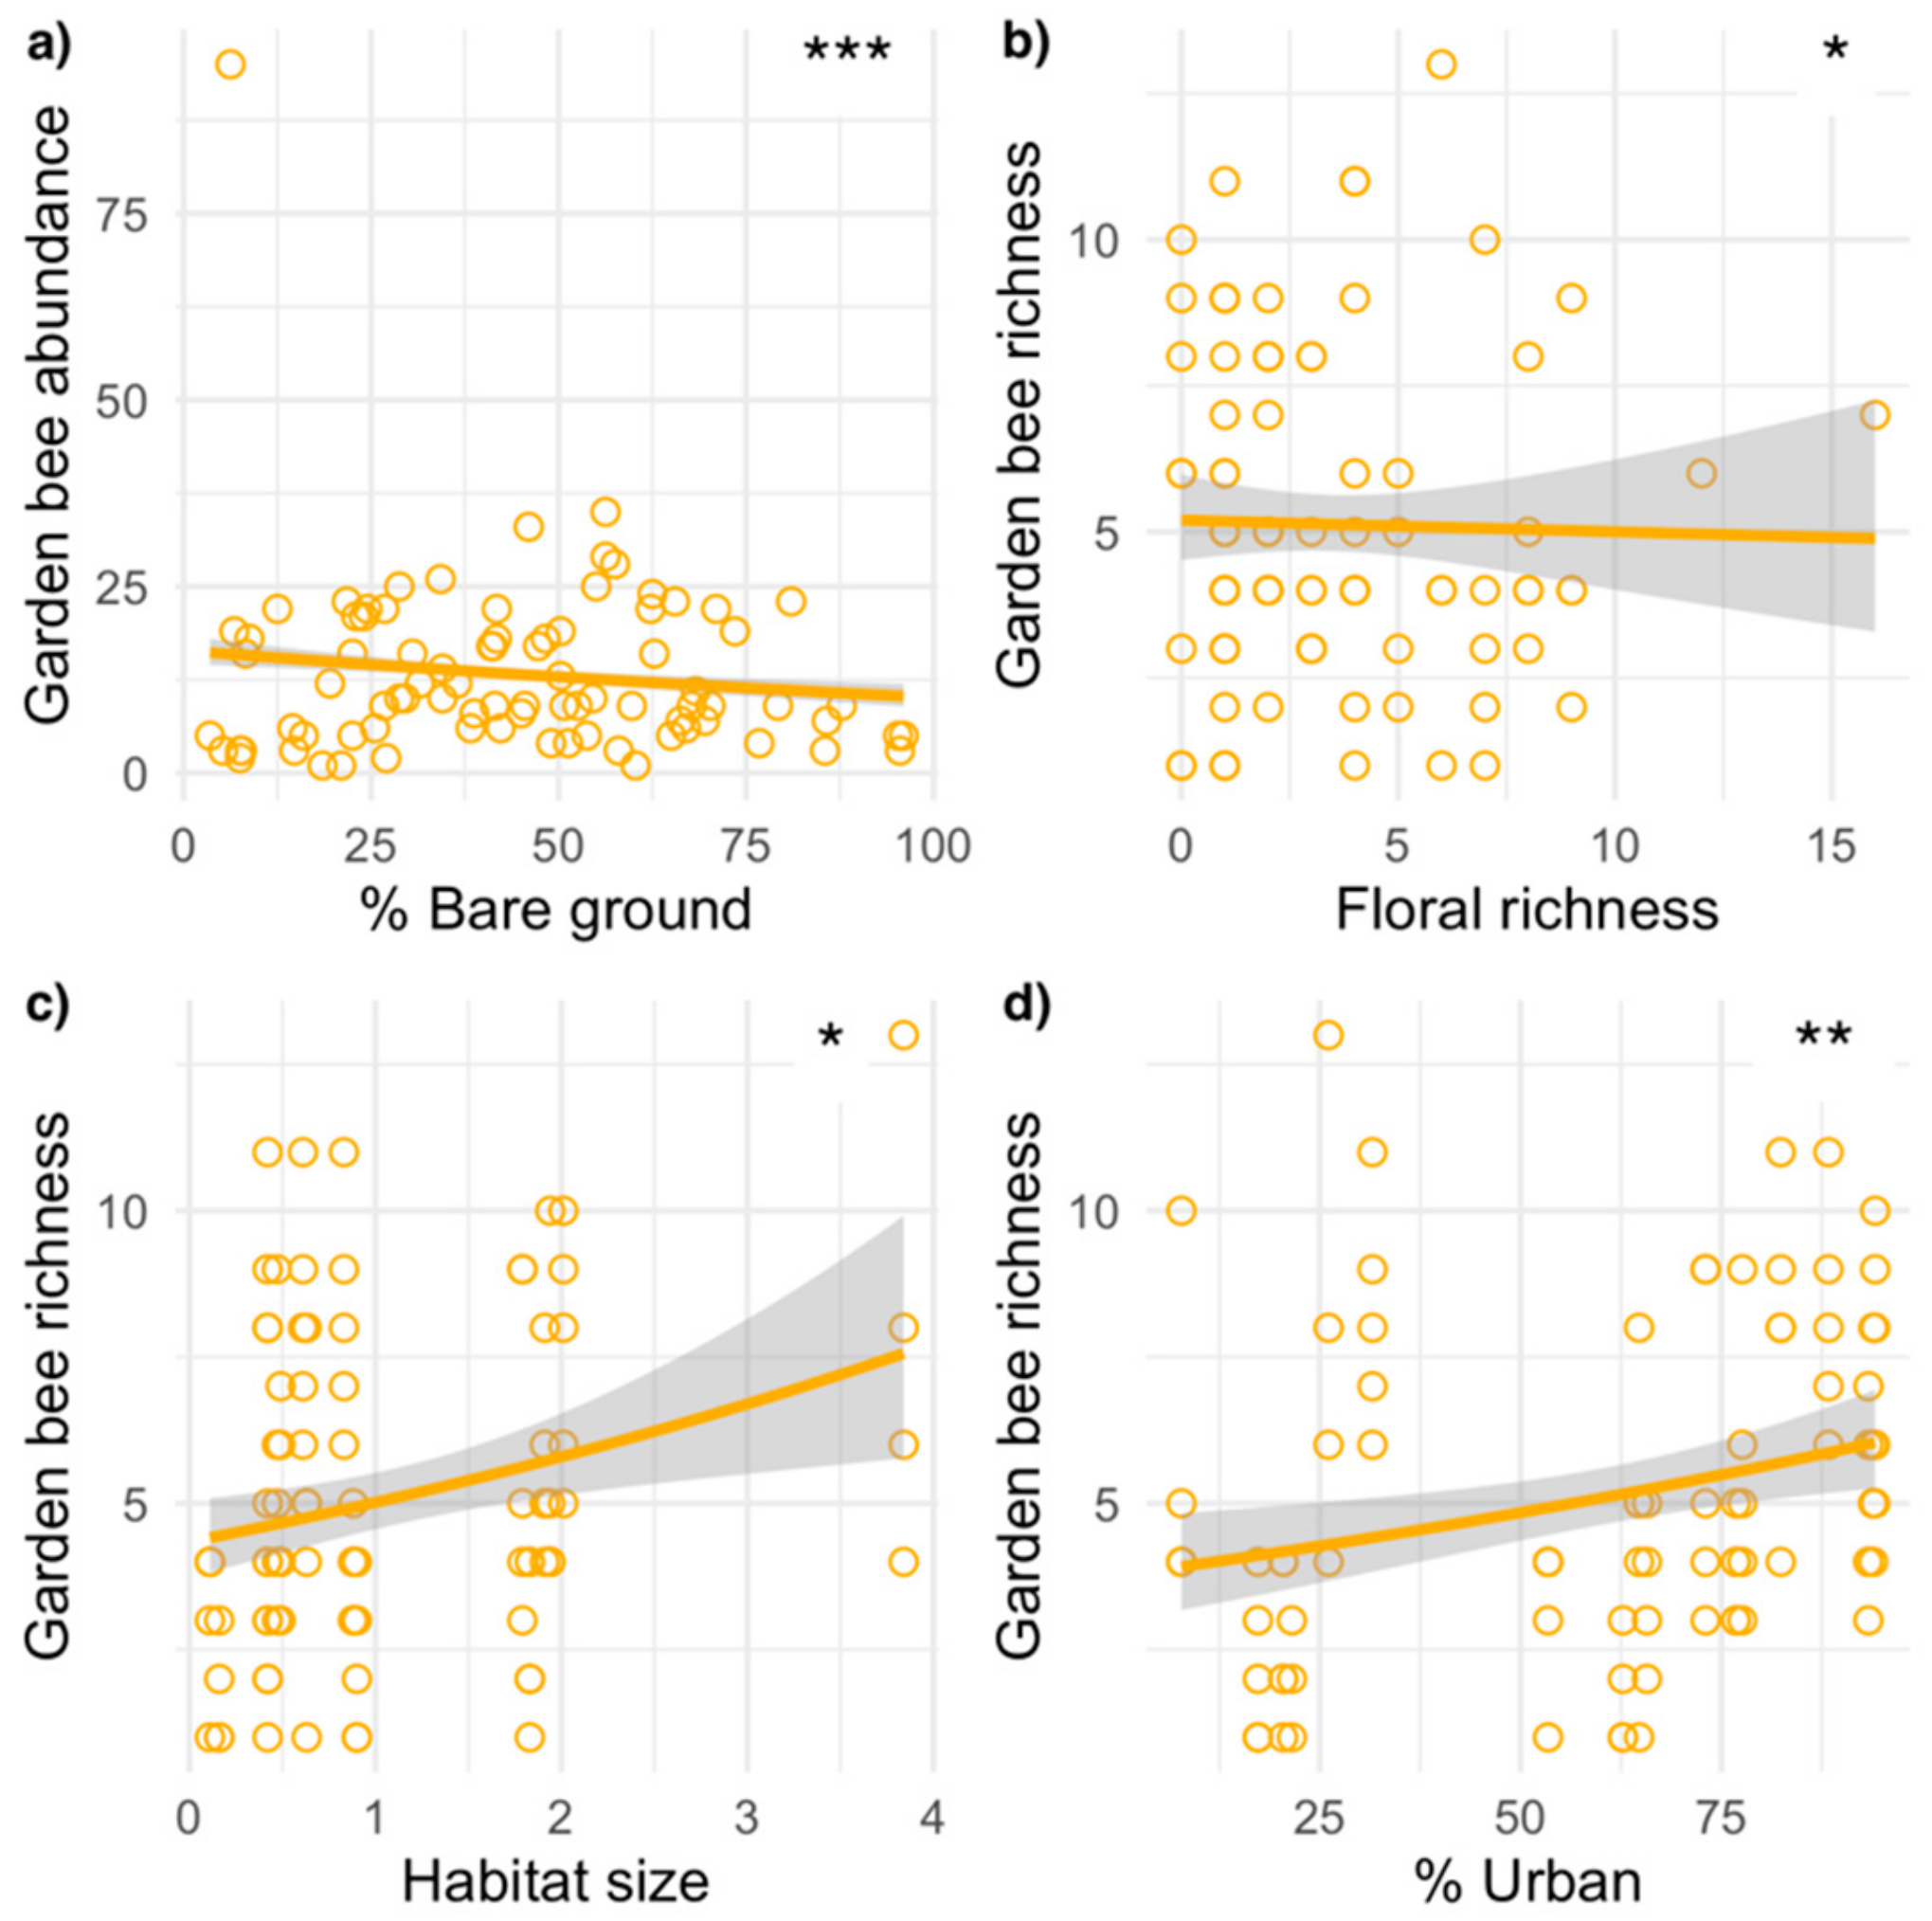
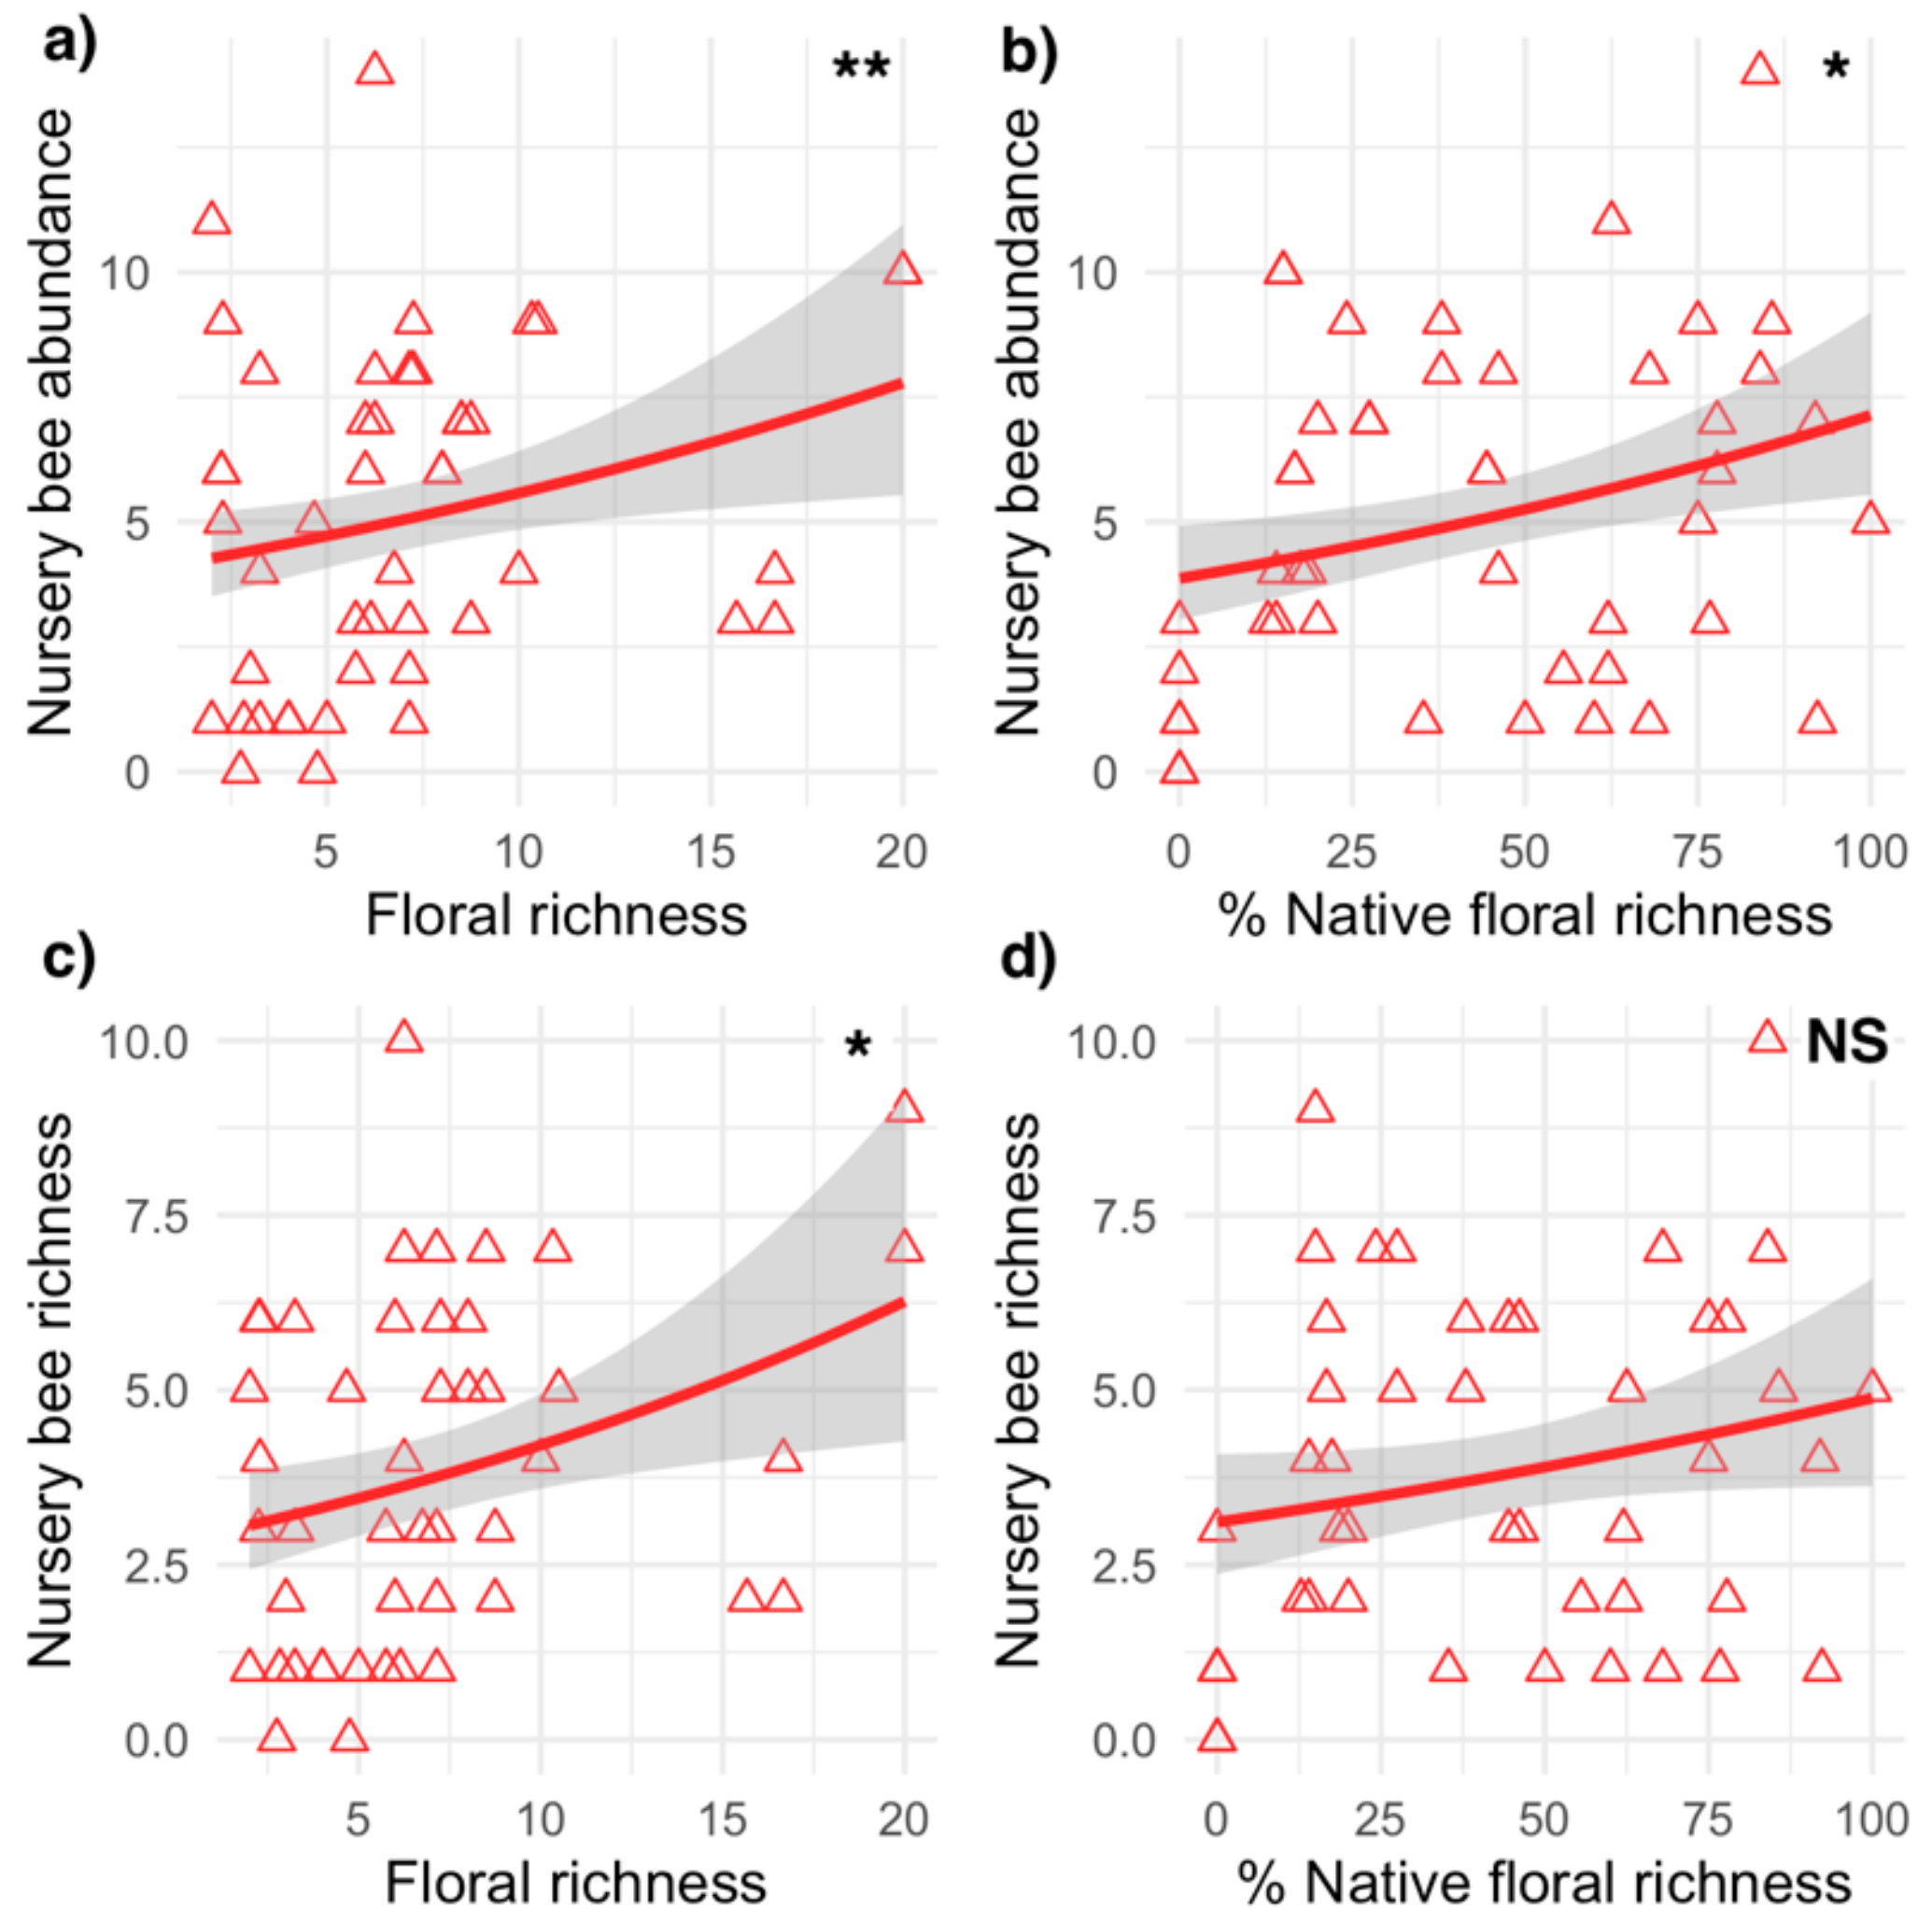
Differences in native floral richness, ground cover, habitat size, and landscape surroundings variably affected the abundance and richness of wild bees in gardens and nurseries (Table 2; Figure 2 and Figure 3). In gardens, the best model predicting abundance included habitat size and the percent of bare ground cover. Garden wild bee abundance tended to be higher in larger gardens but significantly decreased in gardens with more bare ground cover. The best model predicting garden wild bee richness included perennial floral richness, habitat size, the percent of bare ground, and urban land cover surrounding gardens. Garden bee species richness was significantly higher in larger gardens with higher floral richness and in gardens surrounded by more urban land cover. In nurseries, the best model predicting wild bee abundance included perennial floral richness, the percent native perennial richness, and the amount of urban land cover surrounding sites. Nursery bee abundance was significantly higher in nurseries with greater floral richness and native richness, and generally higher in nurseries surrounded by more urban land cover. The best model predicting nursery bee species richness included floral richness and the proportion of native richness, with richness higher in nurseries with greater floral richness and a higher proportion of natives.
3.4. Local and Landscape Features in Relation to Community Composition
4. Discussion
Urban gardens and nurseries vary in their flowering plant composition, ground cover management, and landscape features. These differences in local habitat and landscape features affect wild bee populations. A continuous and diverse supply of floral rewards and ground nesting resources is necessary for bees to persist in landscapes [32,74], and establishing such resources is a common goal of many pollinator habitat enhancement efforts in agroecosystems [75,76,77]. In this study, we opportunistically compared urban gardens and nurseries in California to ask how flowering perennial plant richness, native perennial richness, ground cover, habitat size, and landscape surroundings variably affected the abundance, richness, and community composition of wild bees in both gardens and nurseries. We found that higher flowering perennial richness promoted higher bee species richness in both habitat types. In nurseries, higher perennial richness and a higher proportion of perennials native to California were positively related to bee abundance. In gardens, bee community composition was not related to any measured features, whereas in nurseries, the proportion of native plant species influenced bee community composition. We collected 49 bee species in northern California gardens and 59 bee species in southern California nurseries. Methodological differences considered, these species richness estimates are comparable to those from bee surveys in residential areas in northern California (76 species, [22]) and urbanized fragments of sage scrub from southern California (70 species; [78]). Collectively, this work shows that maintaining flowering plants, planting native perennial plant species, and conserving large urban habitats can promote wild bee populations across urban landscapes.
4.1. Importance of Local and Landscape Features for Wild Bees
At the local habitat scale, wild bee species richness in both gardens and nurseries was positively related to greater flowering perennial richness. This finding adds to an increasing body of literature that connects urban bee richness to floral resource availability and composition [12,22,36,79]. Furthermore, native plant species within a habitat can structure bee community composition. In nurseries, the proportion of perennial plant species native to California was positively related to wild bee abundance, and significantly shaped the bee communities in these habitats. Collectively, this illustrates that native plant richness, not just overall richness, is important for supporting species-rich, abundant, and distinct wild bee assemblages [80]. Studies have found that backyard gardens with native flowers promote more abundant and diverse bee assemblages than gardens without natives [15]. However, other studies have found that native flowers installed in community gardens failed to increase wild bee diversity in gardens [31]. Indeed, in the gardens, the relatively weak relationship between floral richness and bee richness may suggest that annual floral richness typical for many vegetable crops is more important for garden bee species richness and abundance. We are unaware of previous studies investigating bee communities specifically in nurseries. However, in this habitat type, the long-term presence of flowering perennials may be able to attract and support wild bees over long periods, rather than just temporarily. The positive relationships between wild bee abundance and native plant richness in nurseries is similar to relationships reported in other plant species rich systems such as residential yards [22,25]. Despite the fact that residential areas and commercial nurseries are managed very differently, wild bees responding to native plants in both these systems suggests that this is likely a robust strategy for promoting pollinators in urban areas.
The amount of bare ground negatively affected the abundance of garden bees; however, this relationship was weak and suggests a more complex relationship. Many wild bee species nest in the ground and utilize bare soil, particularly in agroecosystems [81], and we would thus expect that greater bare soil in the habitat would increase bee abundance and richness through the provisioning of nesting resources. Indeed, in urban gardens, the absence of bare soil has been related to lower abundance and richness of bees [16]. Although most species of bees nest underground, some evidence suggests urban habitat fragmentation can increase the occurrence of aboveground cavity nesting species in local assemblages [34]. In our study, one garden with high amounts of bare soil had, on average, only five individuals observed per sampling event. However, despite low abundance of wild bees, this garden was relatively species rich, with those five individuals representing five different species, most of which were twig and cavity nesting species (e.g., Hylaeus spp.). On the other end of the spectrum, one garden with low amounts of bare soil also had a high abundance and richness of Hylaeus, with five Hylaeus species documented in one sampling event. Thus, for these and similar bee species, the availability of cavity nesting areas in the garden is probably more important than the amount of bare soil. Or, it may be that other environmental variables are affecting bee abundance and community composition so that cavity nesters are present at greater numbers. The importance of nesting resource availability in structuring bee communities in urban systems is an important direction of future study because bee nesting behavior in urban environments is complex. For example, in one study, when soil and twig nesting habitat was installed within an urban habitat, it had little effect on wild bee recruitment [82]. The heavy modification of urban soils from their natural state via compaction and eutrophication may make gardens—which are often located in environmentally impacted urban areas—unattractive as bee nesting sites [34]. Furthermore, in gardens, soils that would be available are often covered with mulch, which may make them hard to access for bees, or have synthetic amendments, which may deter bees.
At the landscape scale, the amount of urban land cover surrounding gardens had a positive relationship with both garden bee abundance and richness. Our results support the idea [17] that some urban areas can support wild bee species by acting as a refuge for diverse species assemblages. In nurseries, urban land cover did not have a strong significant effects on wild bees, though it was included in the best model for abundance. Some studies in urban gardens found no effect of urban impervious surface on pollination services [83], whereas others found that impervious cover negatively affected bee assemblages and pollination [84,85]. Thus, a strong relationship between bees and urbanization is not yet generalizable, with system- and region-specific factors yet to be identified [20,41].
4.2. Similarities Between Gardens and Nurseries
Some of the same local and landscape features similarly impacted wild bees in both urban habitat types. In both gardens and nurseries, greater perennial floral richness had a positive relationship with wild bee richness, showing that this local habitat feature has a generalizable positive impact on wild bees in urban agricultural habitats. It is interesting to note that the amount of urbanization in the surrounding landscape did not have a negative effect in the best models for either study system, again supporting the argument that urbanization may not have a negative impact on all fauna in all regions, or that urbanization drives pollinators to collect in locally rich habitats. The lack of a strong relationship in nurseries could be because landscapes were less urbanized overall around our nurseries than they were around our gardens (Table 1). Thus, the relationship between urbanization in the landscape and wild bee diversity may be modulated by habitat resources within the surrounding landscape [86].
Another interesting comparison to draw between habitat types is the availability of bare soil. Although bare soil was related to wild bee abundance in gardens, it had no effect on wild bee communities in nurseries. This is puzzling, as many small-bodied bees (e.g., Lasioglossum (Dialictus) spp.) were caught well inside nurseries, suggesting some of these species are nesting within nurseries, given the large area of these sites (Table 1) and the comparatively short flight ranges of small bees [66]. We are aware of anecdotal accounts of wild bees nesting in soil within aboveground plant containers (personal communication), which we did not search for in nurseries, nor did we include in our measurements of nursery bare soil cover. If this is true, bees may not be nest-site limited in nurseries due to the large quantities of aboveground soil in plant containers. However, the soil of most plant containers are regularly saturated by irrigation, rendering it unlikely that we would observe high rates of container nesting. Future studies could assess whether potting media or other containerized soils serve as a suitable substrate for soil-nesting bee species in nurseries.
4.3. Study Limitations
In this study, we used two datasets to compare two types of urban agricultural habitats to ask how local and landscape features in these systems impact wild bees. We recognize that there are limitations in comparing separate existing datasets due to inherent differences in the experimental designs and data collection methods. For example, garden data were collected over one year (2015) in central California, whereas nursery data was collected over two years (2016 and 2017) in southern California. Garden data were collected at a finer time scale (five replicate sampling events within a year) than nursery data (four sampling events across two years). In addition, we did not collect honey bees in nurseries, whereas honey bees were collected in gardens but then excluded before analysis, meaning that time was spent actively collecting honey bees in gardens but not in nurseries. Our vegetation sampling methods, particularly the area of our sampling plots, also differed substantially due to differences in the area and spatial layout of these habitats. Because of these differences, we did not include measures of floral abundance in our analyses, though the impacts of floral abundance on bee communities are documented in the urban agriculture literature (e.g., [16]), and may influence wild bees in these systems. Furthermore, we could not alternate wild bee observers between nursery and urban garden sites due to geographic distance, which may have introduced sampler bias. Though these issues limit the direct comparison of our datasets, we aimed to reduce this by using the same statistical models for each habitat type and comparing only data collected within the same seasons of the year. We emphasize that the new contributions of our study are to highlight how similar local and landscape features may similarly or differently affect wild bee communities in different habitats across urbanization gradients, and should be interpreted with these caveats in mind.
4.4. Recommendations for Supporting Wild Bees in Urban Gardens and Nurseries
Urban gardens and nurseries are both agricultural systems but have different management regimes and cultivate plants for different purposes. Urban gardens are often temporary fixtures in cities due to urban development pressures, whereas nurseries are often more permanent systems, though their plant community itself is highly dynamic through time. Gardens are largely intended for the production of edible fruits and vegetables, as well as recreation for urban residents [87]. Many urban gardeners aim to promote bee conservation through planting practices grounded in ecologically-based principles—that which may be considered “bee-friendly gardening” [88]. Nurseries are essentially holding yards and propagation areas for ornamental plants, mostly growing native and exotic ornamental plants that will be distributed across a geographic region and develop to maturity elsewhere. Thus, in nurseries, the "product" of the horticultural system is the entire plant itself, with emphasis placed on its aesthetic value. Although nurseries have potential to support wild bee communities, they are rarely designed to attract and support pollinating insects. Despite differences in purpose and ecology, similarities in local and landscape features between habitat types and the impact they have on bees make opportunistic comparisons useful to produce generalizable management information. We make three main suggestions for urban gardeners, nursery management, and urban planners to promote and preserve pollinating insects in these habitats.
First, cultivating a greater richness of flowering vegetation can overall promote wild bees across habitats. Second, planting and promoting native flowering vegetation that is long-standing may be even more beneficial for wild bees. Gardeners can focus conservation efforts on increasing the number of flowering plants in their gardens to provide food resources to bees over the season. It is important to not only grow annuals (as annual floral richness can also influence bee communities in other systems, e.g., [89]), but also perennials that flower throughout the year. In nurseries, as the types of plant species grown in nurseries are additionally driven by consumer demand, increasing the public’s awareness of the benefits of regionally native plants for wild bees and other organisms [90] may encourage nurseries to increase their supply of native plants for sale, and subsequently support diverse wild bee assemblages. Third, from an urban planning perspective, our results emphasize the role of conserving large urban gardens for maintaining high species richness. The positive effect of habitat size in urban areas has similarly been shown for organisms including parasitoid wasps [91], hemipterans [92], amphibians [93], and ant species composition [94].
5. Conclusions
Urban agricultural areas present a conservation opportunity to promote wild bee biodiversity within rapidly urbanizing areas through habitat management. This is especially true in urbanizing regions that are also biodiversity hotspots. Gardens and nurseries have high potential to both support biodiversity conservation by providing habitat for wild bees, and multiple human benefits by producing food plants and ornamental plants for people. However, there is little understanding about how shared habitat features and landscape features of these systems may impact wild bee diversity. Here, we show that the local and landscape scale features of urban gardens and nurseries distributed across an urbanization gradient in California shape wild bee communities. Managing these factors is therefore important in the context of bee conservation in this biodiversity hotspot. Future work can investigate functional traits of these bee communities to further understand how such factors may influence bee community assembly and bee conservation in urban areas.
Author Contributions
Garden bee data collection and identification, M.E. and H.C.; nursery bee data collection and identification, J.M.C.; data analysis, M.E.; writing, M.E., J.M.C., and H.C. All authors have read and agreed to the published version of the manuscript.
Funding
This research was funded by the California Association of Nurseries and Garden Centers Endowment for Research and Scholarship (CANERS); The University of California Institute for Mexico and the United States (UC MEXUS) and El Consejo Nacional de Ciencia y Tecnología (CONACYT) Grant for Collaborative Projects to Stacy Philpott and Helda Morales; The University of California, Santa Cruz (UCSC) Committee on Research Faculty Research Grant to Stacy Philpott; and UCSC Heller Endowment Funds to Stacy Philpott. We acknowledge support by the German Research Foundation and the Open Access Publication Fund of TU Berlin.
Acknowledgments
We thank the urban gardeners and nursery staff who allowed us to use their properties as study sites. We also thank D. Yanega for assistance in identifying bee specimens from nurseries, and M. C. Miner, K. To, S. Zaidi, and T. Ng for assistance with nursery bee collections. We thank S. Philpott, P. Bichier, M. MacDonald, J. Burks, R. Schreiber, M. Plascencia, and S.-S. Thomas for contributing to study site access, field data collection, and data entry. We thank E. E. Wilson Rankin and two anonymous reviewers for their feedback to help improve this manuscript.
Conflicts of Interest
The authors declare no conflict of interest.
Appendix A

Table A1.
List of the 98 bee taxa collected in urban gardens and nurseries in California (N = 1380 individuals). Numbers represent the total number of individuals of that species collected in each habitat type, summed across sampling events (a blank cell means that species was not collected in that habitat type). Bolded names indicate the 10 species that were collected in both gardens and nurseries. Morphotaxa (taxa with “sp.” in place of a species epithet), though not identified to species, were determined to be taxonomically distinct units, different from one-another and from identified taxa.
| Bee Species | Gardens | Nurseries |
|---|---|---|
| Agapostemon melliventris | 2 | |
| Agapostemon texanus | 48 | 26 |
| Andrena sp. | 1 | |
| Anthidium manicatum | 2 | |
| Anthophora curta | 1 | |
| Anthophora sp. | 1 | |
| Anthophora urbana | 8 | 6 |
| Ashmeadiella bucconis | 5 | 11 |
| Ashmeadiella meliloti | 1 | |
| Augochlorella pomoniella | 3 | |
| Bombus californicus | 3 | |
| Bombus caliginosus | 96 | |
| Bombus nevadensis | 1 | |
| Bombus sonorus | 2 | |
| Bombus vosnesenskii | 71 | 1 |
| Calliopsis rhodophila | 3 | |
| Calliopsis scutellaris | 2 | |
| Calliopsis sp. | 1 | |
| Ceratina acantha | 68 | 5 |
| Ceratina nanula | 26 | 1 |
| Coelioxys rufitarsis | 2 | |
| Colletes sp. 1 | 1 | |
| Colletes sp. 2 | 1 | |
| Colletes sp. 3 | 3 | |
| Diadasia diminuta | 5 | |
| Diadasia nitidifrons | 1 | |
| Diadasia ochracea | 1 | |
| Diadasia vallicola | 2 | |
| Dianthidium pudicum | 1 | |
| Dieunomia nevadensis | 2 | |
| Eucera actuosa | 4 | |
| Halictus confusus | 3 | |
| Halictus ligatus | 46 | 45 |
| Halictus rubicundus | 1 | |
| Halictus tripartitus | 171 | 8 |
| Holcopasites sp. | 1 | |
| Hylaeus leptocephalus | 20 | |
| Hylaeus mesillae | 95 | 5 |
| Hylaeus panamensis | 13 | |
| Hylaeus polifolii | 6 | |
| Hylaeus punctatus | 33 | |
| Hylaeus rudbeckiae | 69 | |
| Hylaeus sp. 1 | 11 | |
| Hylaeus sp. 2 | 6 | |
| Hylaeus sp. 3 | 1 | |
| Lasioglossum (Dialictus) incompletum | 1 | |
| Lasioglossum (Dialictus) sp. 01 | 48 | |
| Lasioglossum (Dialictus) sp. 02 | 1 | |
| Lasioglossum (Dialictus) sp. 03 | 9 | |
| Lasioglossum (Dialictus) sp. 04 | 4 | |
| Lasioglossum (Dialictus) sp. 05 | 4 | |
| Lasioglossum (Dialictus) sp. 06 | 1 | |
| Lasioglossum (Dialictus) sp. 07 | 1 | |
| Lasioglossum (Dialictus) sp. 08 | 3 | |
| Lasioglossum (Dialictus) sp. 09 | 5 | |
| Lasioglossum (Dialictus) sp. 10 | 7 | |
| Lasioglossum (Dialictus) sp. 11 | 1 | |
| Lasioglossum (Dialictus) sp. 12 | 1 | |
| Lasioglossum (Evylaeus) sp. 1 | 8 | |
| Lasioglossum (Lasioglossum) sp. 1 | 20 | |
| Lasioglossum (Lasioglossum) sp. 2 | 48 | |
| Megachile apicalis | 1 | |
| Megachile brevis | 4 | 1 |
| Megachile inimica | 2 | |
| Megachile latimanus | 1 | |
| Megachile perihirta | 30 | |
| Megachile relativa | 1 | |
| Megachile rotundata | 6 | |
| Megachile sp. 1 | 1 | |
| Megachile sp. 2 | 1 | |
| Megachile sp. 3 | 1 | |
| Megachile sp. 4 | 1 | |
| Megachile sp. 5 | 1 | |
| Megachile sp. 6 | 1 | |
| Megachile sp. 7 | 1 | |
| Megachile sp. 8 | 1 | |
| Megachile sp. 9 | 5 | |
| Melissodes robustior | 97 | |
| Melissodes sp. 1 | 8 | |
| Melissodes sp. 2 | 1 | |
| Melissodes sp. 3 | 14 | |
| Melissodes sp. 4 | 4 | |
| Melissodes sp. 5 | 5 | |
| Melissodes sp. 6 | 8 | |
| Nomada edwardsii | 2 | |
| Nomada sp. 1 | 4 | |
| Nomada sp. 2 | 2 | |
| Osmia sp. | 1 | |
| Peponapis pruinosa | 5 | |
| Perdita rhois | 6 | |
| Sphecodes sp. 1 | 3 | |
| Sphecodes sp. 2 | 1 | |
| Svastra sabinensis | 2 | |
| Triepeolus concavus | 1 | |
| Triepeolus sp. | 3 | |
| Unknown Unknown | 1 | |
| Xylocopa tabaniformis orpifex | 12 | |
| Xylocopa varipuncta | 27 | |
| TOTAL INDIVIDUALS | 1138 | 242 |
| TOTAL SPECIES | 49 | 59 |
References
- Brown, M.J.F.; Paxton, R.J. The conservation of bees: A global perspective. Apidologie 2009, 40, 410–416. [Google Scholar] [CrossRef] [Green Version]
- Potts, S.G.; Biesmeijer, J.C.; Kremen, C.; Neumann, P.; Schweiger, O.; Kunin, W.E. Global pollinator declines: Trends, impacts and drivers. Trends Ecol. Evol. 2010, 25, 345–353. [Google Scholar] [CrossRef] [PubMed]
- Goulson, D.; Nicholls, E.; Botías, C.; Rotheray, E.L. Bee declines driven by combined Stress from parasites, pesticides, and lack of flowers. Science 2015, 347. [Google Scholar] [CrossRef] [PubMed]
- Niemelä, J. Urban Ecology; Breuste, J.H., Elmqvist, T., Guntenspergen, G., James, P., McIntyre, N.E., Eds.; Oxford University Press: Oxford, UK, 2011; ISBN 9780199563562. [Google Scholar]
- McIntyre, N.E. Ecology of urban arthropods: A review and a call to action. Ann. Entomol. Soc. Am. 2000, 93, 825–835. [Google Scholar] [CrossRef]
- Miller, J.R.; Hobbs, R.J. Conservation Where People Live and Work. Conserv. Biol. 2002, 16, 330–337. [Google Scholar] [CrossRef]
- Hennig, E.I.; Ghazoul, J. Pollinating animals in the urban environment. Urban Ecosyst. 2011, 15, 149–166. [Google Scholar] [CrossRef] [Green Version]
- Winfree, R.; Williams, N.M.; Gaines, H.; Ascher, J.S.; Kremen, C. Wild bee pollinators provide the majority of crop visitation across land-use gradients in New Jersey and Pennsylvania, USA. J. Appl. Ecol. 2008, 45, 793–802. [Google Scholar] [CrossRef]
- Ollerton, J.; Winfree, R.; Tarrant, S. How many flowering plants are pollinated by animals? Oikos 2011, 120, 321–326. [Google Scholar] [CrossRef]
- Baldock, K.C.R.; Goddard, M.A.; Hicks, D.M.; Kunin, W.E.; Mitschunas, N.; Osgathorpe, L.M.; Potts, S.G.; Robertson, K.M.; Scott, A.V.; Stone, G.N.; et al. Where is the UK’s pollinator biodiversity? The importance of urban areas for flower-visiting insects. Proc. Biol. Sci. 2015, 282, 20142849. [Google Scholar] [CrossRef] [Green Version]
- Matteson, K.C.; Ascher, J.S.; Langellotto, G.A. Bee richness and abundance in New York City urban gardens. Ann. Entomol. Soc. Am. 2008, 101, 140–150. [Google Scholar] [CrossRef]
- Fetridge, E.D.; Ascher, J.S.; Langellotto, G.A. The Bee Fauna of Residential Gardens in a Suburb of New York City (Hymenoptera: Apoidea). Ann. Entomol. Soc. Am. 2008, 101, 1067–1077. [Google Scholar] [CrossRef]
- Frankie, G.W.; Thorp, R.W.; Hernandez, J.; Rizzardi, M.; Pawelek, J.C.; Witt, S.L.; Coville, R.; Wojcik, V.A. Native bees are a rich natural resource in urban California gardens. Calif. Agric. 2009, 63, 113–120. [Google Scholar] [CrossRef]
- Matteson, K.C.; Langellotto, G.A. Determinates of inner city butterfly and bee species richness. Urban Ecosyst. 2010, 13, 333–347. [Google Scholar] [CrossRef] [Green Version]
- Pardee, G.L.; Philpott, S.M. Native plants are the bee’s knees: Local and landscape predictors of bee richness and abundance in backyard gardens. Urban Ecosyst. 2014, 1–19. [Google Scholar] [CrossRef] [Green Version]
- Quistberg, R.D.; Bichier, P.; Philpott, S.M. Landscape and local correlates of bee abundance and species richness in urban gardens. Environ. Entomol. 2016, 45, 592–601. [Google Scholar] [CrossRef]
- Hall, D.M.; Camilo, G.R.; Tonietto, R.K.; Ollerton, J.; Ahrné, K.; Arduser, M.; Ascher, J.S.; Baldock, K.C.R.; Fowler, R.; Frankie, G.; et al. The city as a refuge for insect pollinators. Conserv. Biol. 2017, 31. [Google Scholar] [CrossRef]
- Ballare, K.M.; Neff, J.L.; Ruppel, R.; Jha, S. Multi-scalar drivers of biodiversity: Local management mediates wild bee community response to regional urbanization. Ecol. Appl. 2019, 29, 1–16. [Google Scholar] [CrossRef]
- Aronson, M.F.J.; Nilon, C.H.; Lepczyk, C.A.; Parker, T.S.; Warren, P.S.; Cilliers, S.S.; Goddard, M.A.; Hahs, A.K.; Herzog, C.; Katti, M.; et al. Hierarchical filters determine community assembly of urban species pools. Ecology 2016, 97, 2952–2963. [Google Scholar] [CrossRef] [Green Version]
- Hernandez, J.L.; Frankie, G.W.; Thorp, R.W. Ecology of Urban Bees: A Review of Current Knowledge and Directions for Future Study. Cities Environ. 2009, 2, 1–15. [Google Scholar] [CrossRef]
- Plascencia, M.; Philpott, S.M. Floral abundance, richness, and spatial distribution drive urban garden bee communities. Bull. Entomol. Res. 2017. [Google Scholar] [CrossRef] [Green Version]
- Frankie, G.W.; Thorp, R.W.; Schindler, M.; Hernandez, J.; Ertter, B.; Rizzardi, M. Ecological Patterns of Bees and Their Host Ornamental Flowers in Two Northern California Cities. J. Kansas Entomol. Soc. 2005, 78, 227–246. [Google Scholar] [CrossRef]
- Pawelek, J.; Frankie, G.W.; Thorp, R.W.; Przybylski, M. Modification of a community garden to attract native bee pollinators in urban San Luis Obispo, California. Cities Environ. 2009, 2, 1–21. [Google Scholar] [CrossRef]
- Richards, R.; Chambers, J.C.; Ross, C. Use of native plants on federal lands: Policy and practice. J. Range Manag. 1998, 51, 625–632. [Google Scholar] [CrossRef]
- Fukase, J.; Simons, A. Increased pollinator activity in urban gardens with more native flora. Appl. Ecol. Environ. Res. 2016, 14, 297–310. [Google Scholar] [CrossRef]
- McIntyre, N.E.; Hostetler, M.E. Effects of urban land use on pollinator (Hymenoptera: Apoidea) communities in a desert metropolis. Basic Appl. Ecol. 2001, 2, 209–218. [Google Scholar]
- Morandin, L.A.; Long, R.F.; Kremen, C. Hedgerows enhance beneficial insects on adjacent tomato fields in an intensive agricultural landscape. Agric. Ecosyst. Environ. 2014, 189. [Google Scholar] [CrossRef] [Green Version]
- Chrobock, T.; Winiger, P.; Fischer, M.; van Kleunen, M. The cobblers stick to their lasts: Pollinators prefer native over alien plant species in a multi-species experiment. Biol. Invasions 2013, 15, 2577–2588. [Google Scholar] [CrossRef] [Green Version]
- Aleixo, K.P.; de Faria, L.B.; Groppo, M.; Castro, M.M.; da Silva, C.I. Spatiotemporal distribution of floral resources in a Brazilian city: Implications for the maintenance of pollinators, especially bees. Urban For. Urban Green. 2014, 13, 689–696. [Google Scholar] [CrossRef]
- Williams, N.M.; Cariveau, D.; Winfree, R.; Kremen, C. Bees in disturbed habitats use, but do not prefer, alien plants. Basic Appl. Ecol. 2011, 12, 332–341. [Google Scholar] [CrossRef]
- Matteson, K.C.; Langellotto, G.A. Small scale additions of native plants fail to increase beneficial insect richness in urban gardens. Insect Conserv. Divers. 2011, 4, 89–98. [Google Scholar] [CrossRef]
- Potts, S.G.; Vulliamy, B.; Roberts, S.; O’Toole, C.; Dafni, A.; Ne’eman, G.; Willmer, P. Role of nesting resources in organising diverse bee communities in a Mediterranean landscape. Ecol. Entomol. 2005, 30, 78–85. [Google Scholar] [CrossRef]
- Ballare, K. Multi-Scalar Drivers of Native Bee Community Composition and Population Genetic Structure in Human-Altered Landscapes. Ph.D. Thesis, University of Texas-Austin, Austin, TX, USA, 2019. [Google Scholar]
- Cane, J.H.; Minckley, R.L.; Kervin, L.J.; Roulston, T.H.; Williams, N.M. Complex responses within a desert bee guild (Hymenoptera: Apiformes) to urban habitat fragmentation. Ecol. Appl. 2006, 16, 632–644. [Google Scholar] [CrossRef] [Green Version]
- Fischer, L.K.; Eichfeld, J.; Kowarik, I.; Buchholz, S. Disentangling urban habitat and matrix effects on wild bee species. PeerJ 2016, 4, e2729. [Google Scholar] [CrossRef] [PubMed] [Green Version]
- Baldock, K.C.R.; Goddard, M.A.; Hicks, D.M.; Kunin, W.E.; Mitschunas, N.; Morse, H.; Osgathorpe, L.M.; Potts, S.G.; Robertson, K.M.; Scott, A.V.; et al. A systems approach reveals urban pollinator hotspots and conservation opportunities. Nat. Ecol. Evol. 2019. [Google Scholar] [CrossRef] [PubMed] [Green Version]
- Corlett, J.L.; Dean, E.A.; Grivetti, L.E. Hmong Gardens: Botanical Diversity in an Urban Setting. Econ. Bot. 2003, 57, 365–379. [Google Scholar] [CrossRef]
- Thompson, K.; Austin, K.C.; Smith, R.M.; Warren, P.H.; Angold, P.G.; Gaston, K.J. Urban domestic gardens (I): Putting small-scale plant diversity in context. J. Veg. Sci. 2003, 14, 71. [Google Scholar] [CrossRef]
- Thompson, K.; Hodgson, J.G.; Smith, R.M.; Warren, P.H.; Gaston, K.J. Urban domestic gardens (III): Composition and diversity of lawn floras. J. Veg. Sci. 2004, 15, 373. [Google Scholar] [CrossRef]
- Speak, A.F.; Mizgajski, A.; Borysiak, J. Allotment gardens and parks: Provision of ecosystem services with an emphasis on biodiversity. Urban For. Urban Green. 2015, 14, 772–781. [Google Scholar] [CrossRef]
- Normandin, É.; Vereecken, N.J.; Buddle, C.M.; Fournier, V. Taxonomic and functional trait diversity of wild bees in different urban settings. PeerJ 2017, 2050, 1–35. [Google Scholar] [CrossRef] [Green Version]
- Parke, J.L.; Grünwald, N.J. A Systems Approach for Management of Pests and Pathogens of Nursery Crops. Plant Dis. 2012, 96, 1236–1244. [Google Scholar] [CrossRef] [Green Version]
- Acar, C.; Acar, H.; Eroğlu, E. Evaluation of ornamental plant resources to urban biodiversity and cultural changing: A case study of residential landscapes in Trabzon city (Turkey). Build. Environ. 2007, 42, 218–229. [Google Scholar] [CrossRef]
- Wojcik, V.A.; McBride, J.R. Common factors influence bee foraging in urban and wildland landscapes. Urban Ecosyst. 2012, 15, 581–598. [Google Scholar] [CrossRef]
- Frankie, G.W.; Vinson, S.B.; Rizzardi, M.A.; Griswold, T.L.; Coville, R.E.; Grayum, M.H.; Martinez, L.E.S.; Foltz-Sweat, J.; Pawelek, J.C. Relationships of Bees to Host Ornamental and Weedy Flowers in Urban Northwest Guanacaste Province, Costa Rica. J. Kansas Entomol. Soc. 2013, 86, 325–351. [Google Scholar] [CrossRef]
- Riddle, T.C.; Mizell III, R.F. Use of Crape Myrtle, Lagerstroemia(Myrtales: Lythraceae), Cultivars as a Pollen Source by Native and Non-Native Bees (Hymenoptera: Apidae) in Quincy, Florida. Fla. Entomol. 2016, 99, 38–46. [Google Scholar] [CrossRef] [Green Version]
- Somme, L.; Moquet, L.; Quinet, M.; Vanderplanck, M.; Michez, D.; Lognay, G.; Jacquemart, A.-L. Food in a row: Urban trees offer valuable floral resources to pollinating insects. Urban Ecosyst. 2016, 19, 1149–1161. [Google Scholar] [CrossRef]
- Harris, B.A.; Braman, S.K.; Pennisi, S.V. Influence of Plant Taxa on Pollinator, Butterfly, and Beneficial Insect Visitation. HortScience 2016, 51, 1016–1019. [Google Scholar] [CrossRef] [Green Version]
- Zotarelli, H.G.S.; Evans, D.M.; Bego, L.R.; Sofia, S.H. A Comparison of Social Bee{\textendash}Plant Networks between Two Urban Areas. Neotrop. Entomol. 2014, 43, 399–408. [Google Scholar] [CrossRef]
- Hopwood, J.; Vaughan, M.; Shepherd, M.; Biddinger, D.; Mader, E.; Black, S.H.; Mazzacano, C. Are Neonicotinoids Killing Bees? A Review of Research into the Effects of Neonicotinoid Insecticides on Bees, with Recommendations for Action; The Xerces Society for Invertebrate Conservation: Portland, OR, USA, 2012. [Google Scholar]
- Brown, T.G.; Kegley, S.; Archer, L. Gardeners Beware 2014: Bee-Toxic Pesticides Found in“Bee-Friendly” Plants Sold at Garden Centers Across the US and Canada; Friends of the Earth Canada: Ottawa, ON, Canada, 2014. [Google Scholar]
- Kegley, S.; Froines, J.; Kobylewski, S.; Malloy, T. Risk and Decision: Evaluating Pesticide Approval in California; UCLA School of Law and School of Public Health: Los Angeles, CA, USA, 2013; pp. 1–32. [Google Scholar]
- Lentola, A.; David, A.; Abdul-Sada, A.; Tapparo, A.; Goulson, D.; Hill, E.M. Ornamental plants on sale to the public are a significant source of pesticide residues with implications for the health of pollinating insects. Environ. Pollut. 2017, 228, 297–304. [Google Scholar] [CrossRef]
- Stoner, K.A.; Cowles, R.S.; Nurse, A.; Eitzer, B.D. Tracking Pesticide Residues to a Plant Genus Using Palynology in Pollen Trapped from Honey Bees (Hymenoptera: Apidae) at Ornamental Plant Nurseries. Environ. Entomol. 2019, 48, 351–362. [Google Scholar] [CrossRef] [Green Version]
- USDA NASS. U.S. Horticulture in 2014: Results from the 2014 Census of Horticultural Specialties. Available online: https://www.nass.usda.gov/Publications/Highlights/2016/Census_of_Horticulture_Highlights.pdf (accessed on 27 December 2019).
- California Floristic Province|CEPF. Available online: https://www.cepf.net/our-work/biodiversity-hotspots/california-floristic-province (accessed on 24 October 2019).
- Discover Life. Available online: www.discoverlife.org (accessed on 20 October 2019).
- Packer, L.; Ratti, C. Key to the Bee Families of the World. Available online: https://www.yorku.ca/bugsrus/resources/keys/BFoW/Images/Introduction/Introduction.html (accessed on 27 December 2019).
- Packer, L.; Genaro, J.A.; Sheffield, C.S. The Bee Genera of Eastern Canada. Can. J. Arthropod Identif 2007, 3. [Google Scholar] [CrossRef]
- Michener, C.D. The Bees of the World; Johns Hopkins University Press: Baltimore, MD, USA, 1990; Volume 78, ISBN 0801885736. [Google Scholar]
- Michener, C.D.; McGinley, R.J.; Danforth, B.N. The Bee Genera of North and Central America (Hymenoptera: Apoidea); Smithsonian Institution Press: Washington, DC, USA, 1994. [Google Scholar]
- Google Inc. Google Earth. Available online: www.earth.google.com (accessed on 27 December 2019).
- Desktop, E.A. ESRI ArcGIS desktop: Release 10. Environ. Syst. Res. Inst. 2011, 437, 438. [Google Scholar]
- QGIS Development Team. QGIS Geographic Information System: Open Source Geospatial Foundation. Available online: http://qgis.osgeo.org (accessed on 27 December 2019).
- Jung, M. LecoS—A python plugin for automated landscape ecology analysis. Ecol. Inform. 2016, 31, 18–21. [Google Scholar] [CrossRef]
- Greenleaf, S.S.; Williams, N.M.; Winfree, R.; Kremen, C. Bee foraging ranges and their relationship to body size. Oecologia 2007, 153, 589–596. [Google Scholar] [CrossRef] [PubMed]
- Homer, C.G.; Dewitz, J.A.; Yang, L.; Jin, S.; Danielson, P.; Xian, G.; Coulston, J.; Herold, N.D.; Wickham, J.D.; Megown, K. Completion of the 2011 National Land Cover Database for the conterminous United States-Representing a decade of land cover change information. Photogramm. Eng. Remote Sens. 2015, 81, 345–354. [Google Scholar] [CrossRef]
- R Core Team. R: A Language and Environment for Statistical Computing; R Foundation for Statistical Computing: Vienna, Austria, 2019. [Google Scholar]
- Bates, D.; Maechler, M.; Bolker, B.; Walker, S.; Christensen, R.H.B.; Singmann, H. lme4: Linear mixed-effects models using Eigen and S4. R Packag. 2015, 1, 1–23. [Google Scholar]
- Fox, J.; Weisberg, S. An R Companion to Applied Regression, 2nd ed.; Sage: Thousand Oaks, CA, USA, 2011. [Google Scholar]
- Barton, K. MuMIn: Multi-Model Inference. R Package Version 1. 0. 0. Available online: http://r-forge.r-project.org/projects/mumin/ (accessed on 10 July 2009).
- Burnham, K.P.; Anderson, D.R. Model Selection and Multimodel Inference: A Practical Information—Theoretic Approach; Springer: New York, NY, USA, 2002. [Google Scholar]
- Oksanen, J. Multivariate Analysis of Ecological Communities in R. Vegan Tutor. 2015, 1–40. [Google Scholar] [CrossRef]
- Westrich, P. The Conservation of Bees; The Linnean Society of London and The International Bee Research Association: London, UK, 2006. [Google Scholar]
- Pywell, R.F.; Warman, E.A.; Carvell, C.; Sparks, T.H.; Dicks, L.V.; Bennett, D.; Wright, A.; Critchley, C.N.R.; Sherwood, A. Providing foraging resources for bumblebees in intensively farmed landscapes. Biol. Conserv. 2005, 121, 479–494. [Google Scholar] [CrossRef]
- Carvell, C.; Roy, D.B.; Smart, S.M.; Pywell, R.F.; Preston, C.D.; Goulson, D. Declines in forage availability for bumblebees at a national scale. Biol. Conserv. 2006, 132, 481–489. [Google Scholar] [CrossRef]
- Goulson, D.; Lye, G.C.; Darvill, B. Decline and Conservation of Bumble Bees. Annu. Rev. Entomol. 2008, 53, 191–208. [Google Scholar] [CrossRef]
- Hung, K.L.J.; Ascher, J.S.; Davids, J.A.; Holway, D.A. Ecological filtering in scrub fragments restructures the taxonomic and functional composition of native bee assemblages. Ecology 2019, 100, 1–13. [Google Scholar] [CrossRef]
- Lowenstein, D.M.; Matteson, K.C.; Minor, E.S. Diversity of wild bees supports pollination services in an urbanized landscape. Oecologia 2015, 179. [Google Scholar] [CrossRef] [PubMed]
- Morandin, L.A.; Kremen, C. Bee Preference for Native versus Exotic Plants in Restored Agricultural Hedgerows. Restor. Ecol. 2013, 21, 26–32. [Google Scholar] [CrossRef] [Green Version]
- Kennedy, C.M.; Lonsdorf, E.; Neel, M.C.; Williams, N.M.; Ricketts, T.H.; Winfree, R.; Bommarco, R.; Brittain, C.; Burley, A.L.; Cariveau, D.; et al. A global quantitative synthesis of local and landscape effects on wild bee pollinators in agroecosystems. Ecol. Lett. 2013, 16, 584–599. [Google Scholar] [CrossRef] [PubMed]
- Fortel, L.; Henry, M.; Guilbaud, L.; Mouret, H.; Vaissière, B.E. Use of human-made nesting structures by wild bees in an urban environment. J. Insect Conserv. 2016, 20, 239–253. [Google Scholar] [CrossRef] [Green Version]
- Potter, A.; LeBuhn, G. Pollination service to urban agriculture in San Francisco, CA. Urban Ecosyst. 2015, 18, 885–893. [Google Scholar] [CrossRef]
- Geslin, B.; Le Féon, V.; Folschweiller, M.; Flacher, F.; Carmignac, D.; Motard, E.; Perret, S.; Dajoz, I. The proportion of impervious surfaces at the landscape scale structures wild bee assemblages in a densely populated region. Ecol. Evol. 2016, 6, 6599–6615. [Google Scholar] [CrossRef]
- Bennett, A.B.; Lovell, S. Landscape and local site variables differentially influence pollinators and pollination services in urban agricultural sites. PLoS ONE 2019, 14, e0212034. [Google Scholar] [CrossRef]
- Threlfall, C.G.; Walker, K.; Williams, N.S.G.; Hahs, A.K.; Mata, L.; Stork, N.; Livesley, S.J. The conservation value of urban green space habitats for Australian native bee communities. Biol. Conserv. 2015, 187, 240–248. [Google Scholar] [CrossRef]
- Lin, B.B.; Philpott, S.M.; Jha, S. The future of urban agriculture and biodiversity-ecosystem services: Challenges and next steps. Basic Appl. Ecol. 2015, 16, 189–201. [Google Scholar] [CrossRef]
- Goddard, M.A.; Dougill, A.J.; Benton, T.G. Scaling up from gardens: Biodiversity conservation in urban environments. Trends Ecol. Evol. 2010, 25, 90–98. [Google Scholar] [CrossRef] [PubMed]
- Potts, S.G.; Vulliamy, B.; Dafni, A.; Ne’eman, G.; Willmer, P. Linking bees and flowers: How do floral communities structure pollinator communities? Ecology 2003, 84, 2628–2642. [Google Scholar] [CrossRef] [Green Version]
- Narango, D.L.; Tallamy, D.W.; Marra, P.P. Native plants improve breeding and foraging habitat for an insectivorous bird. Biol. Conserv. 2017, 213, 42–50. [Google Scholar] [CrossRef]
- Burks, J.M.; Philpott, S.M. Local and landscape drivers of parasitoid abundance, richness, and composition in urban gardens. Environ. Entomol. 2017, 46, 201–209. [Google Scholar] [CrossRef] [Green Version]
- Helden, A.J.; Leather, S.R. Biodiversity on urban roundabouts-Hemiptera, management and the species-area relationship. Basic Appl. Ecol. 2004, 5, 367–377. [Google Scholar] [CrossRef]
- Parris, K.M. Urban amphibian assemblages as metacommunities. J. Anim. Ecol. 2006, 75, 757–764. [Google Scholar] [CrossRef] [PubMed]
- Uno, S.; Cotton, J.; Philpott, S.M. Diversity, abundance, and species composition of ants in urban green spaces. Urban Ecosyst. 2010, 13, 425–441. [Google Scholar] [CrossRef]
Figure 1.
Conceptual model of local- and landscape-scale features measured for each habitat type (gardens and nurseries) as potentially important for affecting wild bee abundance, species richness and community composition in gardens and nurseries.
Figure 1.
Conceptual model of local- and landscape-scale features measured for each habitat type (gardens and nurseries) as potentially important for affecting wild bee abundance, species richness and community composition in gardens and nurseries.

Figure 2.
Wild bee abundance (a) and richness (b–d) in relation to local habitat variables (floral richness and percent native richness) in community gardens. Each point (circle) represents one sampling event at a site. Lines represent best fit models determined from generalized linear mixed effect models (GLMMs); grey shaded areas represent 95% confidence intervals. Asterisks indicate significant relationships in the GLMMs (Table 2; *** p < 0.001, ** p < 0.01,* p < 0.05).

Figure 3.
Wild bee abundance (a,b) and richness (c,d) in relation to local habitat variables (floral richness and percent native richness) in nurseries. Each point (triangles) represents one sampling event. Lines represent best fit models determined from GLMMs; grey shaded areas represent 95% confidence intervals. Asterisks indicate significant relationships in the GLMMs (Table 2; *** p < 0.001, ** p < 0.01,* p < 0.05); NS indicates non-significant relationship in the GLMMs.

Figure 4.
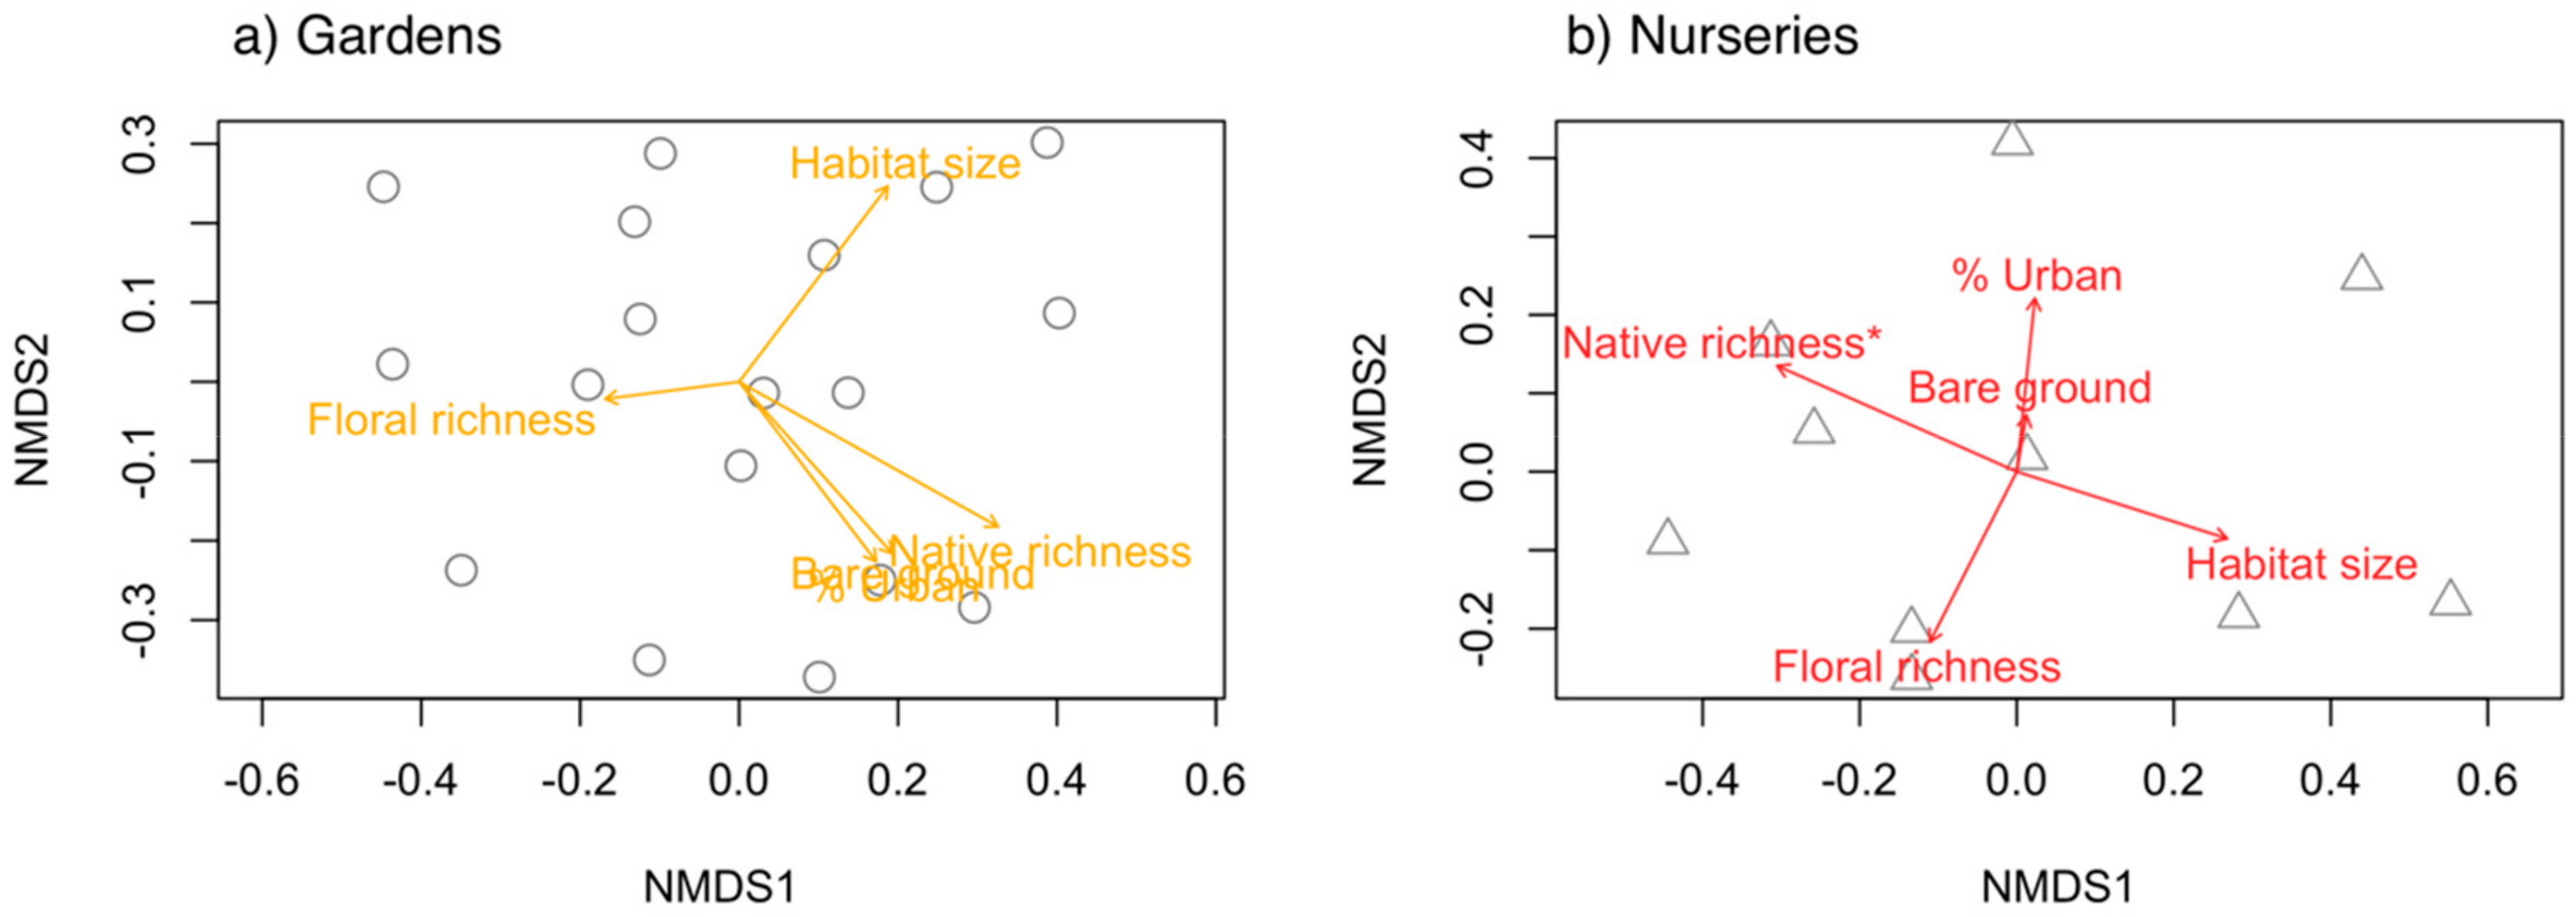
Non-metric multidimensional scaling (NMDS) plots showing wild bee community composition in relation to local and landscape features for (a) gardens and (b) nurseries. Each point on the plot (circles, gardens; triangles, nurseries) represents the composition of species found in a study site. Singleton species were removed from this analysis. Wild bee composition was related to the percent native perennial richness in nurseries, but no features were related to community composition in gardens. An asterisk (*) indicates the one significant (p < 0.05) variable in (b).
Figure 4.
Non-metric multidimensional scaling (NMDS) plots showing wild bee community composition in relation to local and landscape features for (a) gardens and (b) nurseries. Each point on the plot (circles, gardens; triangles, nurseries) represents the composition of species found in a study site. Singleton species were removed from this analysis. Wild bee composition was related to the percent native perennial richness in nurseries, but no features were related to community composition in gardens. An asterisk (*) indicates the one significant (p < 0.05) variable in (b).

Table 1.
Summary statistics for local and landscape features of gardens (a) and nurseries (b) used as predictor variables in statistical models to examine wild bee abundance, richness, and community composition. Values were calculated for each sampling event (SD = standard deviation). Percent bare ground, floral richness, and percent native richness were measured at the scale of sampling plots within study sites, whereas habitat size and percent urban land within 2 km buffers around a site were measured at the scale of the study site. The 0.0 for the minimum floral richness and native richness indicates that the plants were not flowering at the time of sampling.
| Habitat Type | Predictor Variable | Minimum | Maximum | Average | SD |
|---|---|---|---|---|---|
| (a) Gardens | % Bare ground | 3.5 | 99.8 | 43.5 | 24.9 |
| Floral richness | 0.0 | 16.0 | 3.5 | 3.2 | |
| % Native richness | 0.0 | 100.0 | 24.2 | 23.2 | |
| Habitat size (acres) | 0.1 | 3.8 | 1.1 | 0.9 | |
| % Urban land (2 km) | 7.8 | 94.2 | 58.4 | 29.1 | |
| (b) Nurseries | % Bare ground | 9.4 | 100.0 | 47.1 | 25.5 |
| Floral richness | 2.0 | 20.0 | 6.7 | 4.4 | |
| % Native richness | 0.0 | 100.0 | 44.2 | 31.6 | |
| Habitat size (acres) | 7.2 | 74.1 | 17.3 | 19.2 | |
| % Urban land (2 km) | 0.3 | 73.1 | 26.8 | 23.9 |
Table 2.
Optimal generalized linear mixed effect models that best predicted species abundance and richness in (a) gardens and (b) nurseries. Predictor variables were local and landscape variables measured in each habitat type. Bolded variables were statistically significant (p < 0.05). Predictor variables not shown (e.g., % urban in (b)) indicate that variables were not included in the best model. (Coeff = coefficient; SE = standard error; SEAdj = adjusted standard error; z = z value; P = p-value; AICc = Akaike information criterion).
| Habitat Type | Response | Predictor Variable | Coeff. | SE | SEAdj | z | P | AICc |
|---|---|---|---|---|---|---|---|---|
| (a) Gardens | Abundance | (Intercept) | 2.32 | 0.23 | 0.23 | 10.13 | <0.001 | 668.10 |
| Habitat size | 0.27 | 0.16 | 0.16 | 1.73 | 0.08 | |||
| % Bare ground | −0.31 | 0.05 | 0.05 | 5.91 | <0.001 | |||
| Richness | (Intercept) | 1.53 | 0.11 | 0.11 | 13.63 | <0.001 | 381.44 | |
| Floral richness | 0.15 | 0.07 | 0.07 | 2.09 | 0.04 | |||
| Habitat size | 0.23 | 0.10 | 0.10 | 2.34 | 0.02 | |||
| % Urban land (2 km) | 0.27 | 0.11 | 0.11 | 2.58 | 0.01 | |||
| % Bare ground | −0.07 | 0.07 | 0.07 | 0.96 | 0.34 | |||
| (b) Nurseries | Abundance | (Intercept) | 1.44 | 0.25 | 0.26 | 5.58 | <0.001 | 225.71 |
| Floral richness | 0.31 | 0.12 | 0.11 | 2.75 | 0.006 | |||
| % Native richness | 0.31 | 0.13 | 0.14 | 2.27 | 0.02 | |||
| % Urban land (2 km) | 0.09 | 0.12 | 0.13 | 0.74 | 0.46 | |||
| Richness | (Intercept) | 1.20 | 0.24 | 0.25 | 4.88 | <0.001 | 202.39 | |
| Floral richness | 0.26 | 0.12 | 0.12 | 2.34 | 0.02 | |||
| % Native richness | 0.23 | 0.11 | 0.12 | 1.95 | 0.051 |
© 2019 by the authors. Licensee MDPI, Basel, Switzerland. This article is an open access article distributed under the terms and conditions of the Creative Commons Attribution (CC BY) license (http://creativecommons.org/licenses/by/4.0/).
Share and Cite
MDPI and ACS Style
Egerer, M.; Cecala, J.M.; Cohen, H. Wild Bee Conservation within Urban Gardens and Nurseries: Effects of Local and Landscape Management. Sustainability 2020, 12, 293. https://0-doi-org.brum.beds.ac.uk/10.3390/su12010293
AMA Style
Egerer M, Cecala JM, Cohen H. Wild Bee Conservation within Urban Gardens and Nurseries: Effects of Local and Landscape Management. Sustainability. 2020; 12(1):293. https://0-doi-org.brum.beds.ac.uk/10.3390/su12010293
Chicago/Turabian StyleEgerer, Monika, Jacob M. Cecala, and Hamutahl Cohen. 2020. "Wild Bee Conservation within Urban Gardens and Nurseries: Effects of Local and Landscape Management" Sustainability 12, no. 1: 293. https://0-doi-org.brum.beds.ac.uk/10.3390/su12010293
Note that from the first issue of 2016, this journal uses article numbers instead of page numbers. See further details here.