The Use of Superabsorbent Polymers in High Performance Concrete to Mitigate Autogenous Shrinkage in a Large-Scale Demonstrator

 ,
,  , ,
, ,
Abstract
:1. Introduction
2. Materials and Methods
2.1. The Demonstrator
2.1.1. Slabs

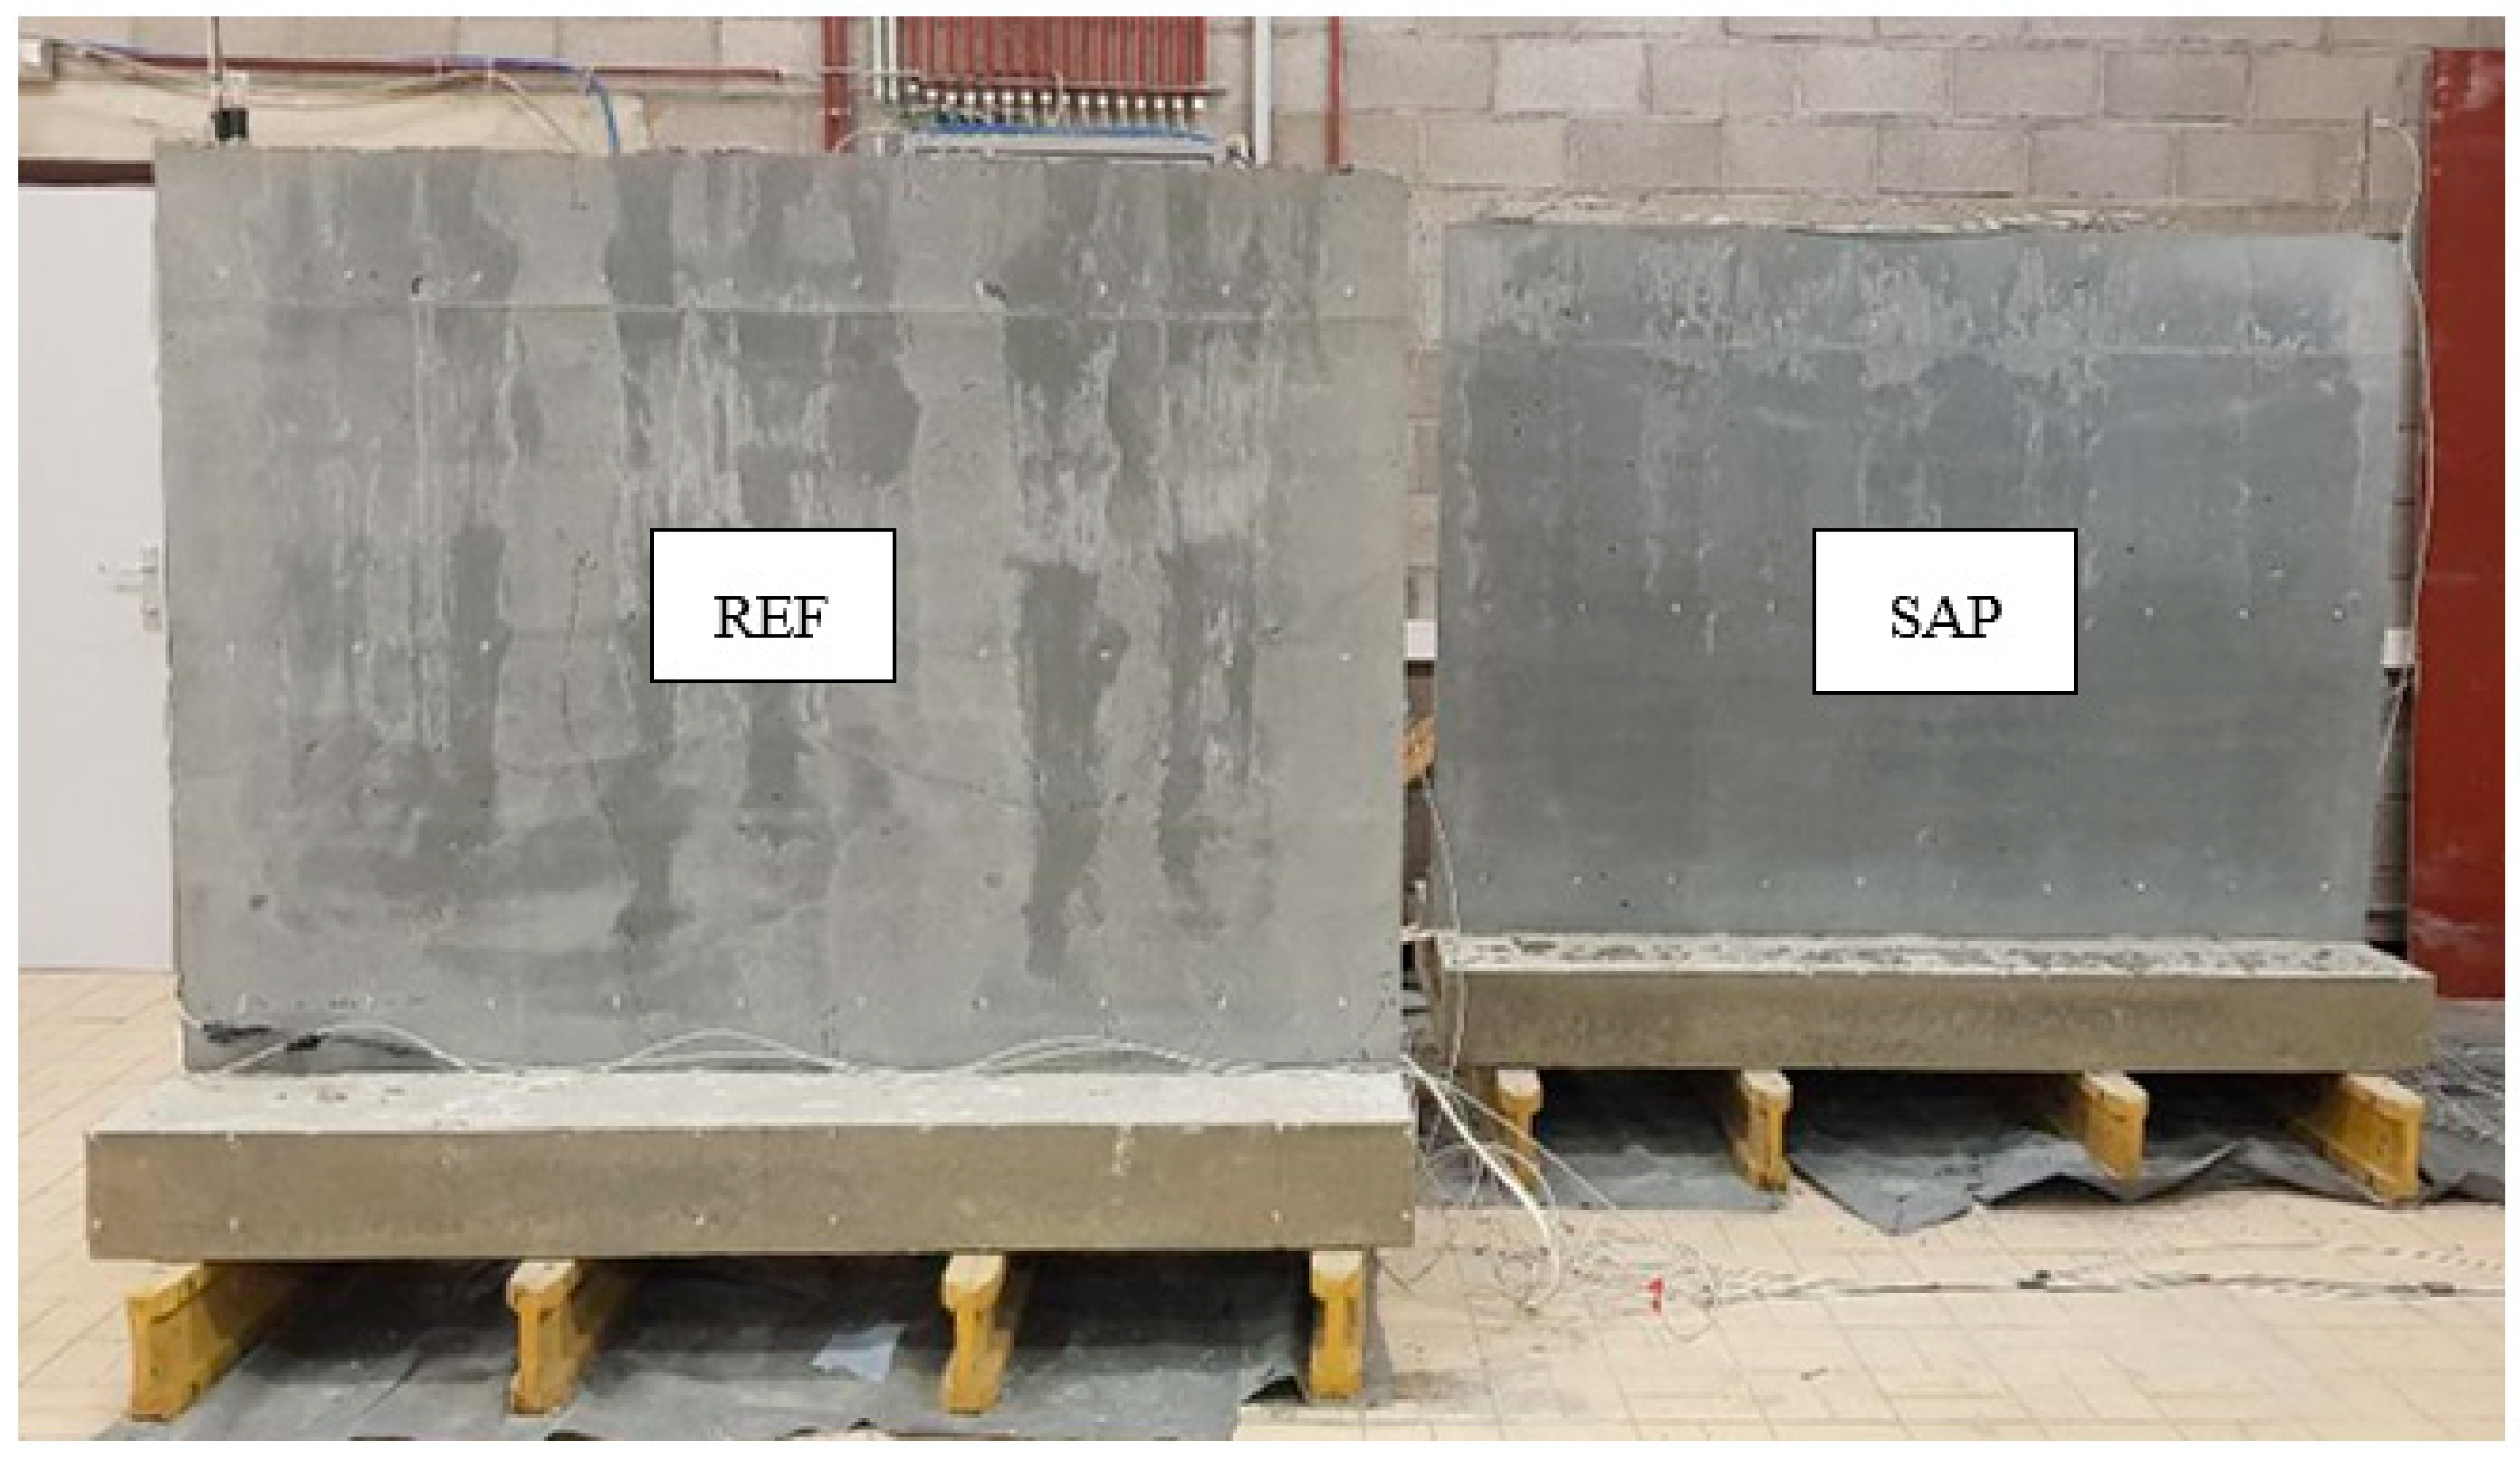
2.1.2. Walls

2.2. Methods
2.2.1. Hardened Concrete Properties of the Slabs
2.2.2. Fresh Concrete Properties of the Walls
2.2.3. Hardened Concrete Properties of the Walls
2.2.4. Autogenous Shrinkage with Corrugated Tubes
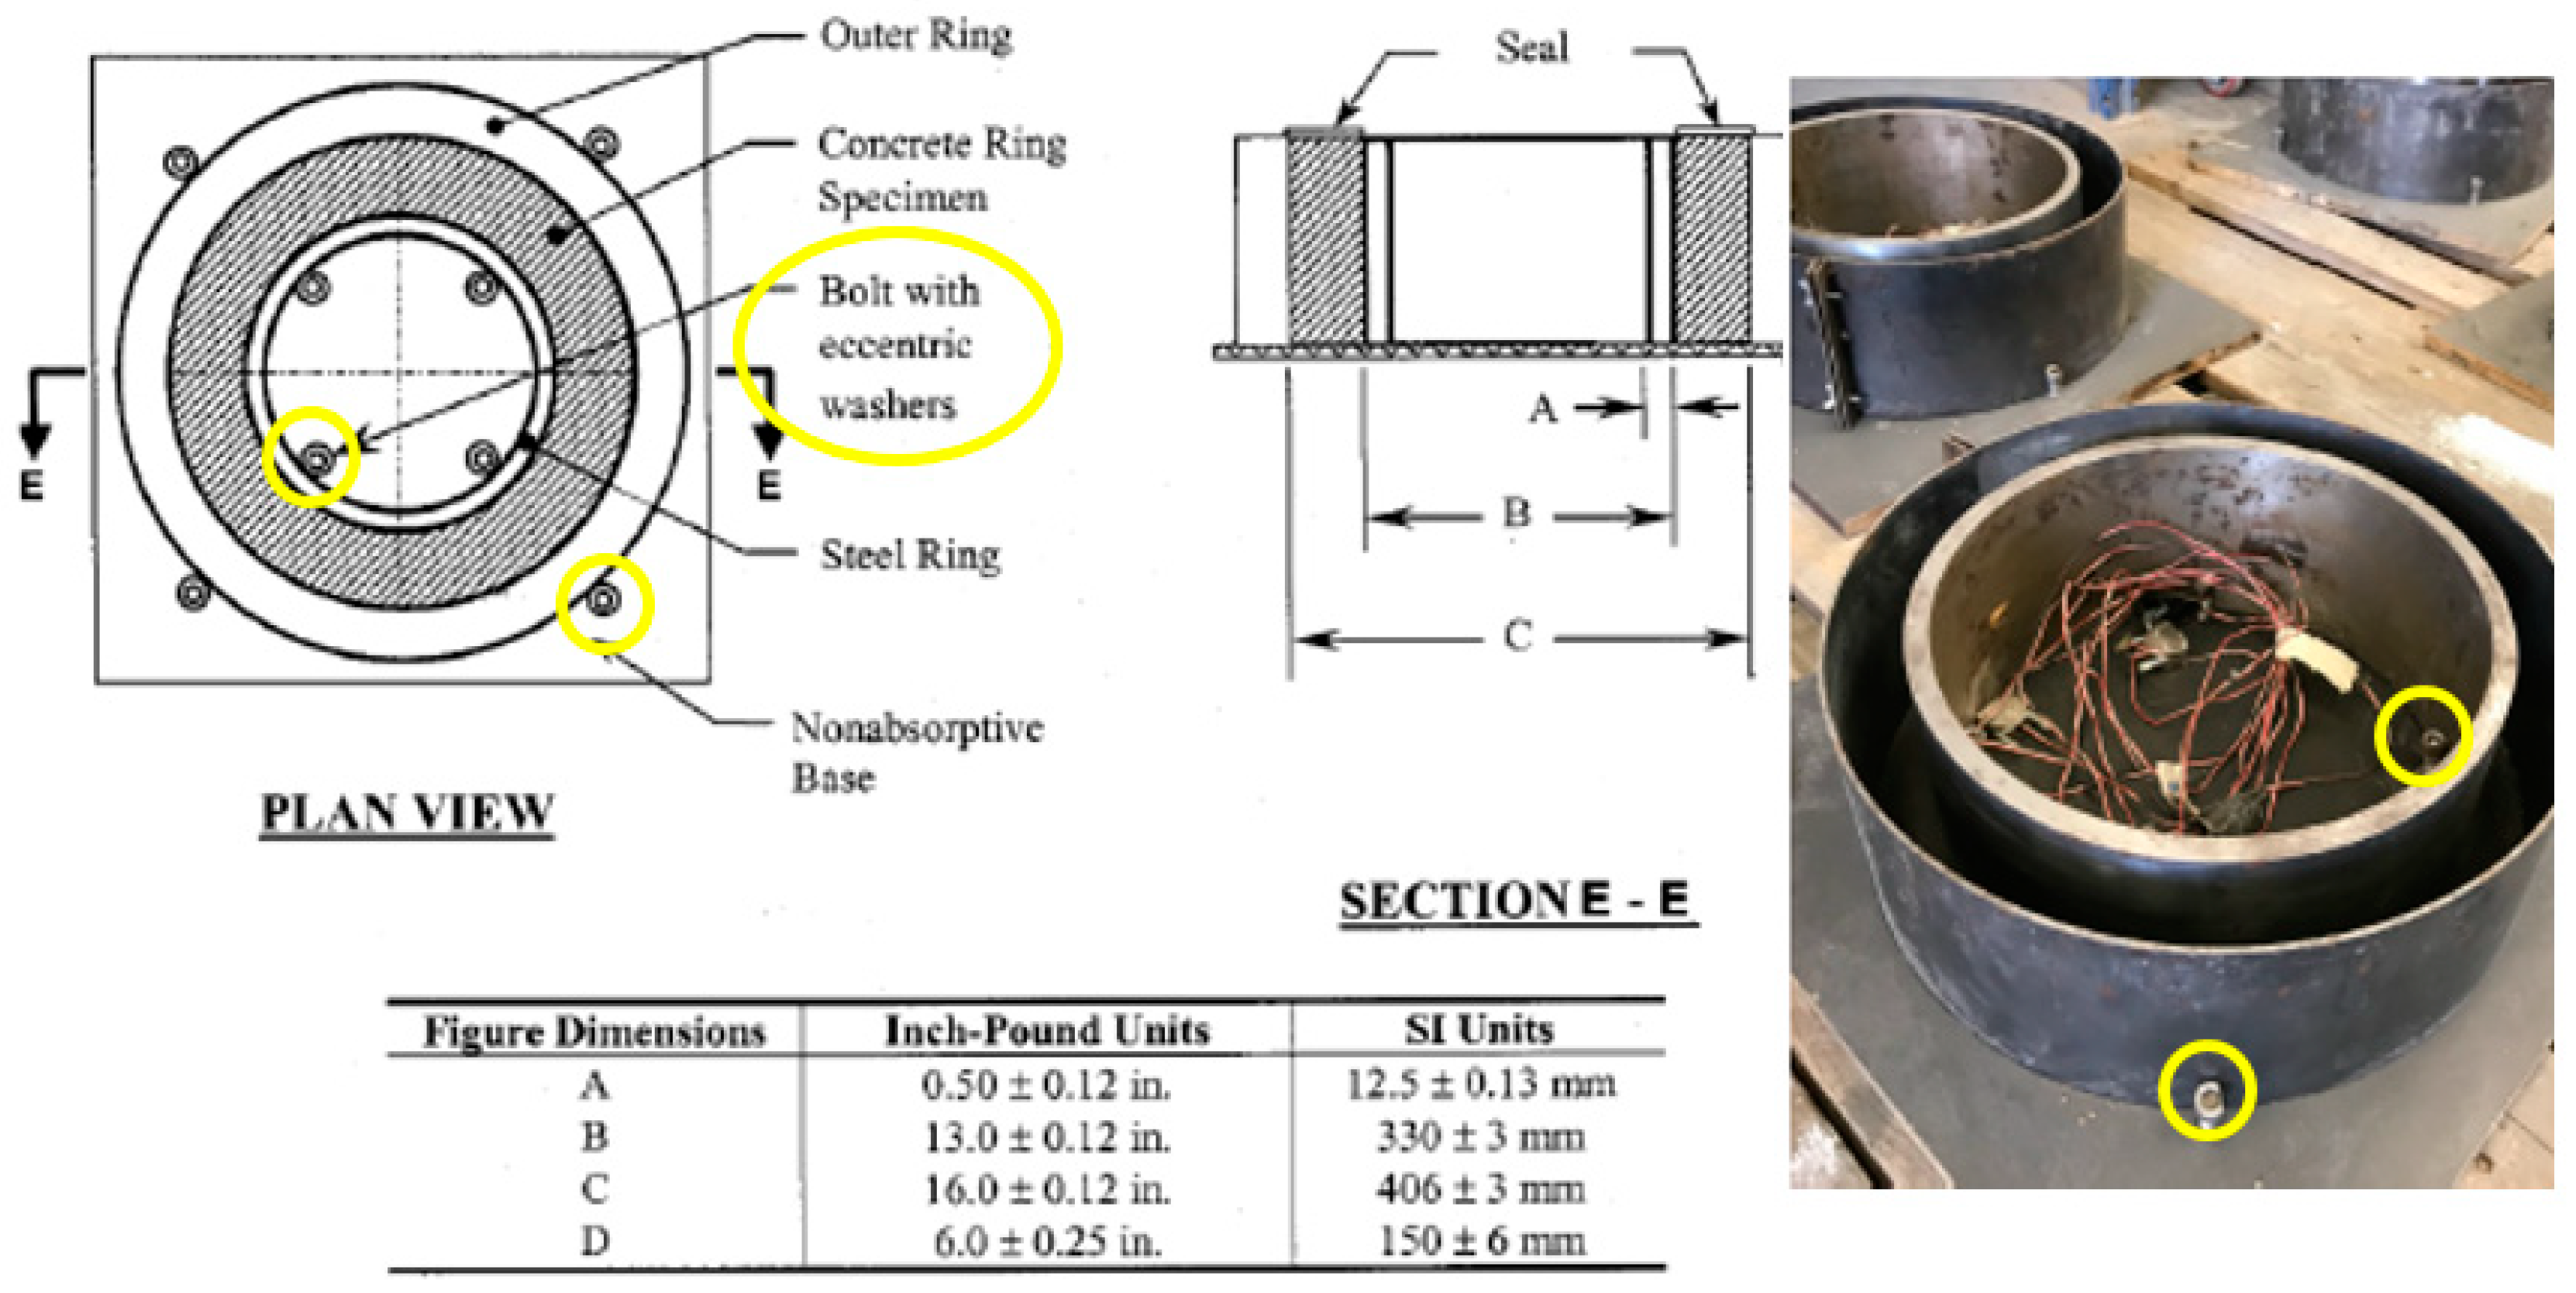
2.2.5. Restrained Shrinkage Measurements with Ring Tests
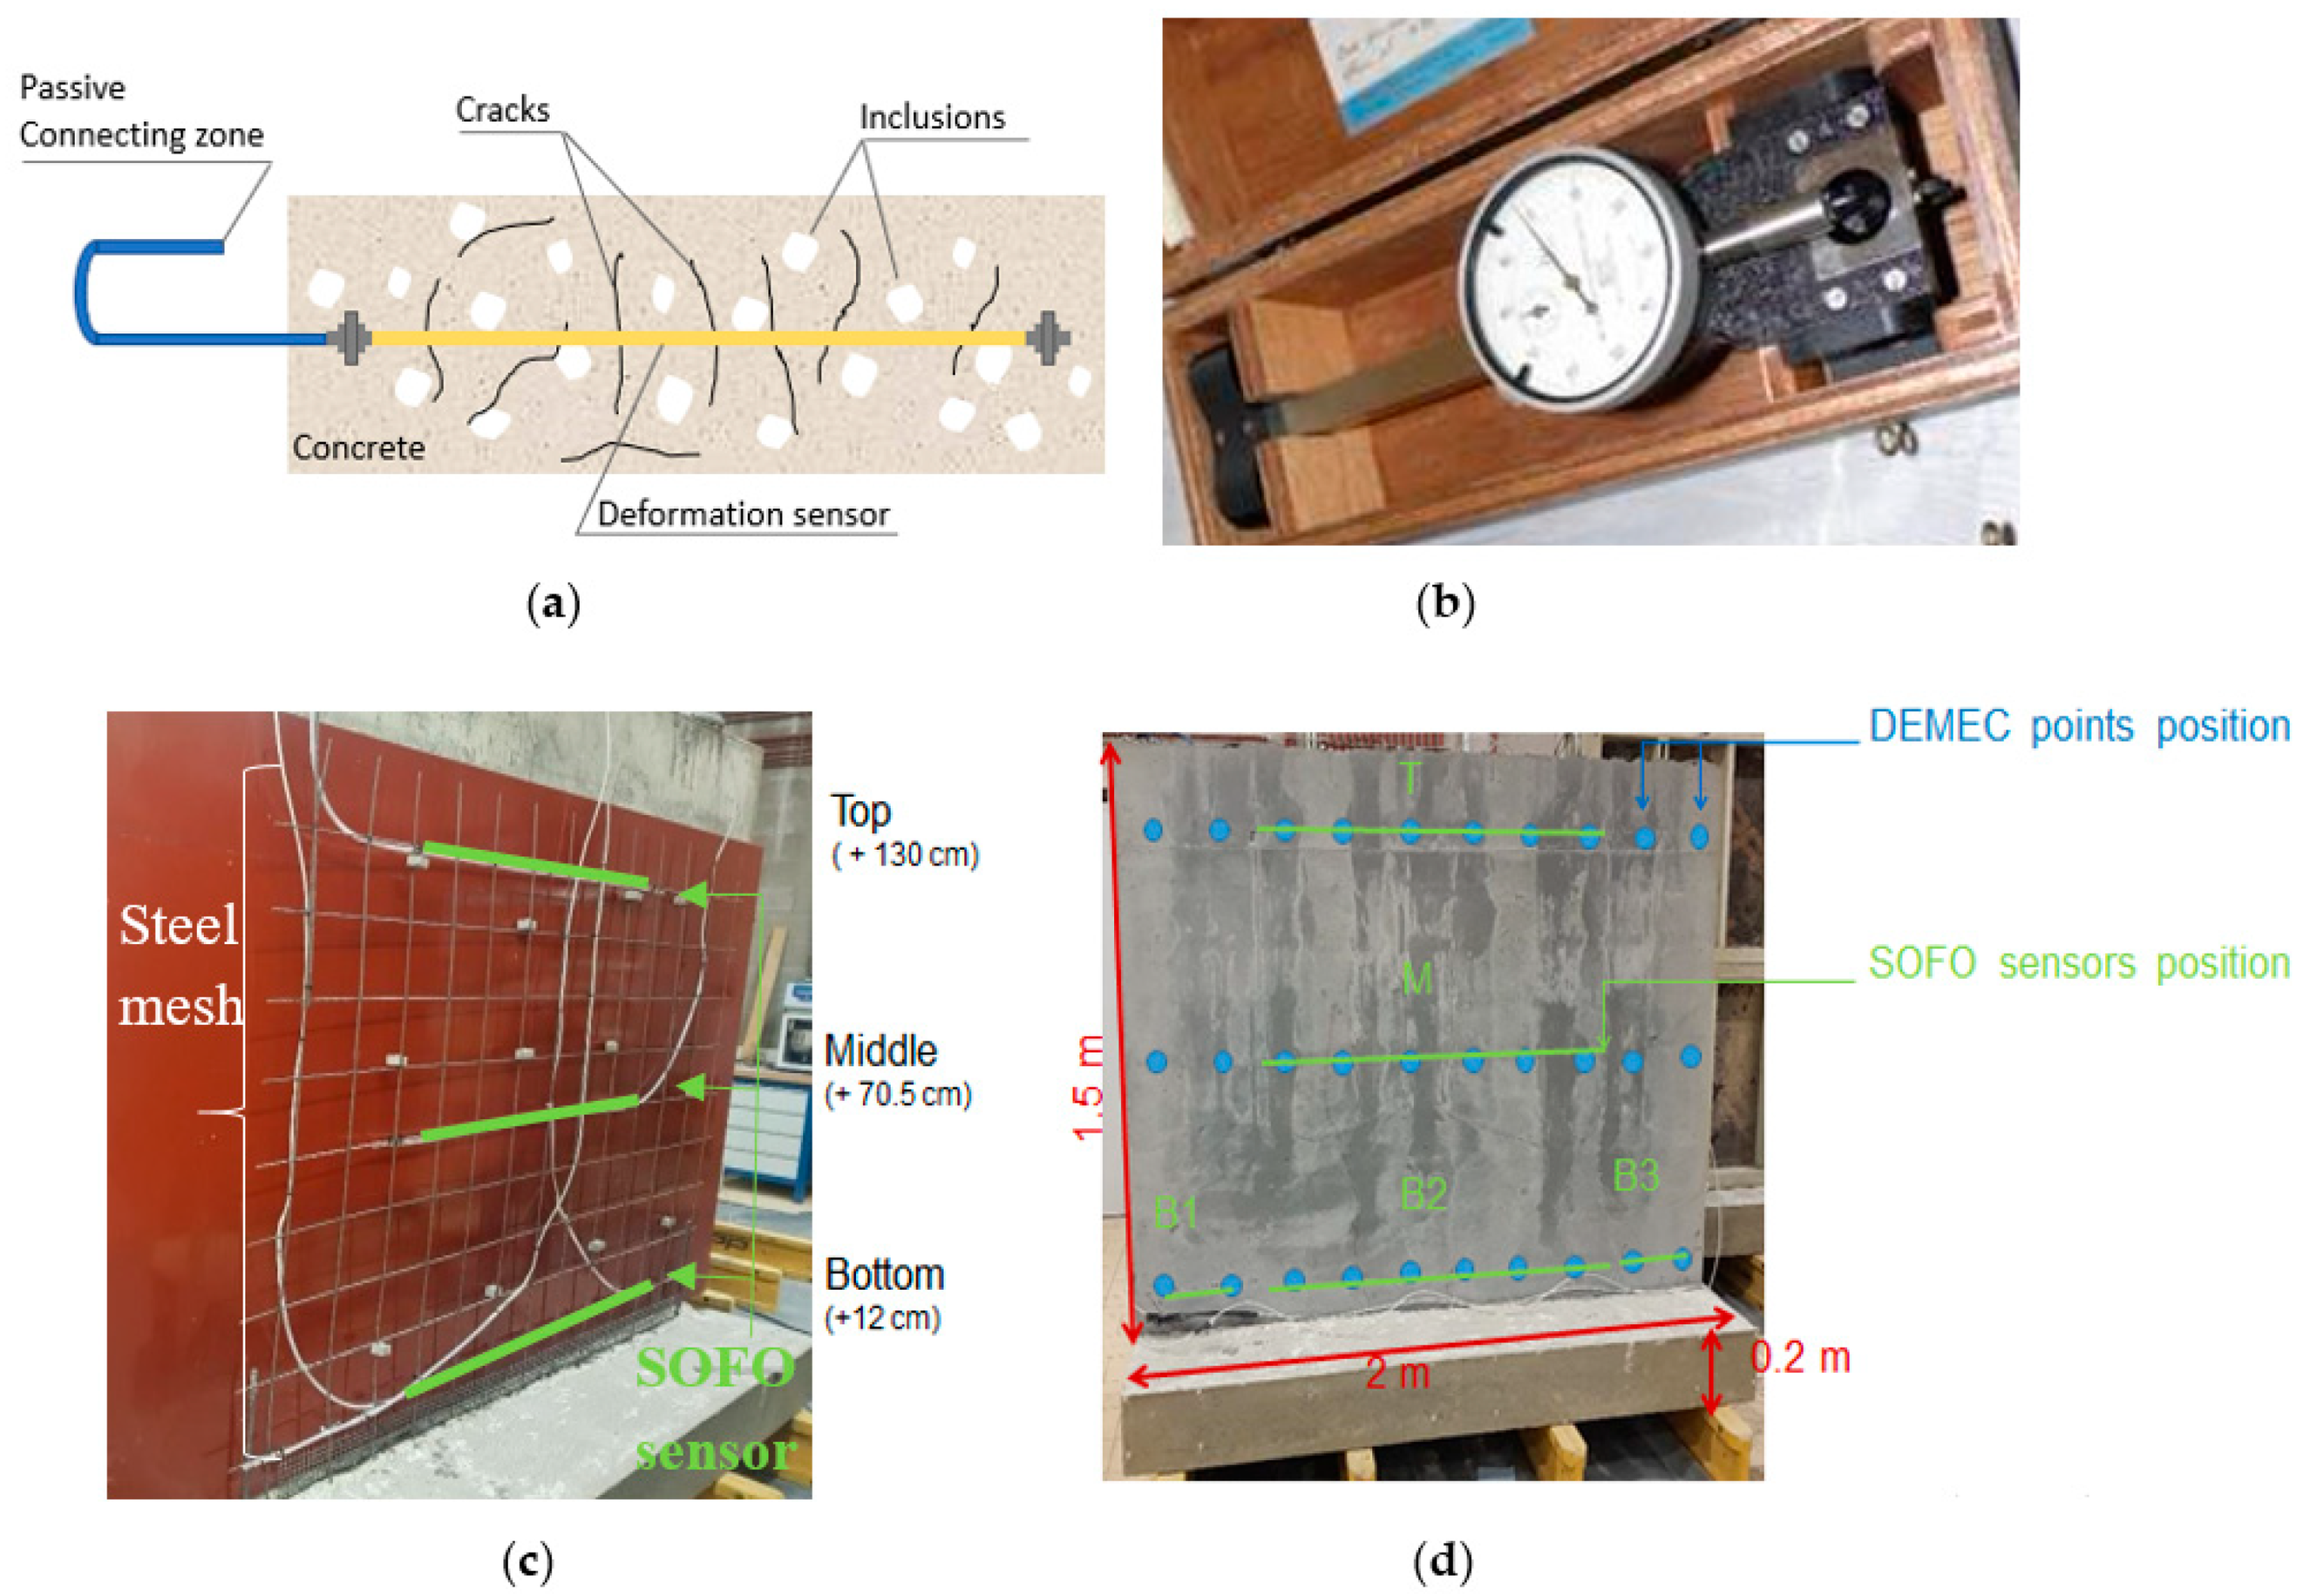
2.2.6. Autogenous Shrinkage Measured with Fiber Optic Sensors and Strain Gauges
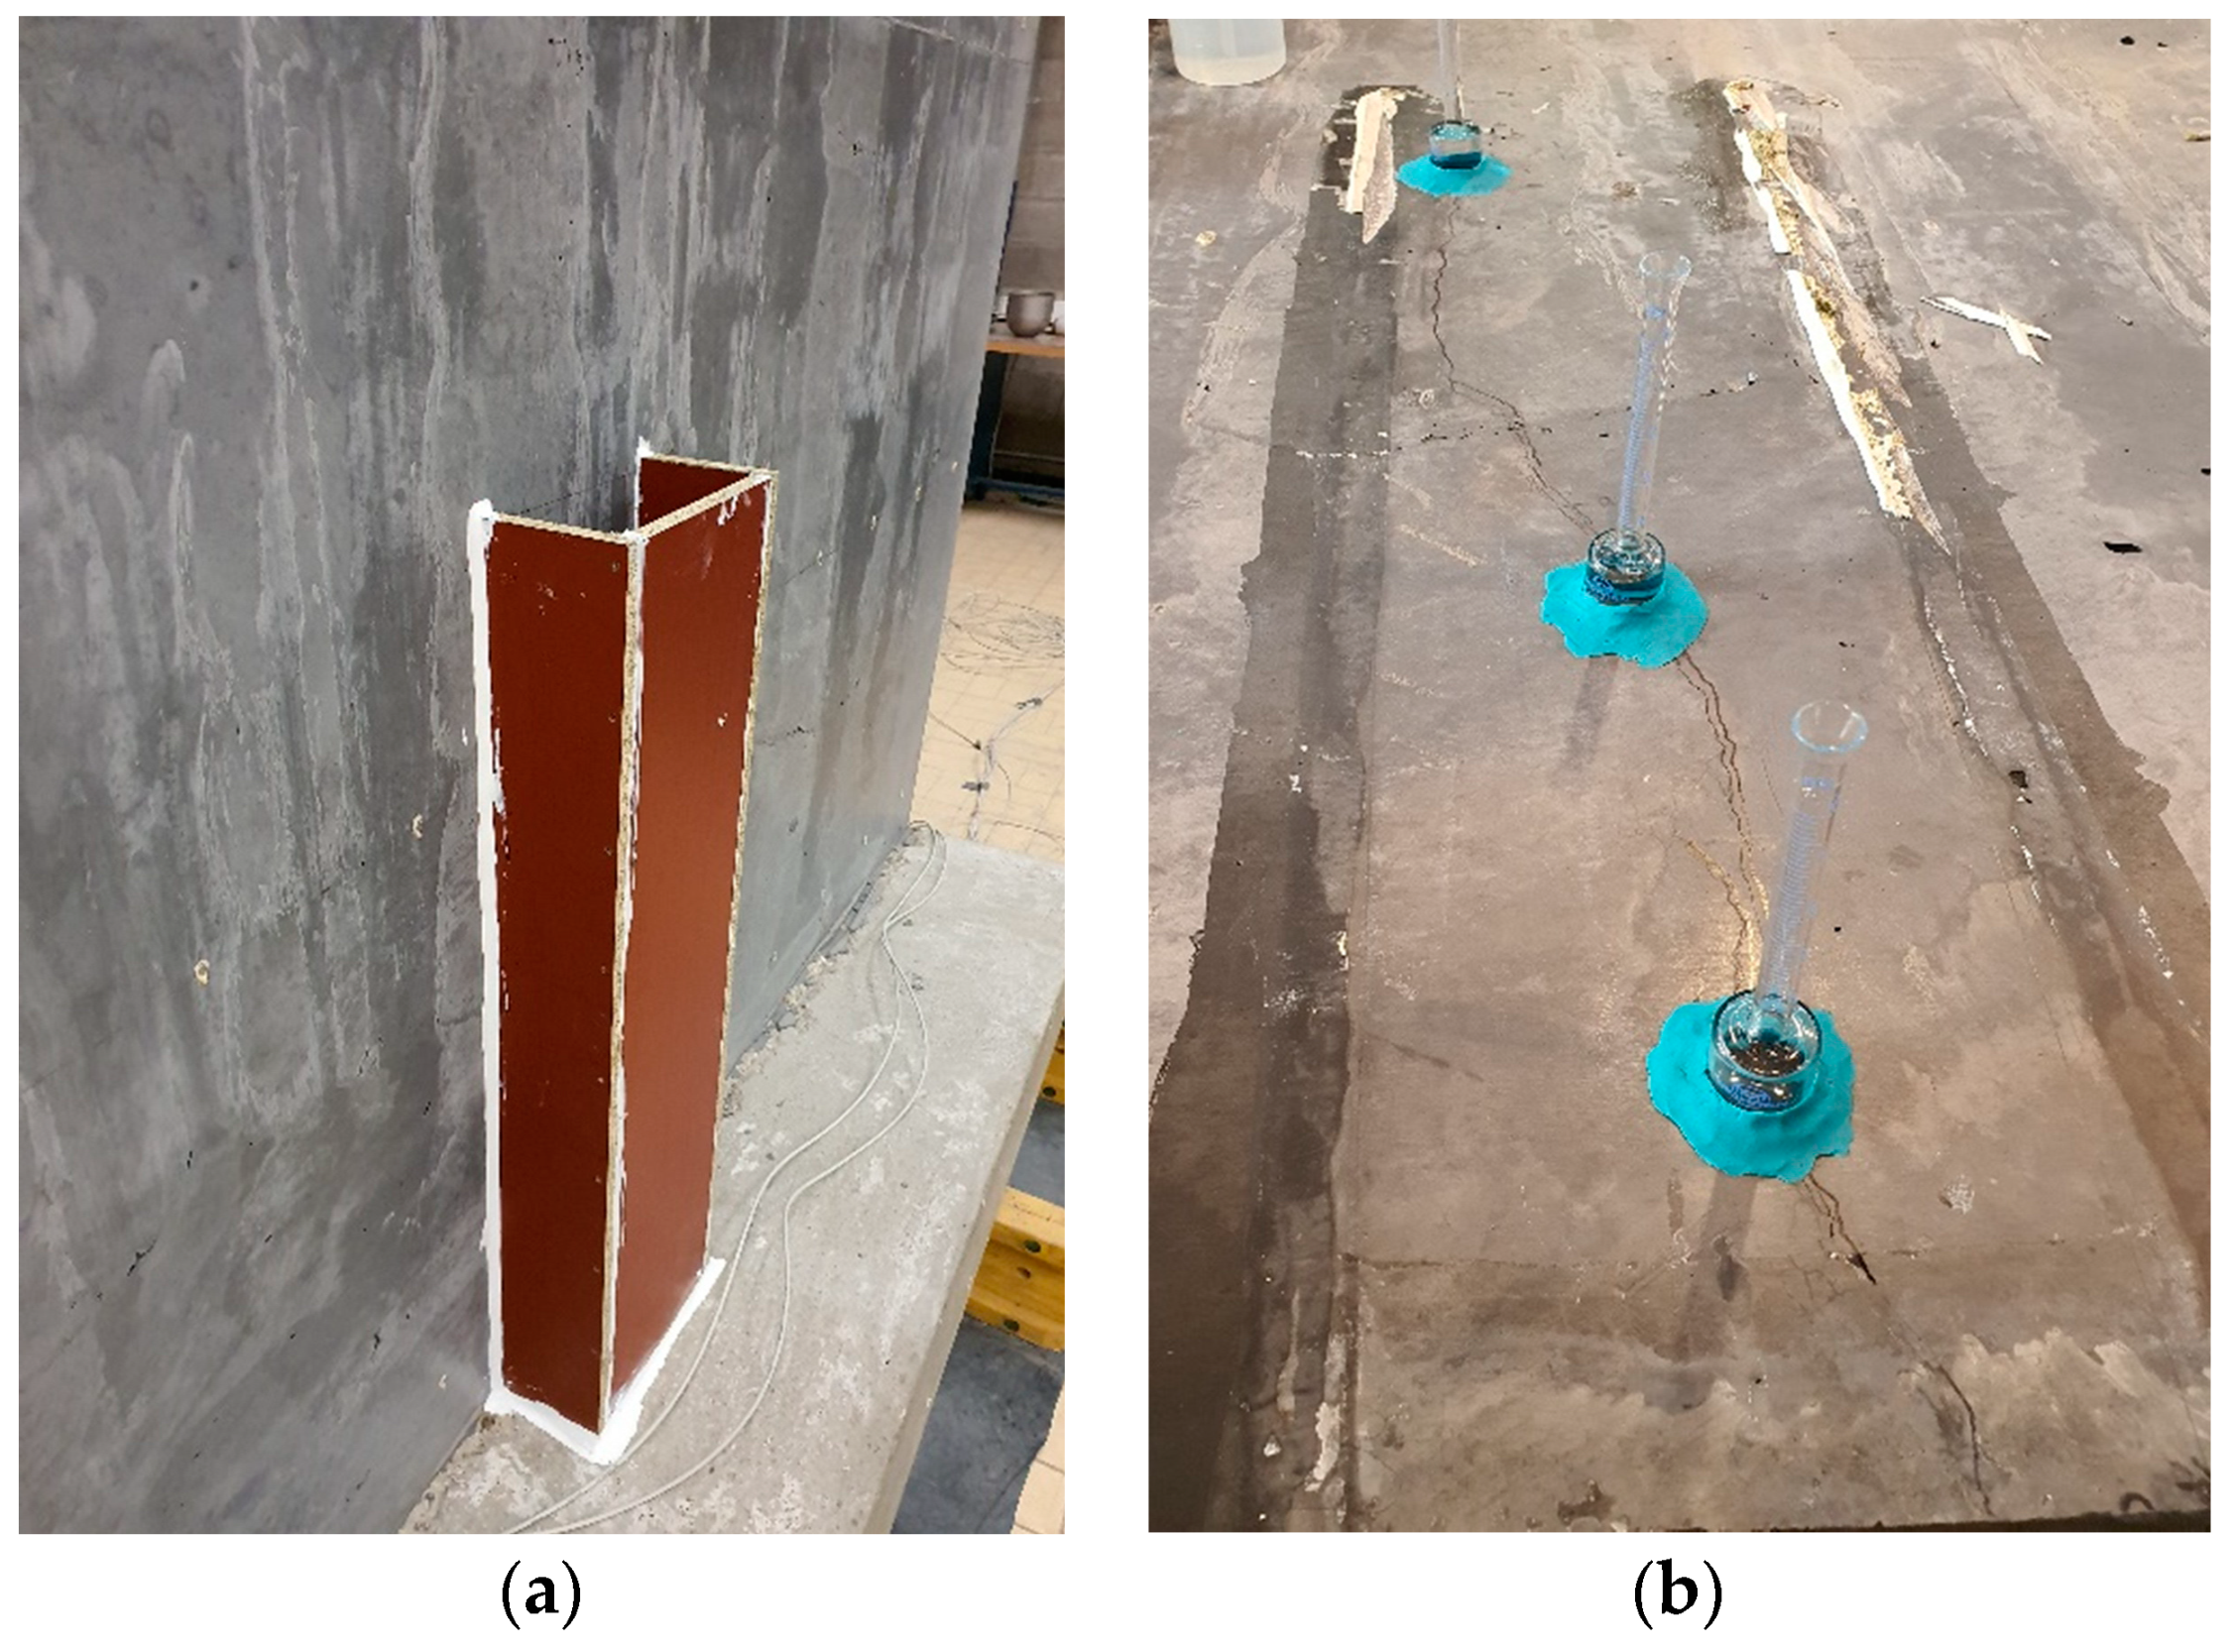
2.2.7. Water Flow
3. Results
3.1. Hardened Properties of the Concrete Slabs
3.2. Fresh and Hardened Properties of the Concrete Walls
3.3. Crack Formation in the Walls
3.4. Autogenous Shrinkage Measured with Corrugated Tubes
3.5. Restrained Shrinkage: Ring Tests
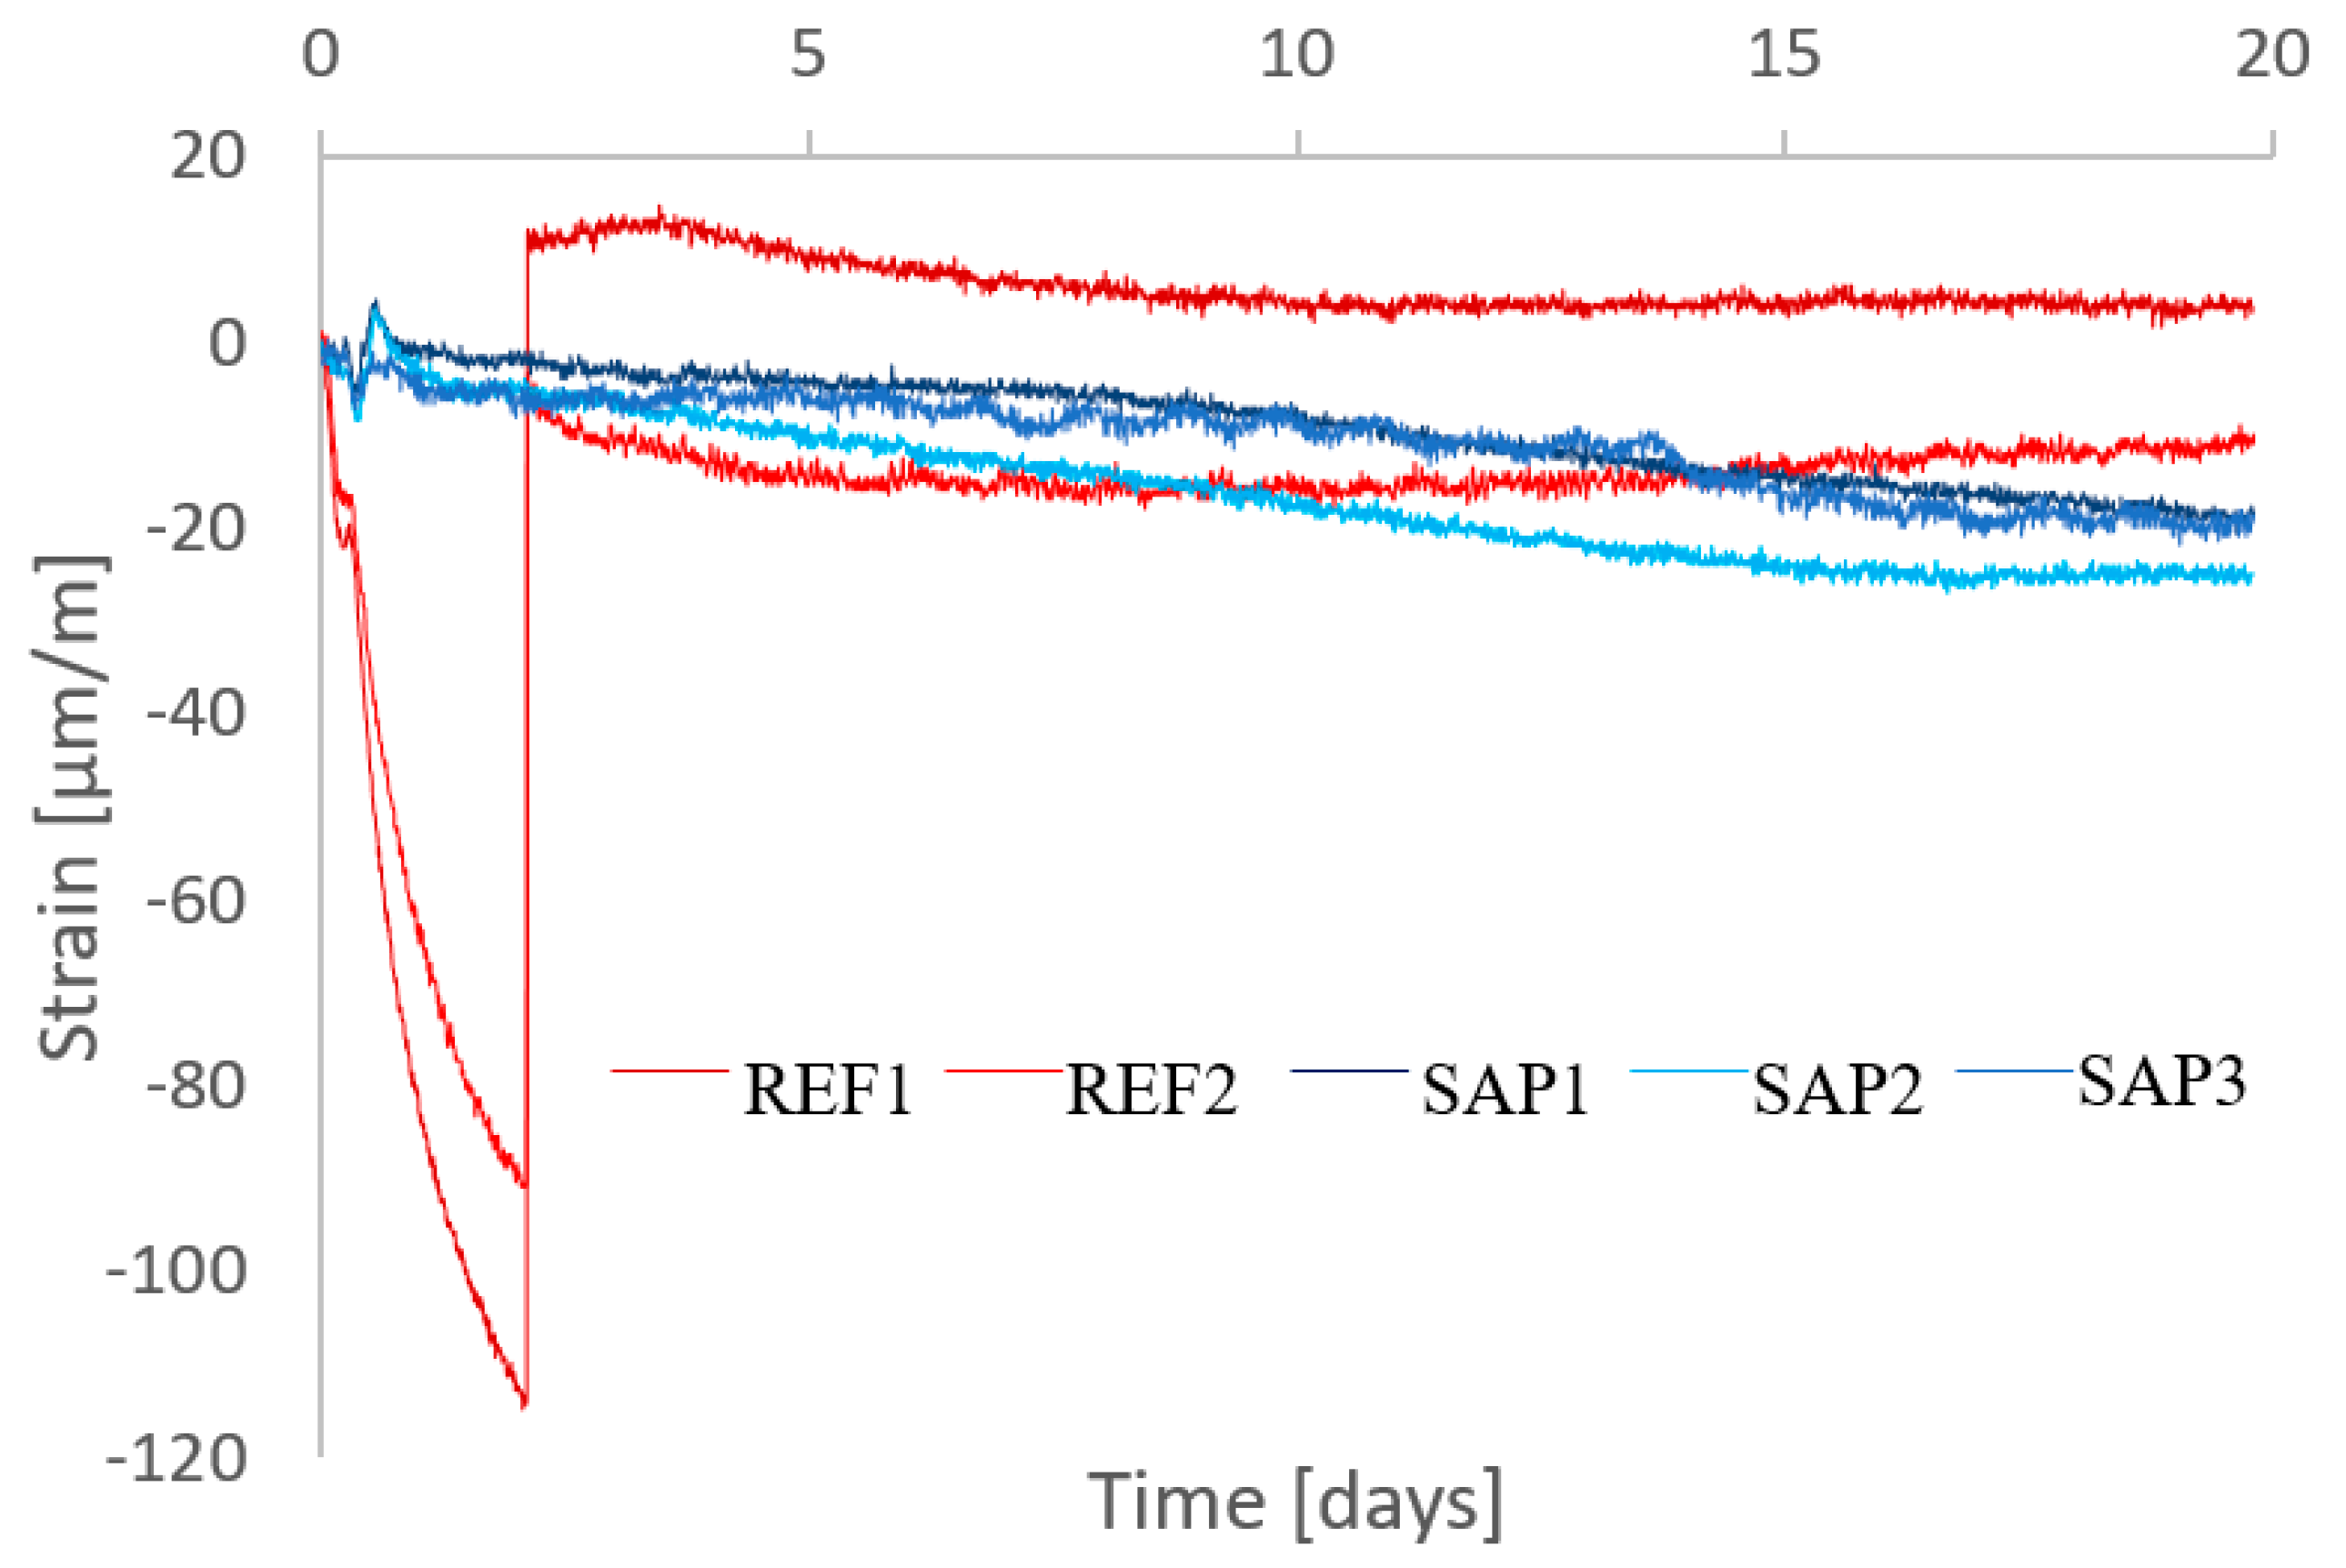
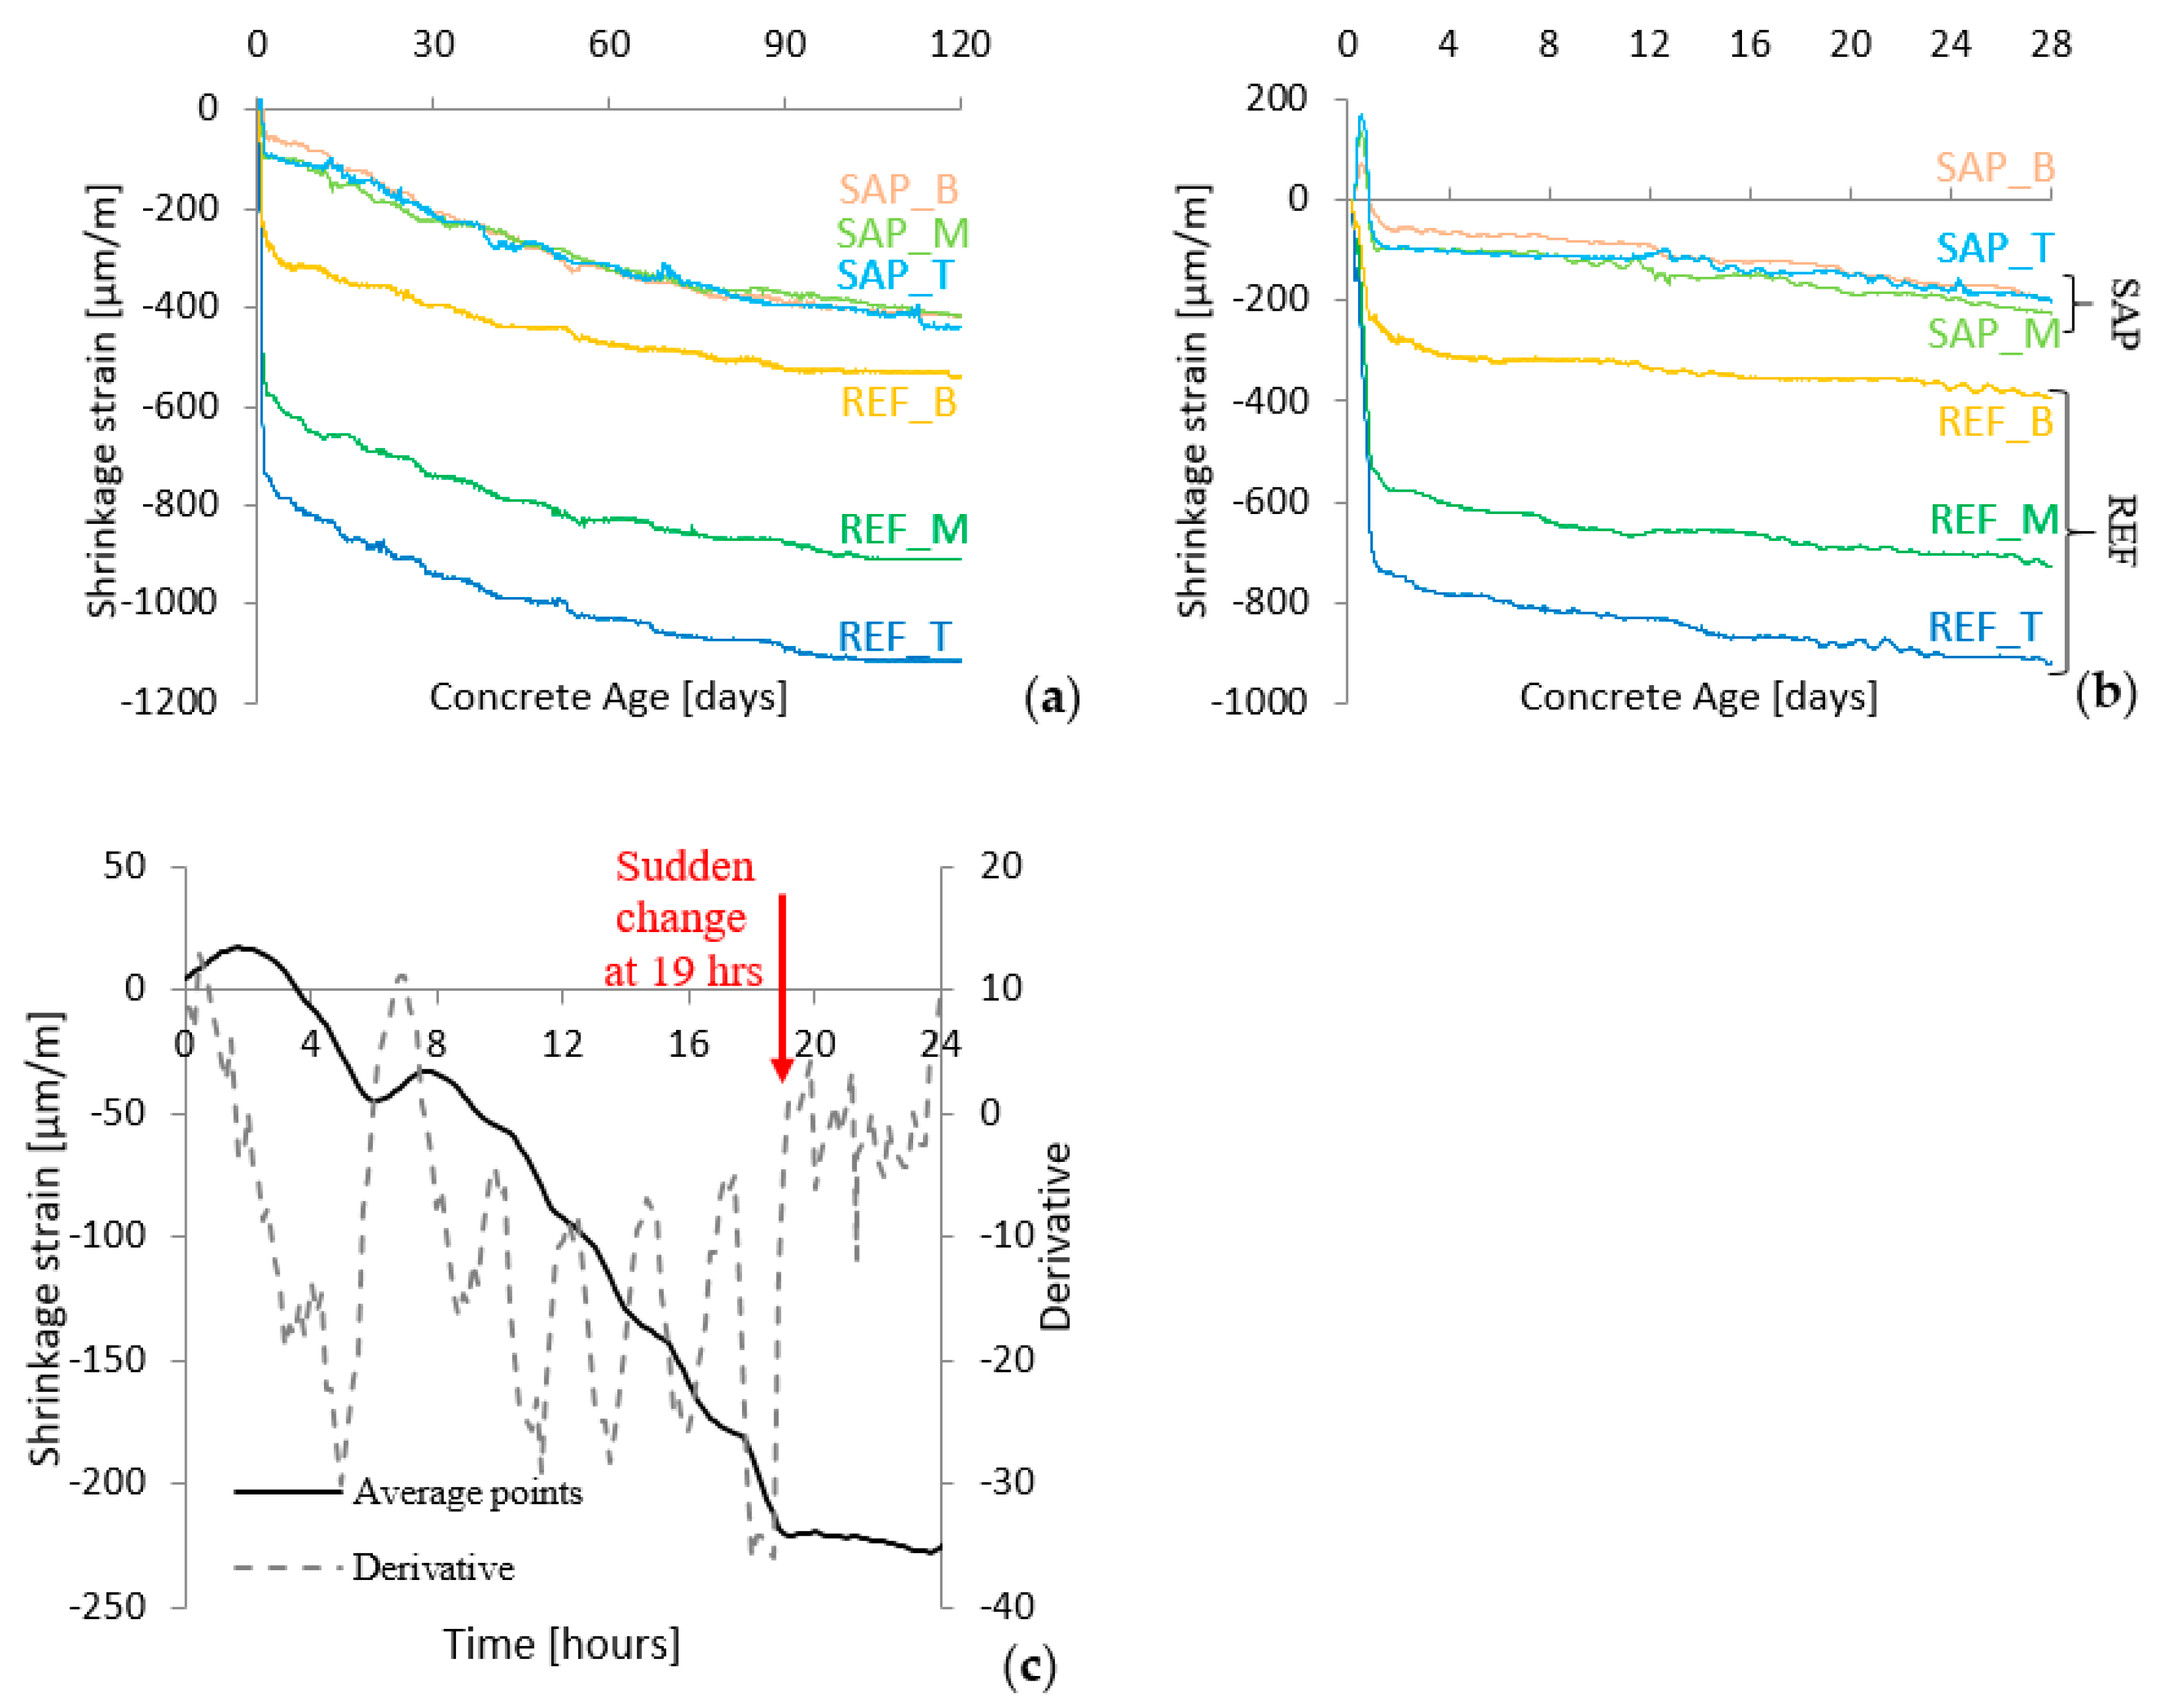
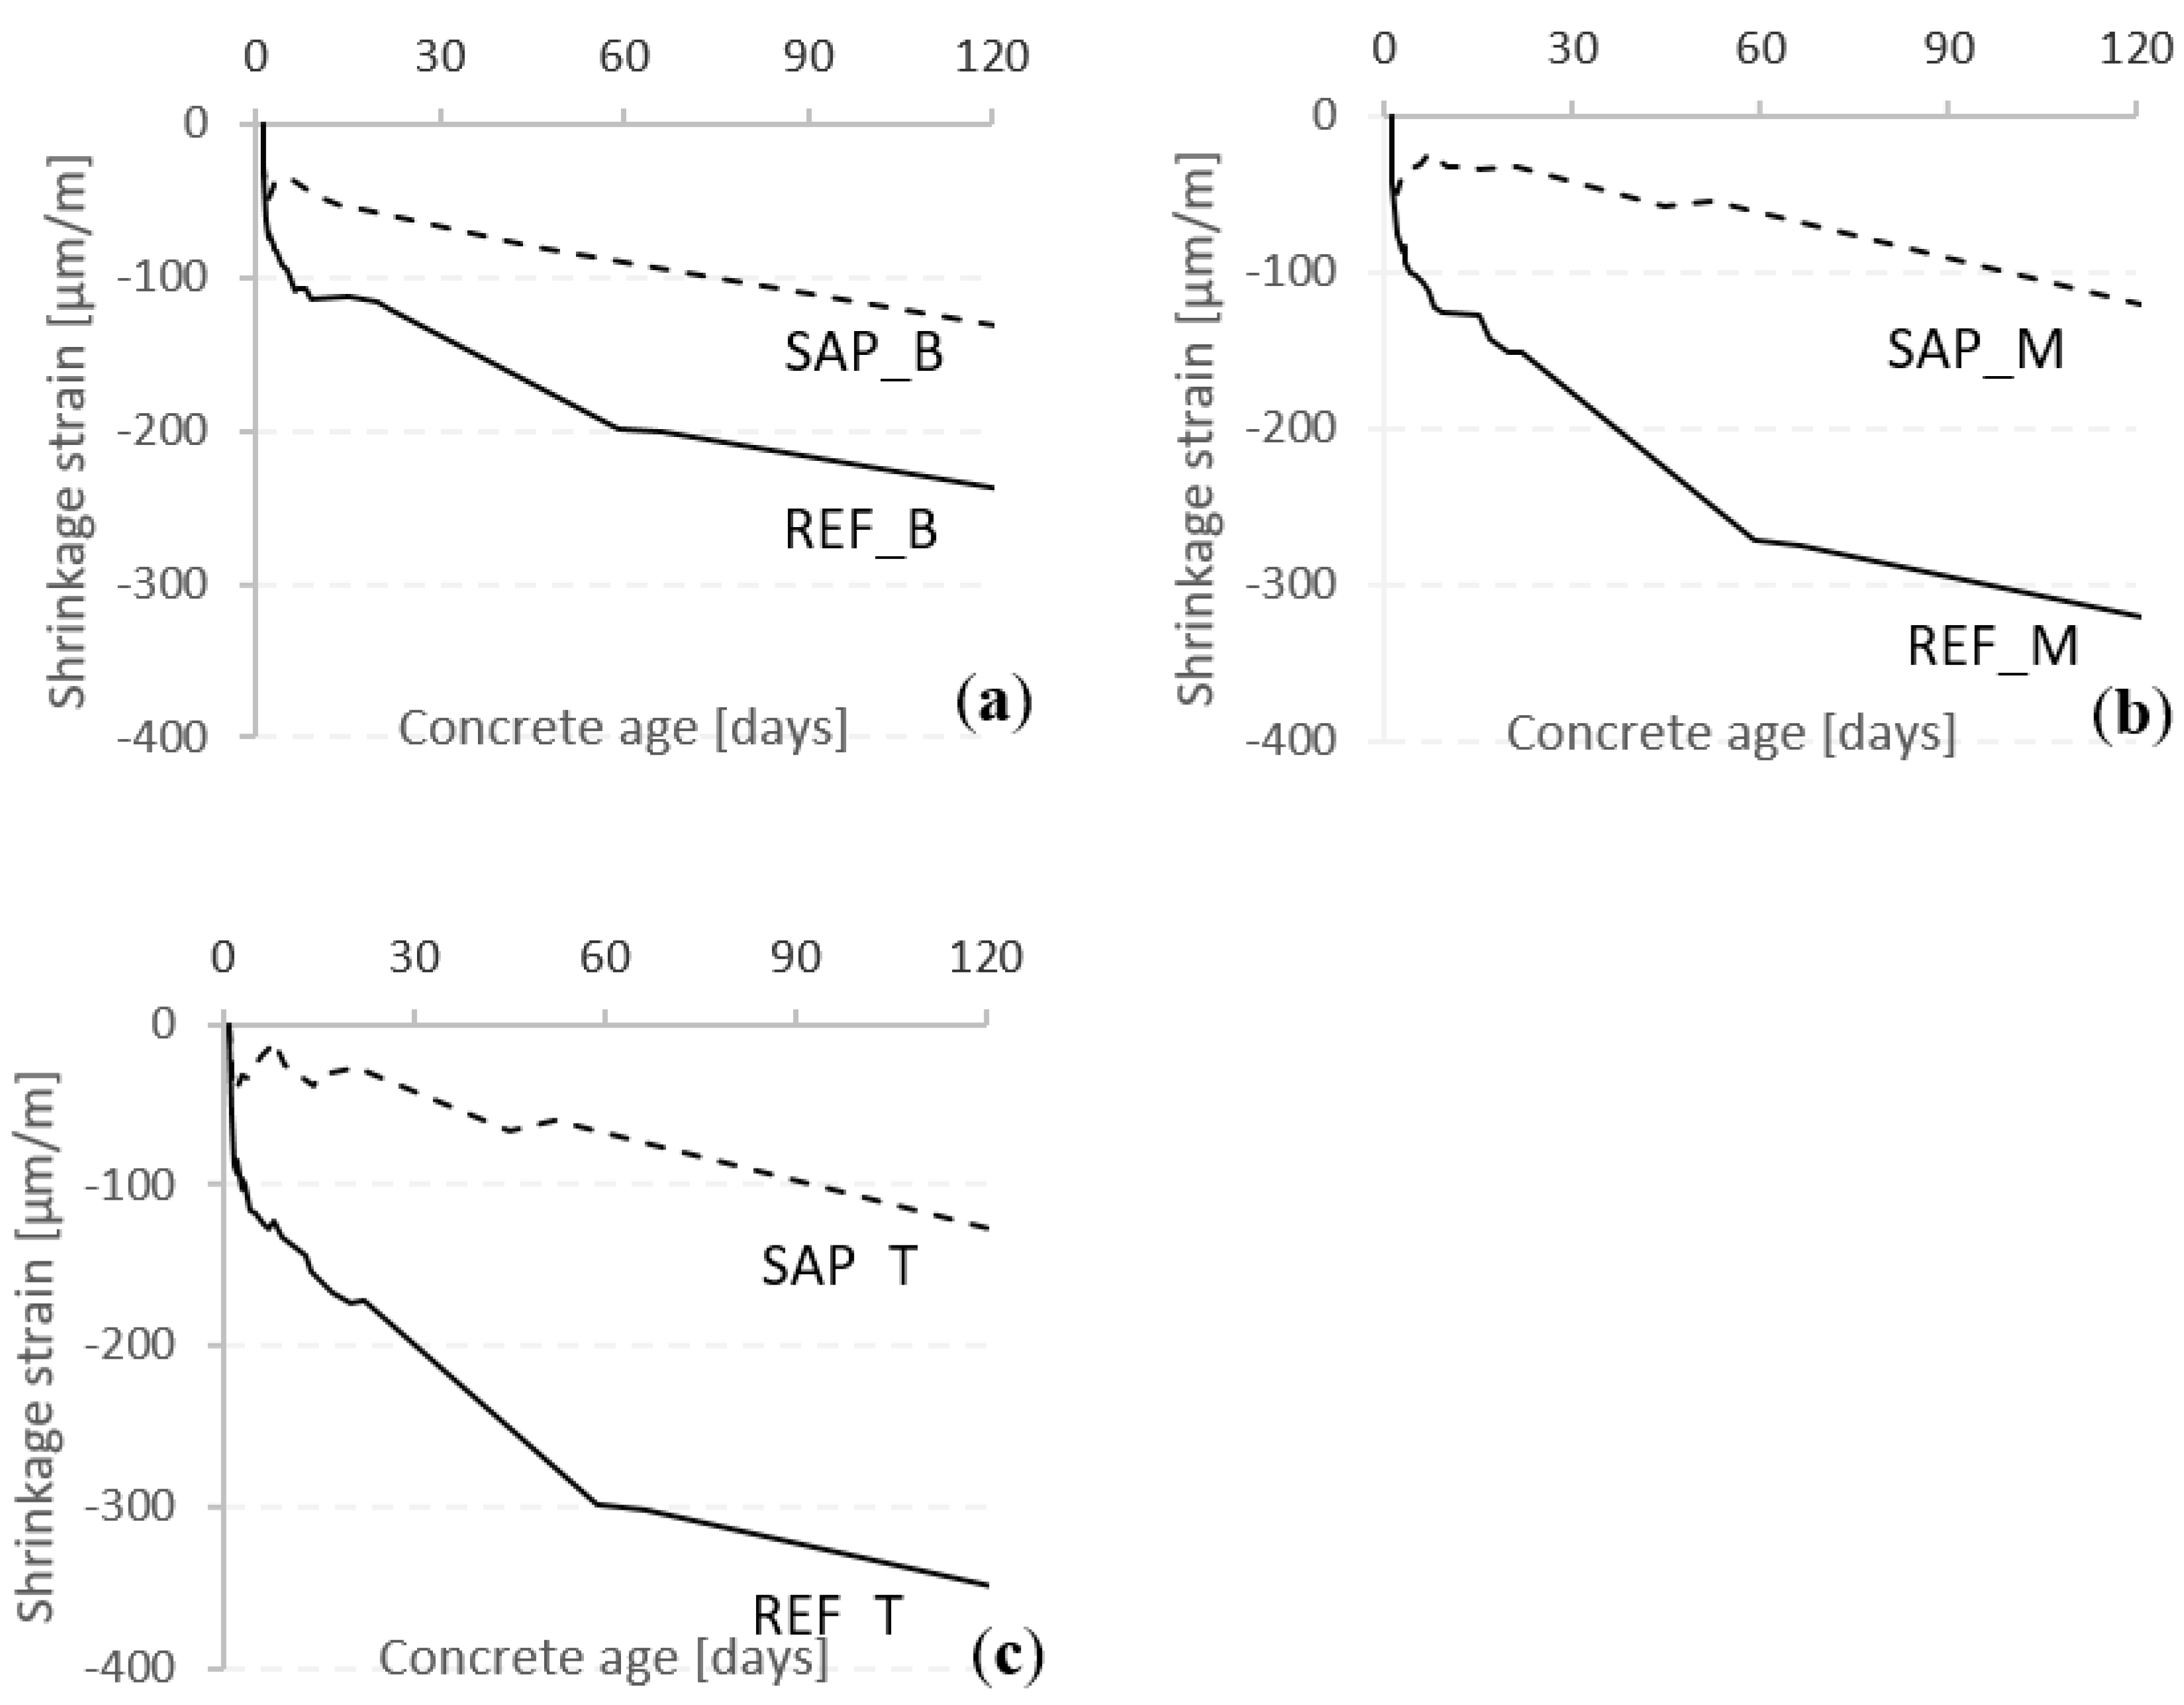
3.6. Autogenous Shrinkage Measured in the Wall with Fiber Optic SOFO Sensors and DEMEC Strain Gauges
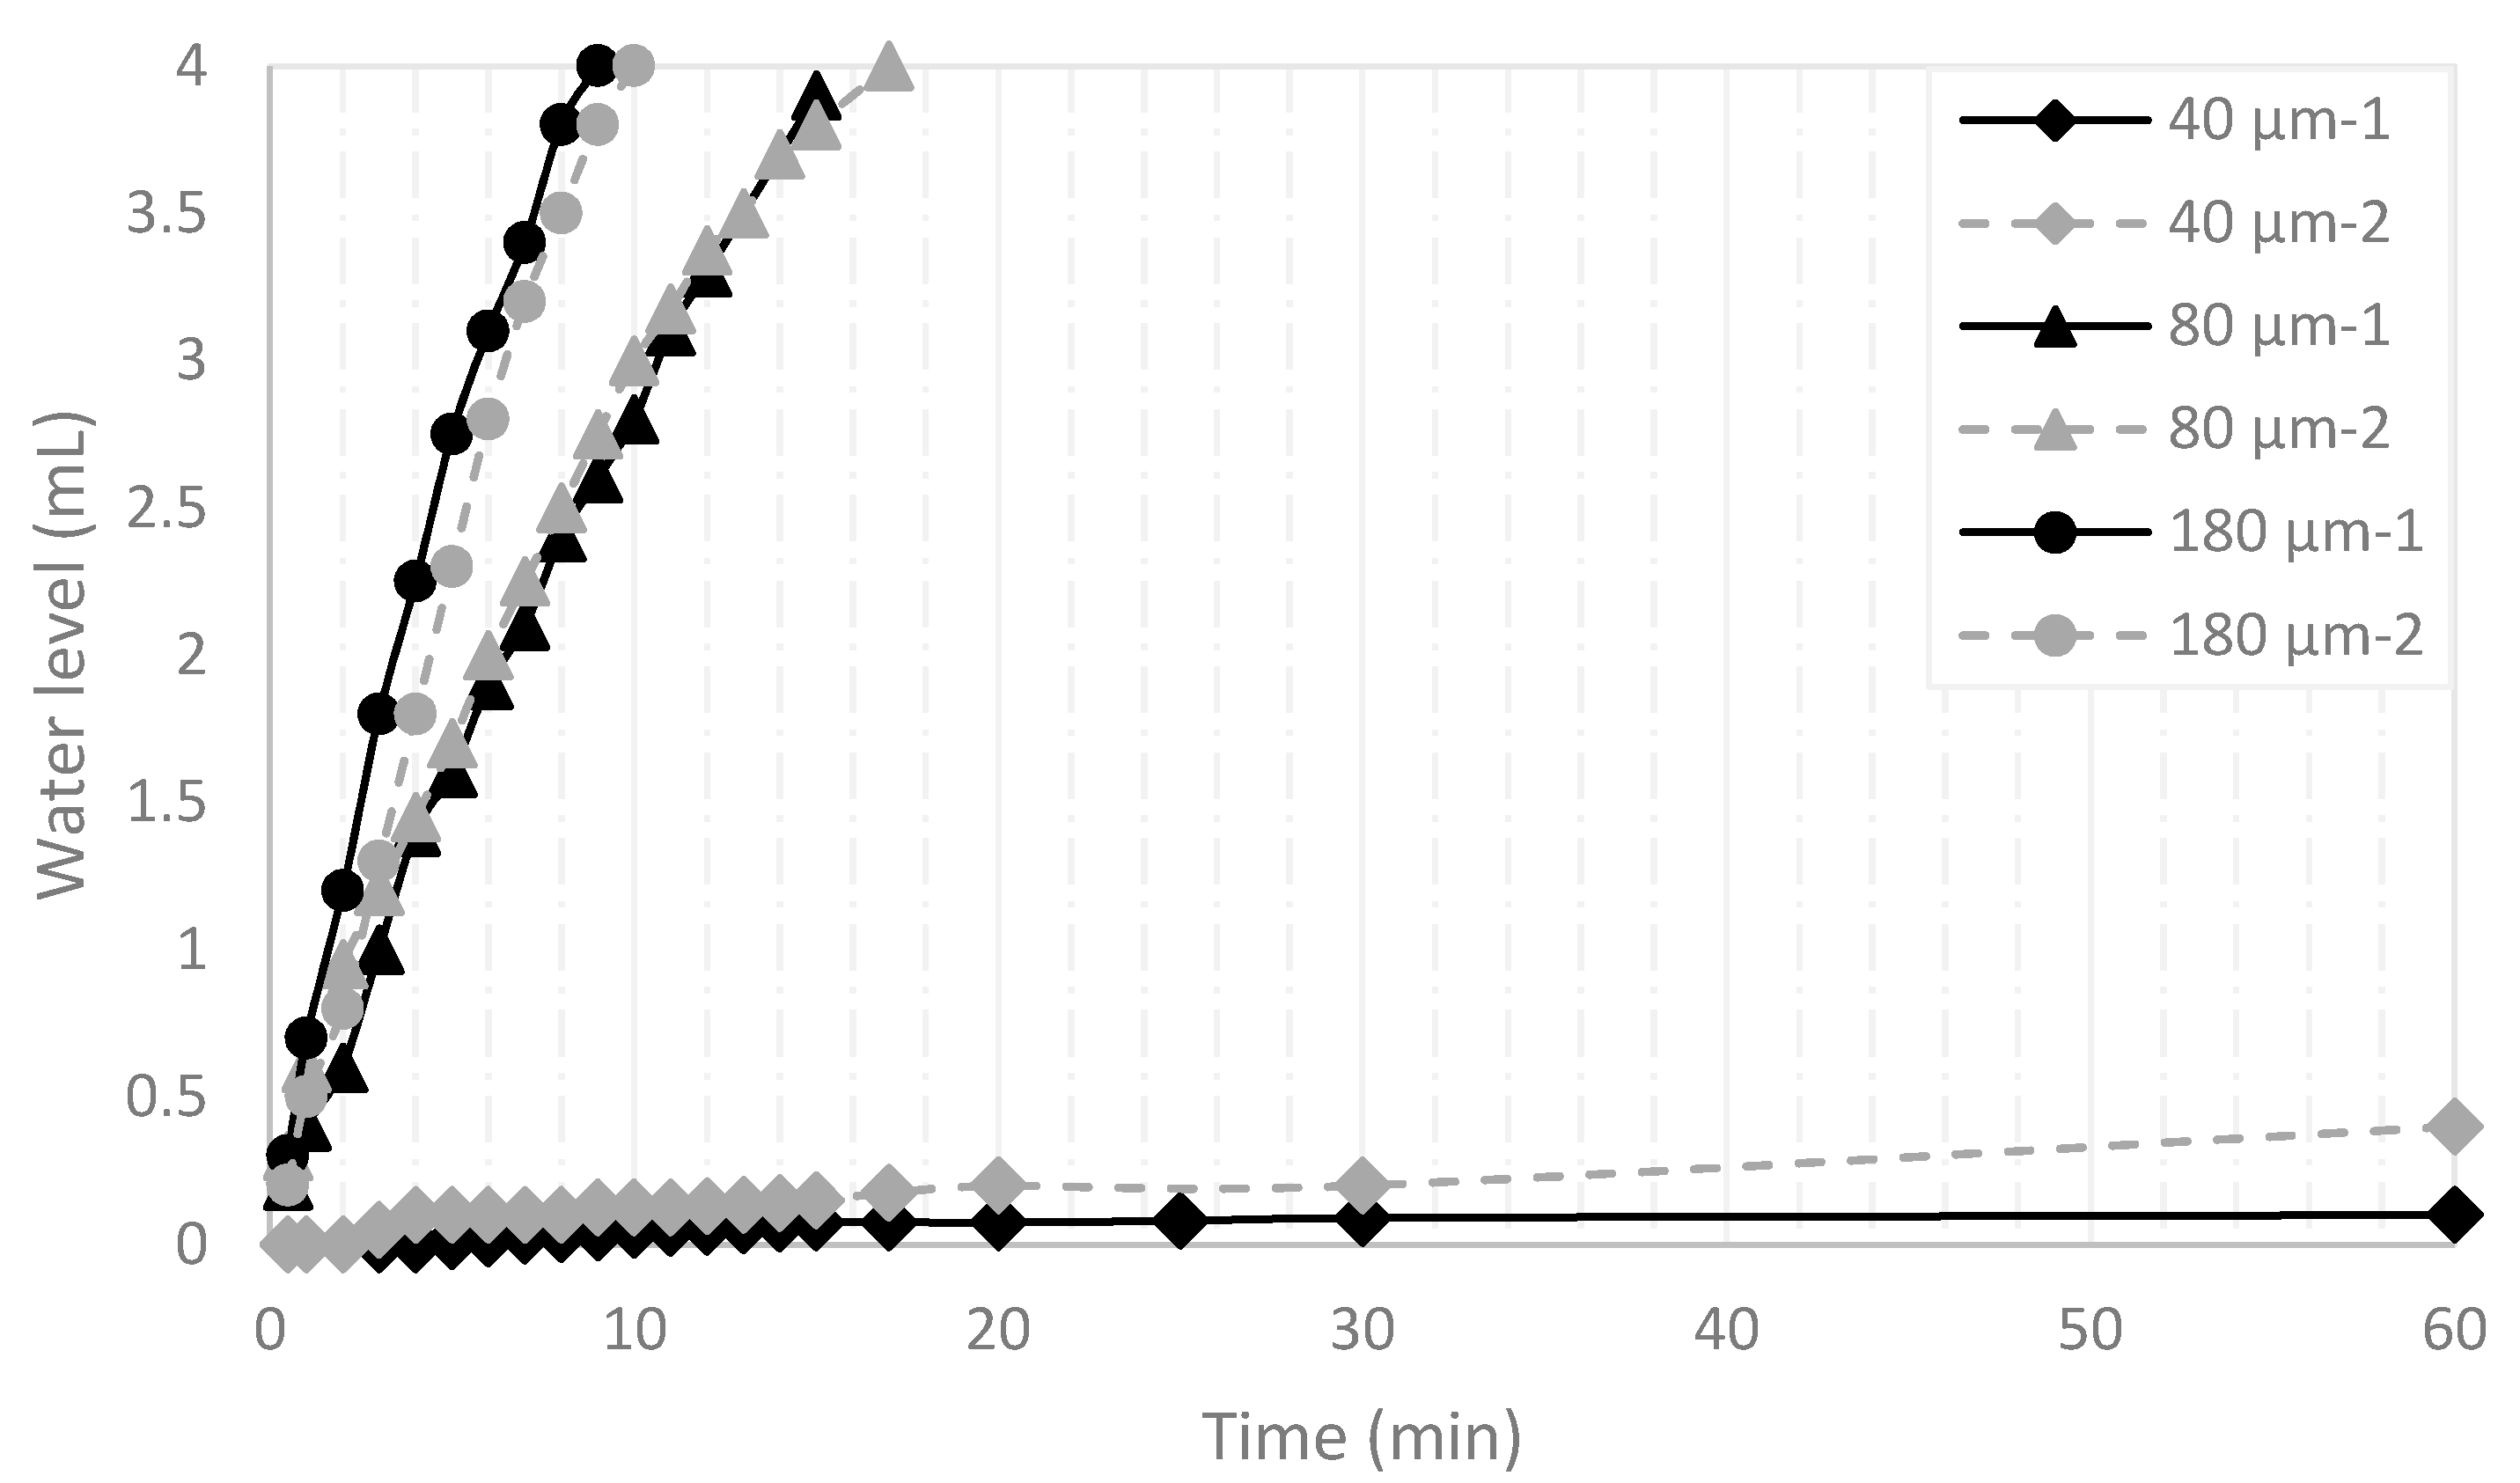
3.7. Water Flow
4. Discussion
4.1. Fresh and Hardened Properties of the Walls
4.2. Restrained Shrinkage
4.3. Autogenous Shrinkage
4.4. Water Flow
5. Conclusions
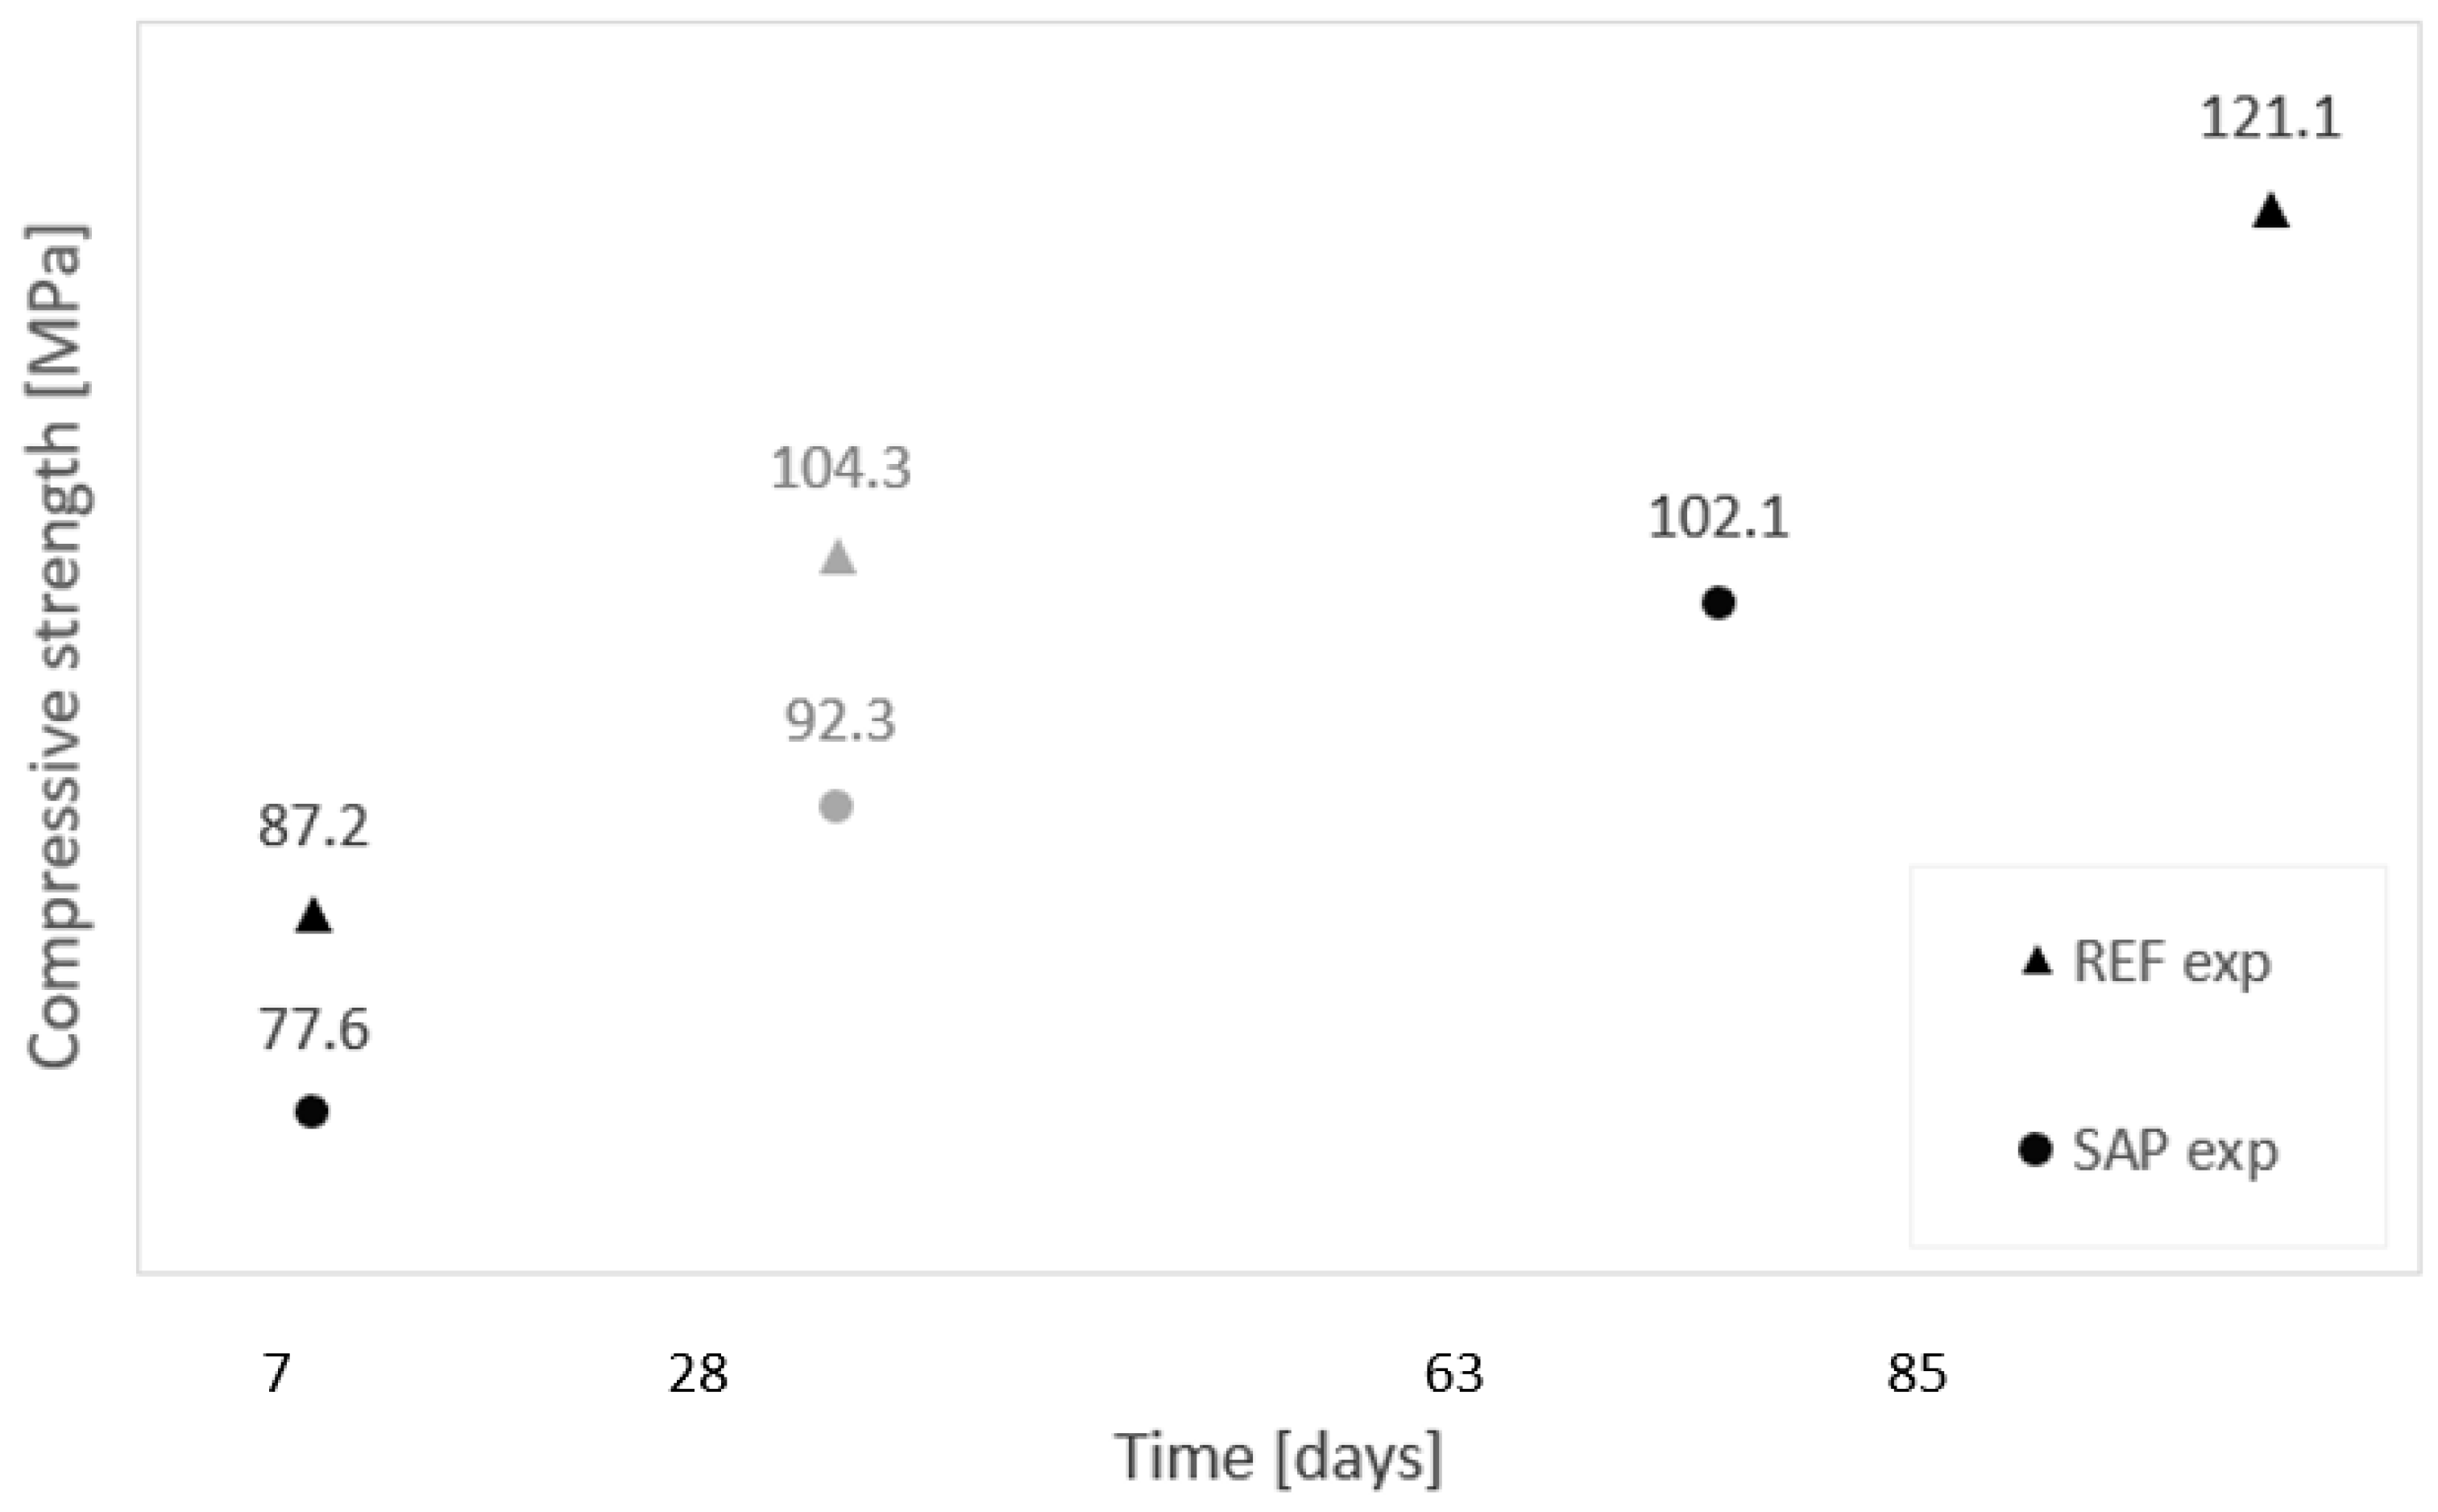
- The compressive strength of the SAP mix is 11% lower than the REF one at seven days and 11.5% at the later-age (28 days) due to the presence of the SAPs that become pores after the release of their water. Nevertheless, the compressive strength of the SAP mixture remains in the same class as the reference one, and the concrete is still classified as HPC.
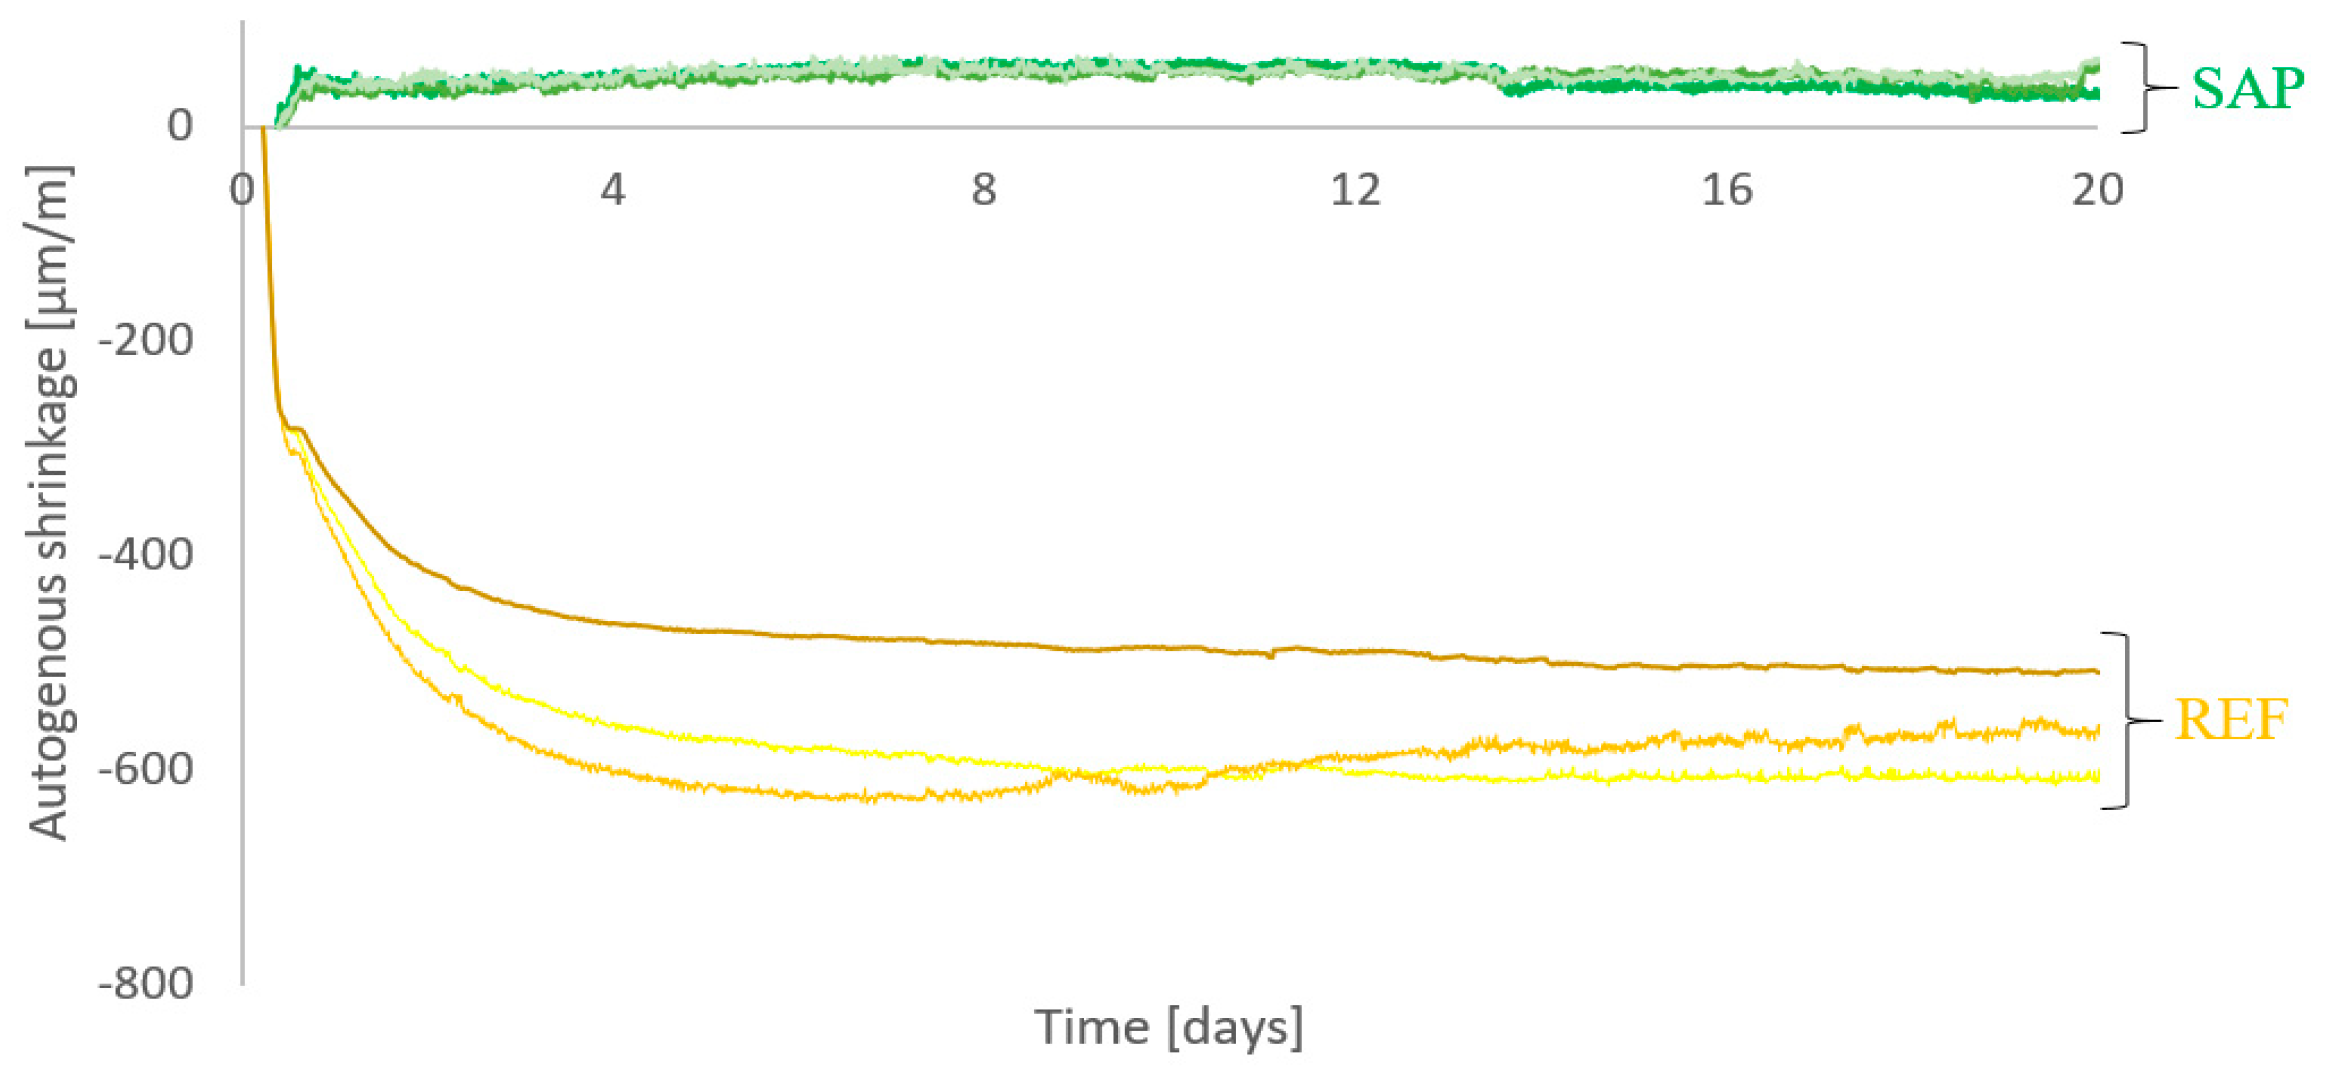
- Autogenous shrinkage results for the SAP wall, clearly showed how the addition of SAP in concrete reduces the AS over a period of four months. This type of shrinkage was investigated using corrugated tubes filled with concrete, while real-time deformations were recorded using fiber optic SOFO sensors embedded in the walls and measurement points for mechanical strain gauges were placed on the wall. The early release of water from the SAPs into the matrix reduced the shrinkage of the structure over the complete measurement period (up to 120 days of age). Thanks to the SAP incorporation, the shrinkage of the walls was reduced by 22% at the bottom, 54% in the middle, and 60% on top.
- Restrained shrinkage tests were also performed on concrete using ring tests to further understand the behavior of HPC toward restrained conditions. The specimens for the REF mixtures cracked after only two days, whereas SAP specimens didn’t crack over the whole testing period (20 days).
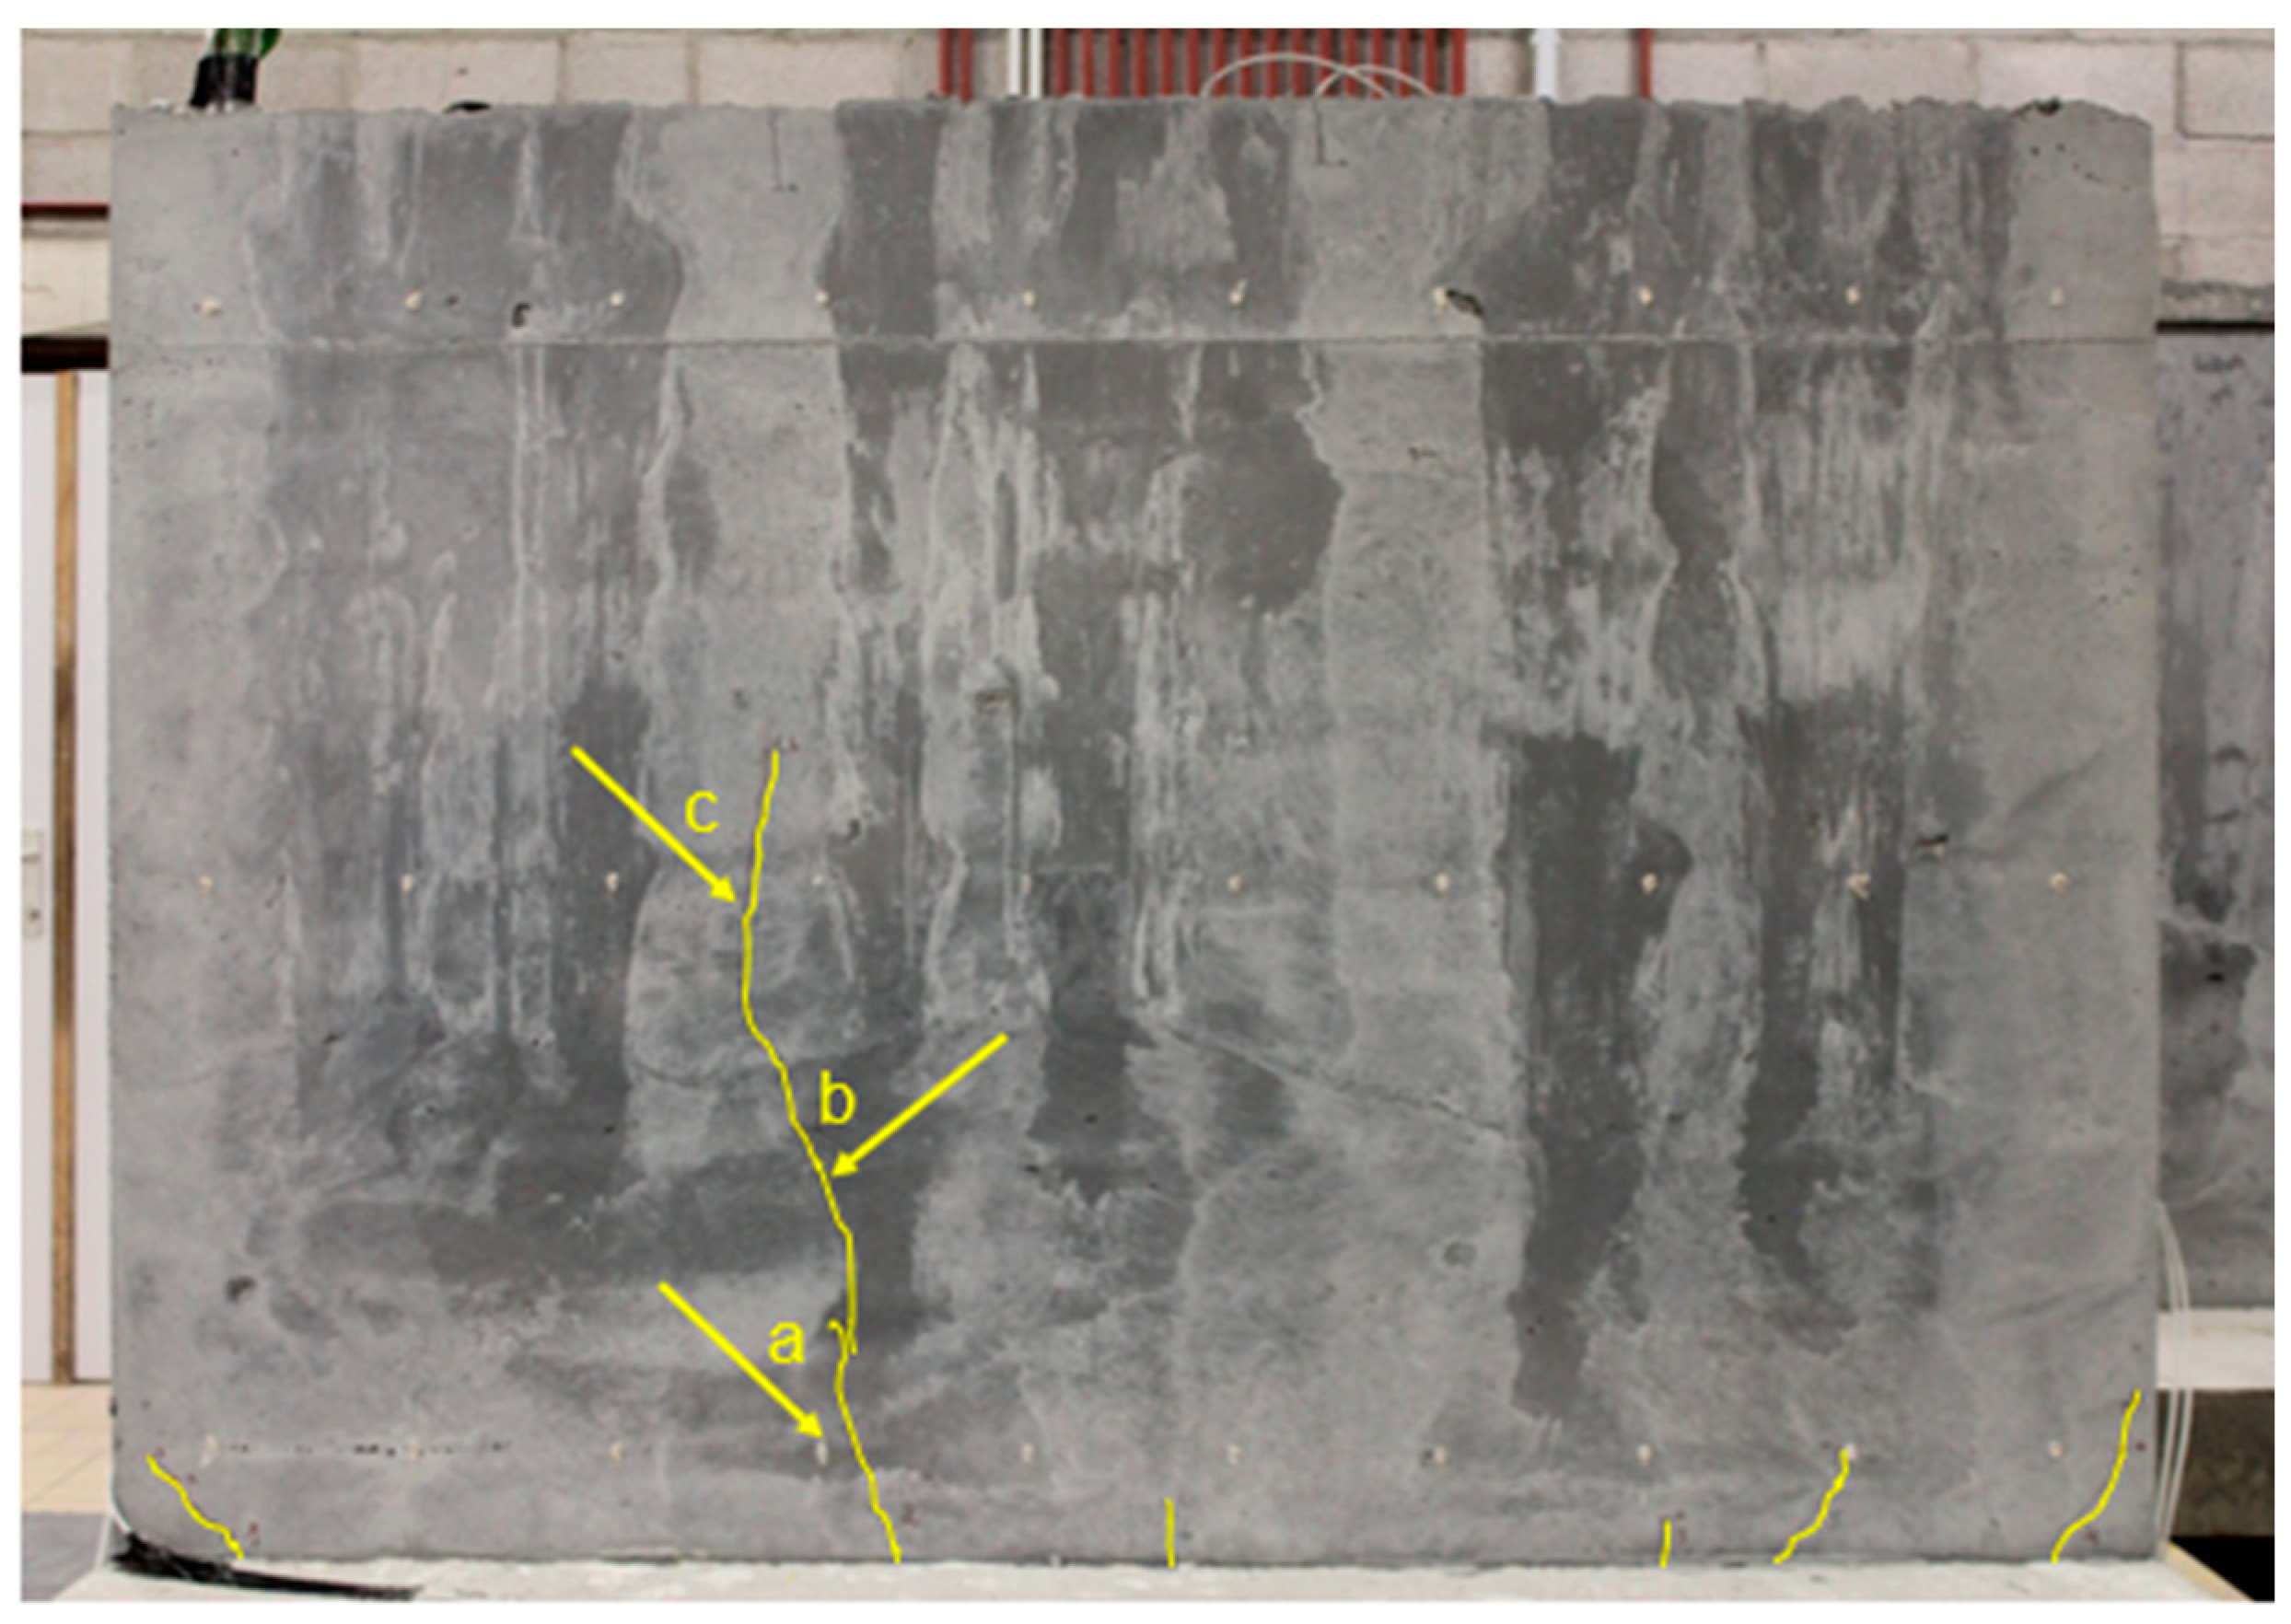
- Cracks were shown on the reference wall at the early-age stage, after 21 h. The biggest crack reaches the middle of the wall and is 180 µm large at the bottom and 40 µm at mid-height of the wall. Over the four months of testing, no cracks were seen on the SAP wall.
- Water flow measurements were performed on the main crack of the reference wall, the water flow rate indeed increased with the third power of the crack width, as can be found in the existing literature.
Author Contributions
Funding
Acknowledgments
Conflicts of Interest
References
- Schröfl, C.; Mechtcherine, V.; Gorges, M. Relation between the molecular structure and the efficiency of superabsorbent polymers (SAP) as concrete admixture to mitigate autogenous shrinkage. Cem. Concr. Res. 2012, 42, 865–873. [Google Scholar] [CrossRef]
- Bentz, D.P.; Jensen, O.M.; Hansen, K.K.; Olesen, J.F.; Stang, H.; Haecker, C.J. Influence of Cement Particle-Size Distribution on Early Age Autogenous Strains and Stresses in Cement-Based Materials. J. Am. Ceram. Soc. 2001, 84, 129–135. [Google Scholar] [CrossRef] [Green Version]
- Snoeck, D.; Jensen, O.M.; De Belie, N. The influence of superabsorbent polymers on the autogenous shrinkage properties of cement pastes with supplementary cementitious materials. Cem. Concr. Res. 2015, 74, 59–67. [Google Scholar] [CrossRef]
- Kovler, K.; Zhutovsky, S. Overview and future trends of shrinkage research. Mater. Struct. Constr. 2006, 39, 827–847. [Google Scholar] [CrossRef]
- Lura, P.; van Breugel, K.; Maruyama, I. Effect of curing temperature and type of cement on early-age shrinkage of high-performance concrete. Cem. Concr. Res. 2001, 31, 1867–1872. [Google Scholar] [CrossRef]
- Holt, E. Contribution of mixture design to chemical and autogenous shrinkage of concrete at early ages. Cem. Concr. Res. 2005. [Google Scholar] [CrossRef]
- Wu, L.; Farzadnia, N.; Shi, C.; Zhang, Z.; Wang, H. Autogenous shrinkage of high performance concrete: A review. Constr. Build. Mater. 2017, 149. [Google Scholar] [CrossRef]
- Holt, E.E. Early Age Autogenous Shrinkage of Concrete; VTT Technical Research Center of Finland: Espoo, Finland, 2001; pp. 2–184. [Google Scholar]
- Mechtcherine, V.; Reinhardt, H.W. STAR 225-SAP Application of Superabsorbent Polymers (SAP) in Concrete Construction; Springer Netherlands: Heidelberg, Germany, 2012. [Google Scholar]
- Justs, J.; Wyrzykowski, M.; Bajare, D.; Lura, P. Cement and Concrete Research Internal curing by superabsorbent polymers in ultra-high performance concrete. Cem. Concr. Res. 2015, 76, 82–90. [Google Scholar] [CrossRef]
- Jensen, O.M.; Hansen, P.F. Water-entrained cement-based materials I. Principles and theoretical background. Cem. Concr. Res. 2001, 31, 647–654. [Google Scholar] [CrossRef]
- Piérard, J.; Pollet, V.; Cauberg, N. Mitigating autogenous shrinkage in HPC by internal curing using superabsorbent polymers. In Proceedings of the International RILEM Conference Volume Changes Hardening Concrete: Testing Mitigation, Lyngby, Denmark, 20–23 August 2006; pp. 97–106. [Google Scholar] [CrossRef] [Green Version]
- Craeye, B.; Geirnaert, M.; de Schutter, G. Super absorbing polymers as an internal curing agent for mitigation of early-age cracking of high-performance concrete bridge decks. Constr. Build. Mater. 2011, 25, 1–13. [Google Scholar] [CrossRef]
- Igarashi, S.; Watanabe, A.; Jensen, O.M.; Lura, P.; Kovler, K. Experimental study on prevention of autogenous deformation by internal curing using super-absorbent polymer particles. In Proceedings of the International RILEM Conference Volume Changes Hardening Concrete: Testing Mitigation, Lyngby, Denmark, 20–23 August 2006; pp. 77–86. [Google Scholar] [CrossRef] [Green Version]
- Mechtcherine, V.; Gorges, M.; Schroefl, C.; Assmann, A.; Brameshuber, W.; Ribeiro, A.B.; Cusson, D.; Custódio, J.; da Silva, E.F.; Ichimiya, K. Effect of internal curing by using superabsorbent polymers (SAP) on autogenous shrinkage and other properties of a high-performance fine-grained concrete: Results of a RILEM round-robin test. Mater. Struct. 2013, 47, 541–562. [Google Scholar] [CrossRef]
- Benboudjema, F.; Delsaute, B.; Honorio, T. Thermal Cracking of Massive Concrete Structures; Springer Cham: New York, NY, USA, 2019. [Google Scholar]
- ASTM International. ASTM C 1581-04, Standard Test Method for Determining Age at Cracking and Induced Tensile Stress Characteristics of Mortar and Concrete under Restrained Shrinkage; American Society for Testing and Materials: West Conshohocken, PA, USA, 2004. [Google Scholar]
- ASTM C1698-09. Standard Test Method for Autogenous Strain of Cement Paste and Mortar; American Society for Testing and Materials: West Conshohocken, PA, USA, 2010. [Google Scholar] [CrossRef]
- Wong, A.C.L.; Childs, P.A.; Berndt, R.; Macken, T.; Peng, G.D.; Gowripalan, N. Simultaneous measurement of shrinkage and temperature of reactive powder concrete at early-age using fibre Bragg grating sensors. Cem. Concr. Compos. 2007. [Google Scholar] [CrossRef]
- Glišić, B. Fibre Optic Sensors and Behaviour in Concrete At Early Age. Ph.D thesis, Ecole Polytechnique Federale de Lausanne, Lausanne, Switzerland, 2000. [Google Scholar]
- Glišić, B.; Simon, N. Monitoring of concrete at very early age using stiff SOFO sensor. Cem. Concr. Compos. 2000, 22, 115–119. [Google Scholar] [CrossRef]
- Kristiawan, S.A.; Aditya, M.T.M. Effect of high volume fly ash on shrinkage of self-compacting concrete. Procedia Eng. 2015, 125, 705–712. [Google Scholar] [CrossRef] [Green Version]
- Zdanowicz, K.; Marx, S. Shrinkage and Expansion Strains in Self-compacting Concrete: Comparison of Methods of Measurements. In High Tech Concrete: Where Technology and Engineering Meet; Springer Cham: New York, NY, USA, 2018; pp. 524–532. [Google Scholar]
- Filho, J.R.T.; Mannekens, E.; van Tittelboom, K.; Snoeck, D.; De Belie, N. Assessment of the potential of superabsorbent polymers as internal curing agents in concrete by means of optical fiber sensors. Constr. Build. Mater. 2020, 238, 1–8. [Google Scholar] [CrossRef]
- Wang, K.; Jansen, D.C.; Shah, S.P.; Karr, A.F. Permeability study of cracked concrete. Cem. Concr. Res. 1997, 27, 381–393. [Google Scholar] [CrossRef] [Green Version]
- Cusson, D.; Hoogeveen, T. An experimental approach for the analysis of early-age behaviour of high-performance concrete structures under restrained shrinkage. Cem. Concr. Res. 2007, 37, 200–209. [Google Scholar] [CrossRef] [Green Version]
- Recommendation of RILEM TC 260-RSC: Testing sorption by superabsorbent polymers (SAP) prior to implementation in cement-based materials. Mater. Struct. 2018, 8. [CrossRef]
- Zhu, Q.; Barney, C.W.; Erk, K.A. Effect of ionic crosslinking on the swelling and mechanical response of model superabsorbent polymer hydrogels for internally cured concrete. Mater. Struct. 2014, 48, 2261–2276. [Google Scholar] [CrossRef]
- Snoeck, D.; De Belie, N. Repeated Autogenous Healing in Strain-Hardening Cementitious Composits by Using Superabsorbent Polymers. J. Mater. Civ. Eng. 2013, 25, 864–870. [Google Scholar]
- Schröfl, C.; Snoeck, D.; Mechtcherine, V. A review of characterization methods for superabsorbent polymer (SAP) samples to be used in cement-based construction materials: Report of the RILEM TC-260-RSC. Mater. Struct. Constr. 2017, 50, 197. [Google Scholar] [CrossRef]
- De Meyst, L.; Mannekens, E.; de Araujo, M.A.P.G.; Snoeck, D.; van Tittelboom, K.; van Vlierberghe, S.; De Belie, N. Parameter Study of Superabsorbent Polymers for Use in Durable Concrete Structures. Materials 2019, 12, 1541. [Google Scholar] [CrossRef] [PubMed] [Green Version]
- Wyrzykowski, M.; Lura, P.; Pesavento, F.; Gawin, D. Modeling of Water Migration during Internal Curing with Superabsorbent Polymers. J. Mater. Civ. Eng. 2012, 24, 1006–1016. [Google Scholar] [CrossRef]
- Filho, J.R.T.; Snoeck, D.; De Belie, N. Mixing protocols for plant-scale production of concrete with superabsorbent polymers. Struct. Concr. 2020, 1–9. [Google Scholar] [CrossRef]
- Belgian Standard. NBN EN 12390-3: 2019 Testing Hardened Concrete—Part 3: Compressive Strength of Test Specimens; NBN, Bureau voor Normalisatie: Brussels, Belgium, 2019. [Google Scholar]
- Belgian Standard. NBN EN 12390-13: Beproeving van Verhard Beton—Deel 13: Bepaling van de Secans Elasticiteitsmodulus Bij Druk; NBN, Bureau voor Normalisatie: Brussels, Belgium, 2005; p. 149. [Google Scholar]
- Belgian Standard. NBN EN 12350-8: Testing Fresh Concrete—Part 8: Self-Compacting Concrete Slump-Flow Test; NBN, Bureau voor Normalisatie: Brussels, Belgium, 2019. [Google Scholar]
- Belgian Standard. NBN EN 12350-7: Testing Fresh Concrete—Part 7: Air Content Pressure Methods; NBN, Bureau voor Normalisatie: Brussels, Belgium, 2019. [Google Scholar]
- Belgian Standard. NBN EN 12350-6: Testing fresh concrete—Part 6: Density; NBN, Bureau voor Normalisatie: Brussels, Belgium, 2019. [Google Scholar]
- Astm C403/C403M-99. Standard Test Method for Time of Setting of Concrete Mixtures by Penetration Resistance. Annu. B ASTM Stand. 1999, 4, 1–6. [Google Scholar]
- Müller, H.; Aïtcin, P.C.; Bentur, A.; Chiorino, M.A.; Clement, J.L.; Curbach, M.; Faust, T.; Hammer, T.A.; Jaccoud, J.P.; Kessler-Kramer, C.; et al. Constitutive Modelling of High Strength/High Performance Concrete; International Federation for Structural Concrete: Lausanne, Switzerland, 2008. [Google Scholar]
- Geiker, M.; Bentz, D.; Jensen, O. Mitigating autogenous shrinkage by internal curing. ACI Spec. Publ. 2004, 218, 143–148. [Google Scholar]
- Jensen, O.M.; Hansen, P.F. Water-entrained cement-based materials II. Experimental observation. Cem. Concr. Res. 2001. [Google Scholar] [CrossRef]
- Lura, P.; Durand, F.; Jensen, O.M. Autogenous strain of cement pastes with superabsorbent polymers. In Proceedings of the International RILEM Conference Volume Changes Hardening Concrete: Testing Mitigation, Lyngby, Denmark, 20–23 August 2006; pp. 57–66. [Google Scholar] [CrossRef] [Green Version]
- Ji, T.; Zheng, D.D.; Chen, X.F.; Lin, X.J.; Wu, H.C. Effect of prewetting degree of ceramsite on the early-age autogenous shrinkage of lightweight aggregate concrete. Constr. Build. Mater. 2015, 98, 102–111. [Google Scholar] [CrossRef]
- SMARTEC. Standard SOFO Deformation Sensor, Guidelines and Installation Instructions, Manno, Switzerland. Available online: https://smartec.ch/wp-content/uploads/sites/2/2017/01/SOFO-Standard-Deformation-Sensor-E10-1010-SMA.pdf (accessed on 8 June 2020).
- RILEM TC 25-PEM. Recommended Tests to Measure the Deterioration of Stone and to Assess the Effectiveness of Treatment Methods, Materials and Structures; RILEM Publications SARL: Paris, France, 1980; p. 75. [Google Scholar]
- Rizwan, S.A.; Mustafa, S.; Ahmed, W. Mitigation of Early Age Shrinkage in self-Consolidating Paste Systems Using Superabsorbent. In Proceedings of the Materials, System and Structures in Civil Engineering (MSSCE-2016), Denmark Technical University, Lyngby, Denmark, 15–29 August 2016; pp. 443–453. [Google Scholar]
- Dudziak, L.; Mechtcherine, V. Deliberations on Kinetics of Internal Curing Water Migration and Consumption Based on Experimental Studies on SAP-Enriched UHPC. In Proceedings of the International RILEM Conference on Use of Superabsorbent Polymers and other New Additives in Concrete, Lyngby, Denmark, 14–18 August 2010. [Google Scholar]
- EFNARC. “The European Guidelines for Self-Compacting Concrete: Specification, Production and Use”. Available online: http://www.efnarc.org/pdf/SandGforSCC.PDF (accessed on 20 February 2002).
- Filho, J.R.T.; Mannekens, E.; Snoeck, D.; De Belie, N. Salt-Scaling Resistance of SAP-Modified Concrete under Freeze-Thaw Cycles. In Proceedings of the 3rd RILEM Spring Convention 2020, Guimaraes, Portugal, 10–14 March 2020. [Google Scholar]
- Filho, J.R.T.; de Araújo, M.A.P.G.; Snoeck, D.; De Belie, N. Discussing different approaches for the time-zero as start for autogenous shrinkage in cement pastes containing superabsorbent polymers. Materials 2019, 12, 2962. [Google Scholar] [CrossRef] [Green Version]
- Hammer, T.A. Testing of Autogenous Deformation (AD) and Thermal Dilation (TD) of Early Age Mortar and Concrete—Recommended Test Procedure. In Proceedings of the International RILEM Conference on Volume Changes of Hardening Concrete: Testing and Mitigation, Lyngby, Denmark, 20–23 August 2006; pp. 341–346. [Google Scholar] [CrossRef]
- Lyu, Y. Autogenous Shrinkage of Cement-Based Materials: From the Fundamental Role of Self-Desiccation to Mitigation Strategies Based on Alternative Materials. Ph.D thesis, Ghent University, Ghent, Belgium, 2018. [Google Scholar]
- Mindess, S.; Young, J.F. Concrete; Prentice-Hall: Englewood Cliffs, NJ, USA, 1981. [Google Scholar]
- Edvardsen, C. Water permeability and autogenous healing of cracks in concrete. ACI Mater. J. 1999, 96, 448–454. [Google Scholar] [CrossRef]
- Van Mullem, T.; Gruyaert, E.; Debbaut, B.; Caspeele, R.; De Belie, N. Novel active crack width control technique to reduce the variation on water permeability results for self-healing concrete. Constr. Build. Mater. 2019, 203, 541–551. [Google Scholar] [CrossRef]


| Materials | kg/m3 |
|---|---|
| Sand 0/4 | 670 |
| Gravel 2/8 | 490 |
| Gravel 8/16 | 790 |
| CEM I 52.5 N | 300 |
| Water | 150 |
| BASF Glenium 27 superplasticizer | 1.67 |
| Materials | REF (kg/m3) | SAP (kg/m3) |
|---|---|---|
| Sand 0/4 | 401.9 | 373.9 |
| Basalt 4/8 | 649.3 | 604.4 |
| Silica Fume-Elkem Microsilica 940 U | 153.8 | 143.1 |
| Cement-Variodur 40 (CEM III/A 52.5 R) | 778.2 | 723.9 |
| Filler-Betofill VK50 | 185.5 | 172.6 |
| Water | 186.4 | 173.4 |
| Superplasticizer-SIKA Viscocrete UHPC-2 | 8.560 * | 8.690 ** |
| SAPs-BASF | - | 2.1717 *** |
| Extra water absorbed by SAP | - | 58.6 |
| REF | SAP | |
|---|---|---|
| Slump flow [mm] | 706 ± 22 | 698 ± 27 |
| Air content [%] | 2.7 | 2.5 |
| Density [kg/m3] | 2400 | 2340 |
| Final setting time [hrs] | 5.5 | 9 |
| E-Modulus (Gpa) | ||
|---|---|---|
| REF | 7 days: 57 ± 15 | 85 days: 57 ± 13 |
| SAP | 7 days: 57 ± 3 | 63 days: 57 ± 8 |
| Flow Rate (mL/min) | Crack Width | ||
|---|---|---|---|
| 40 µm | 80 µm | 180 µm | |
| 0.0075 | 0.23 | 0.41 | |
| 0.005 | 0.25 | 0.34 | |
| Difference (%) | 33% | 8% | 17% |
© 2020 by the authors. Licensee MDPI, Basel, Switzerland. This article is an open access article distributed under the terms and conditions of the Creative Commons Attribution (CC BY) license (http://creativecommons.org/licenses/by/4.0/).
Share and Cite
De Meyst, L.; Kheir, J.; Tenório Filho, J.R.; Van Tittelboom, K.; De Belie, N. The Use of Superabsorbent Polymers in High Performance Concrete to Mitigate Autogenous Shrinkage in a Large-Scale Demonstrator. Sustainability 2020, 12, 4741. https://0-doi-org.brum.beds.ac.uk/10.3390/su12114741
De Meyst L, Kheir J, Tenório Filho JR, Van Tittelboom K, De Belie N. The Use of Superabsorbent Polymers in High Performance Concrete to Mitigate Autogenous Shrinkage in a Large-Scale Demonstrator. Sustainability. 2020; 12(11):4741. https://0-doi-org.brum.beds.ac.uk/10.3390/su12114741
Chicago/Turabian StyleDe Meyst, Laurence, Judy Kheir, José Roberto Tenório Filho, Kim Van Tittelboom, and Nele De Belie. 2020. "The Use of Superabsorbent Polymers in High Performance Concrete to Mitigate Autogenous Shrinkage in a Large-Scale Demonstrator" Sustainability 12, no. 11: 4741. https://0-doi-org.brum.beds.ac.uk/10.3390/su12114741