An Acoustic Emission Technique for Crack Modes Classification in Concrete Structures


School of Electrical, Electronics and Computer Engineering, University of Ulsan, Ulsan 680749, Korea
*
Author to whom correspondence should be addressed.
Sustainability 2020, 12(17), 6724; https://0-doi-org.brum.beds.ac.uk/10.3390/su12176724
Submission received: 19 July 2020
/
Revised: 9 August 2020
/
Accepted: 17 August 2020
/
Published: 19 August 2020
(This article belongs to the Special Issue Crack Prediction and Preventive Repair Methods for the Increasing Sustainability and Safety Requirements of Structures)
Abstract
:The purpose of this study is to characterize fracture modes in a concrete structure using an acoustic emission (AE) technique and a data-driven approach. To clarify the damage fracture process, the specimens, which are of reinforced concrete (RC) beams, undergo four-point bending tests. During bending tests, impulses occurring in the AE signals are automatically detected using a constant false-alarm rate (CFAR) algorithm. For each detected impulse, its acoustic emission parameters such as counts, duration, amplitude, risetime, energy, RA, AF are calculated and studied. The mean and standard deviation values of each of these parameters are computed in every 1-s AE signal and are considered as features demonstrating the damage status of concrete structures. The results revealed that as the damage level in concrete structures grows, these features also change accordingly which can be used to categorize the damage fracture stages. The study also carries out experiments to validate the efficiency of the proposed approaches in terms of visual and qualitative evaluations. Experimental results show that the proposed characterizing model is promising and outstanding with the classification performance in the experimental environment of over 82%.
1. Introduction
Clarifying the damage fracture process in brittle materials such as concrete is a task that takes substantial effort in the civil engineering community [1,2,3,4,5]. This is particularly vital because, during the damage fracture process, a sequence of known fracture modes is generally followed that puts buildings at risk. Therefore, it is essential to characterize fracture modes in concrete structures associated with cracking to guarantee the safe operation of the structure. A notable method to monitor fracture phenomena in concrete is the acoustic emission (AE) as it permits to highlight the occurrence of minor and major fracture events in concrete structure as well as follow the fracture process until the final failure [3,6,7,8,9,10]. In other words, the general condition of concrete can be identified through characterizing the AE signals, along with specific indices that enlighten the understanding of the fracture process.
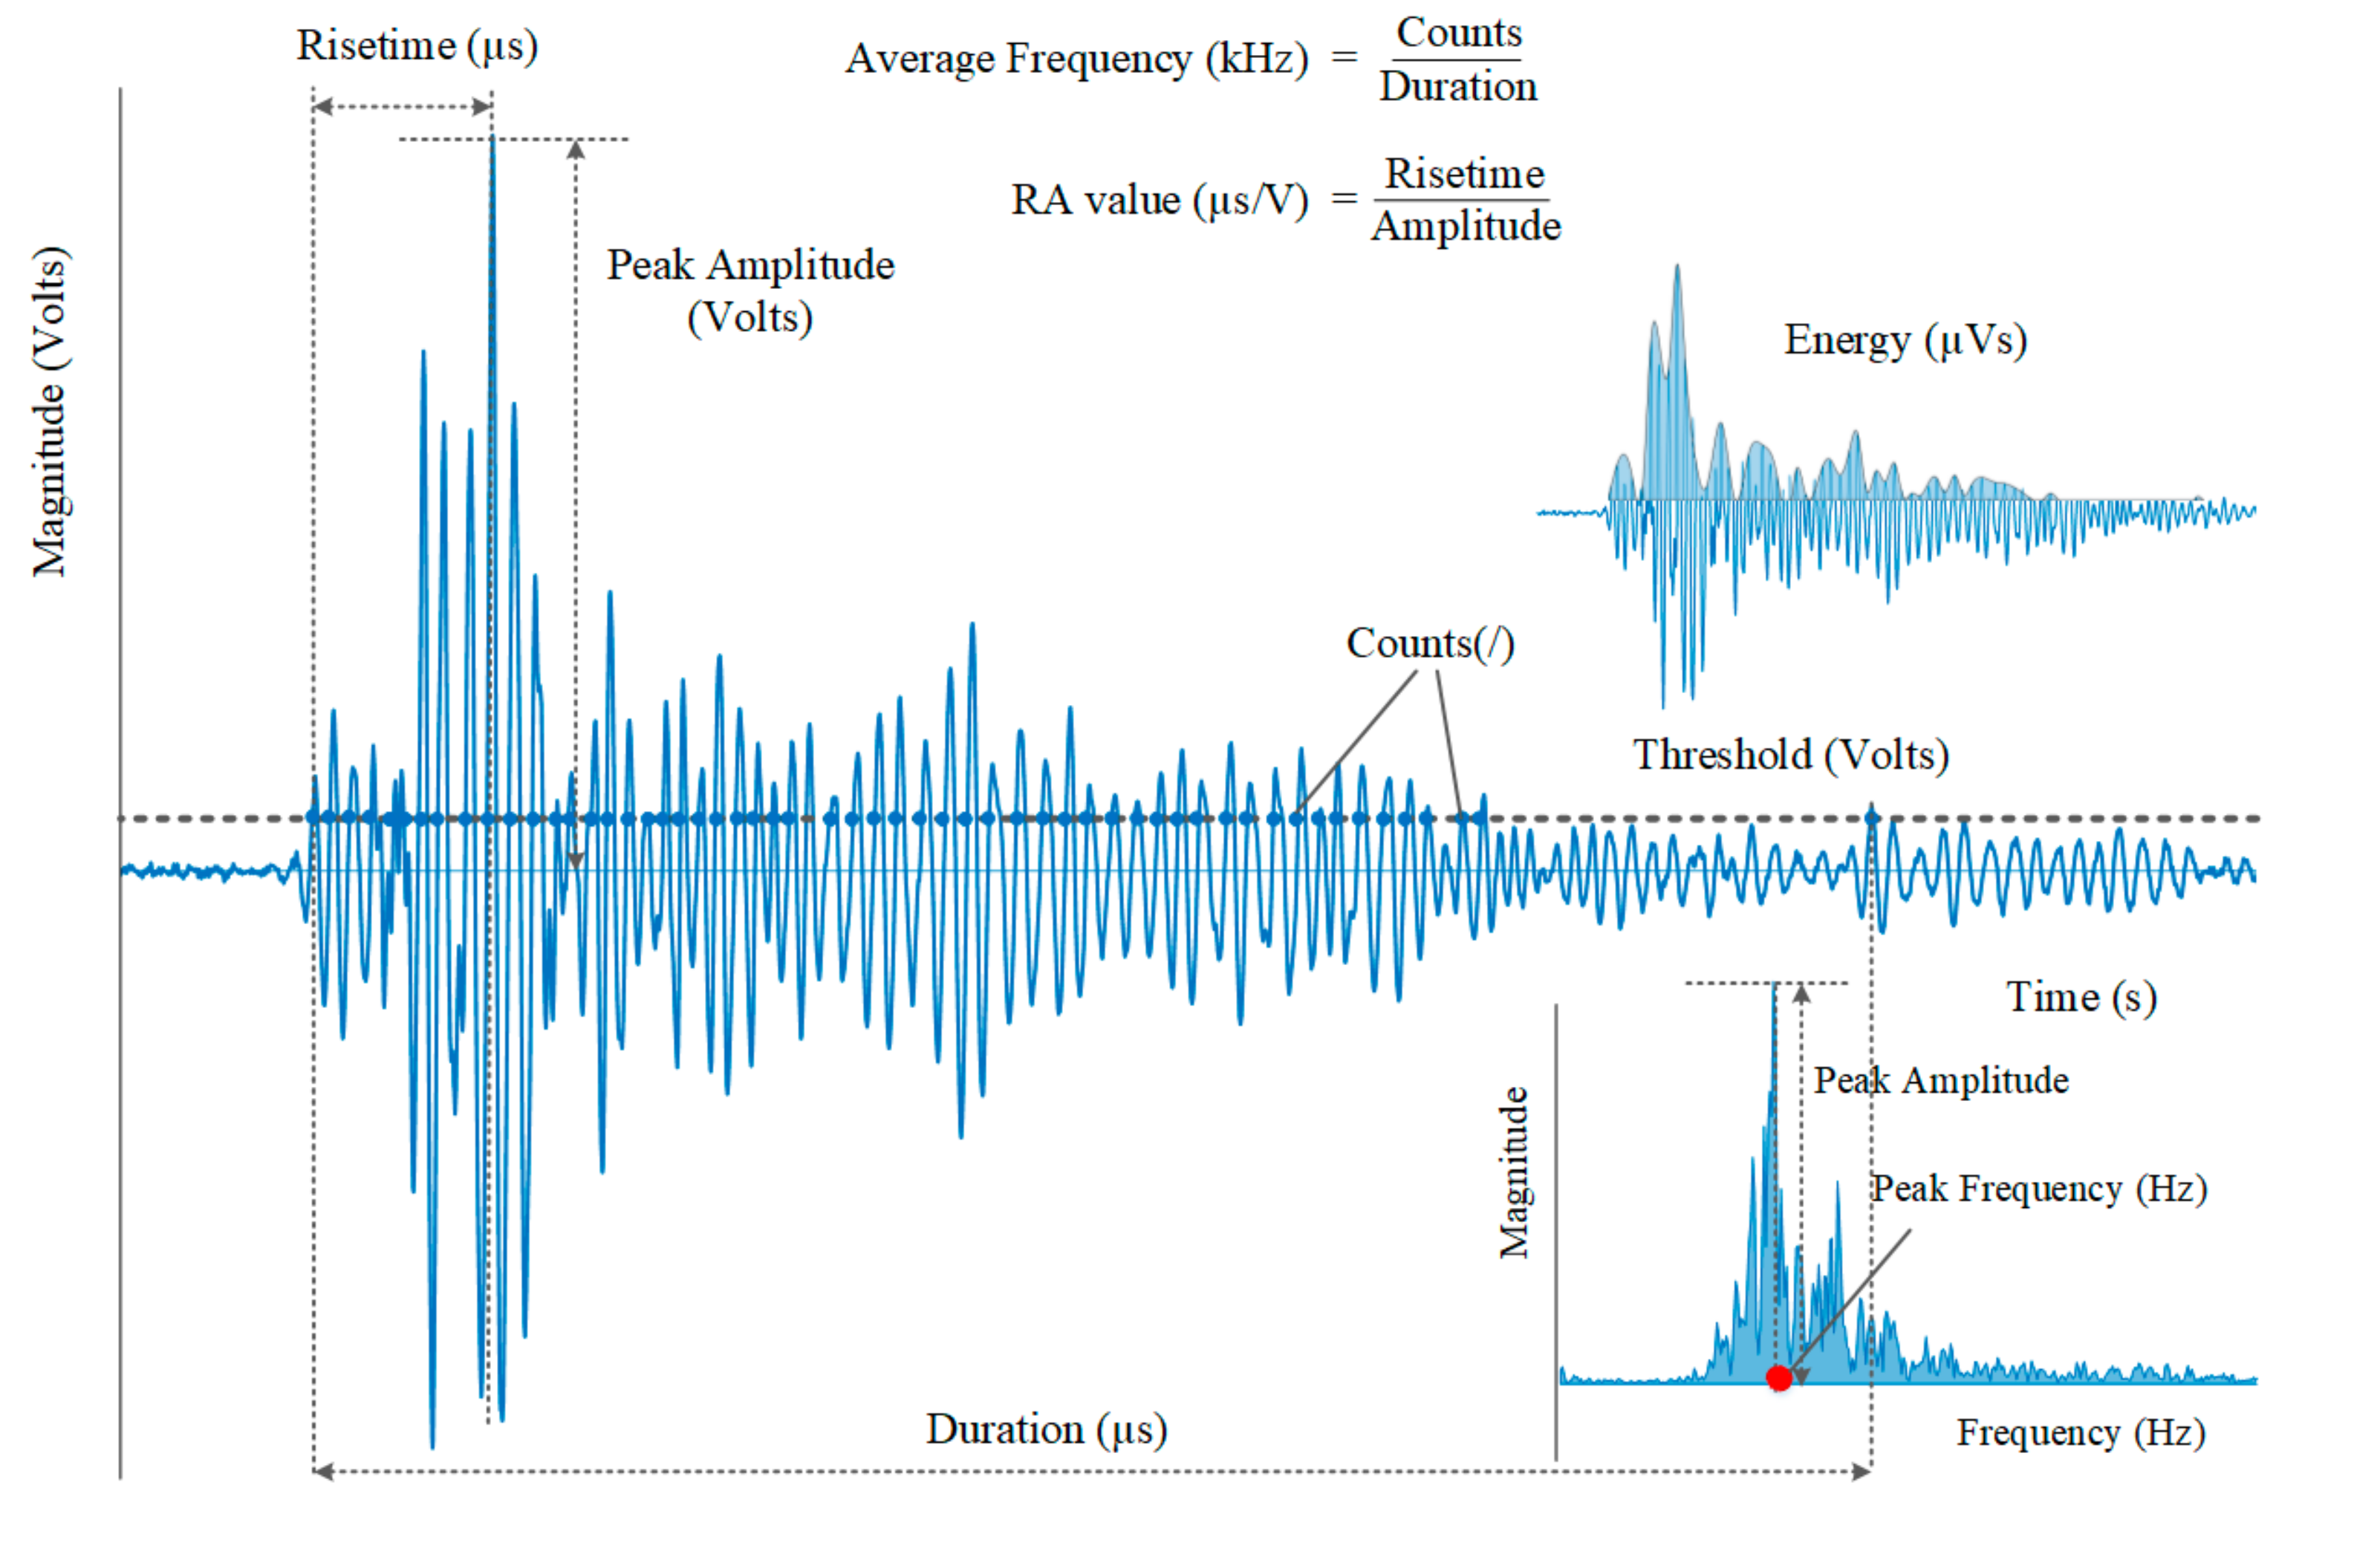
Impulses are diminishing elastic waves released from the initiation, propagation, and development of cracks that occur during the AE monitoring process. Such impulses are normally characterized by a series of parameters that some of them have been proven to be correlated to the fracture process [2,11,12]. The first one is the maximum amplitude (A) of the impulse. This parameter depends on the severity of the cracking source. Two other important parameters are the rise angle (RA) value and the average frequency (AF) value as they have been proven to be very sensitive to the fracture mode in many studies [1,13]. The way to determine the RA parameter is illustrated in Figure 1, which is the duration of the rising part of the impulse or the rise time (RT) measured in μs over amplitude (A) measured in V. The average frequency (AF) is the number of threshold crossings (i.e., counts) over the duration of the impulse. This parameter is normally measured in kHz [2,14,15]. In addition to these parameters, AE characteristic parameters such as the peak frequency (PF) [16], the energy also are listed and studied.
Although these AE characteristic parameters are feasible to clarify fracture modes in concrete structures, researchers have mainly used them in a laboratory environment. In addition, distinct damage stages in concrete are actually dependent on various kinds of factors, not only on the fracture modes of the material itself. Tensile cracks in steel fiber concrete [2,17], for example, are related to matrix cracking. This depends on the strength and quality of the concrete matrix itself. On the other hand, shear phenomena are normally associated with fiber pull-out that depends on the interfacial shear strength between the matrix and the fibers. Moreover, large concrete structures typically include numerous cracks either from construction or function loads. Thus, clarifying fracture condition in its absolute form by using some of AE parameters is difficult.
To fully describe the damage status of concrete, several objects should be evaluated. Instead of using the parameter-based approach, this study proposes to use the data-driven approach. This approach fundamentally divides the continuously measured AE signal into segmented signals of 1-s length. Such the segmented signals contain characteristic information that enables the evaluation of the general condition of concrete at each moment. To determine damage signatures in concrete during bending, impulses occurring in each of the segmented signals should be detected fully, and their corresponding parameters are then computed. Characteristic information or features extracted in the segmented signal are the mean and the standard deviation values of each of the parameters. These features are considered as functions of time, enable comparisons between the behavior and performance of the structure before and after sustaining additional loading. Thus, the proposed approach provides fracture modes in concrete structures during their service life that plays a vital role in guaranteeing the safe operation of structures.
The analysis of impulses commonly needs a lot of effort from an expert, including the costly time to hand-pick impulses occurring in the AE signals. However, for a very large dataset, this procedure is extremely time-consuming, or even impossible. Therefore, the application of automatic impulse-picking is necessary. This study suggests using the Constant False-Alarm Rate (CFAR) algorithm for impulse detection in the concrete AE signals. The CFAR detection in situ used in radar systems to detect targets and the choice of the algorithm in this study is due to its robust ability to find targets in an environment of varying background noise [18,19]. However, impulses collected by the CFAR algorithm often have incomplete shapes that result in parameter miscalculation. Therefore, it is necessary to correct impulses before going through subsequent analyses. In this study, one impulse is corrected by adding adjacent leading and lagging blocks to it. While the resulting impulse fully covers its components, it also contains redundant or non-signal pieces. Non-signal or noise pieces are then cut by a proposed impulse-trimming algorithm. This procedure results in a correct final impulse that is ready for parameter calculations.
The main contributions of this study include:
- The application of the CFAR algorithm for automatically detecting and characterizing impulses that occur in the AE signals obtained from concrete structures;
- The proposal of tips and algorithms to correct detected impulses in terms of their shape;
- The proposal of using the data-driven approach to categorize the crack modes in concrete structures.
The rest of this paper is arranged as follows. Section 2 describes the experimental setup including sample preparation, the four-point loading system, and the AE data acquisition. Section 3 introduces and thoroughly describes the algorithms used in this study. Section 4 analyzes and verifies the experimental results as well as shows the efficiency of the proposed classification model. Conclusions are discussed in Section 5.
2. Experimental Setup
2.1. Preparation of Samples
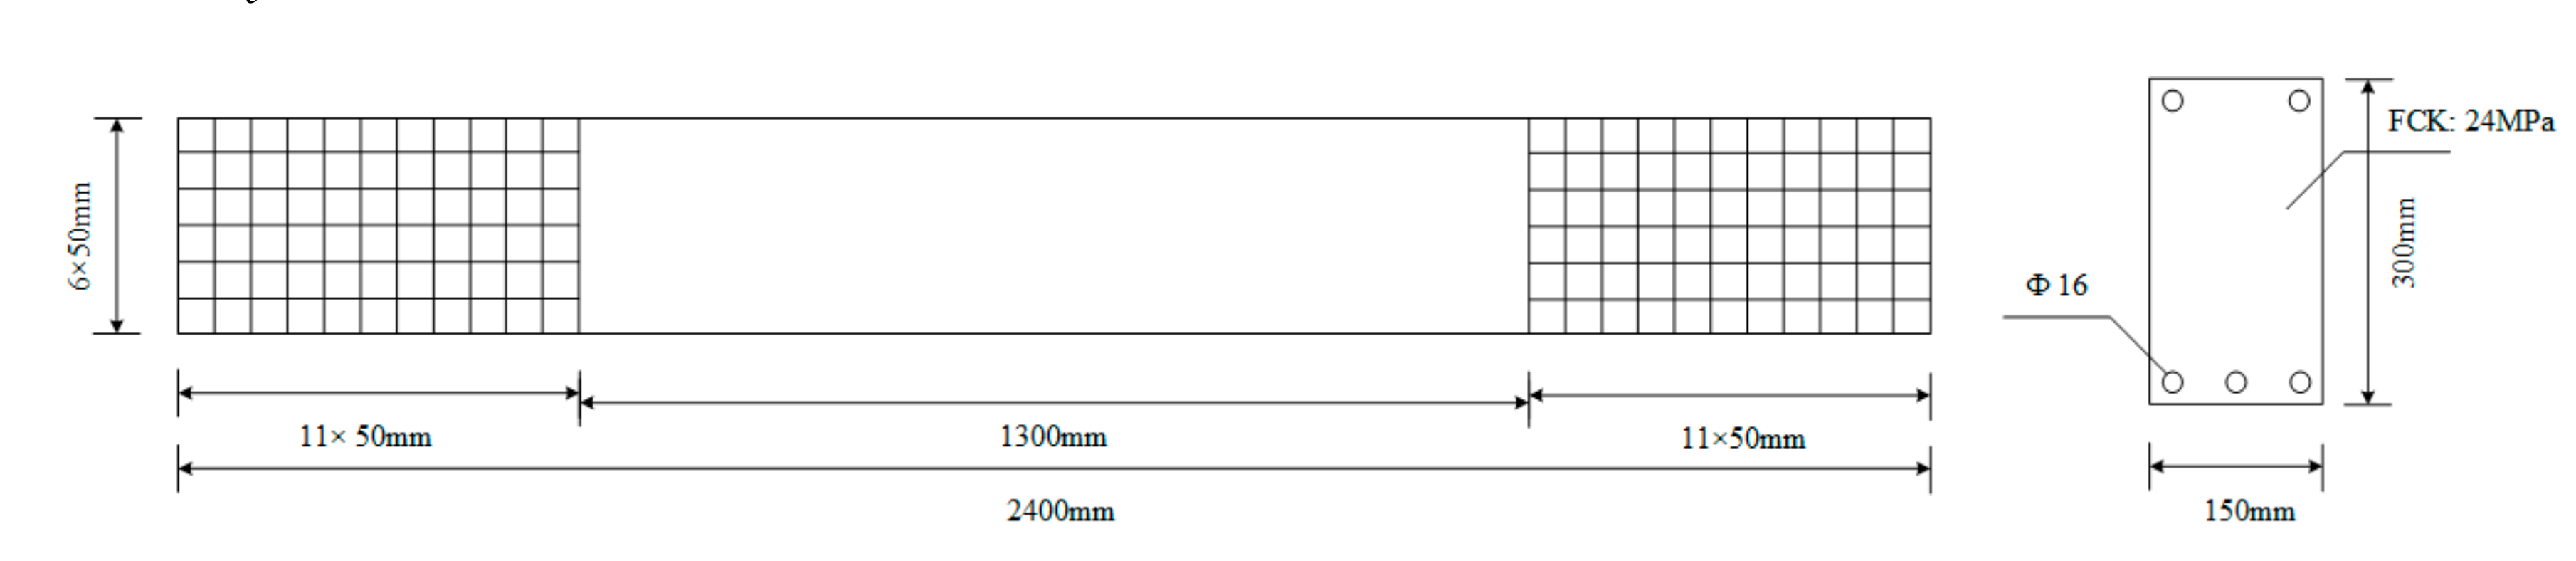
In this study, reinforced concrete (RC) beams with the same specifications were fabricated in a laboratory environment to use for fracture characterization in concrete. The length, height, and width of these RC beams are 240 cm, 30 cm, and 15 cm, respectively. The compressive strength of the RC beams was approximately 24 MPa. Each RC beam was reinforced by five reinforcing bars, each with diameters of 16 mm (Figure 2). The maximum tensile strength of these RC beams was more than 455 MPa. To facilitate locating the progression of cracks, the RC beams were whitewashed, and grids (50 mm × 50 mm) were marked on two side surfaces of the beams. The schematic diagram of the RC beam is shown in Figure 2.
2.2. Test Setup and AE System
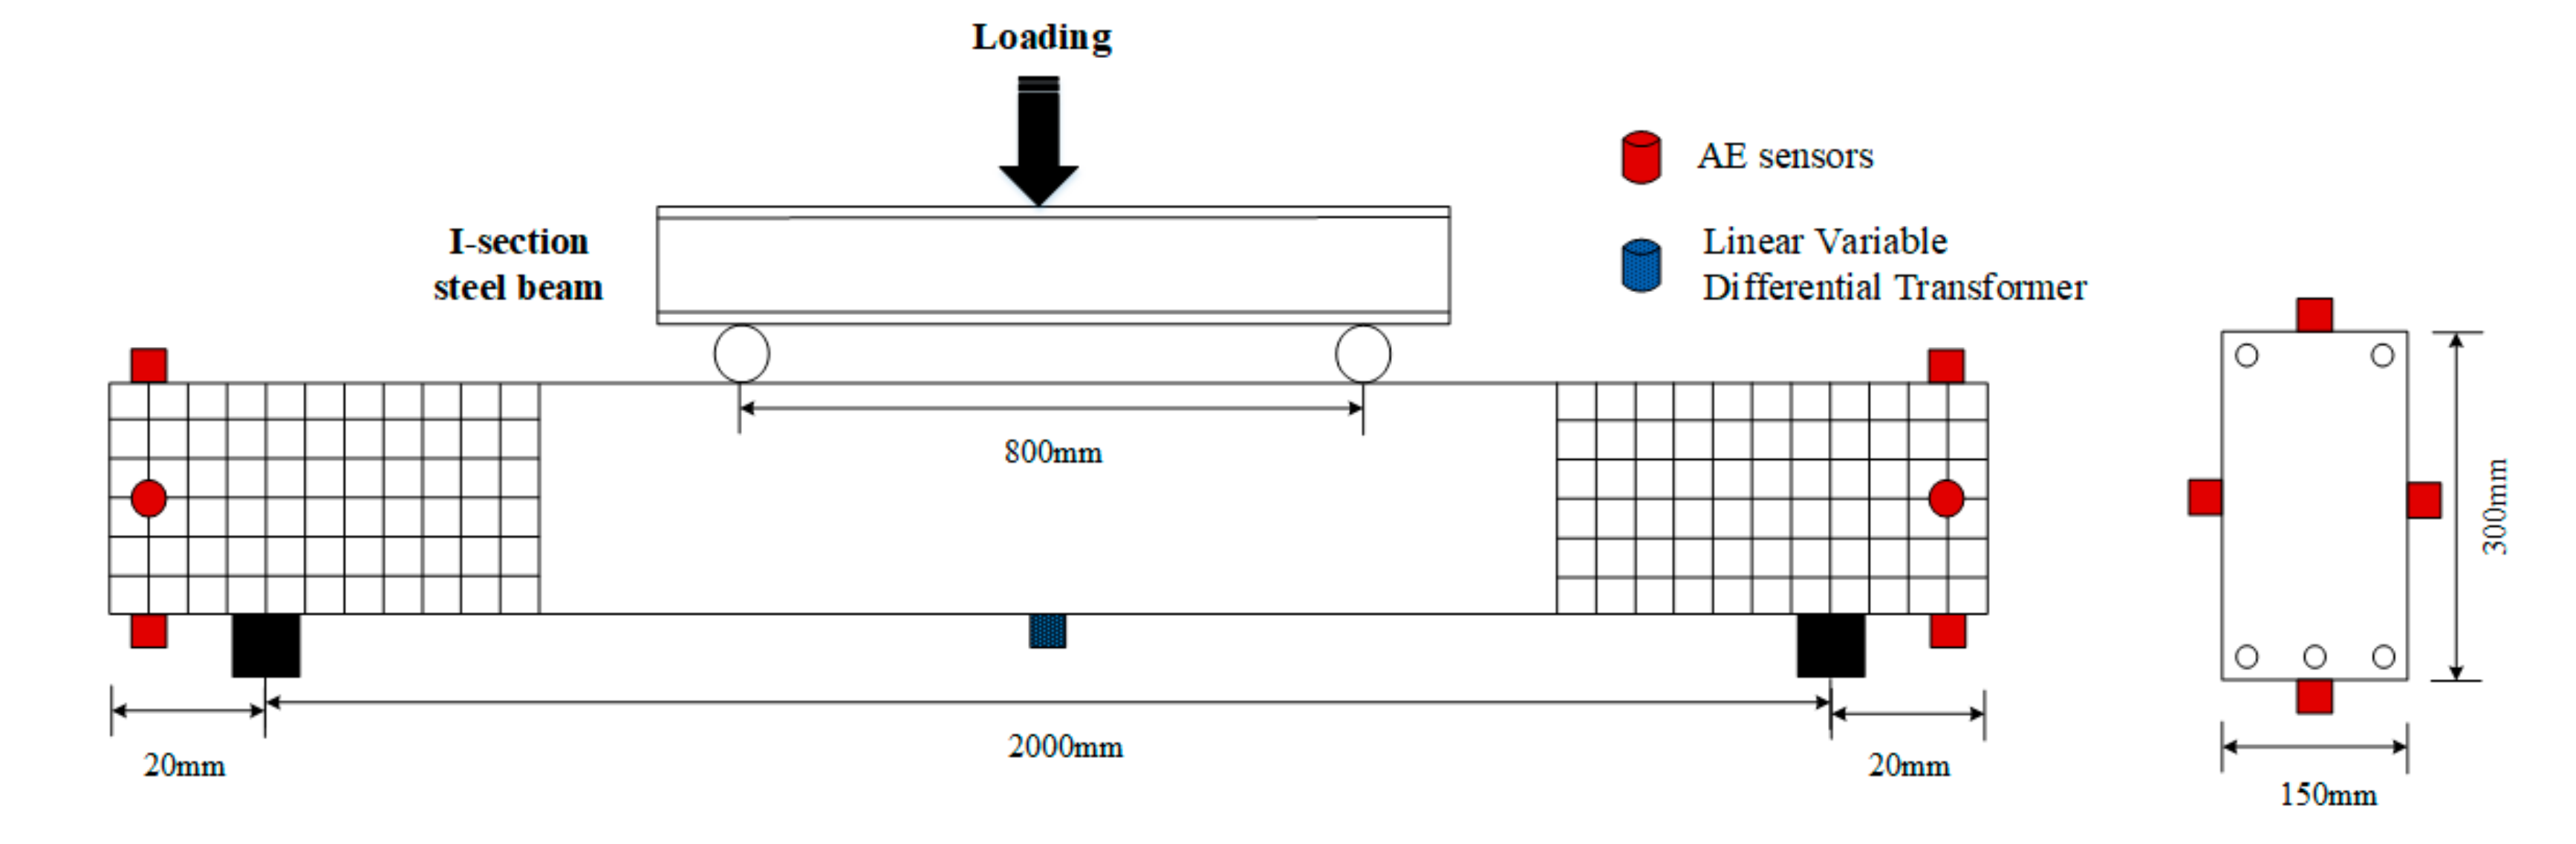
During four-point bending tests, the RC beams were loaded by two equal concentrated loads. The loads were transferred from the actuator through the I-section of a steel beam of that is 80 cm in length with the displacement rate of 1 mm/s and 2 mm/s, according to different bending tests. The center-to-center span between supports is 2000 mm. The schematic diagram and the pictorial illustration of the four-point bending test are depicted as in Figure 3 and Figure 4a. At the bottom surface of the RC beams, a Linear Variable Differential Transformer (LVDT) was placed at the midspan to measure the vertical displacement (Figure 4c).
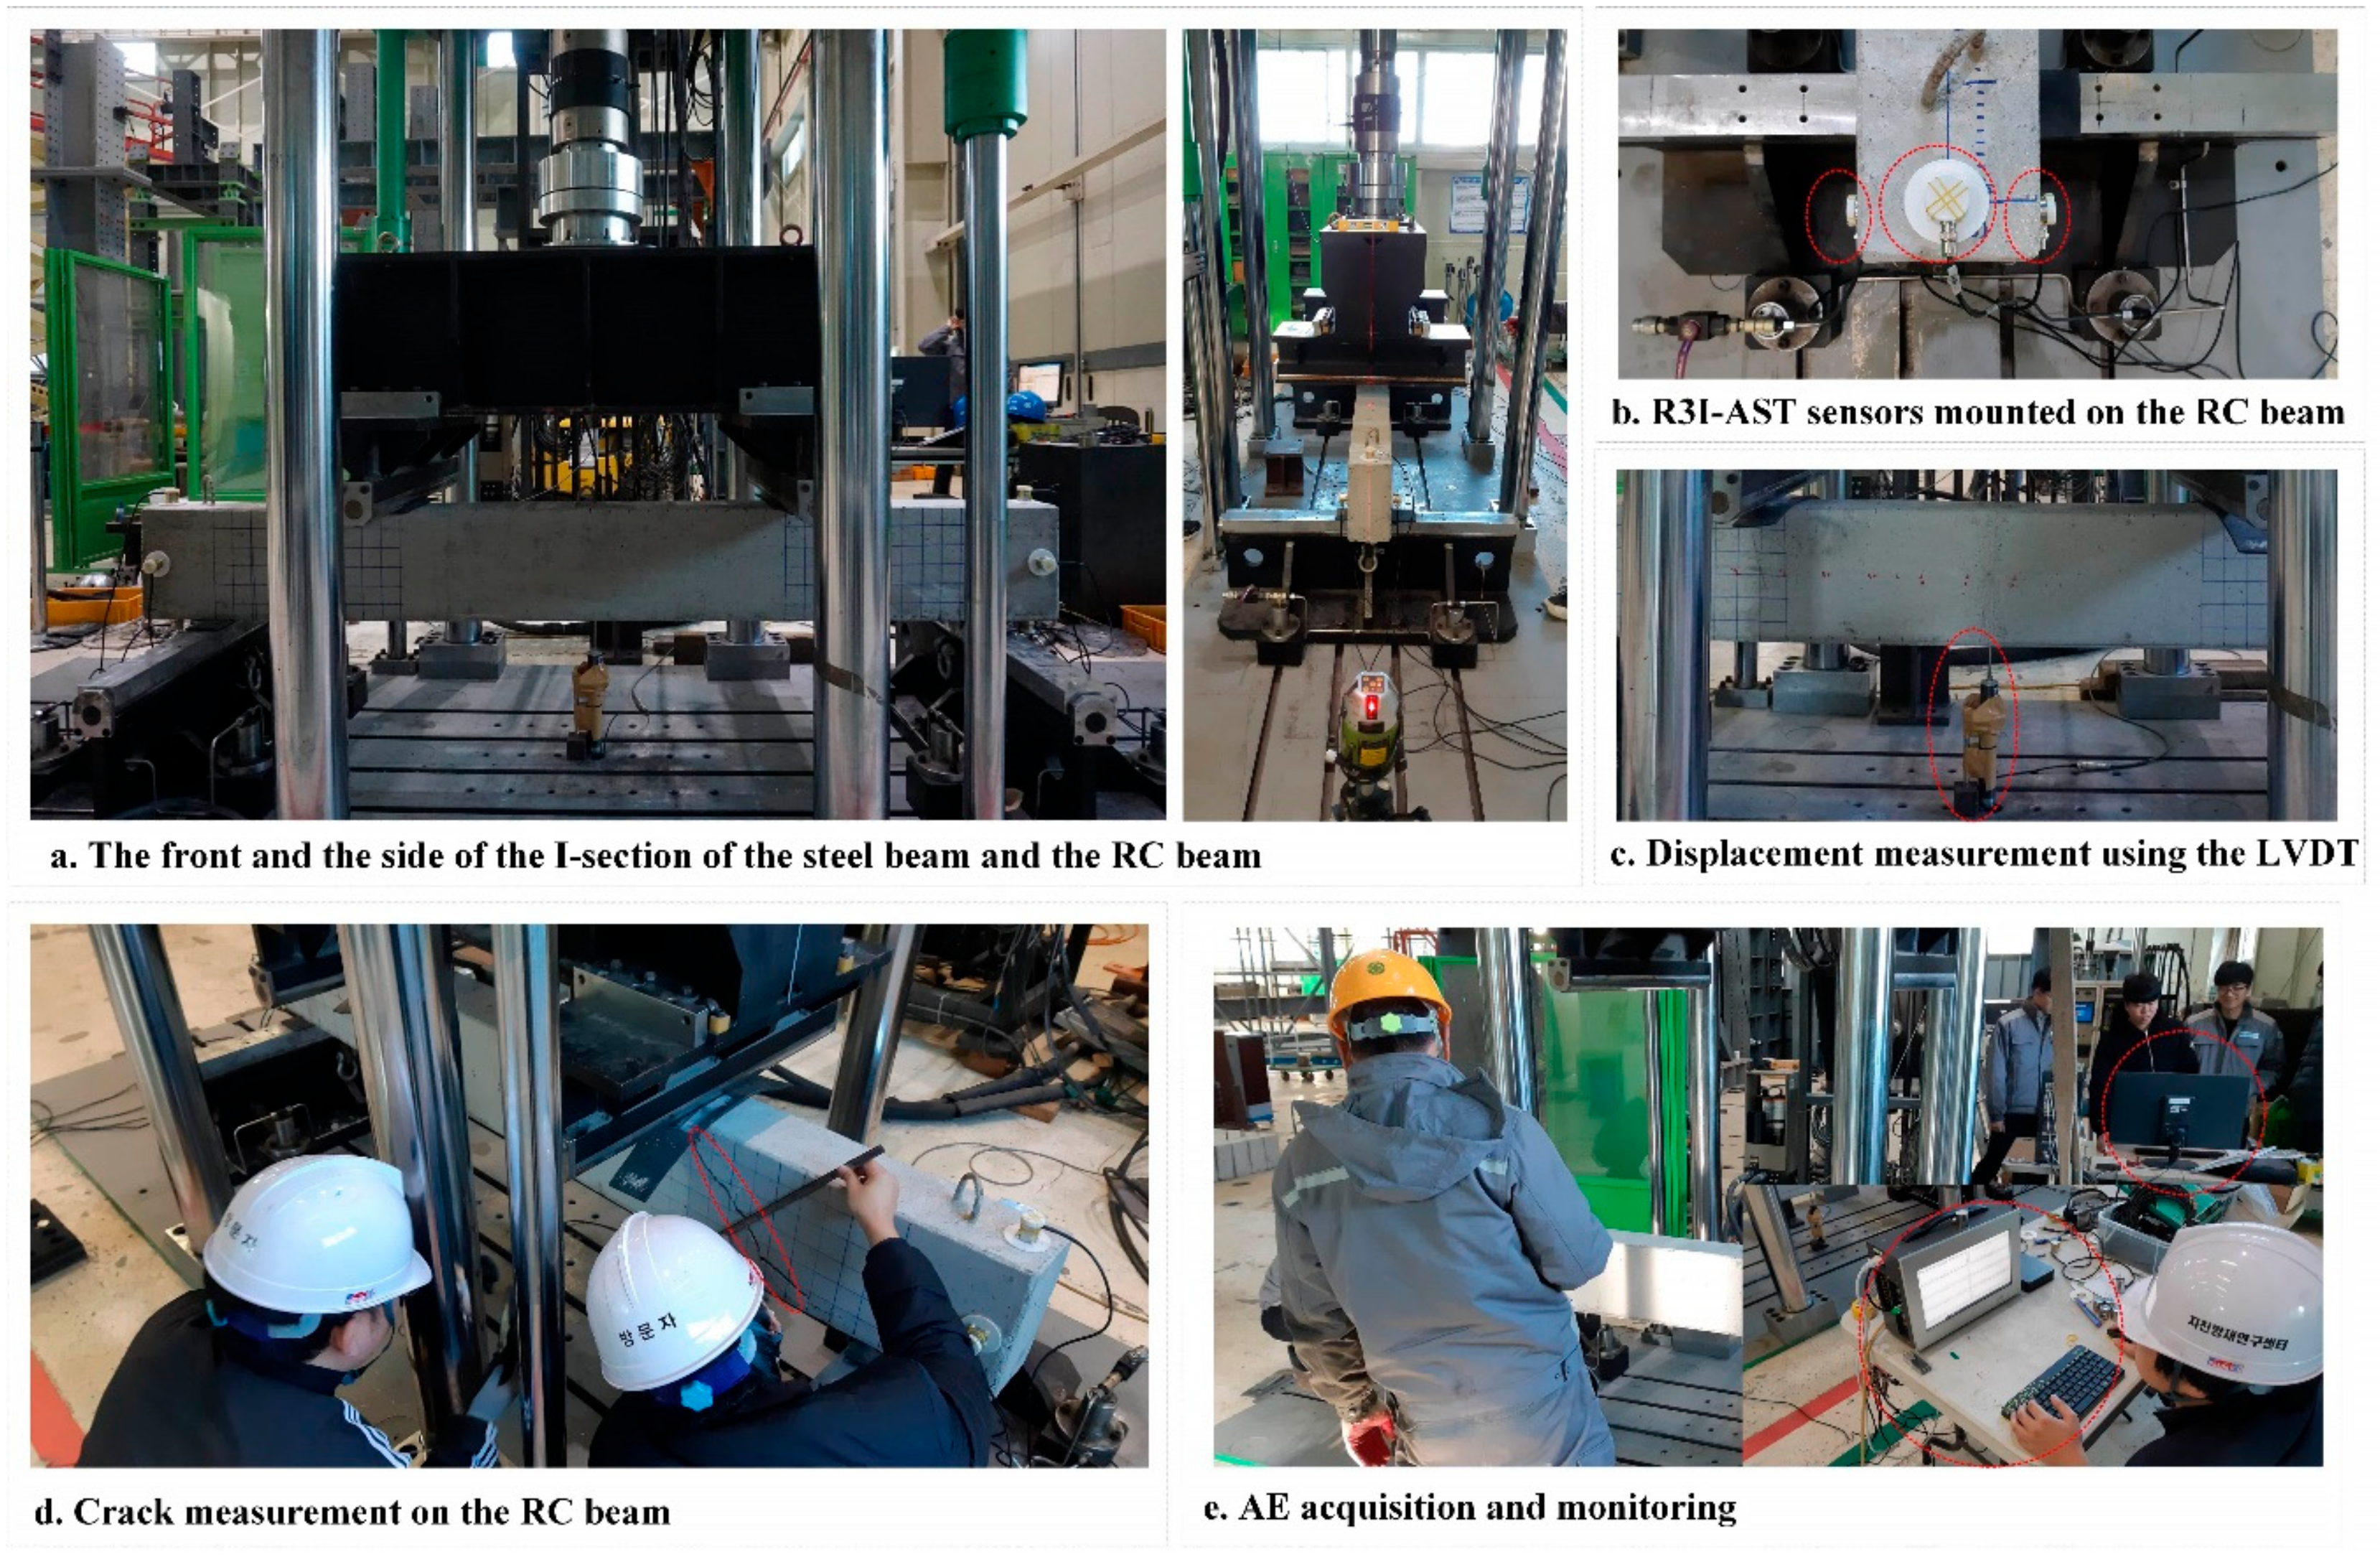
In this study, the AE data was obtained by a PCI-based AE system with eight channels (PCI-8). These high-speed channels offer simultaneous AE data acquisition, waveform processing, and data transfer. The PCI bus enables AE data transfer at speeds of up to 132 Mb/s, at a frequency range of 1 kHz to 400 kHz. To sense the acoustic emission signals in concrete, eight low-frequency AE R3I-AST sensors were surface-mounted on the sides of RC beams using grease as a coupling agent. This type of sensor possesses notable features such as the high sensitivity and the capability to drive long cables without the need for a separate preamplifier. During the data acquisition process, the threshold value of the AE acquisition system was set to be 40 dB to filter out environmental noise and guarantee only AE signals of interest were recorded. The sampling rate was set to 5 MHz to ensure AE data contains the intrinsic properties of concrete. An arrangement for the bending test of RC beams is pictorially shown in Figure 4 and technical specifications of a PCI-8 and R3I-AST sensors are listed in Table 1.
2.3. Separation of Destructive Processes
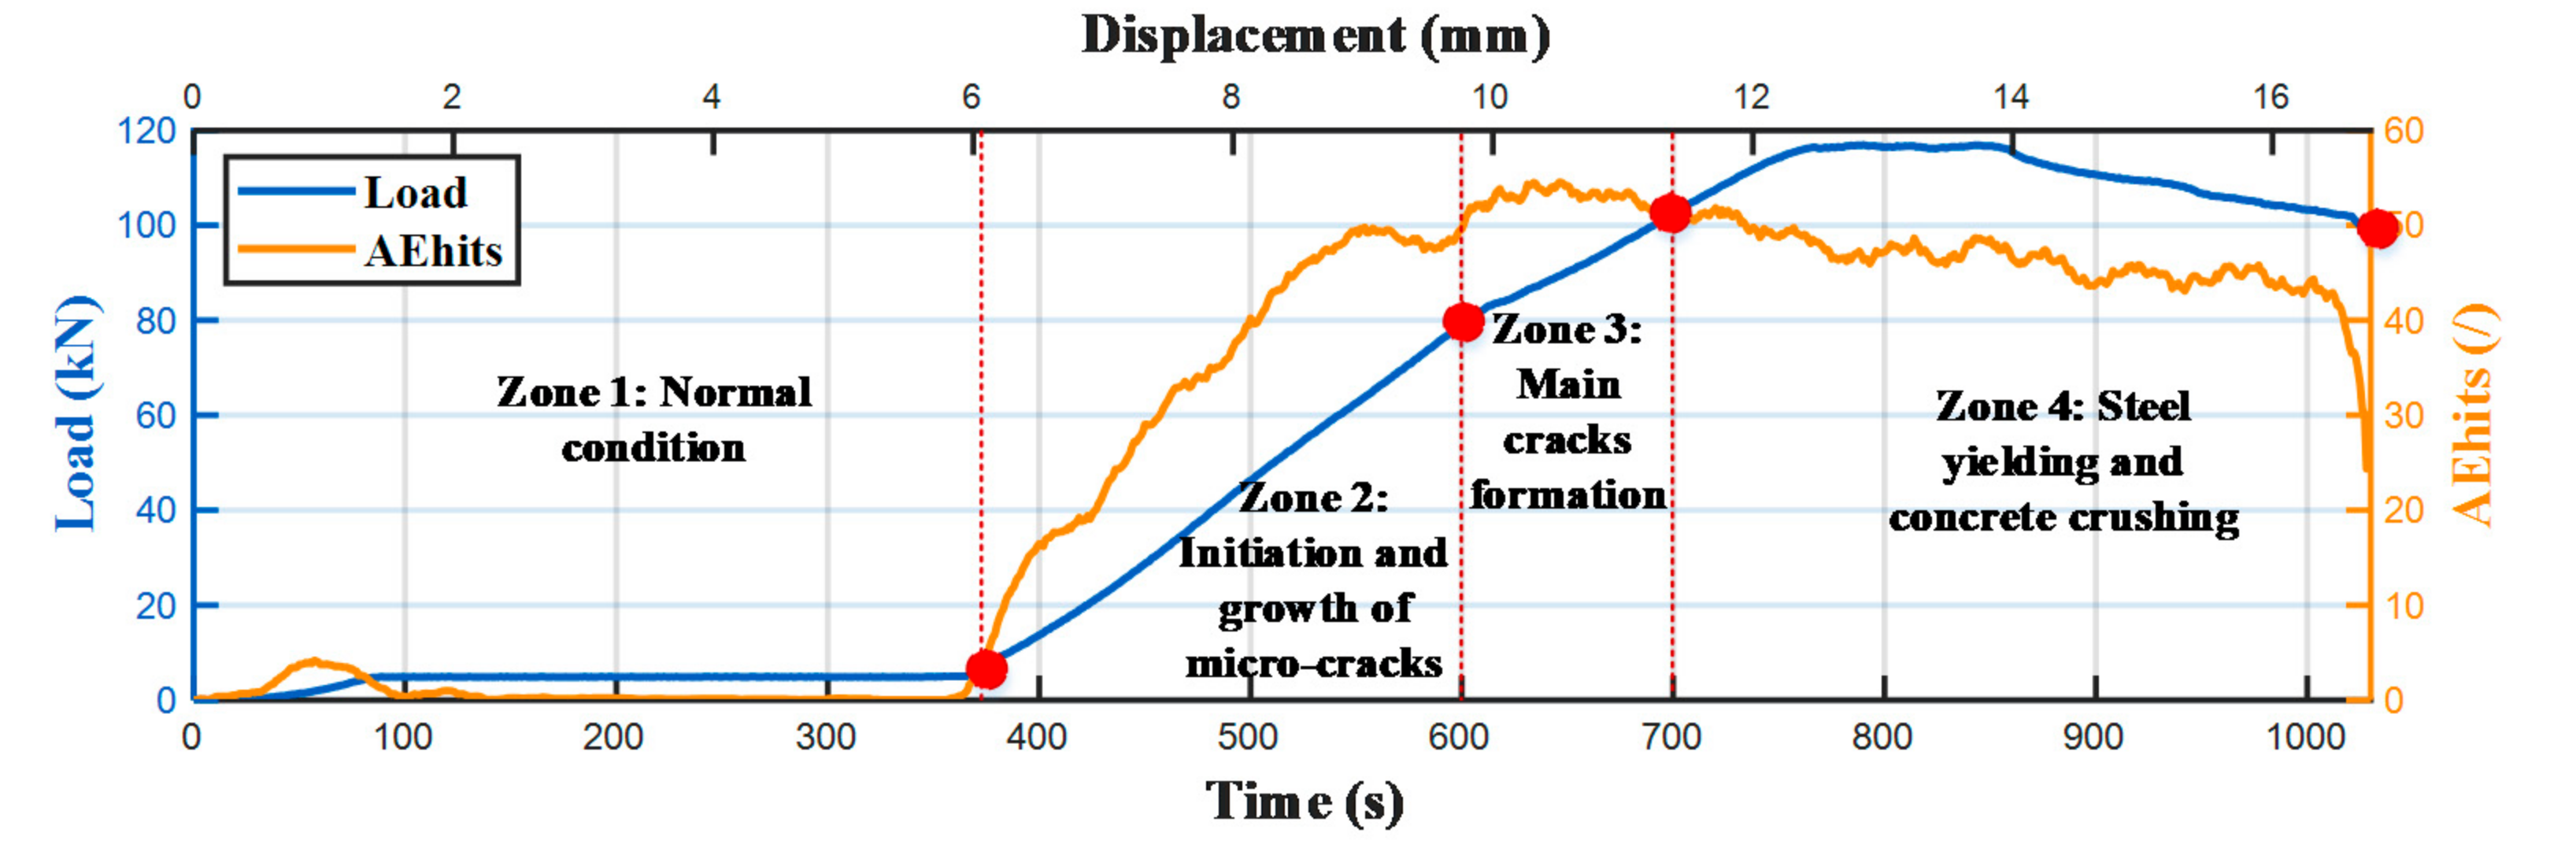
From the observations of cracking growth during bending tests, it is found that the fracture process in concrete can be divided into four damage stages.
Stage 1: In this stage, the RC beam gradually transforms from the normal condition to the damage condition. Some micro-cracks occur at the end of the stage.
Stage 2: Hair-line cracks begin to appear on the surface of the RC beam and develop to macro-cracks.
Stage 3: The formation of main cracks happens. The RC beam undergoes the occurrence of distributed flexural and shear cracks, leading to steel yielding.
Stage 4: The intensification of steel yielding and shear cracks leads to concrete crushing.
The damage stage classification is graphically illustrated as in Figure 5. The left side demonstrates the increase of load applied on the RC beam versus deflection. The right side shows the number of impulses detected every second by sensor 1 during the bending test.
3. Methodologies
3.1. Impulse Detection Using Constant False Alarm Rate (Cfar) Algorithm
Constant false-alarm rate (CFAR) algorithm is a typical data-dependent processing technique originally used in radar systems to find targets in an environment of varying background noise, clutter, and interference. The way this algorithm works is to determine the power threshold that above which any return can be considered to originate from a target.
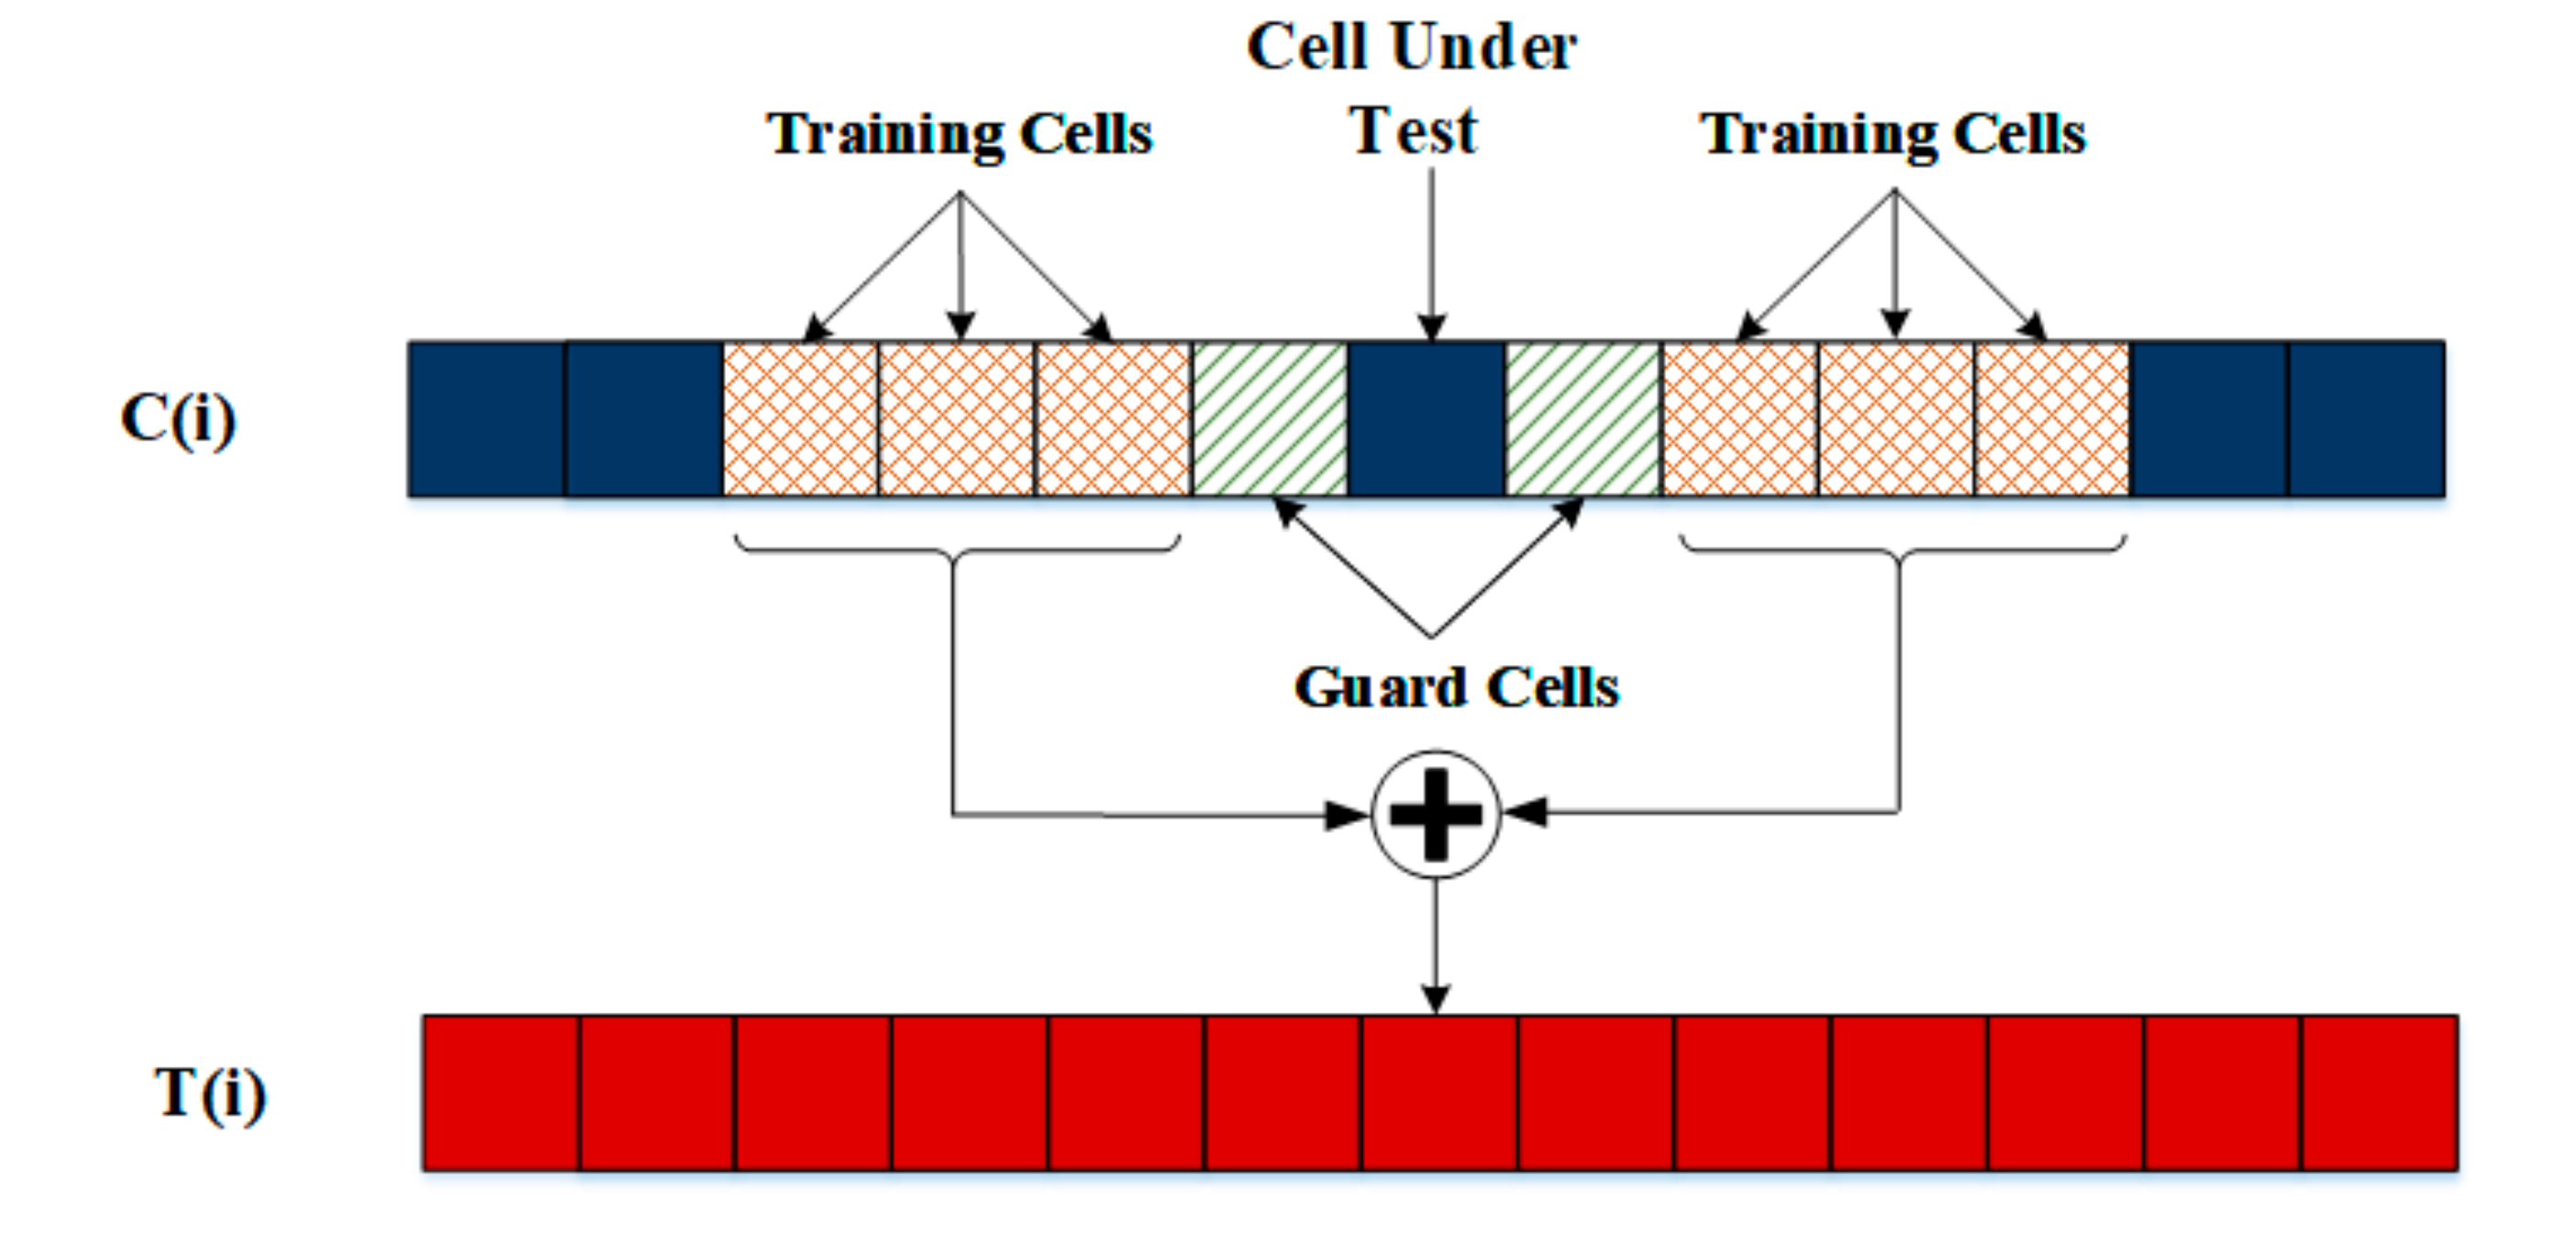
CFAR detection schemes mostly calculate the power threshold by estimating the level of the noise floor around the cell under test (CUT). This can be found by taking a block of cells around the CUT (training cells) and calculating the average power level. To avoid signal components from leaking into the training cell, which could adversely affect the noise estimate, cells immediately adjacent to the CUT are normally ignored (guard cells). The scheme of the CFAR algorithm is described in Figure 6.
This study applied the cell averaging CFAR algorithm to detect AE impulses in concrete due to its stability and robustness in finding targets [18]. First, the detection threshold, T, must be calculated:
where is the noise power estimate for the cell under test and is the threshold factor.
The noise power estimate can be computed as:
where and are the number of training cells and guard cells, respectively. In general, the number of leading and lagging cells are the same. To control the number of targets detected, the threshold factor is used and defined as follows:
where is the desired false alarm rate. If this false alarm rate is high, more targets will be detected but at the expense of an increased number of detected false targets. Conversely, if the false alarm rate is low, fewer targets will be detected, but the number of detected false targets will be low.
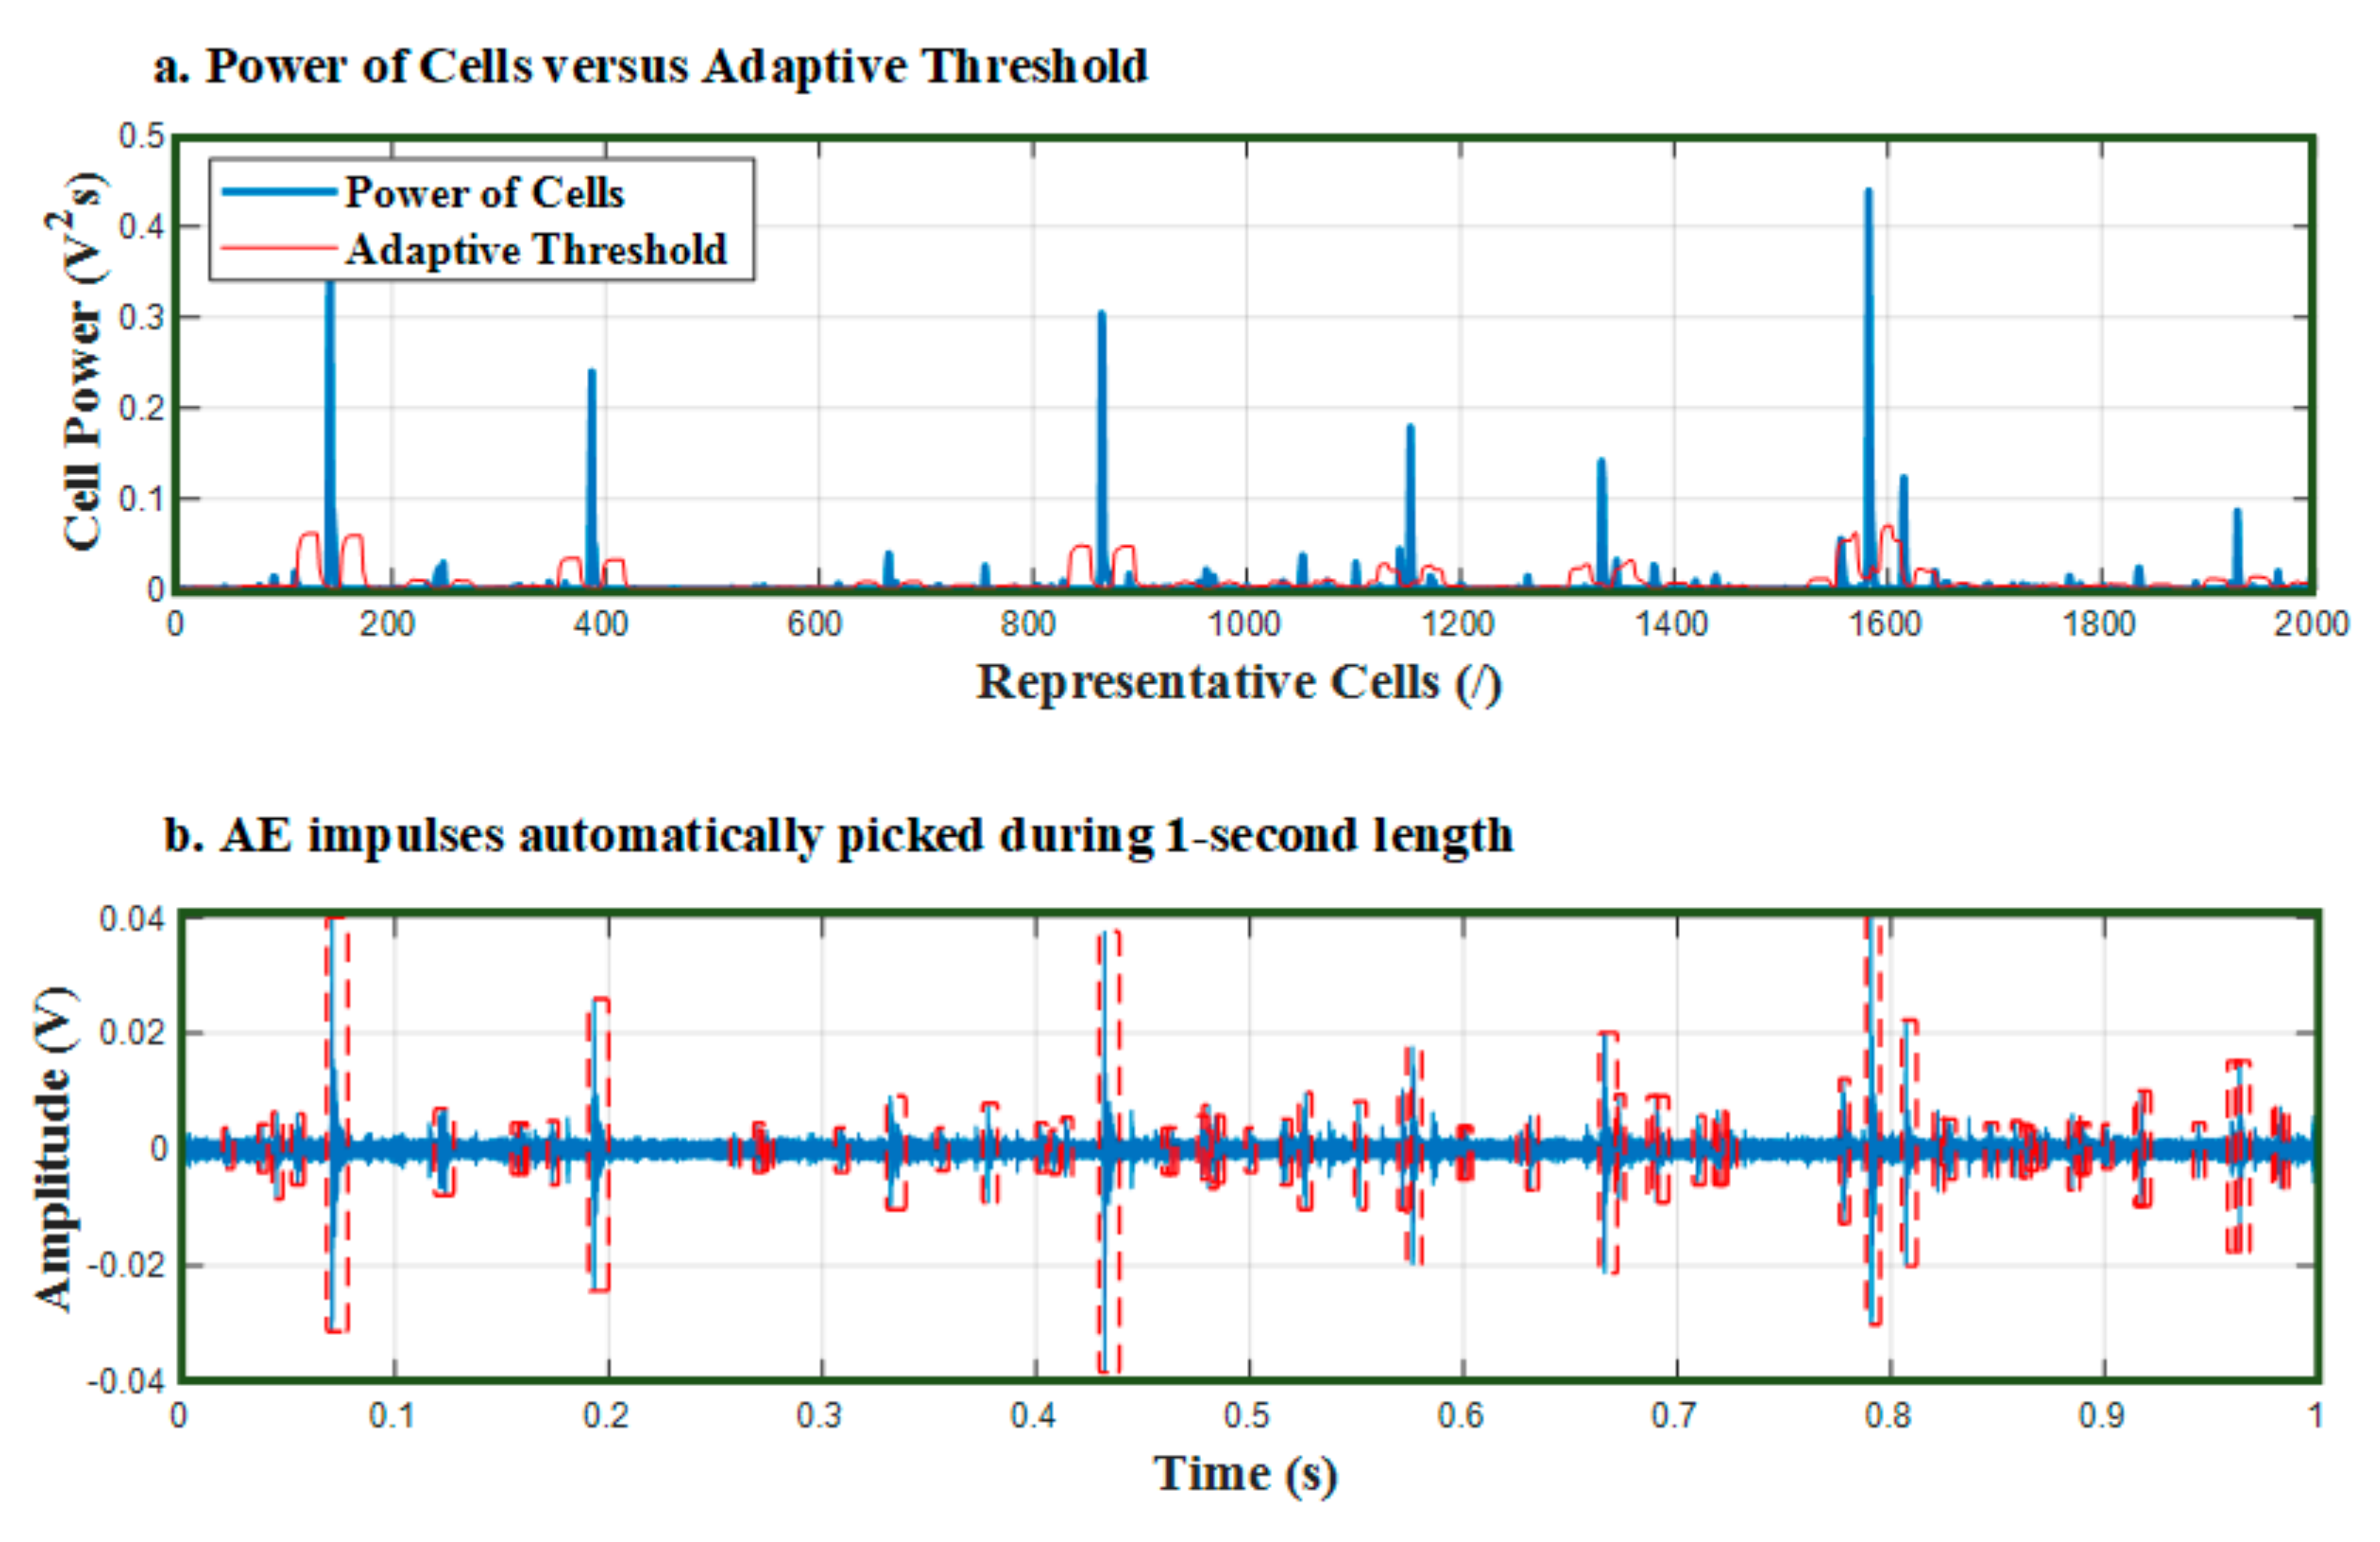
To apply the CFAR algorithm for detecting AE impulses in RC beams, the study divided every 1-s length AE signal into 2000 cells for analysis. The number of training cells and guard cells on each side is set to 20 and 10, respectively. For each cell under test, the adaptive threshold is calculated using (2) and (3). If the cell power of the cell under test is higher than its noise power threshold, the cell is considered to contain a target. Figure 7 shows the principle of the algorithm and the result after applying the CFAR detection algorithm for a 1-s AE signal.
3.2. Impulse Correction
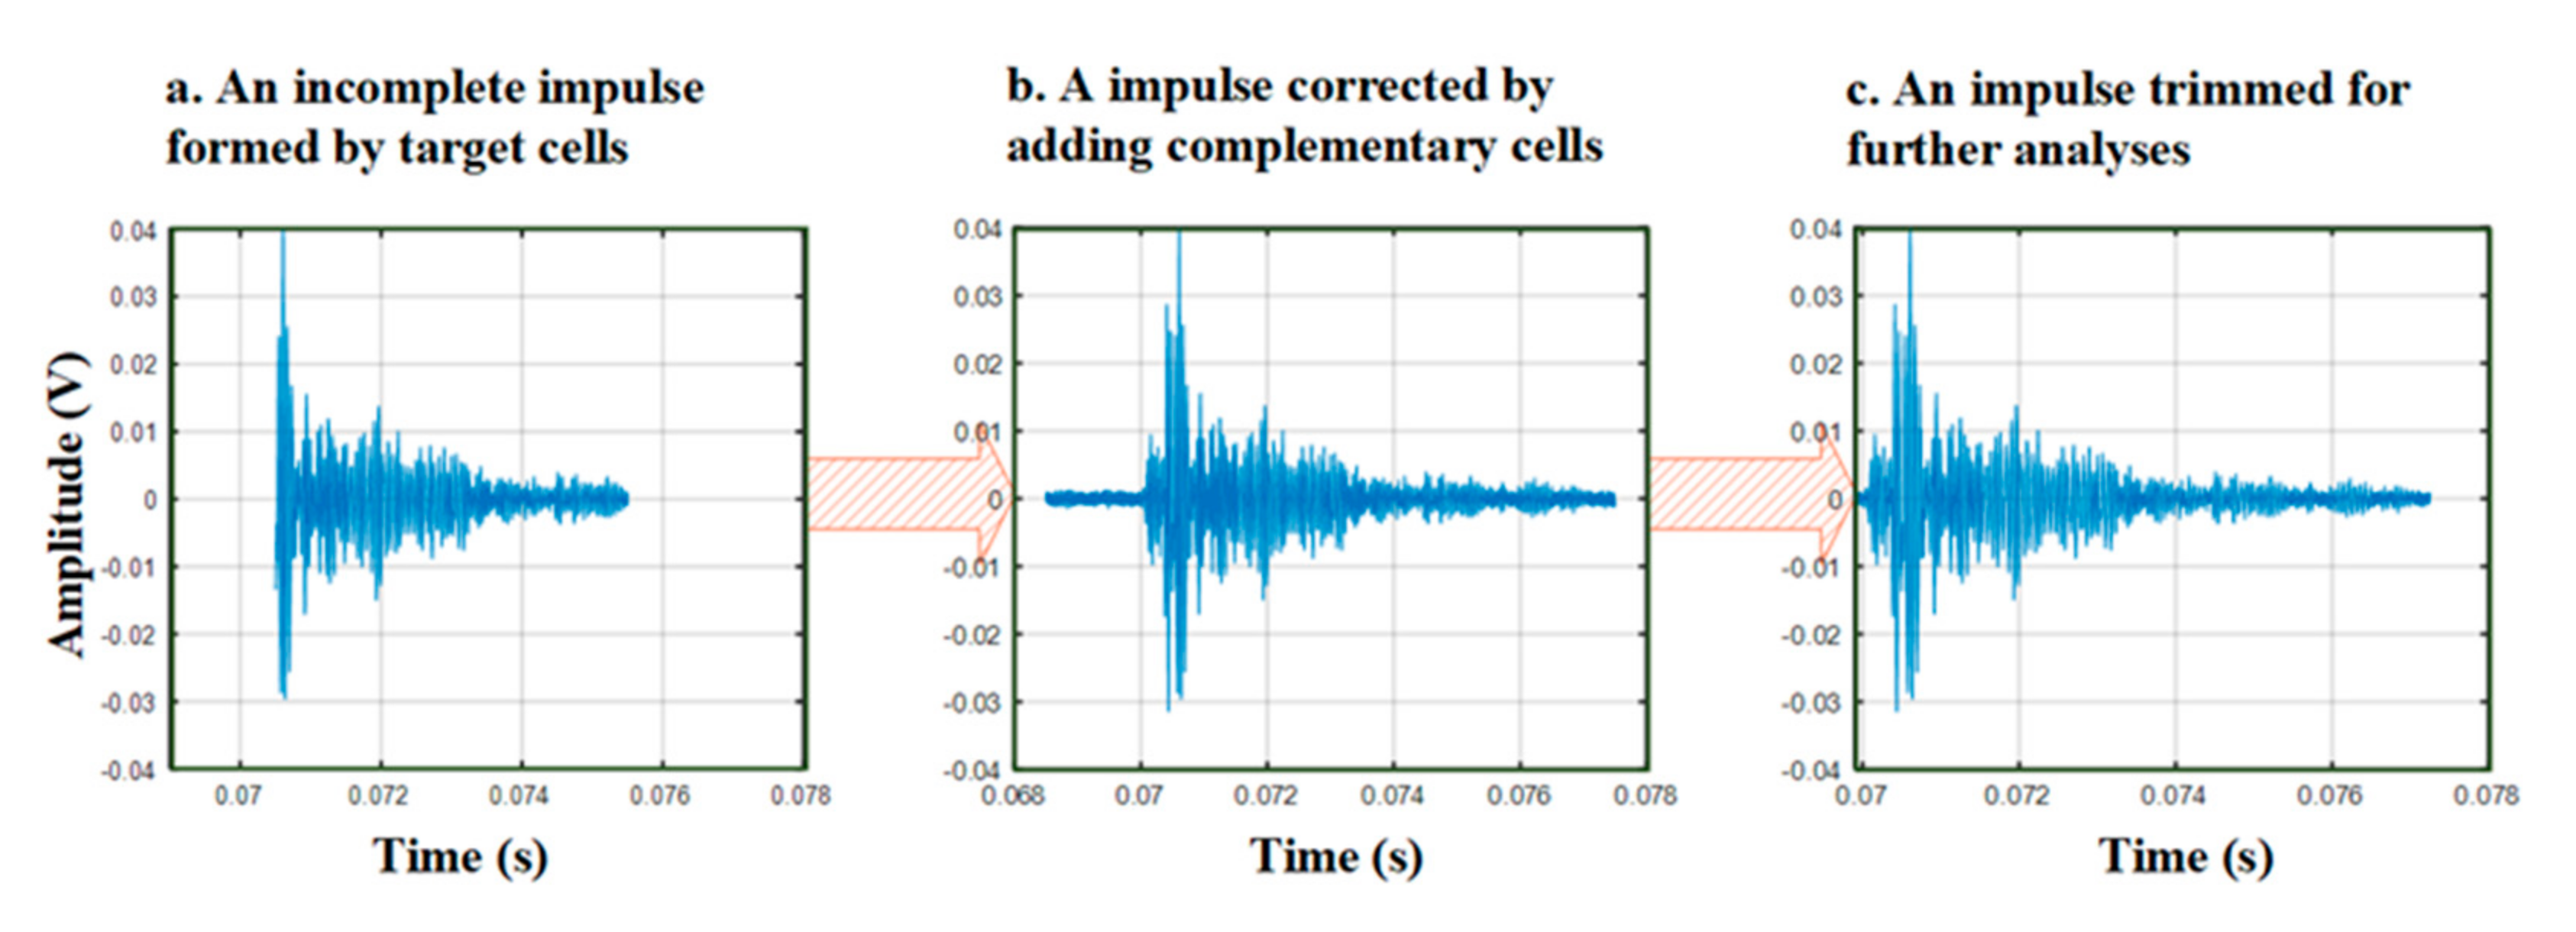
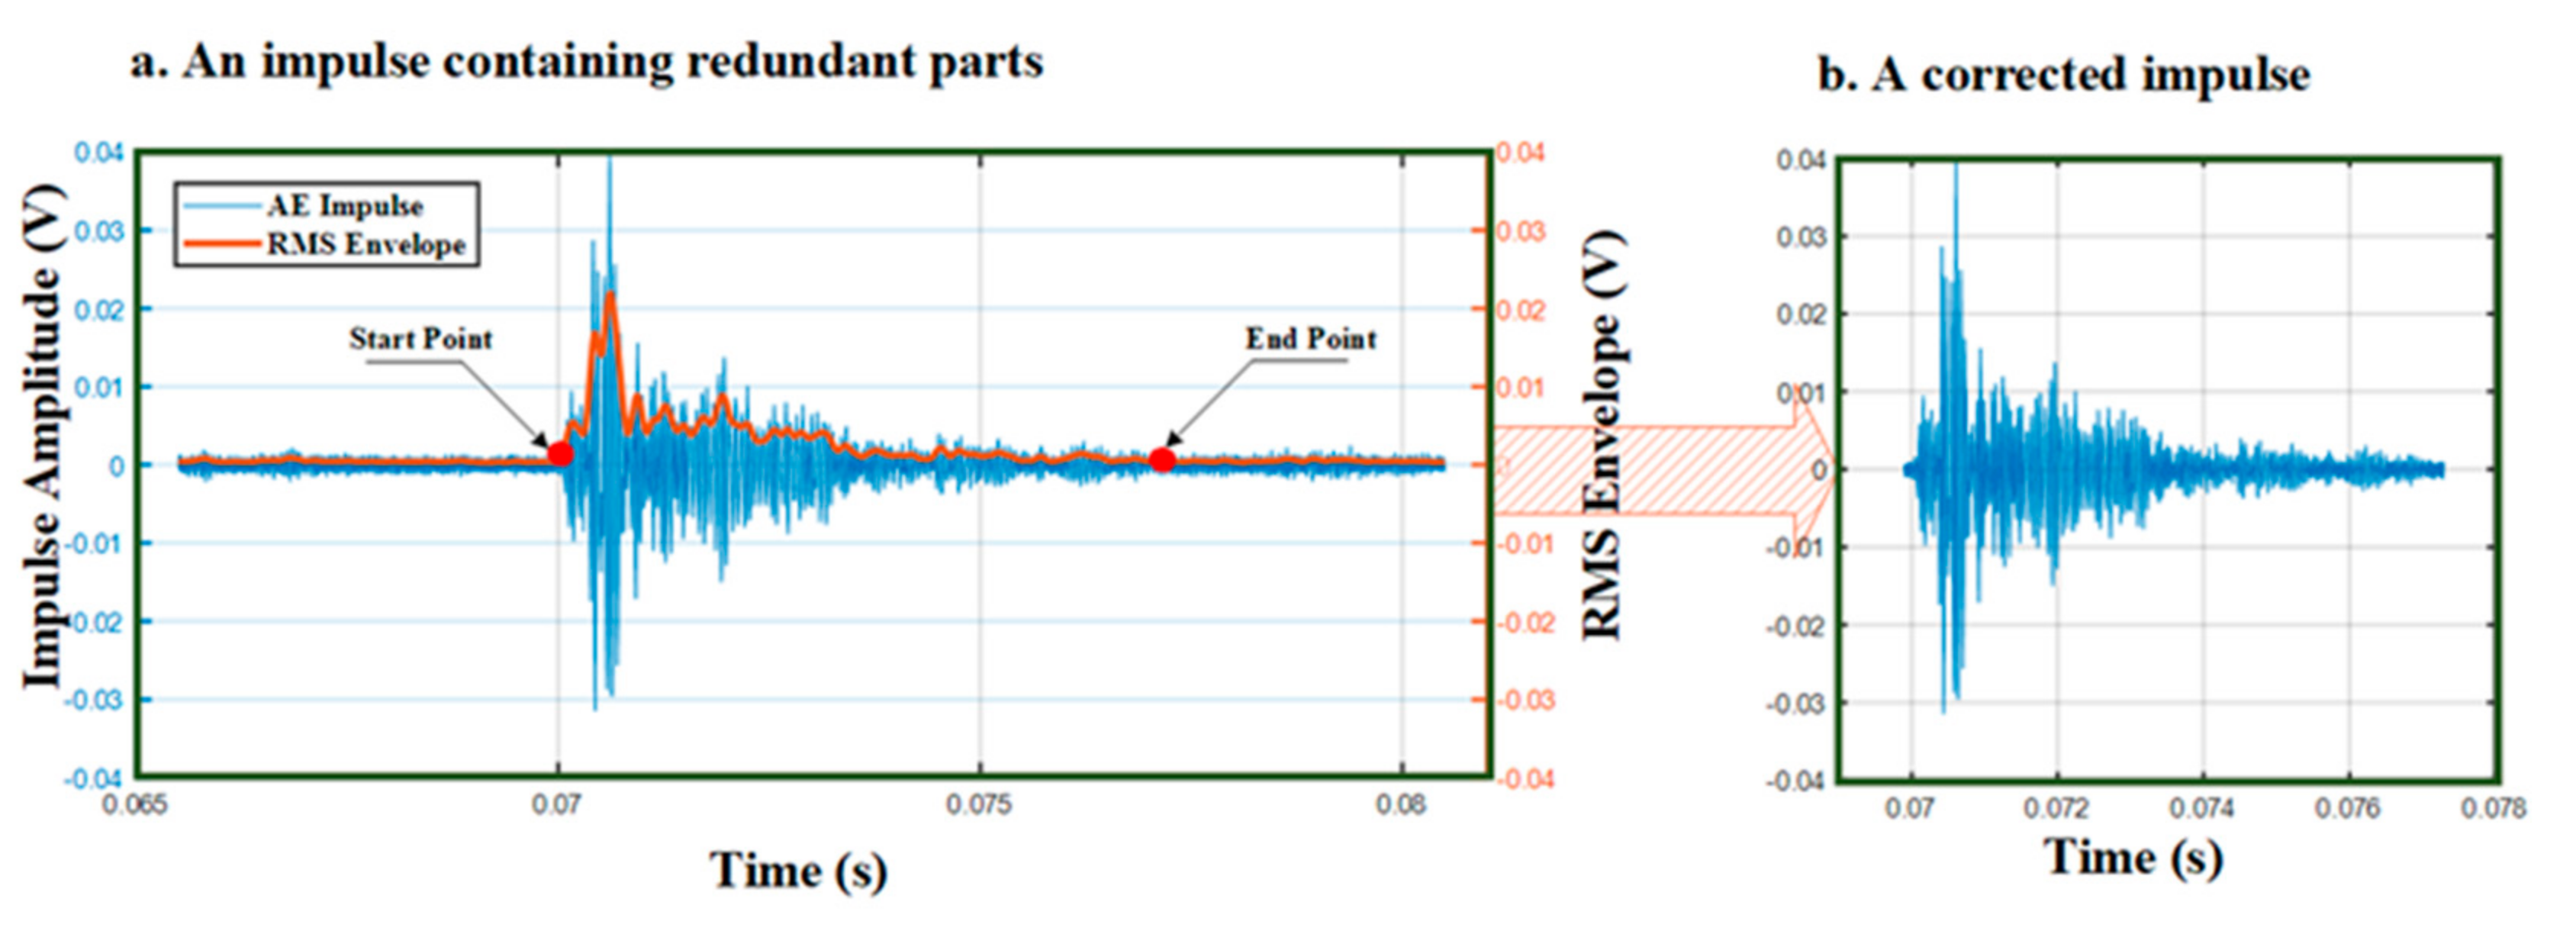
The outcome of CFAR detection is the cells originating from targets or impulses. However, impulses formed by such target cells are usually incomplete. A typical example of an impulse detected by the CFAR algorithm is shown in Figure 8a. This form does not fully cover the parts of an impulse. To cover all the parts of an impulse, the study added adjacent complementary blocks of cells around the initial incomplete impulse. The resulting new form of the impulse shown in Figure 8b. However, it is clear that the impulse should be trimmed afterward to cut its redundant components since such superfluous components certainly lead to miscalculation of the impulse’s parameters such as the rise-time, duration, average frequency, counts, etc. Figure 8c is an example of an expected impulse after being trimmed.
To automatically trim the redundant parts of an adjusted impulse, the study proposes an Impulse-Trimming Algorithm (Algorithm 1) that able to automatically detect redundant components or non-impulse components. The details of the proposed algorithm are described as follows:
| Algorithm 1 Impulse-Trimming Algorithm. |
|
Figure 9 shows the application of the impulse-trimming algorithm. The impulse is now correct for further parameter analysis.
4. Analysis and Verification
4.1. The Trend of Important Parameters During a Bending Test
In this study, numerous parameters were listed and studied including amplitude (V), energy (µVs), duration (ms), rise-time (ms), counts (-), peak frequency (kHz), RA value (µs/V) and AF value (kHz). The method to calculate these parameters is illustrated as in Figure 1.
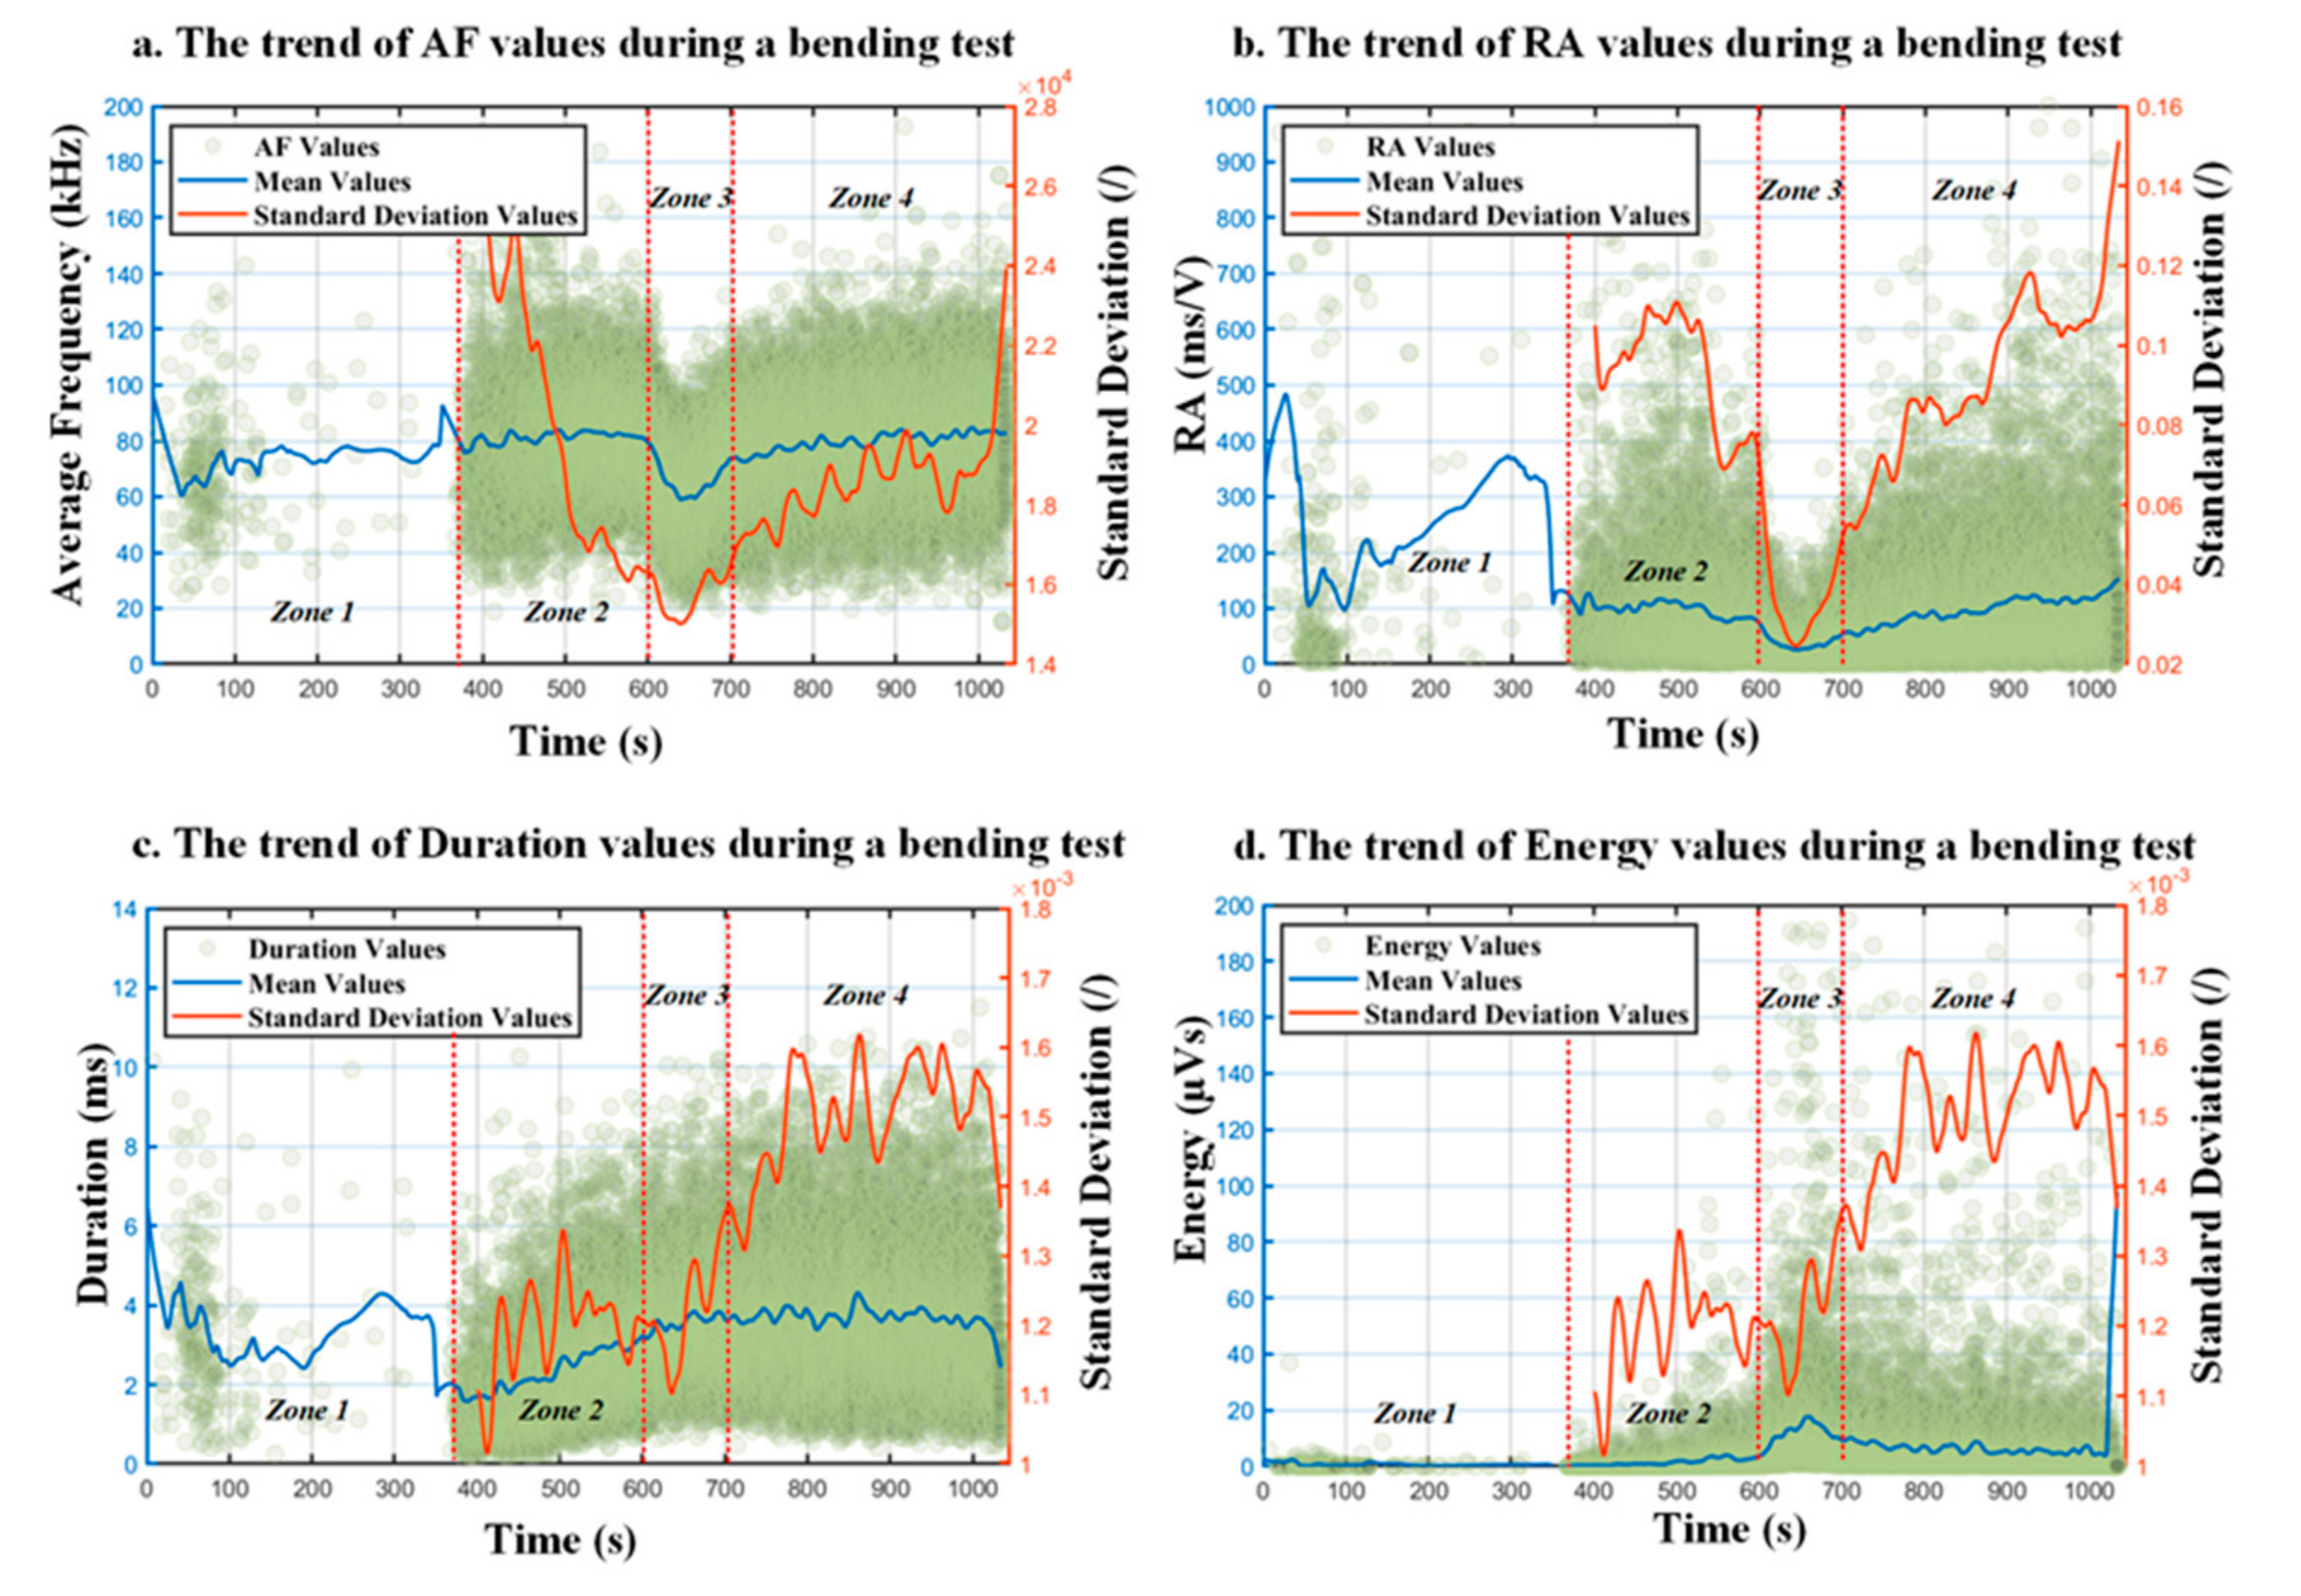
Figure 10 describes the evolutions of some of the parameters versus time. The blue solid line is obtained through the moving average of the recent values calculated for every 1-s AE signal. Meanwhile, the orange solid line is the standard deviation of the recent values calculated for each segmented signal. The dotted lines correspond to the damage zones categorized in Section 2. In zone 1, when a concrete beam is in the normal condition, there is only a small number of detected impulses. The impulses detected in this zone have AF values fluctuating from 20 kHz to 160 kHz and RA values varying from approximately 0 to 1000 ms/V. The energies of these impulses are relatively small, below 10 µVs. In zone 2, the number of collected impulses begins to gradually increase, up to 100 hits/s (Figure 5). Impulses in this zone primarily originate from small matrix cracking events caused by the tensile load at the bottom of the specimen. The AF values and RA values of impulses in this zone have large fluctuations from 30 to 200 kHz and from approximately 0 to 1000 ms/V, respectively. At the stage of the main crack formation (zone 3), the highest rate of incoming AE impulses is recorded, up to 110 hits/s (Figure 5). There are visible cracks on the top and bottom surfaces of an RC beam near the loading points, accompanied by several side cracks. Impulses in this zone have significantly higher energies as compared to the impulses in the other zones. In addition, the AF and RA values of impulses only slightly fluctuate by a small amount. In zone 4, the specimen begins to split into two main pieces and fiber pull-out starts to occur. The characteristic of impulses in this zone is that their duration parameters have higher values than those of the impulses in the other zones. The energies of these impulses are still high but lower than those in zone 3.
4.2. Data-Driven Approach or Concrete Crack Mode Classification
To characterize the damage stages of an RC beam, a new method based on a data-driven approach is proposed. Specifically, the classification model uses feature vectors to learn and characterize the state of the RC beam. Each feature vector is a set of features calculated from the parameters obtained in every 1-s interval. A Mean of Energy feature, for example, is calculated by averaging energy values of impulses picked in a 1-s segmented signal. While an STD of Energy feature is determined by measuring the amount of variation of a set of these energy values. (Figure 10d).
To form a feature vector, a representative pool of 16 features was computed, including the Mean Of Average Frequency, Mean Of Peak Frequency, Mean Of Duration, Mean Of Counts, Mean Of RA, Mean Of Amplitude, Mean Of Rise-Time, Mean Of Energy, STD Of Average Frequency, STD Of Peak Frequency, STD Of Duration, STD Of Counts, STD Of RA, STD Of Amplitude, STD Of Rise-Time, and the STD Of Energy. In addition, a Cumulative AE-hits feature, which is the number of impulses occurring in every 1-s segmented signal, and a Cumulative Energy feature, which is the cumulative energy value of these impulses, are also listed and studied since these two features reflect the damage initiation and accumulation in concrete.
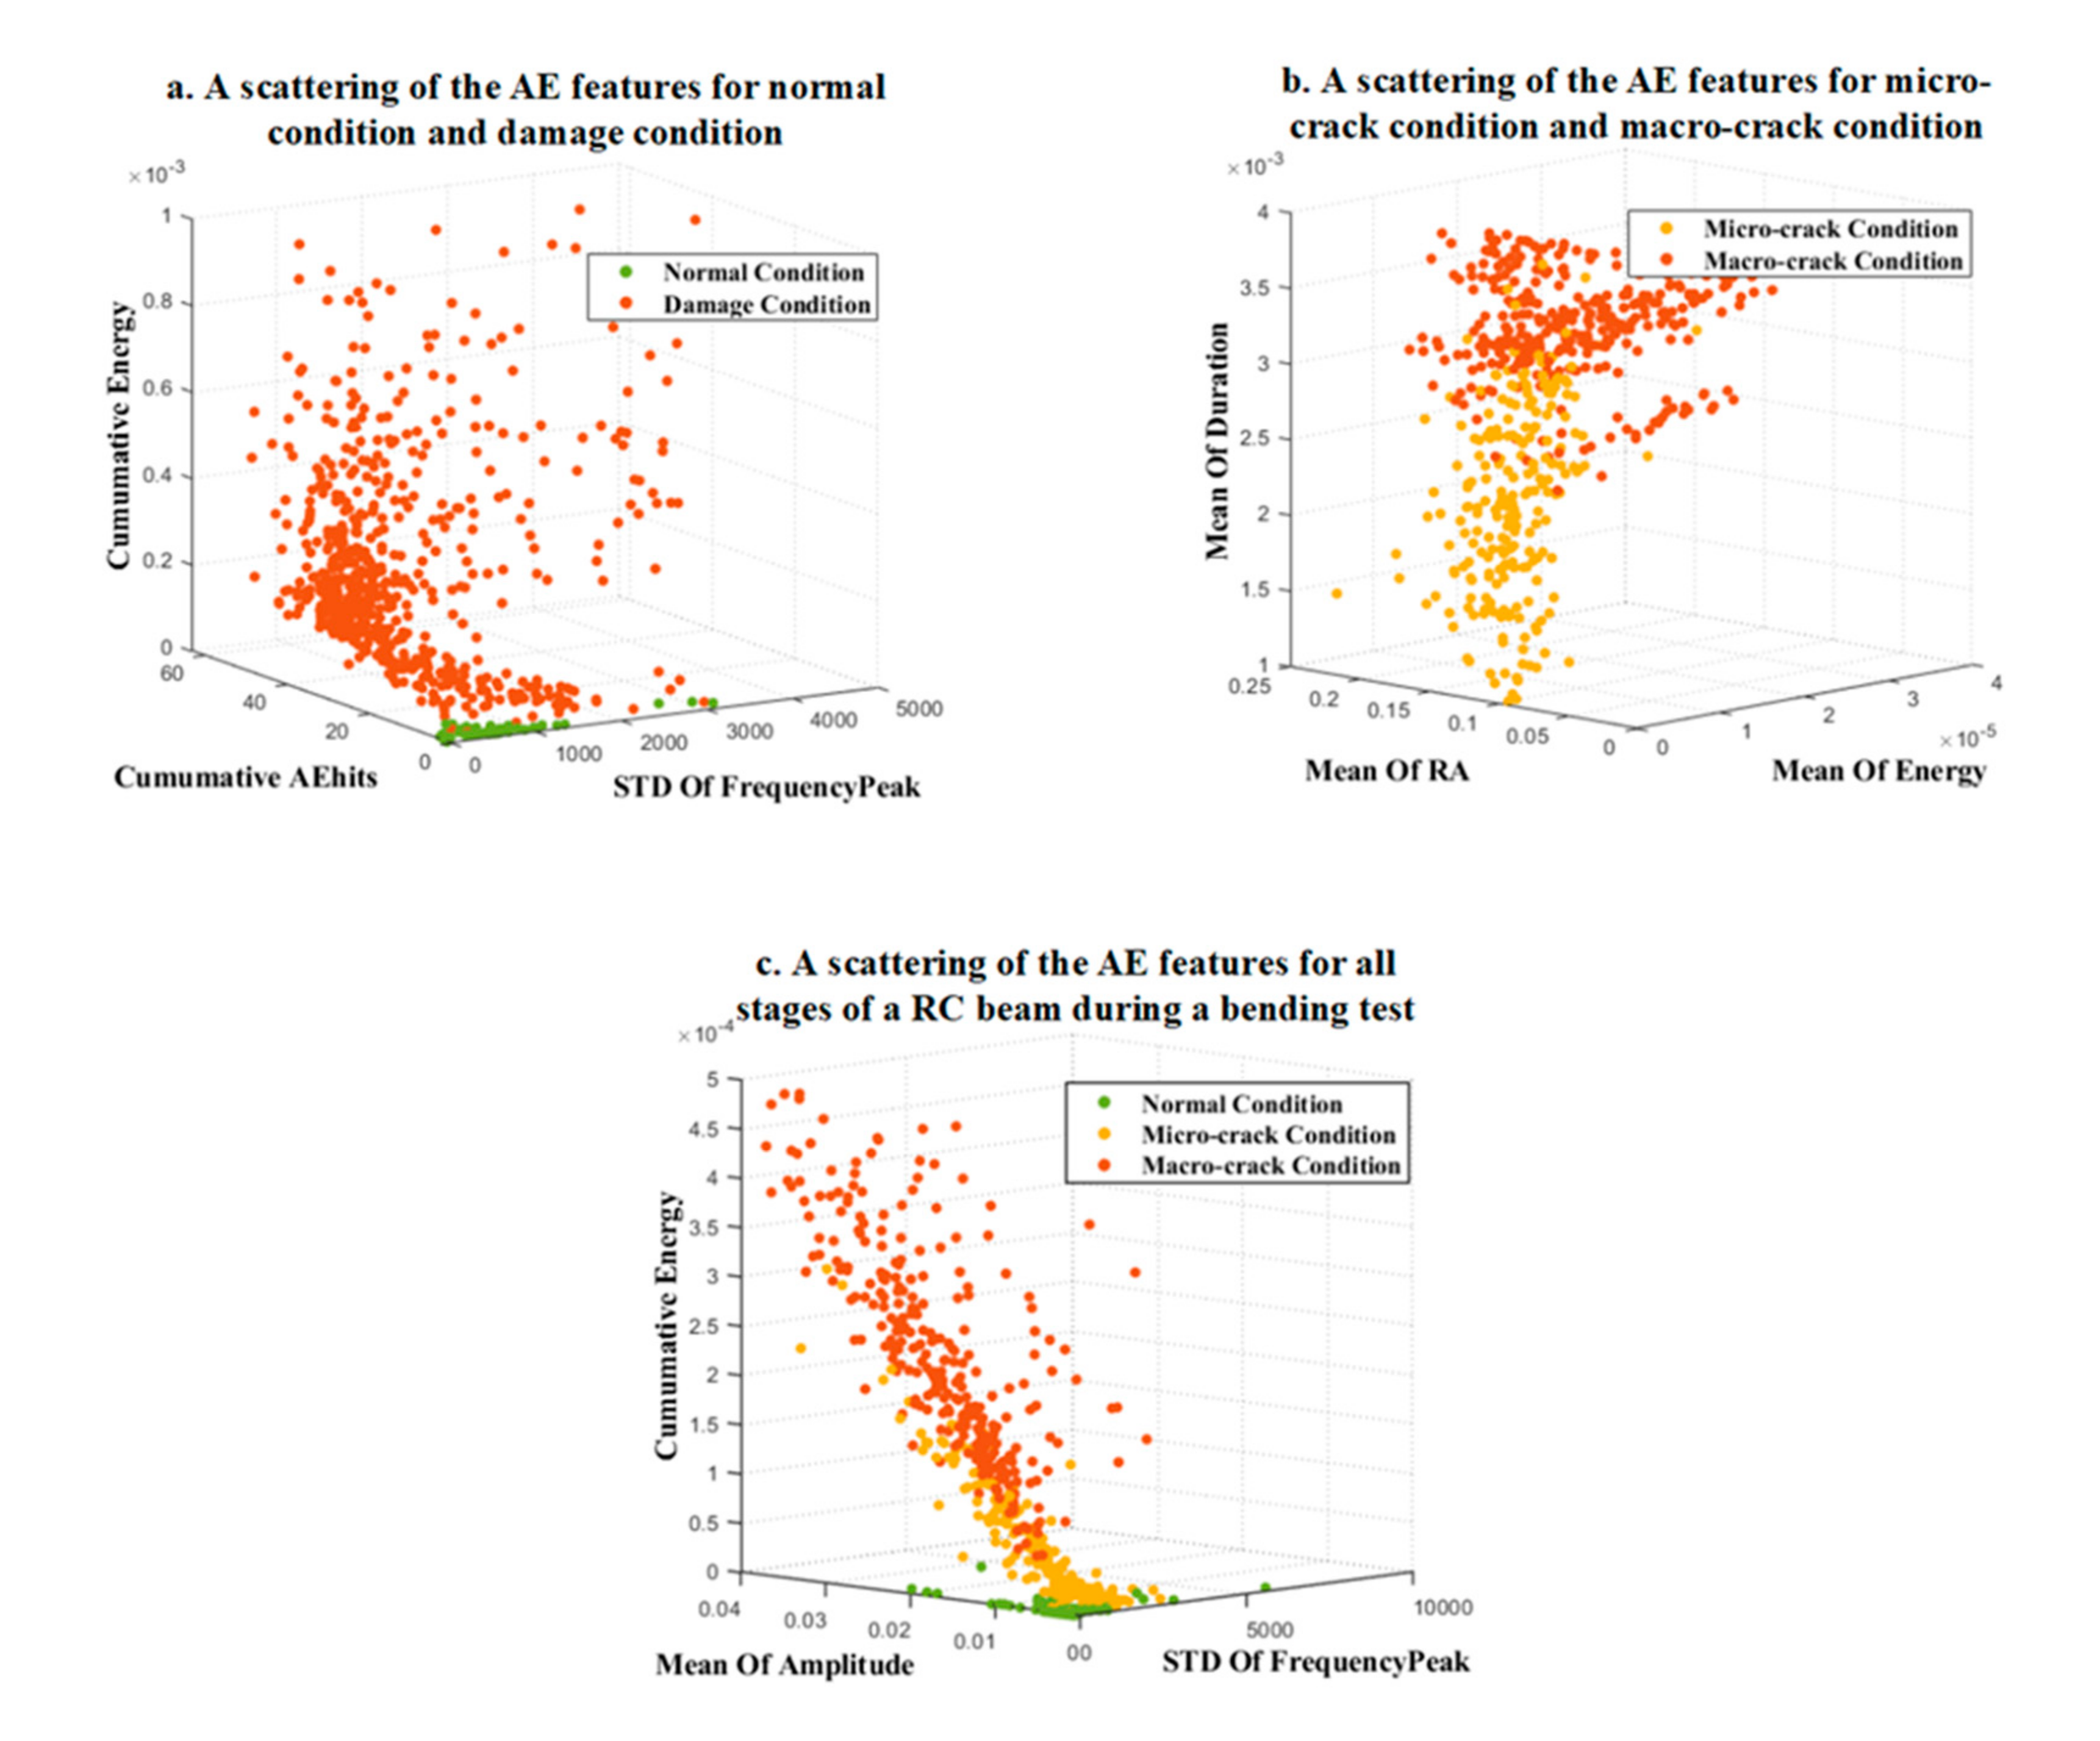
The bending test in this study lasted around 1030 s, so the number of feature vectors used to train and test a characterizing model is 1030. This dataset was divided into three sub-datasets, representing three fracture stages of concrete structure, accordingly (i.e., the normal stage (zone 1), the micro-crack stage (zone 2), and the macro-crack stage (zone 3 and zone 4). The efficiency of the new approach is demonstrated in Figure 11, as only a few features can fairly categorize the state of the RC beam by representative clusters in a 3-D feature space. The classification between the normal state and the damage stage of the RC beam is relatively easy when some specific features can distinguish these two damage stages into two separate clusters (Figure 11a). Regarding the classification of damage grades, the problem is relatively more complicated when their representative clusters lightly overlap (Figure 11b,c). However, with the help of powerful classifiers such as support vector machine (SVM) or a multi-layer neural network (MLP), the classification problem can be solved comprehensively.
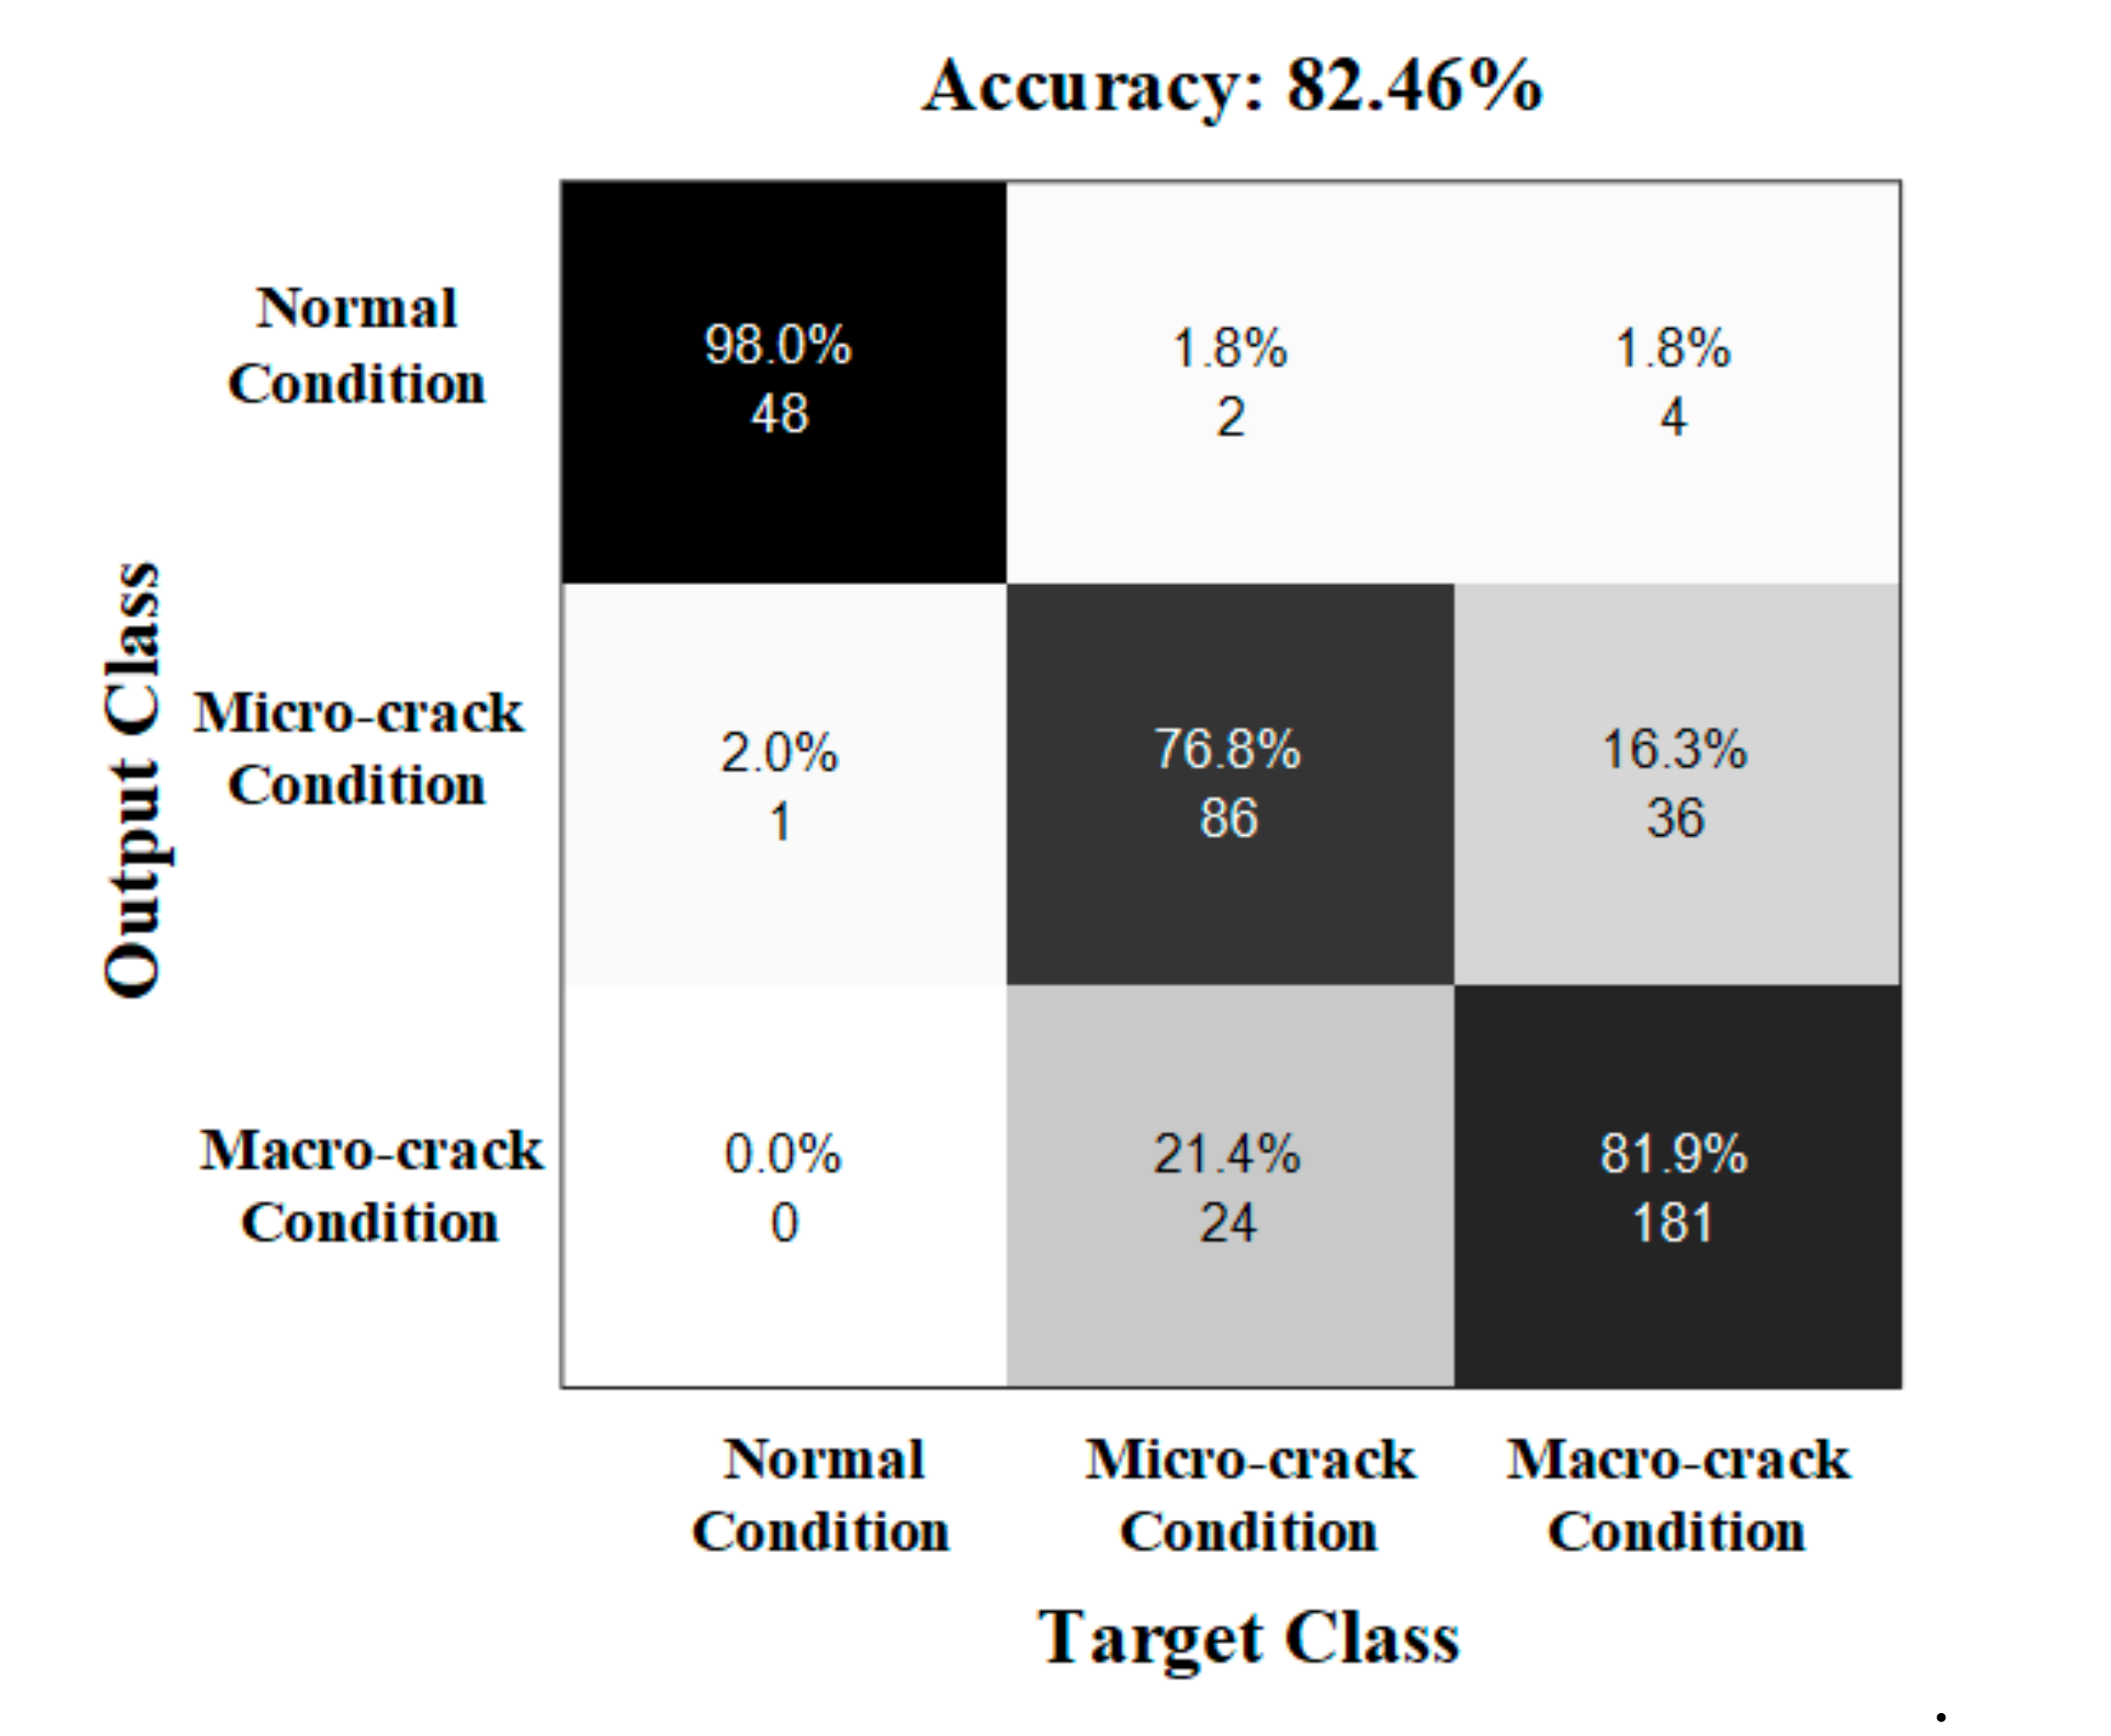
In terms of the qualitative evaluation, to justify the efficiency of the approach, the study used a k-NN-based classifier to categorize the damage states of the RC beam. In this experiment, the dataset of 1030 feature vectors of the three fracture conditions was randomly divided into two parts. One was used to train the classifier and the other was used to validate the performance of the model. To collect the most discriminating features, the study ranked 18 initial features in each vector using the relief algorithm [20,21]. This algorithm works best for estimating the feature importance for distance-based supervised models that use pairwise distances between observations to predict the response as a k-NN. Finally, the top 10 ranked features are used to train the model. The classification result is shown in Figure 12. From the figure, the normal condition is almost exactly categorized from the damage condition. Meanwhile, there is a misclassification between the micro-crack condition and the macro-crack condition, but this ratio is relatively low. The overall accuracy of the model is 82.46%.
5. Conclusions
This paper validated the effectiveness of the proposed concrete-fracture classification model using a data-driven approach. In addition, this study also employed the CFAR algorithm for automatically detecting impulses occurring in AE signals. The parameters of the impulses are calculated for each second. Statistical measurements of these parameters such as mean or standard deviation are considered as features to train and validate the classification model. The experimental results of this study showed a promising outcome for the proposed approach to characterize the damage status in concrete structures.
Author Contributions
Conceptualization, V.T., J.-Y.K., I.J. and J.-M.K.; data curation, V.T., J.-Y.K., I.J.; formal analysis, V.T., J.-Y.K., I.J.; funding acquisition, J.-M.K.; methodology, V.T., J.-Y.K., I.J. and J.-M.K.; software, V.T.; supervision, J.-M.K.; validation J.-M.K.; visualization, V.T.; writing—original draft, V.T.; writing—review & editing, J.-M.K. All authors have read and agreed to the published version of the manuscript.
Funding
This research was supported by a grant(2019-MOIS41-002) from National Demand Customized Life Safety R&D Project funded by Korean Ministry of Interior and Safety (MOIS).
Conflicts of Interest
The authors declare no conflict of interest.
References
- Ohno, K.; Ohtsu, M. Crack classification in concrete based on acoustic emission. Constr. Build. Mater. 2010, 24, 2339–2346. [Google Scholar] [CrossRef]
- Aggelis, D.G. Classification of cracking mode in concrete by acoustic emission parameters. Mech. Res. Commun. 2011, 38, 153–157. [Google Scholar] [CrossRef]
- Aggelis, D.G.; Mpalaskas, A.; Matikas, T. Investigation of different fracture modes in cement-based materials by acoustic emission. Cem. Concr. Res. 2013, 48, 1–8. [Google Scholar] [CrossRef]
- Janeliukstis, R.; Kaewunruen, S. A novel separation technique of flexural loading-induced acoustic emission sources in railway prestressed concrete sleepers. IEEE Access 2019, 7, 51426–51440. [Google Scholar] [CrossRef]
- Guozhen, H.; Bo, Y.; Zan, Y. Damage model test ofprestressed t-beam under explosion load. IEEE Access 2019, 7, 135340–135351. [Google Scholar] [CrossRef]
- Dzaye, E.D.; De Schutter, G.; Aggelis, D.G. Study on mechanical acoustic emission sources in fresh concrete. Arch. Civ. Mech. Eng. 2018, 18, 742–754. [Google Scholar] [CrossRef]
- Behnia, A.; Chai, H.K.; Shiotani, T. Advanced structural health monitoring of concrete structures with the aid of acoustic emission. Constr. Build. Mater. 2014, 65, 282–302. [Google Scholar] [CrossRef]
- Zaki, A.; Chai, H.K.; Behnia, A.; Aggelis, D.G.; Tan, J.Y.; Ibrahim, Z. Monitoring fracture of steel corroded reinforced concrete members under flexure by acoustic emission technique. Constr. Build. Mater. 2017, 136, 609–618. [Google Scholar] [CrossRef] [Green Version]
- Chakraborty, J.; Katunin, A.; Klikowicz, P.; Salamak, M. Early crack detection of reinforced concrete structure using embedded sensors. Sensors 2019, 19, 3879. [Google Scholar] [CrossRef] [PubMed] [Green Version]
- Zaki, A.; Chai, H.K.; Aggelis, D.G.; Alver, N. Non-destructive evaluation for corrosion monitoring in concrete: A review and capability of acoustic emission technique. Sensors 2015, 15, 19069–19101. [Google Scholar] [CrossRef] [PubMed]
- Grosse, C.U.; Finck, F. Quantitative evaluation of fracture processes in concrete using signal-based acoustic emission techniques. Cem. Concr. Compos. 2006, 28, 330–336. [Google Scholar] [CrossRef] [Green Version]
- Shigeishi, M.; Ohtsu, M. Acoustic emission moment tensor analysis: Development for crack identification in concrete materials. Constr. Build. Mater. 2001, 15, 311–319. [Google Scholar] [CrossRef]
- Prem, P.R.; Murthy, A.R. Acoustic emission monitoring of reinforced concrete beams subjected to four-point-bending. Appl. Acoust. 2017, 117, 28–38. [Google Scholar] [CrossRef]
- Soulioti, D.; Barkoula, N.; Paipetis, A.; Matikas, T.; Shiotani, T.; Aggelis, D.G. Acoustic emission behavior of steel fibre reinforced concrete under bending. Constr. Build. Mater. 2009, 23, 3532–3536. [Google Scholar] [CrossRef] [Green Version]
- Lu, Y.; Li, Z.; Liao, W.-I. Damage monitoring of reinforced concrete frames under seismic loading using cement-based piezoelectric sensor. Mater. Struct. 2011, 44, 1273–1285. [Google Scholar] [CrossRef]
- Aggelis, D.G.; Matikas, T. Effect of plate wave dispersion on the acoustic emission parameters in metals. Comput. Struct. 2012, 98, 17–22. [Google Scholar] [CrossRef]
- Aggelis, D.G.; Soulioti, D.; Barkoula, N.; Paipetis, A.; Matikas, T. Influence of fiber chemical coating on the acoustic emission behavior of steel fiber reinforced concrete. Cem. Concr. Compos. 2012, 34, 62–67. [Google Scholar] [CrossRef]
- Richards, M.A. Fundamentals of Radar Signal Processing; Tata McGraw-Hill Education: New York, NY, USA, 2005. [Google Scholar]
- Liu, Y.; Zhang, S.; Suo, J.; Zhang, J.; Yao, T. Research on a new comprehensive CFAR (COMP-CFAR) processing method. IEEE Access 2019, 7, 19401–19413. [Google Scholar] [CrossRef]
- Kononenko, I.; Šimec, E.; Robnik-Šikonja, M. Overcoming the myopia of inductive learning algorithms with RELIEFF. Appl. Intell. 1997, 7, 39–55. [Google Scholar] [CrossRef]
- Huang, M.; Sun, L.; Xu, J.; Zhang, S. Multilabel feature selection using relief and minimum redundancy maximum relevance based on neighborhood rough sets. IEEE Access 2020, 8, 62011–62031. [Google Scholar] [CrossRef]
Figure 1.
AE impulse parameters.

Figure 2.
Schematic illustration of longitudinal section and cross section of the RC beam.

Figure 3.
Schematic illustration of the four-point bending test for the RC beam.

Figure 4.
(a) Four-point bending test, (b) AE sensors, (c) displacement measurement, (d) crack measurement, (e) AE monitoring.
Figure 4.
(a) Four-point bending test, (b) AE sensors, (c) displacement measurement, (d) crack measurement, (e) AE monitoring.

Figure 5.
Damage growth of a RC beam during a bending test.

Figure 6.
A diagram of the CFAR detection scheme.

Figure 7.
The application of CFAR detection for impulse detection.

Figure 8.
The process to determine the correct impulse.

Figure 9.
Application of the impulse-trimming algorithm.

Figure 10.
The trend of some important parameters during a bending test: (a) The trend of AF values during a bending test (b) The trend of RA values during a bending test (c) The trend of Duration values during a bending test (d) The trend of Energy values during a bending test.
Figure 10.
The trend of some important parameters during a bending test: (a) The trend of AF values during a bending test (b) The trend of RA values during a bending test (c) The trend of Duration values during a bending test (d) The trend of Energy values during a bending test.

Figure 11.
A scattering of the AE features: (a) A scattering of the AE features for normal condition and damage condition (b) A scattering of the AE features for micro-crack condition and macro-crack condition (c) A scattering of the AE features for all stages of a RC beam during a bending test.
Figure 11.
A scattering of the AE features: (a) A scattering of the AE features for normal condition and damage condition (b) A scattering of the AE features for micro-crack condition and macro-crack condition (c) A scattering of the AE features for all stages of a RC beam during a bending test.

Figure 12.
Confusion matrix of a k-NN-based fracture classification using a data-driven approach.


Table 1.
Technical specifications of the AE acquisition system.
| AE sensors (R3I-AST) | Peak sensitivity (V/μbar): −28 dB |
| Operating frequency range: 10–40 kHz | |
| Resonant frequency: 31 kHz | |
| Directionality: ±1.5 dB | |
| Gain: 40 dB | |
| Noise Level: <3 µV | |
| 8-channel AE PCI board | 16-bit A/D conversion |
| PCI-bus provides AE data transfer rates up to 132 Mb/sec to a PC computer | |
| 4 High Pass, 4 Low Pass filter selections for each channel. |
© 2020 by the authors. Licensee MDPI, Basel, Switzerland. This article is an open access article distributed under the terms and conditions of the Creative Commons Attribution (CC BY) license (http://creativecommons.org/licenses/by/4.0/).
Share and Cite
MDPI and ACS Style
Tra, V.; Kim, J.-Y.; Jeong, I.; Kim, J.-M. An Acoustic Emission Technique for Crack Modes Classification in Concrete Structures. Sustainability 2020, 12, 6724. https://0-doi-org.brum.beds.ac.uk/10.3390/su12176724
AMA Style
Tra V, Kim J-Y, Jeong I, Kim J-M. An Acoustic Emission Technique for Crack Modes Classification in Concrete Structures. Sustainability. 2020; 12(17):6724. https://0-doi-org.brum.beds.ac.uk/10.3390/su12176724
Chicago/Turabian StyleTra, Viet, Jae-Young Kim, Inkyu Jeong, and Jong-Myon Kim. 2020. "An Acoustic Emission Technique for Crack Modes Classification in Concrete Structures" Sustainability 12, no. 17: 6724. https://0-doi-org.brum.beds.ac.uk/10.3390/su12176724
Note that from the first issue of 2016, this journal uses article numbers instead of page numbers. See further details here.