1. Introduction
During the period from 1950 to 2018, the population of global cities grew four times greater than the estimated. By 2050, the United Nation projects that 68 percent of the world’s population will be urban, totaling 6.7 billion urban dwellers. In Brazil, the most significant direction of migratory flux involves movement from medium to large cities, suburbs, and metropolitan regions. Today, over 80% of the country’s population lives in cities [
1,
2].
Urban growth in Brazil is occurring without complying with land use regulations, mostly in floodplains and hillslope landslide risk areas, thereby impairing the decision-making process and urbanistic interventions. As a consequence, drainage systems experience many challenges due to the lack of planning, the sectorized perspectives of government agencies, and drainage system projects that are inadequate or based on sanitary hygiene concepts [
3,
4].
The rapid and complex urbanization process creates difficulties in urban drainage system implementation. However, few studies evaluate how urban forms affect these systems. Urban patterns can influence the performance, economic efficiency, effectiveness, and adaptability of stormwater systems. Urban planners must recognize the pros and cons of different urban designs and their suitability under environmental conditions to contribute to the sustainable development of the city [
5].
Despite being created as a globally recognized urban project, the Federal District (FD) is experiencing one of the largest population growths in Brazil, with a 1.36% increase every year. Most of the new urban areas are characterized by an unplanned urban expansion in unregulated areas, marked by the deficiency of land use planning and unconstrained appropriations of public spaces in the territory [
6,
7]. Some new planned urban development areas have been implemented, however, in most cases, following patterns already built in the past, with no thought toward water sustainability. In addition to stormwater management problems, groundwater recharge and surface water quality have worsened. Both aspects are critical in this region, which is a highland whose streams are all very small and experience very marked dry and rainy seasons, with very intense rainfall during summer and very low streamflow during winter. Thus, water quality and availability throughout the year depend highly on groundwater recharge and quality control.
Usually, an urban layout is designed without considering the landform characteristics of the site where the city will be built. Therefore, it is necessary to develop instruments that can support the decision-making processes that all land use regulations, environmental licenses, and water resource sustainability measures require [
8].
Castro (2017) [
9] and Sotero (2014) [
10] noted that in the FD, the traditional land use mapping that is still being used is unable to handle the important characteristics of their intended sites, showing that legal instruments like PDOT (Plano Diretor de Ordenamento Territorial, Master Plan for Territorial Planning) and ZEE (Zoneamento Ecológico-Econômico, Ecological-Economic Zoning) are not effective in territorial management [
9,
10]. This divide between perspectives on regional legal instruments and the existing and planned urban developments in the FD have led to the search for a more detailed urban characterization and links to facilitate the appropriation of information about land use, topography, and effective occupation [
11], usually presented as uncorrelated maps.
Traditional land use maps cannot achieve the same level of detail as urban morphology mapping. Urban morphology mapping investigates the details of the urban structure and can capture relationships between the built environment, the urban water cycle, and sustainability [
12,
13]. The conceptual foundations of urban morphology research emerged in German-speaking countries in the first three decades of the twentieth century [
14,
15] as Urban Structure Types (USTs). These USTs are defined as areas with similar characteristics that are marked by specific dispersions of buildings, open and paved spaces, densities, materials of constructed dwellings, and socioeconomic attributes [
16]. Several studies demonstrated that USTs can accurately express the environmental impacts and urban resilience of an area.
Many studies have been published relating the importance of studying urban forms to diverse study areas, such as drainage, water, and sewer systems [
5,
12,
17,
18,
19,
20], Water Sensitive Urban Design (WSUD) and Low Impact Development (LID) applications [
21,
22], ecosystem services [
23,
24], and the recuperation of ecosystem services using nature-based solutions, such as green infrastructure devices [
25,
26].
The first research involving urban patterns in Brazil’s capital was developed by Höefer (2013) [
27], who evaluated diffuse pollution impacts. Sotero (2014) [
10] subsequently studied water consumption in the Riacho Fundo Basin, classifying 18 USTs, among which the industry pattern presents the highest water consumption, followed by commercial, and the multi familiar high-density residential pattern (RB3). Castro (2017) [
9] proposed an Urban Water Security Index (UWSI) as a support tool for water resource management, evaluating the relations between urban morphology (USTs) and ecosystem services in the FD. The results showed that 90% of the area has low water security (UWSI 0.4 to 0.6 in a range of 0.0 to 1.0). Seraphim (2018) [
28], also in the FD, analyzed the relations between urban occupation typologies and their impacts on the natural behavior of water infiltration in aquifer recharge areas. The temporal analysis demonstrated that the built area grew by 230 times from 1953 to 2016 and verified that 81.2% of the city is located on areas with high or very high groundwater recharge potential, with 76% of this area featuring medium to low building density.
Castro et al. (2019) [
8] proposed a new approach to the urban mapping process in the FD, integrating the opinions of decision-makers and agencies, analyzing the spatial relations of the urban forms to improve data analysis, communication capacities, and stakeholder strategies for public policies in urban areas and human settlements. In this process, 25 USTs were identified for the FD and were classified into five main types related to the territory’s functionality: open areas, areas of common use, trade and industry areas, residential areas, and consolidation areas.
Ecosystem services are highlighted in most of the laws of allotment in the Federal District (FD). Groundwater recharge is evaluated using the permeability law approved by the FD in 2017, which establishes a maximum runoff peak flow at the outlet of new allotments and buildings exceeding 600 m
2 in area [
29]. This law emerged from the need to conserve the infiltration and aquifer recharge and to contribute to hygrothermal comfort and evapotranspiration, thereby delaying runoff peak flows and preserving available water resources. Public instruments stimulating groundwater recharge are a new aspect of sustainable urban development whose use must be encouraged in all cities of the country.
Ecological–Economic Zoning (ZEE) highlights the importance of preserving water quality and quantity and is used as the foundation for sustainable urban growth and planning to guarantee the human water supply. The ZEE provides strategies to preserve water resources using zoning to protect water ecosystem services, control consumption, and wastewater treatment and provide groundwater recharge in open spaces and conservation units [
30]. In the FD, the Stormwater Management Master Plan (PDDU) [
31] and Stormwater Management Manual [
32] discuss the runoff water quality by taking into account the effect of first flush [
33,
34], assuming that the first 5 to 10 mm of runoff generated by rainfall carries 50% of the surface accumulated pollutant load. Porto (1995) [
35] estimated that within the first 20 mm of runoff, 90% of the surface load is removed. Other discussions, such as USEPA (1993) [
36], indicate that 80% of the pollutants present in stormwater are suspended solids and that pollution control can be carried out by retaining the first parcel of the runoff in most of the rainfall events during the year, assuming a specific rain depth that represents most of the events or a value related to a determined risk. A previous study analyzed the rainfall data in Brasília and showed that in 95% of rainfall events, the precipitation was less than 22.5 mm [
31].
Flooding, in this research, is related to the provision of flood control using low impact development techniques. This phenomenon is discussed for legal instruments, ZEE, and permeability laws, considering prevention bias and the use of retention and infiltration devices, such as infiltration trenches and detention ponds.
A critical dimension in urban planning is the landscape, which includes soil and earth surface process-form relationships. Topography is one of the essential elements of hydrological behavior. The geometry of the terrain can assume complex forms with different slopes and curvature profiles [
37]. The geometry of the terrain, which is characterized by the elevation, slope, length of ramps, and curvature, has a relevant impact on runoff and exerts significant control over the hydrological response of the basin, defining the boundary conditions through which the transport of water and sediments mechanisms will occur [
38,
39].
Woolhiser (1969) [
40], Moore (1985), and Rose et al. (1983) [
41,
42] evaluated the influence of topographic patterns on surface runoff generation. Troch et al. (2003) [
38] showed that converging surfaces drain more slowly than diverging surfaces due to decreased flow at the outlet of the basin.
Many studies and projects have been carried out in the FD using SWMM based on experimental studies including flow and water quality measurements [
6,
7,
43,
44,
45,
46,
47,
48]. SWMM has proven to be a reliable tool in these studies. In this work, hydrological and hydraulic analyses along with simulations of the drainage systems and LIDs were carried out using SWMM under the PC-SWMM platform, applying the parameters calibrated for the cited works.
The focus of this study is on two specific USTs: “Mixed Residential with high occupancy rates and open spaces between the buildings” and “single-family houses with low occupancy rates”, which occupy 0.5% of the FD and have a high potential to provide ecosystem services. This study aims to assess how urban forms impact the drainage systems of four different landforms: divergent-convergent, flat, convergent, and divergent hillslopes, as well as two different types of soils. Scenarios were created to evaluate the cost of the system in each case of runoff peak flow, water balance, and the provision of water ecosystem services.
2. Materials and Methods
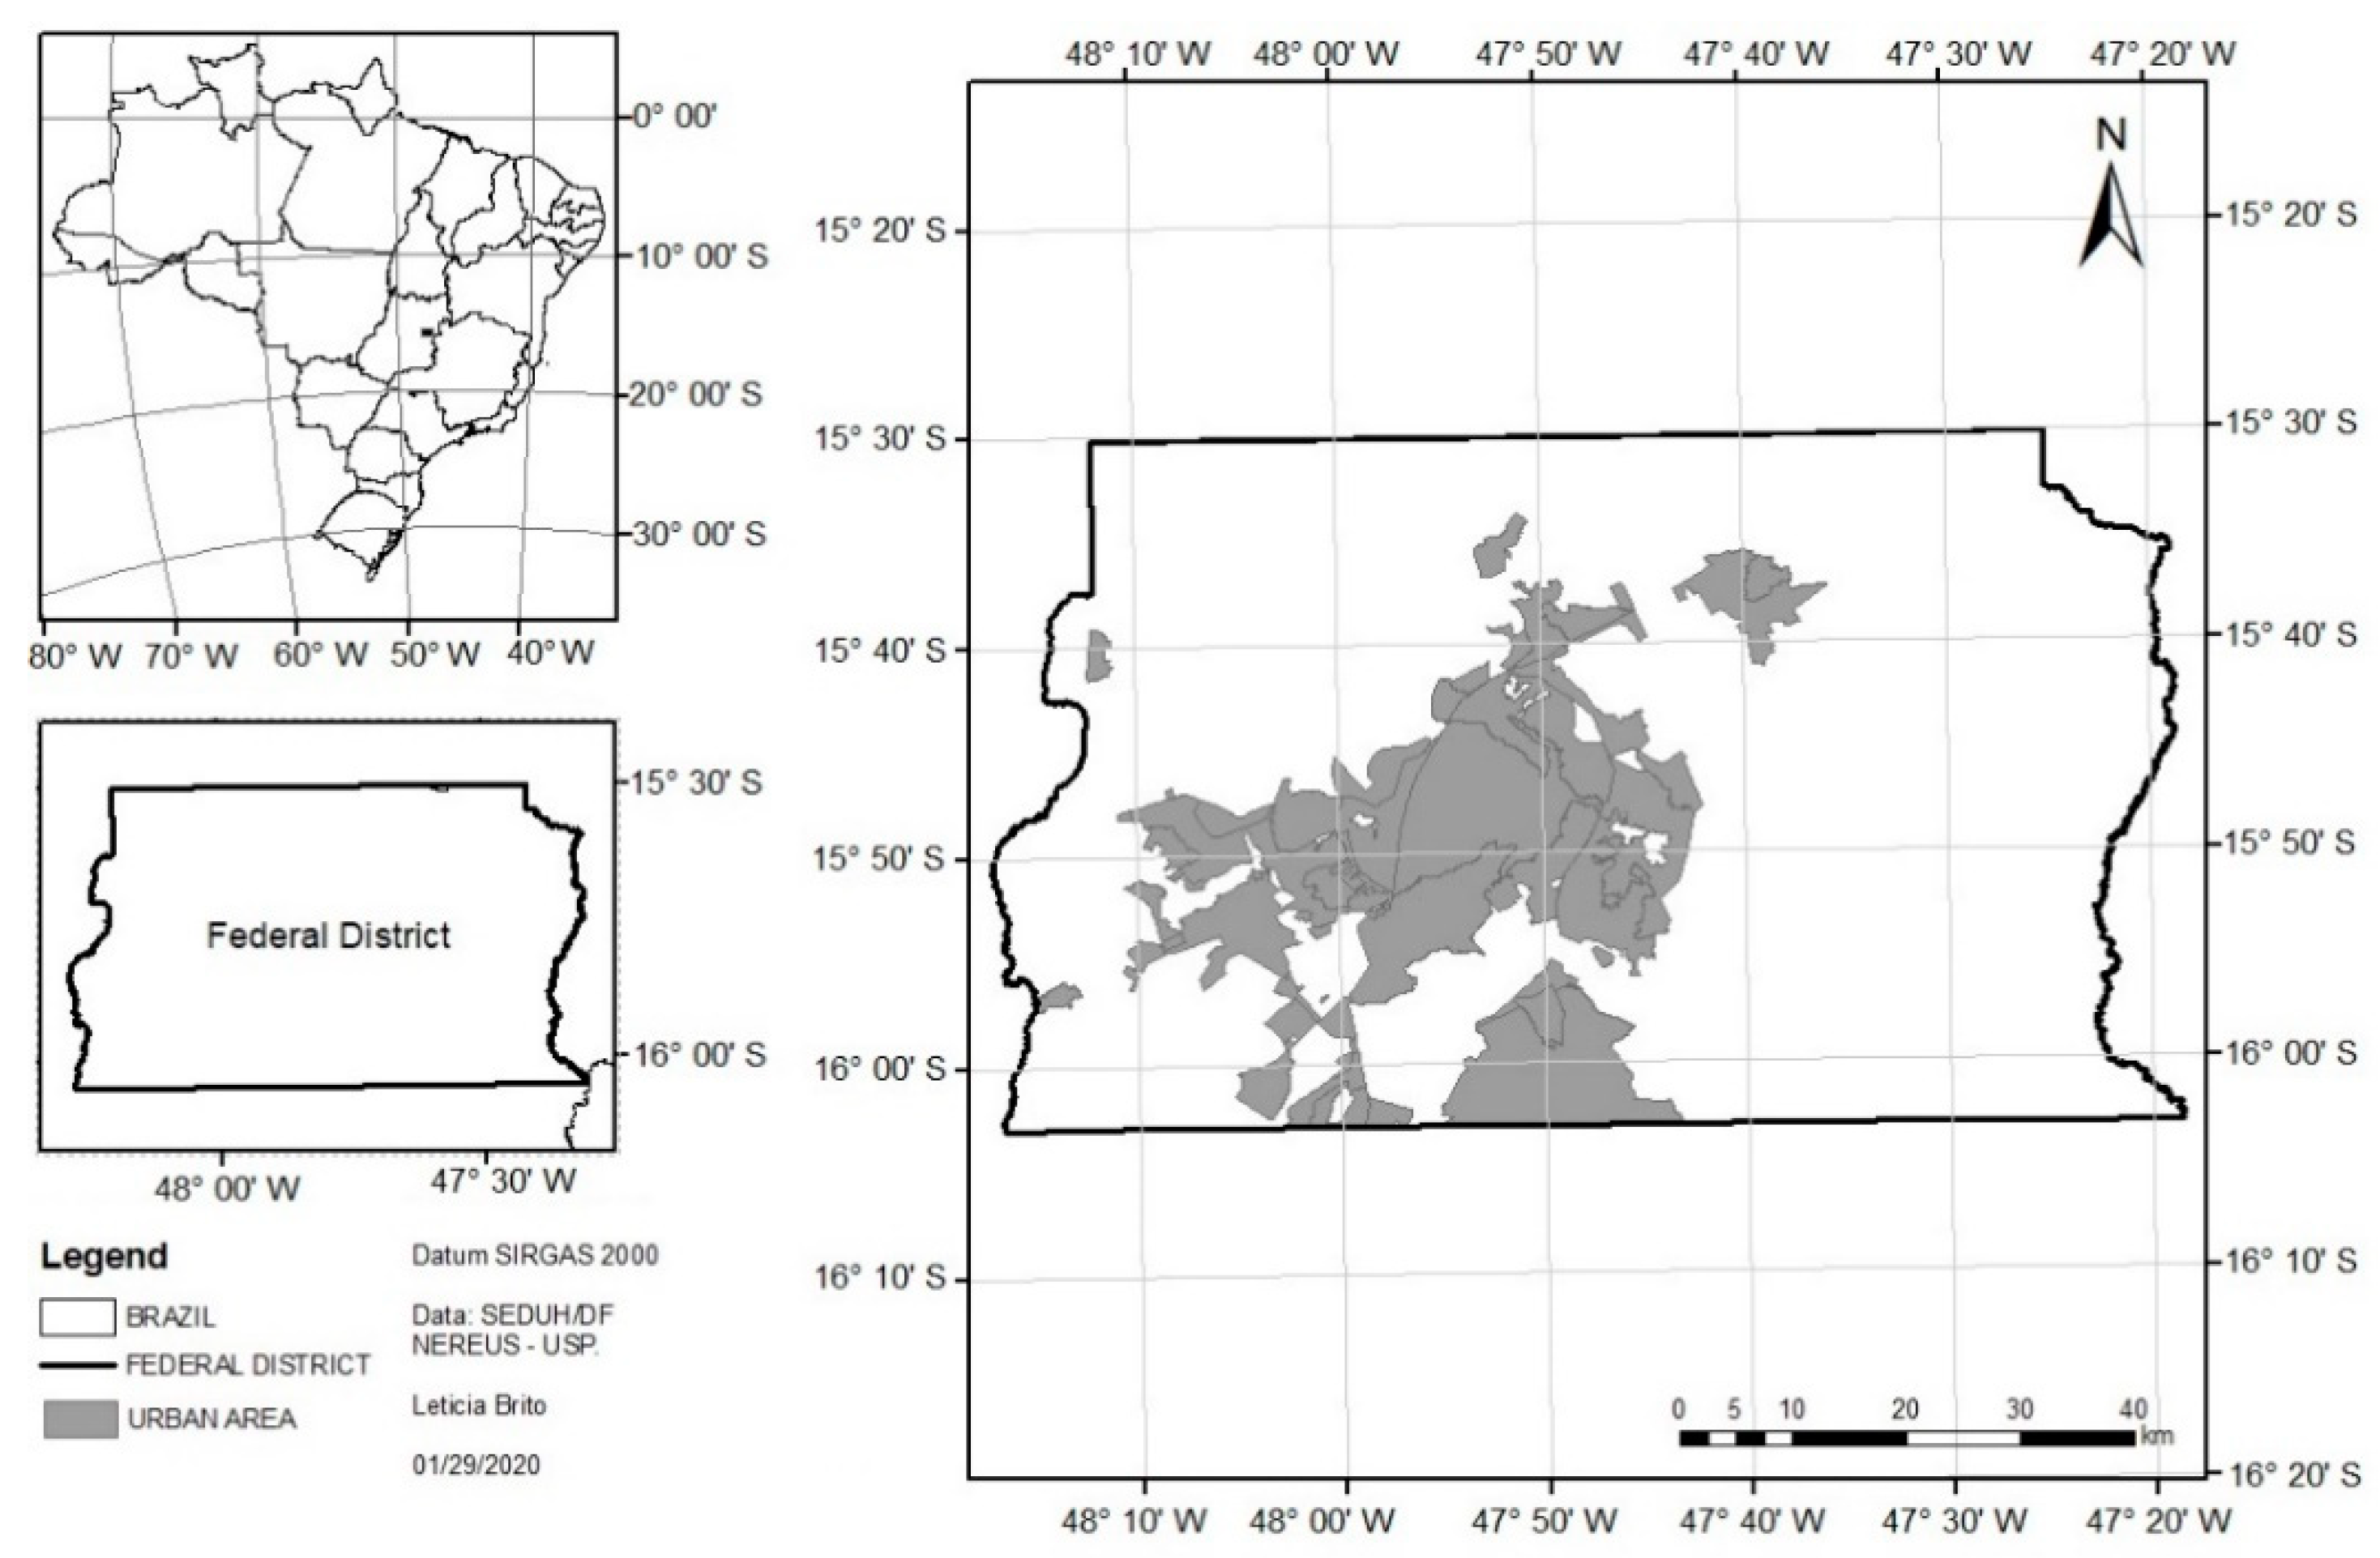
The studied area is located in the Federal District, Brazil’s middle-west region, which has nearly 3 million inhabitants (
Figure 1). In recent years, water resource availability has become critical; thus, the preservation of water resources is extremely important in this area. Water management systems must be developed to preserve water quantity and quality in this scenario.
In this region, the climate is tropical with two clearly defined seasons: an arid season from May to September, with low precipitation rates and high evaporation rates, and a rainy season between October and April, featuring storms with high rainfall intensity. The average annual precipitation varies from 1200 to 1700 mm, covering a territory of about 6000 km2.
The FD has two predominant soil types, a very porous Latossol, representing 54.5% of the area, and a more impervious Cambissol, representing 30.98% [
49]. These two kinds of soils were used in the model due to their representability in the territory of the Federal District. Latossol is a very permeable type of soil whose infiltration capacity is approximately 24.4 mm/h and can be classified as Hydrological Soil Group (HSG) A of the Soil Conservation Service Method, Curve Number (CN). The Cambisol has almost 10 times less infiltration capacity than the Latossol and can be classified as HSG B [
50,
51,
52].
Four distinct topographical patterns were analyzed in this research: one divergent-convergent area, a flat surface with a high slope, and strictly divergent and convergent surfaces. The divergent-convergent hillslope has an average slope of 2.68% and altitudes varying in a range from 1100 m to 1150 m. A divergent and flat top characterizes this surface, with an increasing slope index at the bottom, as shown in
Figure 2a,b. The flat surface has an average slope of 3.47% and elevations between 1160 m and 1215 m. The profile-plan curvature index is near zero, and this hillslope is characterized by low slopes at the top and high slope variation at the bottom, as shown in
Figure 2. The flat and divergent-convergent topographies were taken from two actual urban areas in the region with stormwater management problems. The convergent topography was taken from the convergent side of the divergent-convergent topography, and the divergent topography was created by inverting the elevations of the convergent topography.
After the preliminary evaluations, the combination of UST and soil type that led to the highest flow peaks was tested over two more topographical arrangements: strictly convergent hillslopes and strictly divergent hillslopes (
Figure 3).
The convergent surface has an average slope of 1.15% and elevations between 1.150 m and 1.136 m. The divergent surface has the same rate of elevations and slope average. The drainage system layout, pipe sizing, and hydraulic parameters and constraints followed the local regulations and reference term parameters [
32,
53].
To adopt the original urban design used in Brasilia, maps were provided by the Urbanistic and Cartographic Documents System [
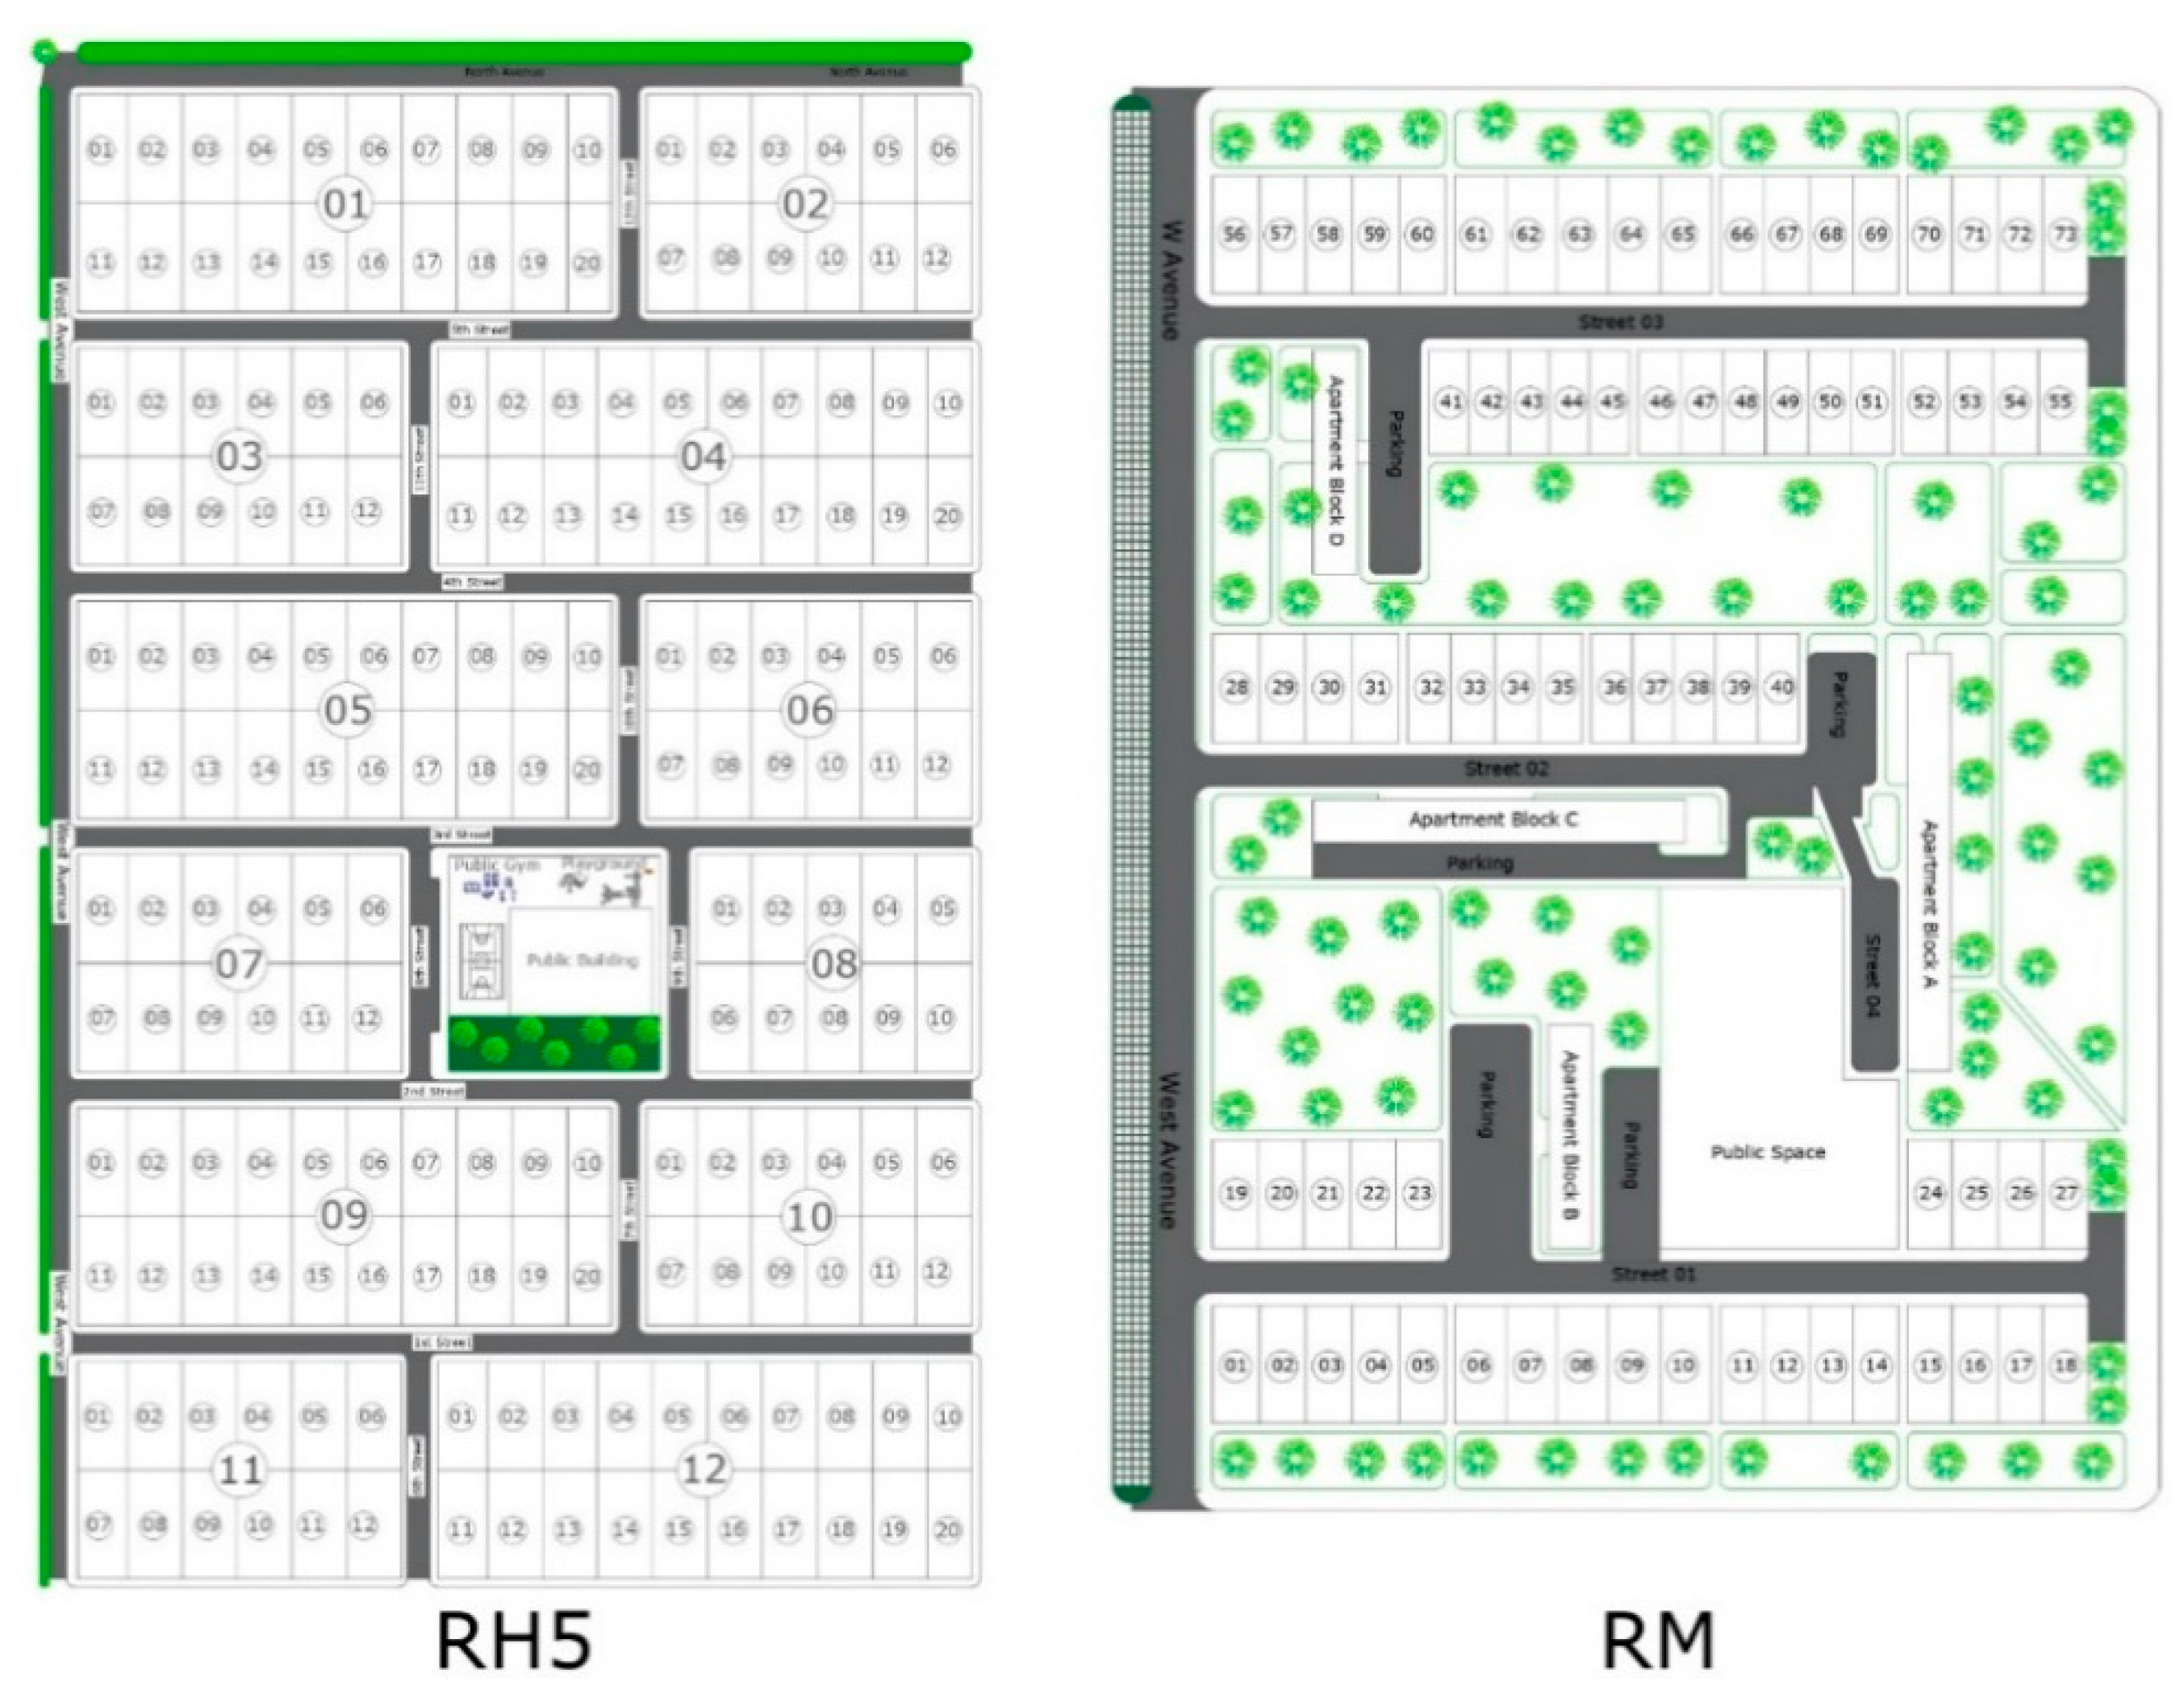
54], and images with high spatial resolutions were used. The buildings and residential allotments were drawn using the metrics and urban fabric details obtained from the original plant and orthomosaic images.
Figure 4 shows a Mixed Residential (RM) design, which is typical of Brasília, as well as single-family housing with low occupancy rates (RH5). The size of the allotments in the UST RH5 vary from 300 m
2 to 700 m
2 and are marked by the presence of one- or two-floor buildings, one public space in the center of the UST, and occupation by a middle class population. The UST RM is marked with a mixed presence of apartment buildings with 3 to 6 floors, allotments with single-story houses, or lofts with areas of 250 m
2 to 300 m
2, with the presence of a public space featuring a school or community facility and occupation by a middle class and upper middle class population. These USTs were chosen in this study because they are very common in the Federal District and used to have a close population density.
The positions of the buildings and allotments in relation to the contour lines were analyzed in two scenarios, the first with allotments mainly parallel to the contour lines and the second mainly orthogonal. The layouts of the buildings and allotments are presented in
Supplementary Materials.
The scenarios were tested using two rainfalls: the designed critical rainfall and a one-year registered rainfall. The local IDF equation was fit by CONCREMAT (2009) [
31] using 32 years of continuous rainfall precipitation data registered in Brasilia. Equation (1) shows the IDF curve:
where
I is the Intensity of the Rainfall (mm/h),
RP is the Return Period (years), and
tc is the Concentration Time (min).
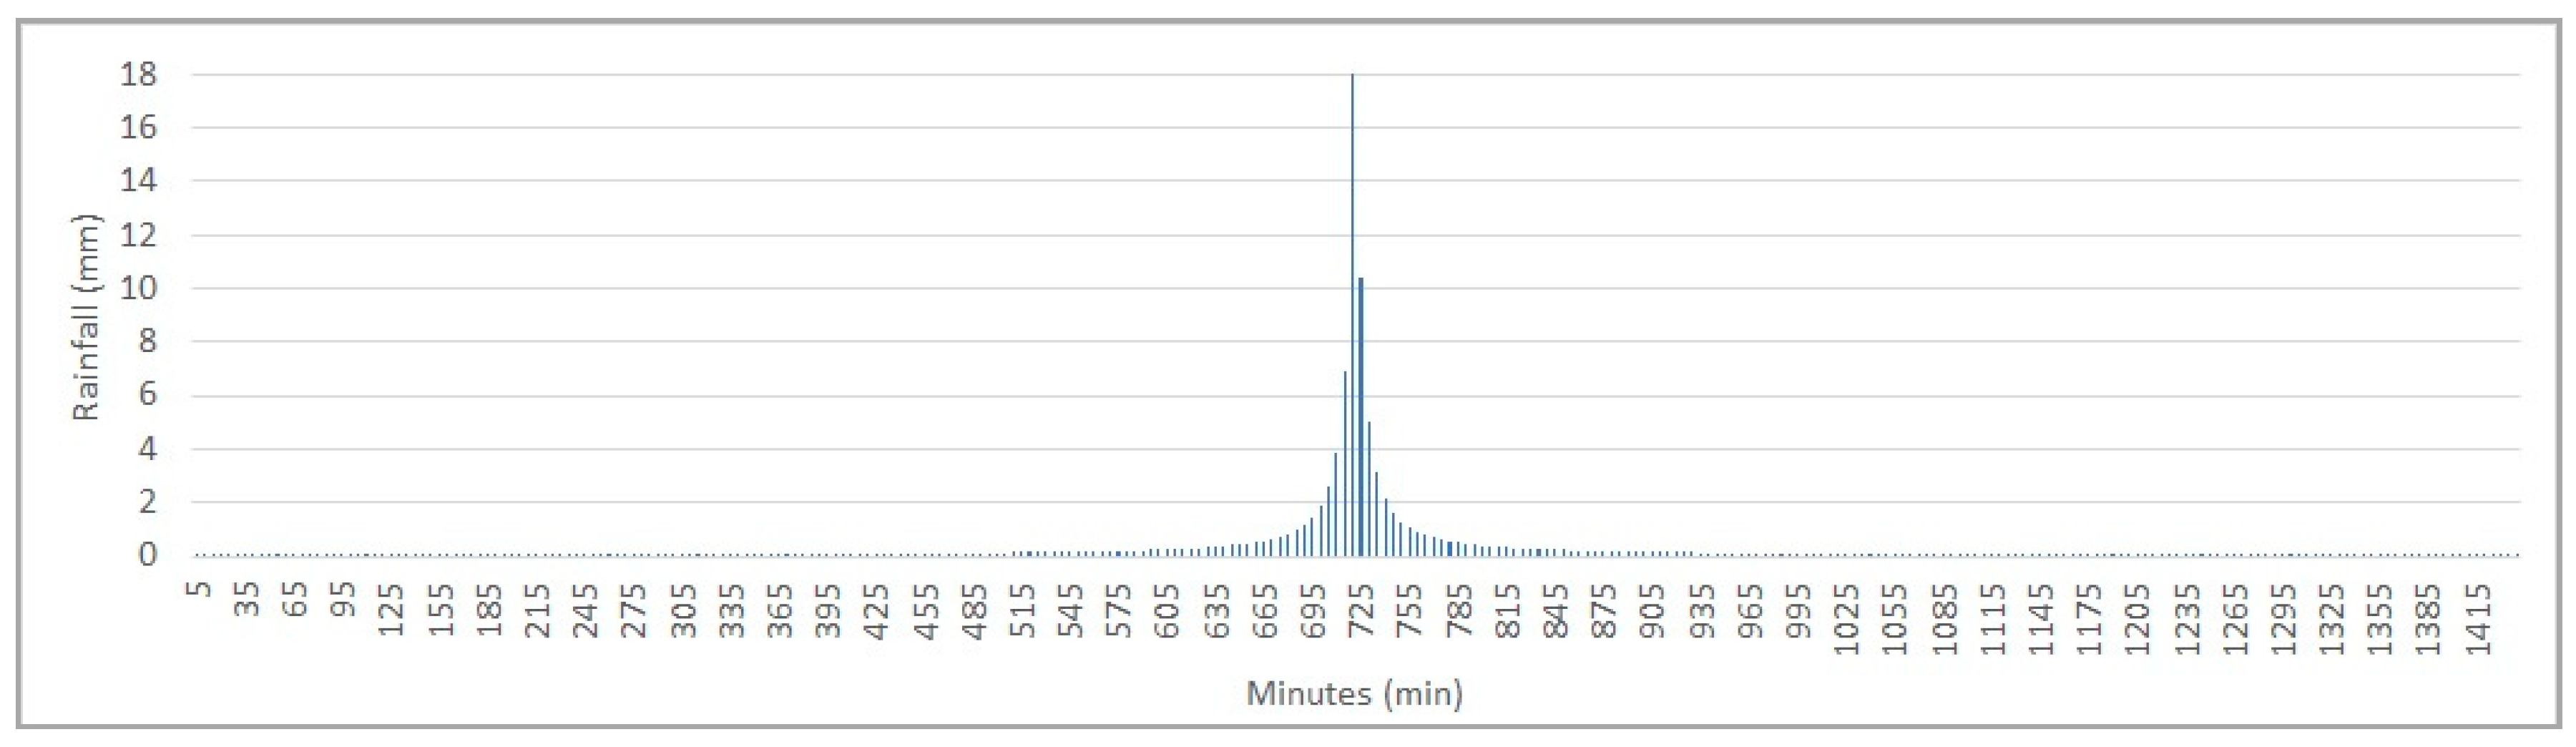
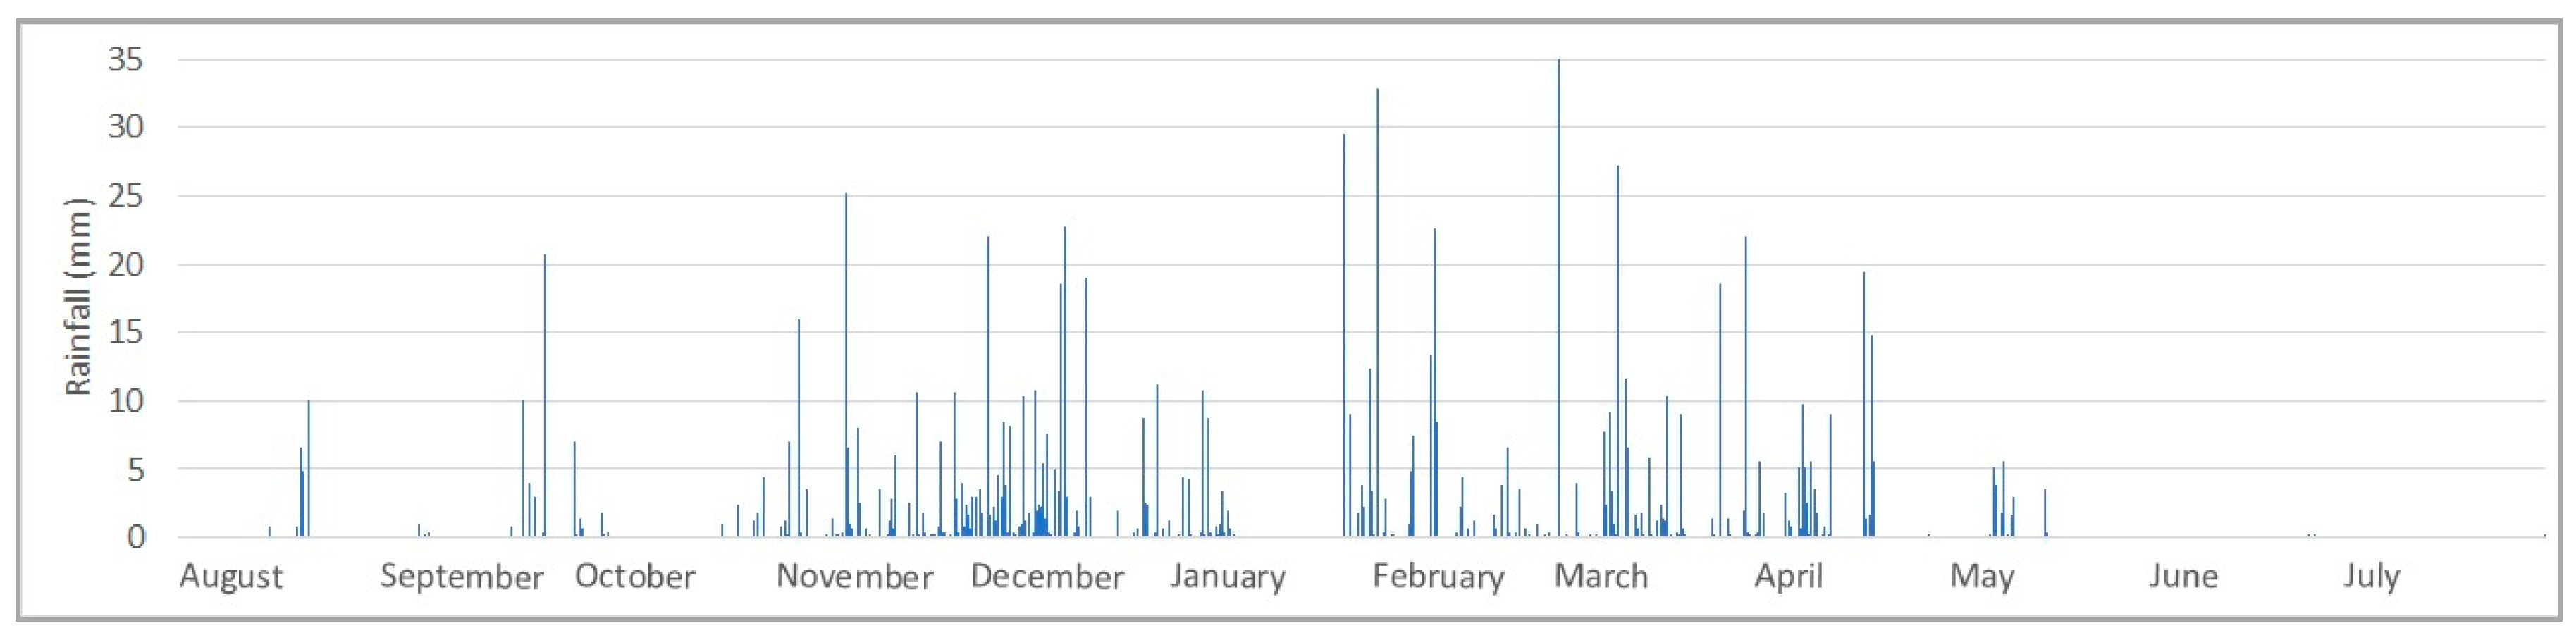
The designed rainfall was built using the IDF curve with the alternating blocks method for a 10-year return period and a 24 h duration. The total determined precipitation depth was 91.7 mm, as shown in
Figure 5. Continuous one-year rainfall data were selected from the series registered by the National Meteorological Institute rain gauges in Brasilia [
55] by choosing a year with total rainfall depth near the series’ annual mean value. The total rainfall of the continuous year was 1457 mm, with a 1 h time interval (
Figure 5).
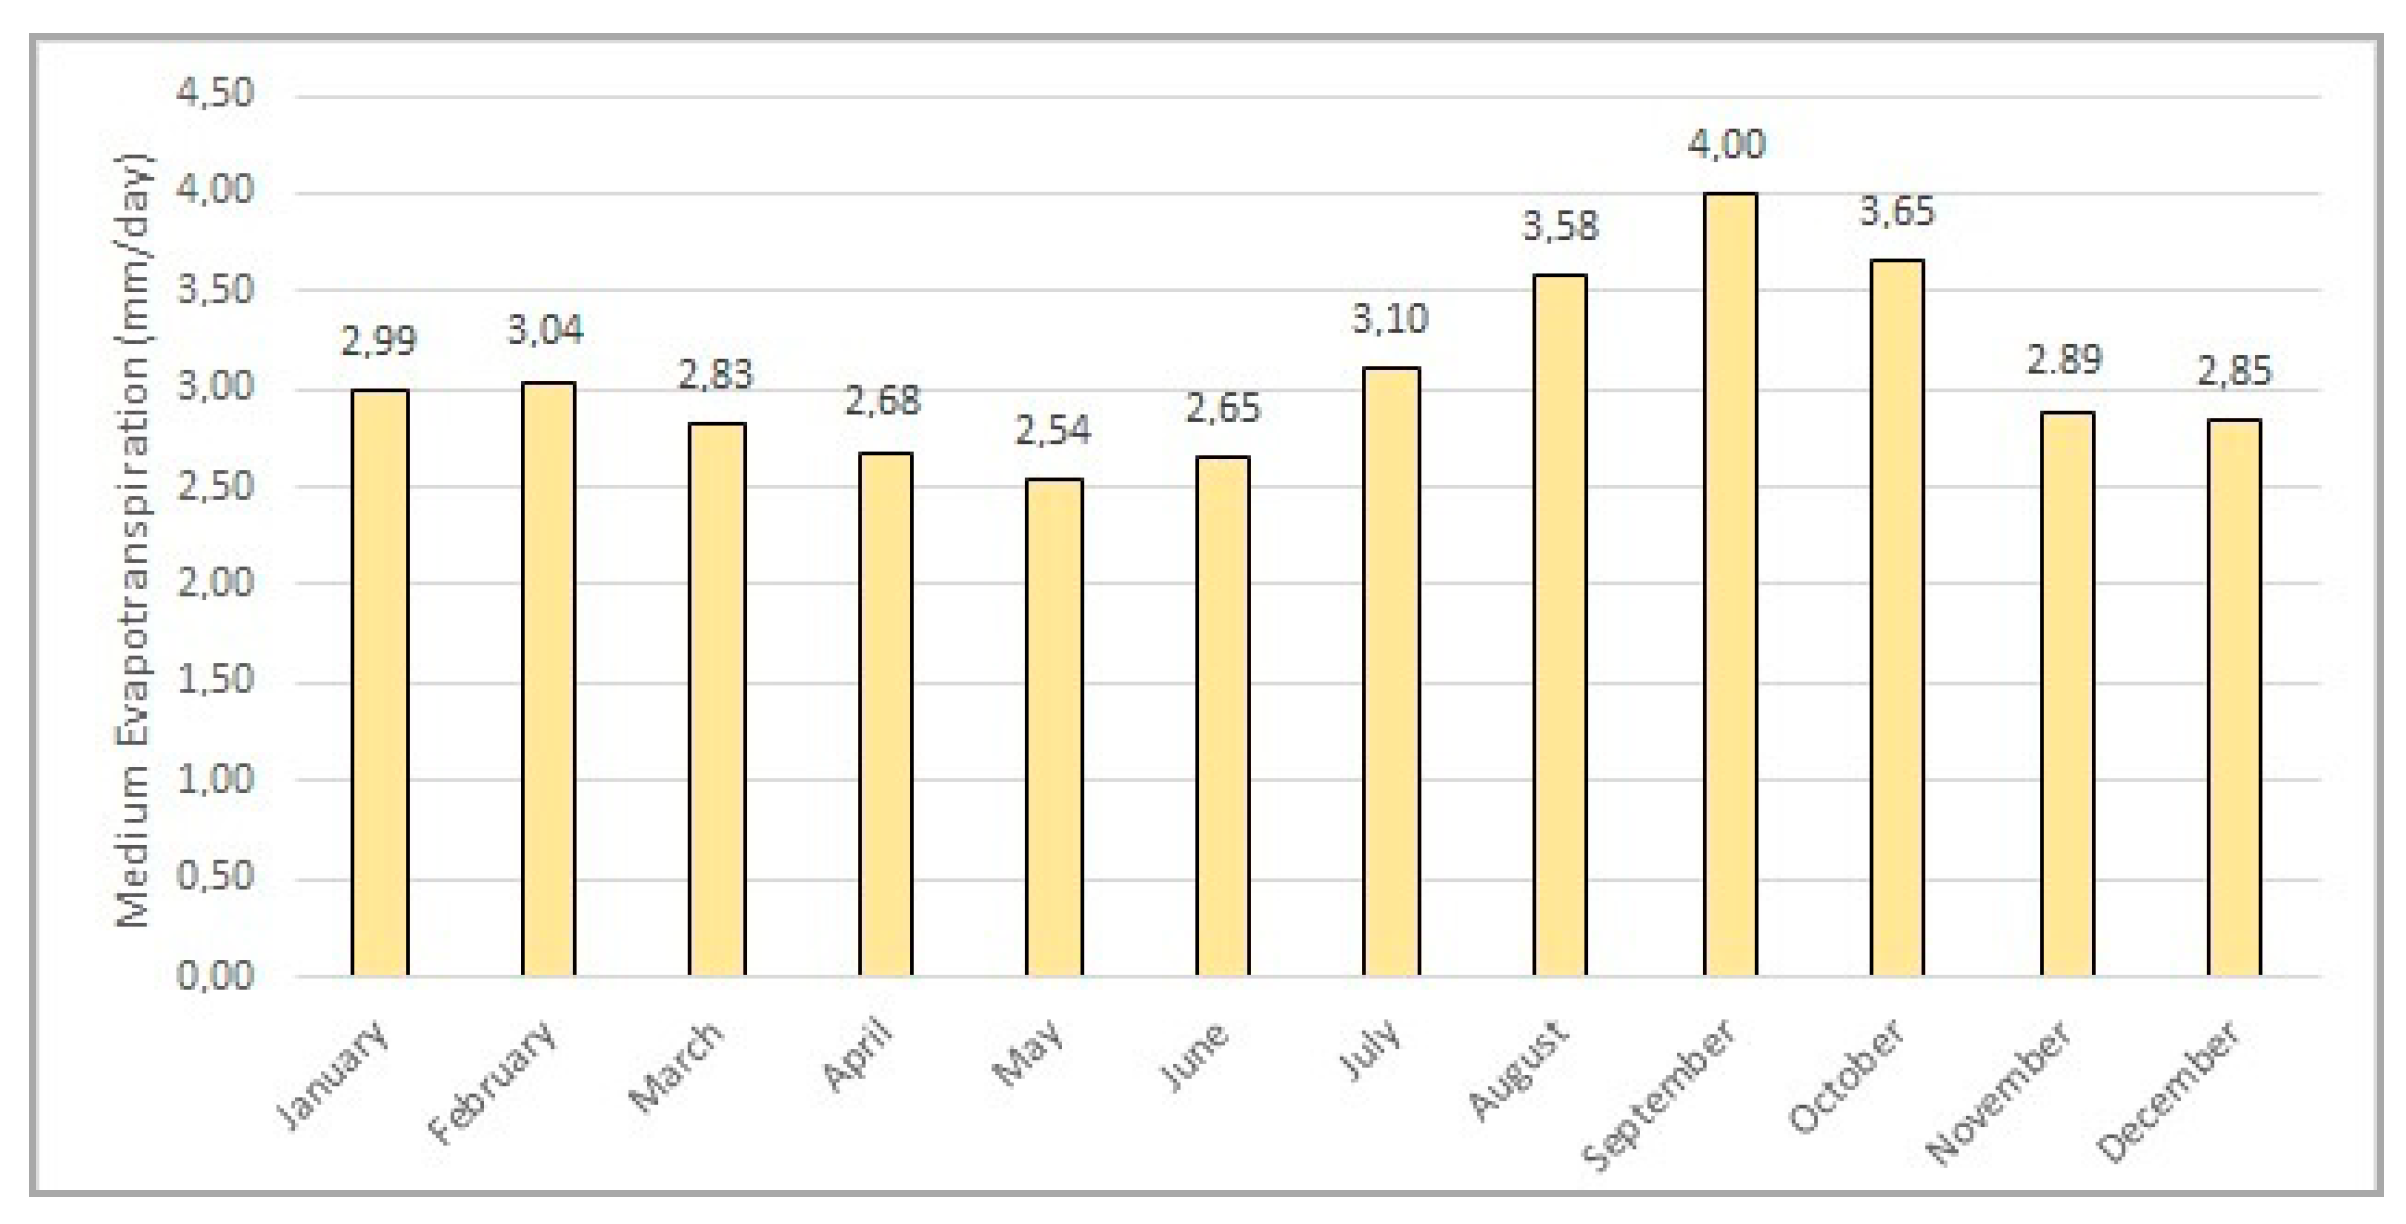
Evaporation data were also used in the continuous simulation. Monthly Class A evaporation tank data were used as the SWMM model climatology input and multiplied by a factor of 0.70 to consider the conversion of potential evaporation to real evaporation data.
Figure 6 presents the evapotranspiration data used in the model.
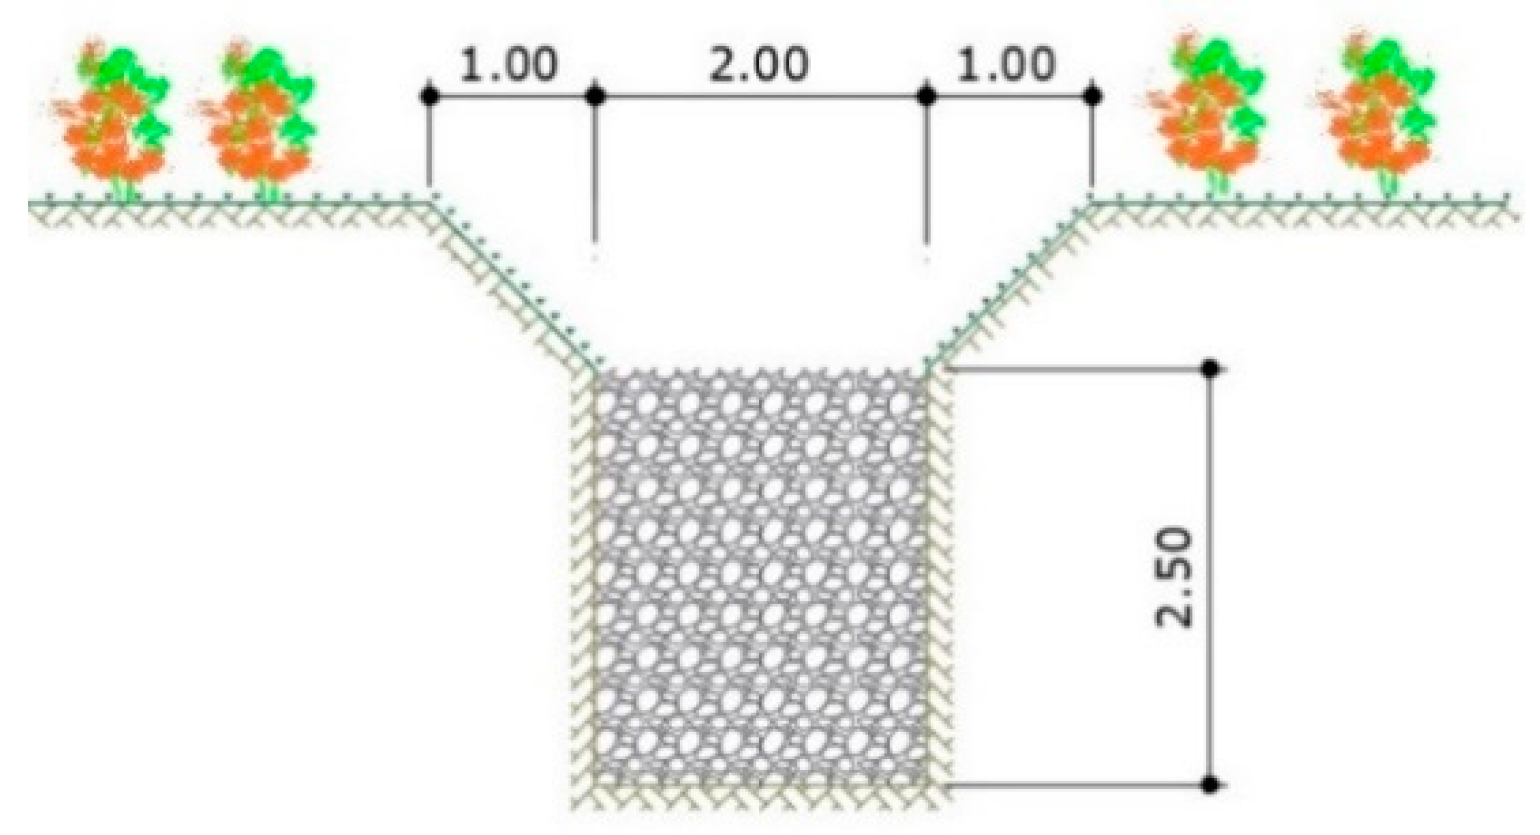
Infiltration swales (ISs) were included in the urban design scenarios to reduce the runoff peak flows to determine the predevelopment runoff conditions. Although the FD’s Water Resource Agency has imposed a maximum peak flow rate of 24.4 l/s.ha, no LID devices have yet been implemented in Brasilia, despite the space availability. To analyze the effects of urbanization, predevelopment scenarios using the SCS CN method were simulated for comparison. The parameters of the ISs included in the scenarios are presented in
Figure 7 and
Table 1.
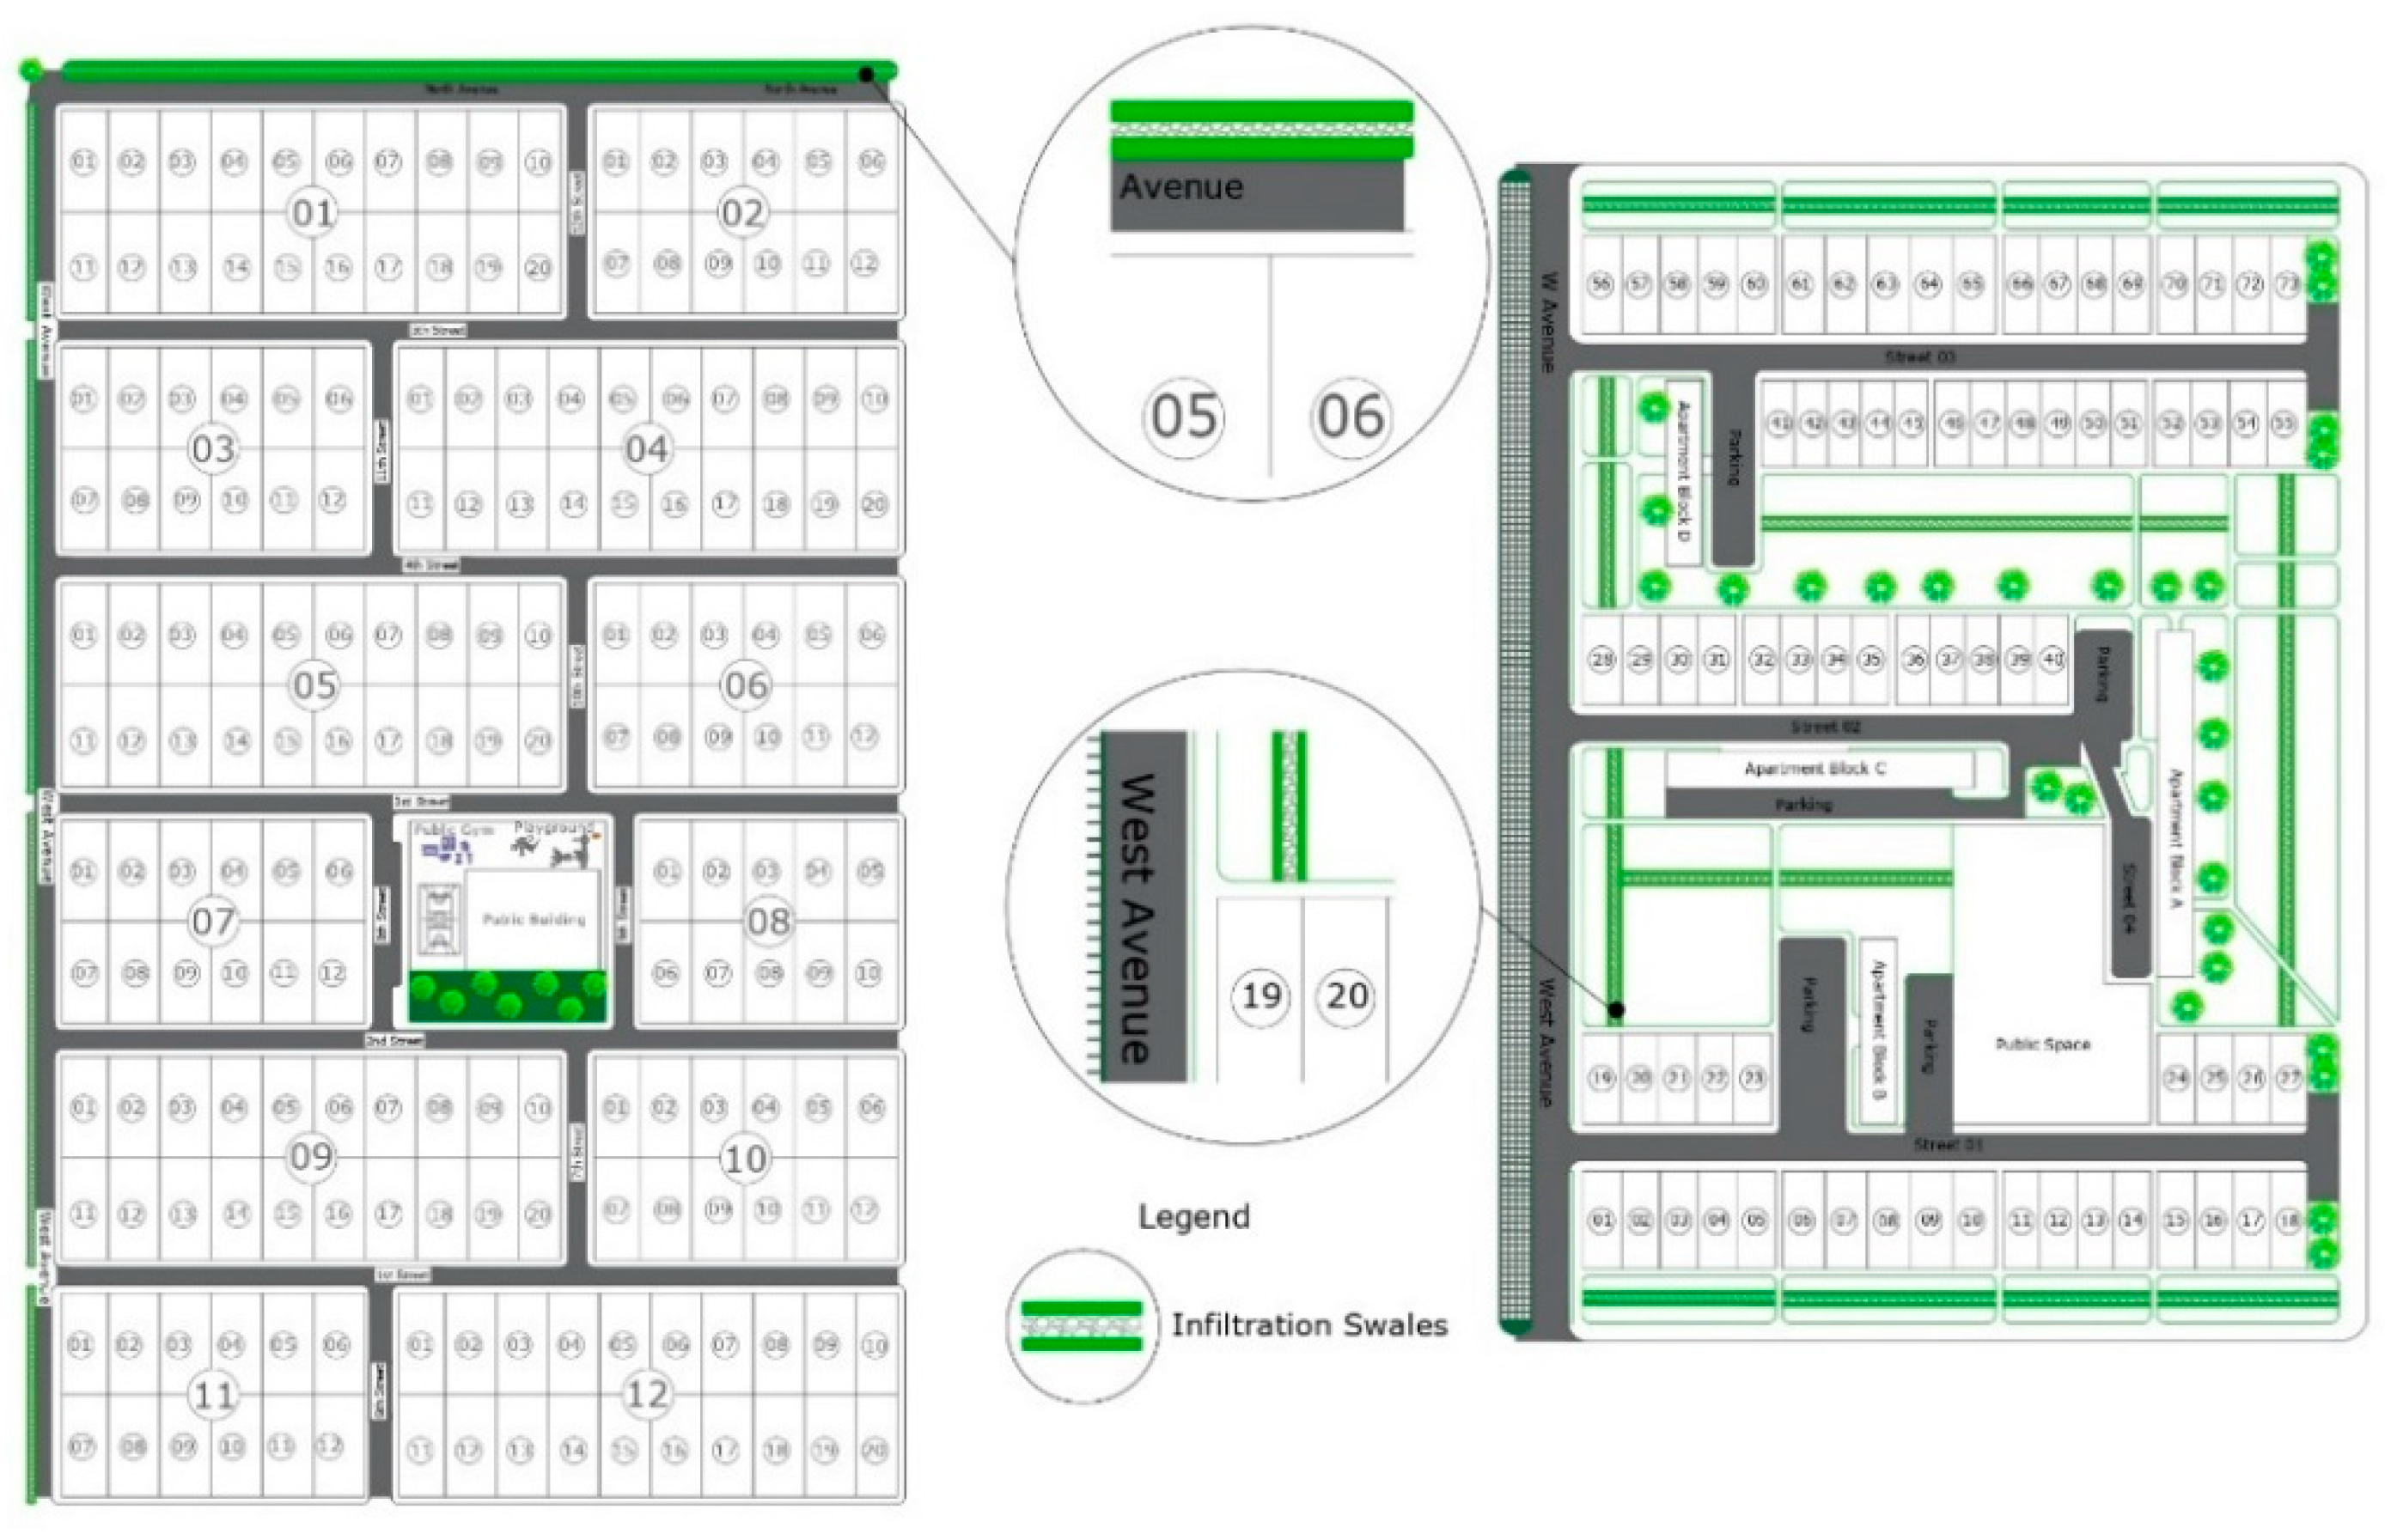
The area that included the ISs is shown in
Figure 8. In UST RH5, the swales were located in the free space in the middle of the avenues, occupying the whole space available. In the UST RM, the ISs were located at the green open spaces available next to the apartment blocks and in front of the residential allotments. The ratio between the IS area and the total area is 2.95% for the UST RM and 1.30% for the UST RH5. The RM urban pattern presents a considerably higher amount of green spaces in comparison to the RH5. Thus, the total area of ISs allocated to the UST RM scenario is higher than that of the UST RH5 pattern.
To evaluate the IS efficiency in terms of percentages, the total runoff volume released at the downstream end of the drainage system in the conventional scenario (
Vc) and the volume in the IS scenario (
VLID) were calculated to estimate the efficiency (
Ef), as shown in Equation (2).
Castro (2017) [
9] discusses the ecosystem services that can be provided by different UST types. The ecosystem services assessed in this paper include groundwater recharge potential, flooding risk, and runoff water quality.
Groundwater recharge was estimated by considering the infiltration and evapotranspiration in a continuous simulation. The amount of water that reaches the aquifer was estimated simply by accounting for the parcel that infiltrates minus the parcel that evaporates, as shown in Equation (3):
where
Egwr is the effective ground water recharge (mm/year),
Inf is infiltration (mm/year), and
EVT is evapotranspiration (mm/year).
Flooding risk was evaluated by considering the conventional drainage system and the system including the ISs. The ISs were expected to improve the system’s resilience to flooding. In the simulation process, we considered flooding to occur when at least two manholes in the drainage network are flooded and a significant part of the conduits are in a surcharging condition. For the simulations, we used the original stormwater network project presented in supplementary materials A, B, C, and D. The resilience of the stormwater network was evaluated by simulations, using the conventional drainage system with the rainfall necessary to cause flooding, as previously defined. Then, using the drainage system including the ISs, the simulations were carried out while increasing the rainfall to achieve the new flooding conditions. The rainfall increase was carried out by increasing the return period in the IDF equation to assemble the alternating block of storm rainfall. The Flooding Ecosystem Service Provision was obtained as demonstrated in Equation (4):
where
FES is the flooding ecosystem service provision (%),
DFloodIS is the depth of the rainfall necessary to flood the system in the IS scenario, and
DFloodconv is depth of the rainfall necessary to flood the system in the conventional scenario.
This increase in infiltration can also be determined in terms of increases in the return period. Equation (5) shows how the increase in the return period of the rainfall obtained in Equation (1) was calculated:
where
IRP is the increase in terms of the return period,
RPFloodIS is the return period of the rainfall necessary to flood the system in the IS scenario, and
RPFloodConv is the return period of the rainfall necessary to flood the system in the conventional scenario.
The superficial water quality was assessed by considering the effect of the first flush on urbanized areas, as discussed by CONCREMAT (2009) and ADASA (2018) [
31,
32]. The accumulated runoff depth generated by the urbanized area with a conventional drainage system and that under the scenario featuring continuous ISs in yearly simulations were considered as the estimator for pollutant load generation. We considered the ISs to absorb the first parcel of the runoff that contains the greatest portion of the pollutants present on the surface. Thus, the water quality improvement was calculated considering the decrease in the depth of the runoff generated in the long-term simulation compared to the conventional and IS scenario, as shown in Equation (6):
where
WQI is the water quality improvement (%),
DRConv is the depth of runoff generated in the conventional scenario (mm), and
DRIS is the depth of runoff generated in the IS scenario (mm).
Drainage system costs were evaluated using SINAPI (National System of Research on Costs and Indices of Civil Construction), SICRO (System of Referential Costs of Construction), and TCPO (Table of Compositions and Prices for Budgets) [
56,
57,
58], which are the Brazilian references for service and material cost estimations.
The stormwater network design for these simulations is presented in
Supplementary Materials. The evaluation of these two cases led to a more specific analysis of the effects of topography, flat, convergent, and divergent configurations. The divergent-convergent surface, despite representing a real topography case, does not allow a comparison of the topographical effects.
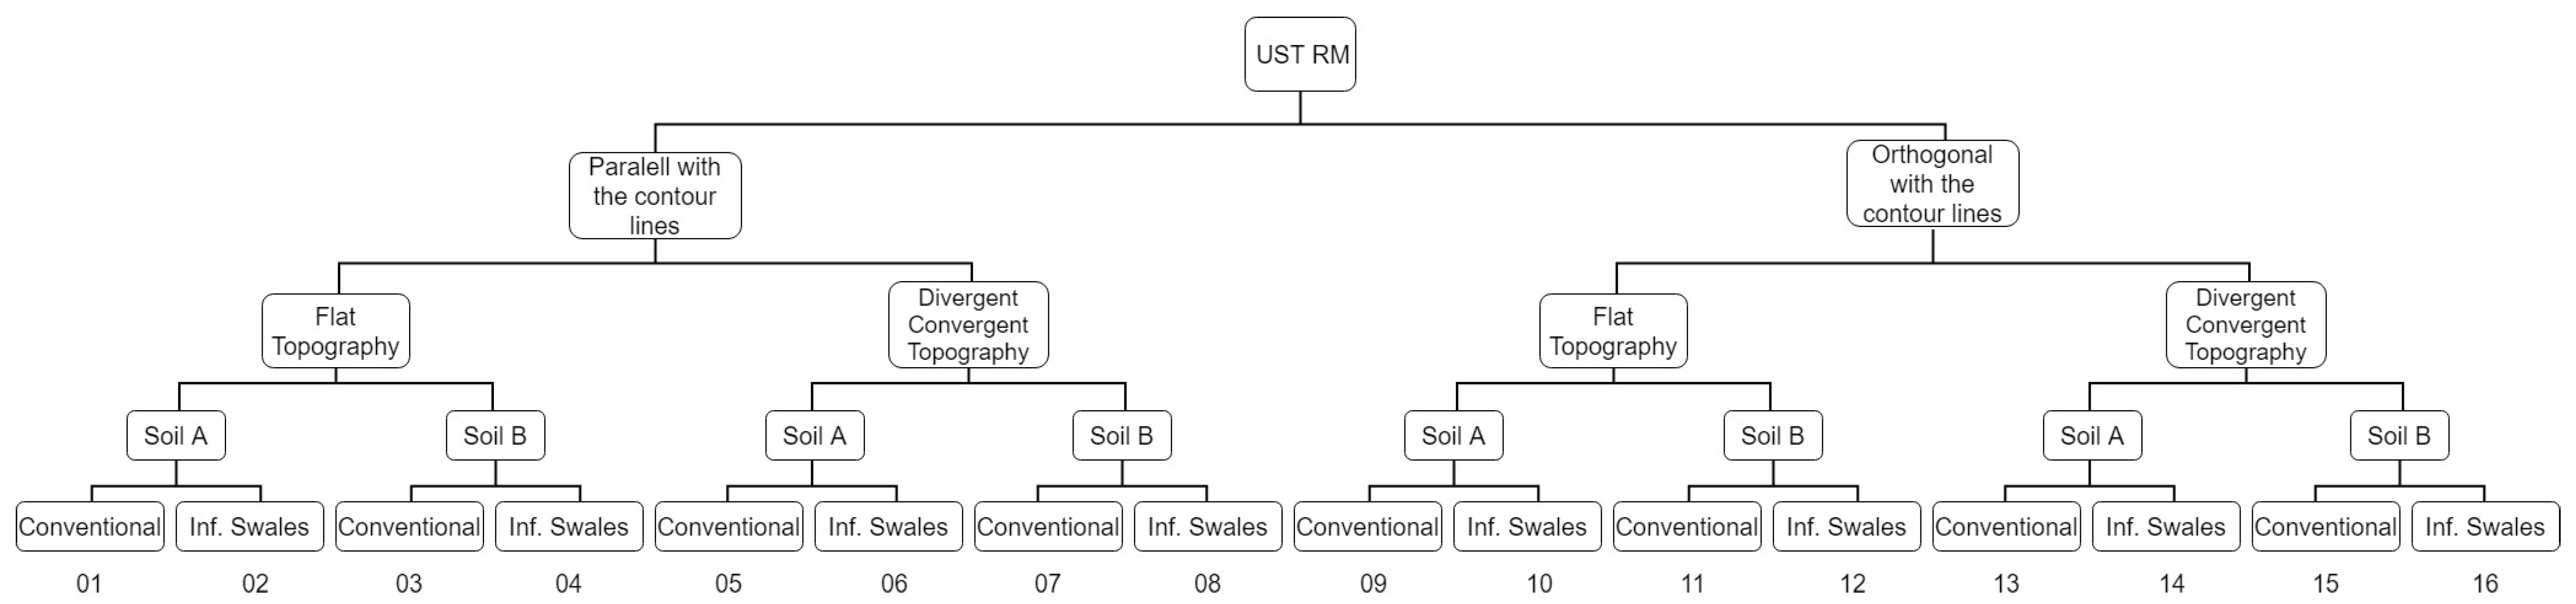
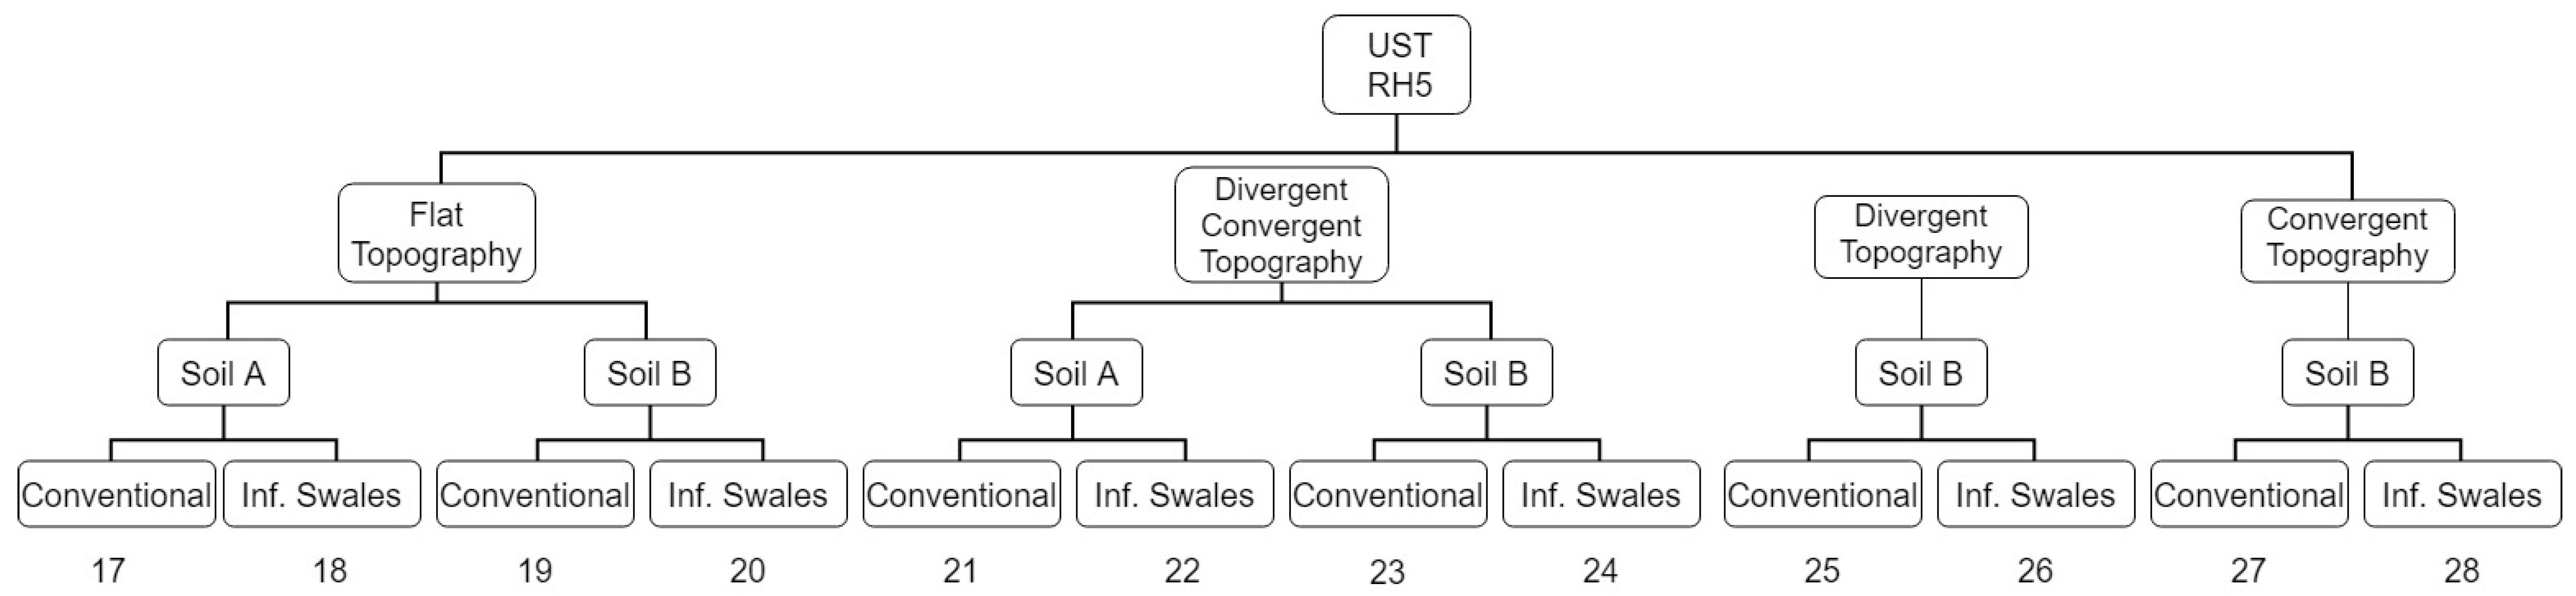
The flowcharts presented in
Figure 9 and
Figure 10 outline the procedures followed to obtain the results. Following all the procedures and phases, in total, 28 arrangements were developed for the simulation. In the results, the arrangements are grouped by the UST and scenario analyzed. The arrangements generated in this process are illustrated in
Figure 9 and
Figure 10.
3. Results and Discussion
The effects of urban patterns associated with different topographies were evaluated using peak runoff flow, LID scenario performance, cost of the drainage systems, and the water balance relationships with impacts on the provision of ecosystem services.
3.1. Impacts of Urban Patterns Considering Topography, Runoff Peak Flows, and LID Controls
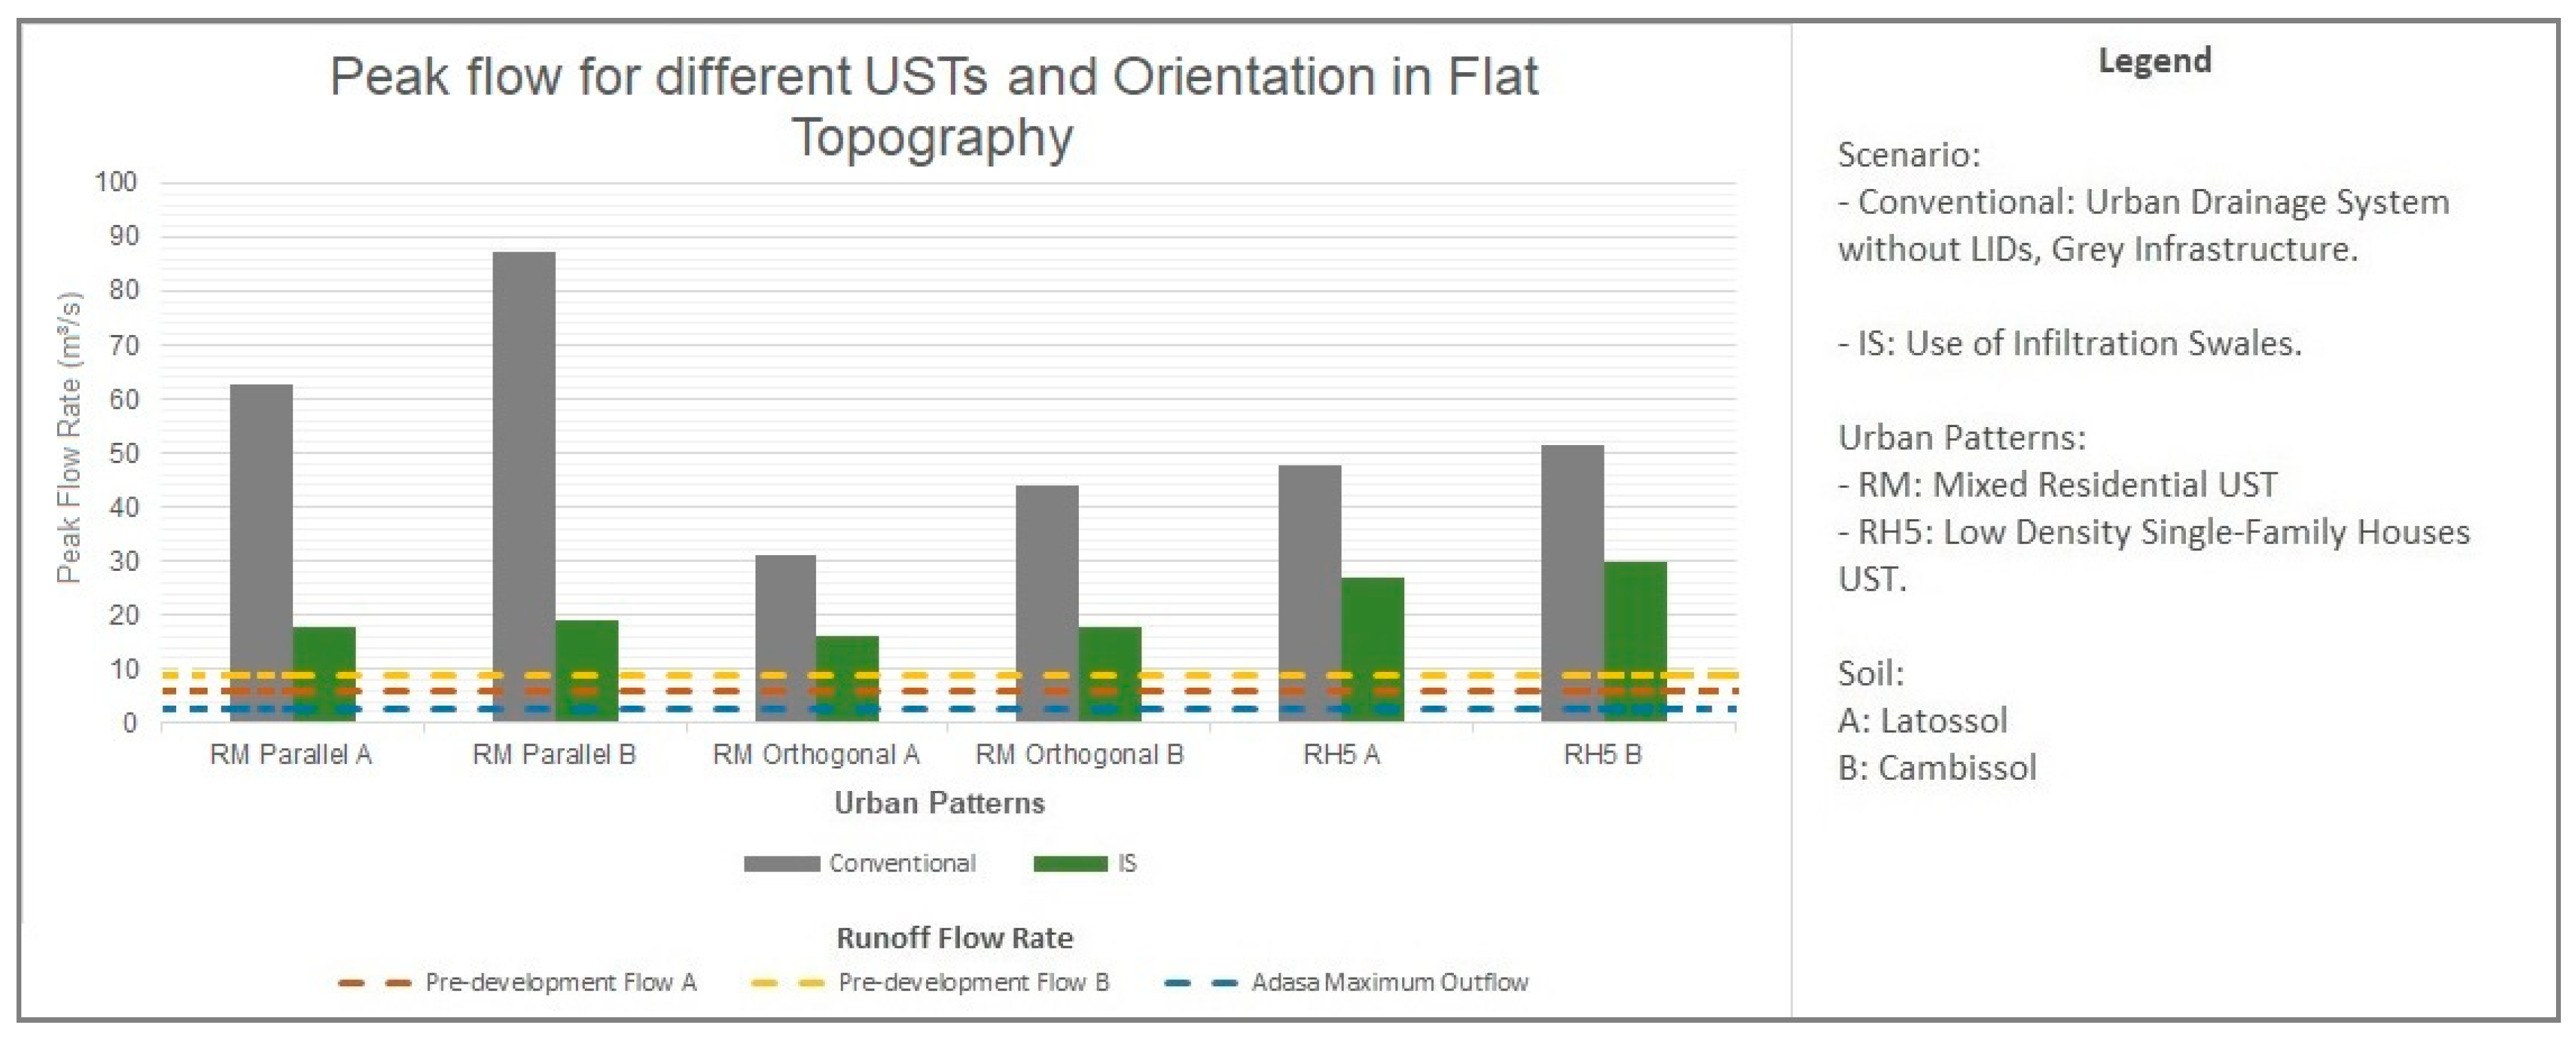
The conventional drainage system and including infiltration swales were analyzed for a designed rainfall with 10-year return period.
The urban pattern Mixed Residential UST (RM), parallel to the contour lines on the divergent–convergent topography, led to the lowest peak flow and, consequently, to the mildest impact compared to the predevelopment natural condition of the area. The UST with single-family housing and low density (RH5) generated the highest runoff, reaching almost four times the predevelopment runoff peak for both landforms analyzed.
Notably, the relative position of the blocks and the contour lines only had a slight influence on the stormwater peak flow. However, mixed residential allotment led to an 8% higher runoff than the parallel disposition of the blocks.
The results of the peak flows for different urban patterns and orientations with a divergent–convergent topography, using conventional and swale systems, are presented in
Figure 11 and
Figure 12.
On the divergent-convergent surface, the parallel disposition of the squares at the UST RM had a lower runoff peak rate. This result highlights that the disposition of the blocks in relation to the contour lines can take advantage of the environmental conditions in both studied surfaces, thereby contributing to a better division of the contribution areas and a type of compactness that enhances the hydraulic capacity of the drainage system.
Moreover, for the scenario with RH5 on soil B, the divergent-convergent topography led to a lower runoff rate in comparison to the strictly convergent and divergent surfaces. The divergent characteristics of the surface tend to accelerate the runoff, and the convergency tends to enhance the infiltration process.
Unlike the results of the USTs located on flat hillslopes, the UST RM blocks orthogonal to the contour line configuration led to a lower runoff compared to the parallel disposition squares. Considering the inclusion of infiltration swales inside the RM UST with the blocks orthogonal to the contour lines, the generated flow rates reached values close to those of the predevelopment conditions under both topographic configurations. The inclusion of IS led to good results for the RH5 UST on soil B and convergent topographic conditions. However, it yielded poor results for divergent topographic conditions, indicating that convergent topography enhances infiltration by concentrating the flux towards the IS.
The orthogonal disposition of the blocks can be considered more advantageous for the use of green infrastructure devices. The UST RH5 led to a significant impact on runoff flow; thus, flow damping was more difficult, and desirable levels were not achieved using only infiltration swales. In this case, the use of detention ponds downstream would be required to comply with the water agency’s maximum flow rate discharged requirements.
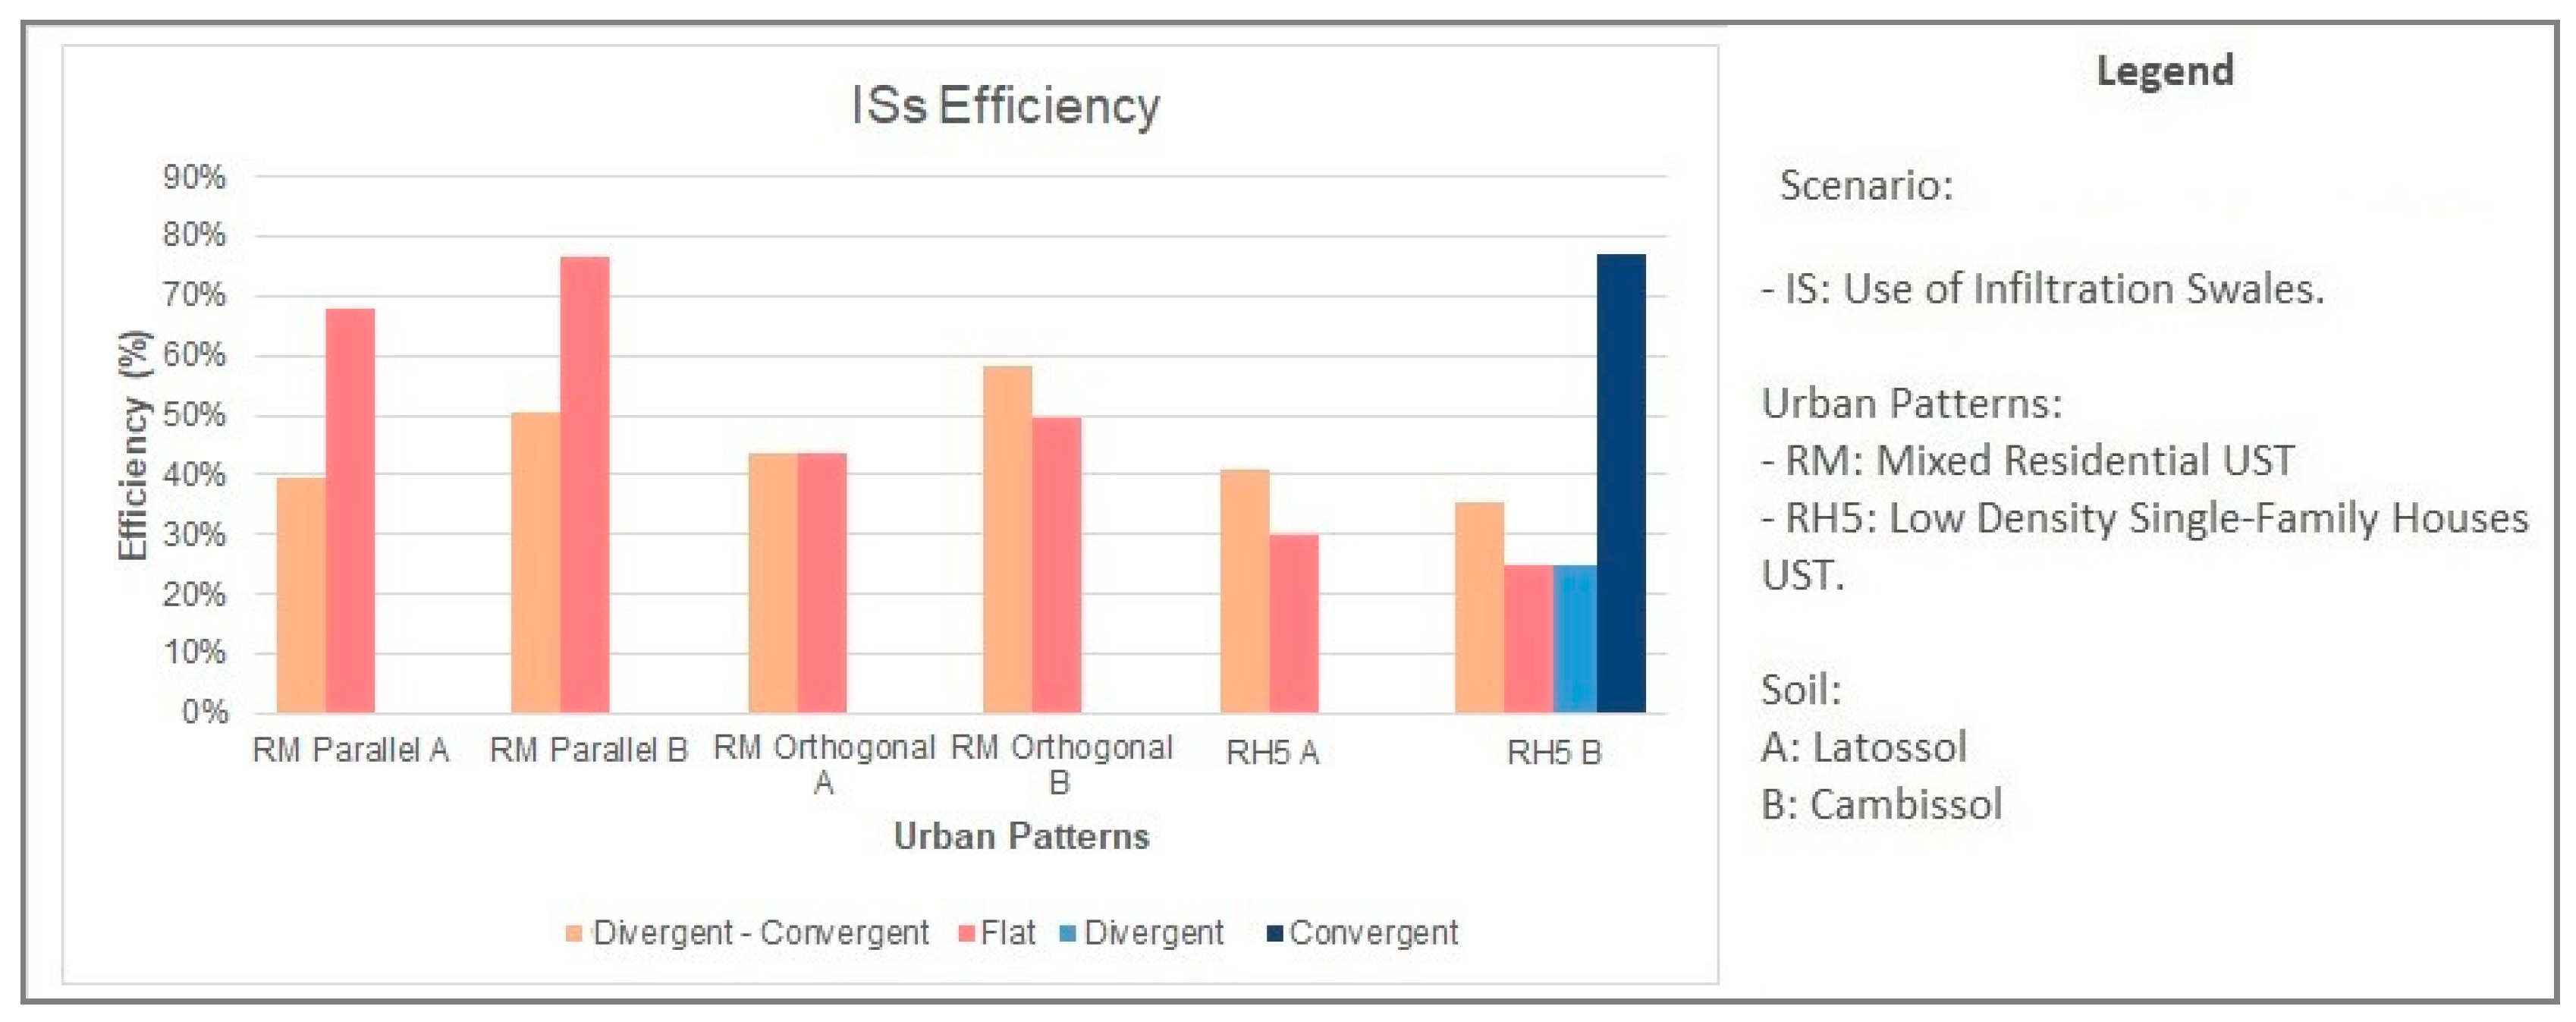
The infiltration swales offered better average performance for the convergent and flat topographies compared to other surfaces. The infiltration swales in UST RH5, as expected, had the worst performance among the USTs (
Figure 13).
The LID efficiency is also related to the relation of the IS area and the total drainage area. Further, the UST public area availability determines the feasible area of the IS. The UST with the highest relationship to the IS area and drainage area is the RM. Observing the square disposition, the ISs yielded better efficiency with the parallel configuration of the squares. For the UST RH5 soil B scenario, the flat and divergent topographies led to almost the same efficiency when using IS controls. Moreover, the convergent topography (even under impervious soil conditions) led to a high capacity of detention and infiltration using the IS controls.
3.2. Impact of Urban Patterns on the Cost of the Drainage System
The cost of the drainage system for each UST allotment was evaluated following the procedure established by the budget data model supplied by Novacap (2019) [
53], the company responsible for the construction and maintenance of drainage systems in the Federal District, along with the unit costs currently used in Brazil (SICRO, SINAPI, and TCPO [
56,
57,
58]).
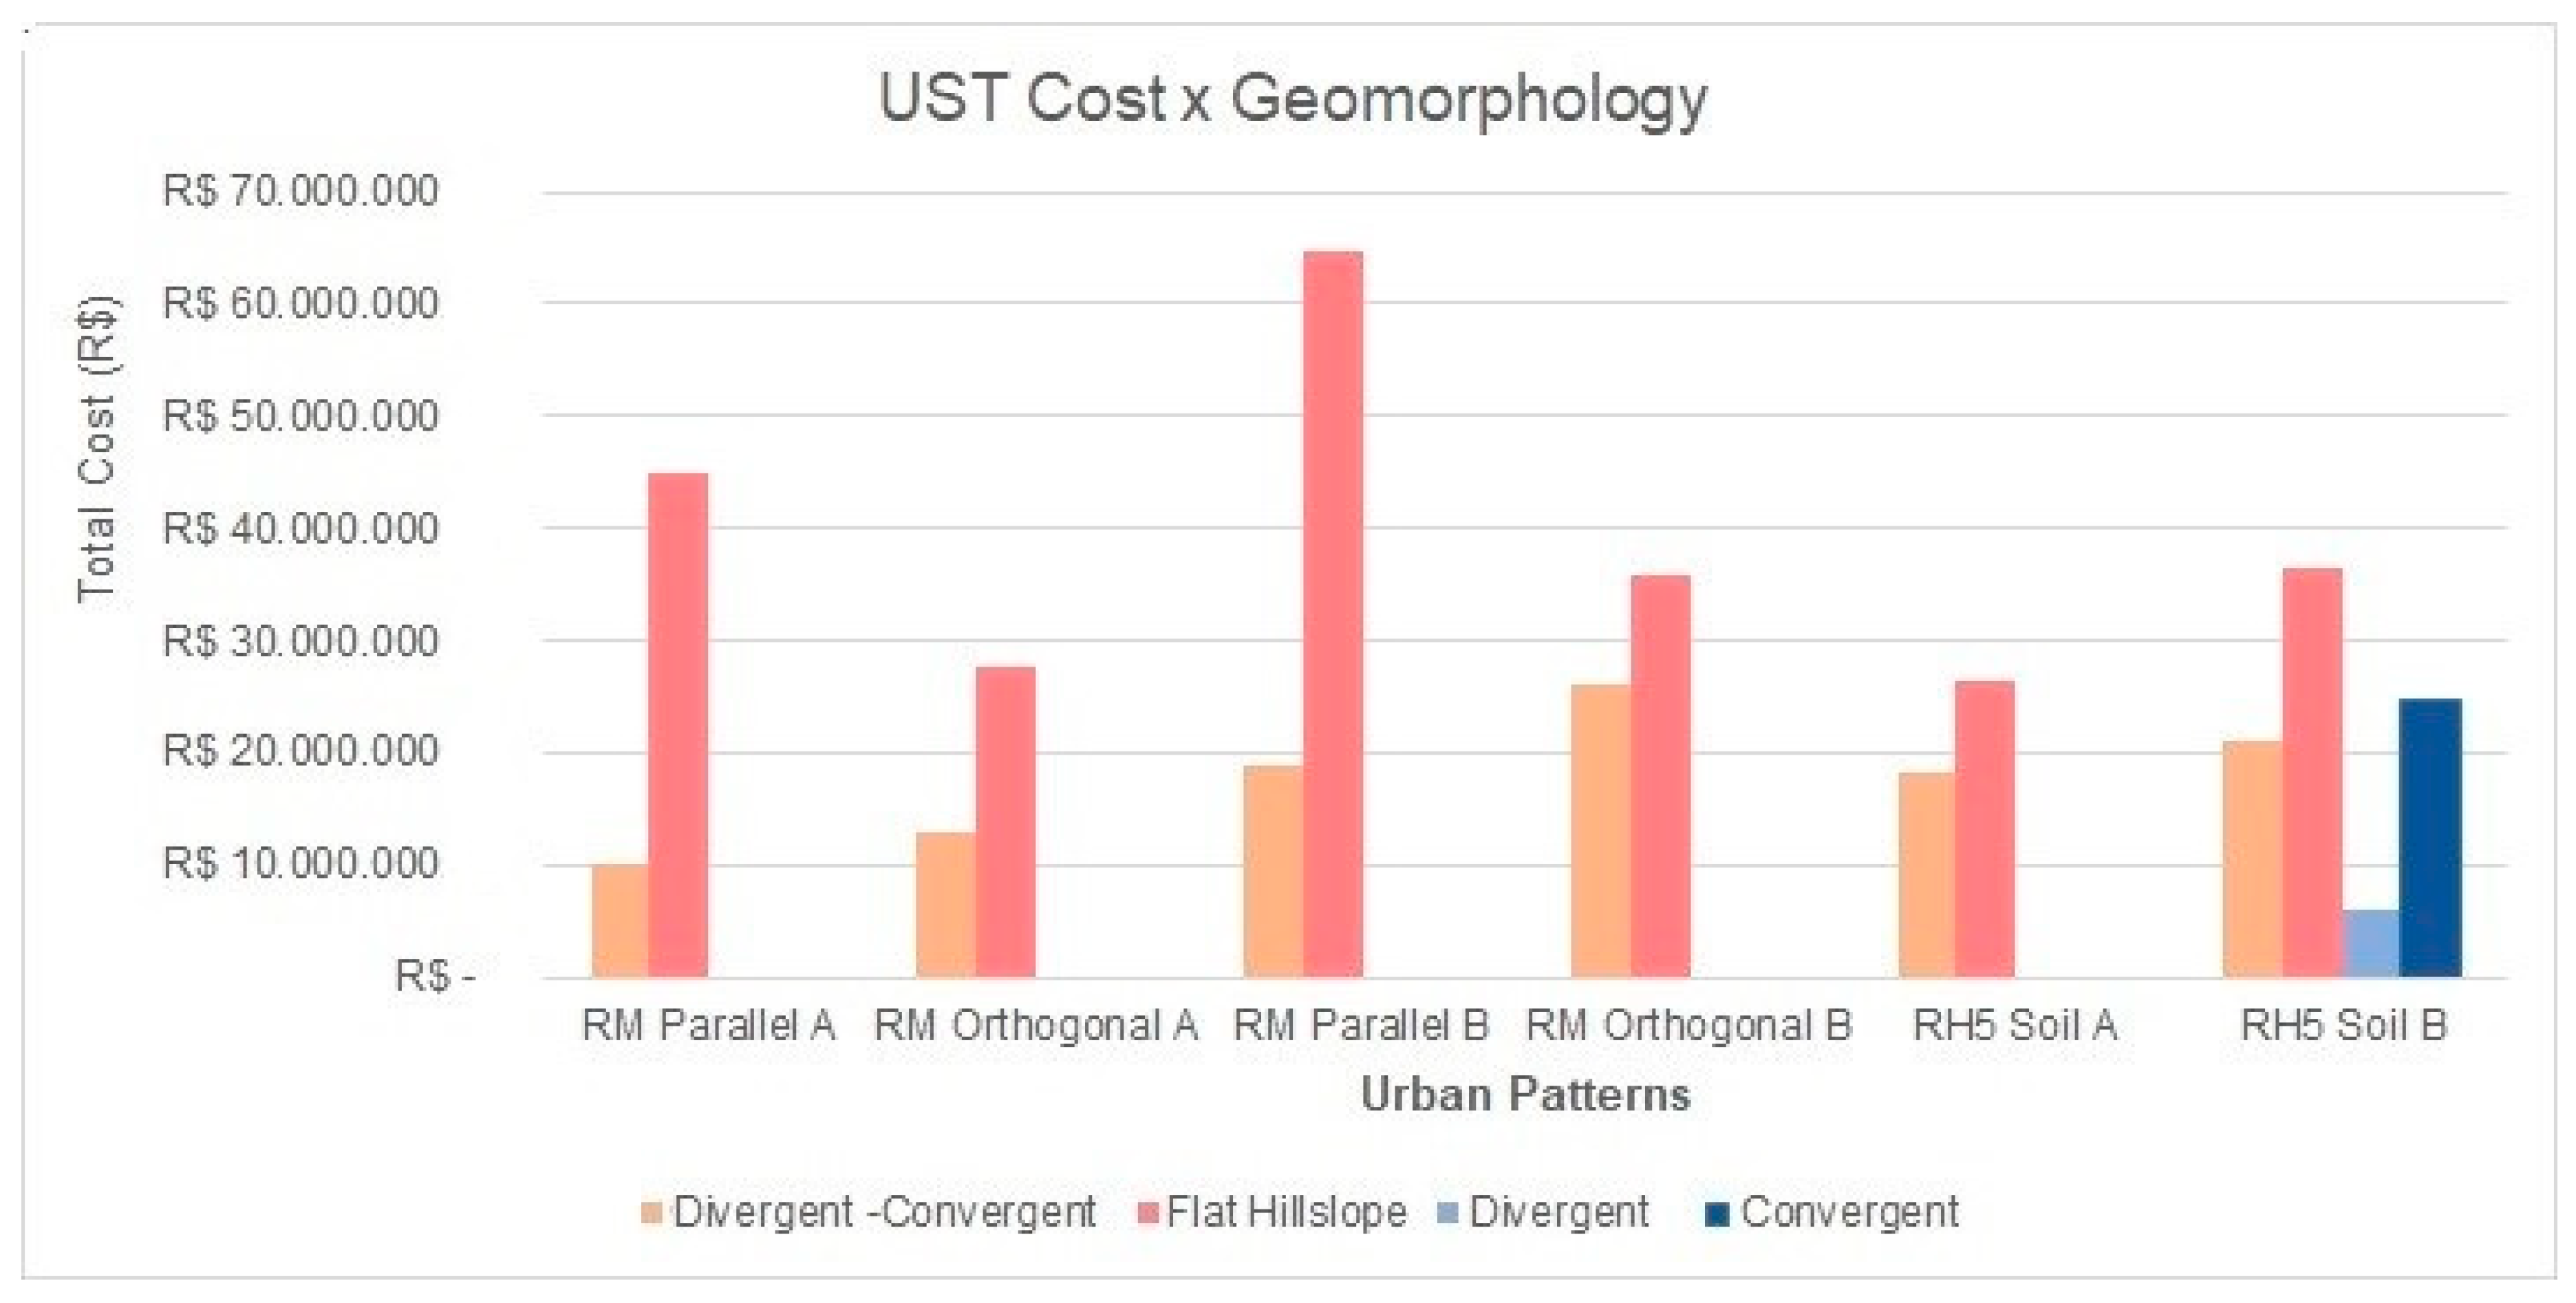
The cost of the system took into account major costs such as excavation, materials, transportation, surface preparation, pipes, and manhole installation/construction, backfilling, and soil compaction. The results are shown in
Figure 14, where the total costs for different USTs, topographies, and soil types are shown. The executed drainage system is presented per meter in the local currency (Reais).
In this study, the flat hillslope topography led to higher costs than the divergent-convergent surface due to the former’s larger diameters. The average conduit slope for the RM UST on the flat hillslope was around 3% in both dispositions, and the maximum conduit slope was 12.1%. For the UST RH5, the average conduit slope was 2.6%, and the maximum slope was 5.8%.
For the UST RH5 soil B scenarios, the strictly divergent surfaces provided the lowest total cost because the stormwater network designed in this relief has less concentration in its runoff peak flows, and its conduits are branched, distributing the runoff peak flows efficiently (and, therefore, not requiring large diameters). On the other hand, the drainage at the convergent surface concentrates the outflows of the basins at the main conduits in the avenues, thus requiring the use of larger diameters. In this topography, we also observed the design of the network to be shaped like a “spine”, suffering backwater effects in almost all the conduits and decreasing the conduits’ efficiency.
The highest drainage system cost was for RH5 (in both soil types) compared to RM UST due to its high percentage of impervious surfaces and few green and open spaces. Moreover, the urban fabric of RH5 does not allow many choices for a better location of LIDs that could improve effectiveness.
The divergent-convergent surface led to smaller diameters due to the runoff division. Thus, it was necessary to compare the topographies on a hillslope. To carry out this comparison, the evaluation included both strictly convergent and strictly divergent hillslopes. In one of these scenarios, RM parallel soil A had a maximum width of 1500 mm. Moreover, this relief facilitated a better division of the subcatchments and ramifications of the drainage network. This is shown in
Supplementary Materials with the design of the blocks and drainage systems. The divergent surface also allowed a better distribution of the contributing basins to the stormwater conduits, leading to conduits with a maximum diameter of 1500 mm, as shown in
Supplementary Materials. The convergent surface required the use of diameters around 3000 mm, thus demonstrating the concentration of the runoff peak flows at the outflow. The design of the conduits and dimensions are presented in
Supplementary Materials.
3.3. Water Balance and the Provision of Groundwater Recharge
The urban patterns situated on the different types of soil and topographic arrangements were analyzed in terms of their water balance under continuous simulations using SWMM.
Table 2 shows the water balance, demonstrating the influence of urban patterns on ecosystem service provisions and resilience.
The results show that the infiltration swales can greatly enhance the provision of groundwater recharge-in some cases, by up to 20% for the soils with a low capacity of infiltration. Moreover, the evapotranspiration rates remain steady in all scenarios.
On average, the divergent-convergent topography, compared to the flat topography, had a higher infiltration index. Surprisingly, the RM Parallel allotment had a more significant infiltration rate in the flat than in the divergent-convergent hillslope. This is possibly related to the position of the blocks relative to the relief contour influencing the average slope of the contribution areas, thereby making the flat surface more favorable to infiltration. As expected, the convergent surface led to a higher infiltration compared to the divergent surface [
37,
38,
40]. The effective groundwater recharge values were estimated using Equation (3). The results are shown in
Table 3.
These values show that ISs can greatly improve groundwater recharge ecosystem services—on average, by 63% for the flat surface and 67% for the divergent-convergent surface. For strictly divergent and strictly convergent surfaces, the ISs improved in more than 20% the groundwater recharge ecosystem services for both topographies while adopting the worst type of soil. The topography had a small influence on this ecosystem service. The UST that led to the best provisions without using IS controls was the RM Parallel for both landforms analyzed.
This small influence of the topography is related to the rainfall patterns derived from the observed data and used in the continuous simulations. Most of the rainfall has low intensity for all landforms. The infiltration capacity is not reached for these rainfall events, which accounts for most of the rainfall height.
The UST that led to the worst provision of groundwater recharge is RM Parallel soil B on the divergent-convergent surface and RM Orthogonal B on the flat surface, showing the importance of the position of the blocks.
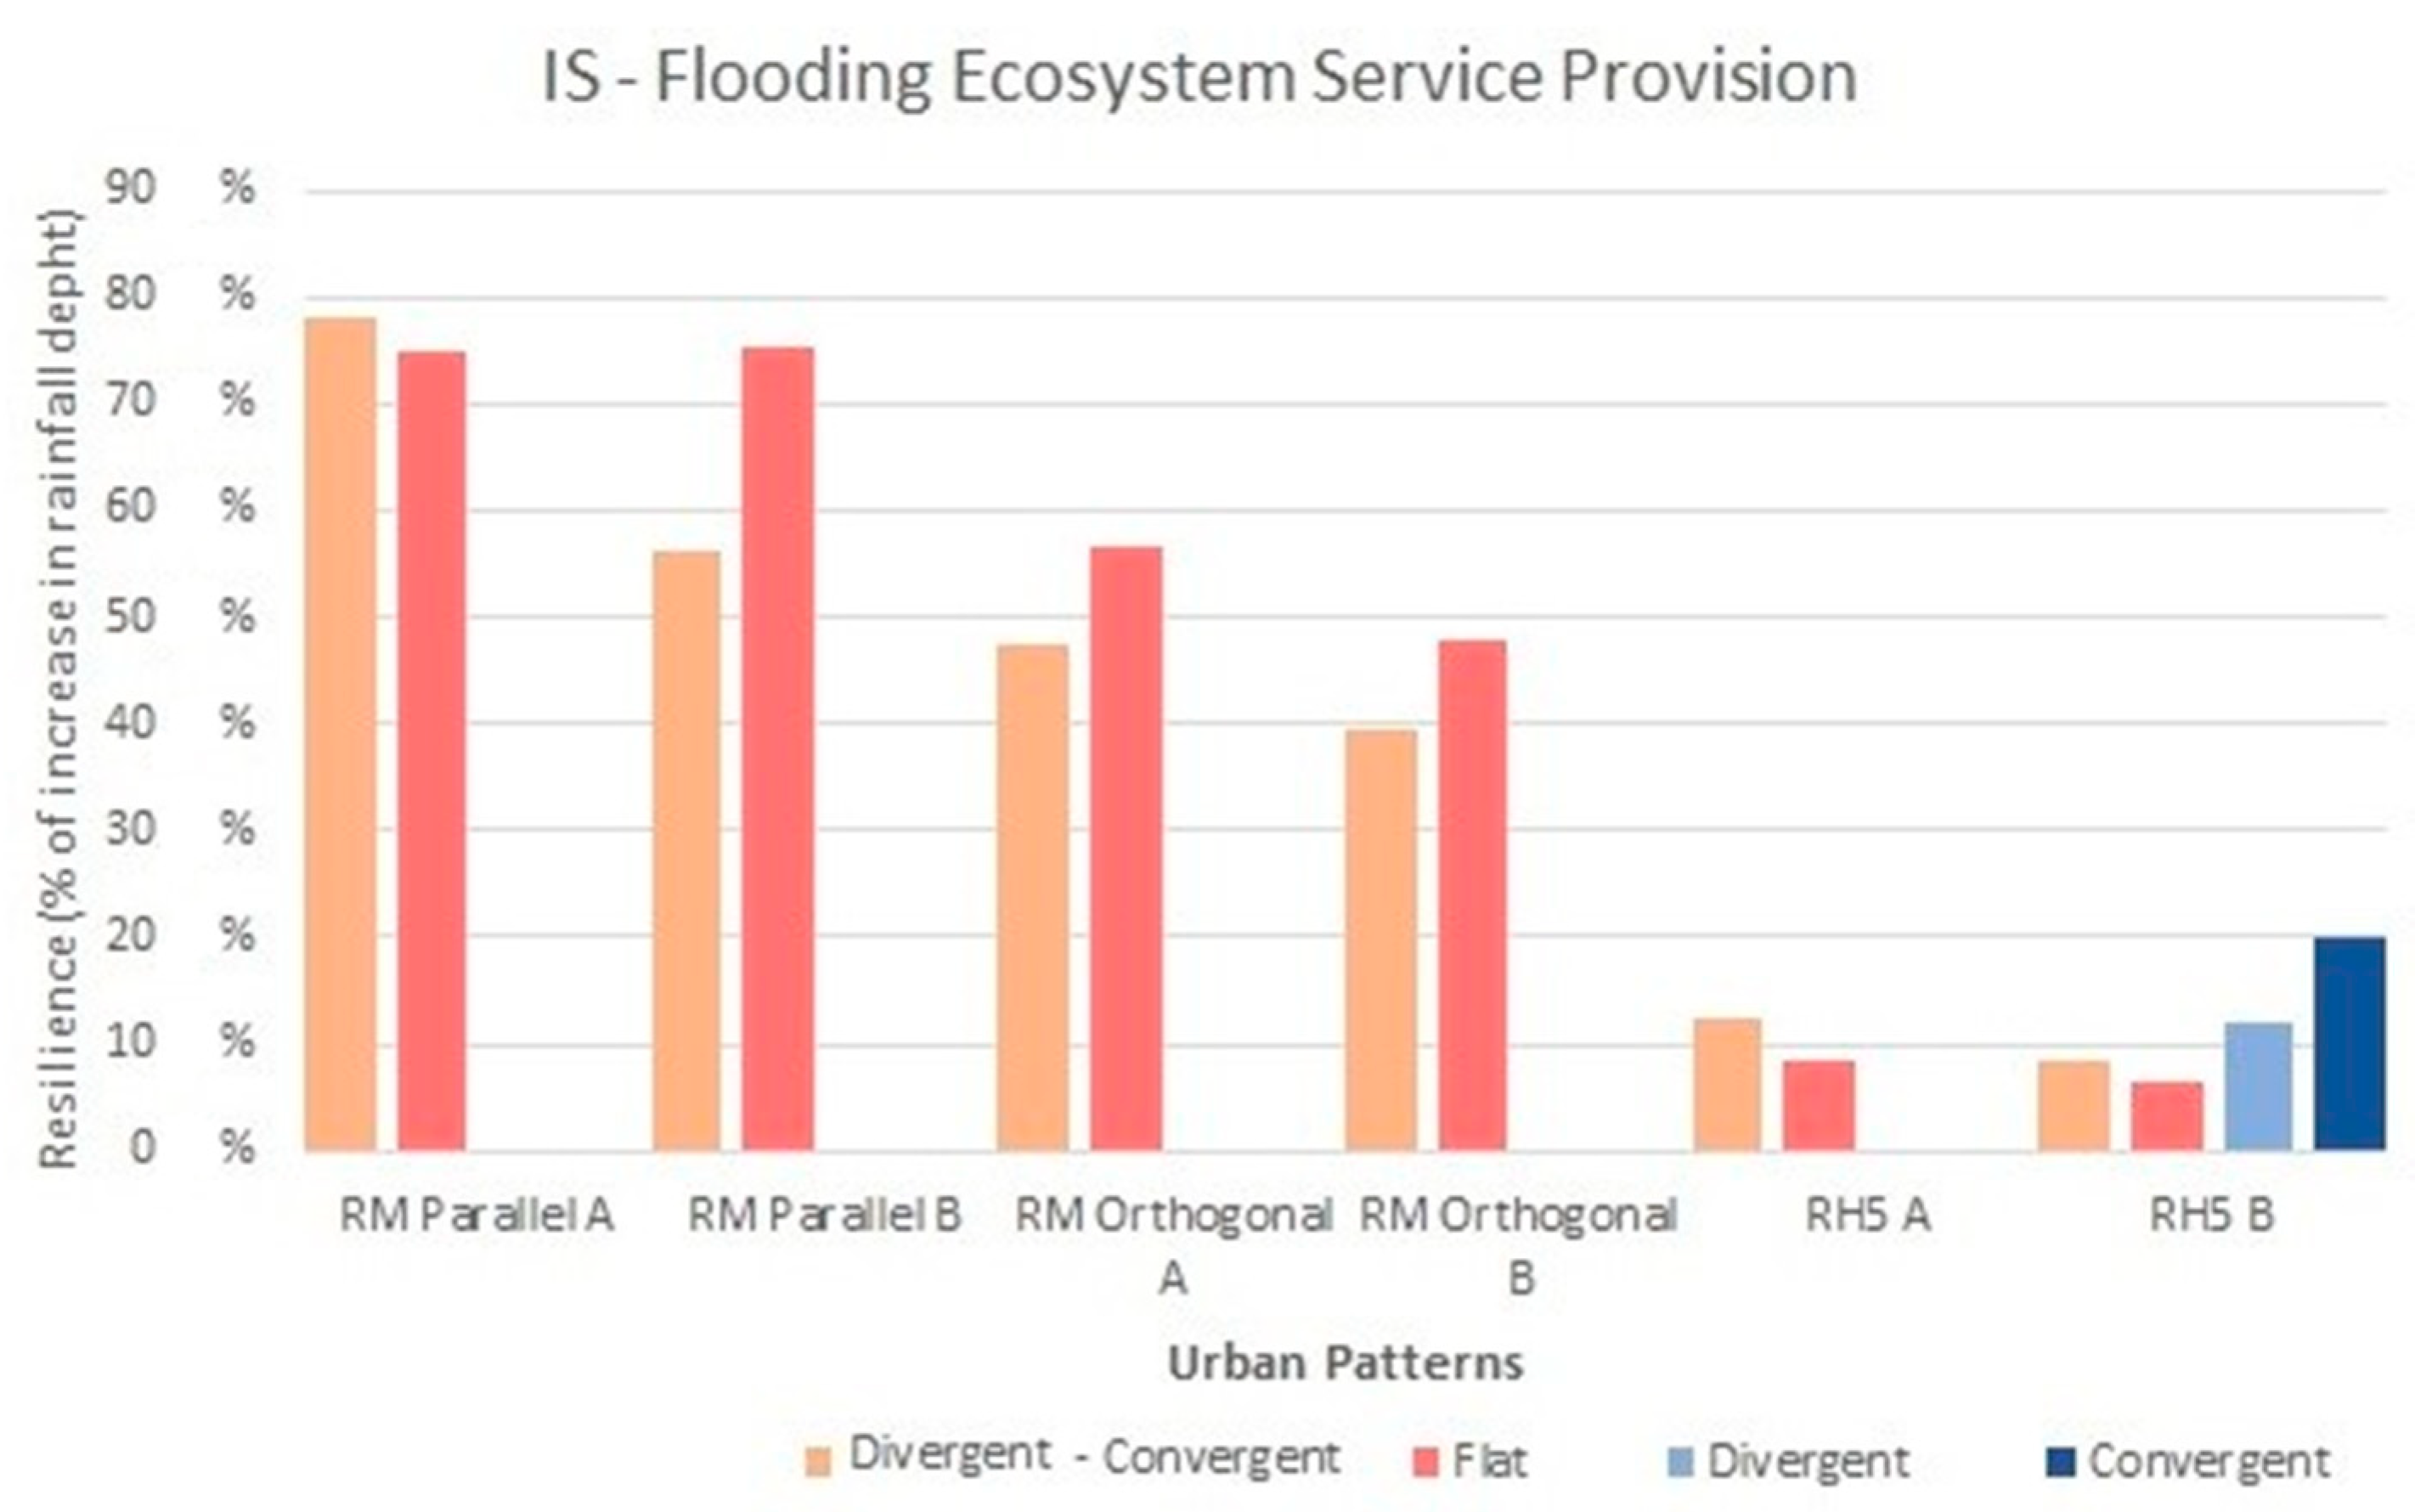
3.4. LID Provision of the Flooding Ecosystem Service
The analysis of the resilience that ISs can provide to urban morphology was focused on estimating the rainfall depth that the ISs can absorb, thus avoiding surcharging nodes or conduits in the drainage system.
In the simulation process, flooding was considered to occur when at least two drainage system manholes are flooded, and a significant part of the conduits experience surcharging conditions. The provisions of flooding ecosystem services were evaluated while considering the rainfall depth necessary to create flooding conditions for a conventional drainage system and the system including ISs. Equation (4) was used to evaluate the resilience in percentage terms.
Figure 15 shows the values of resilience in terms of the capacity gained using ISs.
The return period used to determine the storm rainfall necessary to cause the drainage system to flood is also a measurement of the increase in the system resilience provided by the IS inclusion.
Table 4 shows this increase in the return period in relation to the return period for the conventional drainage system (obtained using Equation (5)).
The flat surfaces provided better results with the UST RM in both dispositions of the squares. The convergent surface led to better results with the UST RH5, likely because, on this surface, the water is conveyed to the main avenues where the ISs are located.
The UST that provided the highest reduction is the RM Parallel soil A on the divergent-convergent surface, and the worst provision is connected to the UST RH5 in both soils and surfaces. The relationship between the LID area and the catchment area is higher for the UST RM Parallel configuration than UST RH5. Another relationship that could be connected to these results is the number of open spaces and green areas, which are much more numerous in mixed residential urban morphologies than in single-family houses with low density.
3.5. The Water Quality Impacts of Infiltration Swales in Urban Areas
Stormwater pollutant loads were considered as a proxy by accounting for the amount of stormwater retained by the ISs, assuming that the ISs retain water from the first flush and thus contribute directly to reducing the pollutant loads, following the discussion in [
31,
32,
33,
34,
35,
36] and others.
Runoff was quantified for each UST and topographical condition using both the conventional drainage system and an IS scenario. The results were evaluated by comparing the quantity of the runoff water (in millimeters) reduced by the IS. This reduction could be linked to runoff water quality improvement, considering that the first water was collected by the ISs, as calculated using Equation (6).
Table 5 presents the percentages of the reduction of runoff.
On average, the divergent-convergent surface generated up to 3% more efficient performance in terms of runoff volume reduction than the flat surface. This could be related to the IS efficiency and topography, which have an influence on the amount of infiltration and runoff generated.
The convergent surface was double the size of the flat surface, and the divergent surface had a small increase in quality compared to the divergent-convergent surface and the flat surface.
4. Conclusions
The study of urban morphology brings together important relationships between stormwater infrastructure and ecosystem services. In this paper, we assessed the impact of two residential Urban Structure Types and the local topographical conditions on the drainage systems and water ecosystem services.
UST Mixed Residential systems, prevalent in parts of Brasilia, are an urban pattern with a high possibility of ecosystem service provisions when situated using most topographical configurations with LIDs installed. Plenty of spaces are available inside the urban configuration. Nevertheless, the experience in Brasilia has shown that flooding, low pollutant retention, and low infiltration are present, indicating the needs and opportunities for implementation. The results also highlight the relationship between block positioning relative to the topography, which can lead to an improvement of the total infiltration and runoff characteristics, which is an important factor for future developments.
This study suggests that the RH5 urban morphology, the single-family housing type prevalent in most neighborhoods of the Federal District (even in low income residential areas), should be adopted only in areas featuring soils with high infiltration capacity due to the significant percentage of impervious surfaces and because the urban configuration does not allow the extensive use of LIDs to control runoff, leading to the need for downstream solutions, such as detention ponds. The drainage system costs are higher compared to those of the mixed residential urban pattern in all cases.
In this study, it was possible to analyze some of the ecosystem service assessments discussed in the literature. Here, we suggest applying quantitative evaluations using urban hydrology concepts, legal restrictions imposed by water resource regulation agencies, laws of allotment, and reference terms to design drainage systems. There is a strong correlation between the stormwater network and the ecosystem services related to the water cycle in urban areas. Hence, assessment of the provision and impacts of these services must take this relationship into account.
The UST RM in the parallel configuration showed consistent results for the provision of ecosystem services in the urban area for all topographies. The IS scenario also reinforces this characteristic of the block disposal. In Brazil, stormwater management is usually thought of as a means to mitigate problems and not as an a priori solution to avoid them. Thus, the implementation of solutions comes later. Therefore, if urban planning considers at least some shared concepts, future problems could be solved at lower costs.
This study was based on two commonly adopted urban morphologies in the Federal District, and thus we did not discuss other types of USTs that could better suit the region. However, other studies have shown that urban patterns designed to consider topography (that include LIDs in their conception) can strongly reduce runoff generation and improve the provision of ecosystem services [
6,
11].
LIDs are important for the improvement of consolidated urban areas to minimize runoff generation and diffuse pollution propagation, thereby maximizing infiltration and groundwater recharge and conserving water resource quality and quantity in urban areas.
The main results demonstrate that considering topography for urban planning can influence runoff generation and ecosystem service provisions. Drainage system costs tend to be higher for USTs on flat surfaces with steep slopes due to the peak flows at the outlet and the need to use energy dissipation techniques. A divergent-convergent type provides a better provision of ecosystem services, lower drainage costs, and higher LID performance.
Further studies are being developed using different urban morphologies. The present research will contribute to the synergy between the laws of allotment, land use planning, and stormwater management, regulations, and maintenance.


