Article

Potentialities of Vehicle Trajectory Big Data for Monitoring Potentially Fatigued Drivers and Explaining Vehicle Crashes on Motorway Sections

1
Urban Science Institute, Incheon National University, Incheon 22012, Korea
2
Department of Transportation Engineering, University of Seoul, Seoul 02540, Korea
*
Author to whom correspondence should be addressed.
Sustainability 2020, 12(15), 5877; https://0-doi-org.brum.beds.ac.uk/10.3390/su12155877
Submission received: 18 June 2020 / Revised: 17 July 2020 / Accepted: 18 July 2020 / Published: 22 July 2020

Abstract

:
Task-related fatigue, caused by prolonged driving, is a major cause of vehicle crashes. Despite noticeable academic achievements, monitoring drivers’ fatigue on road sections is still an ongoing challenge which must be met to prevent and reduce traffic accidents. Fortunately, individual instances of vehicle trajectory big data collected through advanced vehicle-GPS systems offer a strong opportunity to trace driving durations. We propose a new approach by which to monitor task-related fatigued drivers by directly using the ratio of potentially fatigued drivers (RFD) to all drivers for each road section. The method used to compute the RFD index was developed based on two inputs: the distribution of the driving duration (extracted from vehicle trajectory data), and the boundary condition of the driving duration between fatigued and non-fatigued states. We demonstrate the potentialities of the method using vehicle trajectory big data and real-life traffic accident data. Results showed that the measured RFD has a strong explanatory power with regard to the traffic accident rate, with a statistical correlation of 0.86 at least, for regional motorway sections. Therefore, it is expected that the proposed approach is a feasible means of successfully monitoring fatigued drivers in the present and near future era of smart-mobility big data.

1. Introduction

Given that automobile driving is a critical safety task and also a daily socio-economic activity, automobile crashes are a major cause of enormous socio-economic losses (e.g., severe injuries, deaths, and economic losses) [1,2,3,4]. For instance, road traffic crashes caused 1.25 million deaths and cost governments around 3% of GDP globally in 2013 [5]. A review of the literature suggests that the majority of road-related crashes are generally attributed to drivers’ faults, which could have been prevented [6,7,8]. Hence, in order to analyze and prevent road traffic crashes more efficaciously, noticeable academic efforts to explore and determine significant factors that may affect vehicle crashes have been made in the field of road transport safety.
One significant factor from academia and driver experience is known as “driving fatigue.” The term “driving fatigue” has been defined as a state of deteriorated mental alertness [9], a transient period between awake and asleep [10], and physiological and psychological processes [11], all of which, if left undisturbed, impact on the abilities of drivers to perform driving tasks safely. There is a consensus that driving fatigue is a direct or contributing cause of road traffic accidents, especially on motorways [10,12,13,14,15,16,17,18]. Prolonged and monotonous driving on motorways increases driving fatigue [1,9,10,19], which in turn significantly affects fatigue-related vehicle crashes [11,12,14,16,17,18,19,20,21,22,23,24].
Driver fatigue related to vehicle crashes is caused by the driving duration, monotonous environments, sleep deprivation, and drug and alcohol use [1,17,25,26,27], out of which the driving duration (i.e., the time-on-task) is a well-known and compelling cause of driving fatigue under ordinary driving conditions [17,28]. On the other hand, fatigue as a theoretical construct may not be directly observable, but its temporal development accompanies phenomena which can be detectable by countermeasures [21,29]. Naturally, many investigations have been conducted to demonstrate the nexus between time-on-task and fatigue progression using various countermeasures which are linked to physiological activity and driving performance. The details of fatigue countermeasures and detection technologies have also been presented in previous studies [10,11,21,29].
Electroencephalography (EEG) brain-activity signals, categorized into four different bands (i.e., α , β , θ , and δ waves), are among the most reliable and reproducible indicators to detect the psychological impacts of (monotonous) driving durations on fatigue development [30,31,32]. In studies using four types of EEG algorithms (e.g., α / β , ( θ + α ) / β , ( θ + α ) / ( α + β ) , θ / β )), it was proven that EEG signals change significantly and thus, can be effectively utilized to monitor fatigue progression according to the driving time [30,31,32,33]. For instance, the EEG spectral power ( α and θ waves) during excessive driving decreases with awareness [34] and then increases with sleepiness [34,35]. The frequencies of α and θ waves increase during monotonous driving tasks [31]. β wave activities increase considerably at alertness levels and then decrease at drowsiness levels [33]. It was also demonstrated that a combination of α , β and θ waves (i.e., ( θ + α ) / β ) can be effectively employed to detect microsleep events (i.e., short episodes of sleep) [33].
Physiological countermeasures connected to heart, eye, and dermal activities are also used to detect driver fatigue directly or indirectly. Heart activities (e.g., the heart rate and heart rate variability), as measured by electrocardiography, are closely associated with the duration of a prolonged driving task. Research has shown that the heart rate decreases substantially when alertness decreases [1,32], while heart rate variability increases [1] only in cases of microsleep. Eye activities (e.g., blink frequency, eye closure) are used as direct fatigue measures, as driving is a visual-related vigilance task. The usefulness of eye-activity measures has been demonstrated in various studies. For instance, the frequency of blinking increases during low alertness or microsleep events, and eye closures also increase during deteriorated alertness and microsleep events [1,36]; a maximal threshold of eye closure is related to a state of hypovigilance [37]. Dermal activities such as the skin conductance level are indirect measures of attention and cognitive effort. For instance, the skin conductance level decreases in cases when alertness decreases during monotonous driving tasks [1].
Mental and physical fatigue impairs drivers’ cognitive abilities (i.e., perception, processing, responses) and driving performance. The impacts of driving fatigue on cognitive abilities and driving performances using various critical driving-related indicators (e.g., reaction time, speed, headway, steering wheel movement (SWM), line crossing (LC), lateral position) have been experimentally demonstrated in previous investigations [1,11,17,28,38,39,40]. It was found that prolonged and monotonous driving on motorways or rural roadways seriously impairs drivers’ reaction times and driving skills. For instance, the mean reaction time increases significantly from 0.7 to 1.0 s when the time-on-task exceeds 90 min, and the reaction time is highly correlated with other performance indicators [17]; the temporal variation of the reaction time is highly correlated with that of α / β , while monotonous driving [28], speed and LP variations, the average headway, and the frequencies of SWM and LC all tend to increase with the driving time [17]. Speed also tends to increase during microsleep events, though speed variations tend to decrease as alertness decreases, while the time to LC tends to decrease during both alertness and microsleep events [1].
Based on our literature review, it appears that there exists a next-step challenge that should be successfully met in the modern research on fatigue-related road safety, despite the fact that great achievements and meaningful findings have been made through painstaking academic efforts. The challenge is to expand the research directions from virtual driving simulations to real-life road sites based on the academic achievements and findings. That is, the challenge can be to explore and find analytic answers to the questions of how driver fatigue on real-life road sections can be monitored and the extent to which the characteristics of monitored fatigue are correlated with ground-truth vehicle crashes. The answers, if obtainable and useful, can then provide a new opportunity to more efficaciously analyze and prevent automobile accidents from the standpoint of driver fatigue.
To address this ongoing issue, a promising and practical method that allows the direct measurement of potentially fatigued drivers along a motorway network under the condition of vehicle trajectory big data is proposed for the first time in this field. This model is devised based on a direct and disaggregated big data-driven approach, sparing man-made artificial and complex mathematical formulae. The big data-driven approach is simplified for real-life applications, and it is designated to satisfy the computational time required in time-critical big data systems. This approach is also a feasible solution to the privacy policies which have been a chronic hindrance to the utilization of vehicle trajectory data in many cases. In this manner, a new measurement of the number of potentially fatigued drivers on any road section is computed, based on any type of actual vehicle trajectory big information. The feasible potentialities of the proposed method for monitoring fatigued drivers on any motorway section and understanding relationships between the monitored fatigued drivers and vehicle crashes are demonstrated through a case study with both vehicle-GPS trajectory big data and motorway traffic accident data based on observations. Finally, based on the case study results and certain findings, the limitations of the proposed method, and further research directions are given from academic and practical viewpoints.

2. Method

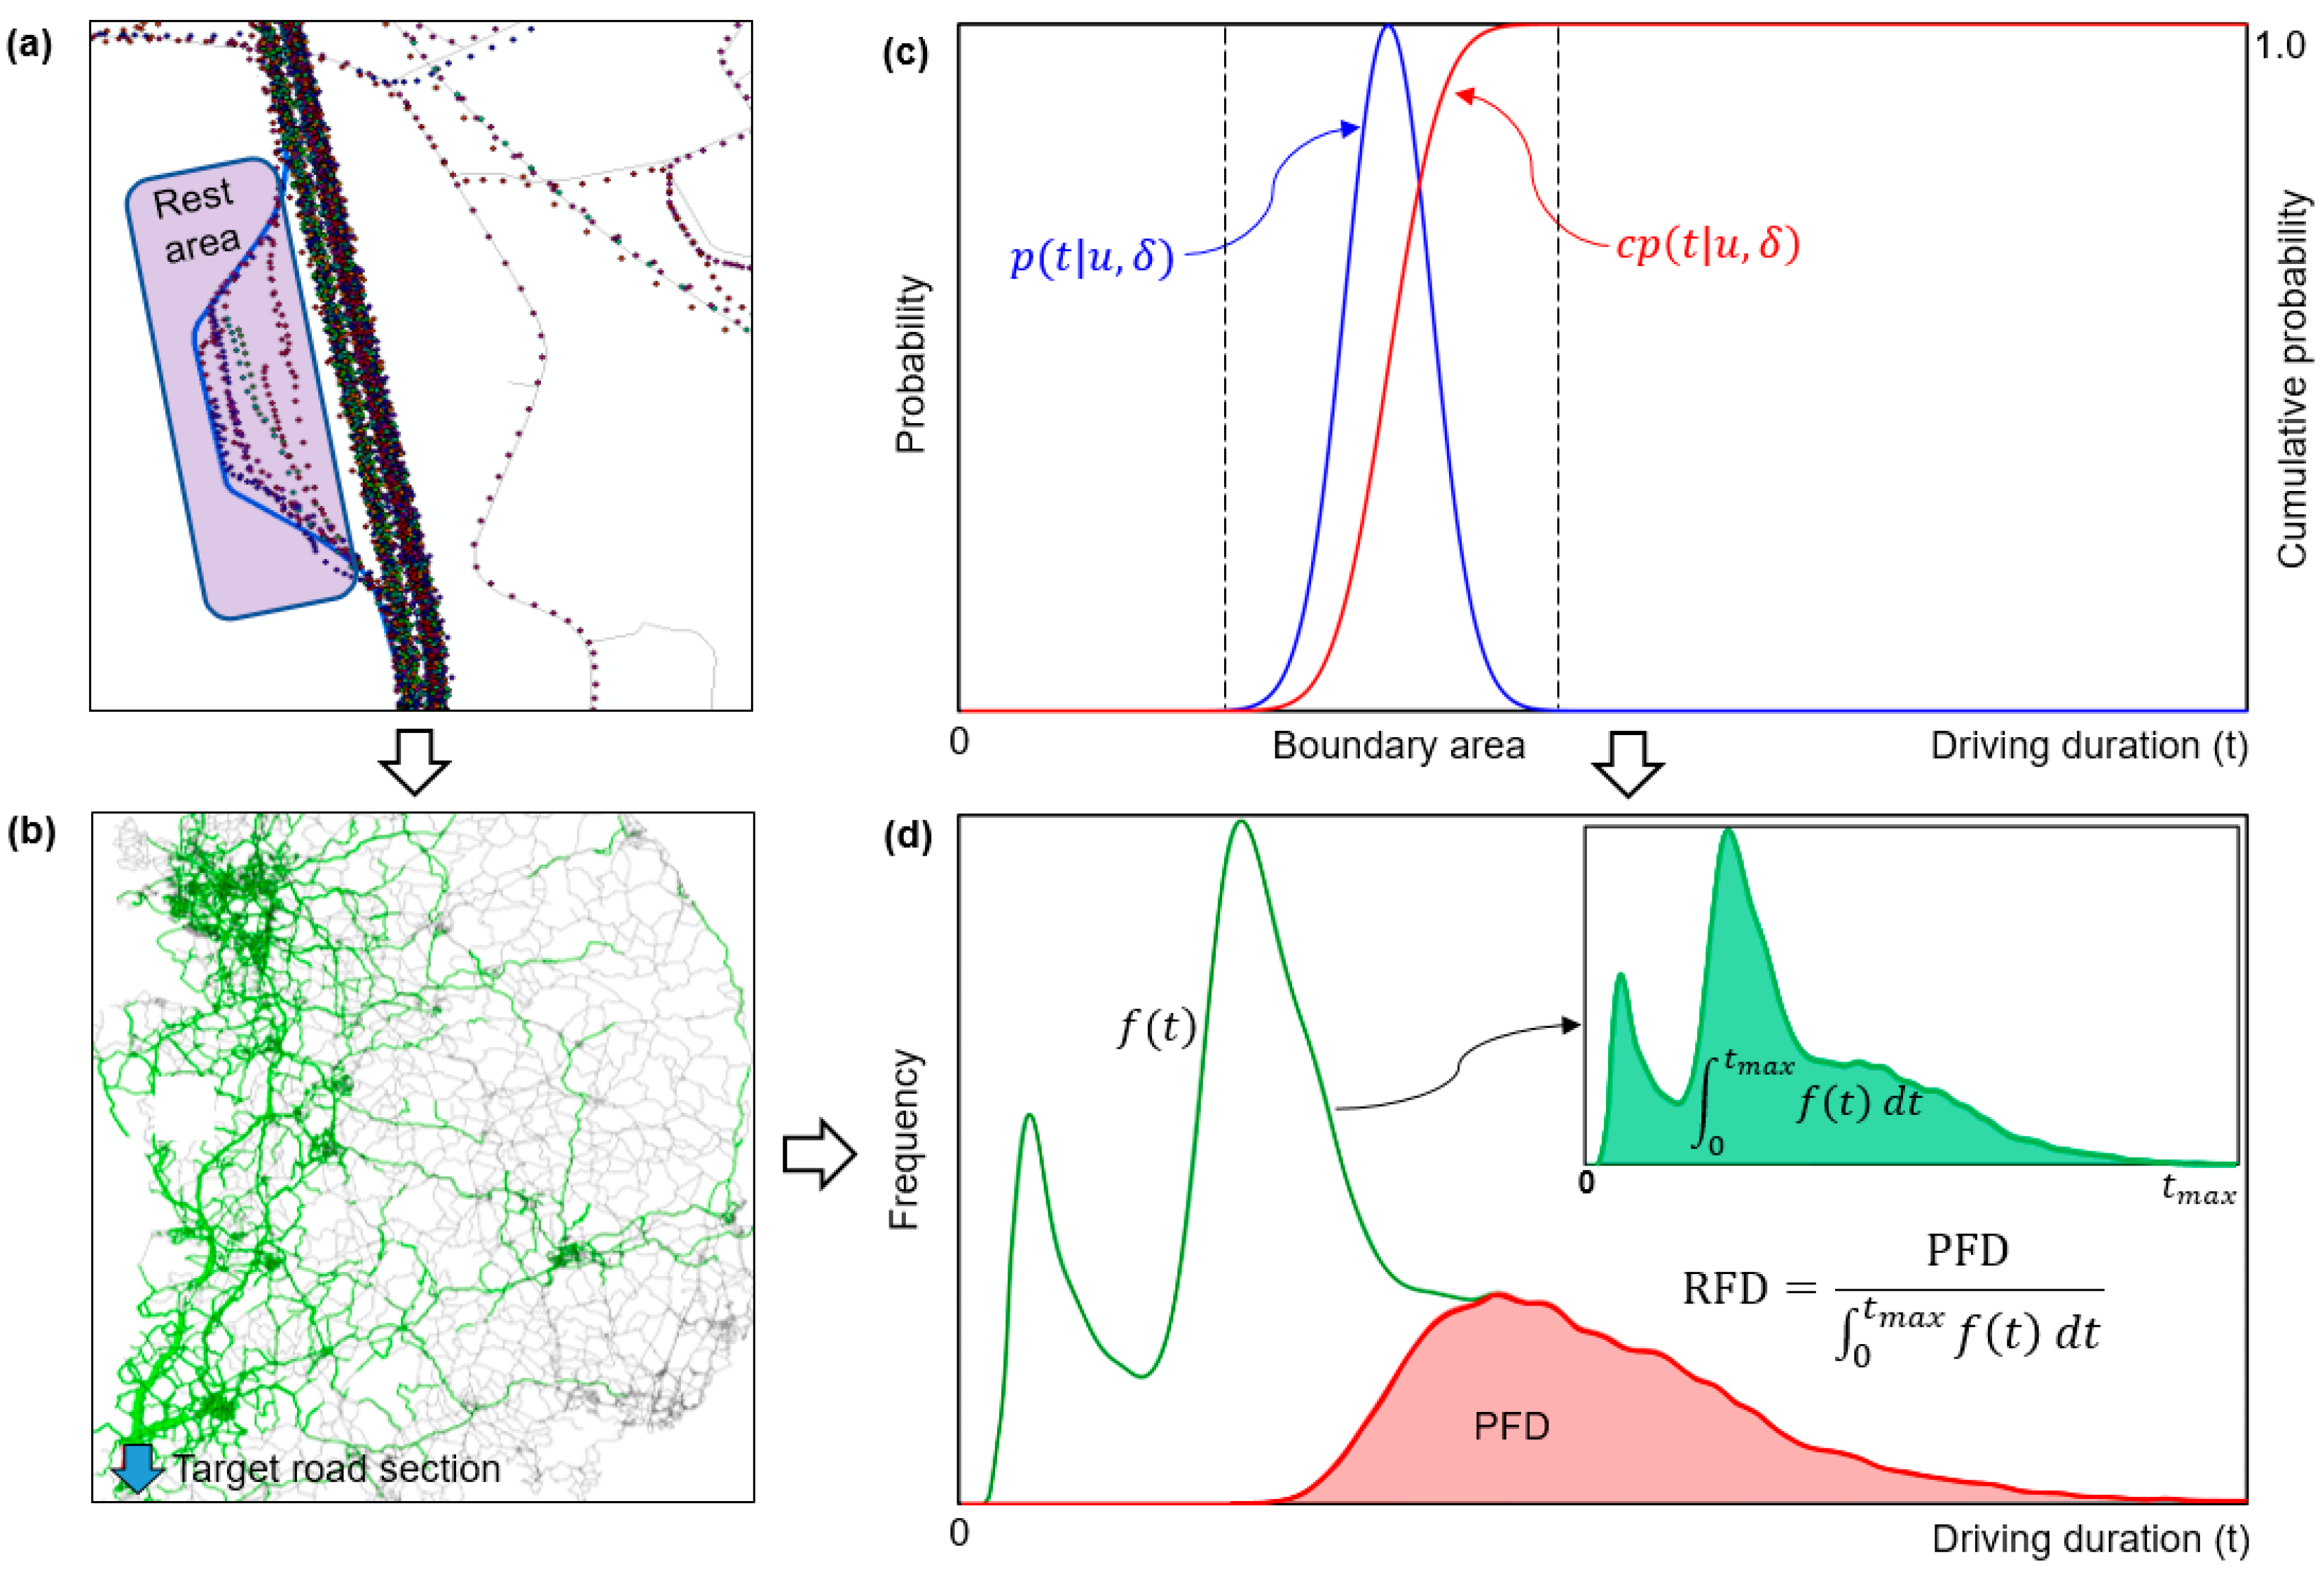
2.1. Approach Concept

It is self-evident that the driving duration (i.e., time-on-task) is a major cause of driver fatigue under typical driving conditions and in turn, that driver fatigue strongly affects the risk of an automobile crash. These facts present the opportunity to use the actual path travel times of individual vehicles on a road network, if available, to survey real-life driving durations and then to monitor the driver fatigue state along a road section. This opportunity can be realized through the GPS information (i.e., geographic coordinates) pertaining to vehicle trajectories, due to the fact that the driving durations of individual drivers along a chain of road sections can be directly and precisely tracked using individual spatiotemporal vehicle trajectories. Currently, vehicle trajectory big data are also collected through widely utilized vehicle-GPS devices and smartphone navigators.
To mine this opportunity, a method capable of measuring potentially fatigued drivers for any road section using vehicle-GPS trajectory data is proposed in this study. The proposed method is developed based on the following two concepts. The first concept is that the driving-duration distribution of drivers using a road section while utilizing vehicle-GPS devices has a high statistical correlation with that of all drivers using the same road section. This concept is also supported by the clear fact that the vehicle-GPS probe volume is a direct part of the vehicular traffic volume for a road location [41,42]. The second concept is that the physical and physiological conditions of drivers develop into a fatigue state when they experience driving durations greater than a time limit for continued driving. If the two concepts are reasonable, then a ratio of potentially fatigued drivers (RFD) to all drivers for a road section can be inferred using both the driving-duration distribution of drivers using vehicle-GPS and the time limit. As such, the RFD value can be efficaciously used for a risk analysis of fatigue-related vehicle crashes in itself due to the fact that the risk of vehicle crashes increases substantially during prolonged driving [17]. Despite this potential, no research on the monitoring of driver fatigue of a road section using the feature of the driving-duration distribution could be found in our literature review.

2.2. Measurement of Potentially Fatigued Drivers

The aim of this study is to directly monitor potentially fatigued drivers on a road segment using the RFD index. In order to compute the RFD of a target road section, two components (the driving-duration distribution of drivers using vehicle-GPS, and a time limit for continued driving) are defined, after which an estimation function to generate the RFD is proposed using the components. It is noted that using an average of driving duration as an independent variable cannot generate the RFD, even though a relationship can be identified between average values of driving durations and traffic accidents for road sections.
In this study, the driving duration ( t ) for a driver who uses a GPS system in the vehicle is regarded as the actual driving time from a departure location to the target road section. The actual driving time can also be obtained by removing the not-driving activity time at rest areas from the total travel time between the departure location and target road section (Figure 1a). Each driving duration of drivers from their departure locations to the target road section can be extracted through map-matching techniques (Figure 1b) and can then be compiled into a frequency distribution of the driving duration with a fixed interval of the driving duration ( Δ t ). Thus, let us define the distribution of t for anonymous drivers as a frequency function of f ( t ) , as shown in Figure 1c, to formulate the RFD, where 0.0 t t m a x , with t m a x as the maximum driving duration. It should be noted that this disaggregated approach is efficient and convenient for the collection and management of big individual data with a marginal error of Δ t / 2 in practice. This approach is also a feasible solution to real-life obstacles (e.g., computational time, data management and transmission, and privacy policies) especially in the case of utilization of vehicle trajectory big data.
Related to the time limit, safe limits for continued driving has been widely debated in driving simulation-based studies. For instance, a wide range of safe limits, including durations of 40 [1,43], 60 [11,33,44], and 80 minutes [17,45] were proposed, using various fatigue-symptom measures which are significantly related to the temporal development of driving fatigue. These safe limits were proposed based on the driving duration, a major fatigue factor, under typical and monotonous driving conditions. Driver fatigue is also commonly related to multidimensional causal factors such as the driving environments (e.g., road geometry, visibility, travel speed, traffic volume) [29,46], physiological conditions (e.g., sleep deprivation, chronic sleepiness, extended durations of wakefulness, mental workload, circadian rhythms, ethanol and drug use) [25,26,27,47,48,49,50], and social features (e.g., age, gender) [48,51]. Hence, it is natural that boundary conditions between non-fatigue and fatigue states for individual drivers reveal wide variations in real-life driving. Here, we assume that the boundary conditions for anonymous drivers have a normal probability distribution p ( t | u , δ ) over the driving duration ( t ) , where u and δ are the mean and standard deviation of the probability distribution, respectively (Figure 1c). In addition, p ( t | u , δ ) plays a role in explaining the temporal evolution of driving fatigue. Thus, the probability of fatigued drivers at t can be estimated by the cumulative probability c p ( t | u , δ ) , as shown in Figure 1c. This parameter is expressed as follows:
c p ( t ) = t p ( s )   d s ,
Based on these considerations (i.e., f ( t ) and c p ( t ) ), the number of potentially fatigued drivers (PFD), as defined in Equation (2), out of all drivers for a target road section, is estimated using f ( t ) and p ( t ) , as shown in Figure 1d. Finally, the ratio of potentially fatigued drivers (RFD, 0.0~1.0) to all drivers who use the target road section is computed with Equation (3). During the actual computation process using the frequency distribution of the driving duration, which ranges from t = 1 to t = t m a x with an interval of the driving duration (i.e., Δ t ), the RFD is computed with Equation (4).
PFD = 0 t m a x ( t p ( s ) d s ) · f ( t )   d t ,
RFD = 0 t m a x ( t p ( s ) d s ) · f ( t )   d t / 0 t m a x f ( t )   d t ,
RFD = t = 1 t m a x ( t p ( s ) d s ) × f ( t ) / t = 1 t m a x f ( t ) ,

3. Application and Potentialities

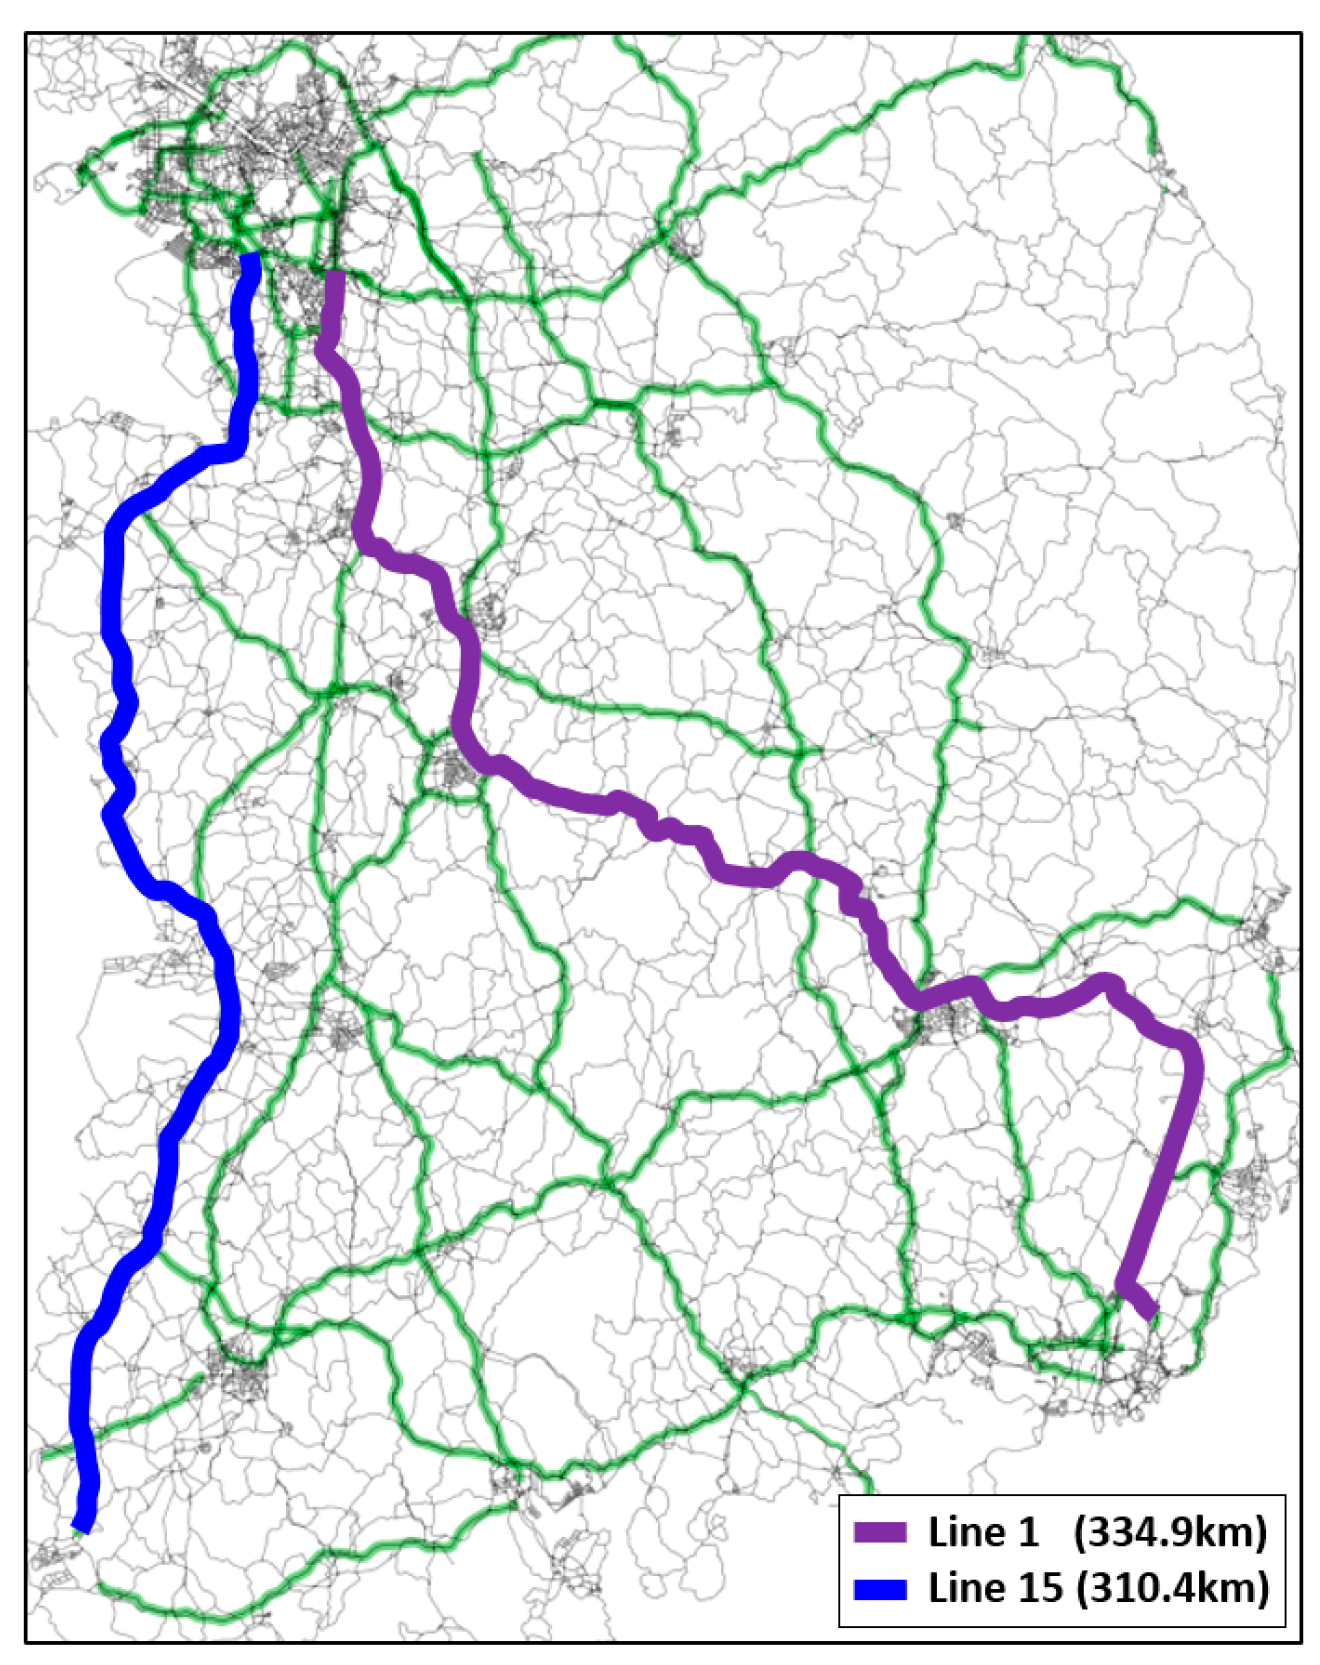
3.1. Data and Characteristics

To demonstrate the potential of RFD to explain the vehicle-crash risk on motorways, a case study was carried out using two types of real-life test data: an accident-rate index and the frequency distribution of driving durations. The time span of the test data is the full year of 2017. The test beds for the data are two main motorway lines in South Korea, as shown in Figure 2, in which lines 1 and 15 consist of 37 and 33 road sections between two interchanges, respectively. All road sections also meet motorway design standards and guidelines through continuous improvements (in an effort to reduce vehicle crashes). The test data for the test bed are shown in Table 1.
The accident rate (AR, accidents per 10 6 × vehicle-km) for each road section ( i ), as defined by Equation (5), was used as an index of the risk of a vehicle crash in our case study. AR is also a widely used indicator in analyses of traffic accidents in practice due to the fact it is based on revealed traffic accident data. The ARs for the 70 target road sections obtained from the traffic accident database of the Korea Highway Cooperation are shown in Figure 3a. ARs that exhibit wide variations from 0.02 to 0.27 exponentially decrease to the increment of the traffic volume.
AR ( i ) = a i × 10 6 q i × l i × d ,
Here, a i , q i , and l i are the number of vehicle crashes (accidents/year), the annual average daily traffic volume (vehicle/day), and the length (km) of each target road section ( i ). In addition, d is the number of days of the year.
Point-to-point vehicle trajectory big data (about 25 terabytes/year), collected by a live vehicle-GPS system and transferred to a data center through 4G LTE wireless communication, were used in our case study. The vehicle-GPS is mounted typically on cars and trucks, even though the type of vehicle is not clear. In addition, the coordinates (i.e., latitude and longitude) of vehicle trajectory were adjusted through a map-matching process. The penetration rate of the vehicle-GPS service is shown in Figure 3b, where penetration rate (PR, %) = (annual average daily vehicle-GPS probe)/(annual average daily traffic volume) × 100. The trend of the PR values is stable within an average ± 10%, despite the fact that the variation of PR increases according to the decrement of the traffic volume. PRs for all target road sections also statistically meet the sample rate (%) during the full year, which is the time dimension of the test data. For instance, the recommended sample size for a population of 2,007,500 (=5500 vehicle/day × 365 day/year) is 16,504 (i.e., sample rate = 0.822%) at a 99.0% confidence level with a 1.0% margin of error.
The frequency distribution of the driving duration for each target road segment was built using the collected vehicle trajectory data, as follows: (1) each path travel time from a departure location to the middle location of the target road segment was extracted from the vehicle trajectory database through a map-matching process. (2) Each driving duration value for the target segment was calculated by removing the total non-driving time at rest areas from the path travel time. (3) All driving duration values for anonymous drivers were compiled into the frequency distribution of driving durations for the target segment with the length of the interval ( Δ t ) equal to one minute and the maximum driving duration (i.e., t m a x ) equal to 480 min.
The frequency distributions built in this manner are highly complex, ranging from left-biased one-peak to right-biased multi-peak examples, as shown in Figure 4. Fatigued drivers, from the standpoint of the recommended safe limit (60 min) for continued driving [11,33,44], range from 15.2% to 84.7% with average and deviation values of 54.1% and 18.6%, respectively. That is, more than half of vehicle drivers for more than 50% of the road sections are at least in a state of task-related fatigue, as the target road sections mainly serve as an inter-regional motorway to cover middle- and long-distance vehicle trips. This fact presents a new opportunity to monitor the degree of task-related fatigued drivers directly, at least for a motorway section for cases in which a suitable boundary between non-fatigue and fatigue driving is available. Additionally, no research on a risk analysis of real-life traffic accidents using the driving-duration characteristics of road sections could be found during our literature review.

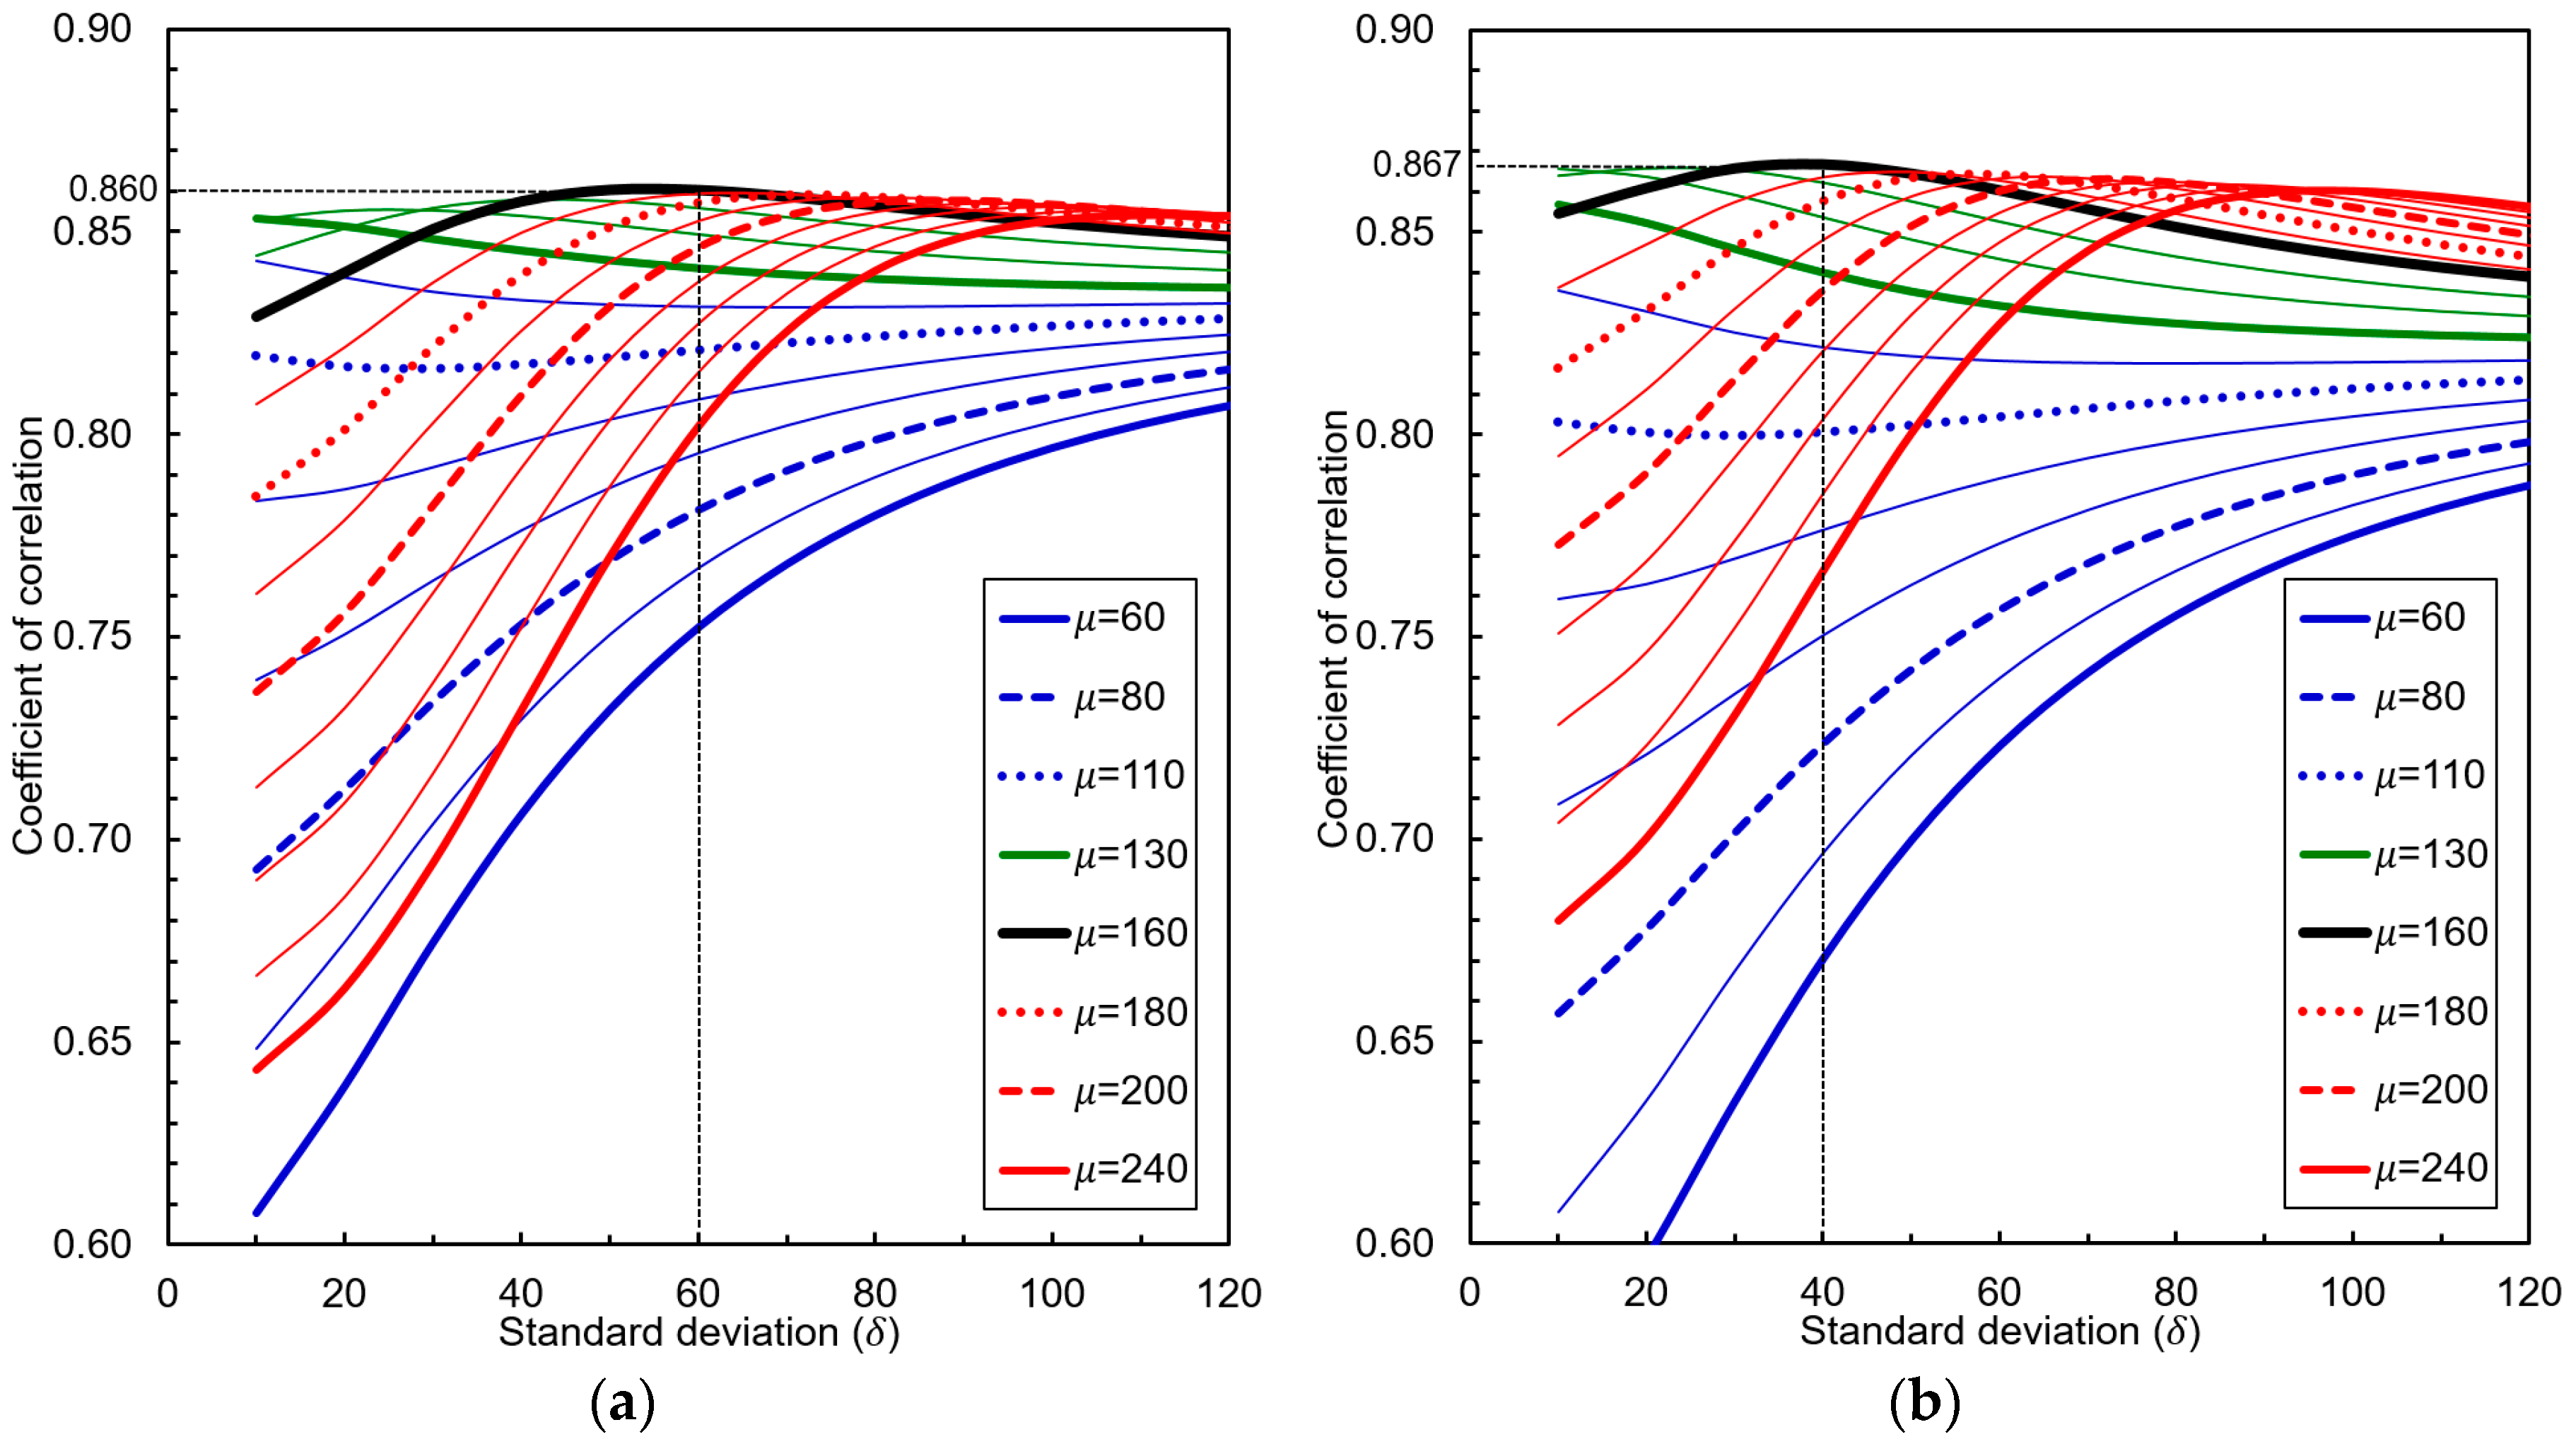
3.2. Identifying the Optimal Boundary Condition and Findings

The explanatory power of RFD for the risk of a vehicle crash relies closely on the boundary condition of p ( t | μ , δ ) between non-fatigue and fatigue states. That is, the μ and δ parameters (min) play key roles in measuring reliable RFD values, given the distribution of driving durations. At present, no universally accepted boundary condition for such a real-life accident rate exists, though several safe limits (i.e., 40, 60, and 80 min) for continued driving were proposed in previous investigations. Therefore, it is essential to analyze and identify suitable values of the two parameters in order to prevent estimation failures (i.e., overestimations or underestimations of the RFD). Due to this, a numeric simulation to identify the optimal values of μ and δ was carried out for the possible combinations of 60 μ 240 and 10 δ 120 in increments of ten minutes. The entire test data was exactly separated into two datasets (i.e., 50% training and 50% testing) as shown in Table 1. For the cross-fold validation, datasets 1 and 2 were employed as training and testing datasets for scenario 1, and datasets 2 and 1 were also used as training and testing datasets for scenario 2.
The effects of the combination of the μ and δ values on the statistical coefficient of the correlation ( r ) between RFD and AR values for the two datasets are shown in Figure 5, where the behaviors of correlation coefficient are categorized into two groups with μ = 130 min. With regard to the first group ( μ 130 ), each correlation coefficient between RFD and AR reaches its maximum value only when the δ value is 10 or 120 for the two datasets. This indicates that the boundary conditions (i.e., p ( t | μ , δ ) ) at the maximum r values, despite the fact that the values (more than 0.80) are statistically acceptable, may not be acceptable for real-world use, due to the following reasons. In the case of ( μ , δ ) = (60, 120), it can be seen that unreal fatigue-related behaviors for normal drivers arise due to the over-dispersion problem of the boundary condition. For instance, 30.9 % of drivers (0.309 = c p ( 0 ) with Equation (1)) are already in a fatigued state when their driving starts. In addition, 2.28% of drivers (0.023 = 1.0 c p ( μ + 2 δ ) ) are still in a non-fatigued state before the continued driving of 300 min ( = 60 + 2 × 120 ), even when they have sufficient rest time at a rest area. Moreover, fatigue drivers are up to 43.4%, 50.0%, and 56.6% of the proposed safe limits of 40, 60, and 80 min, respectively, according to previous research [1,11,17,33,43,44,45]. For the case of ( μ ,   δ ) = (130, 10), the boundary condition is too homogeneous to explain early-fatigued drivers, despite the fact that the r values ( 0.85 ) for the two datasets appear acceptable. Due to this, fatigued drivers account for only 0.1 % of the total (0.001 = c p ( μ 3 δ ) ) before continued driving of 100 min ( = 130 3 × 10 ). The percentage of fatigued drivers is also zero for all safe limits.
Regarding the second group ( μ > 130 ), r value for each case of the μ value (steeply) increases to its maximum space and then gradually decreases as the δ value increases (Figure 5a,b). This convex-shaped outcome of concurrence is evidence that a useful boundary condition exists, regardless of whether or not the boundary space is obvious. The maximum r values for all μ values also exceed 0.85. In this manner, the maximum r values for the dataset 1 and 2 are as high as 0.860 and 0.867 with μ = 160 when δ values are 60 and 40, respectively. The results of model calibration and validation are summarized in Table 2, where the differences between two r values (i.e., correlation coefficient) for calibration and validation are within 0.007 for all scenarios. More importantly, the performances of calibration and validation for the same dataset, in terms of r value, are very comparable, despite the fact that the two groups of μ and δ values (i.e., the best μ and δ values calibrated using the dataset and another μ and δ values calibrated using the counterpart dataset) are not equal. This reveals that an optimal boundary condition between non-fatigued and fatigued driving states can be determined based on given observed data in advance. Additionally, this implies that the boundary condition can be effectively employed to monitor RFD for any road section within an acceptable level of monitoring error from the standpoint of actual AR, and the monitored RFD can be used as a significant explanatory variable to forecast the risk of motorway traffic accidents. Therefore, critical μ and δ values ( μ c ,   δ c ) of 160 and 50 were identified for the critical boundary condition (CBC, p c ( t | μ c ,   δ c ) ) that maximizes the statistical explanatory power of the RFD with regard to AR. In addition, the CBC can be used to demonstrate the potentiality of the RFD in research involving risk analyses of motorway vehicle crashes as well as more detailed analyses.

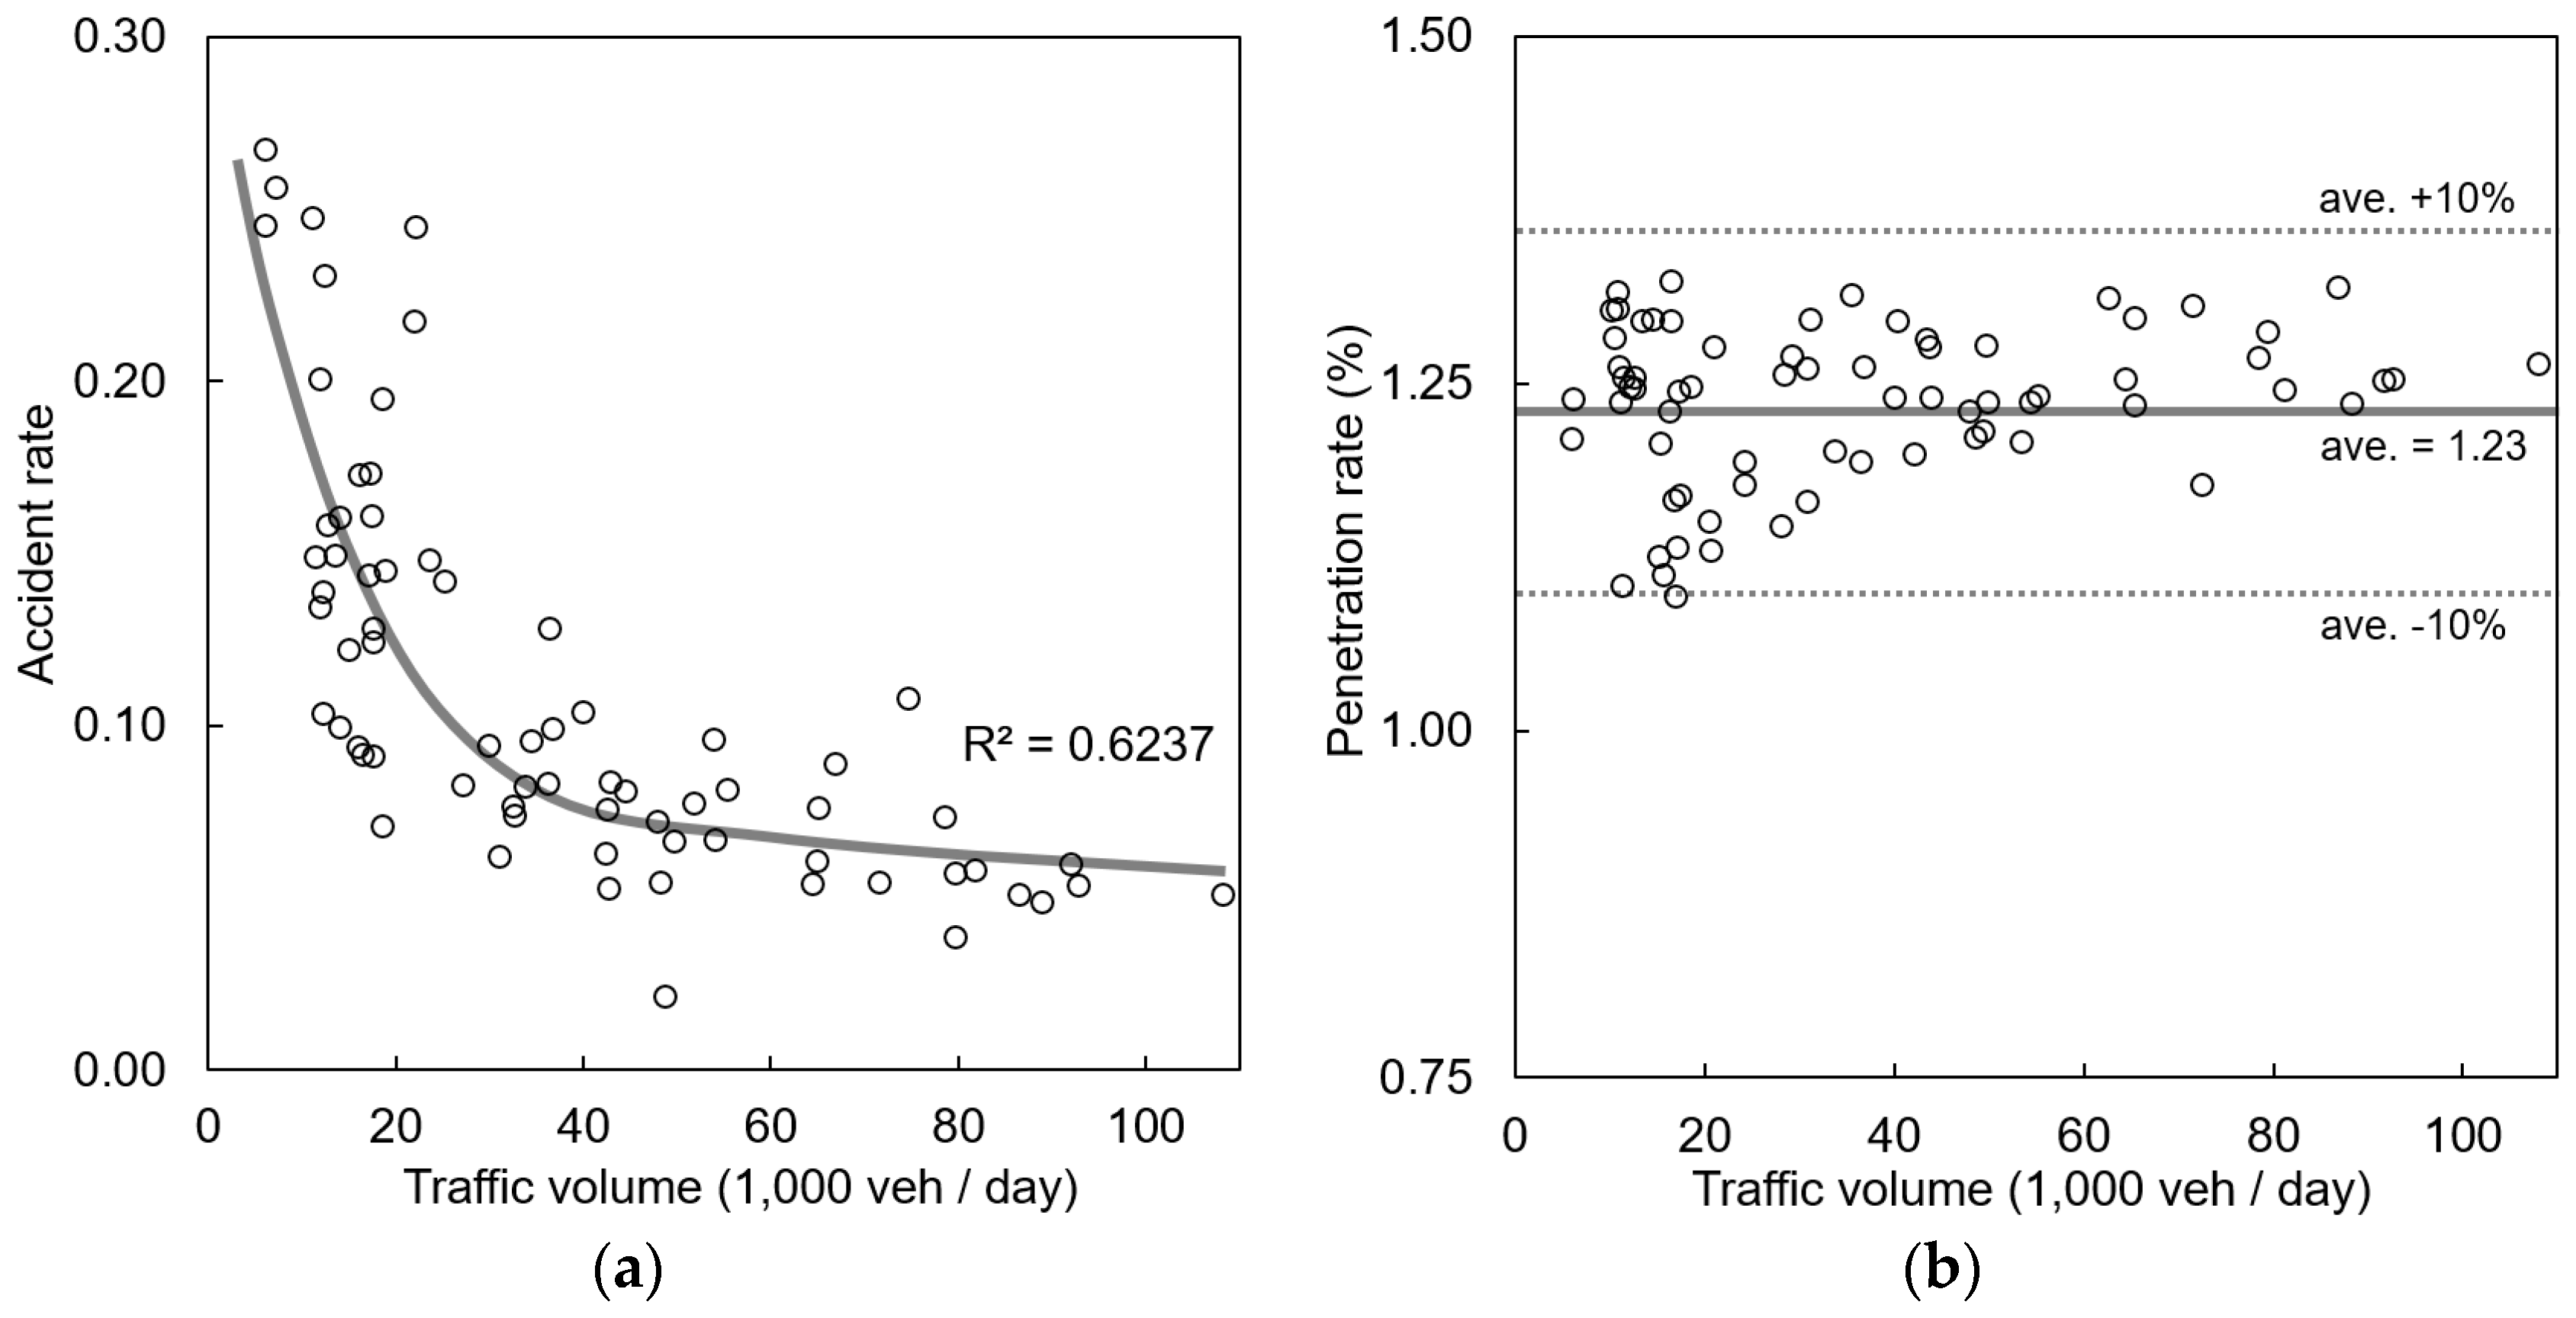
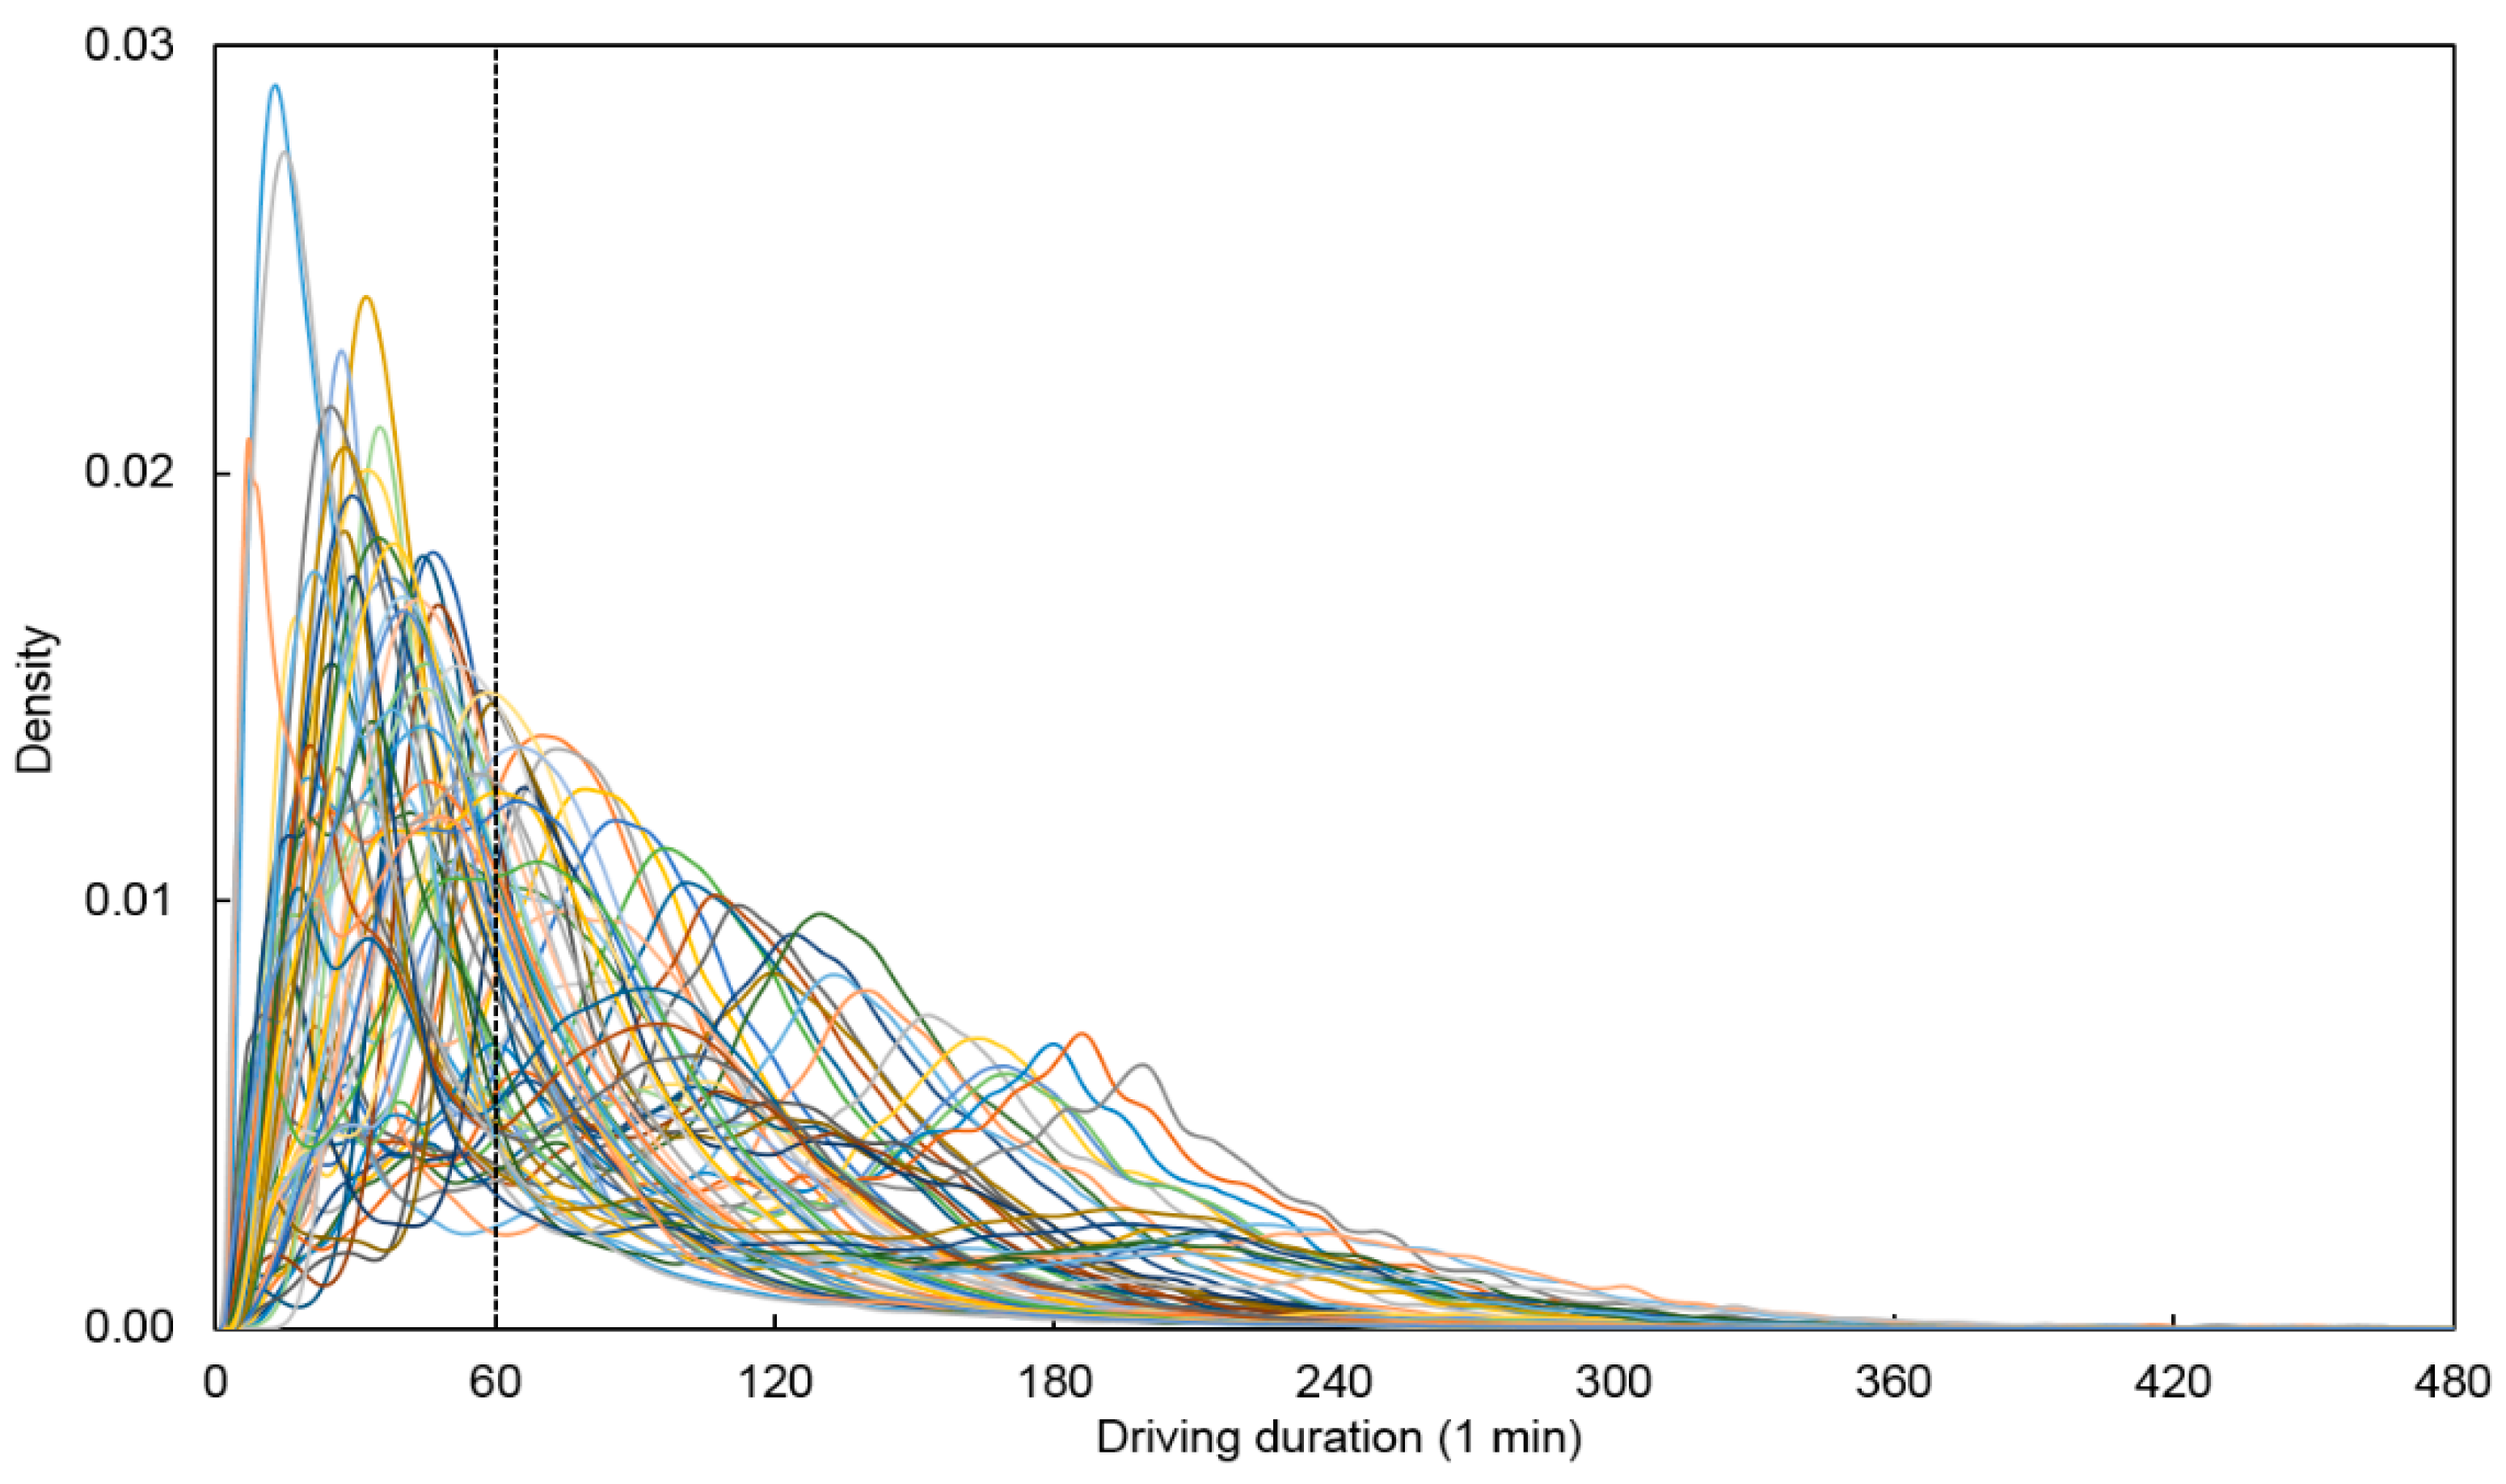
3.3. Potentialities and Findings

The potentialities of the RFD for both monitoring fatigued drivers and the predictability of AR for motorway sections are demonstrated, and some of the findings are presented in this subsection. In addition, further research directions which are closely associated with and which effectively address the shortcomings of this research are suggested.
Detailed relationships between the driving-duration distribution, the RFD, and AR are shown with seven cases in Figure 6. The shape of the driving-duration distributions varies from a left-biased shape (e.g., C1) to a right-biased shape (e.g., C7), as the numbers of mid-range and long driving trips increase. These variations of the distribution originate from the fact that the features of the driving times from the departure locations to a road section wholly rely on the complex spatiotemporal behaviors of the origin-destination vehicle trips in the road network. Therefore, each distribution has its own characteristics distinguishable from those of the others. It can be seen that these characteristics of the driving-duration distribution has intuitive discriminant power for the RFD in itself, if a suitable boundary for non-fatigued and fatigued driving conditions could be given. For instance, the RFD values, considering the CBC, increase from 0.036 to 0.55 when a portion of the mid-range and long driving durations increases. The maximum RFD value is also more than 15 times the minimum value. This fact indicates that the RFD can be effectively utilized to monitor the percentage of fatigued drivers, at least for regional motorway sections using the features of the driving-duration distribution.
Concerning the relationship between the RFD and AR, the AR values increase from 0.02 to 0.27 when the RFD values increase (Figure 6). The statistical correlation (0.86) between the RFD and AR with the CBC is also significant (Figure 5). This fact indicates that the RFD has significant explanatory power with regard to AR and thus, can be successfully used for predicting AR values with considerable reliability. This also indicates that the feature of the driving-duration distribution is closely associated with AR in the case of motorway sections, where the percentage of middle- and long-distance trips is higher than short-distance trips.
From the aspect of reliability of CBC, it can be seen that the meaningful points of CBC ( μ c 2 δ c , μ c δ c , μ c , μ c + δ c ) in Figure 6 are in line with the findings of previous fatigue-related investigations. Regarding ( μ c 2 δ c ) (i.e., 60 min), CBC guarantees the different safe limits for continued driving with tolerable differences. Fatigued drivers for safe limits of 40, 60, and 80 min are 0.8, 1.4, and 5.5% of drivers ( = c p (a safe limit) × 100), respectively. The r values of the two datasets for the safe limit of 80 min with δ = 10 (i.e., ( μ , δ ) = (80, 10)) in Figure 5 are 0.69 and 0.66, which are useful during a risk analysis of vehicle crashes. These facts indicate that safe limits, when the distribution of the driving duration for a road section is available, could at least provide a useful boundary with which to monitor the percentage of fatigued drivers directly from the practical perspectives of public safety, despite the academic debate about safe limits for continued driving. With respect to ( μ c δ c ) (i.e., 110 min), CBC meets the duration of the continued driving for safety driving, as recommended in a notable study [45] in which the researchers stressed “drivers should stop and rest every 1–2 h”. Moreover, CBC guarantees a turning point (90 min) of the mean fatigue score [45], after which the fatigue score varied little. Concerning ( μ c ) and ( μ c + δ c ) (i.e., 160 and 210 min), CBC guarantees two significant periods of prolonged driving times [28] in terms of the temporal development of fatigue states. The μ c value of 160 explains the middle of the first period (120–190 min), during which, subject drivers started to feel some fatigue, attempted to resist it and struggled to remain alert. The μ c + δ c value of 210 locates in the middle of the second period (190–240 min), during which subject drivers became fatigued quickly, began to feel sleepier, and lost interest in remaining awake as the driving task continued further. Furthermore, any additional continued driving tasks should be halted after the second period [28].
Interestingly, the values of μ c , μ c + δ c , and μ c + 2 δ c of CBC (i.e., 160, 210, and 260 min) are greater than the three threshold values of the prolonged driving duration (i.e., 120, 190, and 240 min) [28] with differences of 20–40 min. This implies that CBC does not exclude the following significant factors which have not been included in driving simulator-based studies but are deeply related to drivers’ fatigue, especially in the case of mid-range and long-distance real-life driving trips. In order to reduce driving-related fatigue and sleepiness, drivers use self-initiated tactics (e.g. blasting the radio, listening to driving music, rolling down the windows, turning on the air conditioner) [52]; ingest caffeine-containing products [25,27,50,52,53,54], and take naps at rest areas [17,50,52]. Various advanced in-vehicle systems (e.g., lane-departure warning systems, lane-keeping assist systems, adaptive cruise control systems, forward collision avoidance systems) have also been utilized to assist with safe driving. In addition to these, drivers tend to underestimate the impact of fatigue, ignore feelings of drowsiness, and continue driving as they become sleepy [20,52].
The explanatory power of the RFD with regard to AR is illustrated in Figure 7. The RFD shows a positive trend with regard to AR with an R 2 value of 0.736 (Figure 7a). That is, the RFD statistically explains more than 73% of motorway traffic accidents, at least in our study. This indicates that task-related fatigue significantly impacts actual traffic accidents and that the RFD can be efficaciously used as a powerful variable in the monitoring of fatigued drivers and in assessing the risk of fatigue-related traffic accidents for motorway sections. The R 2 values (0.797, 0.741, and 0.761) for the three different numbers of lanes ( N ) (Figure 7b–d) are greater than that for all lanes (Figure 7a). This result indicates that the impacts of driving fatigue on traffic accidents differ according to N , and thus, RFD can be successfully used for the forecasting of risk of traffic accidents according to different N .
Specifically, the effects of driving fatigue on the risk of a traffic accident when N 3 are distinguished from that when N 4 . When N 3 , the trend of the ARs increases exponentially as the RFD values increase. This implies that weighted fatigue (or drowsy) driving states caused by prolonged monotonous driving more negatively affect the risk of a traffic accident than the average level of fatigue caused by monotonous driving. This also indicates that drivers, even when they take a break periodically, should take naps or at least get enough rest to reduce fatigue [17,50] in cases when the accumulated driving duration reaches the maximum level, thus seriously impairing their abilities related to safe driving. When N 4 , the trend of the ARs shows lower values than those in the other cases, despite the fact that the explanatory power of the RFD is comparable to the power of other variables. This is likely due to the fact that increased interactions between vehicles (e.g., lane-changing, overtaking, acceleration, and deceleration) frequently interrupt continuously monotonous driving, which is a major cause of task-related fatigued driving. In contrast, the AR values for the two cases of N 3 show stationary trends with little variation when RFD ≤ 0.1 (Figure 7c,d), and the estimated AR values when RFD = 0.0 range from 0.03 to 0.08 (Figure 7b–d). This implies that the impacts of fatigued driving on the risk of a vehicle crash, in the case when the percentage of fatigued drivers is low, could decrease when combined with other accident-related causal factors. Despite this, it is clear that the RFD, even when low, offers the promising opportunity, at least to be used as a significant causal factor, without ignoring the impacts of small percentages of fatigued drivers on traffic accidents.
Despite the demonstrated feasibility of the proposed approach, further investigations related to the additional potentialities of big vehicle trajectory data should be conducted from the standpoints of (1) driving-duration boundaries for monitoring fatigued drivers and understanding fatigue-related traffic accidents, (2) the risk management of traffic accidents based on driver fatigue.
Regarding the driving-duration boundary, it can be seen that subsequent investigations will be necessary for more reliable monitoring of fatigued and drowsy drivers, though several remarkable studies of the time course of task-related fatigue from mental and physical aspects have been conducted for continued driving. Multiple driving-duration boundaries that can effectively explain the actual behaviors of discontinued driving (i.e., driving, resting, driving, resting, and so on), especially in cases of middle- and long-distance driving, should be investigated and determined; that is, suitable multi-step boundaries are fundamental for explaining the iterative accumulation of and recovery from fatigue. Conservative and progressive multi-step boundaries, at least for different age groups, can also be explored to monitor fatigued drivers and estimate fatigue-related traffic accidents, respectively. Moreover, multiple boundaries related to the time of day, at least day and night, should be investigated in order to consider the effects of the circadian rhythm on the temporal progression of driver fatigue.
More importantly, the present and future availability of vehicle trajectory data provides promising opportunities and future research directions for the offline and online fatigue-based risk management of traffic accidents, as the proposed method was developed based on the intrinsic driving-duration characteristics, which are included in vehicle trajectory data. Research for offline fatigue-based risk management related to the time of day, at least for day and night times, should be conducted using the driving-duration features of certain vehicle types (e.g., cars, buses, trucks). For instance, the driving-duration distributions of heavy vehicles (i.e., buses and trucks), obtained by digital tachograph devices, can be used effectively to monitor the fatigue of heavy-vehicle drivers and then to reflect the effects of their fatigue on traffic accidents. Note that point-to-point vehicle trajectory data, even when collected by different vehicle-GPS devices, can easily be integrated into a structured system database, as each point of information consists of the geographic coordinates and the time. This convenient integration of vehicle-GPS data indicates that big vehicle trajectory data to guarantee a high market rate of vehicle-GPS can be collected and used in real time. The distribution of driving durations, as proposed in this study, is also a practicable solution to address privacy policies effectively. In this vein, it can be seen that further research related to online fatigue-based risk management, based on the real-time availability of big vehicle-GPS data, is necessary, proactively, to prevent fatigue-related traffic accidents currently and in the near future.

4. Conclusions

Driver fatigue, inevitably caused by prolonged continued driving, is a major factor in vehicle crashes. Hence, noticeable achievements and findings have been reported through painstaking academic efforts. Despite these continued efforts, there still exists an ongoing challenge, which is to explain driver fatigue and then to understand the significant relationship between driver fatigue and actual traffic accidents for real-life road segments. Fortunately, advanced vehicle-GPS systems, widely installed in vehicles and smart phones, provide a feasible opportunity to use vehicle trajectory big data, which includes crucial information about driving durations (i.e., time-on-task). However, despite this opportunity, no research to monitor driver fatigue and to explain the impact of driver fatigue on actual traffic accidents for road sections using individual vehicle trajectory data has been reported.
To mine this opportunity, a concept for the direct monitoring of a degree of drivers’ task-related fatigue (i.e., RFD) for road sections was introduced in this study. A data-oriented method to monitor driver fatigue was developed based on the distribution of the driving duration, which, in this case, was extracted from vehicle trajectory data. The robustness of the method was demonstrated using vehicle trajectory big data obtained from a vehicle-GPS system and real-life vehicle crash data collected from regional motorways. The analysis results were notable from two standpoints: monitoring the RFD and understanding traffic accidents (i.e., AR) using the monitored RFD. It was found that drivers’ task-related fatigue for a road section can be successfully measured in terms of the RFD using a suitable boundary of the driving duration for non-fatigue and fatigue states. It was also found that the measured RFD has significant explanatory power with regard to traffic accidents in terms of AR, at least for regional motorway sections. Therefore, it is expected that the direct monitoring of drivers’ task-related fatigue for road sections using vehicle trajectory big data is a promising approach for successfully addressing the current limitations of fatigue-based risk management of vehicle crashes. Moreover, the proposed approach is instantly practicable when vehicle trajectory data is available, at least with a market rate of 1.0%.
The findings of this research pertaining to the implications of road safety policies can be summarized as follows. First, a suitable boundary condition (i.e., p ( t | u , δ ) ) between non-fatigue and fatigue driving states can be determined based on observed data (i.e., the distribution of driving duration and the risk of vehicle crashes) in advance. The identified boundary condition can be efficaciously employed to continuously monitor the temporal evolution of driving fatigue for a driver using only driving duration collected through a vehicle-GPS system, and then the monitored fatigue state can be dynamically provided through the vehicle-GPS in order to prevent fatigue-related vehicle crashes. Second, RFD for a motorway section can be easily monitored using a suitable boundary condition and (real-time or past) driving-duration distribution. The monitored RFD can be provided to drivers for defensive and careful driving on the motorway section through information terminals (e.g., variable message sign, and online vehicle-GPS), and can be also employed in analyzing the location adequacy of fatigue-related motorway infrastructures (e.g., rest area). Lastly, RFD has a significant explanatory power with regard to traffic accident rate. RFD, thus, can be efficaciously used as a fatigue-related explanatory variable for forecasting the risk of vehicle crashes, especially in the case of the network of motorway and inter-regional highway.
This research presents a first step toward proposing a feasible solution with which to undertake direct measurements of drivers’ task-related fatigue using vehicle trajectory big data. In spite of the acceptable results of this study, there are still other opportunities to enhance the method and to improve its capabilities using the aforementioned multiple driving-duration boundaries. In addition, further research should be conducted to accomplish the aforementioned offline and online fatigue-based risk management of traffic accidents, given the availability of vehicle trajectory data and the high penetration rate of vehicle-GPS.

Author Contributions

Conceptualization, H.C.; methodology, H.C. and D.P.; software, H.C.; validation, H.C. and D.P.; formal analysis, H.C.; investigation, D.P.; resources, D.P.; data curation, H.C.; writing—original draft preparation, H.C.; writing—review and editing, H.C. and D.P.; visualization, H.C. All authors have read and agreed to the published version of the manuscript.

Funding

This research received no external funding.

Acknowledgments

We heartily thank the anonymous reviewers for their insightful and valuable comments on the paper. We also thank Smart Big Data Center of the Korea Transport Institute, and QBICWARE for the provision of the used data.

Conflicts of Interest

The authors declare no conflict of interest.

References

  1. Larue, G.S.; Rakotonirainy, A.; Pettitt, A.N. Driving performance impairments due to hypovigilance on monotonous roads. Accid. Anal. Prev. 2011, 43, 2037–2046. [Google Scholar] [CrossRef] [PubMed] [Green Version]
  2. Li, Y.; Ma, D.; Zhu, M.; Zeng, Z.; Wang, Y. Identification of significant factors in fatal-injury highway crashes using genetic algorithm and neural network. Accid. Anal. Prev. 2018, 111, 354–363. [Google Scholar] [CrossRef] [PubMed]
  3. Haghighi, N.; Liu, X.C.; Zhang, G.; Porter, R.J. Impact of roadway geometric features on crash severity on rural two-lane highways. Accid. Anal. Prev. 2018, 111, 34–42. [Google Scholar] [CrossRef] [PubMed]
  4. Hong, J.; Tamakloe, R.; Park, D. A Comprehensive Analysis of Multi-Vehicle Crashes on Expressways: A Double Hurdle Approach. Sustainability 2019, 11, 2782. [Google Scholar] [CrossRef] [Green Version]
  5. WHO. Global Status Report on Road Safety 2015; WHO: Geneva, Switzerland, 2015. [Google Scholar]
  6. Lee, D.; Guldmann, J.-M.; von Rabenau, B. Interactions between the built and socio-economic environment and driver demographics: Spatial econometric models of car crashes in the Columbus Metropolitan Area. Int. J. Urban Sci. 2018, 22, 17–37. [Google Scholar] [CrossRef]
  7. Kim, D.-G.; Lee, Y. Identifying the influences of demographic characteristics and personality of inveterate drunk drivers on the likelihood of driving under the influence of alcohol (DUIA) recurrence. Int. J. Urban Sci. 2017, 21, 300–311. [Google Scholar] [CrossRef]
  8. Hong, J.; Tamakloe, R.; Park, D. Application of association rules mining algorithm for hazardous materials transportation crashes on expressway. Accid. Anal. Prev. 2020, 142, 105497. [Google Scholar] [CrossRef]
  9. Williamson, A.M.; Feyer, A.-M.; Friswell, R. The impact of work practices on fatigue in long distance truck drivers. Accid. Anal. Prev. 1996, 28, 709–719. [Google Scholar] [CrossRef]
  10. Lal, S.K.L.; Craig, A. A critical review of the psychophysiology of driver fatigue. Biol. Psychol. 2001, 55, 173–194. [Google Scholar] [CrossRef]
  11. Thiffault, P.; Bergeron, J. Monotony of road environment and driver fatigue: A simulator study. Accid. Anal. Prev. 2003, 35, 381–391. [Google Scholar] [CrossRef]
  12. Horne, J.A.; Reyner, L.A. Sleep related vehicle accidents. BMJ 1995, 310, 565–567. [Google Scholar] [CrossRef] [PubMed] [Green Version]
  13. Pack, A.I.; Pack, A.M.; Rodgman, E.; Cucchiara, A.; Dinges, D.F.; Schwab, C.W. Characteristics of crashes attributed to the driver having fallen asleep. Accid. Anal. Prev. 1995, 27, 769–775. [Google Scholar] [CrossRef]
  14. Philip, P.; Ghorayeb, I.; Stoohs, R.; Menny, J.C.; Dabadie, P.; Bioulac, B.; Guilleminault, C. Determinants of sleepiness in automobile drivers. J. Psychosom. Res. 1996, 41, 279–288. [Google Scholar] [CrossRef]
  15. Mitler, M.M.; Miller, J.C.; Lipsitz, J.J.; Walsh, J.K.; Wylie, C.D. The Sleep of Long-Haul Truck Drivers. N. Engl. J. Med. 1997, 337, 755–762. [Google Scholar] [CrossRef] [PubMed]
  16. Sagberg, F. Road accidents caused by drivers falling asleep. Accid. Anal. Prev. 1999, 31, 639–649. [Google Scholar] [CrossRef]
  17. Ting, P.-H.; Hwang, J.-R.; Doong, J.-L.; Jeng, M.-C. Driver fatigue and highway driving: A simulator study. Physiol. Behav. 2008, 94, 448–453. [Google Scholar] [CrossRef]
  18. Davenne, D.; Lericollais, R.; Sagaspe, P.; Taillard, J.; Gauthier, A.; Espié, S.; Philip, P. Reliability of simulator driving tool for evaluation of sleepiness, fatigue and driving performance. Accid. Anal. Prev. 2012, 45, 677–682. [Google Scholar] [CrossRef]
  19. Sagaspe, P.; Taillard, J.; Åkerstedt, T.; Bayon, V.; Espié, S.; Chaumet, G.; Bioulac, B.; Philip, P. Extended Driving Impairs Nocturnal Driving Performances. PLoS ONE 2008, 3, e3493. [Google Scholar] [CrossRef]
  20. Horne, J.A.; Baulk, S.D. Awareness of sleepiness when driving. Psychophysiology 2004, 41, 161–165. [Google Scholar] [CrossRef]
  21. Williamson, A.; Lombardi, D.A.; Folkard, S.; Stutts, J.; Courtney, T.K.; Connor, J.L. The link between fatigue and safety. Accid. Anal. Prev. 2011, 43, 498–515. [Google Scholar] [CrossRef]
  22. Philip, P.; Taillard, J.; Guilleminault, C.; Quera, S.; Bioulac, B.; Ohayon, M. Long Distance Driving and Self–Induced Sleep Deprivation among Automobile Drivers. Sleep 1999, 22, 475–480. [Google Scholar] [CrossRef] [PubMed] [Green Version]
  23. Philip, P. Fatigue, alcohol, and serious road crashes in France: Factorial study of national data. BMJ 2001, 322, 829–830. [Google Scholar] [CrossRef] [Green Version]
  24. Garbarino, S.; Lino, N.; Beelke, M.; Carli, F.D.; Ferrillo, F. The Contributing Role of Sleepiness in Highway Vehicle Accidents. Sleep 2001, 24, 201–206. [Google Scholar] [CrossRef] [Green Version]
  25. Lumley, M.; Roehrs, T.; Asker, D.; Zorick, F.; Roth, T. Ethanol and Caffeine Effects on Daytime Sleepiness/Alertness. Sleep 1987, 10, 306–312. [Google Scholar] [PubMed]
  26. Hack, M.A.; Choi, S.J.; Vijayapalan, P.; Davies, R.J.O.; Stradling, J.R. Comparison of the effects of sleep deprivation, alcohol and obstructive sleep apnoea (OSA) on simulated steering performance. Respir. Med. 2001, 95, 594–601. [Google Scholar] [CrossRef] [PubMed] [Green Version]
  27. Wesensten, N.; Belenky, G.; Kautz, M.A.; Thorne, D.R.; Reichardt, R.M.; Balkin, T.J. Maintaining alertness and performance during sleep deprivation: Modafinil versus caffeine. Psychopharmacology 2002, 159, 238–247. [Google Scholar] [CrossRef] [PubMed]
  28. Guo, M.; Li, S.; Wang, L.; Chai, M.; Chen, F.; Wei, Y. Research on the Relationship between Reaction Ability and Mental State for Online Assessment of Driving Fatigue. Int. J. Environ. Res. Public Health 2016, 13, 1174. [Google Scholar] [CrossRef]
  29. May, J.F.; Baldwin, C.L. Driver fatigue: The importance of identifying causal factors of fatigue when considering detection and countermeasure technologies. Transp. Res. Part F Traffic Psychol. Behav. 2009, 12, 218–224. [Google Scholar] [CrossRef]
  30. Lal, S.K.L.; Craig, A.; Boord, P.; Kirkup, L.; Nguyen, H. Development of an algorithm for an EEG-based driver fatigue countermeasure. J. Saf. Res. 2003, 34, 321–328. [Google Scholar] [CrossRef]
  31. Lal, S.K.L.; Craig, A. Reproducibility of the spectral components of the electroencephalogram during driver fatigue. Int. J. Psychophysiol. 2005, 55, 137–143. [Google Scholar] [CrossRef]
  32. Jap, B.T.; Lal, S.; Fischer, P.; Bekiaris, E. Using EEG spectral components to assess algorithms for detecting fatigue. Expert Syst. Appl. 2009, 36, 2352–2359. [Google Scholar] [CrossRef]
  33. Eoh, H.J.; Chung, M.K.; Kim, S.H. Electroencephalographic study of drowsiness in simulated driving with sleep deprivation. Int. J. Ind. Ergon. 2005, 35, 307–320. [Google Scholar] [CrossRef]
  34. Ranney, T.A.; Simmons, L.A.; Masalonis, A.J. Prolonged exposure to glare and driving time: Effects on performance in a driving simulator. Accid. Anal. Prev. 1999, 31, 601–610. [Google Scholar] [CrossRef]
  35. Kecklund, G.; Åkerstedt, T. Sleepiness in long distance truck driving: An ambulatory EEG study of night driving. Ergonomics 1993, 36, 1007–1017. [Google Scholar] [CrossRef] [PubMed]
  36. Lal, S.K.L.; CRAIG, A. Driver fatigue: Electroencephalography and psychological assessment. Psychophysiology 2002, 39, S0048577201393095. [Google Scholar] [CrossRef]
  37. Dinges, D.F.; Mallis, M.M.; Maislin, G.; Powell, J.W. Evaluation of Techniques for Ocular Measurement as an Index of Fatigue and the Basis of Alertness Management; Report for NHTSA; NHTSA: Washington, DC, USA, 1998.
  38. Oron-Gilad, T.; Ronen, A.; Shinar, D. Alertness maintaining tasks (AMTs) while driving. Accid. Anal. Prev. 2008, 40, 851–860. [Google Scholar] [CrossRef]
  39. Pour-Rouholamin, M.; Jalayer, M.; Zhou, H. Modelling single-vehicle, single-rider motorcycle crash injury severity: An ordinal logistic regression approach. Int. J. Urban Sci. 2017, 21, 344–363. [Google Scholar] [CrossRef]
  40. Hong, J.; Tamakloe, R.; Park, D. Discovering Insightful Rules among Truck Crash Characteristics using Apriori Algorithm. J. Adv. Transp. 2020, 2020, 1–16. [Google Scholar] [CrossRef] [Green Version]
  41. Chang, H.; Cheon, S. The potential use of big vehicle-GPS data for estimations of annual average daily traffic for unmeasured road segments. Transportation 2019, 46, 1011–1032. [Google Scholar] [CrossRef]
  42. Chang, H.; Yoon, B. Potentialities of Autonomous Vehicles for Online Monitoring of Motorway Traffic Volume. J. Adv. Transp. 2018, 2018, 1–12. [Google Scholar] [CrossRef] [Green Version]
  43. Gillberg, M.; Kecklund, G.; Åkerstedt, T. Sleepiness and performance of professional drivers in a truck simulator—Comparisons between day and night driving. J. Sleep Res. 1996, 5, 12–15. [Google Scholar] [CrossRef] [PubMed]
  44. Yamakoshi, T.; Rolfe, P.; Yamakoshi, Y.; Hirose, H. A novel physiological index for Driver’s Activation State derived from simulated monotonous driving studies. Transp. Res. Part C Emerg. Technol. 2009, 17, 69–80. [Google Scholar] [CrossRef]
  45. Nilsson, T.; Nelson, T.M.; Carlson, D. Development of fatigue symptoms during simulated driving. Accid. Anal. Prev. 1997, 29, 479–488. [Google Scholar] [CrossRef]
  46. Gimeno, P.T.; Cerezuela, G.P.; Montanes, M.C. On the concept and measurement of driver drowsiness, fatigue and inattention: Implications for countermeasures. Int. J. Veh. Des. 2006, 42, 67. [Google Scholar] [CrossRef]
  47. Lenné, M.G.; Triggs, T.J.; Redman, J.R. Time of day variations in driving performance. Accid. Anal. Prev. 1997, 29, 431–437. [Google Scholar] [CrossRef]
  48. Lenné, M.G.; Triggs, T.J.; Redman, J.R. Interactive Effects of Sleep Deprivation, Time of Day, and Driving Experience on a Driving Task. Sleep 1998, 21, 38–44. [Google Scholar] [CrossRef] [PubMed]
  49. Philip, P.; Sagaspe, P.; Moore, N.; Taillard, J.; Charles, A.; Guilleminault, C.; Bioulac, B. Fatigue, sleep restriction and driving performance. Accid. Anal. Prev. 2005, 37, 473–478. [Google Scholar] [CrossRef]
  50. Philip, P.; Taillard, J.; Moore, N.; Delord, S.; Valtat, C.; Sagaspe, P.; Bioulac, B. The Effects of Coffee and Napping on Nighttime Highway Driving. Ann. Intern. Med. 2006, 144, 785. [Google Scholar] [CrossRef]
  51. Makishita, H.; Matsunaga, K. Differences of drivers’ reaction times according to age and mental workload. Accid. Anal. Prev. 2008, 40, 567–575. [Google Scholar] [CrossRef]
  52. Reyner, L.A.; Horne, J.A. Evaluation of ‘In-Car’ Countermeasures to Sleepiness: Cold Air and Radio. Sleep 1998, 21, 46–50. [Google Scholar]
  53. Reyner, L.A.; Horne, J.A. Early morning driver sleepiness: Effectiveness of 200 mg caffeine. Psychophysiology 2000, 37, 251–256. [Google Scholar] [CrossRef] [PubMed]
  54. Reyner, L.; Horne, J. Efficacy of a ‘functional energy drink’ in counteracting driver sleepiness. Physiol. Behav. 2002, 75, 331–335. [Google Scholar] [CrossRef]
Figure 1. (a) Spatial deployment of vehicle-GPS trajectories, (b) map-matching to compute each driving duration for the target road section, (c) boundary condition between non-fatigued and fatigued driving, and (d) concepts of the number of potentially fatigued drivers (PFD) and the ratio of potentially fatigued drivers (RFD) according to the frequency distribution of driving duration.
Sustainability 12 05877 g001
Figure 2. Test bed.
Figure 2. Test bed.
Sustainability 12 05877 g002
Figure 3. (a) Relationship between the traffic volume and accident rate, and (b) penetration rate according to the traffic volume.
Sustainability 12 05877 g003
Figure 4. Diversity of the distribution of the driving durations.
Sustainability 12 05877 g004
Figure 5. Effect of the boundary conditions ( μ , δ ) on the statistical coefficient of the correlation between the RFD and AR: (a) dataset 1, and (b) dataset 2.
Sustainability 12 05877 g005
Figure 6. Relationships between the driving-duration distribution, RFD, and AR.
Sustainability 12 05877 g006
Figure 7. Potentialities of the RFD to explain AR according to number of lanes ( N ): (a) 2 N 5 , (b) N = 2, (c) N = 3, (d) 4 N 5 .
Sustainability 12 05877 g007
Table 1. Test data.
Table 1. Test data.
RNSNNLQANARDS RNSNNLQANANDS
1152.98108,22260.0511 13637.9832,59670.0742
254.9991,941100.0602 3731.9729,54120.0941
344.6481,77880.0581 15125.2448,87520.0211
443.8488,26260.0492 242.6779,42930.0391
5413.2792,816240.0531 341.5565,70220.0542
644.9886,12080.0512 435.1242,42960.0762
7411.4179,716190.0571 534.2048,08640.0541
848.5678,689180.0732 634.2753,53980.0962
947.0071,672100.0551 7313.6247,292170.0721
1034.1342,36840.0631 837.6244,507100.0812
11325.1039,901380.1042 936.8351,777100.0771
1234.5236,40050.0831 10313.0442,728170.0842
1334.1964,54360.0612 1138.3736,361110.0991
1443.8054,00950.0672 1239.1734,486110.0952
15410.3255,603170.0811 1327.2827,31260.0832
1644.9949,66760.0662 14214.3818,84570.0711
1736.2042,11450.0521 15210.9016,08260.0942
18312.1518,670120.1452 16219.3215,094130.1221
19316.5417,492170.1611 17211.7914,02660.0992
20310.2917,52660.0912 1828.5114,04670.1601
21310.0817,05090.1431 19212.2113,51290.1492
22311.8317,383130.1732 2028.9917,17370.1241
2337.8716,12480.1731 2126.2218,09080.1952
2439.7717,53280.1282 2228.4012,73790.2301
2545.4374,924160.1081 23211.9511,93270.1342
2647.8866,619170.0892 24213.7311,946120.2001
2743.8465,79370.0761 25215.9811,098160.2472
2849.4136,324160.1282 2629.6711,40760.1491
29316.8525,182220.1421 2728.1612,73960.1582
30317.7322,111350.2452 2824.9112,07830.1391
31310.3022,012180.2181 29214.897,177100.2562
32328.1523,668360.1482 30223.836,023140.2671
3331.4231,19910.0621 3127.416,03240.2452
3436.6332,45960.0762 3223.6616,35020.0921
35313.8133,744140.0821 3326.4612,28630.1042
RN and SN stand for line number and road section number, respectively. N = number of lanes; L = length (km); Q = annual average daily traffic volume (vehicle/day); AN = number of vehicle crashes (accidents/year); AR = accident rate. DS stands for dataset-scenario number which was used to identify an optimal boundary condition in Section 3.2.
Table 2. Summary of model statistics.
ScenarioPurposeDataset μ Value δ Value r Value
S1Calibration1160600.860
Validation2--0.857
S2Calibration2160400.867
Validation1--0.860

