Analysis of Validation and Simplification of Timber-Frame Structure Design Stage with PU-Foam Insulation


Faculty of Civil and Environmental Engineering, Gdansk University of Technology, 80-233 Gdansk, Poland
*
Author to whom correspondence should be addressed.
Sustainability 2020, 12(15), 5990; https://0-doi-org.brum.beds.ac.uk/10.3390/su12155990
Submission received: 11 May 2020
/
Revised: 15 July 2020
/
Accepted: 20 July 2020
/
Published: 25 July 2020
(This article belongs to the Special Issue Design and Construction of Civil Engineering Structures Appropriate for Sustainable Development)
Abstract
:The transition from experimental studies to the realm of numerical simulations is often necessary for further studies, but very difficult at the same time. This is especially the case for extended seismic analysis and earthquake-resistant design. This paper describes an approach to moving from the experimental testing of an elementary part of a wood-frame building structure to a numerical model, with the use of a commercial engineering analysis software. In the presented approach, a timber-frame structure with polyurethane (PU)-foam insulation and OSB (oriented strand board) sheathing was exposed to dynamic excitation. The results were then used to generate a numerical 3D model of the wooden frame element. The process of creating the 3D model is explained with the necessary steps to reach validation. The details of the model, material properties, boundary conditions, and used elements are presented. Furthermore, the authors explain the technical possibilities for simplifying the numerical model in used software. Simplifying the model leads to a substantial reduction of calculation time without the loss of accuracy of results. Such a simplification is especially useful when conducting advanced numerical calculations in the field of seismic and dynamic resistant object design.
1. Introduction
Introducing modern materials or innovative solutions requires, in most cases, experimental study of the new product. Tests can be carried out on real objects [1,2,3] or on special test stands designed for this purpose [4,5]. Tests are carried out on both structural elements of objects [6,7,8,9] and structural connectors [10,11,12], whose role in the structure is increasingly important in the case of timber-frame structures. Researchers largely focus their attention on numerical calculations because it is a cheaper alternative to experimental research on real objects. Computer software for calculations, with the help of the FEM (finite element method), also proves effective. As a result, the object can be modeled and tested relatively simply and cheaply compared to experimental tests. Testing parts of real construction elements exclusively is another alternative. Studies on skeletal wooden buildings are often focused only on basic structural elements such as shear walls [13,14], layers/sheathing of walls [15,16], and anchoring methods [17].
Other studies are focused on the analysis of structural fasteners and connectors of tested elements of real scale, and are a great complement to real object studies [18,19,20,21,22,23].
Experimental tests can be easily carried out for small elements or parts of larger elements. Whole structures like buildings, however, are often very difficult or even—depending on the size—not possible to test. This applies especially if the new materials are designed for earthquake-resistant buildings on a real-life scale [24,25]. Despite the difficulties associated with the study of objects on a real scale, we can find many numerical studies related to real objects, including a 2D/3D FEM analysis of a real timber-framed building conducted by the authors of this paper [26,27,28,29]. Therefore, a different approach has to be applied, one that—once tests on a smaller real-life specimen have been successfully carried out and sufficient data have been collected—is based on physical materials, but incorporates those findings by means of numerical simulations into the final design of the structure. The possibility of modeling whole structures and exposing them to different earthquake conditions is very important for developing designs and solutions that can withstand such natural hazards. Due to size and loads, this is only possible with computer simulations.
The first step required to move from the experimental model to numerical simulations is the precise recreation of the experimental model in FEM software. For the current study, we used a commercial FEM program created by the company Dlubal called RFEM, version 5-23-01 (Dlubal Software GmbH, Tiefenbach, Germany) [30]. The use of commercially available software, using only standard elements of the program, has the advantage that companies that try to introduce new materials or solutions can use these programs and follow the presented procedure. This way they can expose their product to all different kinds of scenarios without the need to build multiple models to be tested until failure, which increases the costs of the process, and sometimes is even impossible due to the dimensions. They can thus test the product before presenting it to the public or using the results. Since standard procedures and libraries are used, the difficulties in using the software are reduced to a minimum, which would not be the case when using scientific (academic) programs that require a much deeper knowledge of FEM software and more involvement in designing the numerical model. Such software is also often much more expensive.
The aim of this paper is to present an approach to moving from the experimental tests of an elementary part of a wood-frame building structure to a numerical model, with the use of a commercial engineering analysis software. In the presented approach, a timber-frame structure with polyurethane (PU)-foam insulation and OSB (oriented strand board) sheathing was exposed to dynamic excitation. The results were then used to generate a numerical 3D model of the frame. The process of creating the 3D model is presented with the necessary steps to achieve validation. The next step in the presented article was to analyze possibilities of simplifying the numerical model in order to speed up numerical calculations with minimum loss of accuracy thus reducing the time required for the numerical analysis as much as possible. The issue is particularly applicable to extensive numerical models of real structures subjected to dynamic loads and earthquake excitation. Looking at an example of a 10 s analysis of earthquake excitations for two timber-frame buildings, which incorporates pounding and takes around one week to complete (using a fast workstation), it can be seen that a reduction of 15% translates to one day of calculation time. Saving time on numerical calculations creates greater opportunities in the field of designing and conducting numerical analyses as well as designing earthquake-resistant objects.
2. Model and Testing Methods
2.1. Experimental Study
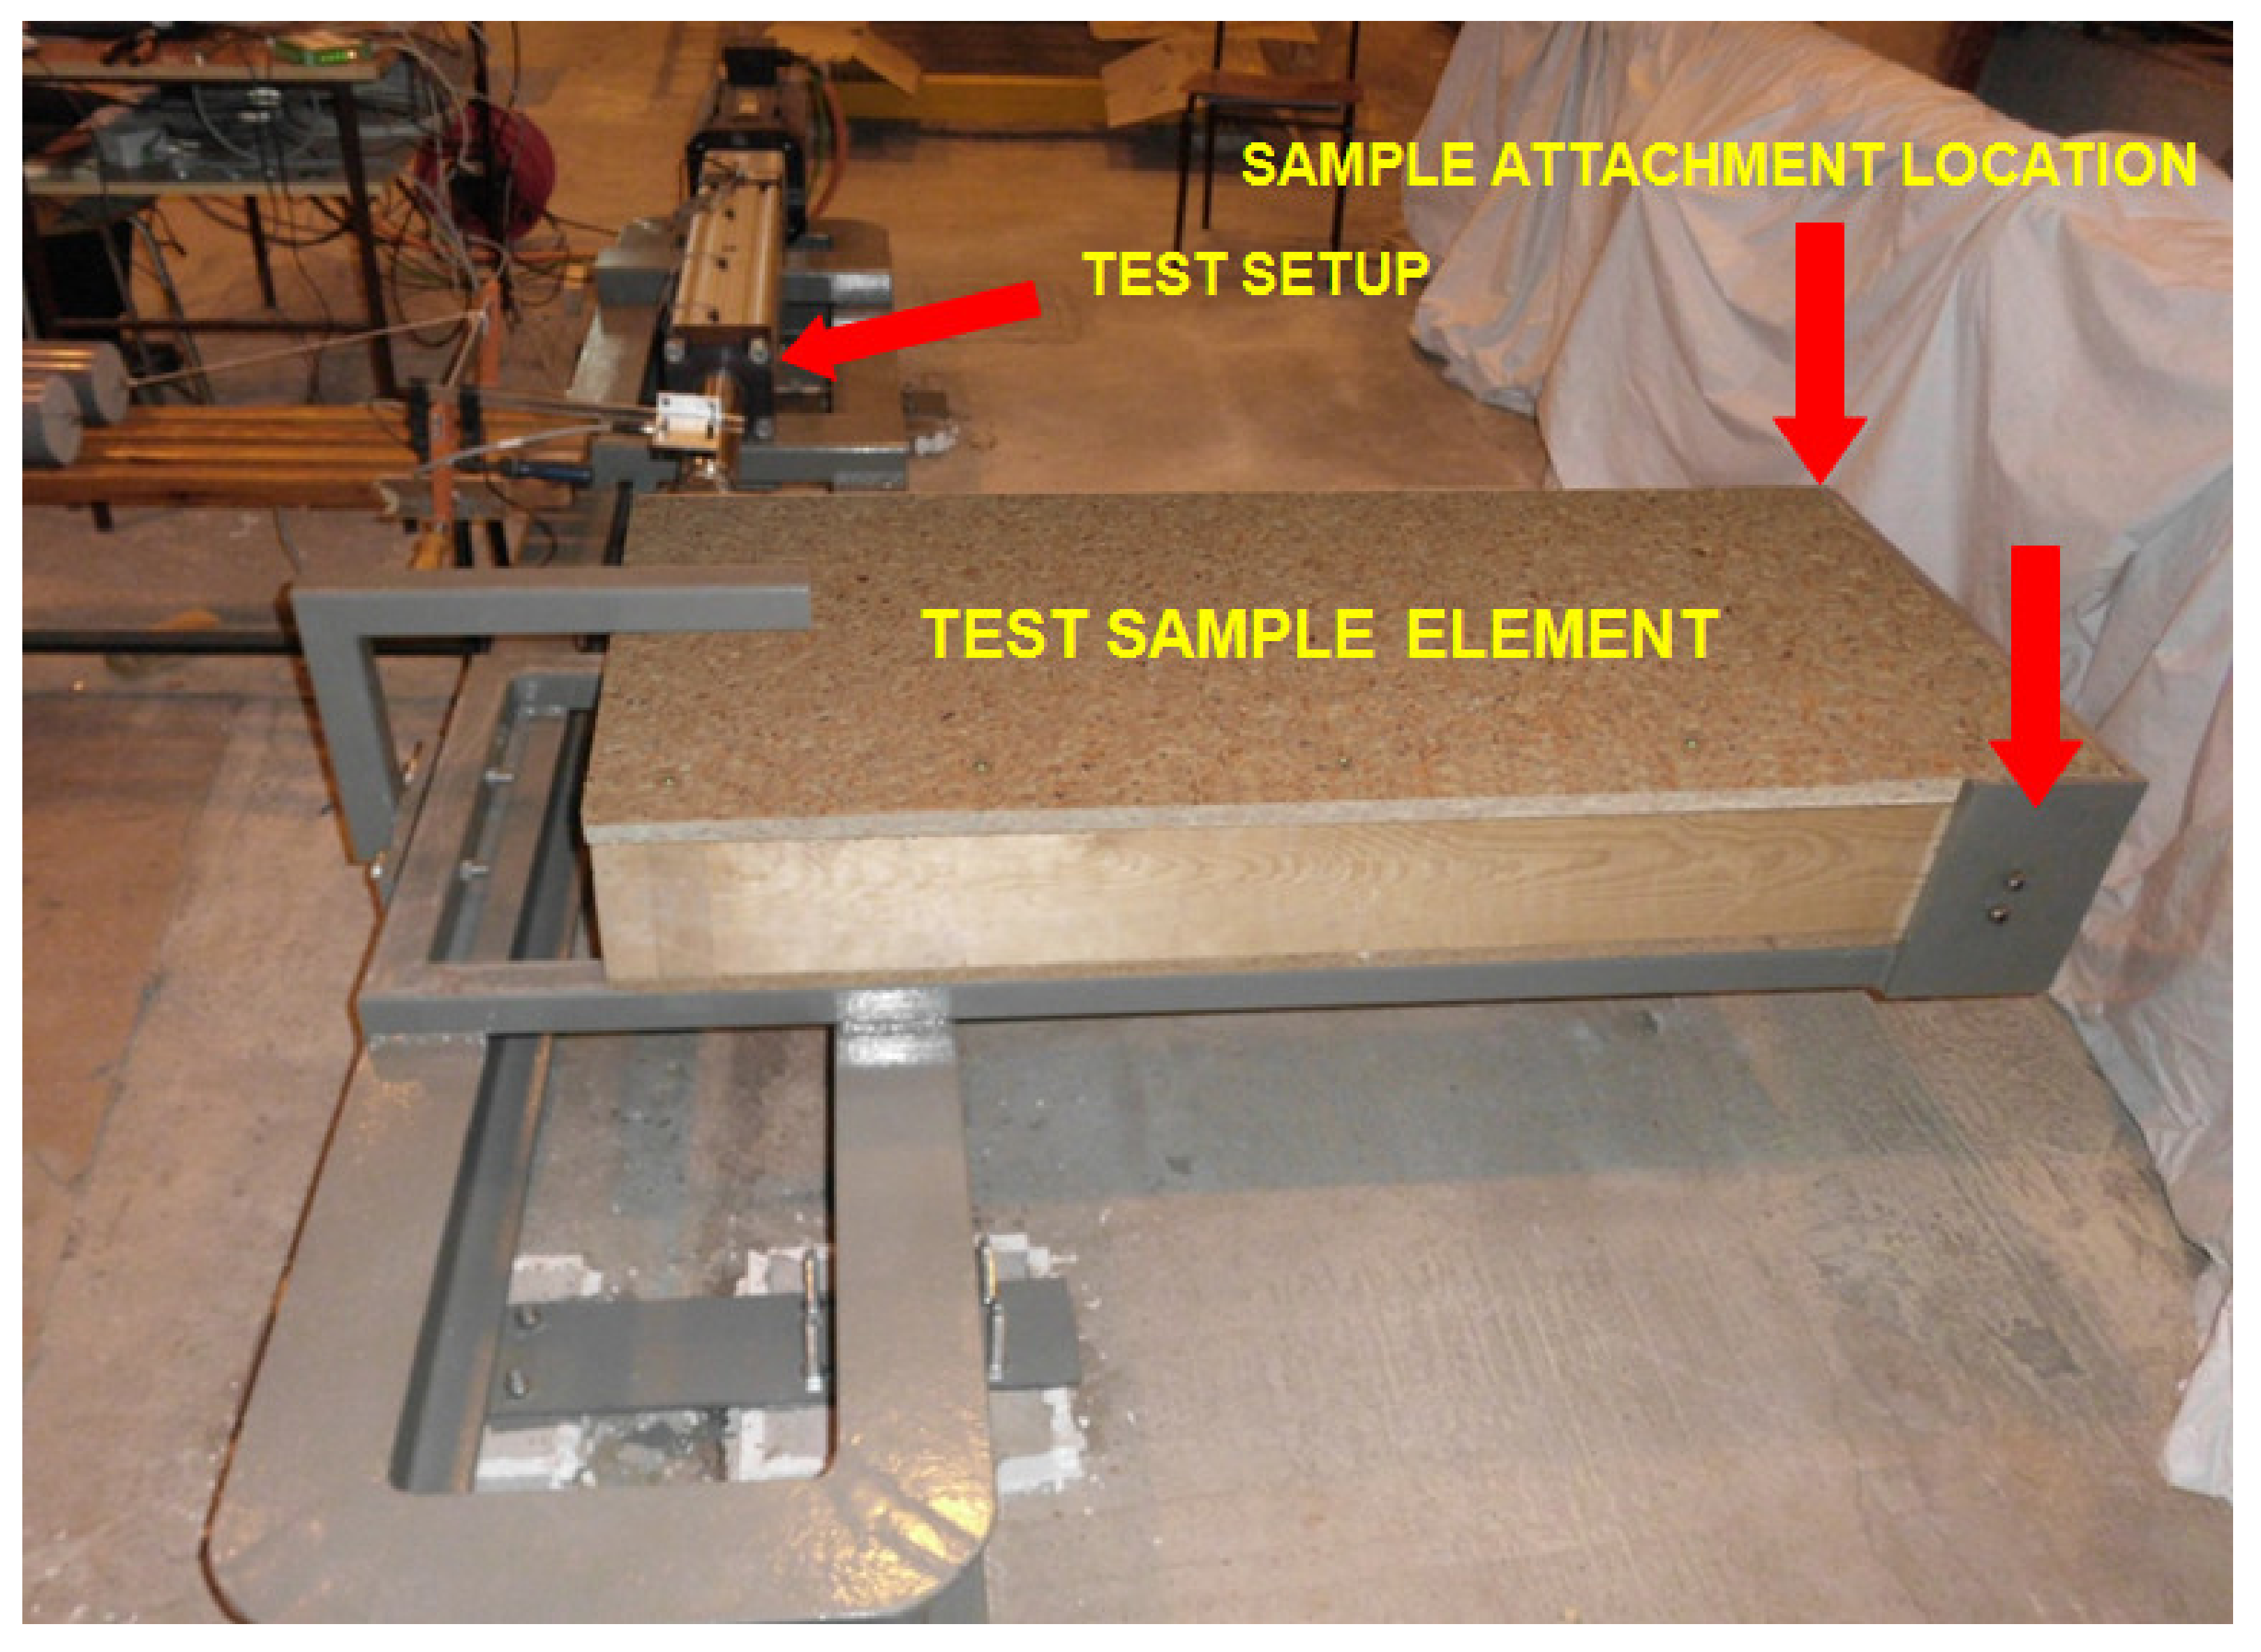
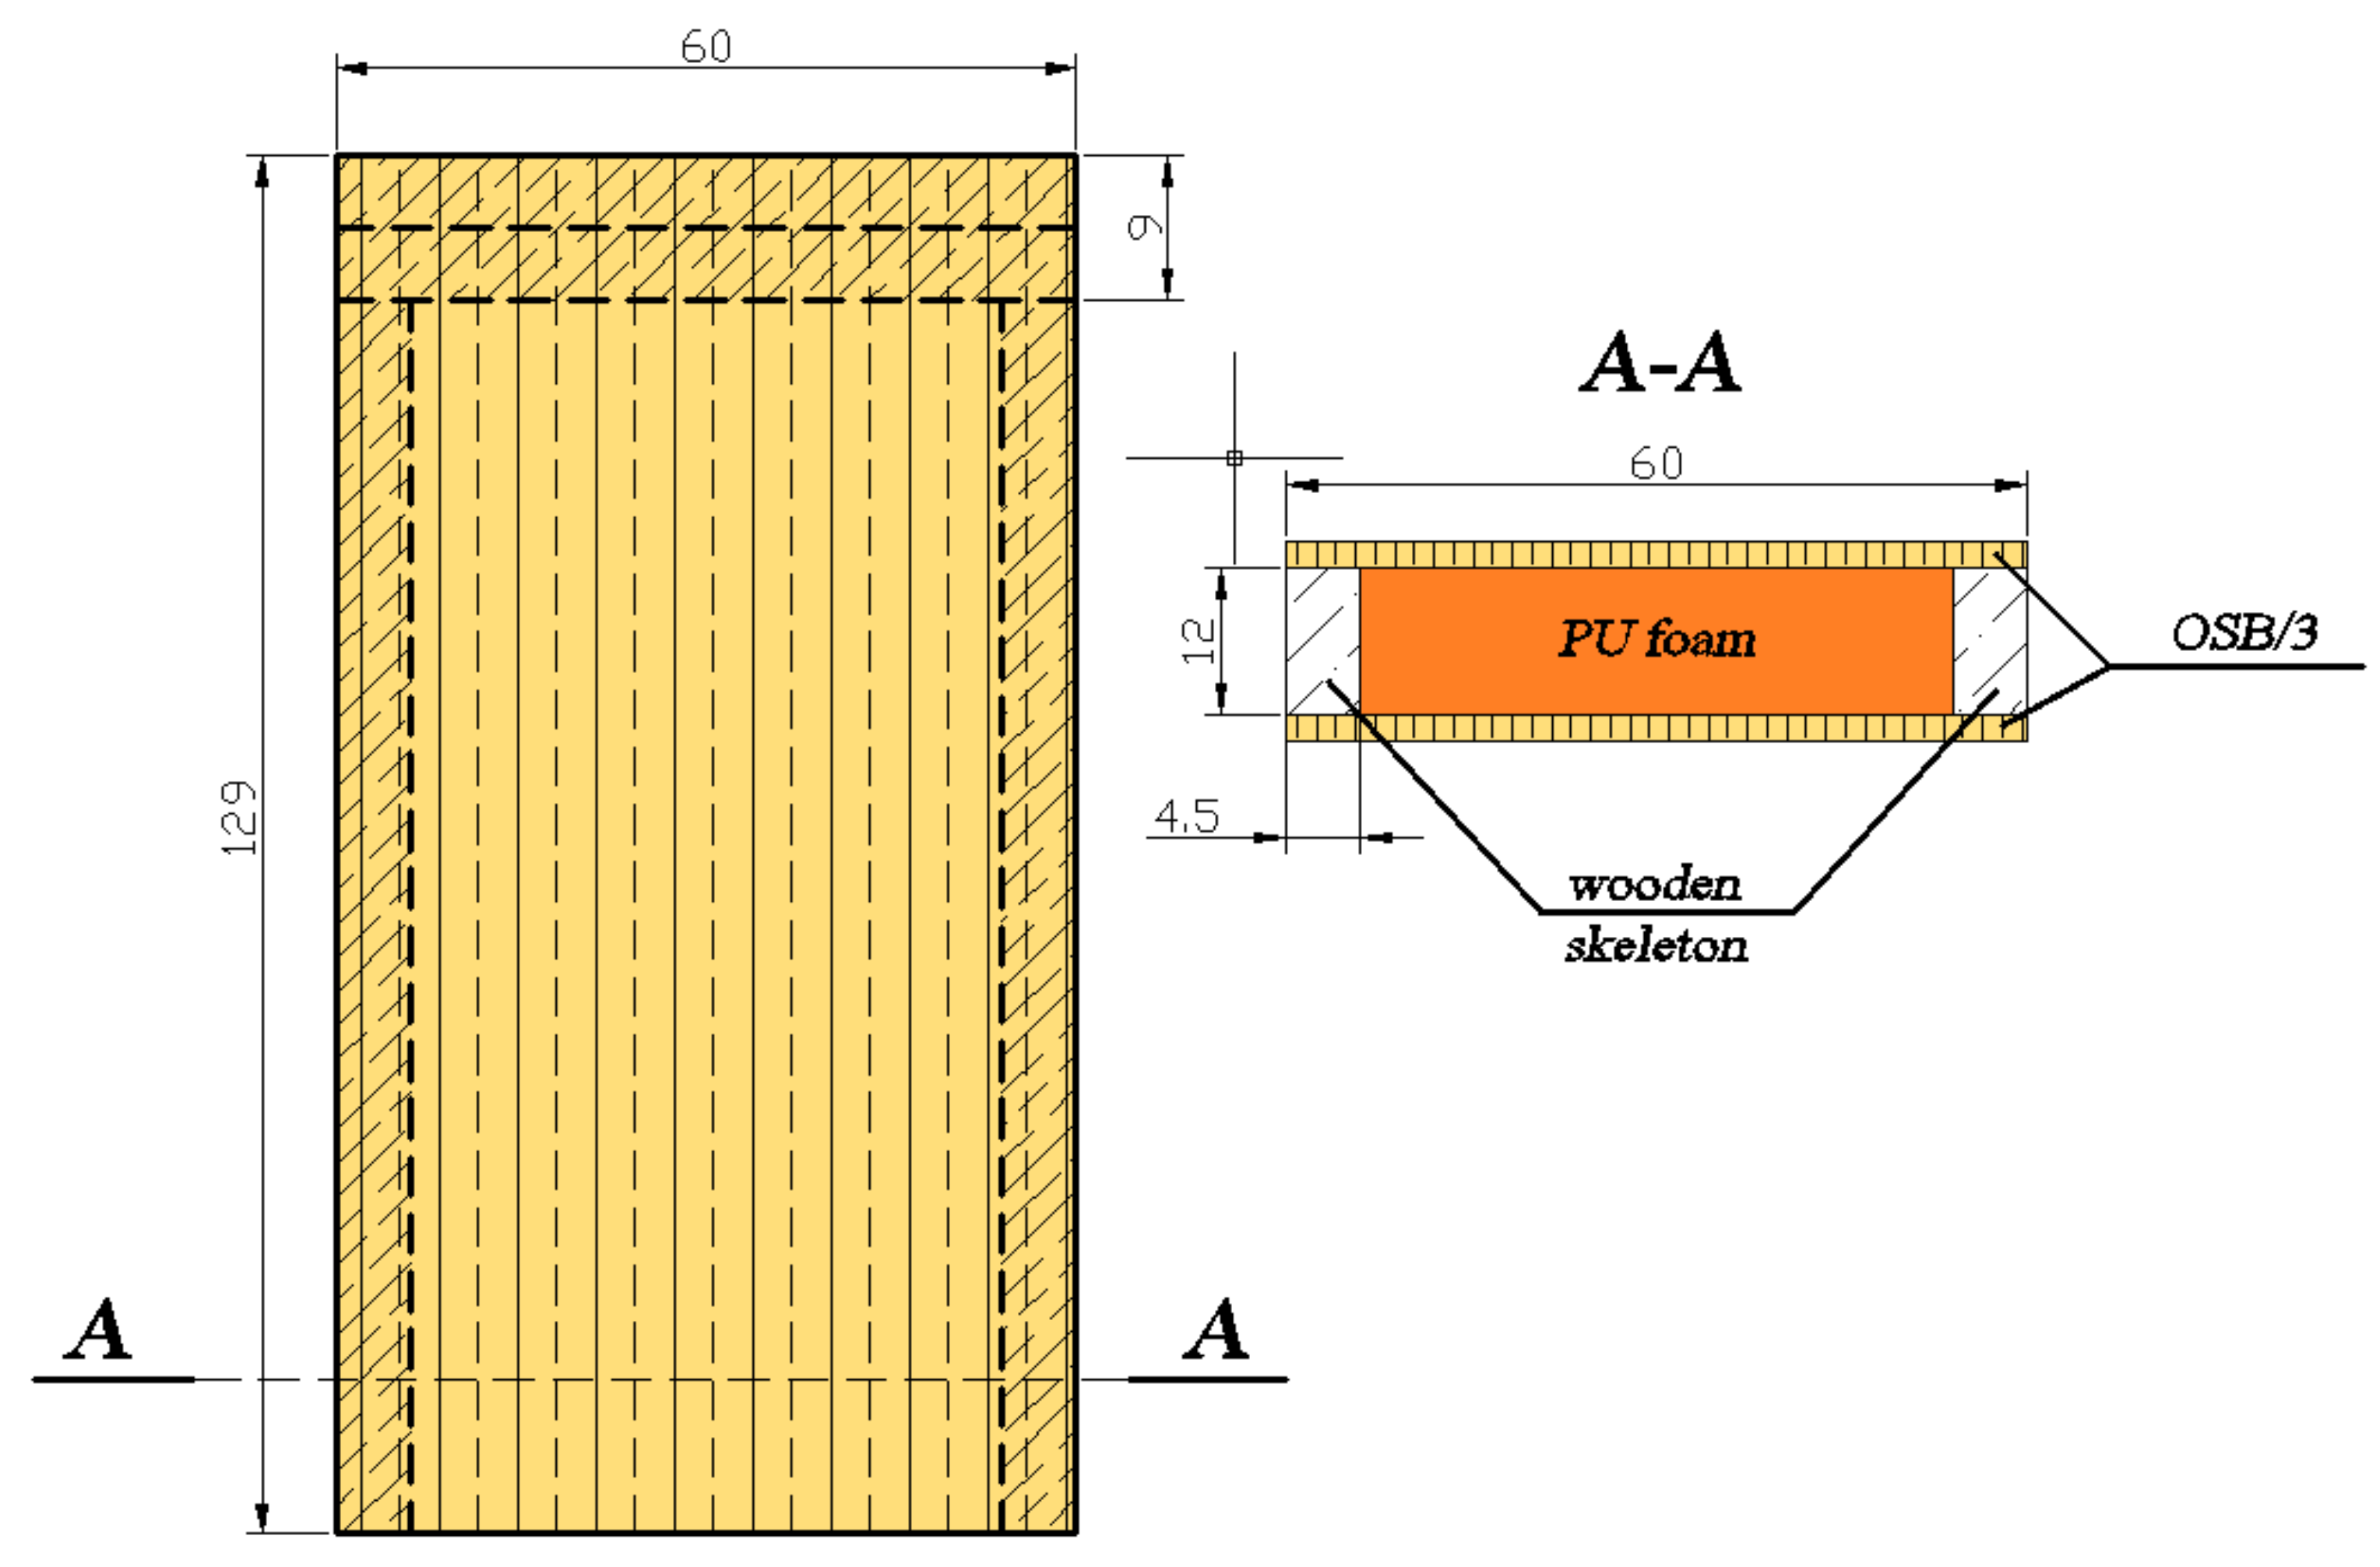
For this study, a modular timber-frame specimen was created, made of a pine wood frame covered with OSB sheathing and filled with polyurethane (PU) foam. This specimen was subjected to static and dynamic loading using the same actuator. Note that this specimen represents a modular part of a typical wood-frame building, and is not a shear wall. The results in the form of displacement and resulting force were recorded. The dynamic test, with recorded time history, was carried out until failure. The timber-frame specimen was subjected to a displacement carried out with an actuator (with force measurement) acting on the top-left corner of the specimen—the corresponding node in the model was node ES14 (the node on which the force acts). The specimen was covered with OSB/3 (OSB of the third generation, moisture proof) on both sides. The basic overall dimensions of each panel consisted of a total length of 129 cm and a total width of 60 cm. In turn, the outer beams of the skeleton were 120 cm in length and 4.5 cm in thickness. Beams of the same dimensions, cut to a modular frame spacing (60 cm) and double-punched (9 cm thick), were used as the outer skeleton element to map the work of the double cap as a stiffening element. The structural elements of the wooden frame were joined with Ø 6 mm screws, while the plating was nailed. The next stage of work was the one-sided restraint of the specimen on one of the edges of the mounting frame.
Specially designed fixing for this allows the specimen to be screwed to the frame with four 10 mm diameter bolts. This way of fastening was used on both sides at the bottom of the fastening frame, aiming to reproduce the support conditions of the actual structure as closely as possible. On the other side of the mounting frame, a special lock was made to ensure that the element could only be moved horizontally (in one plane only). The supporting frame that the specimen was placed on acted like a sliding bearing, due to low friction between the OSB sheathing and the steel frame.
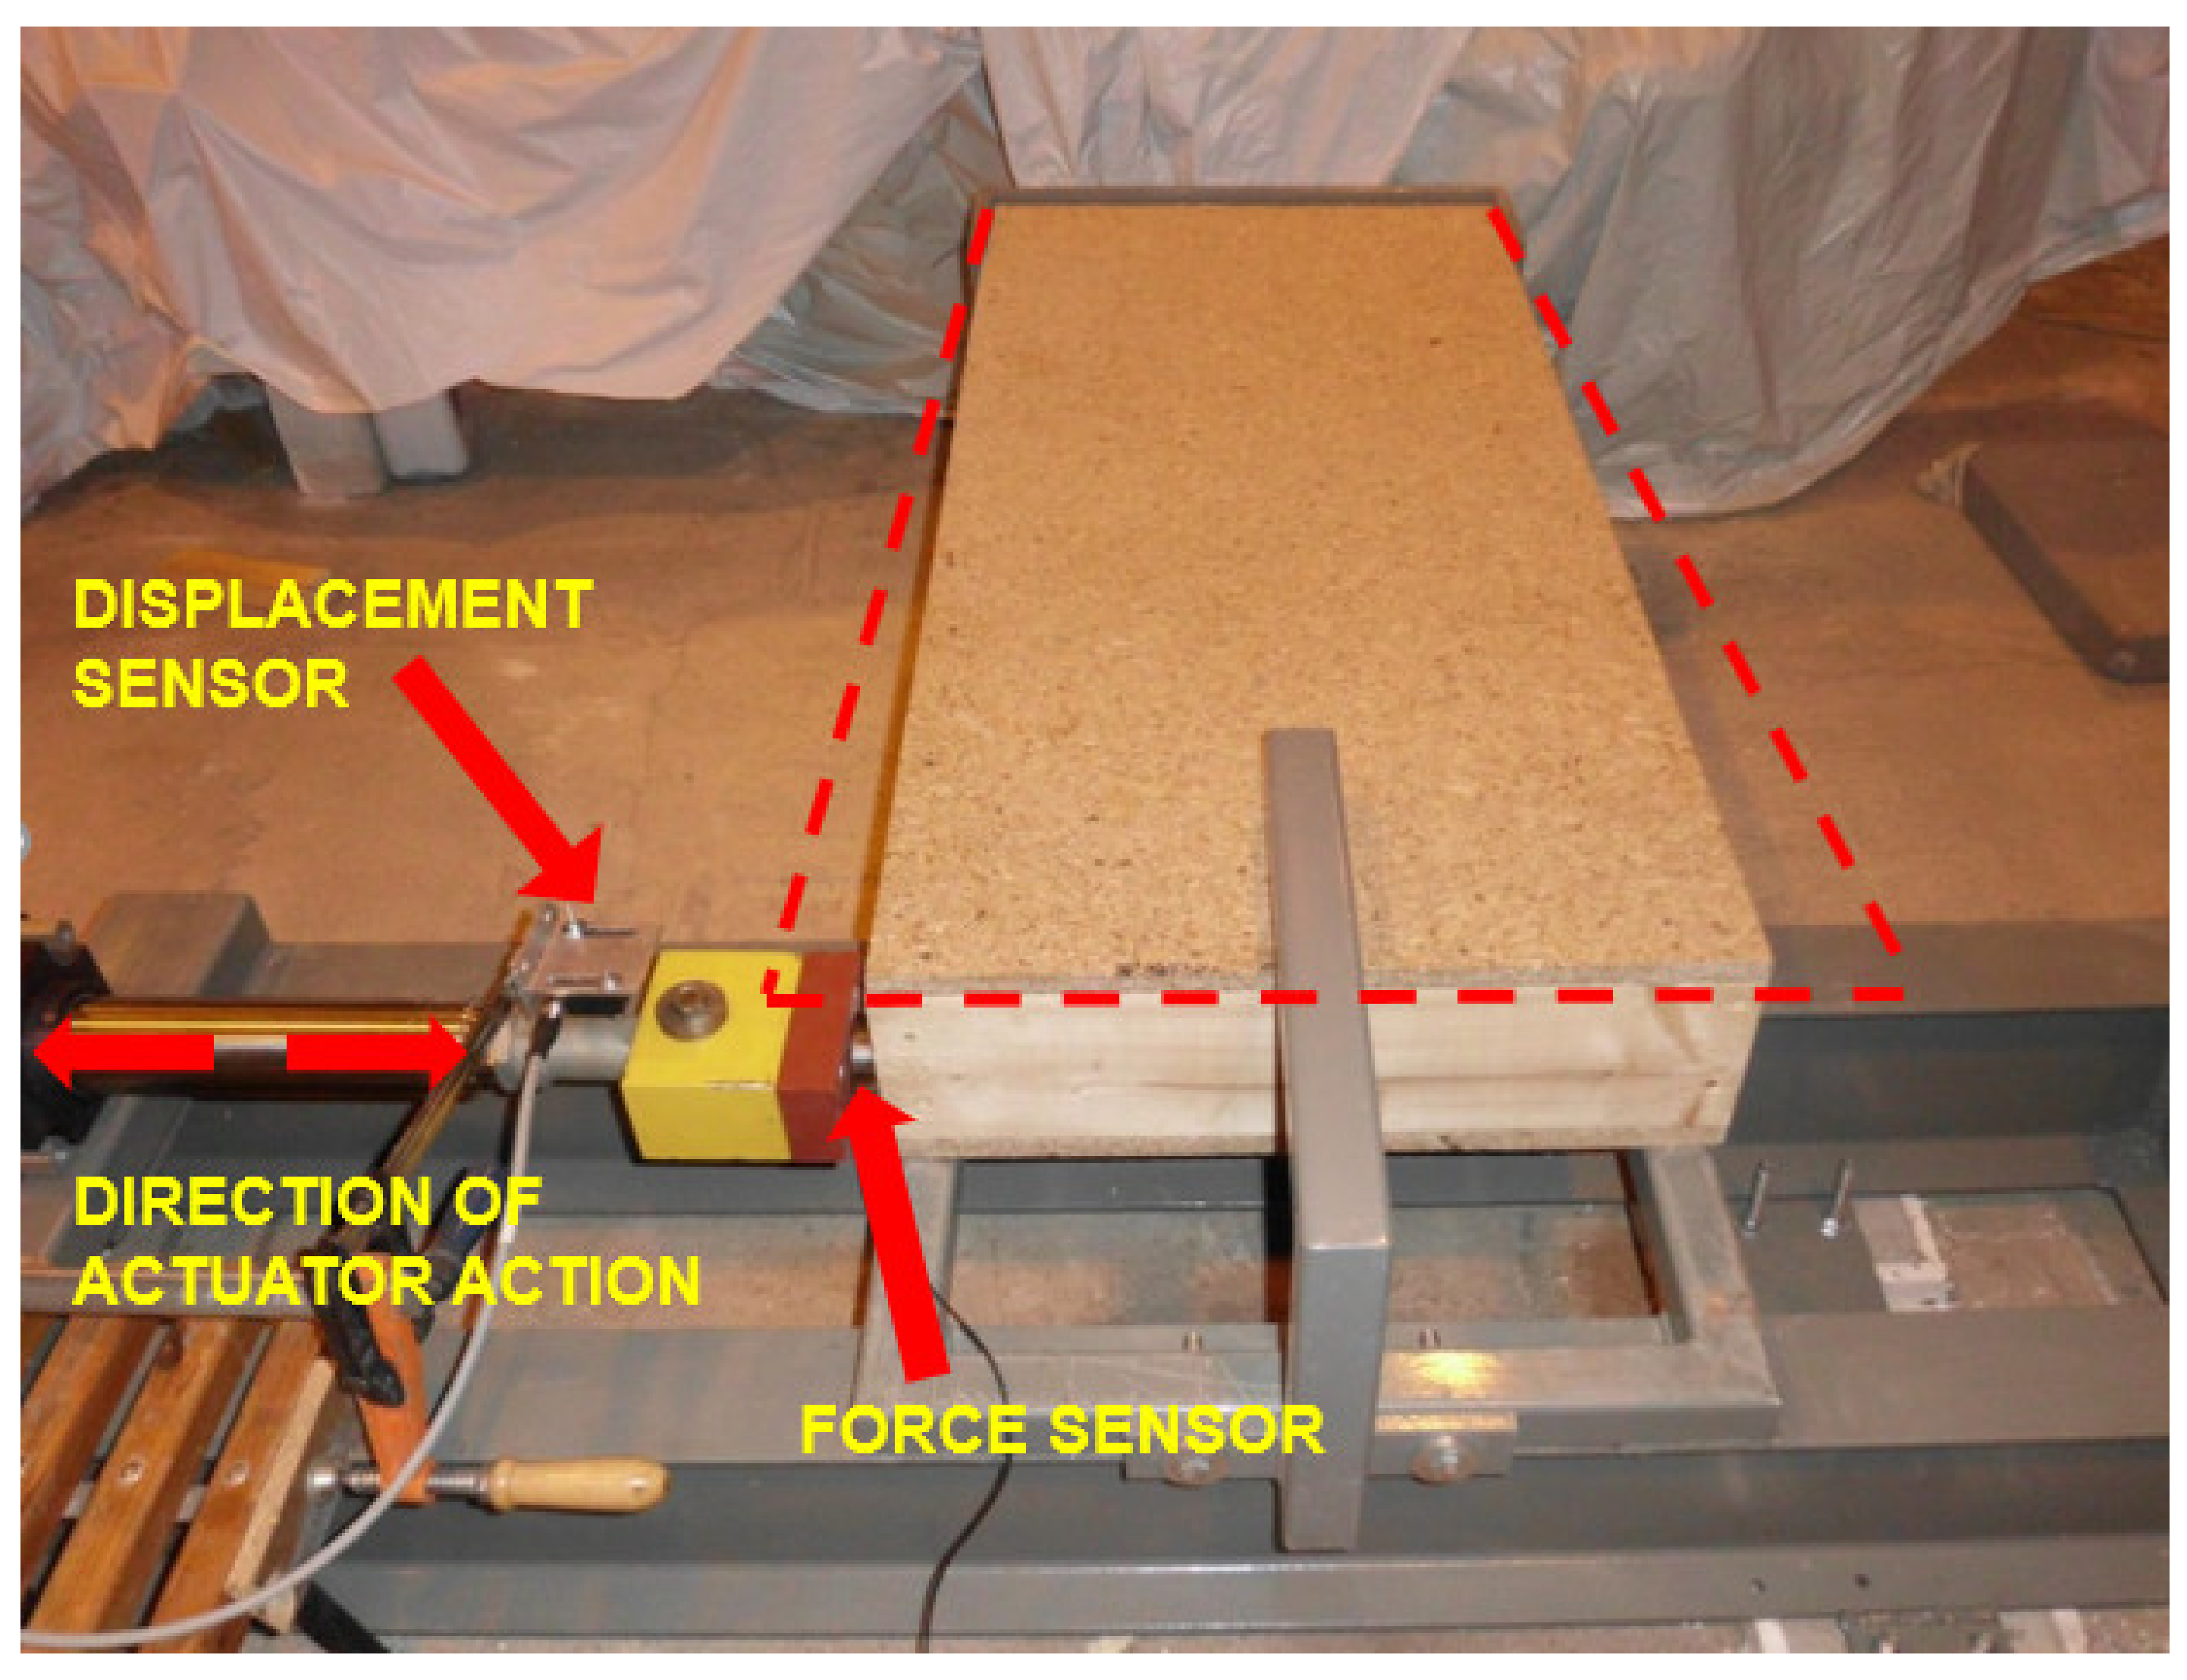
The test frame and research element are shown in the images below in Figure 1, Figure 2, Figure 3 and Figure 4. During experimental tests, both models were subjected to harmonic excitations. The tests were carried out at the frequency of 2 Hz for different values of displacement amplitude. The exerted force was recorded by a KMM40 force sensor. The resulting displacement was measured by an optoNCDT 1302 laser displacement sensor. The force sensor was mounted to the end of the actuator’s moveable rod, while the displacement sensor was installed onto the actuator’s shaft (see Figure 2).
2.2. Materials
As mentioned previously, for this study the materials used were chosen from the available (within the program) library and were not altered in terms of their properties; they are presented in Table 1.
2.3. Model
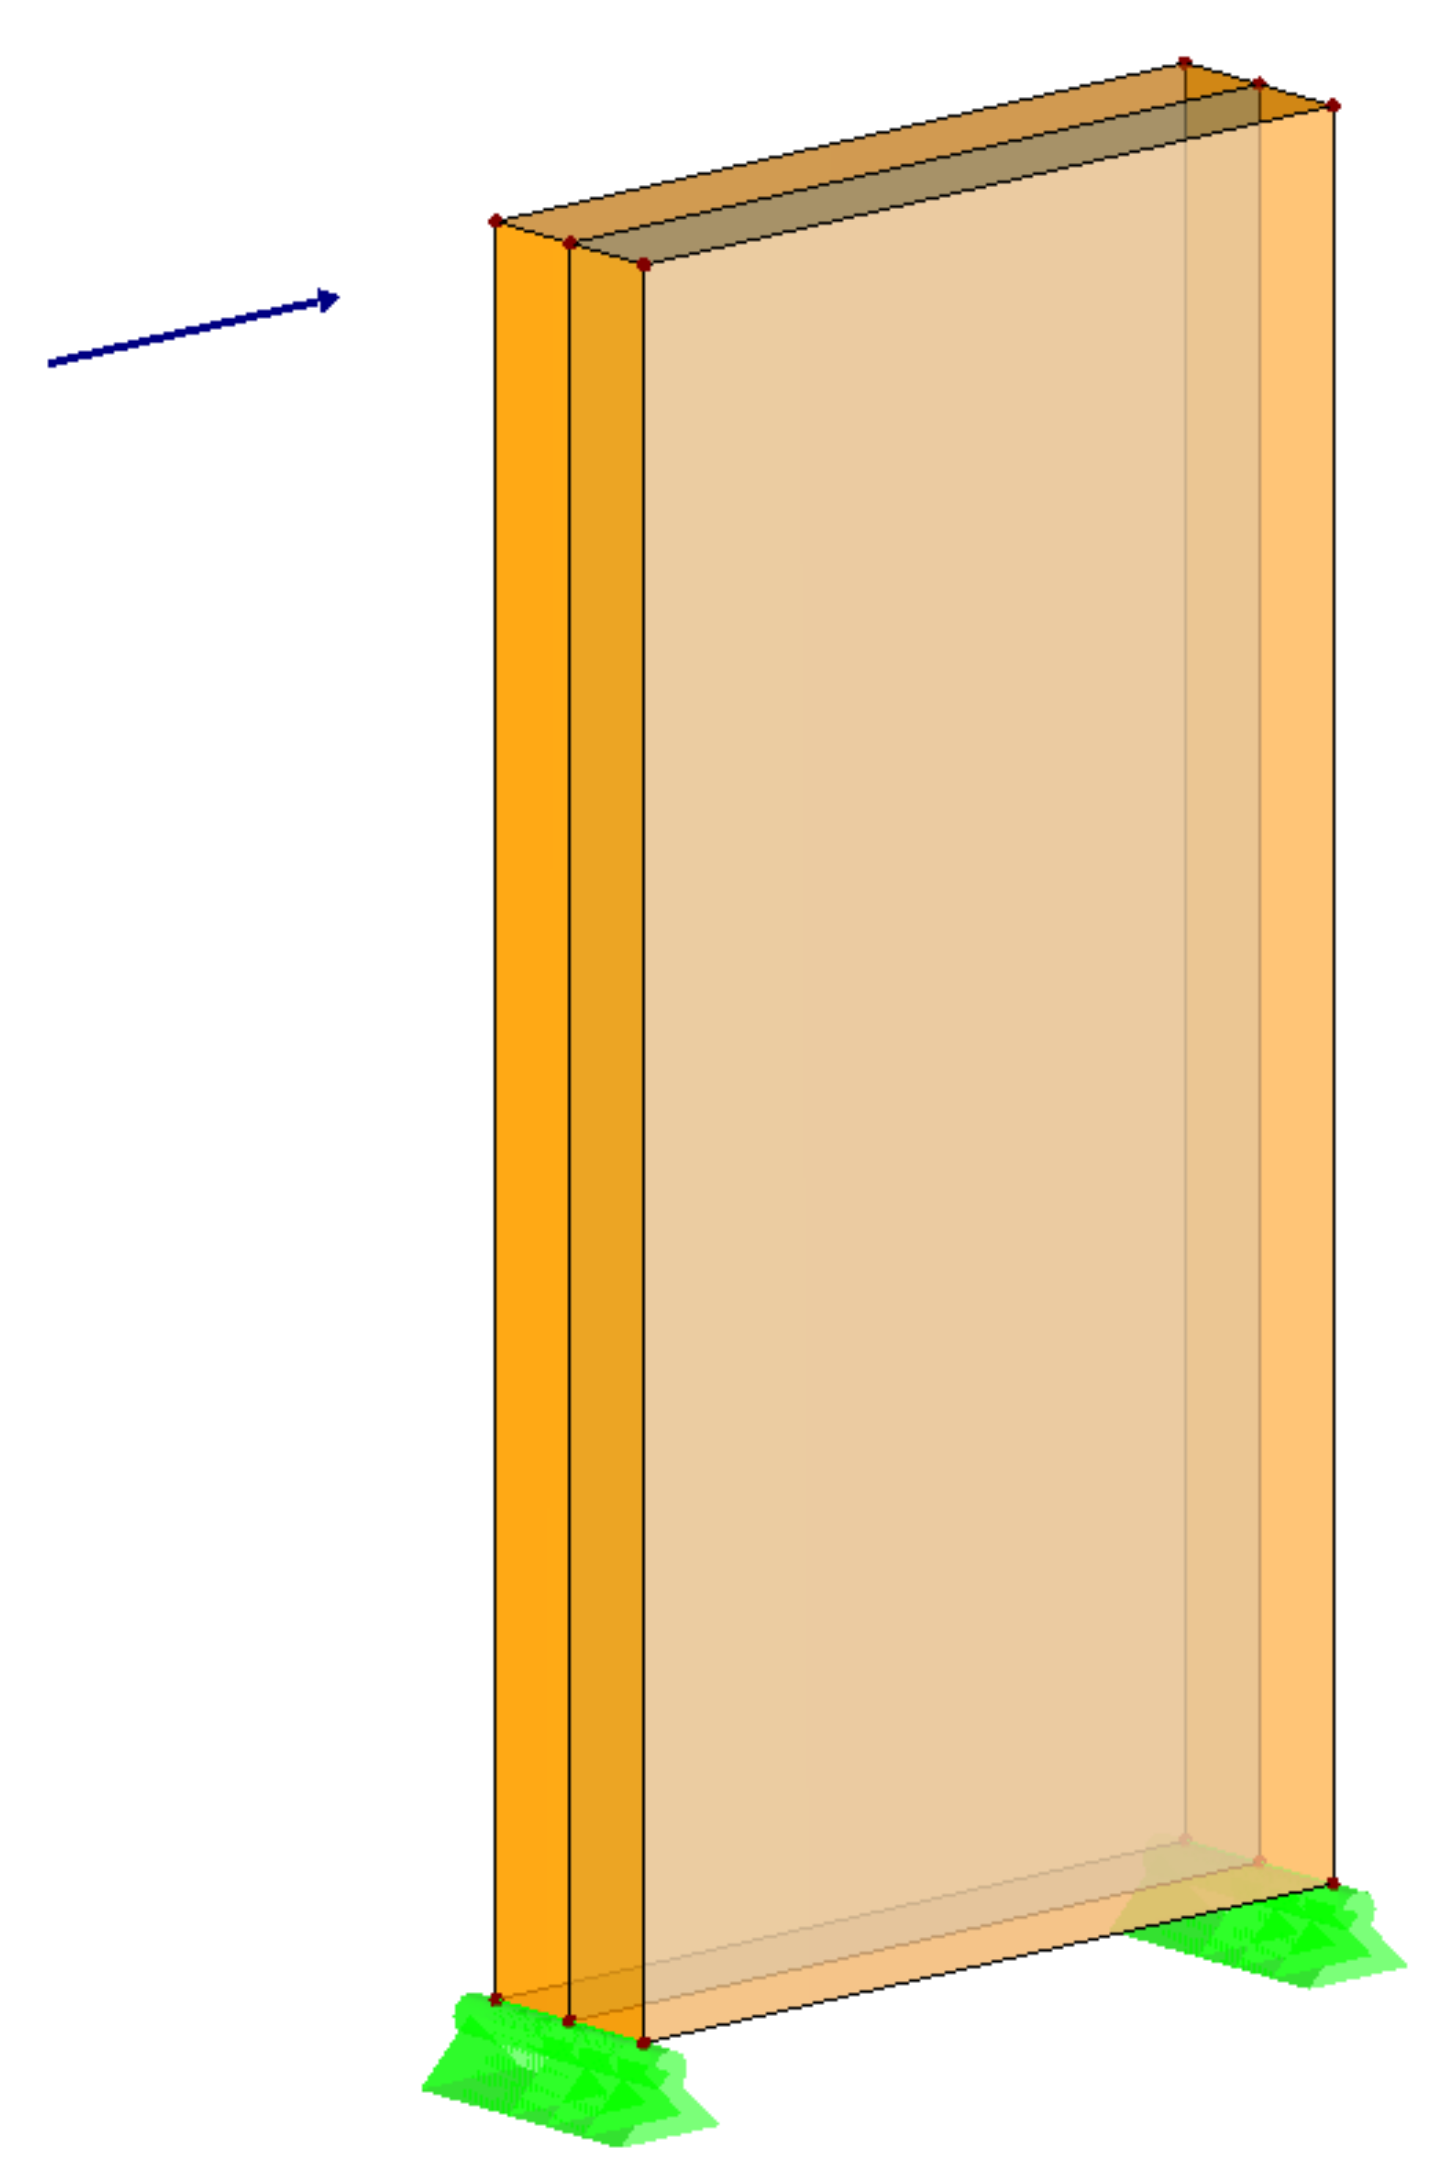
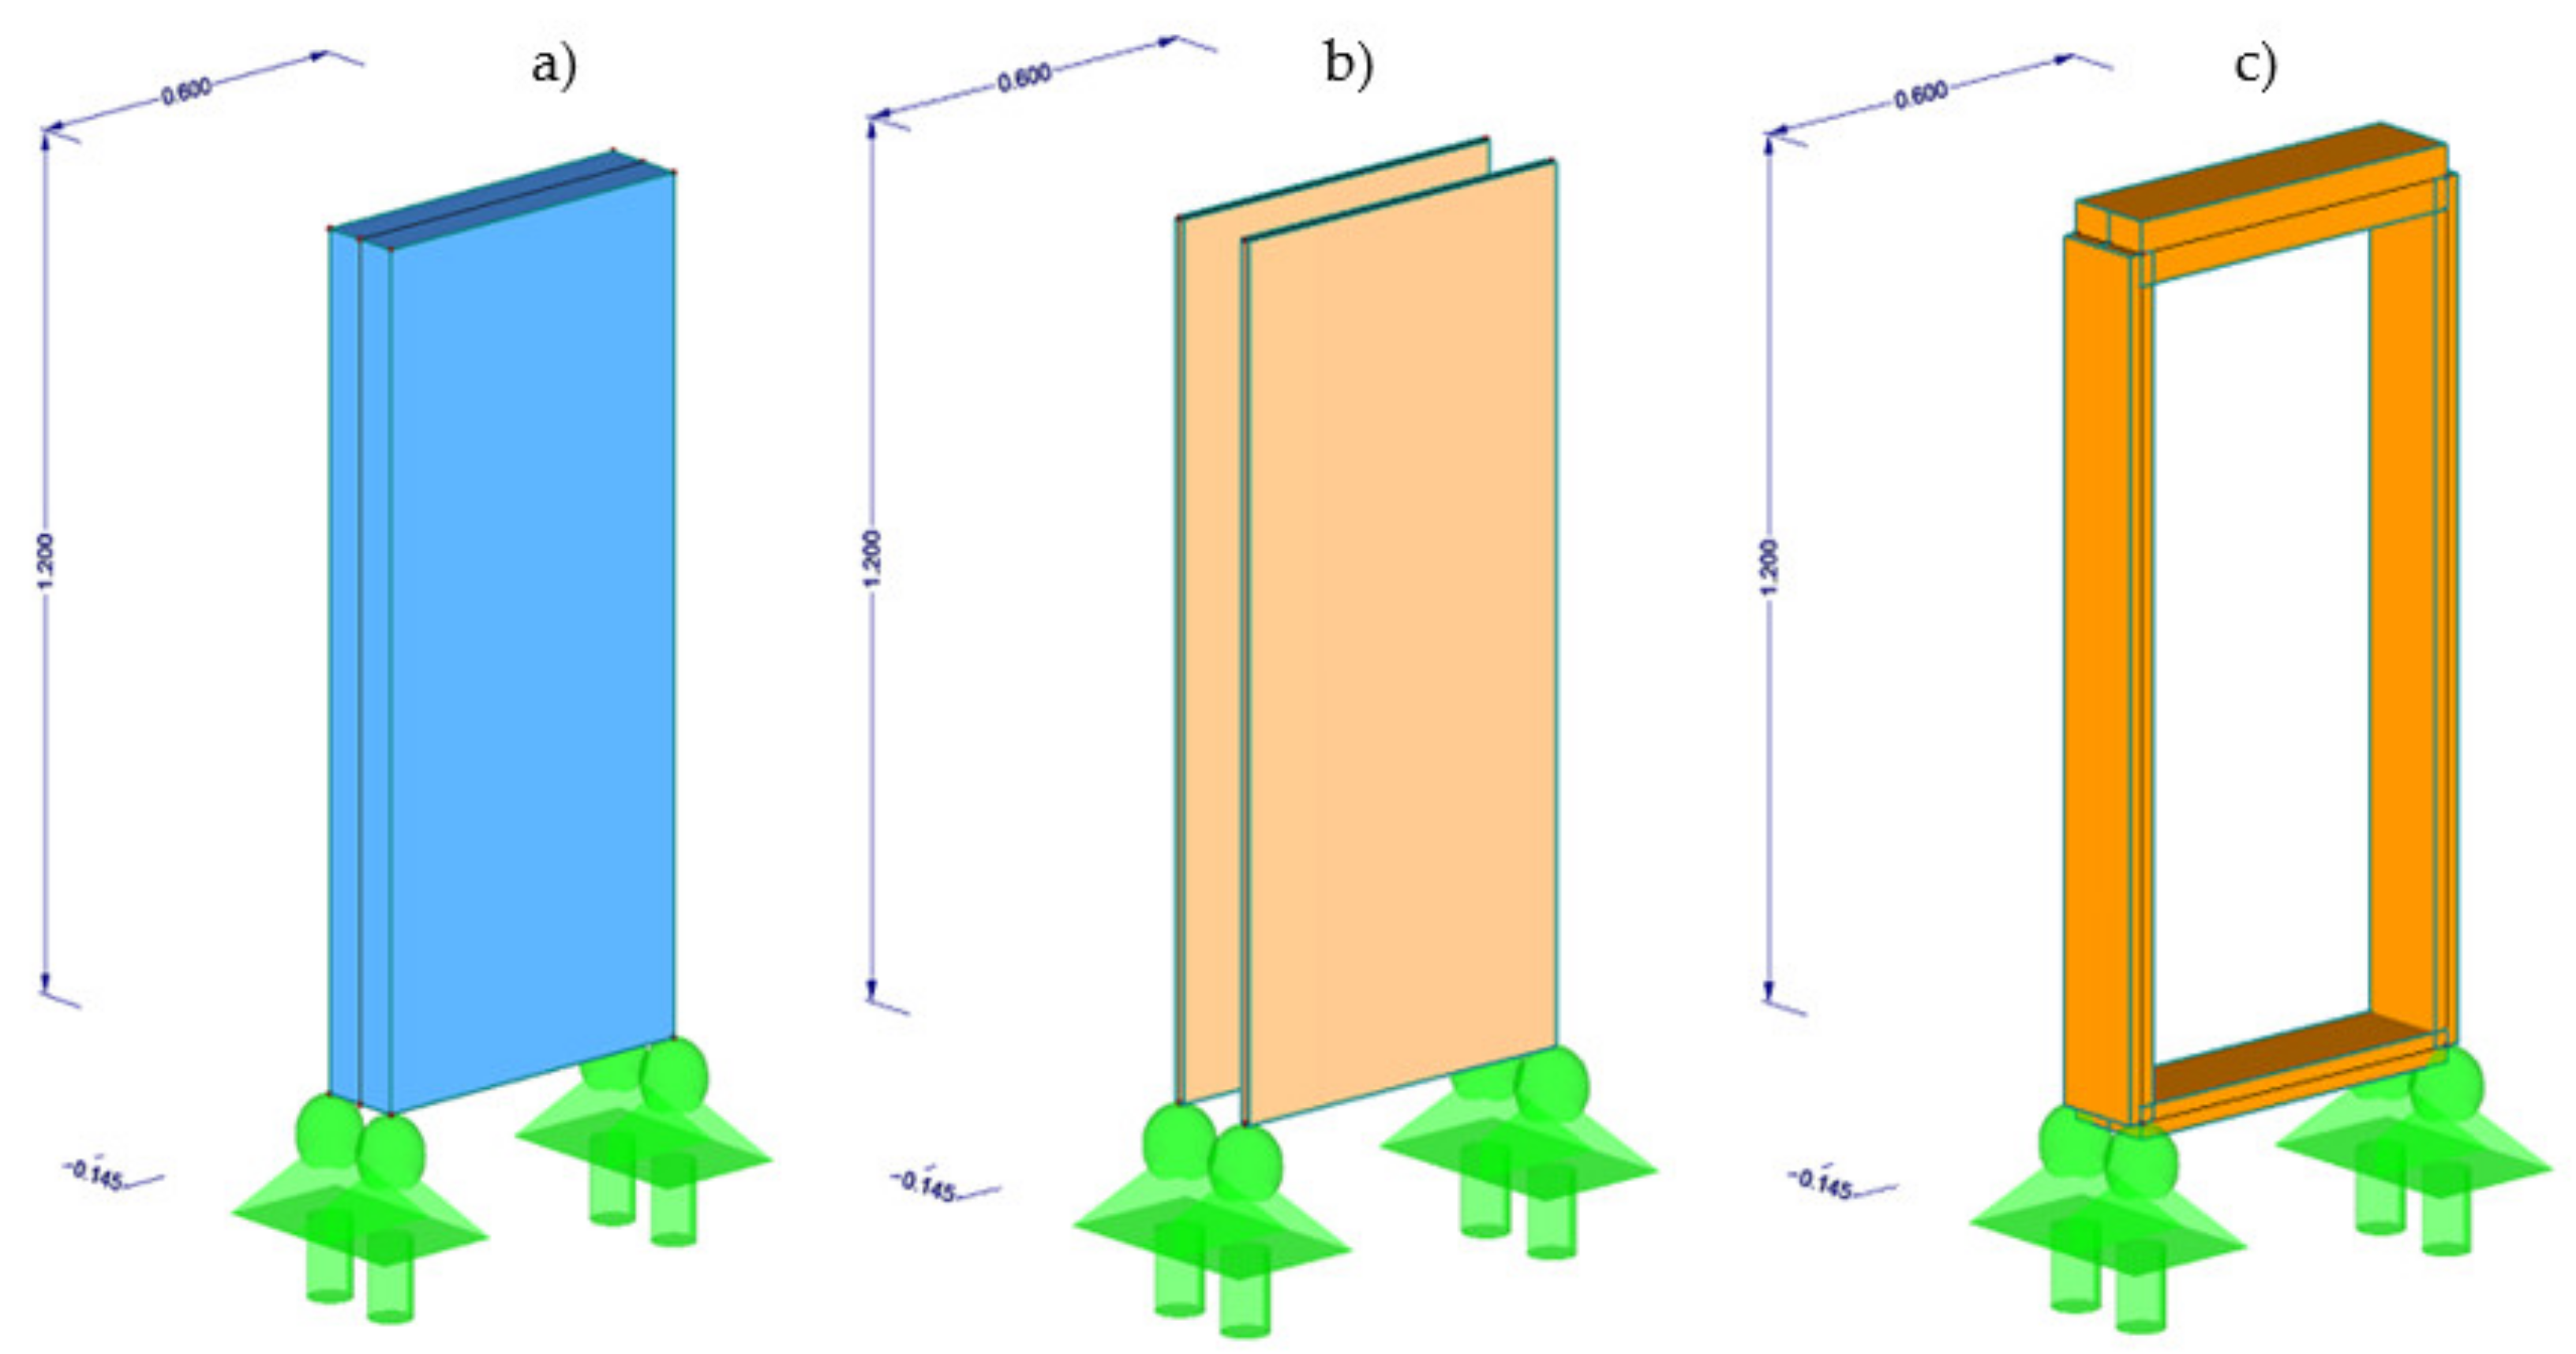
The model’s geometry was based on the test specimen and was 60 cm in width, 120 cm in height, and 18.1 cm in thickness. The outer frame was modeled with shell elements with a thickness of 45 mm on the sides and bottom and 90 mm on top, representing a double layer of beams. The insulation (PU foam) and the sheathing were also modeled as shell elements with a thickness of 18 mm for each OSB panel (covering both sides of the frame) and 145 mm for the insulation made of PU foam. Figure 1 presents the initial model. Figure 5 presents all three materials and the corresponding elements separately. Numerical models were created from a number of composite structural elements consisting of shell elements—one representing the wood frame and three representing three layers (two external simulating OSB sheathing and an internal one simulating PU foam). These three layers were fully connected one to another in the case of the panel with PU foam, representing the situation when the PU foam is injected inside OSB sheathing and it bonds wooden elements together. It should be noted that using beam elements for the outer frame was not possible, because this would not allow the use of three different layers (i.e., two outer layers of sheathing and one internal layer of foam, as presented in Figure 5).
2.4. Adjustments of the Model
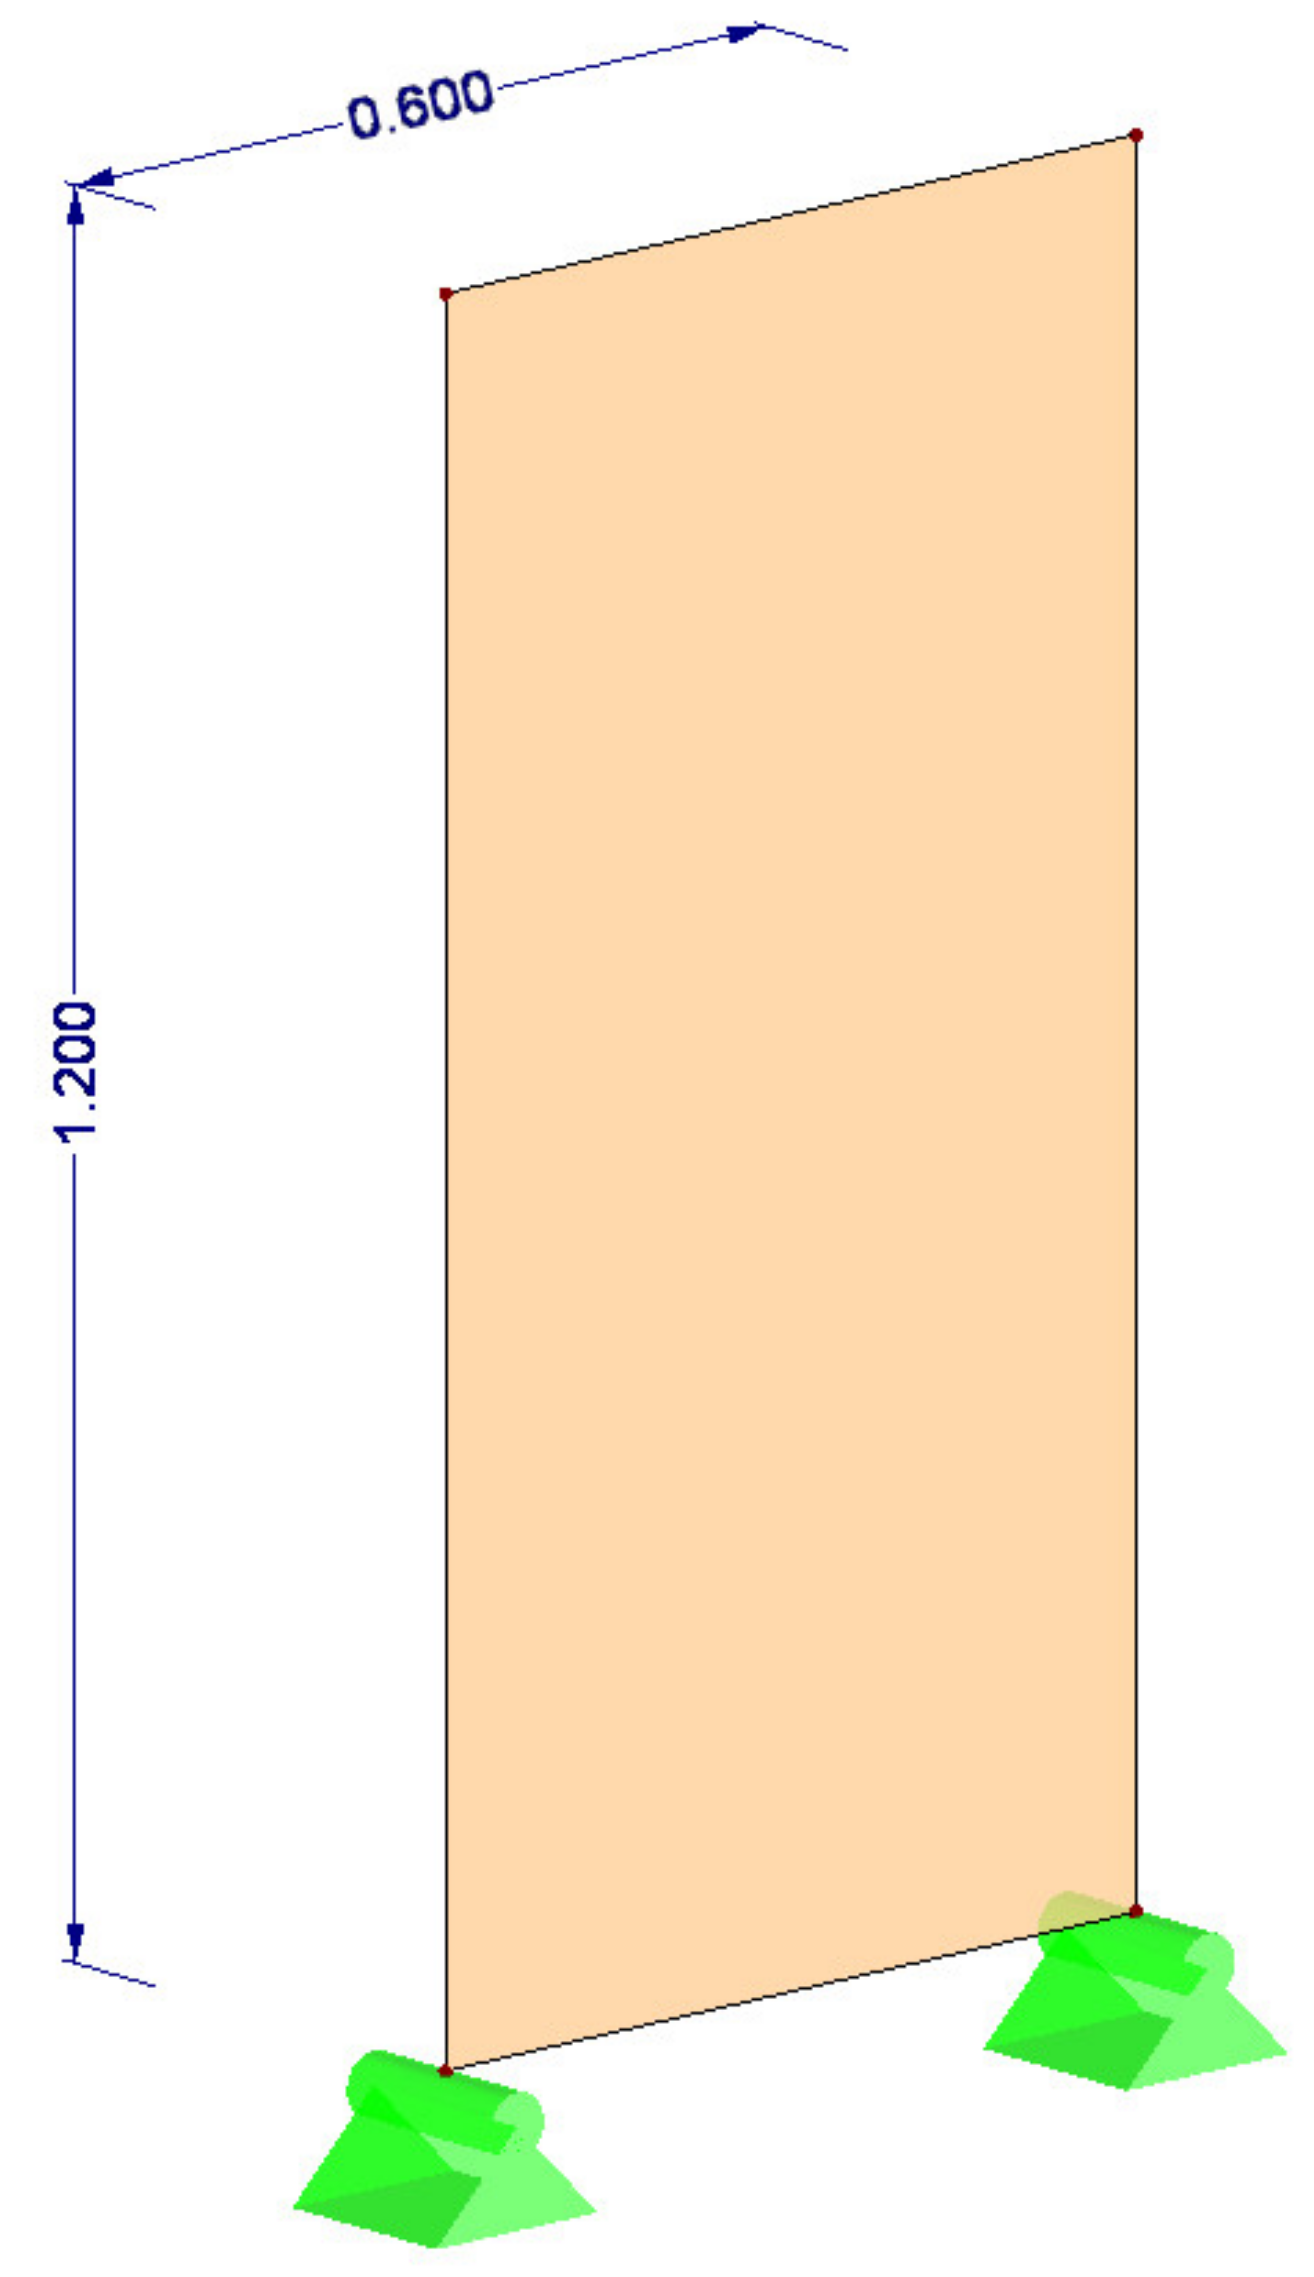
The first step in testing the accuracy of the model was to subject the numerical model to the same static loading as the experimental specimen and to compare the displacement of both models. During that phase, it turned out that it was necessary to refine the support conditions of the numerical model, hence the line supports that were set up initially—as can be seen in Figure 4—were replaced by node supports, as can be seen in Figure 5. Note that nodal supports—with all three displacements locked but all three rotations unlocked—were only placed on the outer nodes of the bottom frame element, skipping the internal node; this corresponds to the real model where the specimen was bolted to the steel frame. This change was sufficient to achieve a convergence in the static force/displacement comparison.
In the next step, the dynamic relations were compared. The dynamic comparison required a different approach because a straightforward way was not possible due to software limitations. In the experiment, the timber frame was forced into a previously determined displacement and the required force to achieve that set displacement was measured. In the used software, it was not possible to apply a displacement, so a recursive approach was used, where the force that was measured in the experiment was used and the resulting displacement was compared with the set displacement from the experiment.
3. Results
3.1. Comparison of Different Support Configurations and Experiment
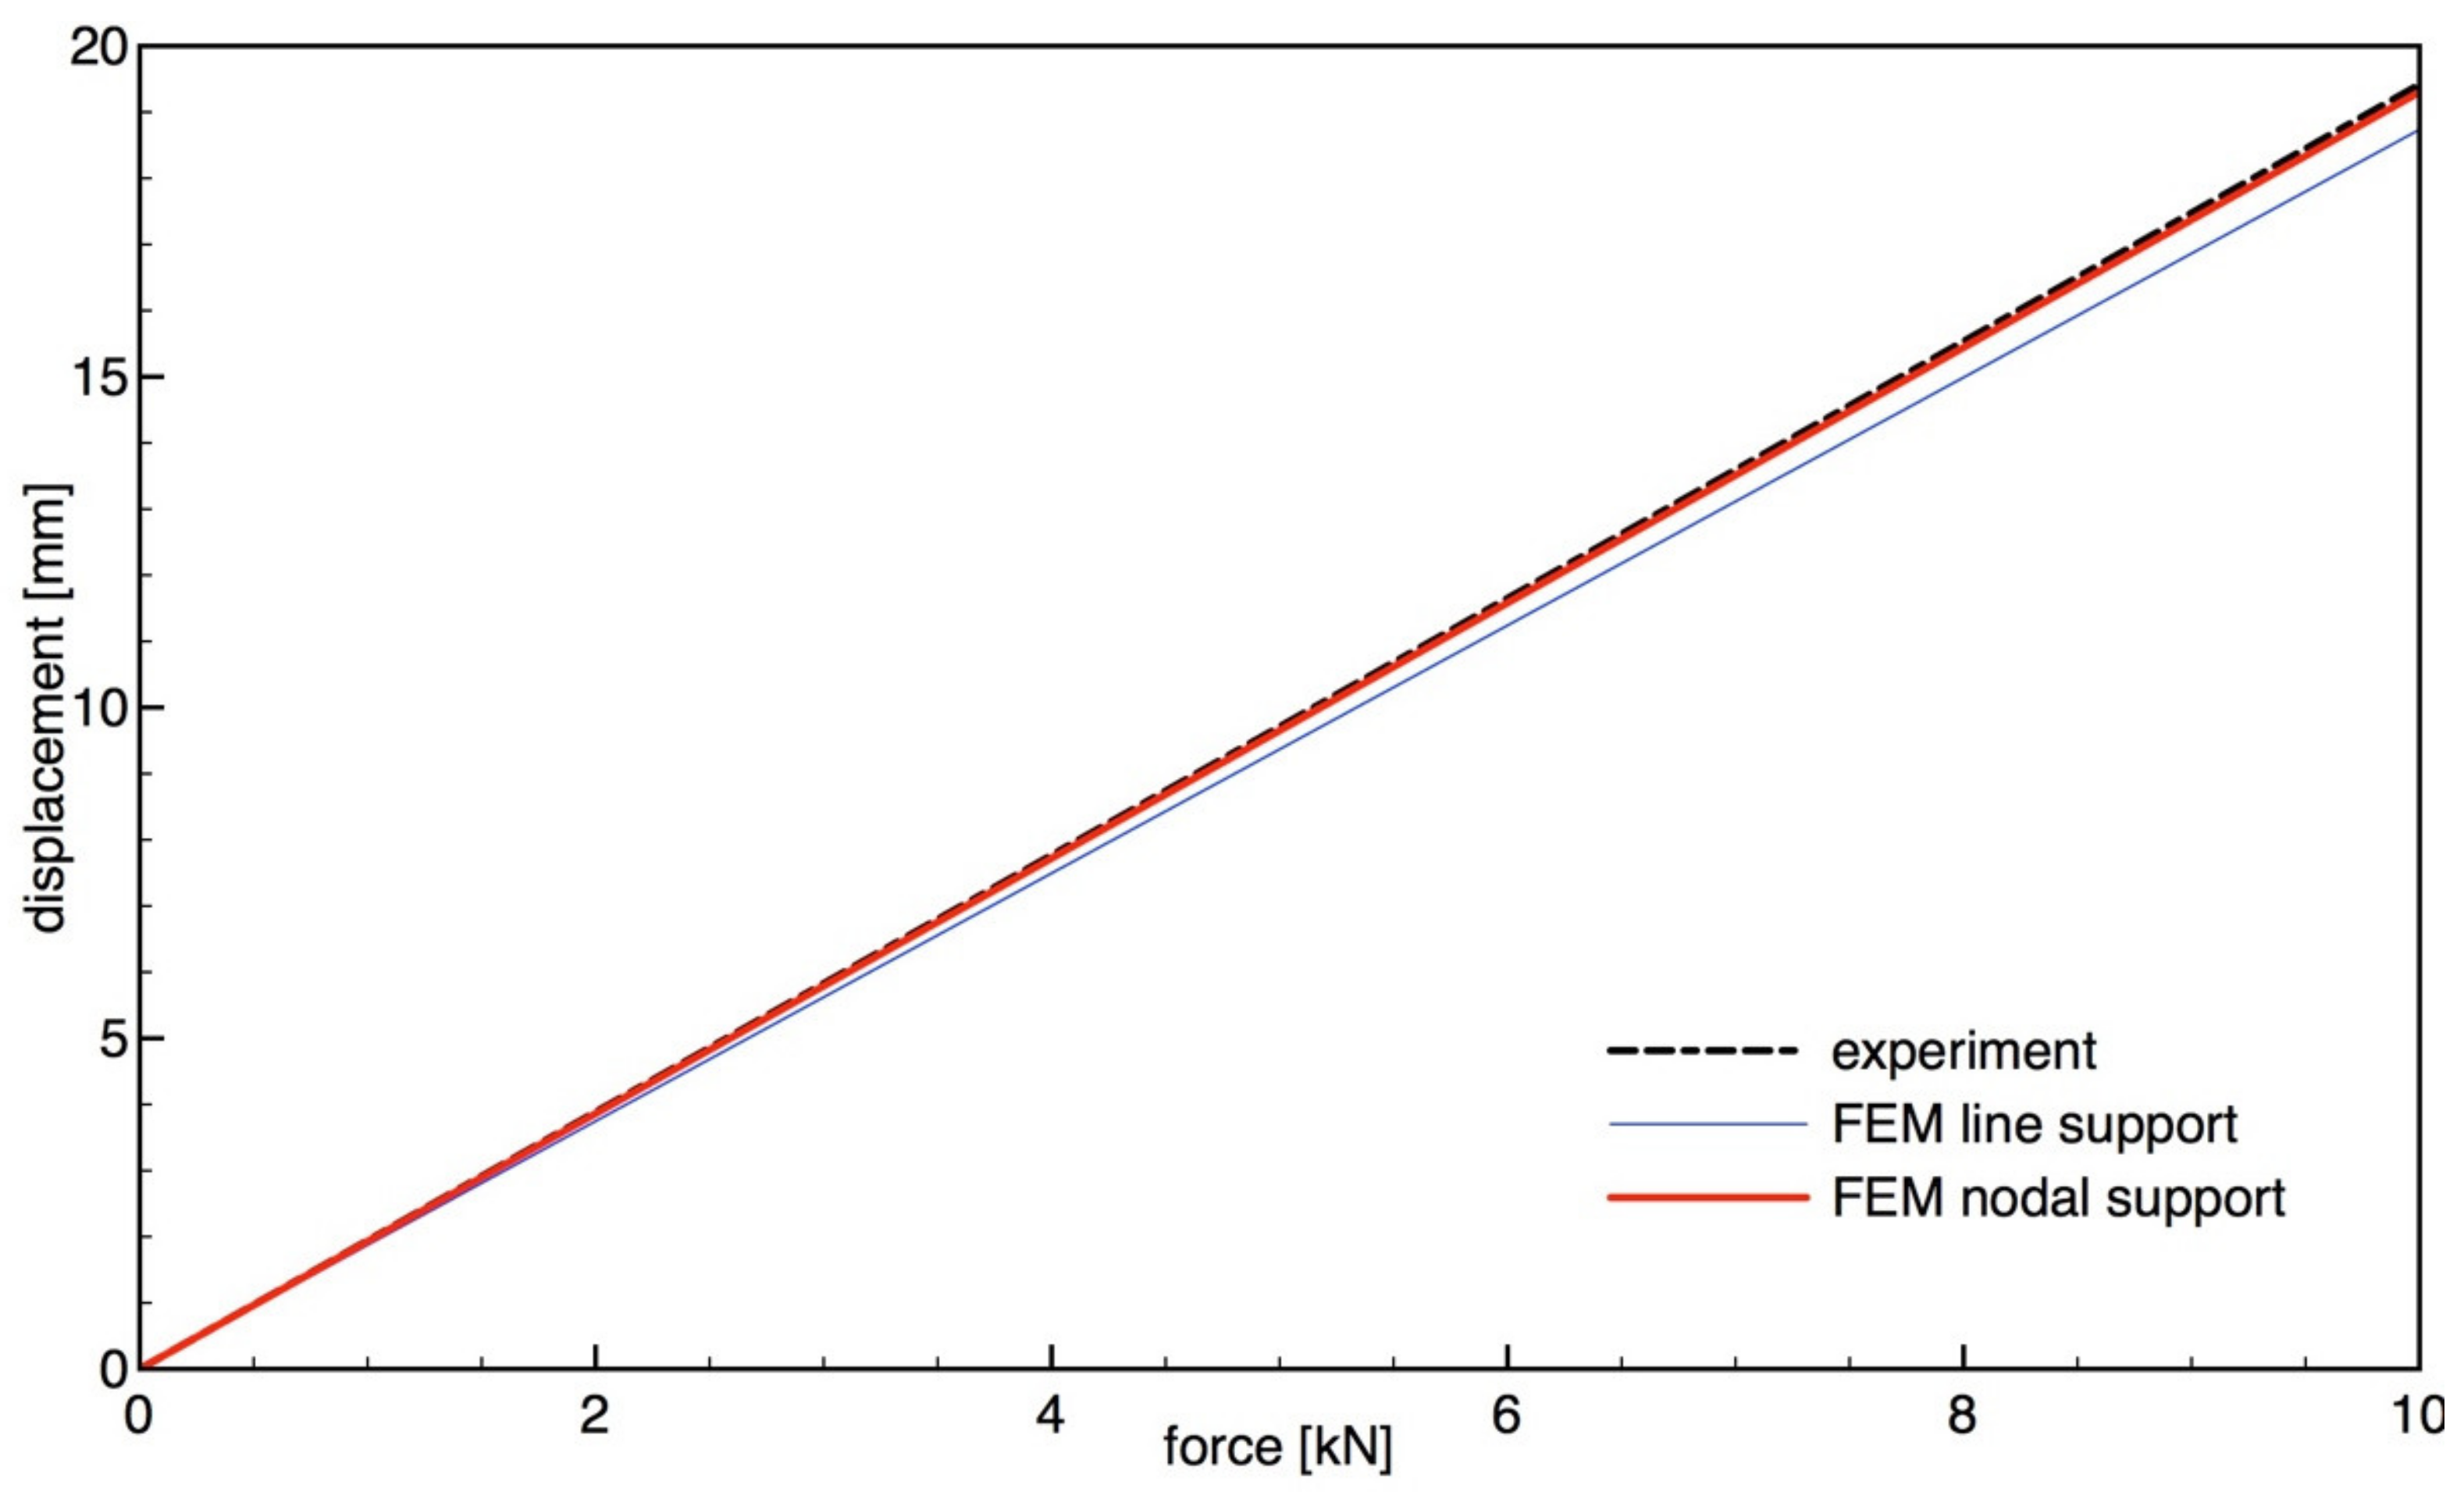
The displacement and resulting force relationship in the experiment and the two different support configurations—line support as presented in Figure 1 and nodal support as visible in Figure 2—are presented in Figure 6. It turned out that no further adjustments were required in order to achieve a convergence in the results for a static load. It also can be seen that the difference between these two support types is basically neglectable.
3.2. Comparison of Dynamical Behaviour between Experiment and Simulation
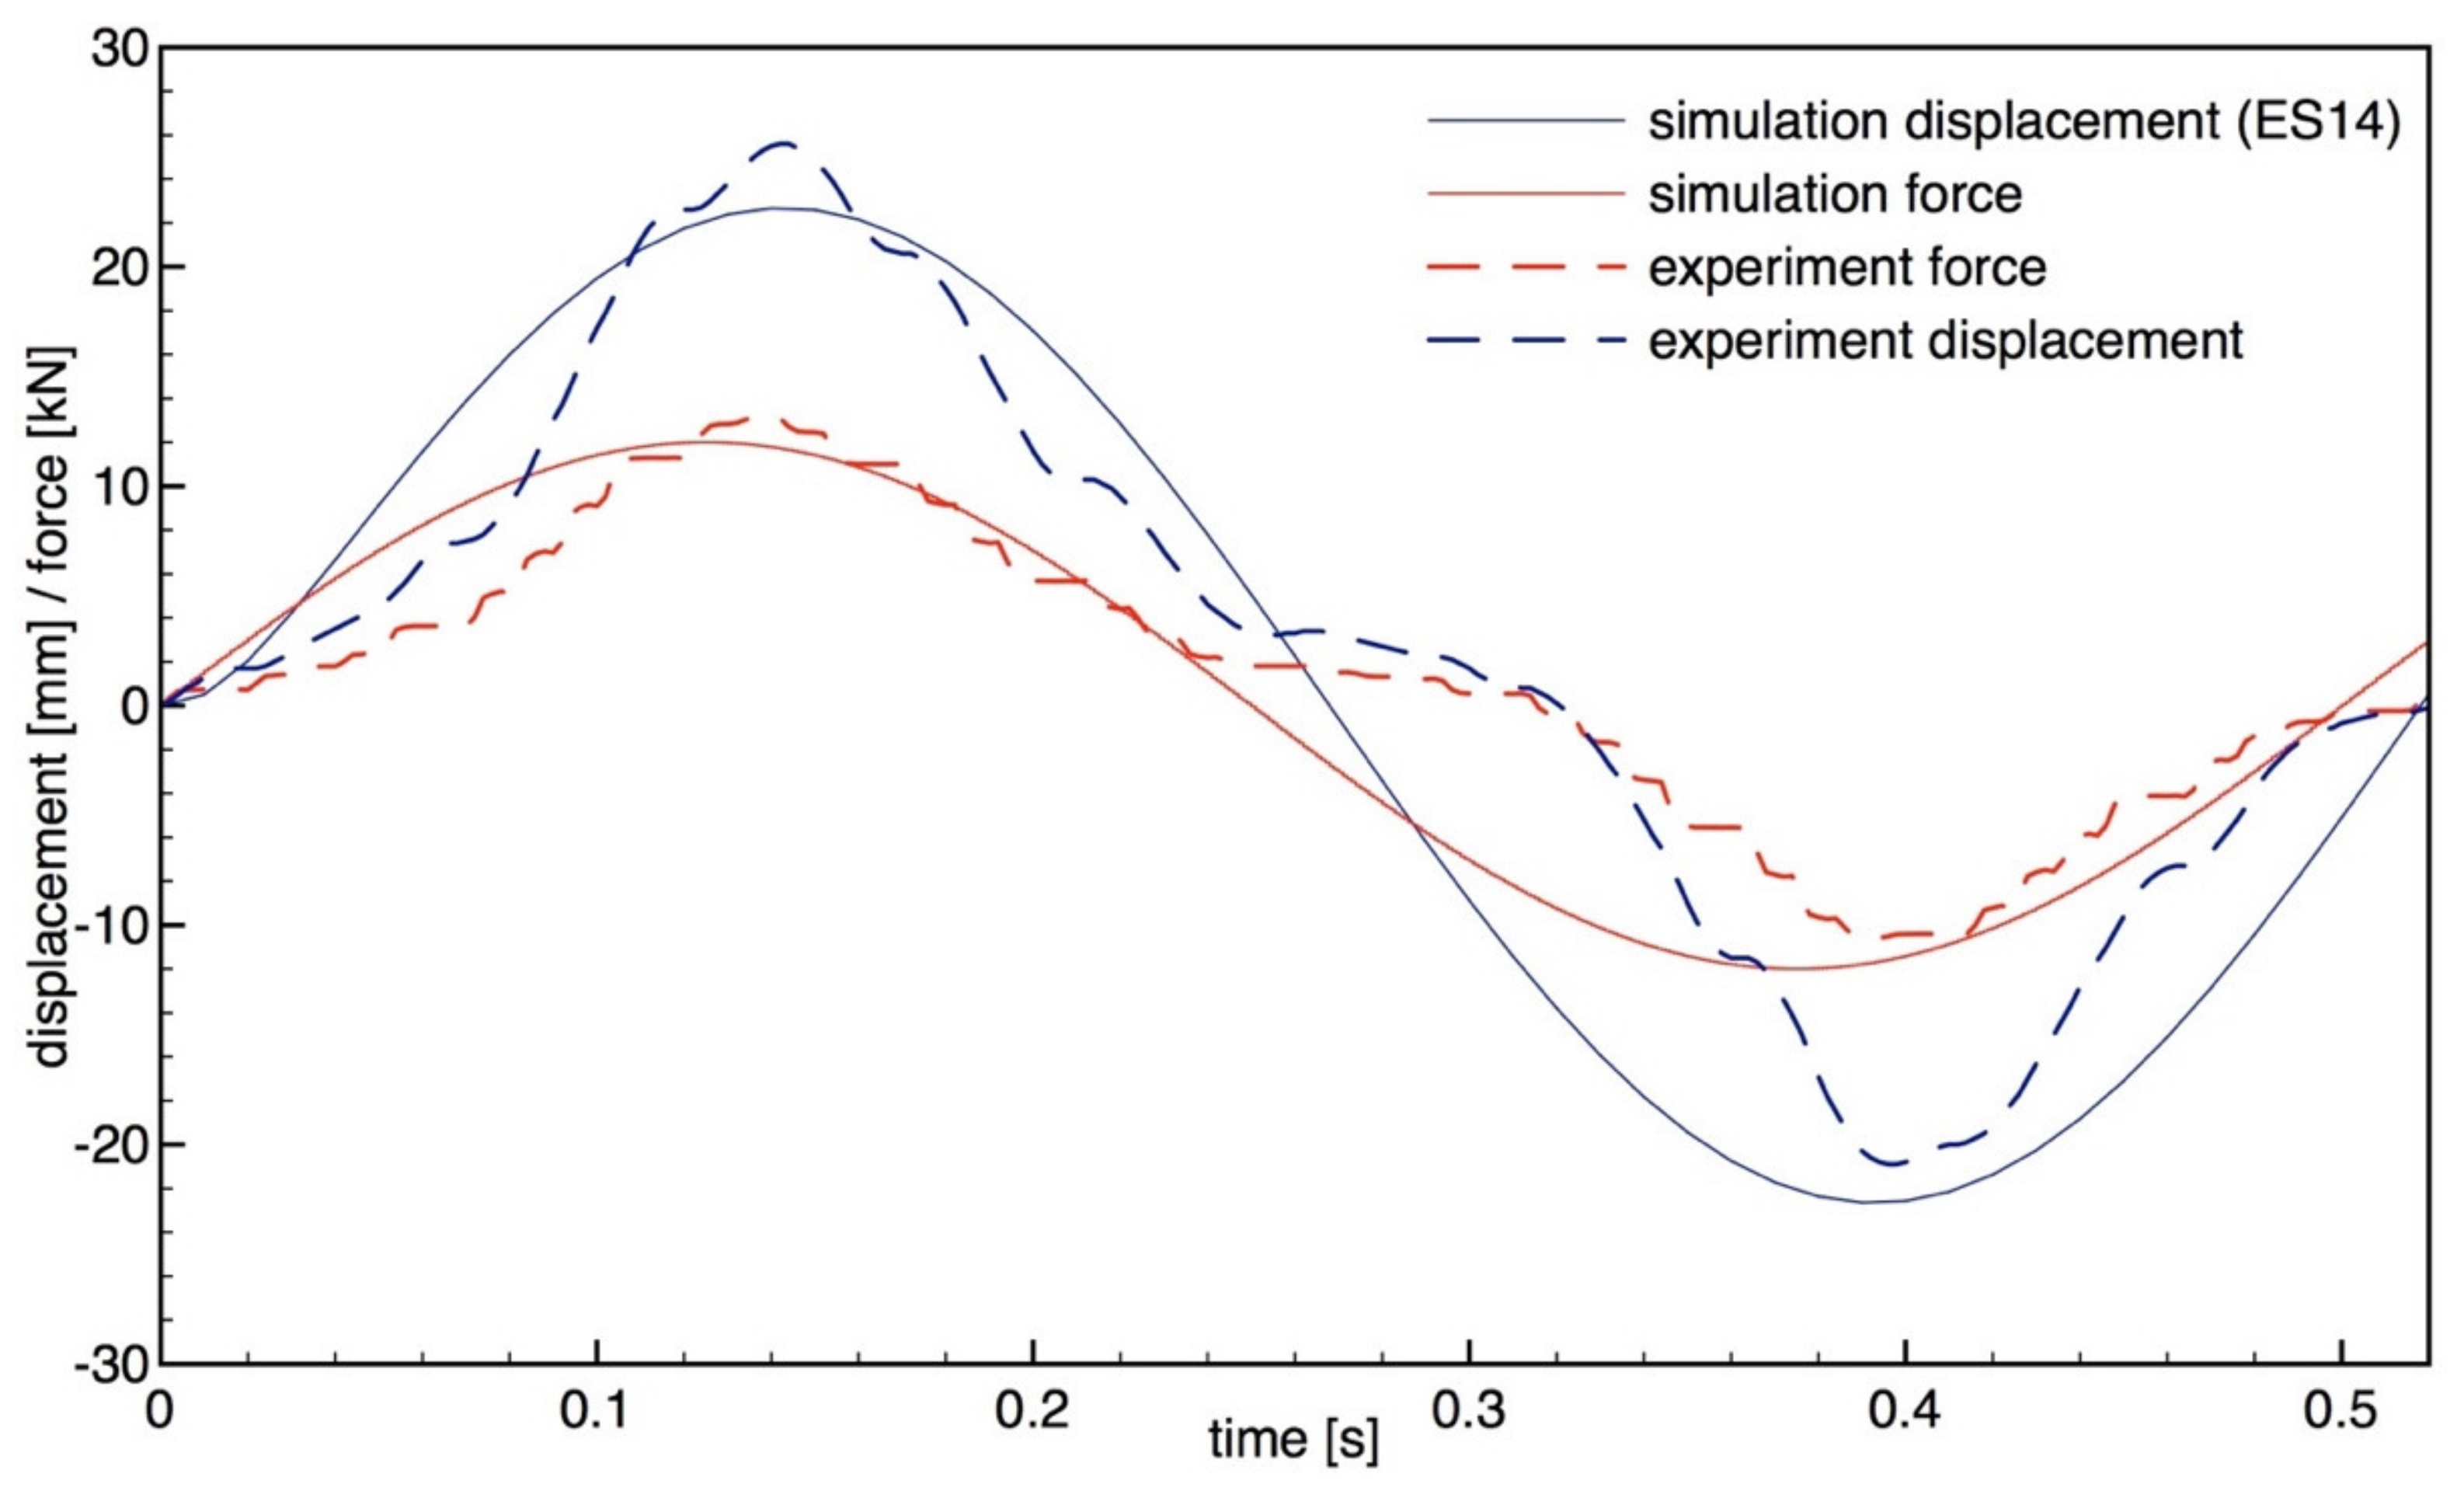
In order to use the numerical 3D model for advanced dynamical tests, it was necessary to verify its dynamical behavior and compare the response of the numerical model with the response of the tested specimen. We chose a frequency of 2 Hz because it was close to the eigenfrequency of the specimen. The results of this comparison—where a sine load at 2 Hz was applied to the specimen in the form of a nodal force—are presented in Figure 7. It should be kept in mind that for using the numerical model to carry out numerical simulations of whole structures like buildings, the most important criteria are the maximum displacement as well as the response frequency. It can be seen from Figure 7 that the numerical results are smoother compared to the real-world test. This can be accepted since the maximum values are close enough, the difference is less than 12% (which can be accepted for engineering design), and the possibility of using numerical models for advanced simulations with accurate maximum displacements makes up for the inaccuracy in the time curve.
3.3. Reduction of the Numerical Model
For some simulations, a model constructed from basic elements like the one presented in Figure 4 might be too large in terms of finite elements. The size of the model has a significant influence on computation time, especially in dynamic analysis, which sometimes (for large models) might render the calculations impossible due to computer requirements. Therefore, it might be necessary to simplify a model, sometimes even at the cost of accuracy.
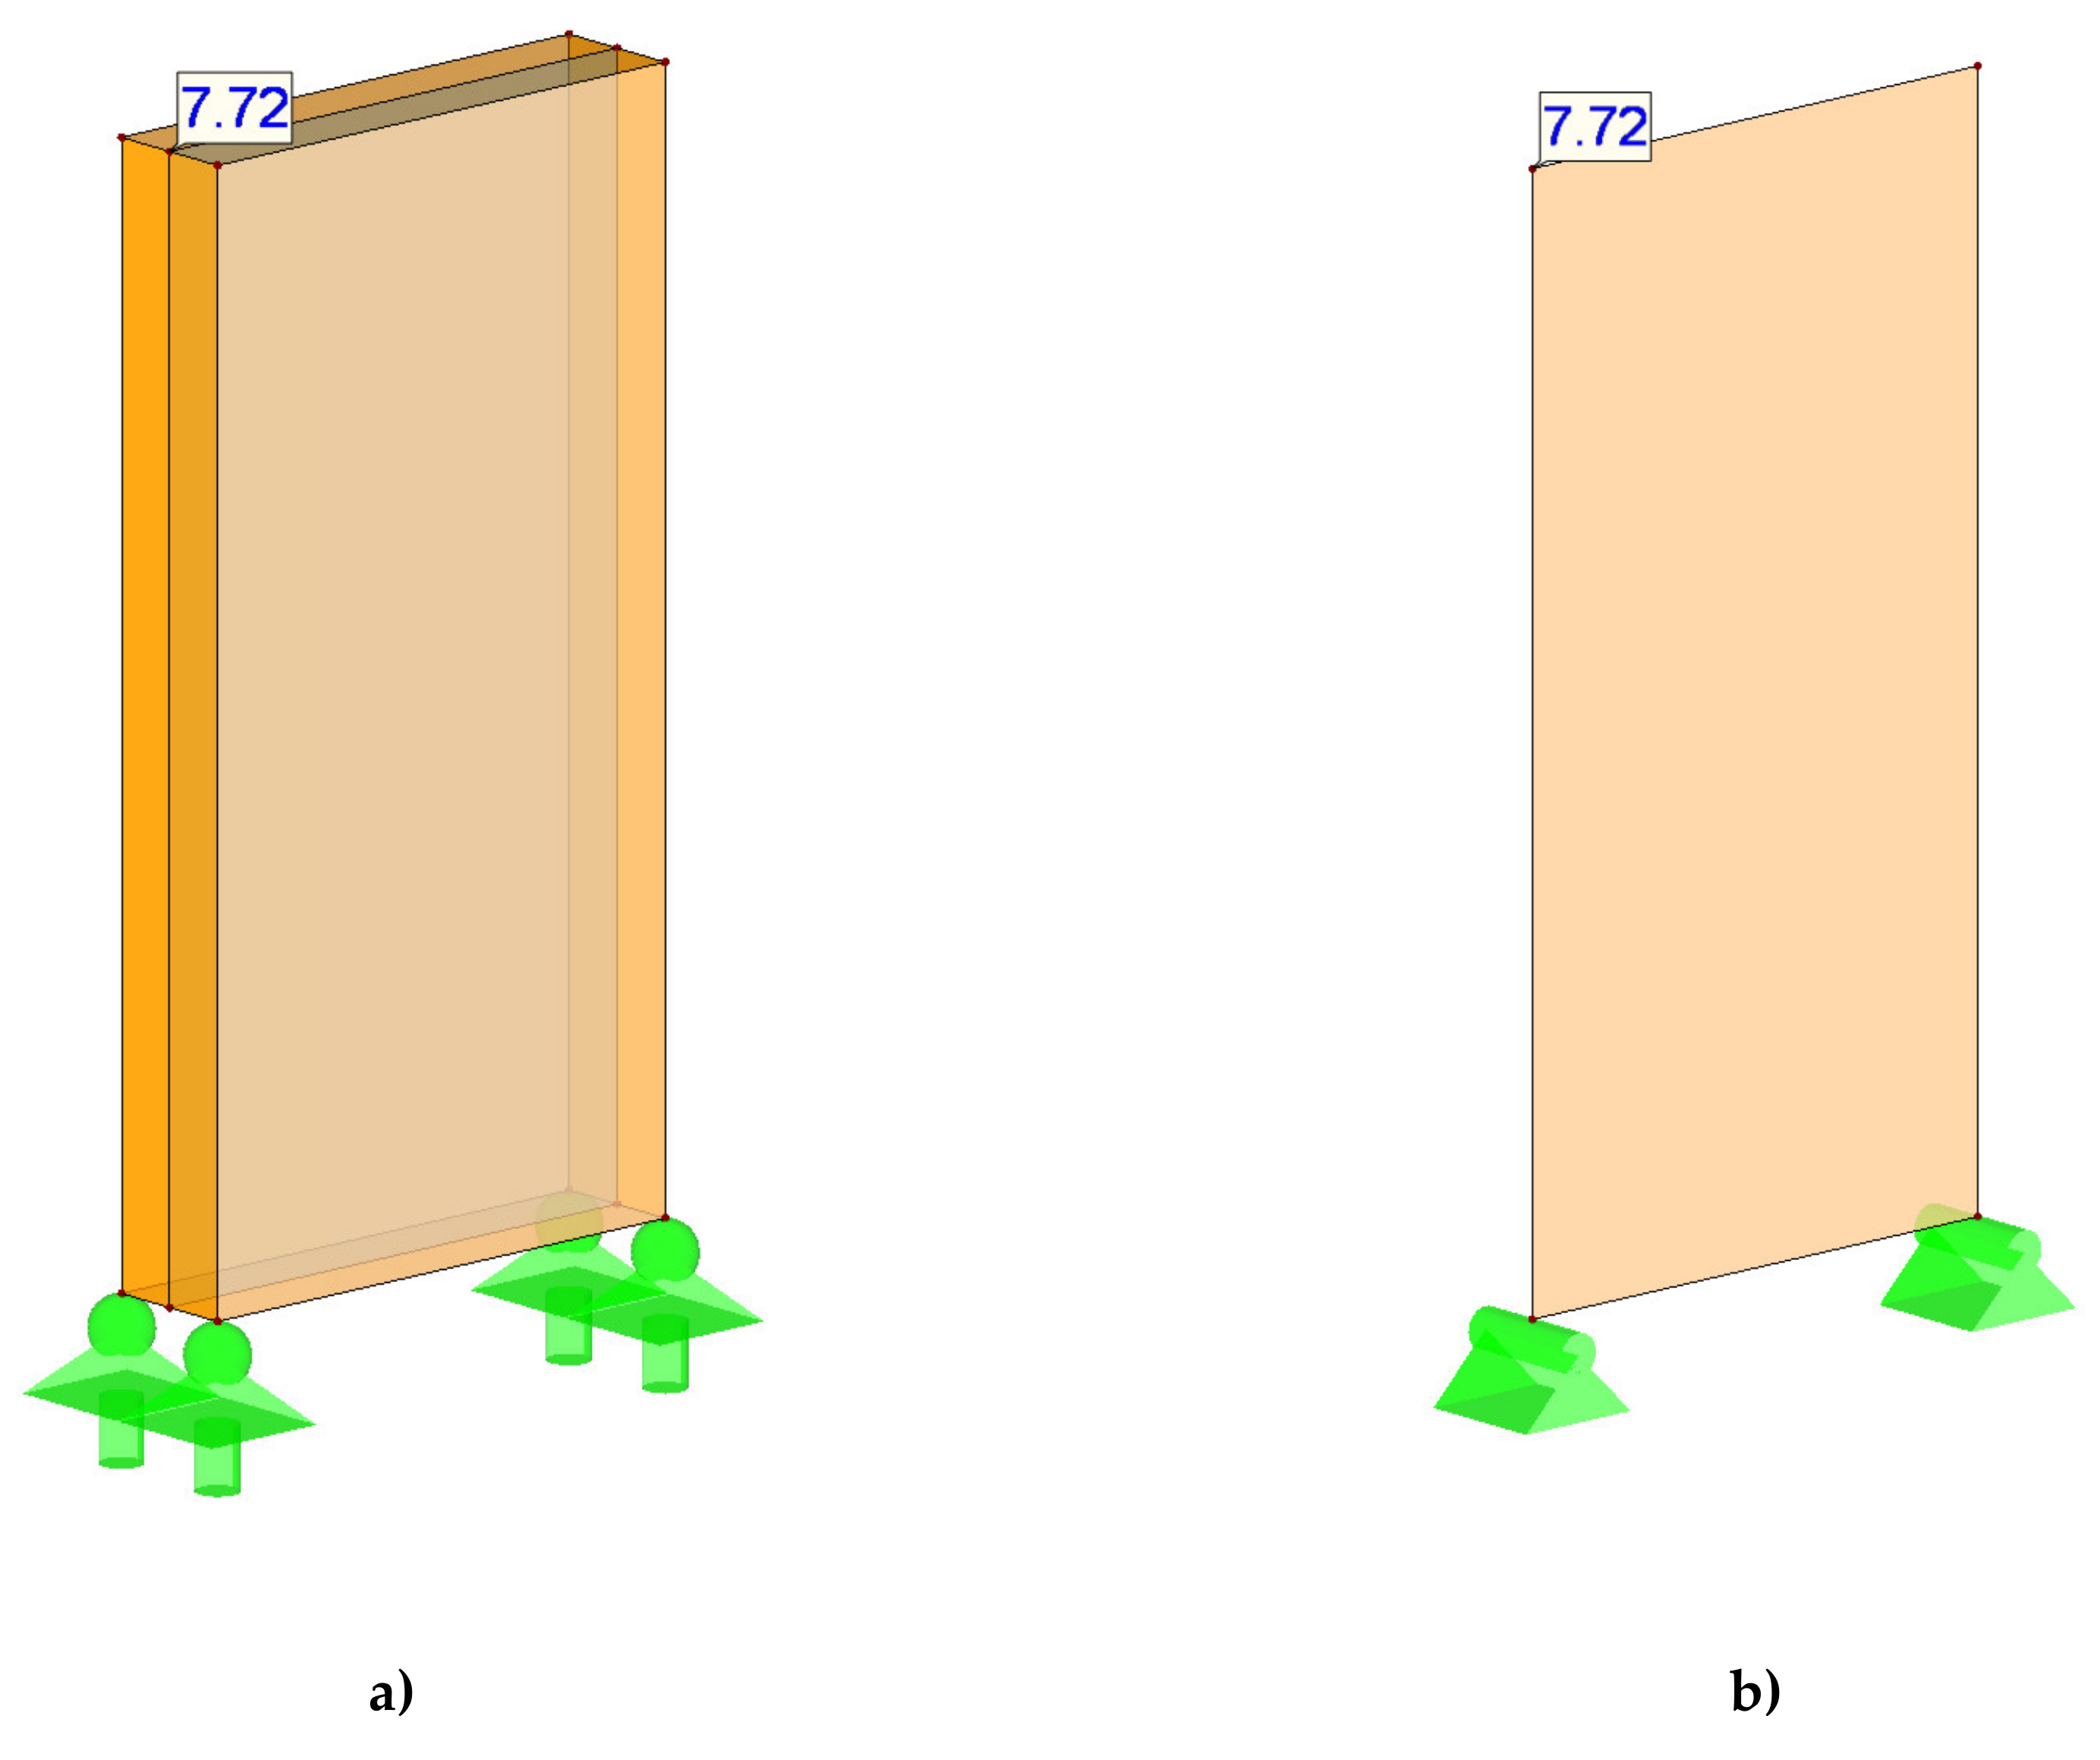
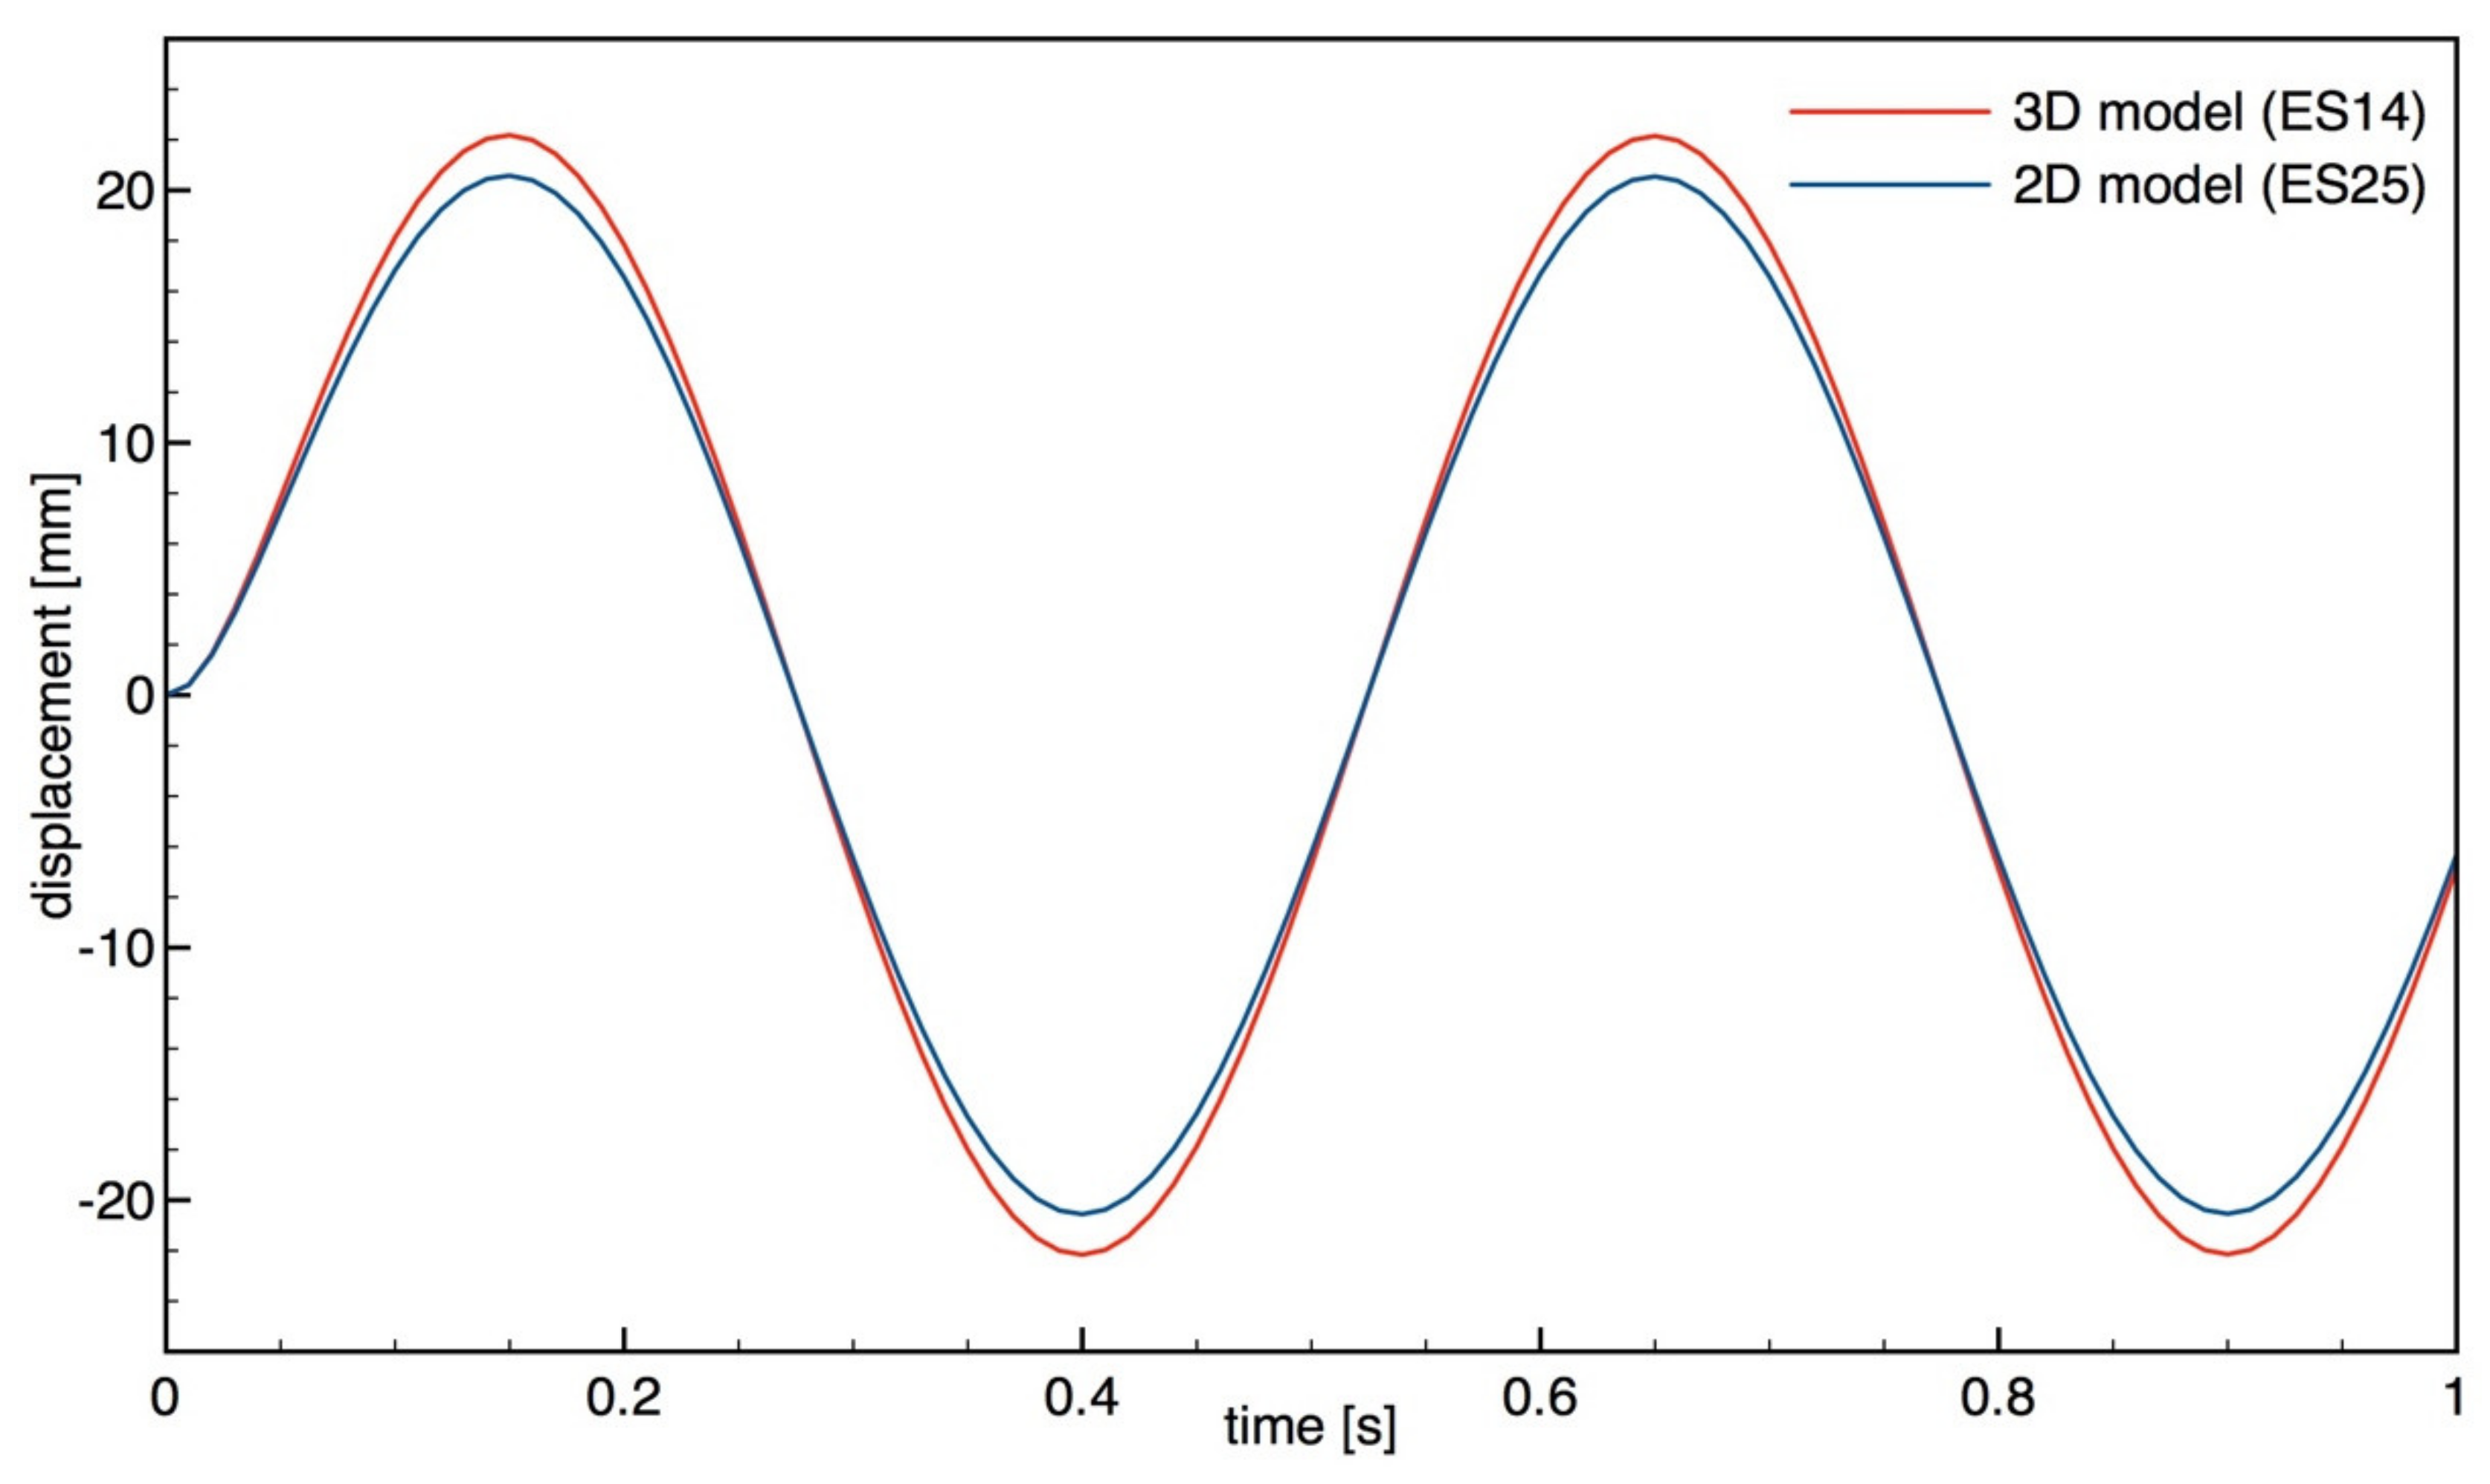
In order to present such a possibility, a shell model was created (shown in Figure 8). It is based on the reduction of all seven elements into one shell element. To achieve useable results, the stiffness matrix of the shell element as well as its geometrical and physical properties had to be modified. At first, the overall mass and volume were converted to determine the proper thickness of the 2D element that was modeled as a single-layer OSB shell element. The thickness of this 2D shell was 70 mm, which ensured the same overall mass of the element. Then, the supports were altered to account for the changed model by replacing the two-node supports with only displacements fixed, with one-node supports with two rotations fixed, as shown in Figure 8. In the next step, the stiffness matrix factors (as can be seen in Table 2 and Figure 9) were changed in order to achieve the same displacement under static loading as the 3D model of the elementary wall panel. The results of the displacement under static loading (the acting force was 4 kN) of both models (3D and 2D) are presented in Figure 10. This calibration of the model by using the stiffness matrix factorsm was then validated by dynamic loading by comparing the time–displacement curve, as shown in Figure 11. The difference in maximum displacement is 7.26%, which can be considered a satisfying result, rendering the model accurate.
The computation time for these elements subjected to a 4 s dynamical non-linear analysis could be reduced by replacing the 3D model of seven elements with the 2D one-element model, from 44 s to 22 s (measured manually)—a reduction of 50%. This not only saves computation time but also the space (memory) required for analysis and results. The reduction of required RAM can increase the performance of calculations for models of growing size by far more than 50%. Sometimes this can even be necessary to be able to carry out an analysis because a larger model might be too resource-demanding for calculations to be possible on a regular workstation (computer).
Setting up an experimental test is very time consuming and expensive. Using numerical models that are simplified and validated enables studies of different configurations or much more complex structures and scenarios while reducing the time and costs needed to perform these tasks. Numerical calculations also enable simulations to be executed in parallel on many workstations, so different setups and parameters can be analyzed simultaneously, allowing for a much larger scope. This is a great advantage over experimental tests.
3.4. Requirements and Limitations for Migration into a Full 3D Model
The process of designing a numerical model that will allow for a full 3D simulation requires proper real-world testing that will provide sufficient data for the model in all three dimensions and also the behavior of the model under all possible internal forces. For this, the response under excitation or load in three directions is needed as well as the force–displacement relationship under twisting forces. As for the presented model, it was only possible to verify behavior in the plane of the tested element, as that was the only plane of the test specimen which was subjected to experimental loads and displacement measurements (recording). Therefore, this numerical model is limited to providing reliable results for loads (forces) acting in this plane, and any results with loads acting outside of this plane cannot be considered reliable.
4. Concluding Remarks
As can be seen from the presented analysis, the transition from an experimental setup into a numerical simulation for a small model is not difficult, but requires the right approach and validation of the model, preferably with an experiment. In addition, simplifications should be made based on similar experimental models when there is a need to shorten the FEM calculation times, especially in extensive dynamic analyses including earthquakes. To obtain shorter calculation times, it is advisable to use simplifications of complicated numerical models after comparing the results obtained from the main and simplified models so that the compliance is relatively high. Saving time on numerical calculations creates greater opportunities in the field of advanced analysis, such as designing earthquake-resistant objects or conducting advanced nonlinear numerical analyses.
The possibilities for simplifying numerical models in general, put forward by the authors, led to shorter calculation times, which may have a number of advantages in advanced numerical analyses. An undoubted advantage will be the possibility of carrying out several analyses in the time it would take to conduct one with an unsimplified model. This creates an additional opportunity for modifications and improvements in the model during analyses, as well as multiplying its edition. A model generated in this way can undergo more different analyses at the same time, which significantly increases its experimental value. Furthermore, the numerical load can then be handled by less-advanced workstations.
However, it should be noted that a slight inaccuracy between numerical models—as presented in Figure 11—is acceptable if the model is validated and the numerical calculations are subsequently shortened. This analysis considers wood a non-homogenous and non-isotropic material and OSB sheathing falls into the same category. So, the typical differences in such materials alone would require a statistical consideration under academic conditions, but the aim of this paper is to present a possible means for the qualitative estimation of elements on a larger scale in a numerical investigation. In the future, the authors plan to carry out experimental research on a full wall with real dimensions and provide its numerical validation.
Author Contributions
Conceptualization, M.S. and W.M.; methodology, M.S. and W.M.; software, M.S. and W.M.; validation, M.S.; formal analysis, M.S. and W.M.; resources, M.S.; writing—original draft preparation, M.S. and W.M.; writing—review, and editing, M.S.; supervision, W.M. All authors have read and agreed to the published version of the manuscript.
Funding
This research received no external funding.
Conflicts of Interest
The authors declare no conflicts of interest.
References
- Bobra, P.; Marynowicz, A.; Zembaty, Z. Badania drewnianej konstrukcji ramowej na stole wstrząsowym. Inżynieria Bud. 2012, 8, 440–443. (In Polish) [Google Scholar]
- Kasal, B.; Heiduschke, A.; Haller, P. Analysis of wood-composite laminated frames under dynamic loads—Analytical models and model validation. Part I: Connection Model. Prog. Struct. Eng. Mater. 2006, 8, 103–110. [Google Scholar]
- Kasal, B.; Polocoser, T.; Guindos, P.; Urushadze, S.; Pospisil, S.; Heiduschke, A.; Ruther, N.; Zembaty, Z. High performance composite-reinforced earthquake resistant buildings with self-aligning capabilities. Geotech. Geol. Earthq. Eng. 2015, 35, 359–372. [Google Scholar]
- Szczepański, M.; Migda, W.; Jankowski, R. Construction technology of timber-frame houses resistant to dynamic loads—Study on models of exterior walls. Adv. Sci. Technol. Res. J. 2015, 9, 75–80. [Google Scholar] [CrossRef] [Green Version]
- Szczepański, M.; Migda, W.; Jankowski, R. Experimental study on dynamics of wooden house wall panels with different thermal isolation. Appl. Sci. 2019, 2, 1–16. [Google Scholar] [CrossRef] [Green Version]
- Liang, H.; Wen, Y.-K.; Foliente, G.C. Damage modeling and damage limit state criterion for wood-frame buildings subjected to seismic loads. J. Struct. Eng. 2011, 137, 41–48. [Google Scholar] [CrossRef]
- Kim, D.H.; Moon, D.Y.; Kim, M.K.; Zi, G.; Roh, H. Experimental test and seismic performance of partial precast concrete segmental bridge column with cast-in-place base. Eng. Struct. 2015, 100, 178–188. [Google Scholar] [CrossRef]
- Donovan, T.; Memari, M. Feasibility study of determination of seismic performance factors for structural insulated panels. J. Archit. Eng. 2015, 21, 1–9. [Google Scholar] [CrossRef]
- Toratti, T. Seismic Design of Timber Structures; FEMA: Espoo, Finland, 1994. [Google Scholar]
- Dujic, B.; Zarnic, R. Study of lateral resistance of massive X-lam wooden wall system subjected to horizontal loads. In International Workshop on Earthquake Engineering on Timber Structures; University of Coimbra: Coimbra, Portugal, 2006; pp. 97–104. [Google Scholar]
- Toratti, T. Design guidance on Eurocode 8 for practicing engineers for timber structures. In International Workshop on Earthquake Engineering on Timber Structures; University of Coimbra: Coimbra, Portugal, 2006; pp. 55–70. [Google Scholar]
- Fournely, E.; Lamadon, T. Design detailing for earthquake engineering application for timber structures. In International Workshop on Earthquake Engineering on Timber Structures; University of Coimbra: Coimbra, Portugal, 2006; pp. 71–80. [Google Scholar]
- Varoglu, E.; Karacabeyli, E.; Stiemer, S.; Ni, C.; Buitelaar, M.; Lungu, D. Midply wood shear wall system: Performance in Dynamic Testing. J. Struct. Eng. 2007, 133, 1035–1042. [Google Scholar] [CrossRef]
- Yamaguchi, N.; Minowa, C.; Miyamura, M. Seismic performance of wooden shear walls on dynamic condition. In Proceedings of the 12th World Conference on Earthquake Engineering, Auckland, New Zeland, 30 January 2000; pp. 1–8. [Google Scholar]
- Meirovitch, L. Fundamentals of Vibrations; Virginia Politechnic Institute and State University: New York, NY, USA, 2001.
- Koshiharo, M.; Isoda, H.; Yusa, S. The design and installation of a five-story new timber building in Japan. In Proceedings of the Summaries of Technical Papers of Annual Meeting Japan Society for Finishings Technology, Tokio, Japan, 21 December 2005; pp. 1–11. [Google Scholar]
- White, K.B.D.; Miller, T.H.; Gupta, R. Seismic performance testing of partially and fully anchored wood-frame shear walls. Wood Fiber Sci. 2009, 41, 396–413. [Google Scholar]
- Vessby, J. Analysis of Shear Walls for Multi-Storey Timber Buildings. PhD thesis, Linnaeus University, Växjö, Sweden, 2011. [Google Scholar]
- Echavarría, C.; Salenikovich, A. Analytical model for predicting brittle failures of bolted timber joints. Mater. Struct. 2009, 42, 867–875. [Google Scholar] [CrossRef]
- González Fueyo, J.L.; Dominguez, M.; Cabezas, J.A.; Rubio, M.P. Design of connections with metal dowel-type fasteners in double shear. Mater. Struct. 2009, 42, 385–397. [Google Scholar] [CrossRef]
- Germano, F.; Metelli, G.; Giuriani, E. Experimental results on the role of sheathing-to-frame and base connections of a European timber framed shear wall. Constr. Build. Mater. 2015, 80, 315–328. [Google Scholar] [CrossRef]
- Gattesco, N.; Boem, I. Seismic performances and behavior factor of post-and-beam timber buildings braced with nailed shear walls. Eng. Struct. 2015, 100, 674–685. [Google Scholar] [CrossRef]
- Miller, J.F.; Schmidt, R.J.; Bulleit, W.M. New yield model for wood dowel connections. J. Struct. Eng. 2010, 136, 1255–1261. [Google Scholar] [CrossRef]
- Heiduschke, A.; Kasal, B.; Haller, P. Shake table tests of small-and full-scale laminated timber frames with moment connections. Bull. Earthq. Eng. 2009, 7, 323–339. [Google Scholar] [CrossRef]
- Villaverde, R.; Pardoen, G.C.; Carnalla, S. Ground motion amplification at flange level of bushings mounted on electric substation transformers. Earthq. Eng. Struct. Dyn. 2001, 30, 621–632. [Google Scholar] [CrossRef]
- Jameel, M.; Islam, A.B.M.S.; Hussain, R.R.; Hasan, S.D.; Khaleel, M. Non-linear FEM analysis of seismic induced pounding between neighbouring multi-storey structures. Lat. Am. J. Solids Struct. 2013, 10, 921–939. [Google Scholar] [CrossRef] [Green Version]
- Szczepański, M.; Migda, W.; Jankowski, R. Modal analysis of real timber frame houses with different insulation materials. Adv. Sci. Technol. Res. J. 2016, 10, 215–221. [Google Scholar] [CrossRef] [Green Version]
- Szczepański, M.; Migda, W.; Jankowski, R. Increasing the seismic resistance of wood-frame buildings by applying PU foam as thermal insulation. Period. Polytech. Civ. Eng. 2019, 63, 480–488. [Google Scholar]
- Filiatrault, A.; Christovasilis, I.P.; Wanitkorkul, A.; Wan de Lindt, J.W. Experimental seismic response of a full-scale light-frame wood building. J. Struct. Eng. 2010, 136, 246–254. [Google Scholar] [CrossRef]
- Dlubal RFEM—FEM Structural Analysis Software. Available online: https://www.dlubal.com/ (accessed on 4 May 2020).
Figure 1.
View of the test stand and the research element.

Figure 2.
View of the test stand, research element, and sensor locations.

Figure 3.
Technical drawing of the specimen.

Figure 4.
FEM model with the placement of force and linear supports.

Figure 5.
FEM model of the timber frame with all its materials, corresponding elements, and node supports (a) PU foam, shell elements, (b) OSB sheathing, shell elements, (c) wooden frame, shell elements.
Figure 5.
FEM model of the timber frame with all its materials, corresponding elements, and node supports (a) PU foam, shell elements, (b) OSB sheathing, shell elements, (c) wooden frame, shell elements.

Figure 6.
Comparison of static loading in experimental and numerical simulation.

Figure 7.
Comparison of dynamic loading in experimental and numerical simulation.

Figure 8.
Simplified shell 2D model.

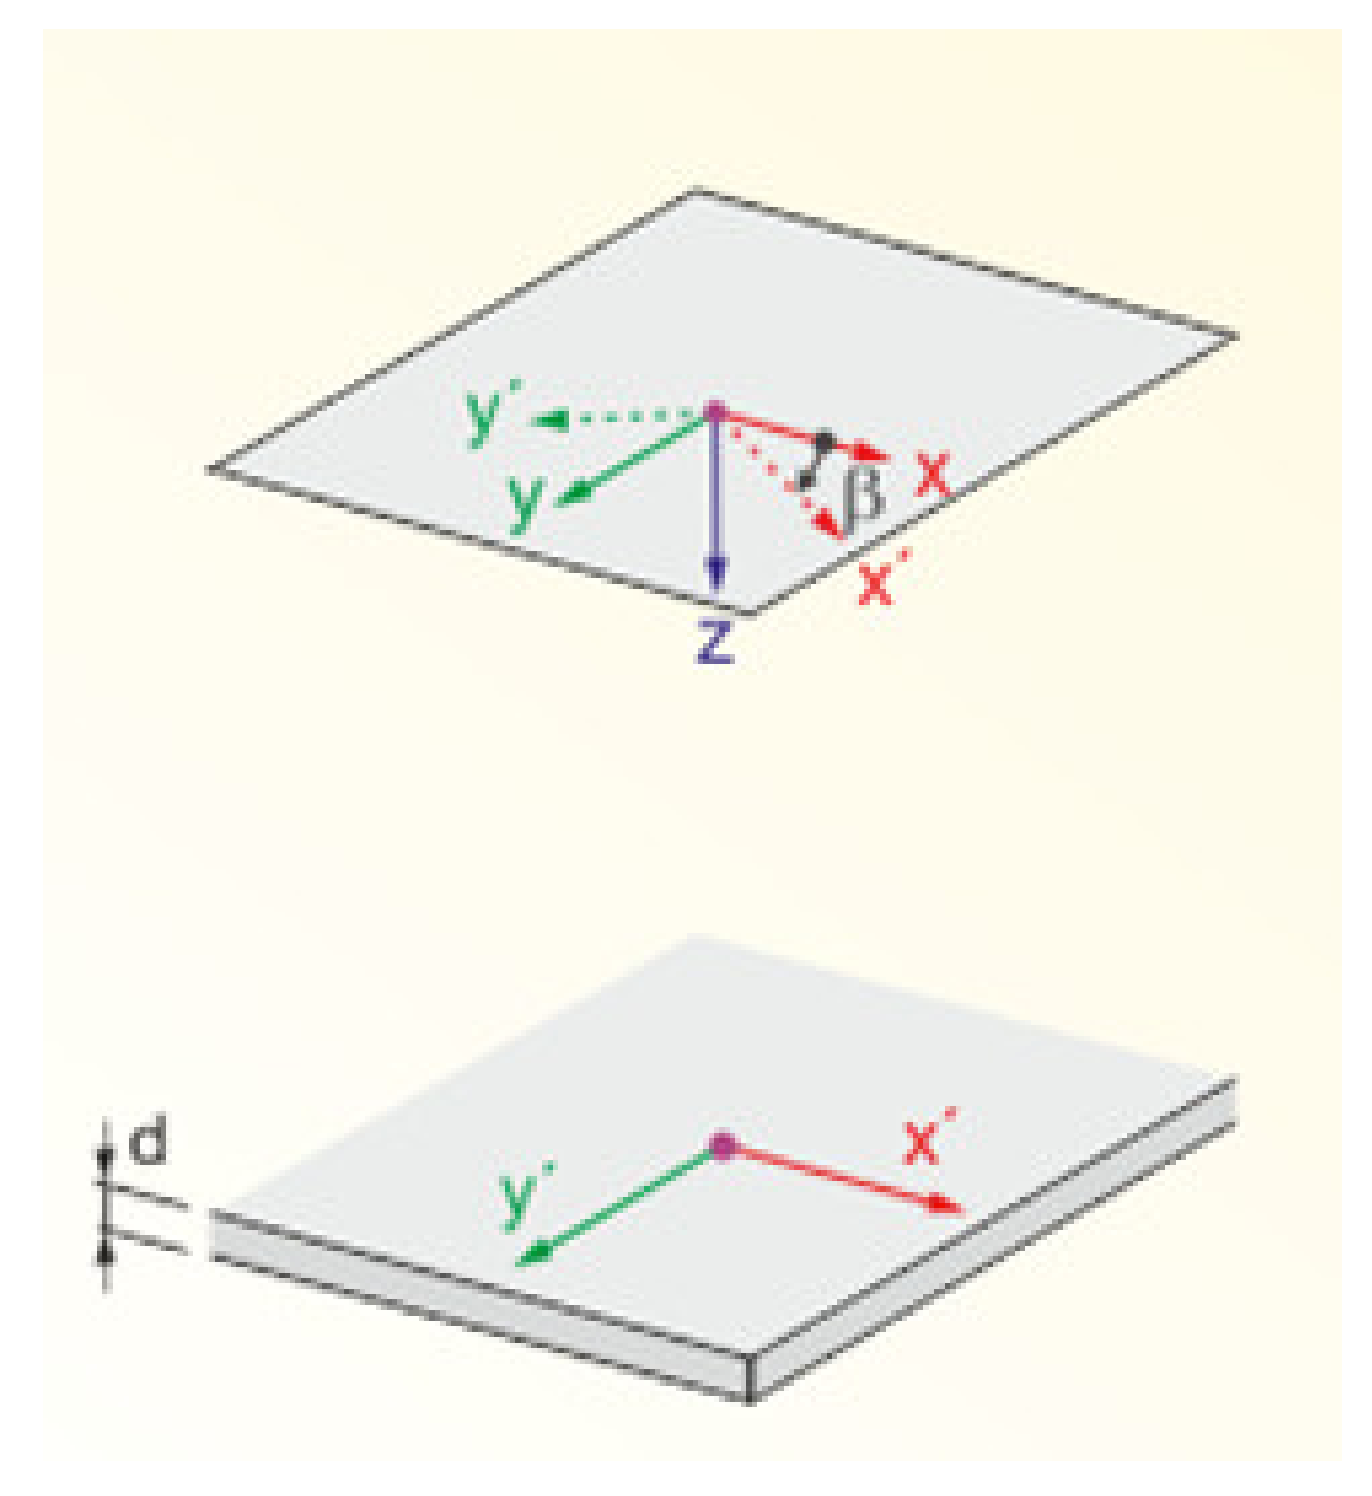
Figure 9.
Stiffness matrix for 2D shell element-orthotropy direction.

Figure 10.
Displacement under static loading for (a) 3D shell model and (b) simplified shell (2D model).
Figure 10.
Displacement under static loading for (a) 3D shell model and (b) simplified shell (2D model).

Figure 11.
Displacement under dynamic loading for 3D shell model and simplified shell (2D model).


Table 1.
Material properties used in the numerical study.
| Element | Material | Density (kg/m3) | Elasticity Modulus (GPa) | Material Model |
|---|---|---|---|---|
| Timber frame | Wood of class C27 | 500.0 | 11.5—along fibers 0.72—across fibers | Orthotropic linear elastic 2D |
| Sheathing | OSB | 700.0 | 11.50—along fibers 0.65—across fibers | Orthotropic linear elastic 2D |
| Insulation | PU foam | 0.35 | 0.35 | Isotropic linear elastic 2D |
Table 2.
Values of stiffness multiplication factors.
| For all Stiffness Elements [-] | For Bending and Torsional Stiffness Elements [-] | For Torsional Stiffness Elements [-] | For Shear Stiffness Elements [-] | For Membrane Stiffness Elements [-] | For Eccentric Stiffness Elements [-] |
|---|---|---|---|---|---|
| 2.45 | 313.00 | 40.00 | 37.57 | 7.79 | 20.00 |
© 2020 by the authors. Licensee MDPI, Basel, Switzerland. This article is an open access article distributed under the terms and conditions of the Creative Commons Attribution (CC BY) license (http://creativecommons.org/licenses/by/4.0/).
Share and Cite
MDPI and ACS Style
Szczepański, M.; Migda, W. Analysis of Validation and Simplification of Timber-Frame Structure Design Stage with PU-Foam Insulation. Sustainability 2020, 12, 5990. https://0-doi-org.brum.beds.ac.uk/10.3390/su12155990
AMA Style
Szczepański M, Migda W. Analysis of Validation and Simplification of Timber-Frame Structure Design Stage with PU-Foam Insulation. Sustainability. 2020; 12(15):5990. https://0-doi-org.brum.beds.ac.uk/10.3390/su12155990
Chicago/Turabian StyleSzczepański, Marcin, and Wojciech Migda. 2020. "Analysis of Validation and Simplification of Timber-Frame Structure Design Stage with PU-Foam Insulation" Sustainability 12, no. 15: 5990. https://0-doi-org.brum.beds.ac.uk/10.3390/su12155990
Note that from the first issue of 2016, this journal uses article numbers instead of page numbers. See further details here.