Temperature Reduction Effects of Rooftop Garden Arrangements: A Case Study of Seoul National University


1
Department of Landscape Architecture and Rural Systems Engineering, Seoul National University, Seoul 08826, Korea
2
Research Institute of Agriculture and Life Sciences, Seoul National University, Seoul 08826, Korea
3
Interdisciplinary Program in Landscape Architecture, Seoul National University, Seoul 08826, Korea
4
Interdisciplinary Program in Urban Design, Seoul National University, Seoul 08826, Korea
*
Author to whom correspondence should be addressed.
Sustainability 2020, 12(15), 6032; https://0-doi-org.brum.beds.ac.uk/10.3390/su12156032
Submission received: 14 July 2020
/
Revised: 14 July 2020
/
Accepted: 23 July 2020
/
Published: 27 July 2020
(This article belongs to the Special Issue Development of Green Infrastructure Design for Sustainable Social-Ecological System)
Abstract
:Increasing urbanization has highlighted the need for more green spaces in built-up areas, with considerable attention of vertical installations such as green walls and rooftop gardens. This study hypothesizes that the rooftop-garden-induced temperature reduction effects vary depending on the type of arrangements. Therefore, the objective of this study is to find the most efficient arrangement of the roof gardens for temperature reduction. This paper presents the results of a quantitative analysis of the temperature reduction effect of rooftop gardens installed on structures and sites on the campus of Seoul National University. An ENVI-Met simulation is utilized to analyze the effects of roads, buildings, green areas, and vacant land on temperature and humidity. The effects of the following five rooftop garden configurations were compared: extreme, linear (longitudinal), linear (transverse), checkerboard, and unrealized rooftop gardens. The extreme and linear (longitudinal) gardens achieved the maximum temperature reduction, −0.3 °C, while the lowest maximum reduction of −0.2 °C was achieved by the checkerboard pattern. Over larger areas, the greatest impact has been recorded in the mornings rather than in the afternoons. The results of this study will be useful for those planning and installing rooftop gardens at the district and city levels.
1. Introduction
1.1. Background
The rapid growth in industrial and urban development has led to ongoing indiscriminate urbanization in countries around the world, creating serious environmental problems, the destruction of forests, and extreme air pollution [1,2,3]. Above all, global warming is becoming critical. Between 1880 and 2018, the temperature of the Earth’s surface increased by around 0.9 °C [1]. The resulting rise in global sea levels and the destruction of ecosystems that are unable to withstand these rising temperatures will have a major impact on everyday life for billions of people [2,3]. By the end of this century, the average temperature on Earth could rise by anything between 1.1 °C to 6.4 °C according to an intergovernmental panel on climate change and the global average sea-level rise is forecast to be somewhere between 0.4 m and 0.77 m, with every 0.1 m rise in global sea level directly affecting up to 10 million people [2,3,4]. Our growing awareness of this impending crisis is driving many researchers to seek new ways to tackle global warming, including developing alternative energy sources to reduce greenhouse gas emissions and new approaches that reduce energy consumption levels [3,4,5]. This is particularly important in densely populated built-up areas such as cities, where environmental problems are most obvious [3,4]. Mitigating the heat island effect caused by artificial heat emissions in urban areas could, thus, make a significant contribution; integrating garden areas such as parks and street water features into urban environments could not only improve the standard of living of inhabitants but also substantially reduce the impact of the city on global warming [4]. However, in the case of the Seoul Metropolitan Government area, only about 34.9% of the surface area is currently devoted to gardens and parks [5,6]. In other words, it is necessary to create a new type of green space that can replace buildings and roads [7].
1.2. Purpose of This Study
One approach that is gaining widespread support is the afforestation of vertical space, with gardens and vegetation no longer being limited to ground level installations [4]. By way of illustration, options for integrating garden space into buildings and other man-made structures could be green walls and roof gardens [8]. Unfortunately, green walls tend to be very sensitive to local environmental conditions, limiting the kinds of plants that can be used and only certain types of structures are suitable for wall afforestation [9]. Rooftop gardens are thus far more common than green walls, as they suffer from fewer restrictions [10]. So far, many studies have dealt with rooftop gardens. However, the impact of rooftop gardens on the entire city or a wide area was not clearly understood, mainly by analyzing only small-scale temperature reduction effects in one space [4,7,8,9,10,11]. The study began with the hypothesis that the effect of temperature reduction, in a wide range of areas, changes with the arrangements of rooftop gardens. Therefore, the purpose of this study is to learn how much the temperature reduction effect is depending on the arrangement of rooftop gardens in a large area. This study conducted a quantitative analysis of the temperature reduction effects of rooftop gardens on both the structures hosting them and the surrounding area. ENVI-Met, a climate simulation software [11], was adopted to derive optimal plans that maximize the temperature reduction effects achieved by each type of rooftop gardens.
2. Literature Review
In a recent study [11], a green area policy proposal was made for future improvement of Taiwan’s heat environment by using the ENVI-met program. It suggests that if the green area is increased to more than 60%, the thermal environment can be improved. When the ratio of increasing green area was fixed at 60%, there was a temperature reduction effect of at least −0.44 °C, up to −2.0 °C, depending on the installation rate of the permeable pavement. The last prior research identifies the effect of urban form and specific building functions on the thermal environment [12]. This study suggests that the optimal size, height, and layout of buildings were presented in different ways. Therefore, a single index is insufficient to measure the direct relationship between the urban form and the thermal environment.
Roof gardens, which can be installed on existing residential, commercial, and industrial buildings [13], provide the following three main types of benefits: (1) environmentally, (2) socially, and (3) economically [13,14,15,16,17,18,19,20,21,22,23,24,25,26,27,28,29,30,31,32,33,34,35,36]. Their environmental effects go beyond simply reducing surface temperatures: the plants absorb carbon dioxide and hence help to mitigate the urban heat island effect. Besides, they often support the creation of garden spaces to help maintain a more diverse and resilient biological ecosystem [14,15]. It has been documented that a 10-cm-deep soil layer can absorb 20–30 L of rainwater in each m2, reducing the pressure on urban storm drains and helping to prevent flooding during extreme rainfall events [16]. Social effects include a more attractive urban environment that enhances inhabitants’ quality life and psychological stability [17]; on the roof of a building with a garden installed, a 20 cm layer of soil has been shown to reduce ambient noise levels by as much as 46dB [18]. The subsequent reduction in the amount of energy required to meet the building’s needs provides a further economic incentive to encourage greater rooftop afforestation [19]. Although these three classes of advantages are closely related to each other [4,20], this study focuses on the environmental effects, quantitatively analyzing the temperature-reduction effects of roof gardens.
Most of the research into the environmental impacts of roof gardens have focused on temperature reduction. For example, a year-long study tracking the environmental impacts (temperature/humidity/light) achieved by nine different types of flowers at building in Gyeonggi-do, Korea, reported that before the roof garden was installed, the highest figures are as follows; at the average atmospheric in July, at 34.4 °C, the average relative humidity was September, at 59.3%, and the illumination levels were in August, at 990,150 lux. All the flowers planted in the rooftop plots successfully reduced the temperature, with the greatest temperature reduction being achieved by the Blackberry Lily, Belamcanda chinensis, which was around 7.7 °C lower than that recorded on the comparison concrete plot [21]. Another study found that a temperature reduction of 5 °C could be achieved by the evaporation of soil moisture from bare soil, with no plant material presece [22]. In a more recent study, bare soil plots were found to heat up and cool down relatively rapidly compared to plots containing plants, probably because the plants had a higher heat conductivity than the soil [7]. This caused the temperature across the rooftop to vary by up to 2 °C. The humidity varied from about 2.6 to 3.1%, indicating that a rooftop garden can indeed absorb solar energy that would otherwise pass into the building below and thus reduce the load on the building’s air conditioning system.
Users’ psychological changes were compared and analyzed with the Profile of Mood States (POMS) and Semantic Differential Method (SDM) as they visited six different types of rooftop gardens [23,24]. In another study, bamboo forests, ponds, and city areas were randomly arranged in an arboretum. Study participants were asked to quietly appreciate the scenery in their assigned area for 10 min and then walk through either the natural environments or the urban area for 15 min [25]. Their physiological characteristics were measured before and after completing the task, revealing a statistically significant improvement in those walking through the natural areas compared to those assigned to the urban environment [25,26].
Several studies have analyzed the energy and economic savings achieved with the aid of different types of rooftop garden systems, with most utilizing the Life Cycle Cost for the analysis. Overall, a deep layer of sandy loam delivered the highest savings rate of heat energy, with reinforced insulation material a close second. An energy-saving rate of around 10% per unit area was achieved for soil depths of over 300 mm [27,28,29,30].
The software, which is used in this study, is a three-dimensional climate analysis program that quantifies the effects of environmental factors such as vegetation, buildings, and solar radiation [31,32,33]. Fur the more, the program can model the impact of gardens, fields, and building materials as well as taking into account the airflow between and around buildings, evaporation, and the heat exchange systems of surfaces [34,35]. ENVI-met has been used to analyze the urban thermal environment of the city of Songdo [36] and the campus of Konkuk University [37]. Both of these studies involved only a simple analysis.
3. Site Selection and Specifications
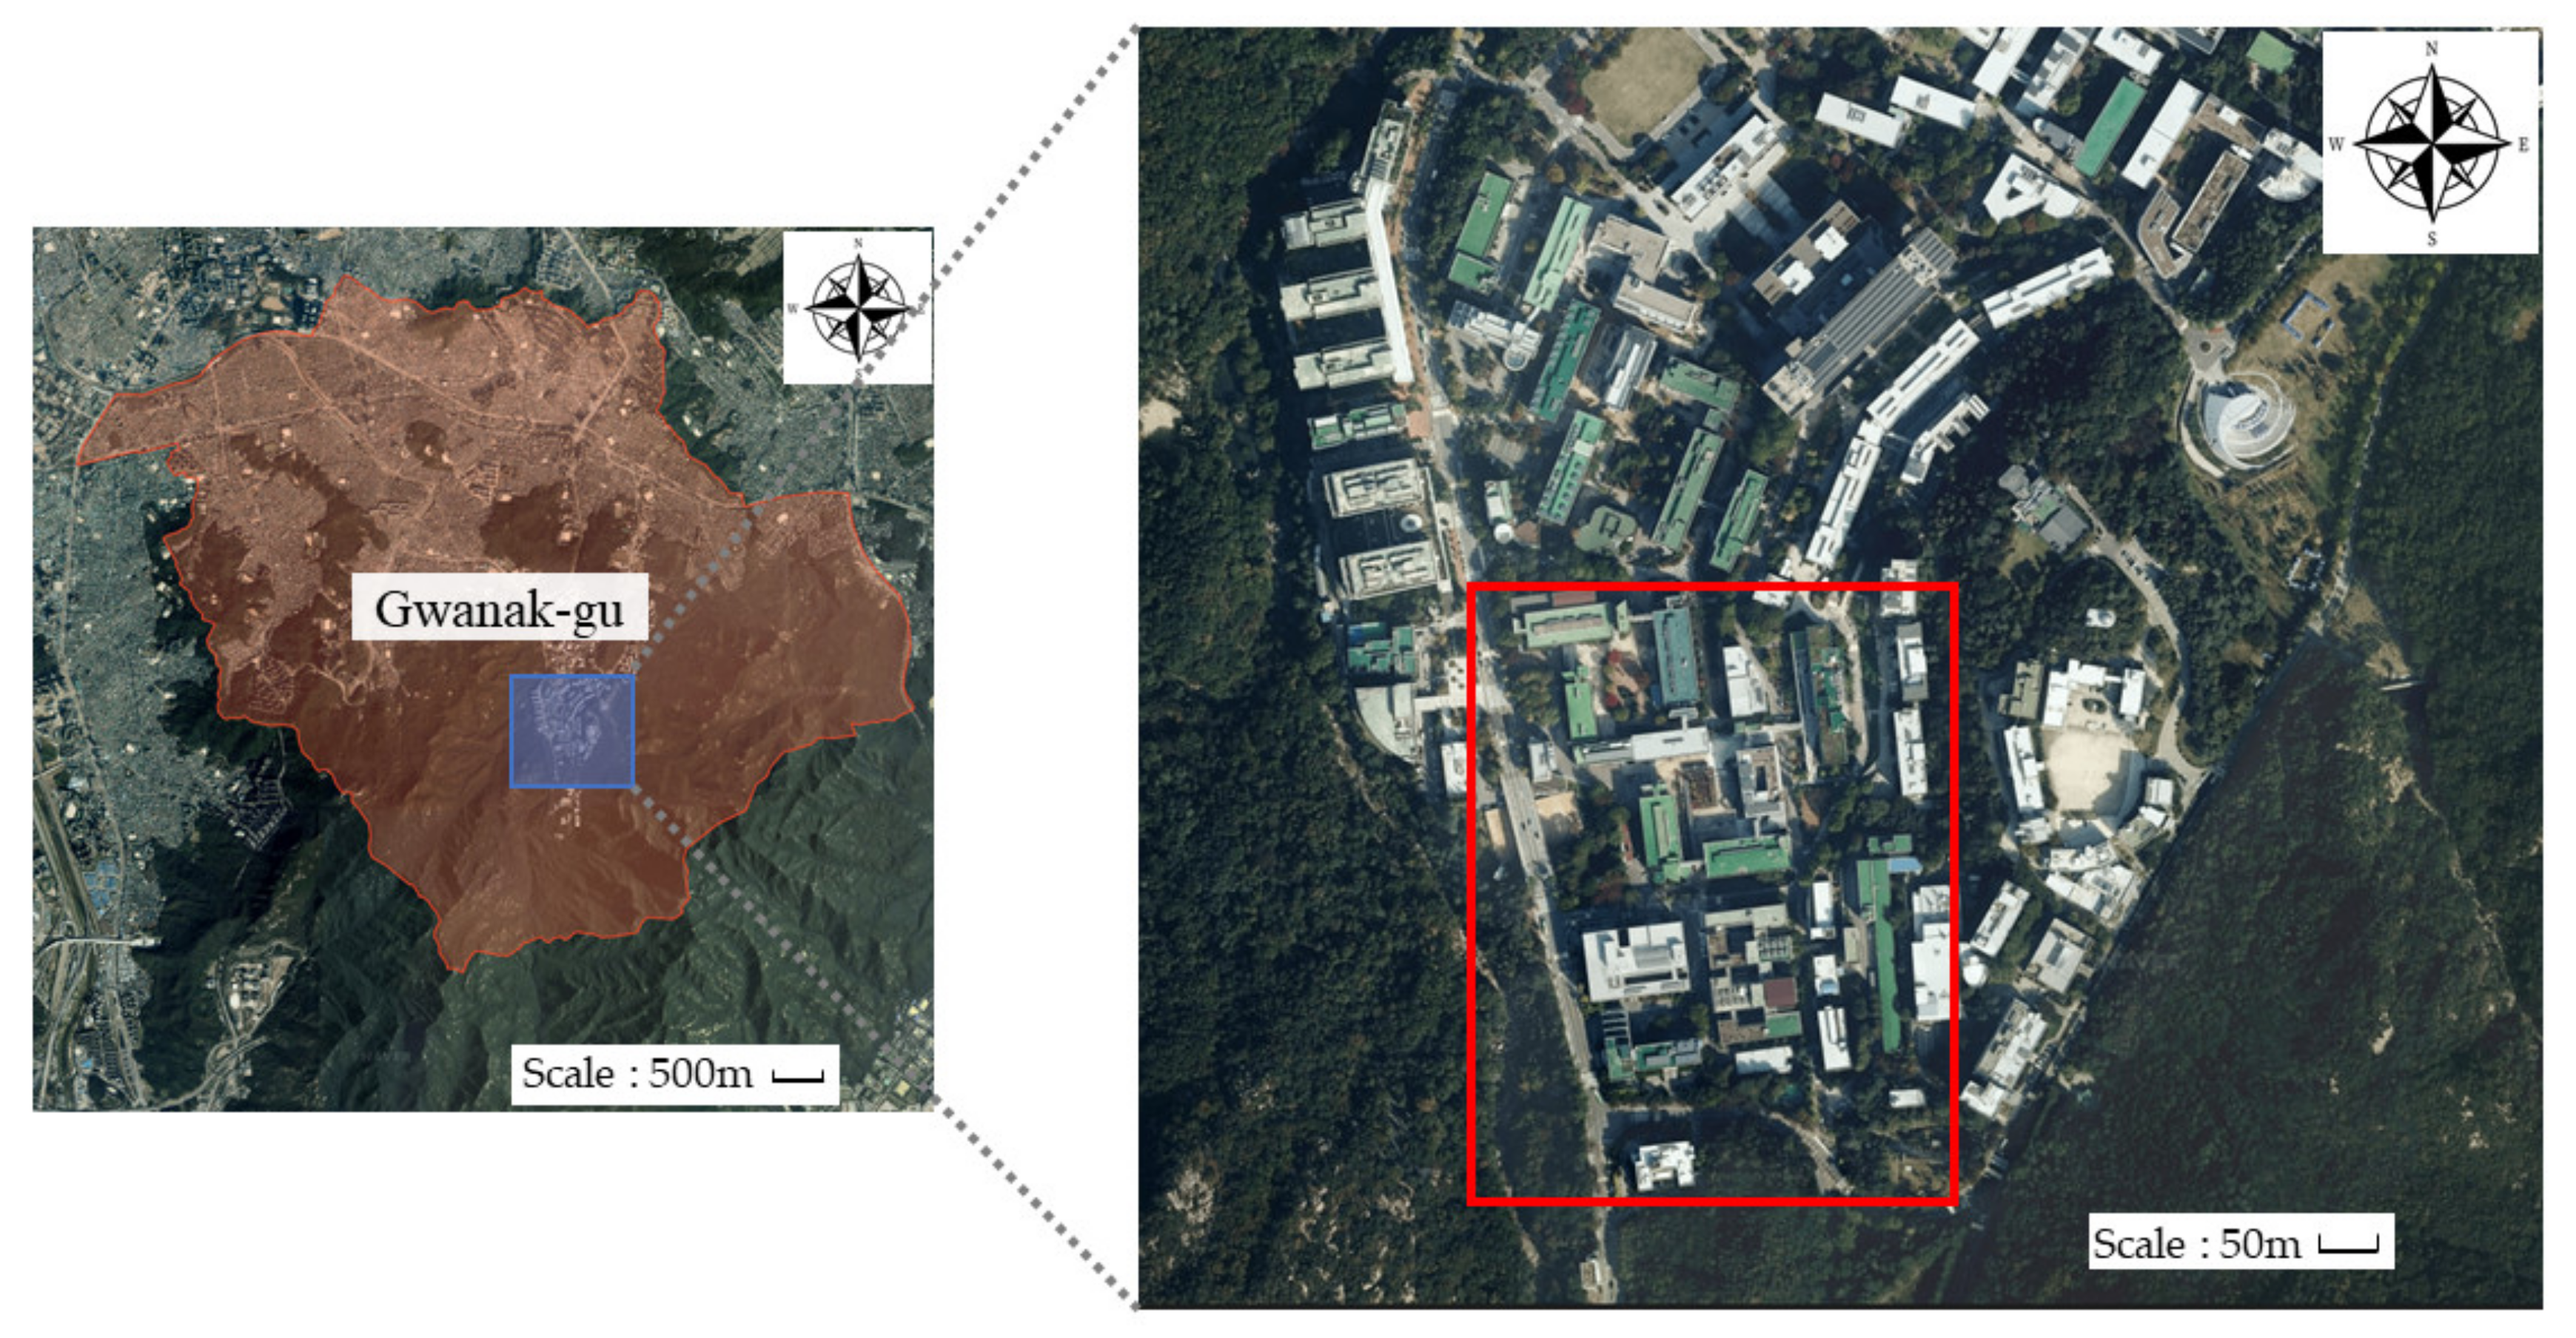
Two different sites were chosen for this study, both on the campus of Seoul National University in Gwanak-gu, Seoul. In addition to their proximity to the weather station on Mt. Gwanak, where the weather data was collected, their distinctly different characteristics provide a good test of the model. The reason for selecting the aforementioned sites is that two sites are easily accessible, and a lot of geographical information is provided from the Seoul Metropolitan Government and Seoul National University. The first site, Seoul National University Engineering college is a public facility, so all the rooftop entrances are open. Therefore, it is easy to measure the environmental data such as temperature and humidity of the site and to analyze the target site. In the case of Seoul National University Station, it is easy to obtain building information, sea level, height, land use, and soil conditions of site by using the three-dimensional spatial information system provided by the Seoul Metropolitan Government.
The first study site is an area around the Engineering College of Seoul National University located in the south of Gwanak-gu in Seoul (Figure 1). The campus is located in a mountainous area, with Mt. Cheongnyongsan to the north, Mt. Dolsan to the west, and Mt. Gwanak to the east. The lowest site at Seoul National University is 58.0 m above sea level, and the highest is 189.3 m. Within the first analysis site, the lowest altitude of the sea level is 114 m and the highest altitude is 140 m.
The slope of the highest and lowest points was 7.9%, and the total area of this site is 200,000 m2 (400 × 500 m). The site consists of university buildings, roads, and mountains, and 51% of the site was used as buildings. The number of buildings is 24 in total, and the buildings are partially connected through a passageway. The height of the tallest building is 28.8 m while that of the lowest one is 11.2 m. Accordingly, the average height of the buildings is 19.2 m. All buildings used for research or lecture purposes were of reinforced concrete type. The roads have occupied 19% of the site area, while the rest of the region specified to the green areas, gardens, and parking lots [38].
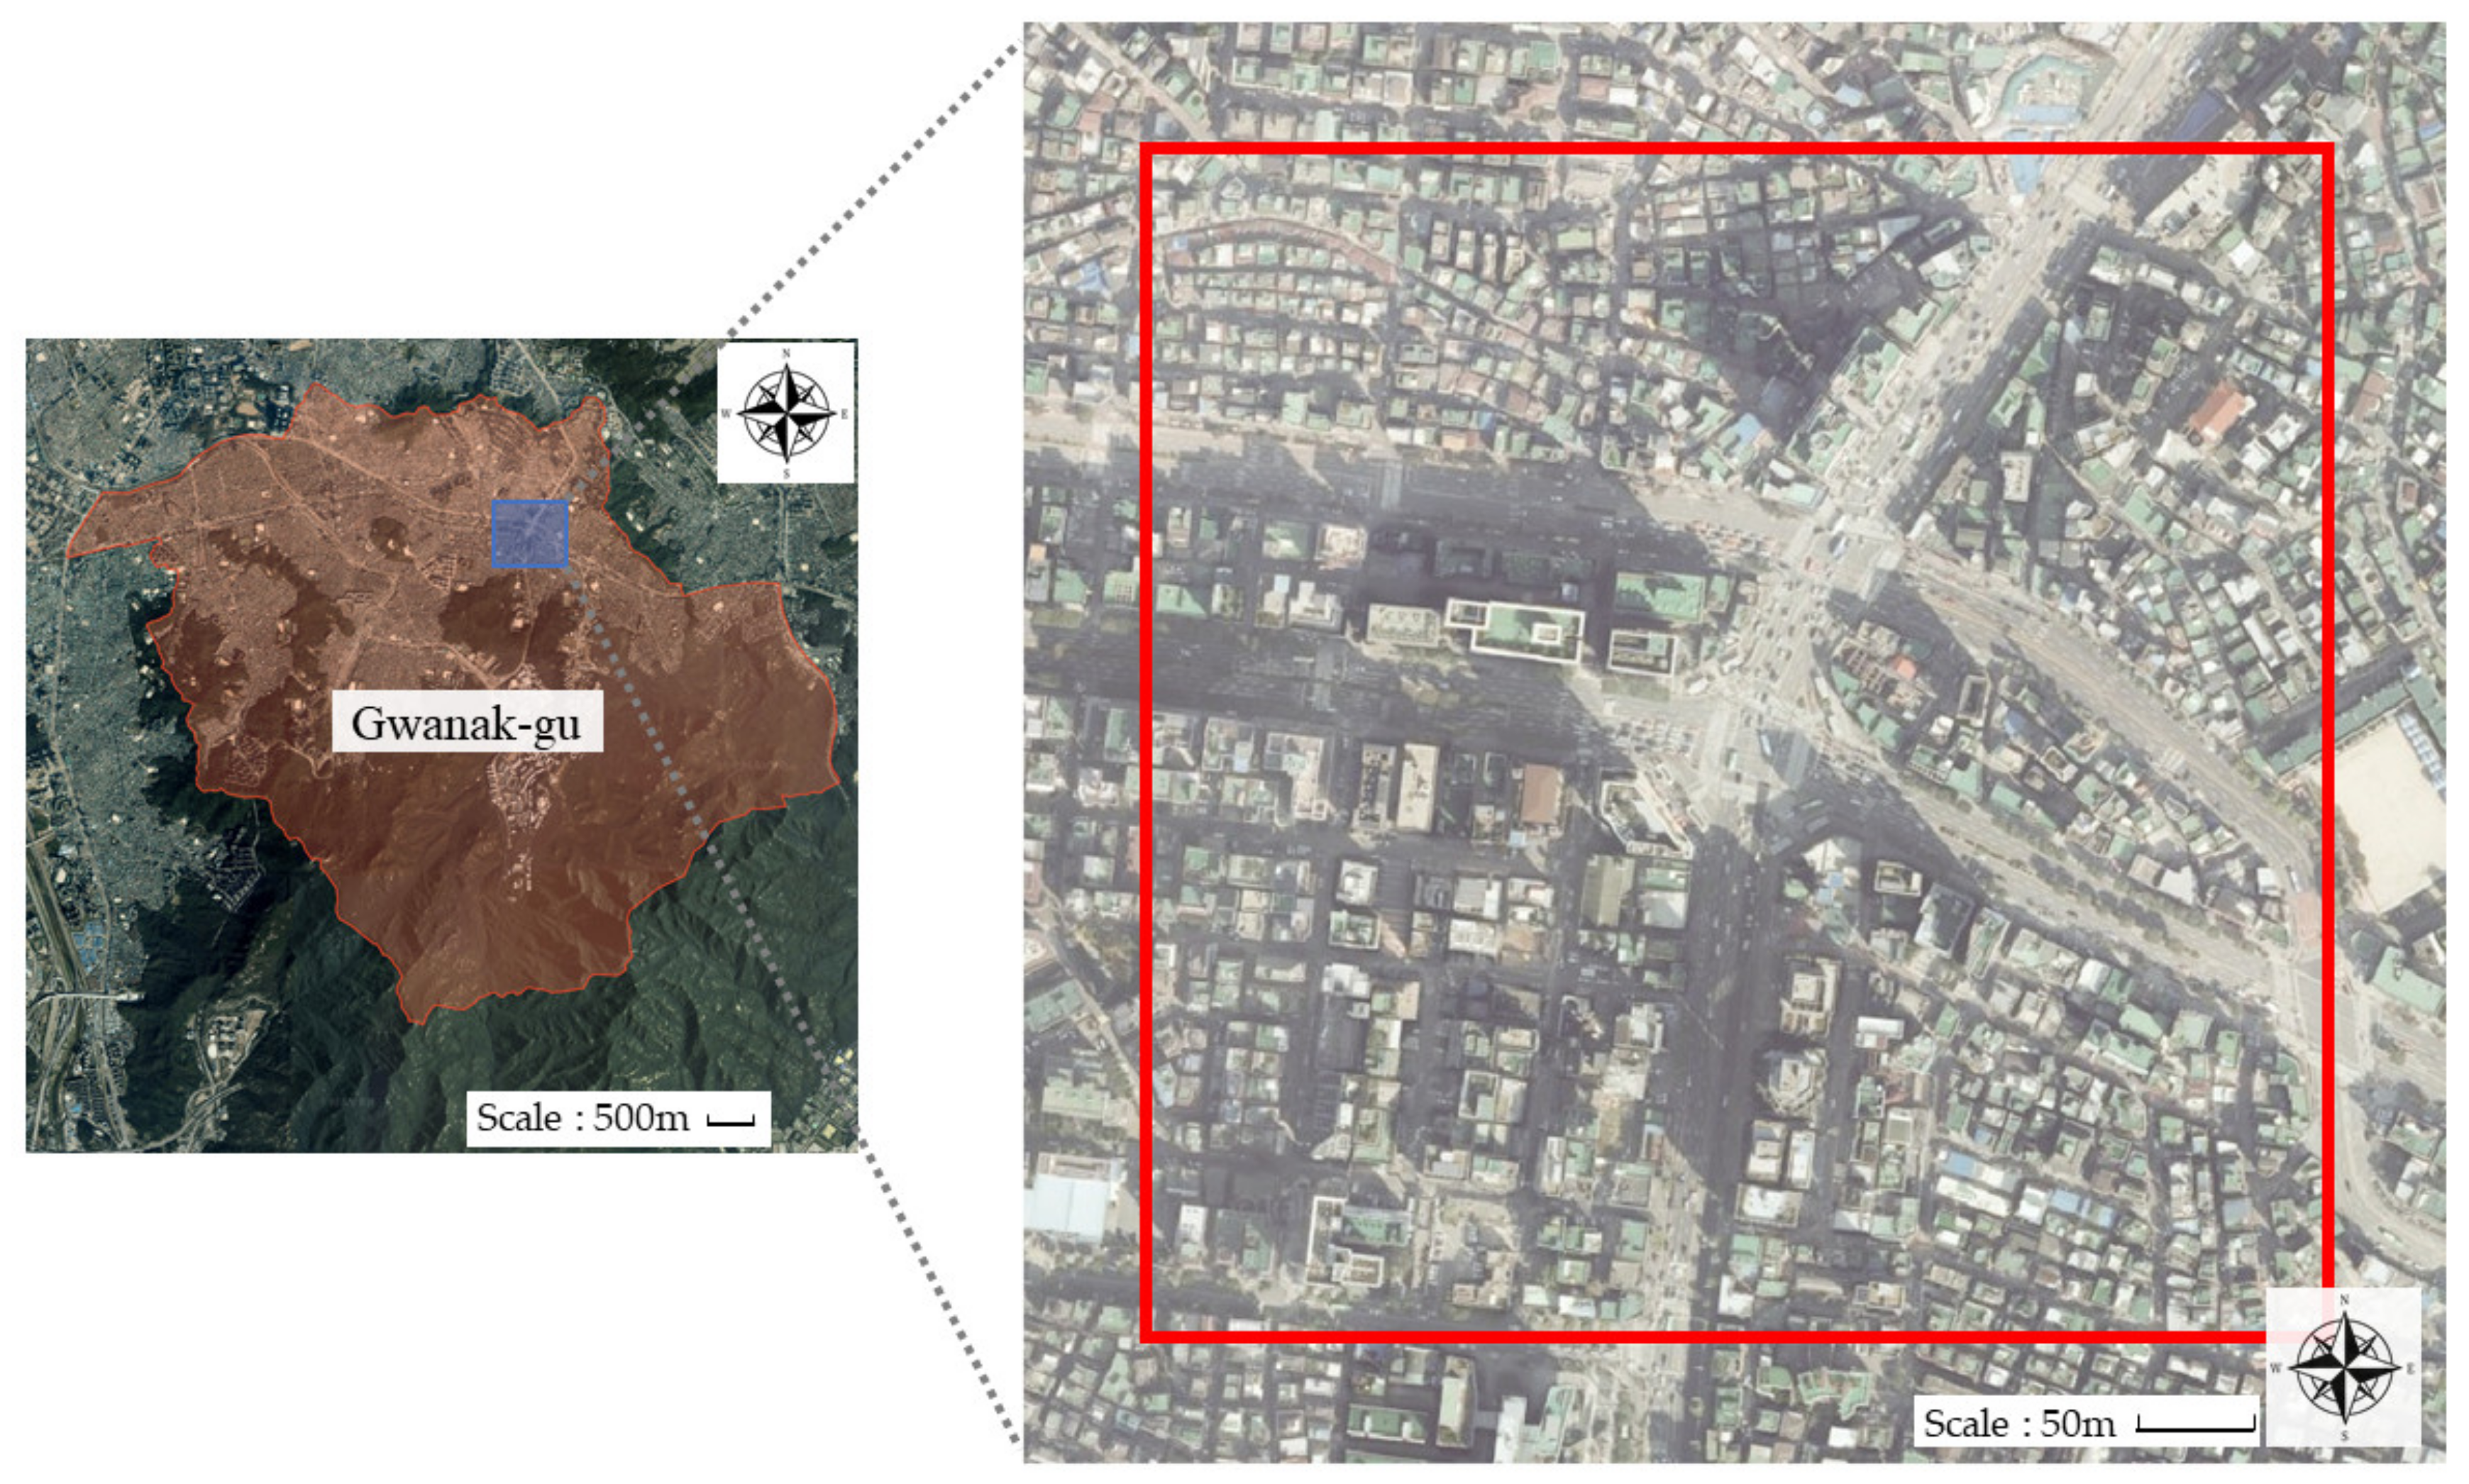
The second study site is an intersection at a Seoul National University Station in Gwanak-gu, Seoul Metropolitan Government (Figure 2). The Seoul National University station is located in Bongcheon-dong, the center of Gwanak-gu. The site area is 250,000 m2 (500 m × 500 m) and consists of 450 commercial buildings and 311 residential buildings. The second site consists of a total of 761 buildings. The lowest altitude in the site was 32.0 m, and the highest one was 38.7. The overall slope was less than 2% and 72% of areas were buildings, 21 of roads, and the rest of the area accounted for parks and parking lots. The tallest building has 73.9 m in height, while the shortest one acquired height of 6.5 m, and the average height of buildings is 28.2 m [38]. For this study, the analysis was conducted for the 24 h when Gwanak-gu experienced its highest temperature of the year, midnight to midnight, on 5 August 2019.
4. Methods of Design and Simulation
Once appropriate study sites had been selected, the local temperature, humidity, and wind speed data provided by the Korea Meteorological Administration were collected, and the target locations were modeled. Information on building heights from the National Geographic Information Institute’s spatial information portal was converted to a format compatible with ENVI-met using Rhino 6 and the Grasshopper and Dragonfly plug-ins [39]. The second step has been related to utilizing the information collected to conduct the simulation analysis. Finally, the new model was applied to develop an optimal design for rooftop gardens in the study areas.
4.1. Site Design and Data Analysis
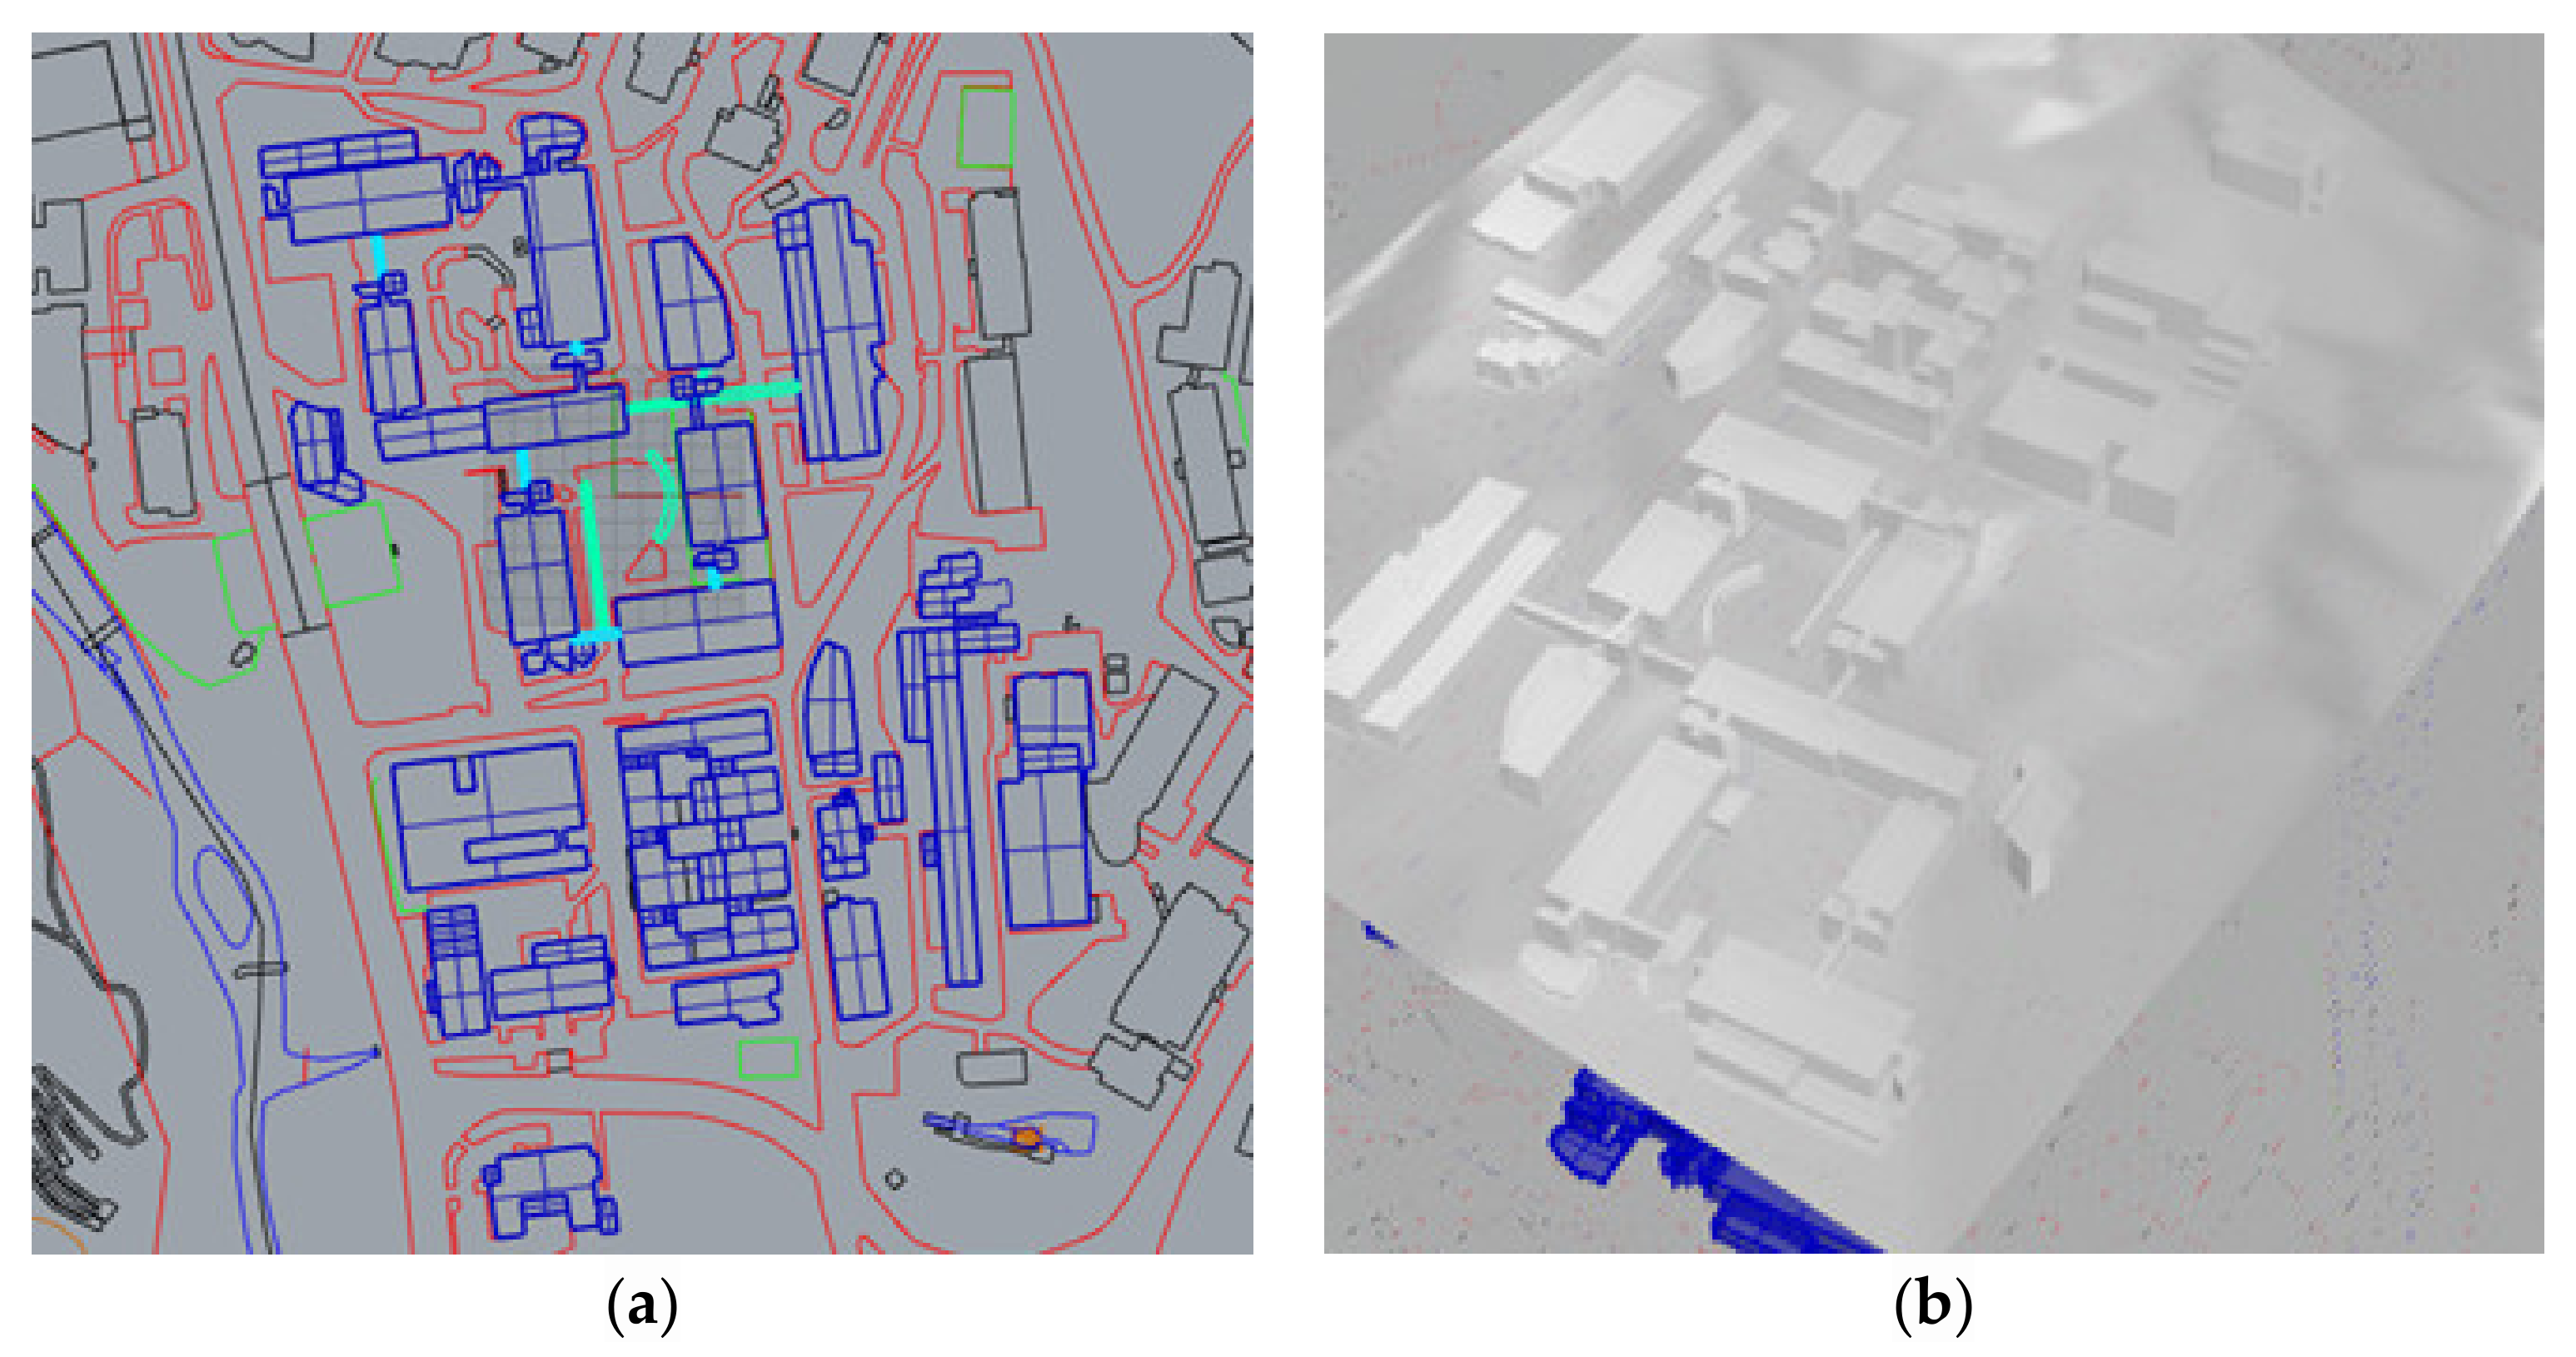
A polyline file provided by the National Geographic Information Institute was utilized for this research. Figure 3 shows the terrain and buildings depicted using the realistic modeling program Rhino 6. Two plug-in modules, Grasshopper and Dragonfly, were then used to convert the Rhino 6 data into a format suitable for ENVI-Met.
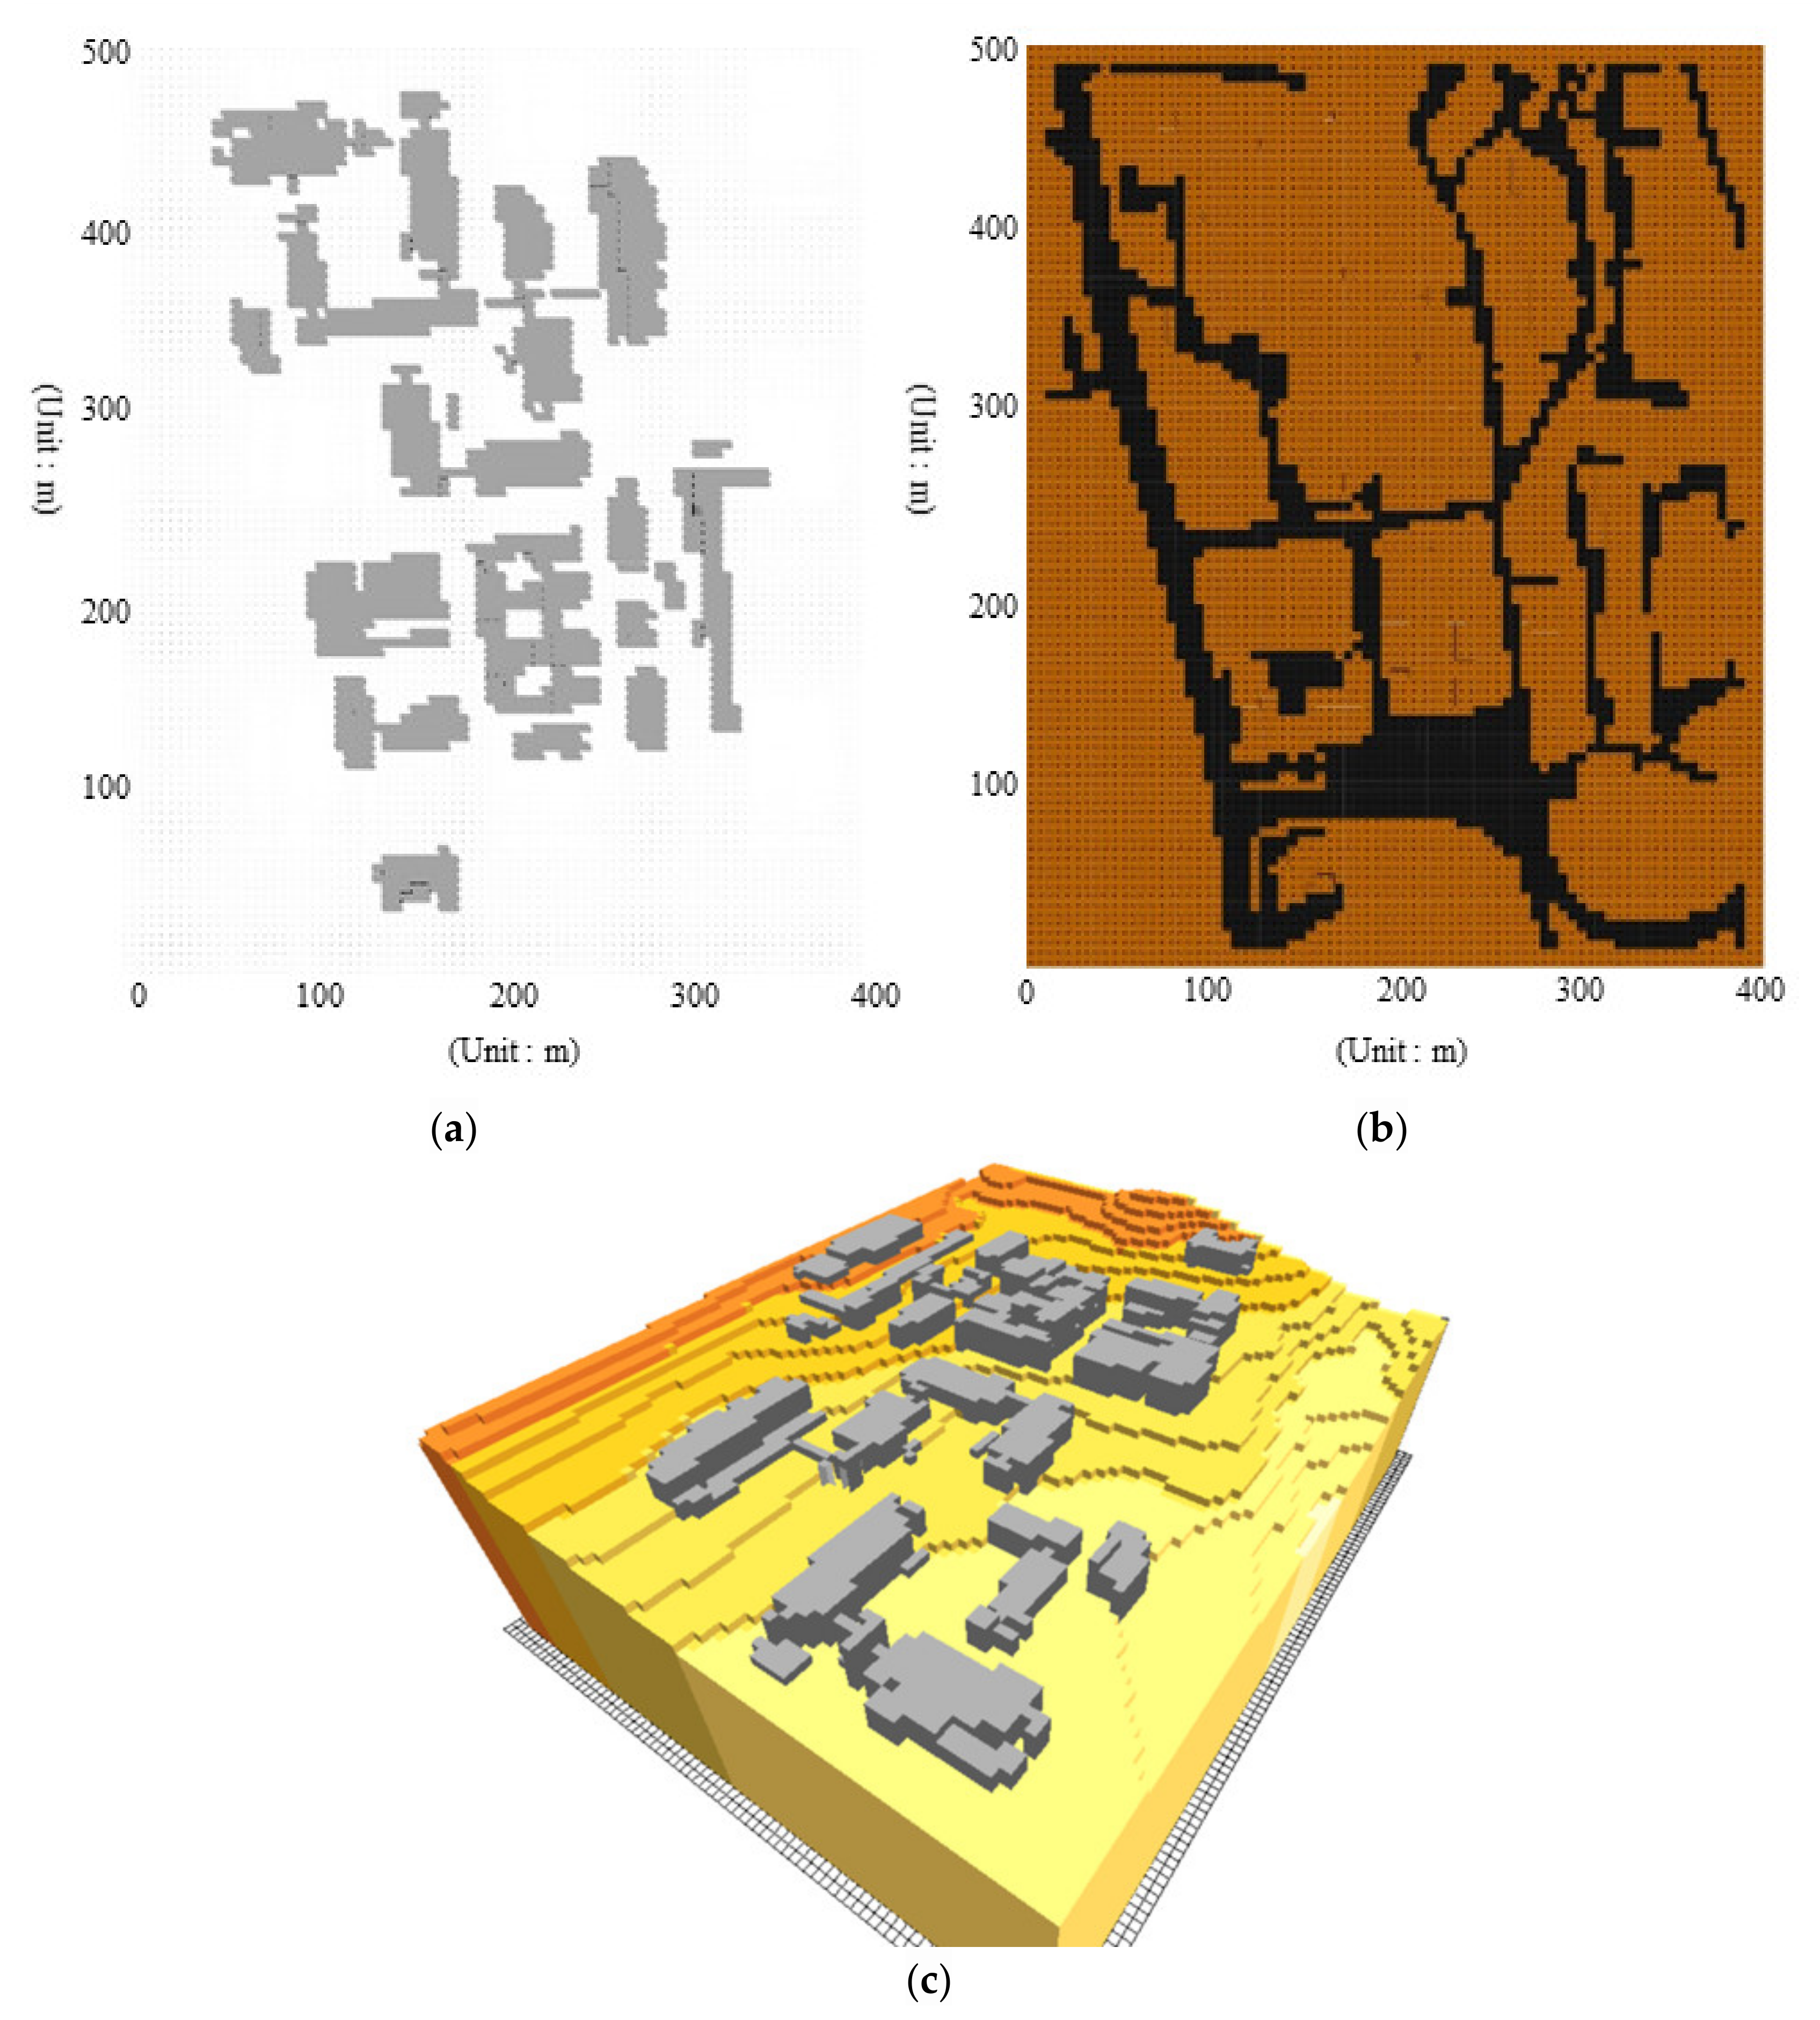
The modeling data were transferred to ENVI-Met Space using Grasshopper codes. ENVI-Met inputs include buildings, topography, soil, vegetation, and receptors. The materials of the building were set up as reinforced concrete, and asphalt was set for land pavement. GIS topography files were also used for modeling. The lattice spacing was 5 m along all three axes; the vertical analysis extended to a height of 300 m. The corresponding modeling data for Site 1, the Seoul National University Campus are depicted in Figure 4, and modeling data for site 2, the Seoul National University Outstation is illustrated in Figure 5.
4.2. Model Simulation
The two sites’ temperature-reduction analysis utilized two ENVI-Met components—ENVIGuide and Leonardo—to convert the site models created by Rhino and Grasshopper into appropriate ENVI-Met formats. Information on the various environmental factors, times of the day, time intervals, and location characteristics were entered and the simulation performed with ENVIGuide. The resulting files presented in the output data were then sent to Leonardo to analyze the weather conditions throughout the day. All research results, including existing modeling analyses, were analyzed based on the ongoing simulations [39].
Existing modeling analyses were used as controls for all other analyses; apart from the presence or absence of a rooftop garden, the timing, time intervals, and environment variables remained the same for all the simulations. The simulation was run for the 6 h from 09:00 to 15:00 on 5 August 2019, with data extracted at hourly intervals. In the case of environmental analysis, the basic Beginner Level was selected and simulated for general data. The temperature range was set between 22 °C and 34 °C to reflect the temperature of a hot day. Besides, the wind speed and direction were set at an average of 1 m/s and toward the east with the direction angle between 80 and 100 degrees, respectively. To evaluate the potential effectiveness of the various types of rooftop gardens, simulations of the existing situation and the temperatures with gardens installed on all the available rooftops were performed. This type of comparison is supported by ENVI-Met’s Leonardo program.
Five rooftop garden configurations were analyzed for this study (Table 1). The impact of changes in various environmental factors on the host structure itself and the surrounding area for each configuration was modeled using ENVI-Met and an optimal plan derived [40]. The five types were: an extreme rooftop garden, linear (longitudinal) and linear (transverse) gardens, a checkerboard pattern, and an unrealized (bare rooftop) garden. In Korea, where there is a predominant wind direction, the results obtained would be expected to differ when the roof-top afforestation is aligned in different directions.
5. Results and Discussion
5.1. Existing Model Analysis
5.1.1. Simulated Data
The results analyzed by employing the Leonardo program were derived in the form of a series of 2D maps with the maps generated at 5 m vertical intervals as shown in Figure 6.
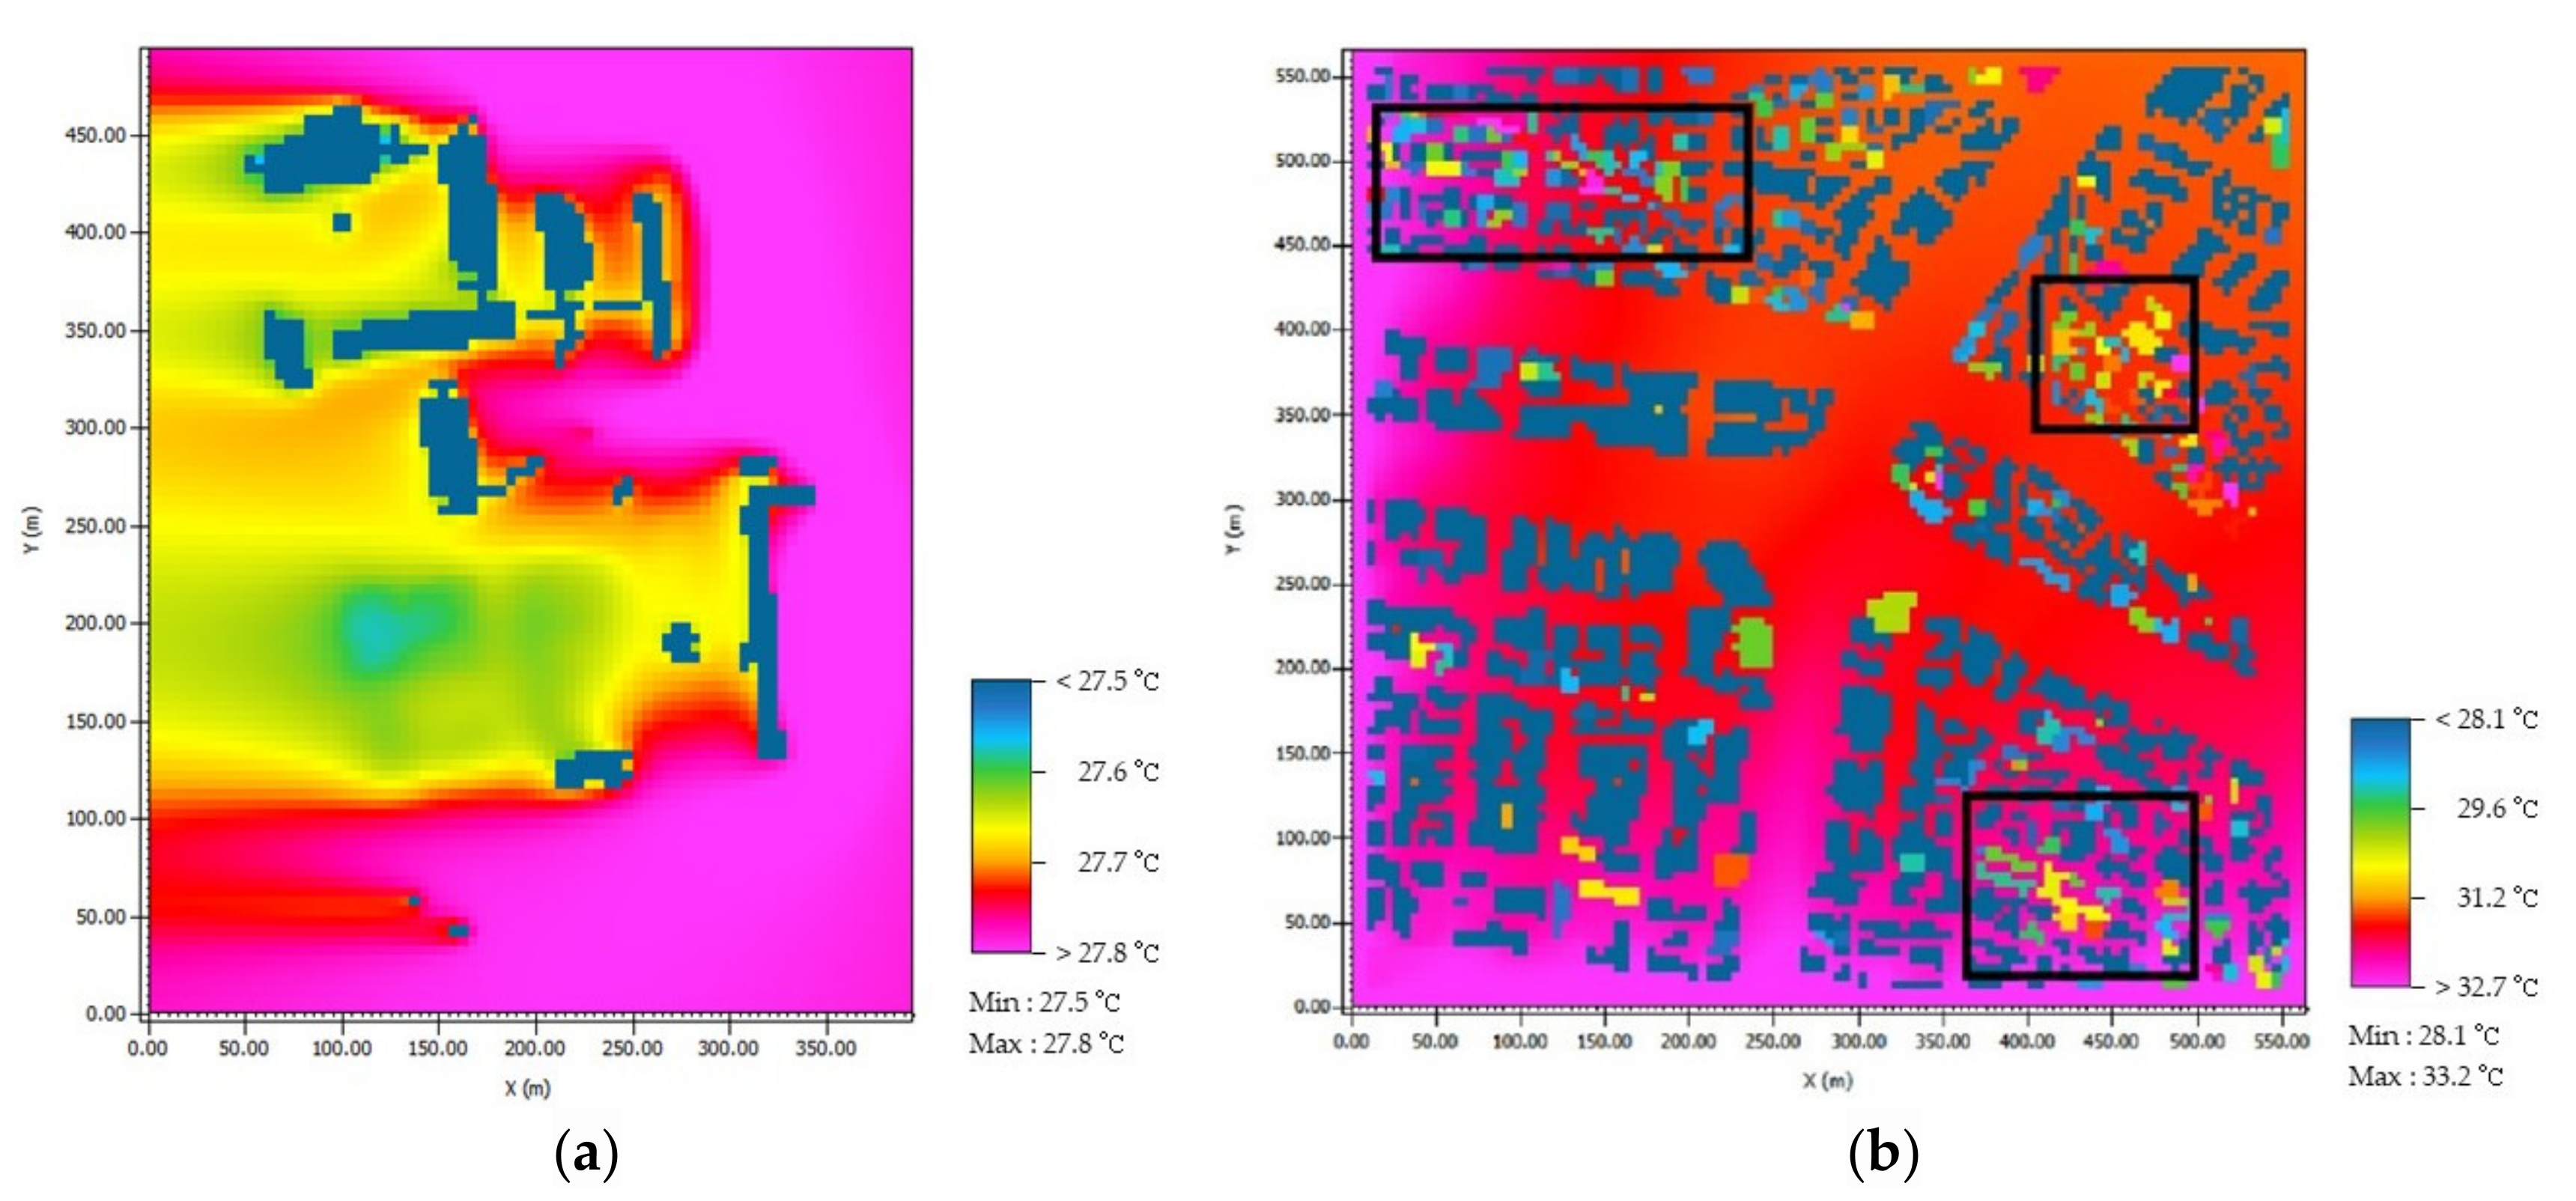
The altitude at which the best observation of the temperature distribution could be achieved was 122.5 m. Figure 6 shows the data for 12:00 from the existing modeling data. The minimum and maximum temperatures are 27.5 °C and 27.9 °C, respectively. The distribution of temperature varies with respect to the location of the building as the wind direction has been fixed in one direction only. By shielding the building from the hot winds of the heatwave period, one can assume that the west part of the building has a low temperature. Winds shielded by buildings in the longitudinal direction will then have winds in the northeast and southeast, respectively.
From Figure 6b illustrating the simulation data at 15:00, it was found that the minimum and maximum temperatures were 28.1 °C and 33.2 °C, respectively. Considering the location of the building, it can be inferred that the northeastern part of the site subjected to a low temperature due to shielding the building from extreme heat.
5.1.2. Analysis Results by Time Zone
The results of the site1 model analysis by time zone are shown in Figure 7.
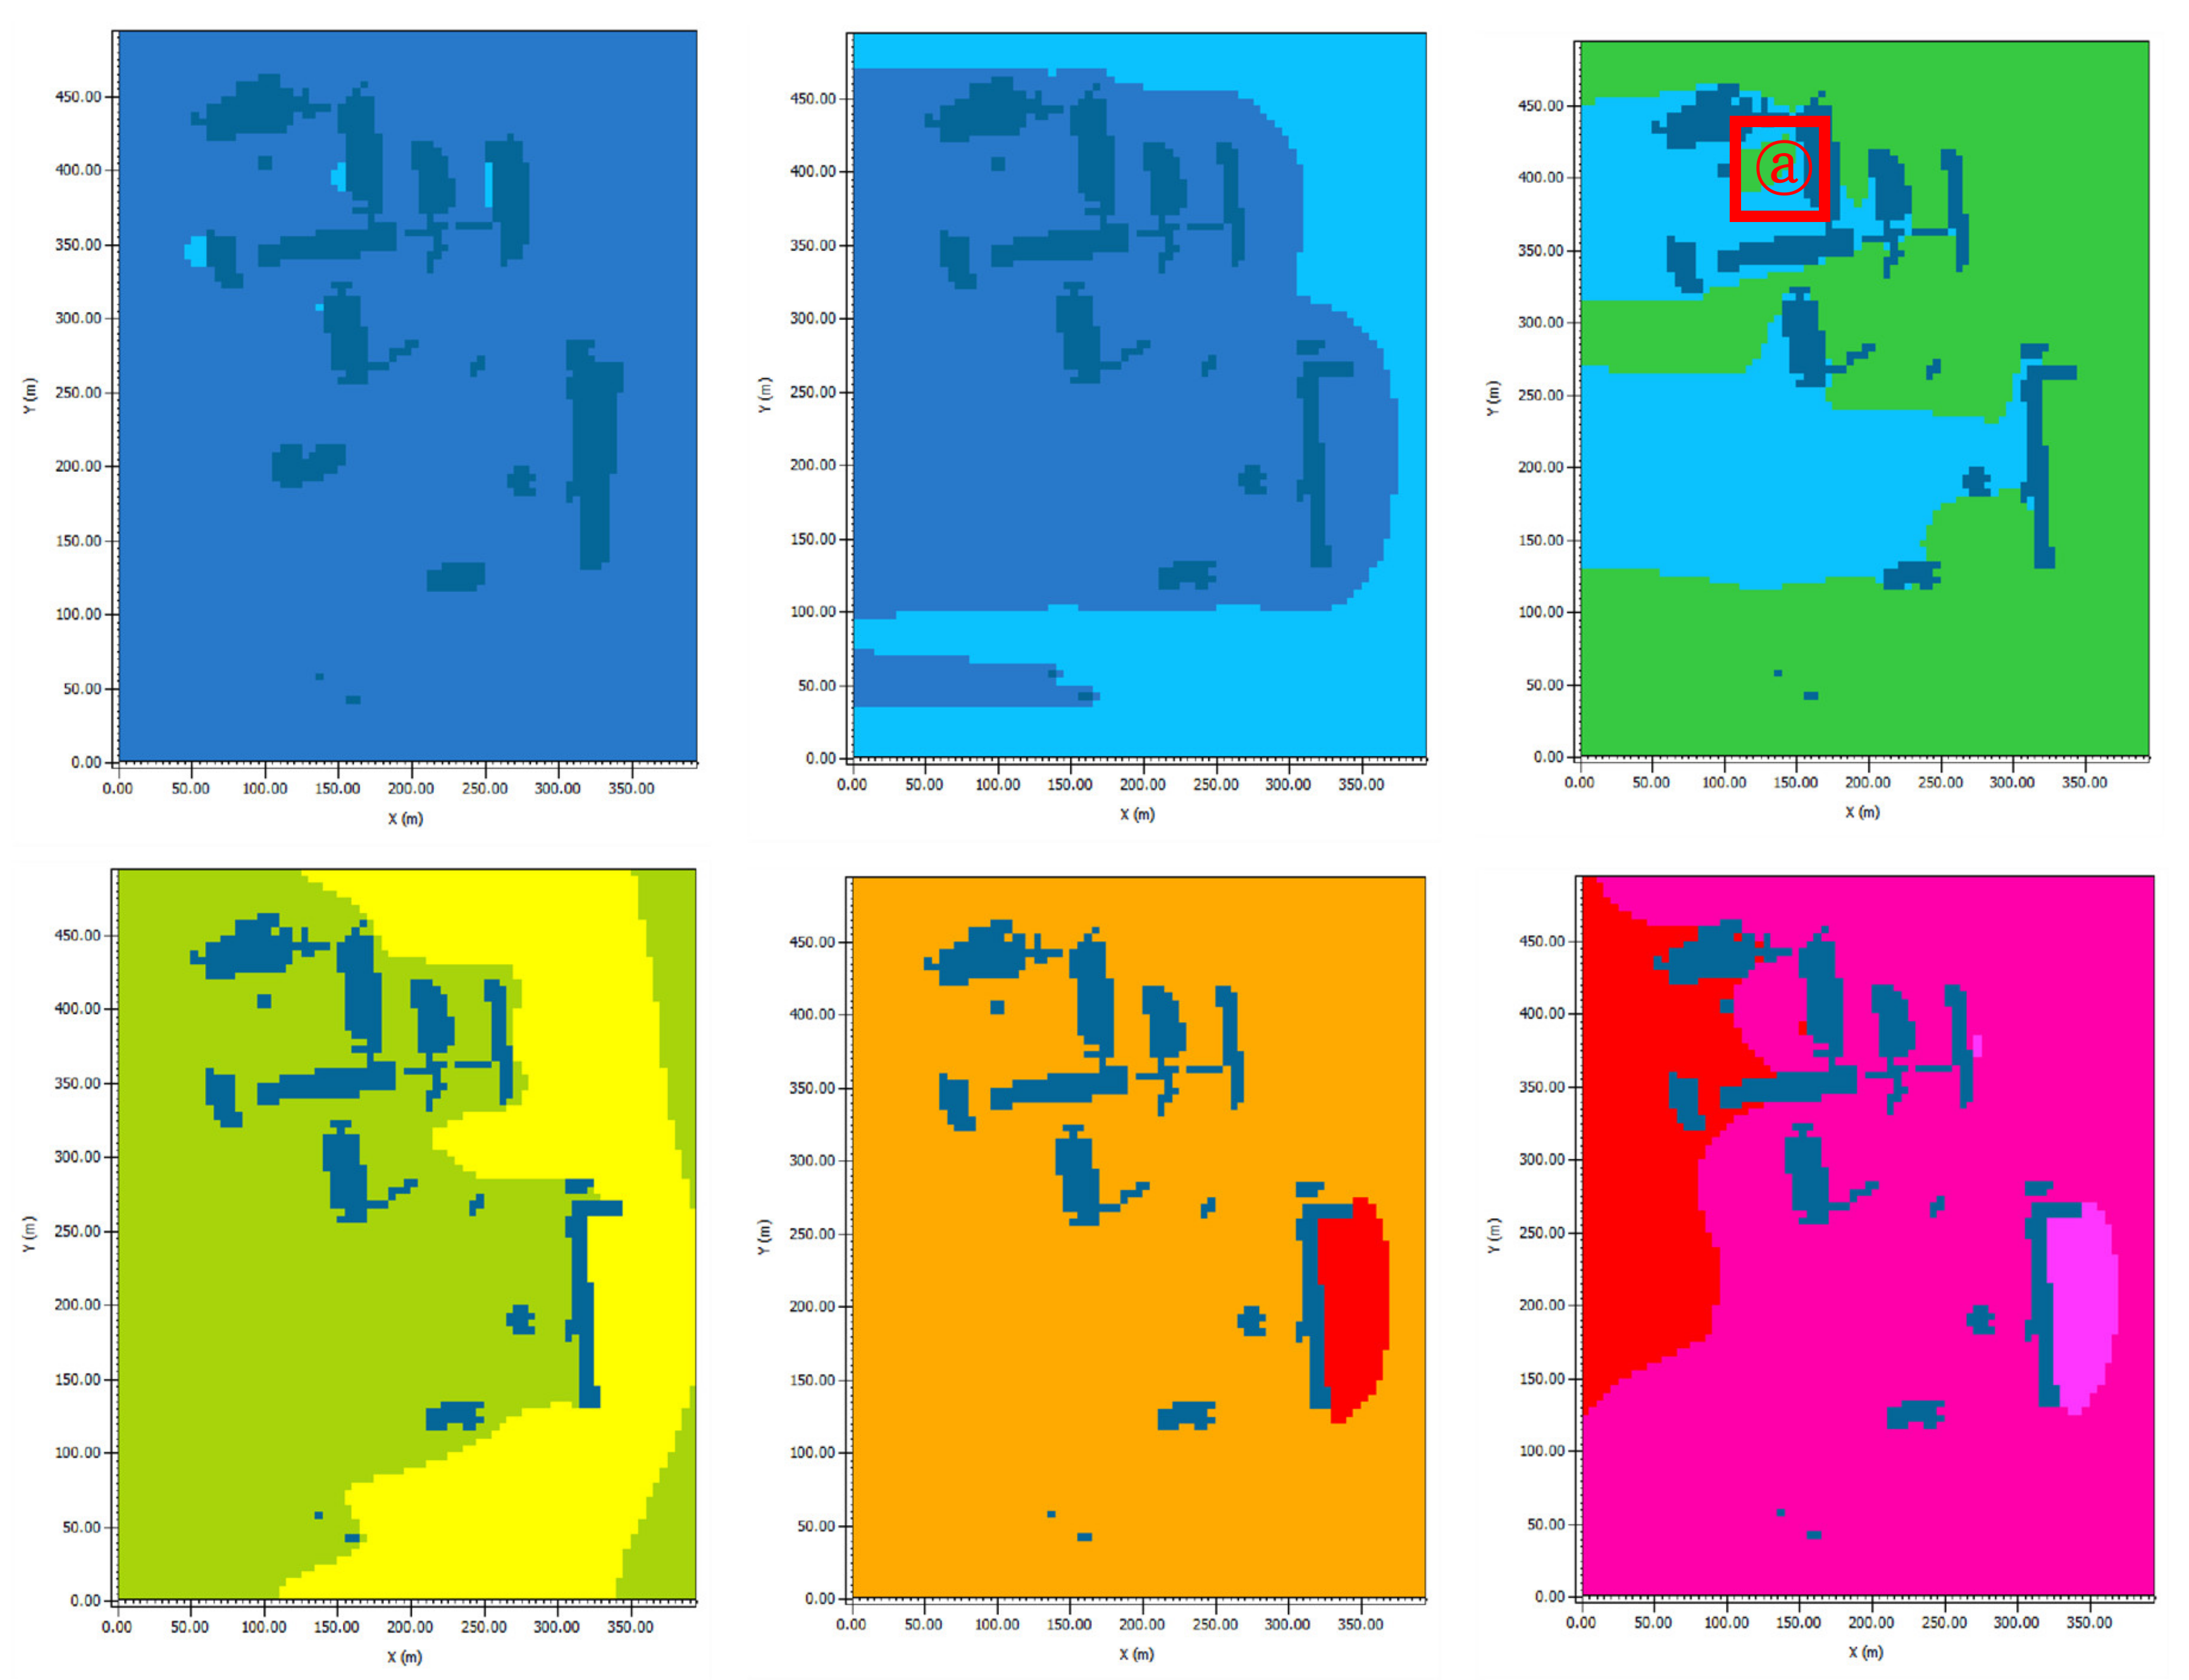
From Figure 7, it can be cathed out that the temperature gradually increased from 10:00 to 15:00, and the distribution of temperature, excluding buildings, varied in the shape from time to time. The distribution of the y-axis at 12:00 between 130 m and 270 m and the x-axis at 13:00 tend to have a temperature distribution that varies with wind direction. Meanwhile, the temperature distribution of point at 12:00 is 0.5 °C higher than the surrounding area. This is the result of a concentration of air shielded by buildings all over the place.
The analysis results for the models of site 2, by time zone, are shown in Figure 8.
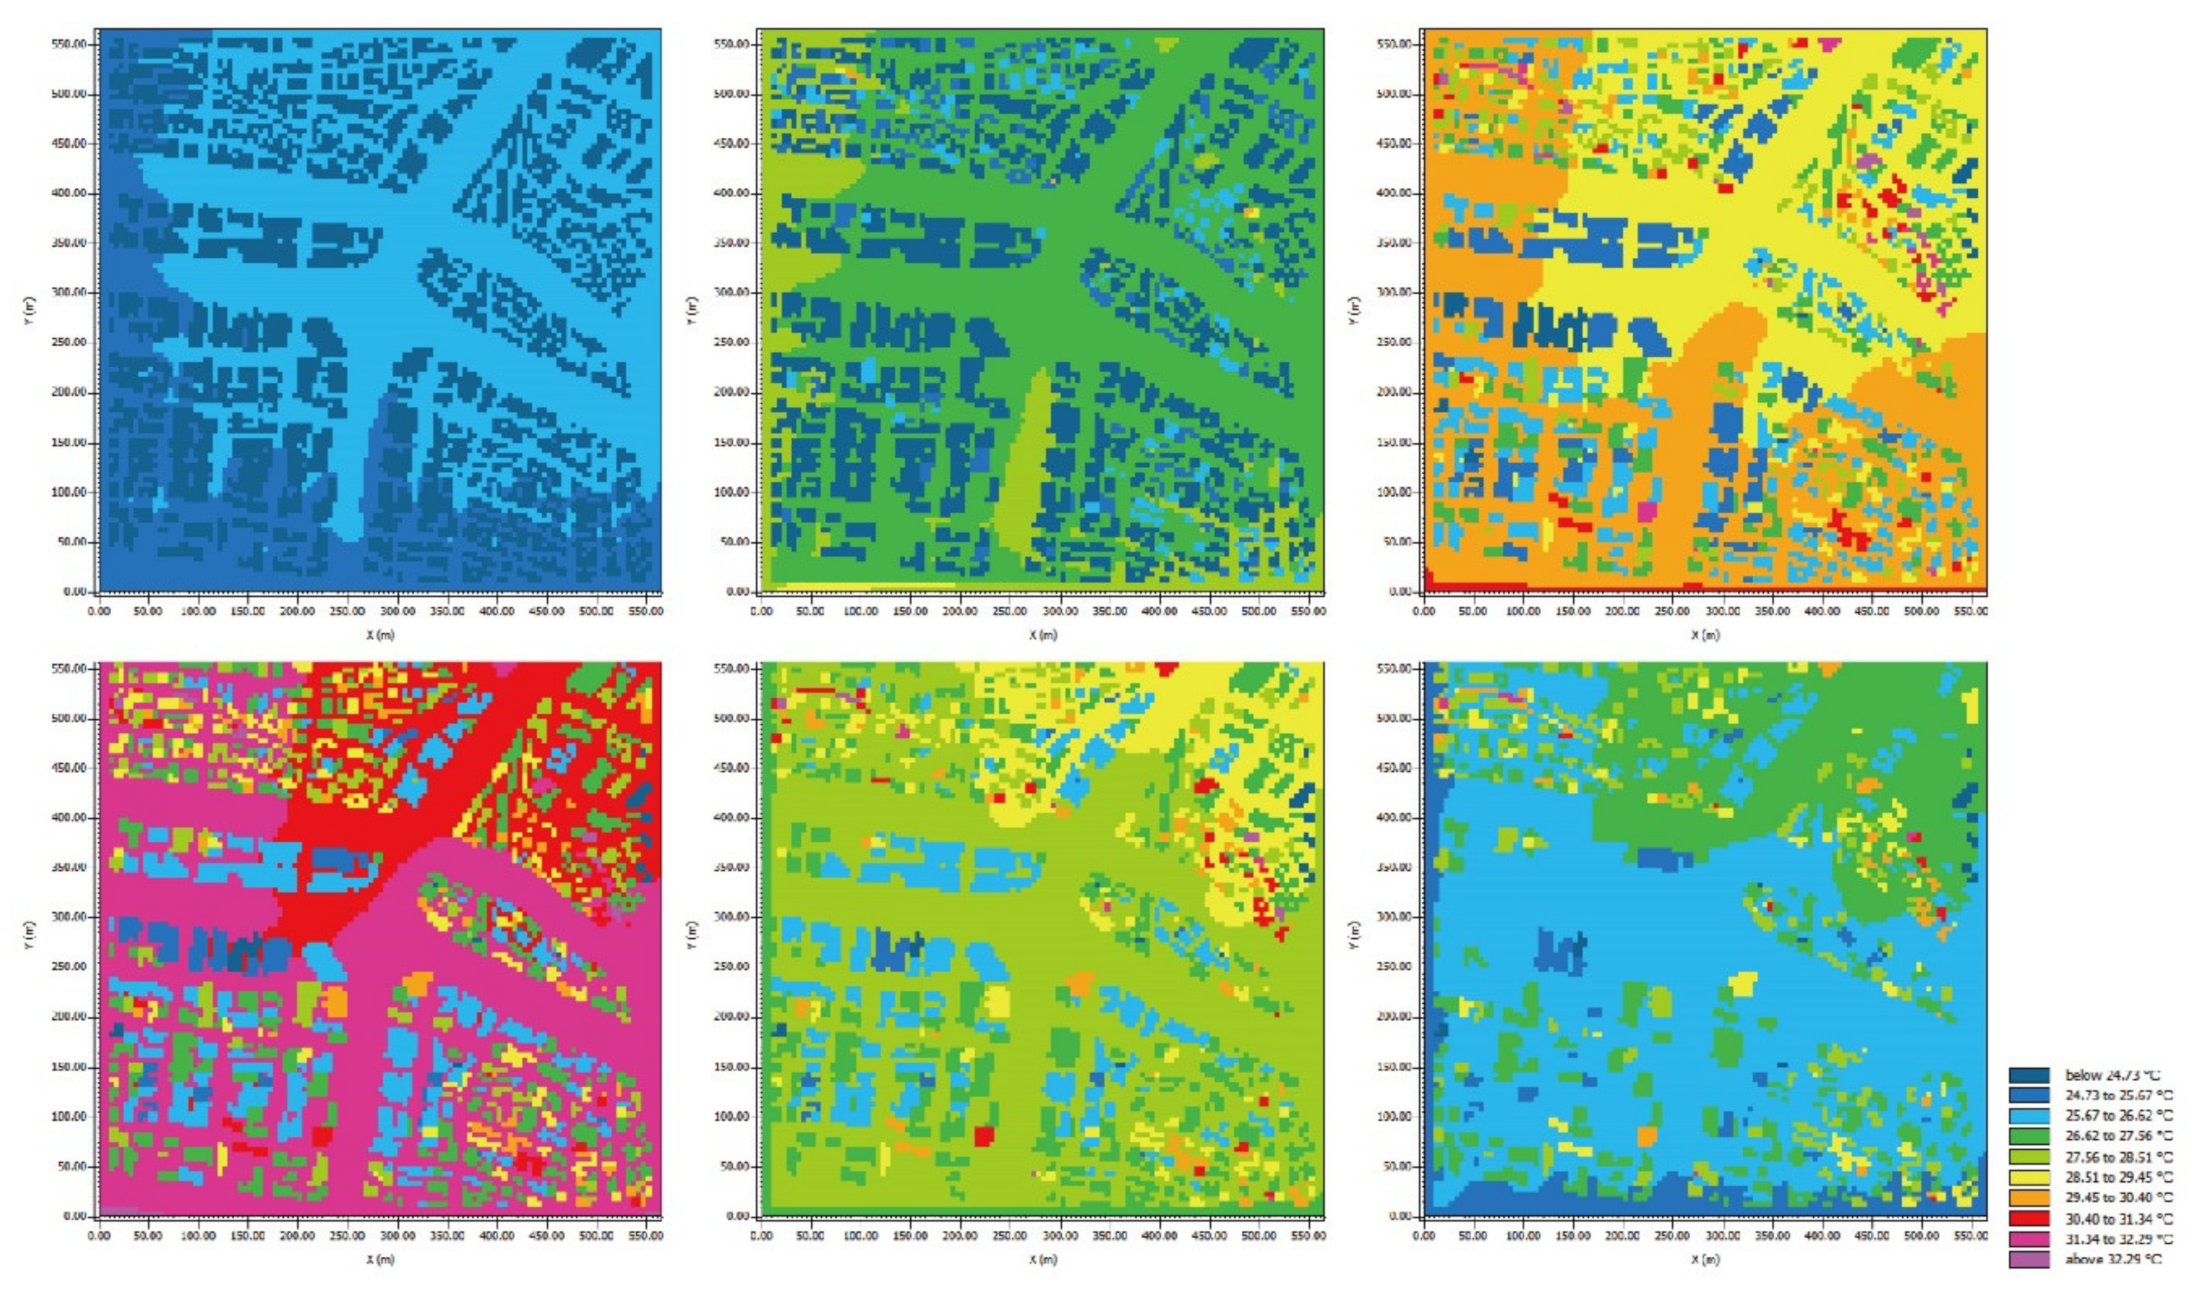
From the results, it was revealed that changes in temperature by time zone were mostly affected by the location of the sun. Temperatures, before sunrise, acquired almost a concrete amount about 25–26 °C until 08:00, while a sharp increase in temperature was observed after sunrise. Also, for temperature distribution within each time zone, the temperature difference between the region in the northeast and the southwest was assumed relatively small due to the effects of altitude and wind direction. On the other hand, the comparison of the analysis data between 4 h and 24 h indicates that the temperature decrease is less than the temperature increase, which is assumed to be the result of the slow-decreasing properties of asphalt. This is because the range of temperature changes on roads set as asphalt, through the time, was smaller. The daily maximum temperature was 33.2 °C at 15:00, and the maximum temperature difference was about 5.3 °C at 14:00.
5.2. Results of the Analysis on the Efficiency of Rooftop Afforestation by Time Zone
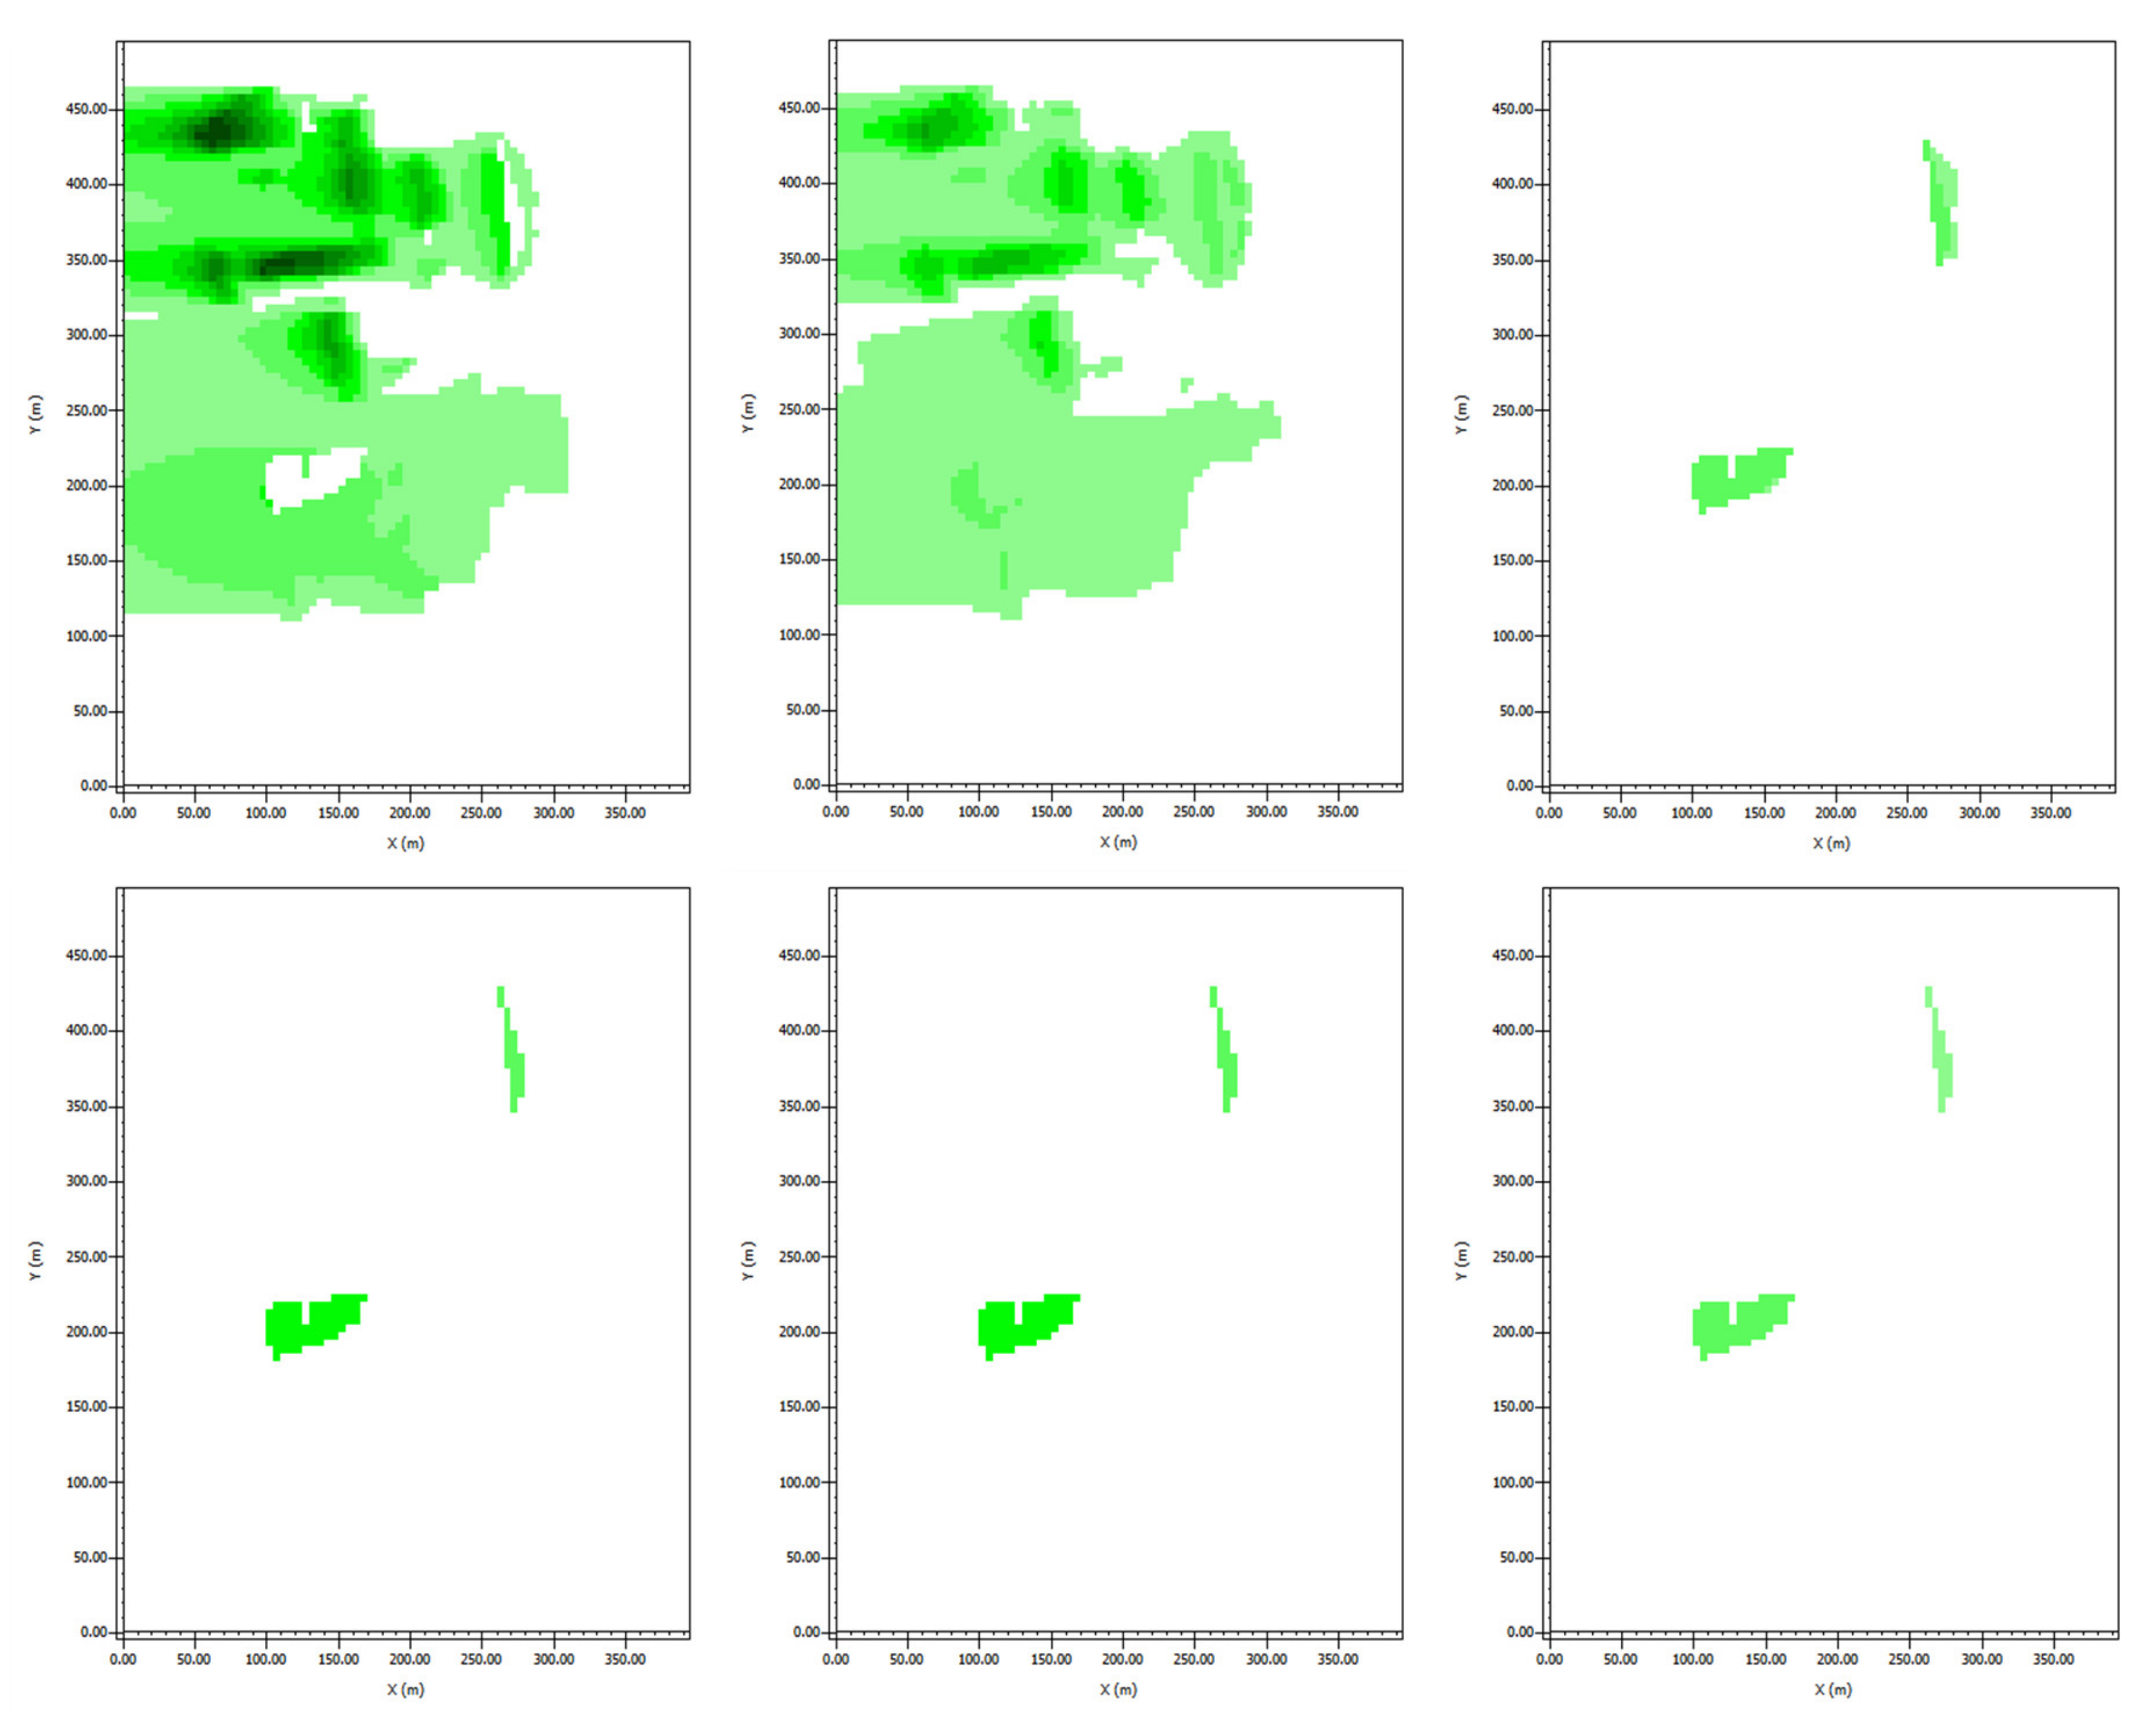
To analyze the effects of temperature reduction of the rooftop garden through the time, the simulations of the existing model and the model carried out at the rooftop garden of all buildings were compared. The simulation results revealed the reduced temperature and areas by time zone (Figure 9).
The comparison was made except for areas which reduced the temperature by 0.03 °C. When the roof garden was created, the most effective times were 10:00 and 11:00. Referring to Figure 9, from 12:00 to 15:00 the reduction temperature and the shape of the area were similar.
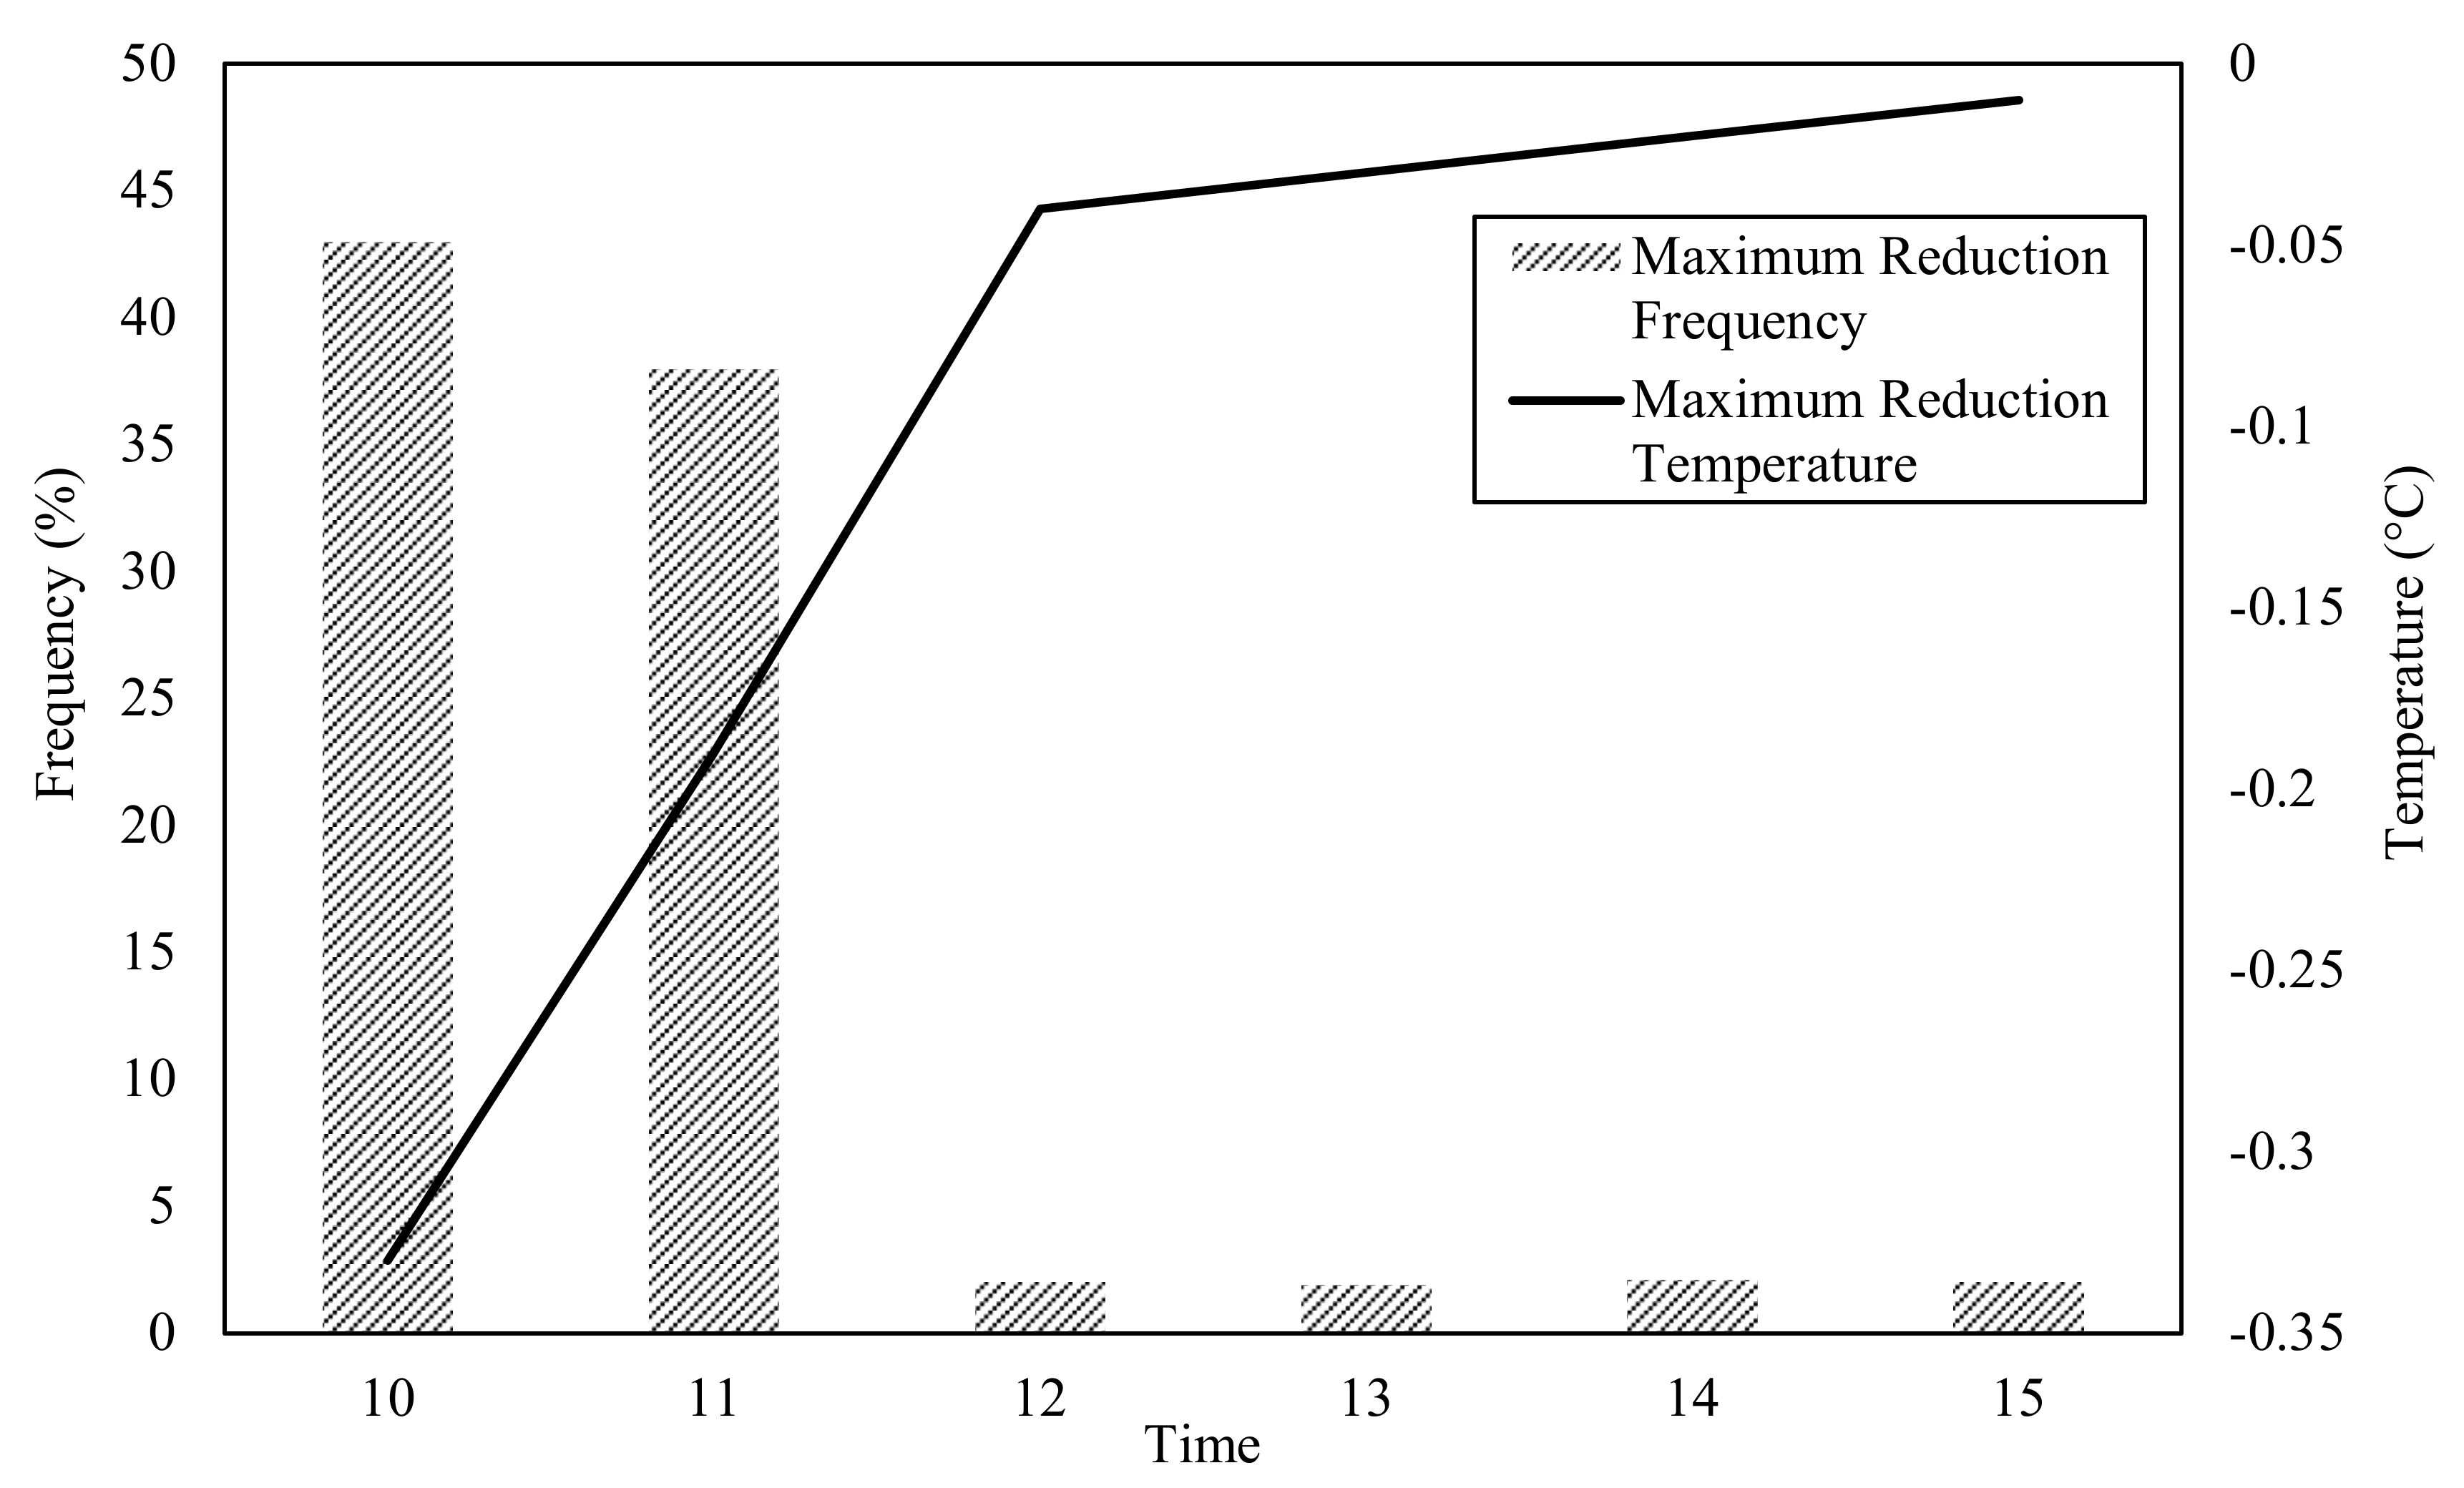
The maximum temperature reduction and the frequency of reduction over time are shown in Figure 10. The maximum temperature reduction at 10 a.m. was −0.3 °C and that of 11:00 was −0.2 °C, which significantly reduced compared to other times. The frequency was also 42.1% at 10:00 and 38.0% at 11:00, which can be said to have been affected by the temperature reduction.
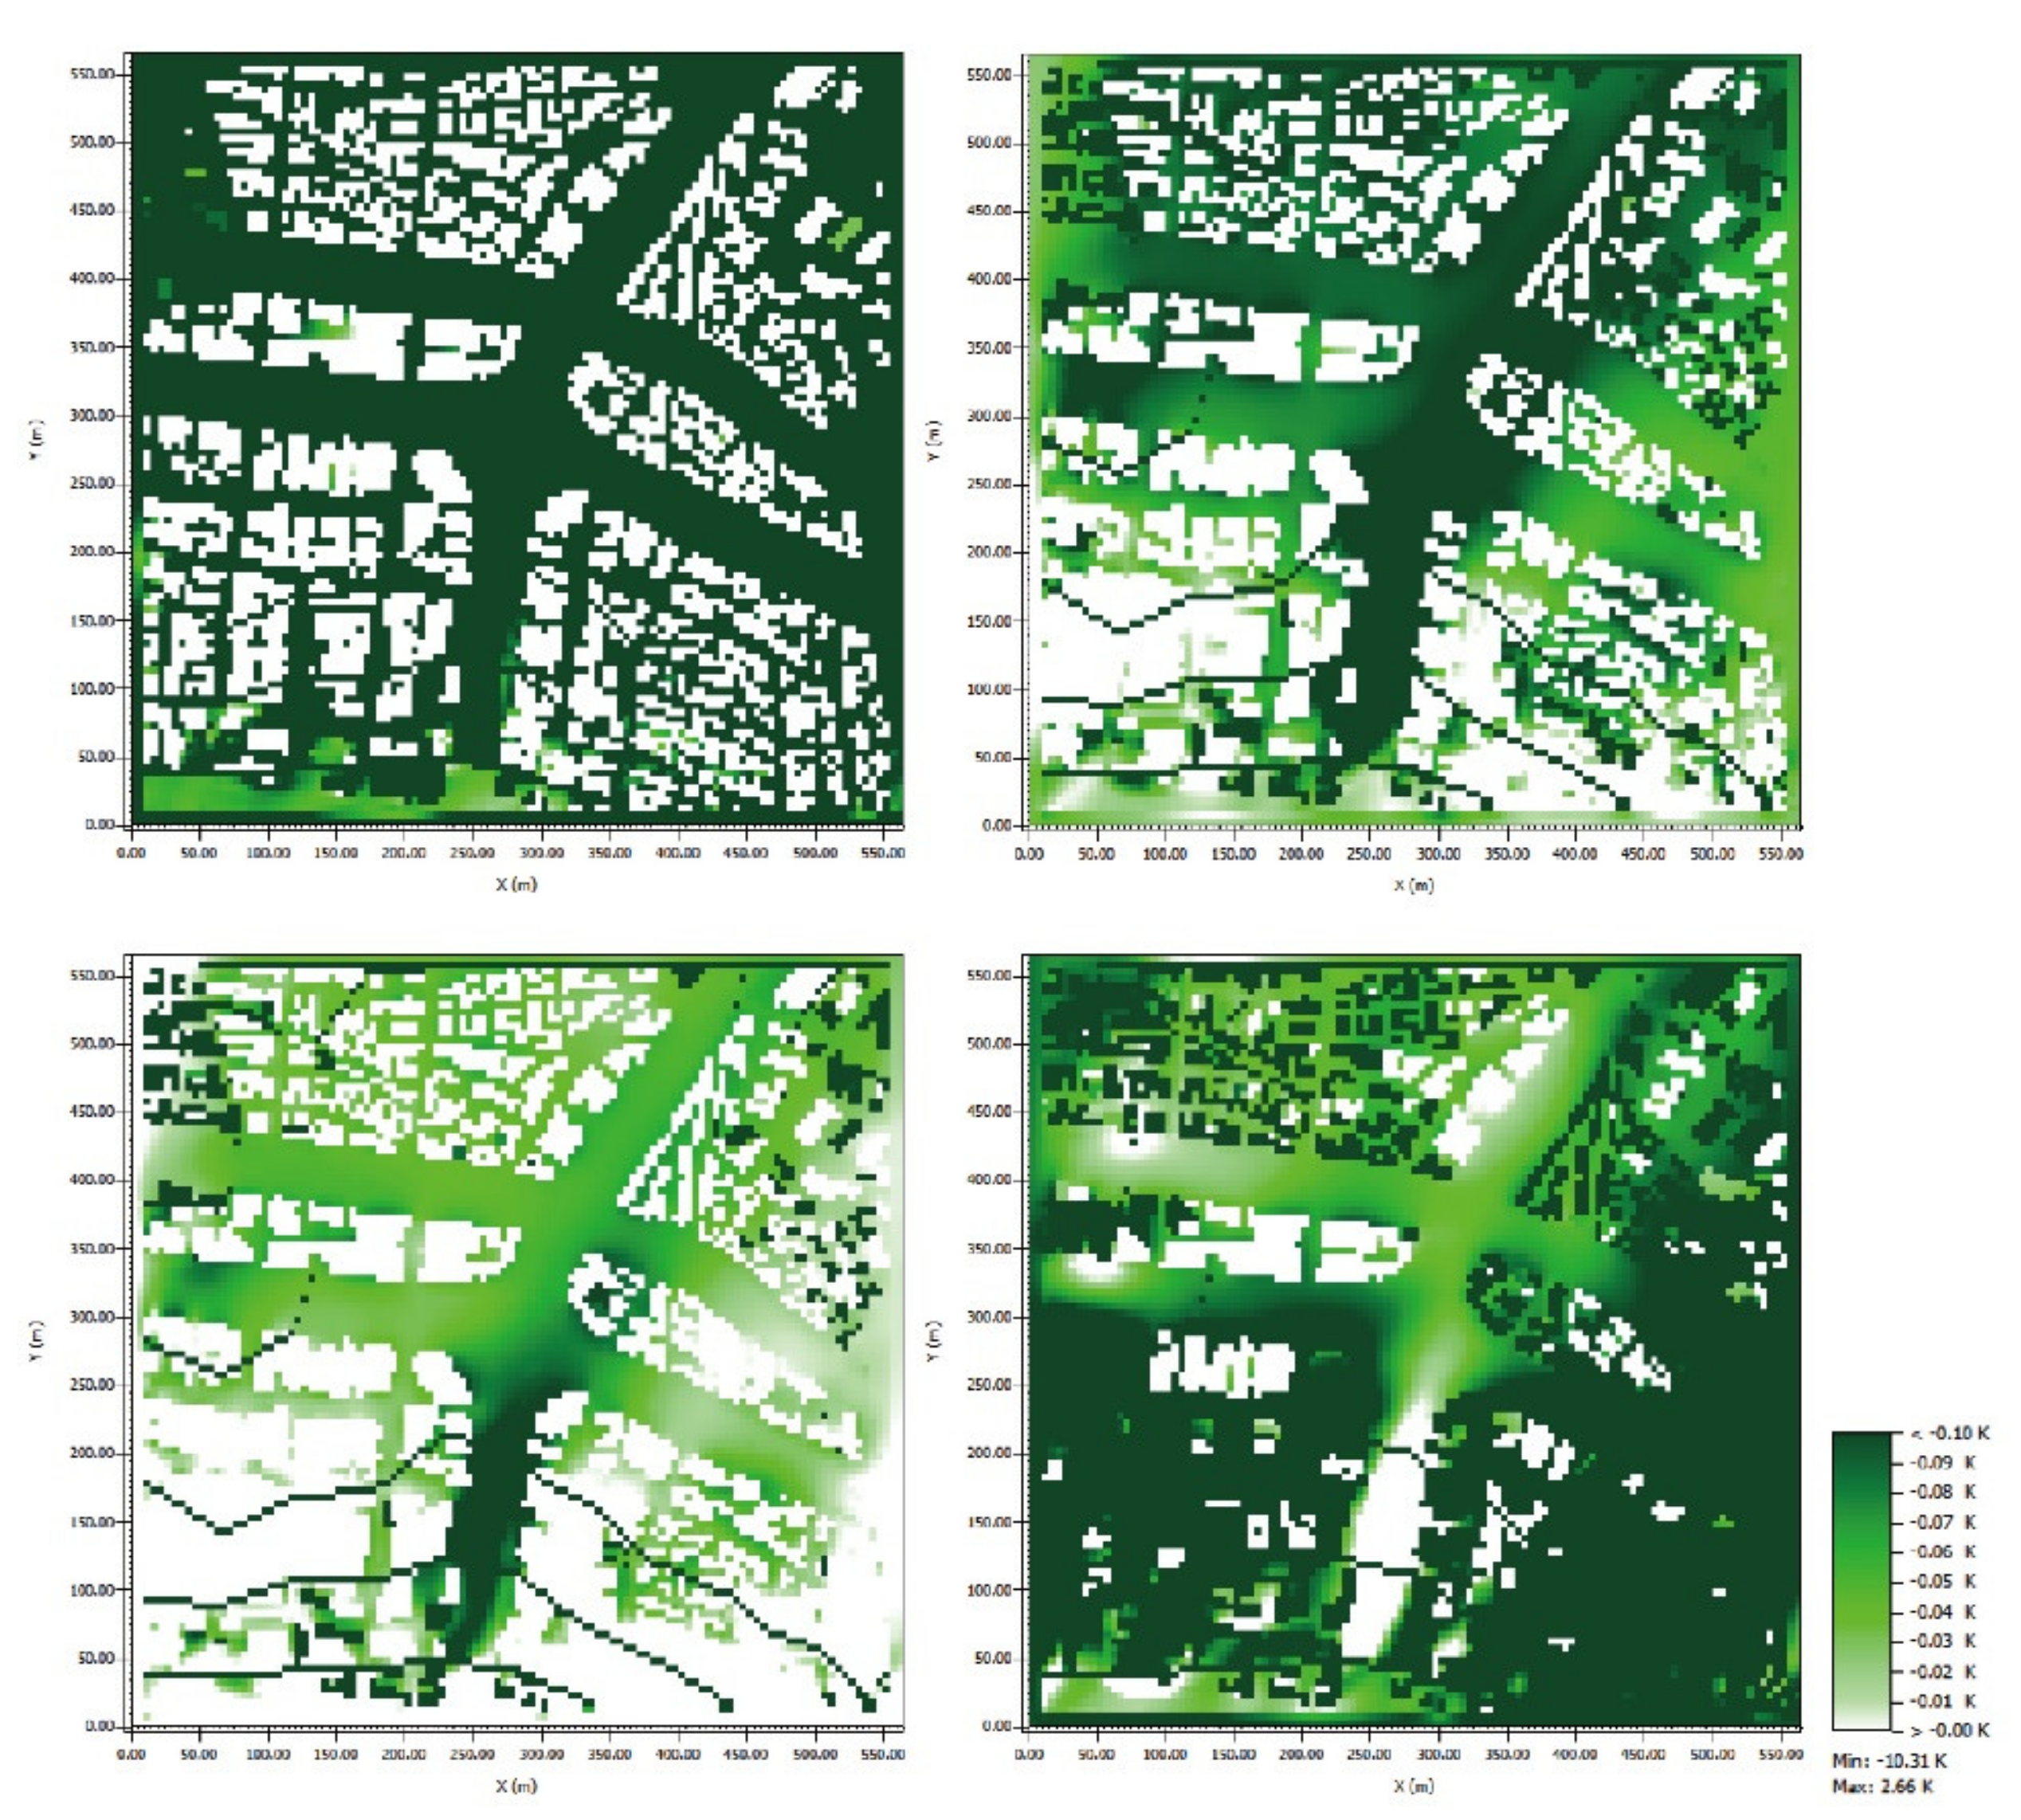
In the case of roof garden by time zone, the difference between the simulation of the existing model and the simulation of the greening at all rooftops was analyzed and the reduced temperature and area were compared by time zone (Figure 11). In the case of having the gardens installed at all the rooftops, most areas experienced a temperature reduction of about 1 °C. It was observed that the temperature reduction differed over time. For instance, at 00:00–09:00, only the temperature in the rooftop garden area was reduced. However, at 11:00–17:00, the temperature reduced near the areas where the roadside trees were planted. It might have resulted from the increased transpiration of plants with strong sunlight and lower humidity. It was seen that the temperature reduction was low on 5 August due to high humidity from 00:00–09:00. It was also observed that after 18:00, areas with reduced temperatures were near the rooftop, before which temperatures were reduced only on roads, not near buildings.
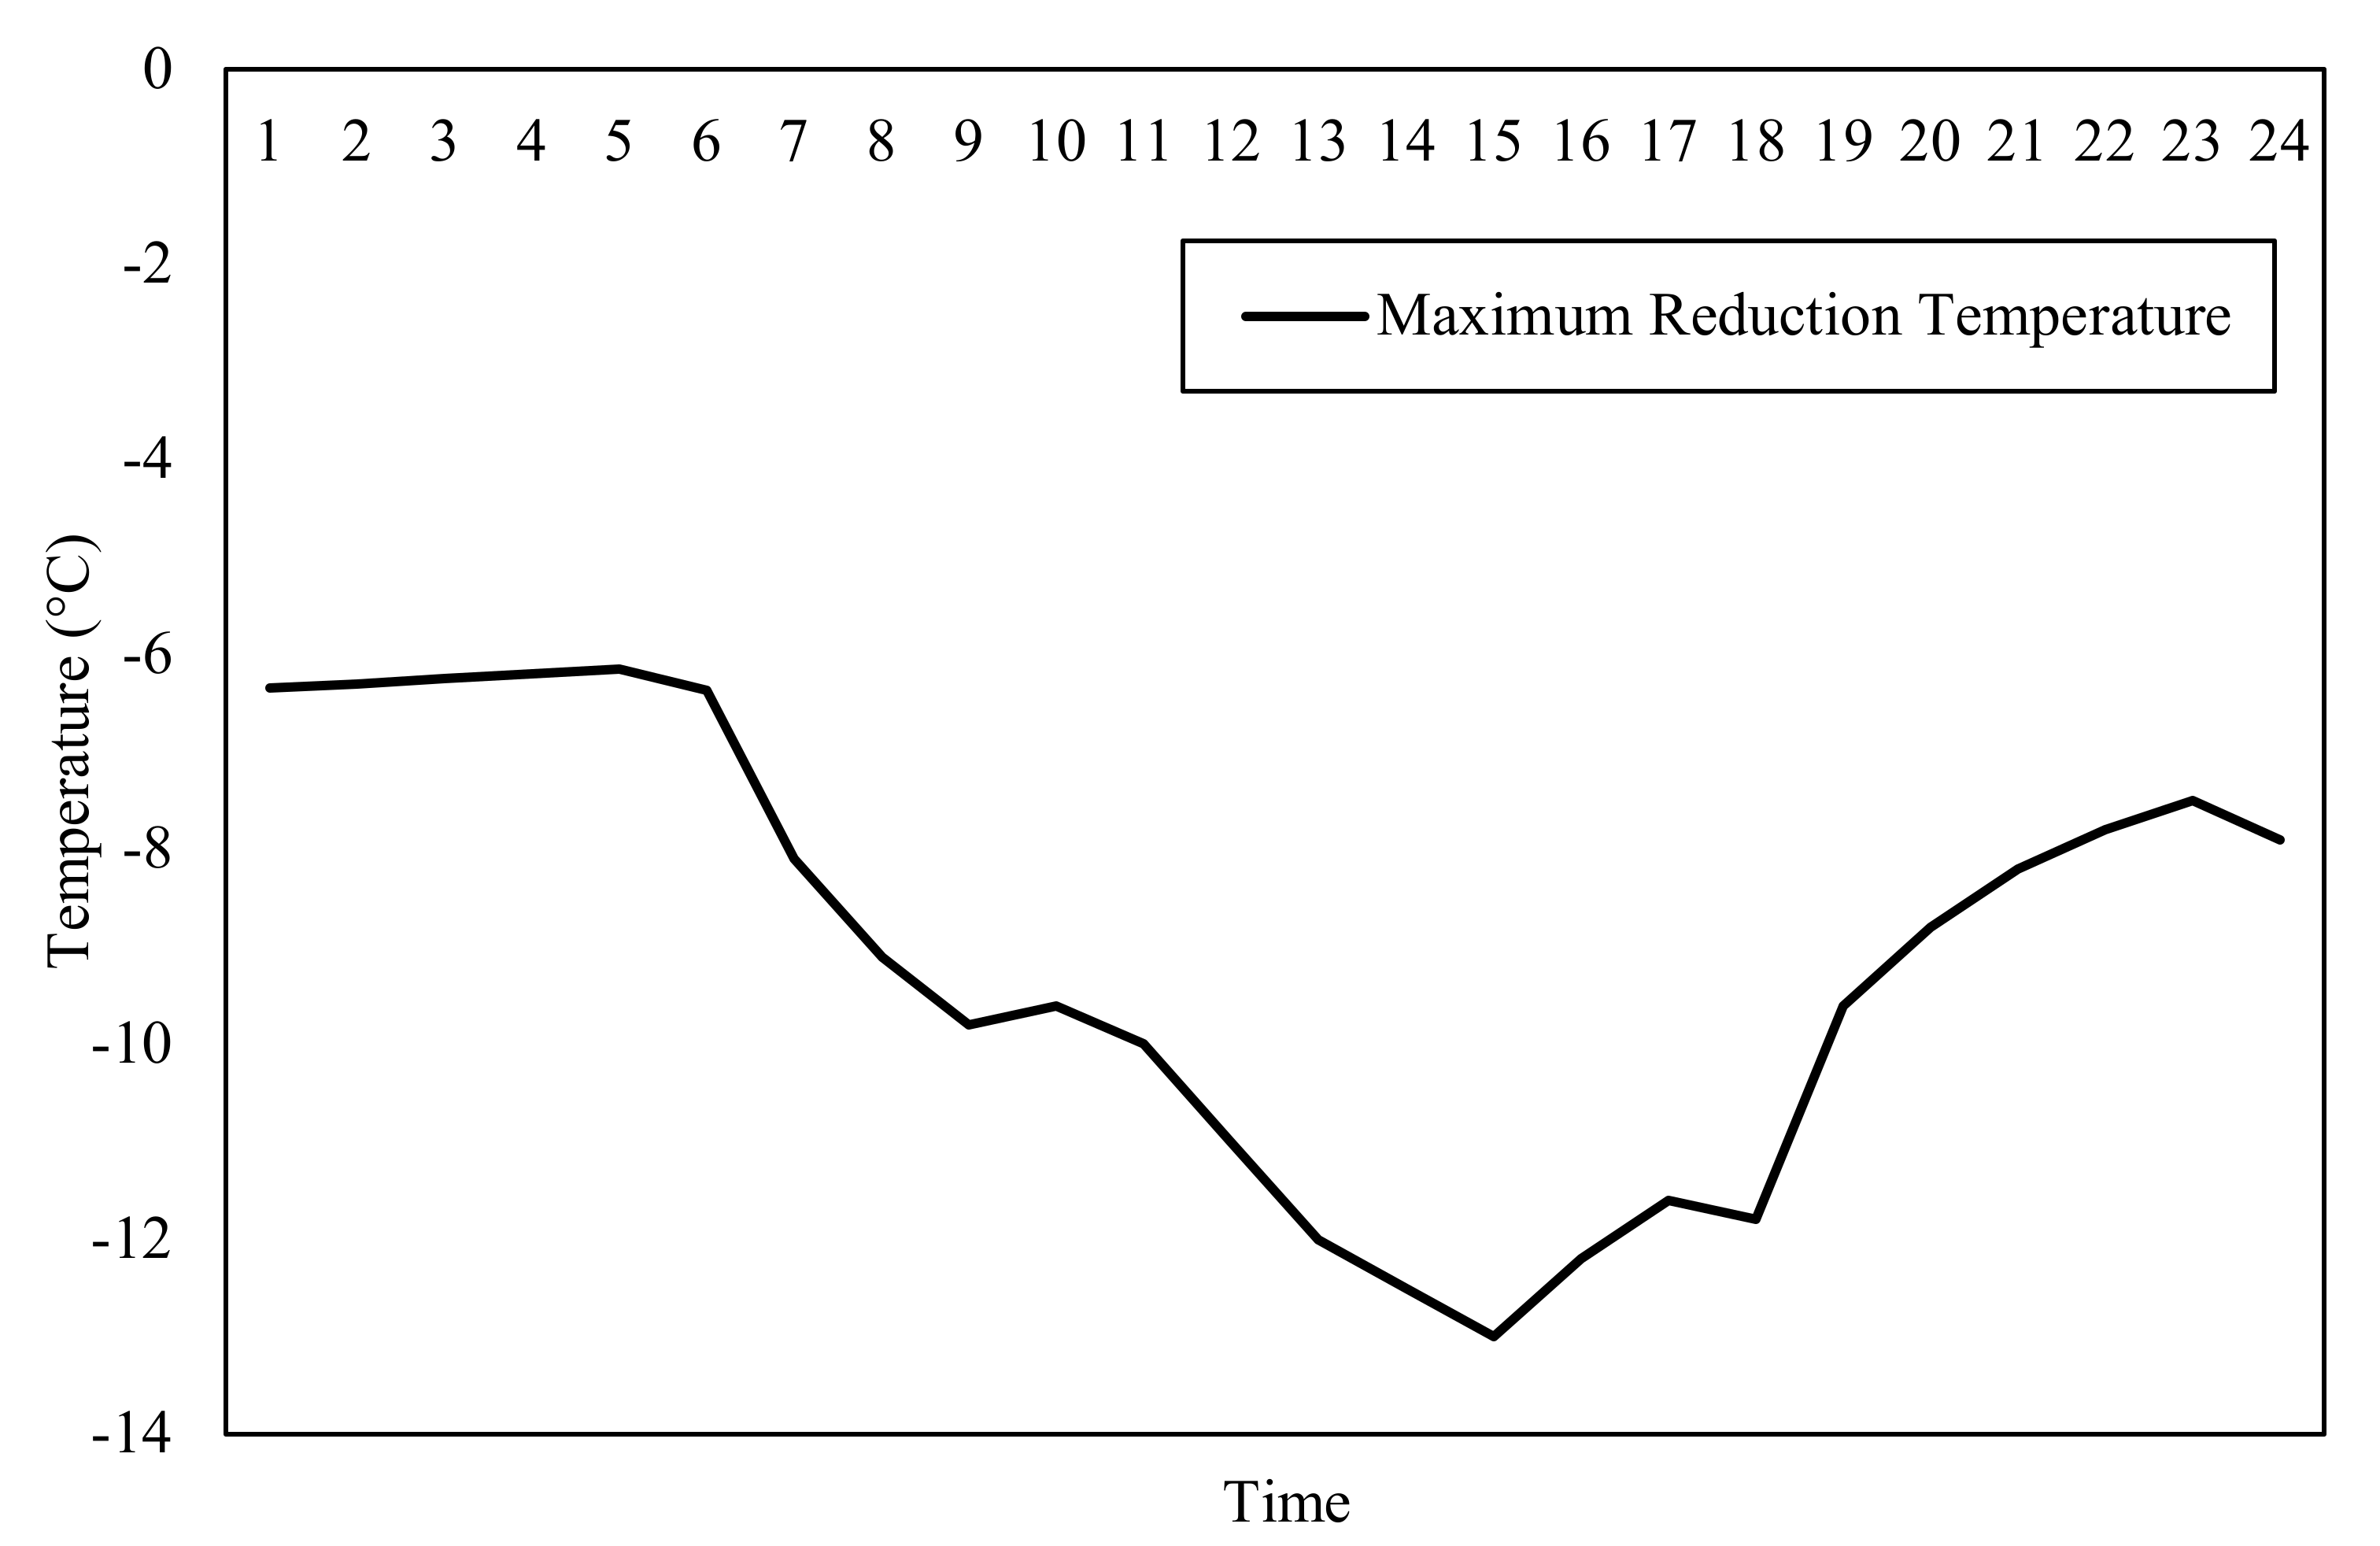
The variation of the maximum temperature reduction with respect to the time zone is shown in Figure 12. At all times, the maximum temperature reduction was 6 °C or higher, of which the maximum temperature reduction occurred at 15 o’clock and 12.9 °C. This is assumed to be the area in which the elevation difference occurred in ENVI-Met Space or the area in which the horizontal number exists.
5.3. Results of the Analysis on the Efficiency of Rooftop Afforestation by Type
Modeling of Target Sites by Afforestation
Modeling was made in different ways depending on the type of roof-top garden of each type. The area covered by the rooftop garden is shown in green (Table 2 and Table 3).
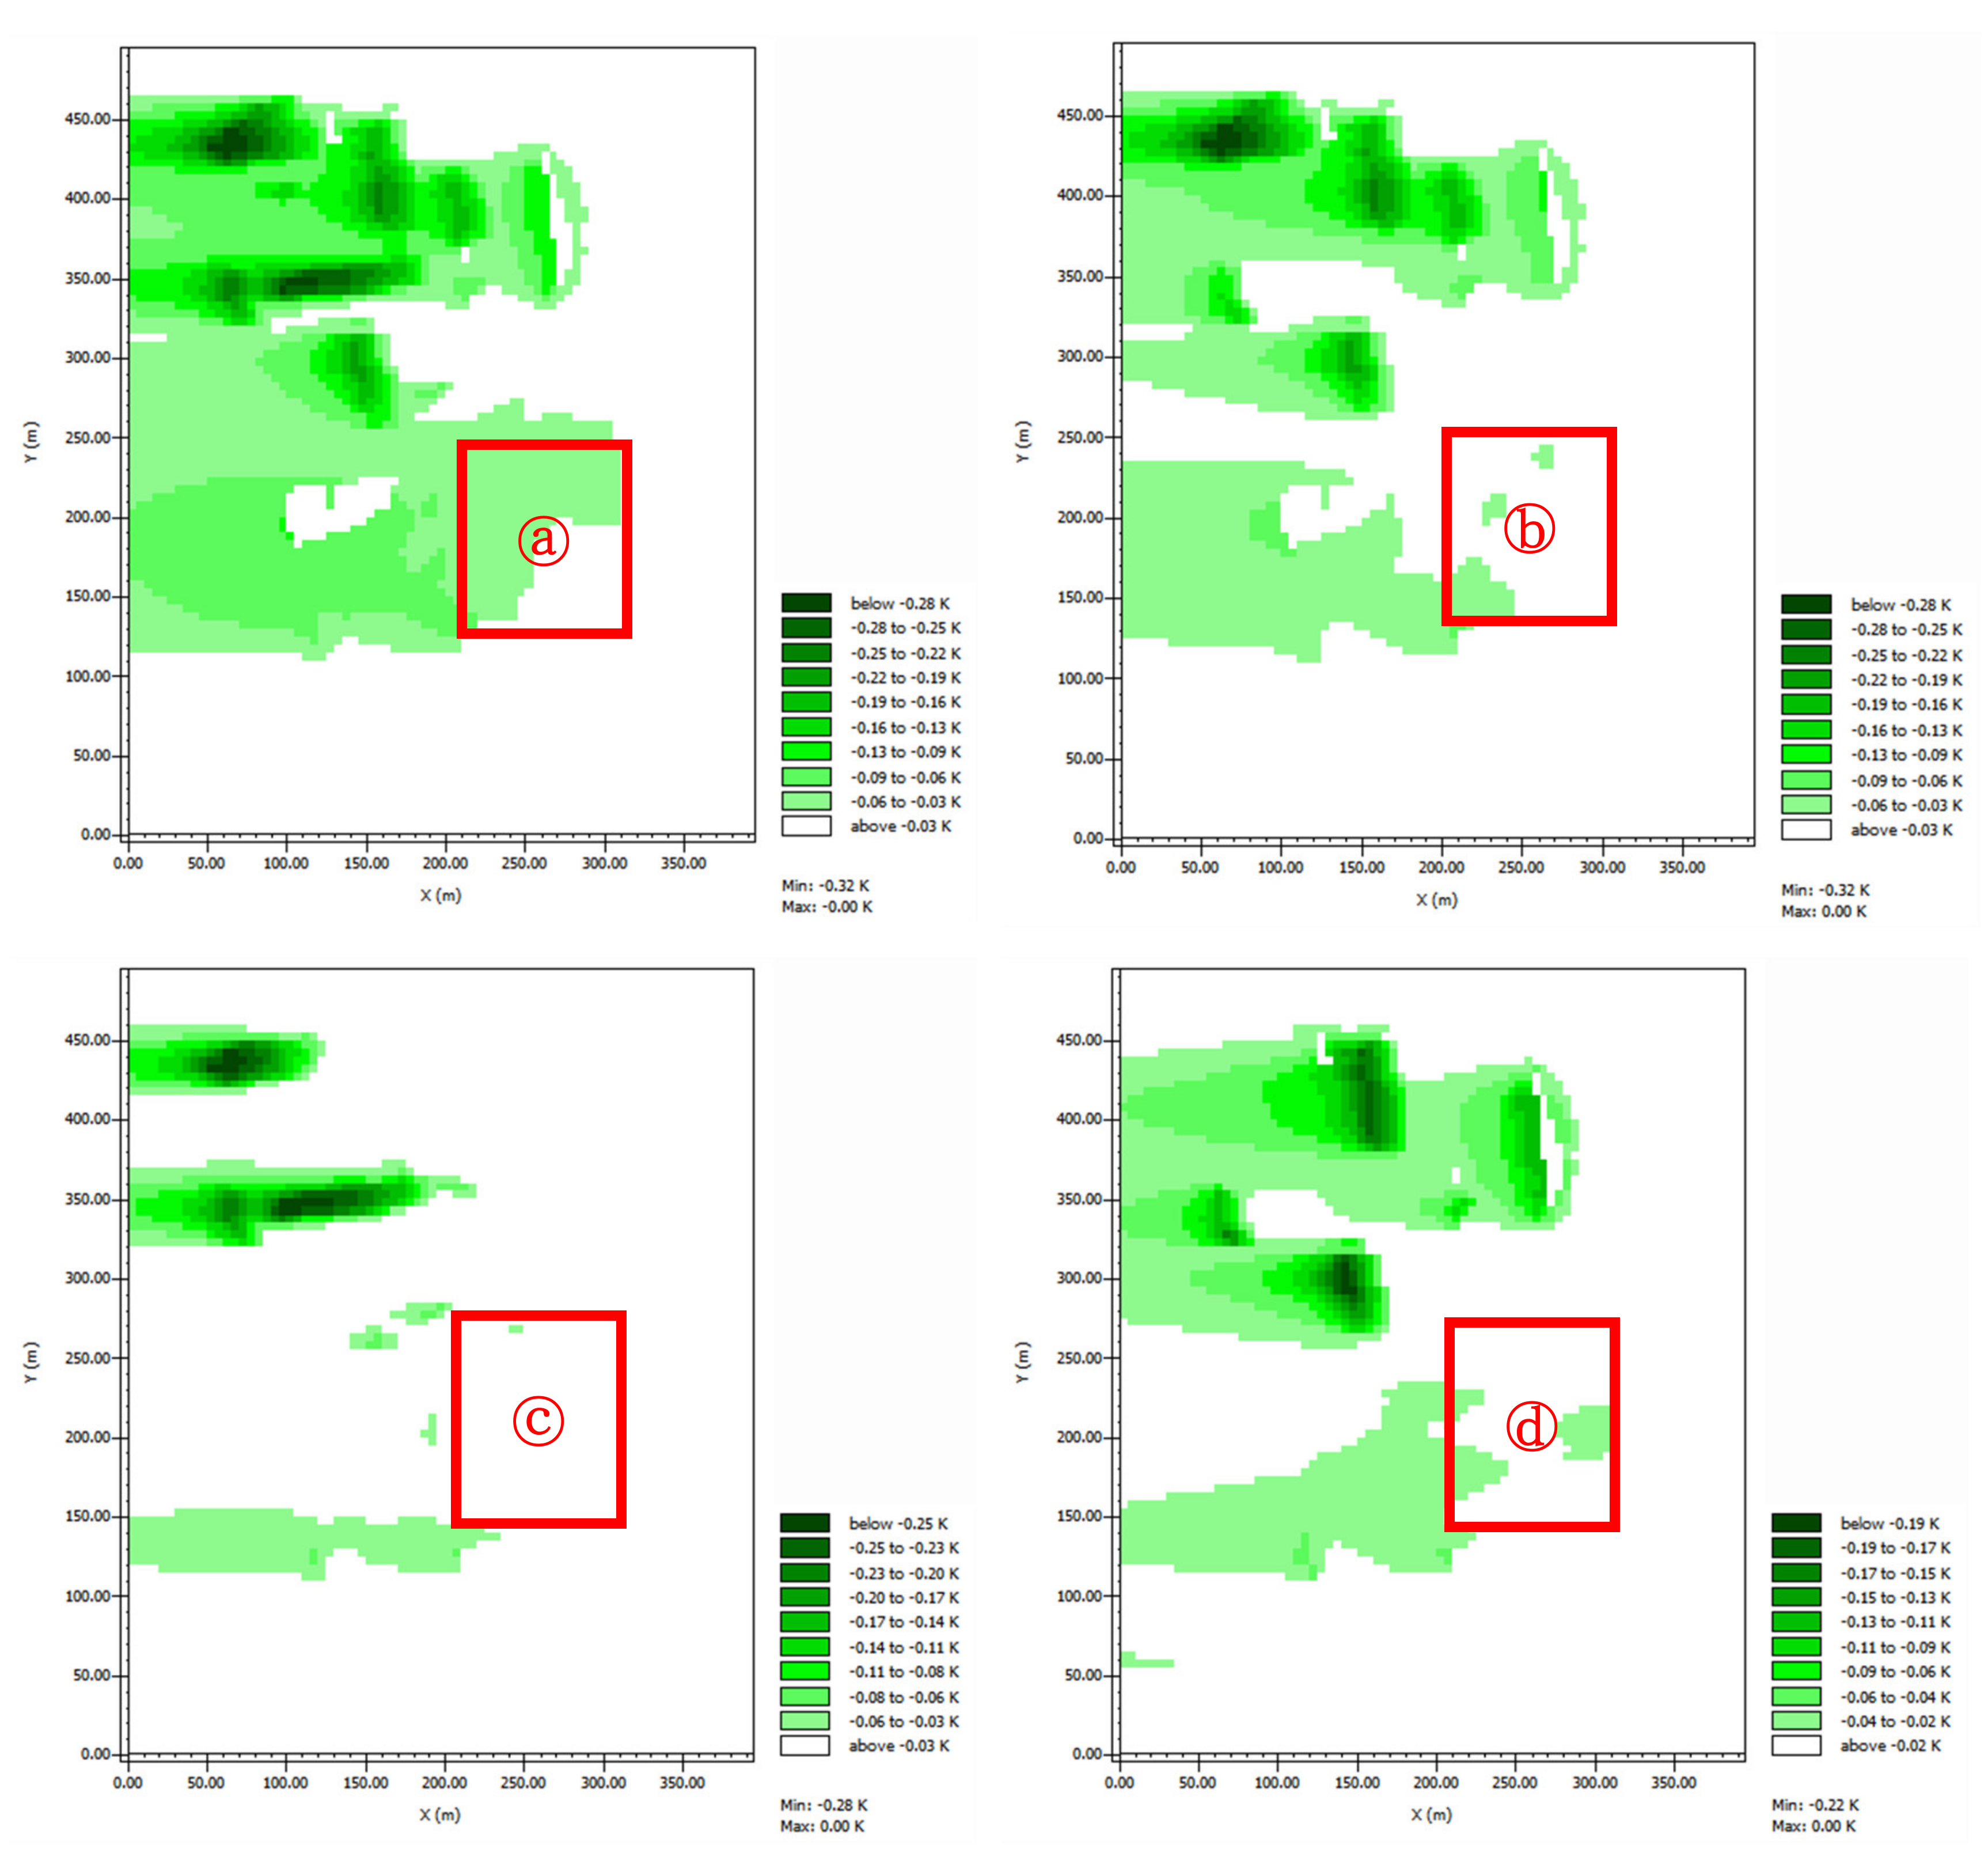
Figure 13 shows the results of the temperature-reduction analysis by the rooftop type. Depending on the location and degree of rooftop green, the extent to which temperature distribution is affected was subtly different (extreme rooftop garden type). In the case of a fully afforestation type, both the west side of the building site decreased in temperature. On the other hand, in the case of linear (longitudinal) less space than the full-green type was affected by temperature reduction, and the lower-temperature range was greatly distributed to the west. Meanwhile, the linear (transverse) type was significantly lower in temperature than the other three types and the affected area was also transverse-shaped for both cases. The check pattern type was generally an area affected by the west side of the building site, but unlike fully afforestation, linear (longitudinal), an area with very little temperature reduction was located between the building and the building.
The simulation data for each arrangement were compared with data when the rooftop garden was not installed. In particular, when comparing point ⓐ to point ⓓ shown in Figure 13, the difference in temperature reduction effect can be clearly seen for each type of rooftop garden. This is attributed to the location of the building, and the results shown in Figure 13 are due to the unique shape of the building, where several layers of the building are connected at different heights. In extreme rooftop garden type, the northern part of the building was affected by the temperature reduced. In the linear (longitudinal) direction, the center of 39 dong building was affected by the temperature reduced. In the check pattern type, the only northeastern part of the building was affected by the temperature reduced, and in the linear (transverse direction), no area was affected by the temperature decrease.
For the analyzed time zone, data from the 15:00 time zone, which had the greatest effect on reducing the temperature of the rooftop garden, was utilized among the time zones of the previous study results. Two of the four types of temperature reduction, extreme rooftop green and linear (longitudinal), were found to be about 0.1 °C higher than other types on average. In the case of complete gardening and linearity (longitudinal), the extent to which temperature distribution was affected was subtly different depending on the location and degree of the roof garden. In the case of a complete green area, the temperature of buildings located on the edge of the target site had further reduction. On the other hand, linearity (longitudinal direction) had a greater effect on the building’s surroundings compared to the full-roof garden type, and the temperature in the center of the target area showed more decrease (Figure 14).
The maximum temperature reduced for each type is shown in Table 4.
From Table 4, it can be realized that the maximum temperature reduction of the full-afforestation type and linear (longitudinal) was −0.3 °C, while the type with the minimum amount was −0.2 °C in a check-patterned format. On the other hand, for the linear (transverse) type, the area of temperature reduction was lower than the other three types, but the maximum temperature reduction was −0.3 °C, which had more decrease than the check pattern type owing to the parallel building sites on the x-axis 0–150 m and the y-axis 320–450 m.
6. Concluding Remarks
This study analyzed the weather conditions on the engineering area of Seoul National University’s campus via an ENVI-Met analysis simulation to simulate the temperature reduction achieved by five different rooftop garden configurations. The temperature in the target area is, not surprisingly, affected by environmental factors such as wind direction and wind speed. The results of the simulation conducted during the three hours either side of noon (09:00–15:00) on the hottest day of the year (5 August 2019) showed that the overall temperature at the target site increased as time went on and the temperature on the western side of the buildings, which was sheltered from the prevailing wind, was lower than that on the eastern side.
The examination of the temperature reduction effect achieved by rooftop gardens showed that the gardens successfully reduced the temperature across a wider area in the morning than in the afternoon. In the morning, about 39% and more of the total area experienced a reduction in temperature compared to the afternoon, and the temperature decreased by more than 0.3% C. This is likely the result of less photosynthesis in the morning than in the afternoon, but further work is needed to understand the underlying mechanism and it is also necessary to explore the effects of different types of roofing material at night when dew is deposited. This research examined only a short six-hour period in summer; the temperature reduction effects of rooftop gardening deserve a much longer-period study tracking the effects over multiple days or a year-long analysis over all four seasons.
Based on the analysis of the temperature reduction effect by type of rooftop garden, extreme rooftop garden planting was the most effective type in terms of the area, delivering the greatest reduction of temperature. The two linear configurations, transverse and longitudinal plantings, exhibited major differences. Despite the rooftops of the buildings in the target area were mostly rectangular and having many different types of rooftops commonly encountered in urban neighborhoods, further research is needed in a more diverse urban area. The target sites covered in this study had significant temperature reduction effects of the Linear (Longitudinal) type. This is different from other studies. Other studies expressed that more than 60 percent of green space will have a temperature reduction effect [6]. However, the results revealed in this study can produce a large temperature reduction effect if the arrangement is concerned, even if approximately 50% of the rooftop green space is secured.
This study has made two major contributions to research into developing more efficient plans for wide-area-unit rooftop gardens. First, there are economic effects due to the quantitative identification of temperature-reduction effects across a wider area that will reduce the energy cost incurred by air-conditioning buildings during heatwaves; further research could examine the associated impact on resource circulation, including water resources. Second, the environmental effects suggest rooftop gardens may contribute to efforts to address the urban heat island phenomenon, providing a theoretical basis for the assessment of the potential utility of increasing the vertical garden area around the site.
This study can make policy suggestions related to the installation of rooftop gardens. It can have the greatest effect if a rooftop garden is installed in all buildings. However, if the construction costs are insufficient, an arrangement of rooftop gardens should be set in consideration of the wind direction. In other words, it is deemed necessary to install a linear (longitudinal) rooftop garden that is perpendicular to the direction of the wind.
However, the study was based on the simulation without collecting historical climate data for both target sites. Therefore, future study will require at least one to two years of detailed temperature information to ensure the justification for the selection of the target site.
Author Contributions
J.K. (Junsuk Kang) designed and coordinated the study. J.K. (Jaekyoung Kim) and S.Y.L. performed the analytical and conceptual study under the supervision of J.K. (Junsuk Kang). J.K. (Junsuk Kang) reviewed the results of this study, and all authors have written and revised the text of this paper. All authors have read and agreed to the published version of the manuscript.
Funding
This work is supported by Smart City R&D project of the Korea Agency for Infrastructure Technology Advancement (KAIA) grant funded by the Ministry of Land, Infrastructure and Transport (20NSPS-B154565-03) and the 10th Creative Research Program of the College of Agricultural and science at Seoul National University.
Conflicts of Interest
The authors declare no conflict of interest.
References
- National Aeronautics & Space Administration (NASA). Goddard Institute for Space Studies (GISS), GISS Surface Temperature Analysis. Available online: https://data.giss.nasa.gov/gistemp (accessed on 3 April 2020).
- IPCC. Climate Change 2014: Synthesis Report. In Contribution of Working Groups I, II and III to the Fifth Assessment Report of the Intergovernmental Panel on Climate Change; Core Writing Team, Pachauri, R.K., Meyer, L.A., Eds.; IPCC: Geneva, Switzerland, 2014. [Google Scholar]
- Carter, J.G.; Cavan, G.; Connelly, A.; Guy, S.; Handley, J.; Kazmierczak, A. Climate change and the city: Building capacity for urban adaptation. Prog. Plan. 2015, 95, 1–66. [Google Scholar] [CrossRef]
- Gottlieb, J.; Gottlieb, W.U.S. Vertical garden. U.S. Patent 7,516,574, 14 April 2009. Available online: https://patents.google.com/patent/US7516574B2/en (accessed on 2 March 2020).
- Song, I.J.; Yun, C.R. A Study on the Development and Application of Biodiversity Indicators in Park and Green Areas in Seoul Metropolitan Government; The Seoul Institute: Seoul, Korea, 2019. [Google Scholar]
- Jabareen, Y. Planning the resilient city: Concepts and strategies for coping with climate change and environmental risk. Cities 2013, 31, 220–229. [Google Scholar] [CrossRef]
- Jang, J.; Oh, C.H. The Effect of Green Roof on Temperature Reduction in Seoul. In Proceedings of the Conference of The Korean Institute of Landscape Architecture, Seoul, Korea, 25 March 2011; pp. 165–168. (In Korean). [Google Scholar]
- Bribach, C.J.; Rossomano, D. Vertical garden panel. U.S. Patent 8,141,294B2, 27 March 2012. Available online: https://patents.google.com/patent/US8141294B2/en (accessed on 2 March 2020).
- Smith, T.L. Vertical garden systems and methods. U.S. Patent 201,301,044,56A1, 2 May 2013. Available online: https://patents.google.com/patent/US20130104456A1/en?oq=US20130104456A1 (accessed on 2 March 2020).
- Liu, K.; Minor, J. Performance Evaluation of an Extensive Green Roof. In Greening Rooftops for Sustainable Communities, Proceedings of the Annual International Greening Rooftops for Sustainable Communities Conference, Washington, DC, USA, 5 May 2005; NRCC: Ottawa, ON, Canada, 2005; pp. 1–11. [Google Scholar]
- Huang, J.M.; Chen, L.C. A Numerical Study on Mitigation Strategies of Urban Heat Islands in a Tropical Megacity: A Case Study in Kaohsiung City, Taiwan. Sustainability 2020, 12, 3952. [Google Scholar] [CrossRef]
- Yang, J.; Shi, B.; Xia, G.; Xue, Q.; Cao, S.J. Impacts of Urban form on Thermal Environment near the Surface Region at Pedestrian Height: A Case Study Based on High-density Built-up Areas of Nanjing City in China. Sustainability 2020, 12, 1737. [Google Scholar] [CrossRef] [Green Version]
- Yeo, K.; Jung, Y. An Analysis of Effect of Green Roofs in Urbanized Areas on Runoff Alleviation and Cost Estimation. Seoul Inst. 2013, 14, 161–177. (In Korean) [Google Scholar]
- Lee, C.W.; Kim, S.; Moon, H.S. A Study on the Analysis of Temperature Reduction Effect by the Types of the Green Roof. J. Korean Hous. Assoc. 2011, 22, 25–33. (In Korean) [Google Scholar] [CrossRef] [Green Version]
- Hien, W.N.; Yok, T.P.; Yu, C. Study of Thermal Performance of Extensive Rooftop Greenery Systems in the Tropical Climate. Build. Environ. 2007, 42, 25–54. [Google Scholar] [CrossRef]
- Lee, D.H.; Lee, E.J.; Kim, J.H.; Yoon, D.Y. An Experimental Study on the surface Temperature Depending on Green Roof Vegetation. Korean Sol. Energy Soc. 2013, 11, 91–94. [Google Scholar]
- Dravigne, A.; Waliczek, T.M.; Lineberger, R.; Zajicek, J. The Effect of Live Plants and Window Views of Green Spaces on Employee Perceptions of Job Satisfaction. HortScience 2008, 43, 183–187. [Google Scholar] [CrossRef] [Green Version]
- Groenewegen, P.P.; Van den Berg, A.E.; De Vries, S.; Verheij, R.A. Vitamin G: Effects of Green Space on Health, Well-being, and Social Safety. BMC Public Health 2006, 6, 149. [Google Scholar] [CrossRef] [Green Version]
- Kim, S.B.; Chang, J.K. An Analysis of Environmental and Economic Benefits of Green Roof in Jung-Gu, Daegu. J. Environ. Sci. Int. 2007, 16, 603–610. [Google Scholar] [CrossRef] [Green Version]
- Vande Zande, R. The Advantages of a Rooftop Garden and Other Things. Int. J. Art Des. Educ. 2006, 25, 205–216. [Google Scholar] [CrossRef]
- Kim, Y.S.; Lee, B.; Lee, E.H. Temperature Reduction Effect of Herbaceous Plants for the Extensive Green Roofs Department of Horticulture, Graduate School of Seoul Women’s University. In Proceedings of the Conference of Korean Society of Environment and Ecology, Seoul, Korea, 24 November 2014; Volume 1, pp. 62–63. (In Korean). [Google Scholar]
- Lee, D.; Yoon, S.; Oh, S.; Jang, S. The Effect of Temperature Reduction as Influenced by Rooftop Greening. J. Korean Soc. Environ. Restor. Technol. 2005, 8, 34–44. (In Korean) [Google Scholar]
- Kim, J.H.; Yang, J.; Yoon, Y.H.; Joh, T.D. The Influence of Construction Types on the Psychological Effects of Users of Roof-top Green. J. Environ. Sci. Int. 2013, 22, 435–442. (In Korean) [Google Scholar] [CrossRef] [Green Version]
- McNair, D.; Lorr, M.; Droppleman, L. POMS Manual for the Profile of Mood States; Educational & Industrial Testing Service: San Diego, CA, USA, 1971. [Google Scholar]
- Lee, M.S.; Ka, J.N.; Kim, S.A.; Park, M.W.; Lee, J.W.; Park, B. Effect of Walking at the Urban Arboretums on Psychological Stability of Male University Students. J. Korean Soc. People Plants Environ. 2011, 14, 271–277. (In Korean) [Google Scholar]
- Kaplan, R. The Nature of the View From Home: Psychological Benefits. Environ. Behav. 2001, 33, 507–542. [Google Scholar] [CrossRef]
- Kim, J.H.; Yoon, Y.H. Economic Analysis and Energy Reduction by the Types of the Green Roof; The Seoul City Institute: Seoul, Korea, 2011; Volume 12, pp. 125–140. (In Korean) [Google Scholar]
- Wong, N.H.; Chen, Y.; Ong, C.L.; Sia, A. Investigation of Thermal Benefits of Rooftop Garden in the Tropical Environment. Build. Environ. 2003, 38, 261–270. [Google Scholar] [CrossRef]
- Wong, N.H.; Cheong, D.K.W.; Yan, H.; Soh, J.; Ong, C.; Sia, A. The Effects of Rooftop Garden on Energy Consumption of a Commercial Building in Singapore. Build. Environ. 2003, 35, 353–364. [Google Scholar] [CrossRef]
- Kim, J.H.; Lee, Y.J.; Oh, E.; Kim, S.; Kim, H. Economic Analysis and Energy Reduction by the Types of the Green Roof. In Proceedings of the Conference of Korean Society of Environment and Ecology, Seoul, Korea, 16 April 2010; Volume 2, pp. 197–200. (In Korean). [Google Scholar]
- Ozkeresteci, I.; Crewe, K.; Brazel, A.; Bruse, M. Use and Evaluation of the ENVI-met Model for Environmental Design and Planning: An Experiment on Linear Parks. In Proceedings of the 21st International Cartographic Conference (ICC), Durban, South Africa, 10–16 August 2003. [Google Scholar]
- Papadakis, G.; Tsamis, P.; Kyritsis, S. An Experimental Investigation of the Effect of Shading With Plants for Solar Control of Buildings. Energy Build. 2001, 33, 831–836. [Google Scholar] [CrossRef]
- Huttner, S.; Bruse, M. Numerical Modeling of the Urban Climate—A Preview on ENVI-met 4.0. In Proceedings of the 7th International Conference on Urban Climate (ICUC-7), Yokohama, Japan, 29 June–3 July 2009. [Google Scholar]
- Huttner, S. Further Development and Application of the 3D Microclimate Simulation ENVI-met. Ph.D. Thesis, Johannes Gutenberg-Universität, Mainz, Germany, 26 April 2012. [Google Scholar]
- Kim, D.; Jung, E.; Cha, J. Simulation of Changes in Nearby Thermal Environment According to Green Roof in Low-Rise Residential Area of Daegu. J. Korean Hous. Assoc. 2013, 24, 45–53. (In Korean) [Google Scholar]
- Kim, M.S.; Lim, J.H. Urban Thermal Environment Analysis of Songdo International City Using ENVI-met. In Proceedings of the Conference of Architectural Institute of Korea, Gyeong-ju, Korea, 25–27 October 2017; Volume 37, pp. 1014–1017. (In Korean). [Google Scholar]
- Kim, Y. Analysis of Thermal Environment Variation by Land Cover Using ENVI-Met—Focused on the Case of Konkuk University Campus; Konkuk University: Seoul, Korea, 2014. [Google Scholar]
- Seoul Metropolitan Government. 3D Spatial Data Systems (S-Map); Seoul Metropolitan Government: Seoul, Korea, 2019.
- Ahn, S.M.; Woo, J.H.; Zhang, A.L. A Study on the Application of ENVI-met for the Evaluation of the Atmospheric Environment by the Roof-Top Garden; Korean Meteorological Society: Seoul, Korea, 2011; pp. 314–315. [Google Scholar]
- Nadal, A.; Alamús, R.; Pipia, L.; Ruiz, A.; Corbera, J.; Cuerva, E.; Rieradevall, J.; Josa, A. Urban Planning and Agriculture. Methodology for Assessing Rooftop Greenhouse Potential of Non-residential Areas Using Airborne Sensors. Sci. Total Environ. 2017, 601, 493–507. [Google Scholar] [CrossRef] [PubMed] [Green Version]
Figure 1.
The first study site (Seoul National University, Seoul, Korea).

Figure 2.
The second study site—a major intersection at an outstation of Seoul National University.

Figure 3.
Model data for the Rhino 6 analysis and Grasshopper code. (a) Numerical map and modeling top view; (b) modeling perspective view.
Figure 3.
Model data for the Rhino 6 analysis and Grasshopper code. (a) Numerical map and modeling top view; (b) modeling perspective view.

Figure 4.
Model data for Site 1. (a) Building data; (b) soil data (roads and land); (c) 3D modelling data.
Figure 4.
Model data for Site 1. (a) Building data; (b) soil data (roads and land); (c) 3D modelling data.

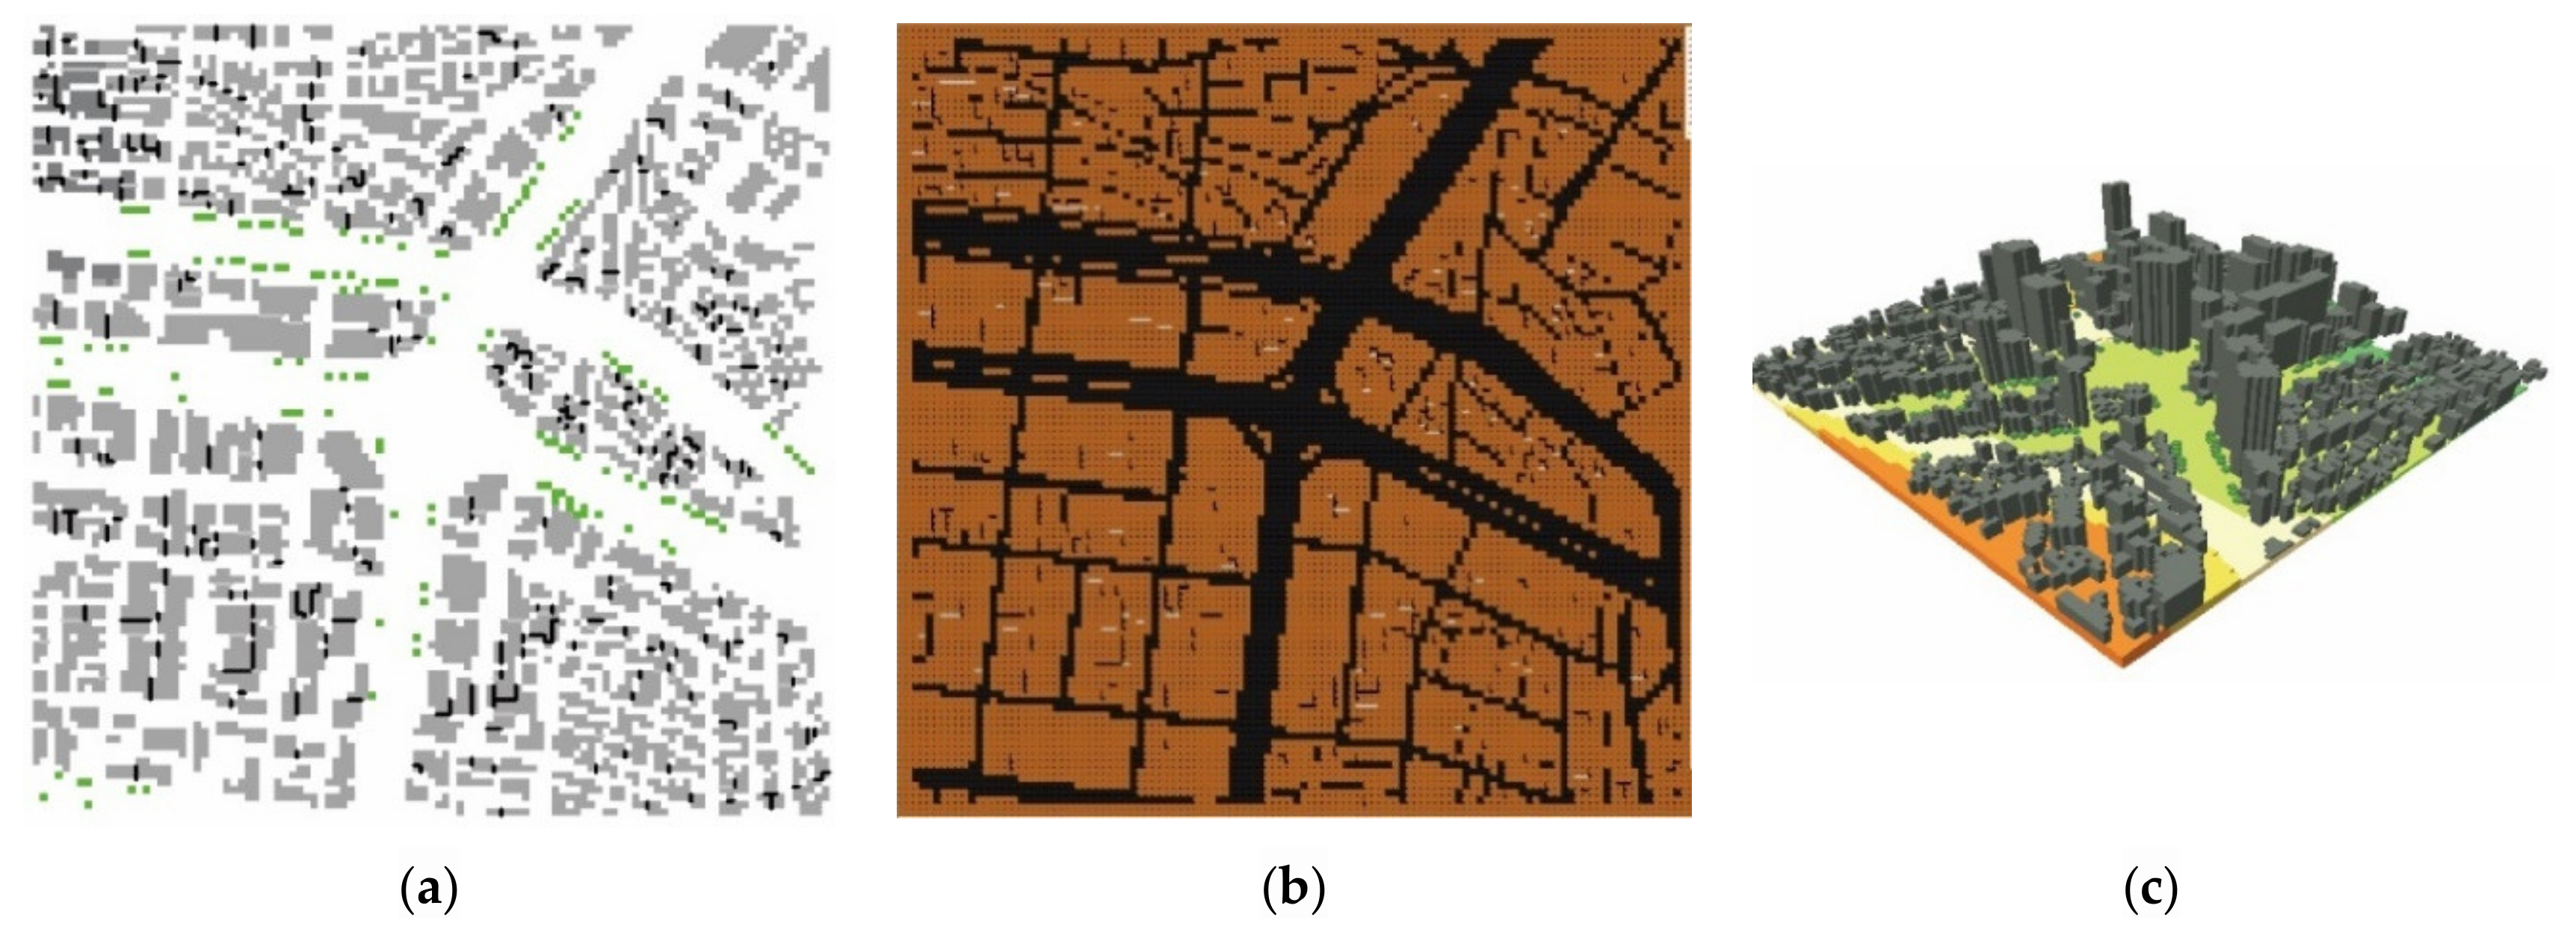
Figure 5.
Model data for Site 2. (a) Building and vegetation data; (b) soil data (roads and land); (c) 3D modelling data.
Figure 5.
Model data for Site 2. (a) Building and vegetation data; (b) soil data (roads and land); (c) 3D modelling data.

Figure 6.
Simulated data at 12:00 in the Target Site. (a) Seoul National University (temperature on 5 August); (b) National University Station (temperature on 5 August).
Figure 6.
Simulated data at 12:00 in the Target Site. (a) Seoul National University (temperature on 5 August); (b) National University Station (temperature on 5 August).

Figure 7.
Time zone simulation data before modeling the rooftop garden (Site 1). (10, 11, 12 (above), 13, 14, 15 (below).)
Figure 7.
Time zone simulation data before modeling the rooftop garden (Site 1). (10, 11, 12 (above), 13, 14, 15 (below).)

Figure 8.
Time zone simulation data before modelling rooftop garden (site 2) (4, 8, 12 (above), 16, 20, 24 (below)).
Figure 8.
Time zone simulation data before modelling rooftop garden (site 2) (4, 8, 12 (above), 16, 20, 24 (below)).

Figure 9.
Analysis of temperature reduction effect of roof garden by time zone at Seoul National University (10, 11, 12 (above), 13 14 15 (below)).
Figure 9.
Analysis of temperature reduction effect of roof garden by time zone at Seoul National University (10, 11, 12 (above), 13 14 15 (below)).

Figure 10.
Maximum temperature reduction and frequency of reduction of rooftop garden by time zone at Seoul National University.
Figure 10.
Maximum temperature reduction and frequency of reduction of rooftop garden by time zone at Seoul National University.

Figure 11.
Analysis of roof garden-induced temperature reduction by time zone at Seoul National University Station (6, 12 (above), 18, 24 (below)).
Figure 11.
Analysis of roof garden-induced temperature reduction by time zone at Seoul National University Station (6, 12 (above), 18, 24 (below)).

Figure 12.
Maximum temperature reduction and variation of reduction of rooftop garden by time zone at Seoul National University Station.
Figure 12.
Maximum temperature reduction and variation of reduction of rooftop garden by time zone at Seoul National University Station.

Figure 13.
Temperature-reduction analysis by rooftop type—extreme green rooftop, linear (longitudinal), (above)/linear (transverse) check pattern type, (below).
Figure 13.
Temperature-reduction analysis by rooftop type—extreme green rooftop, linear (longitudinal), (above)/linear (transverse) check pattern type, (below).

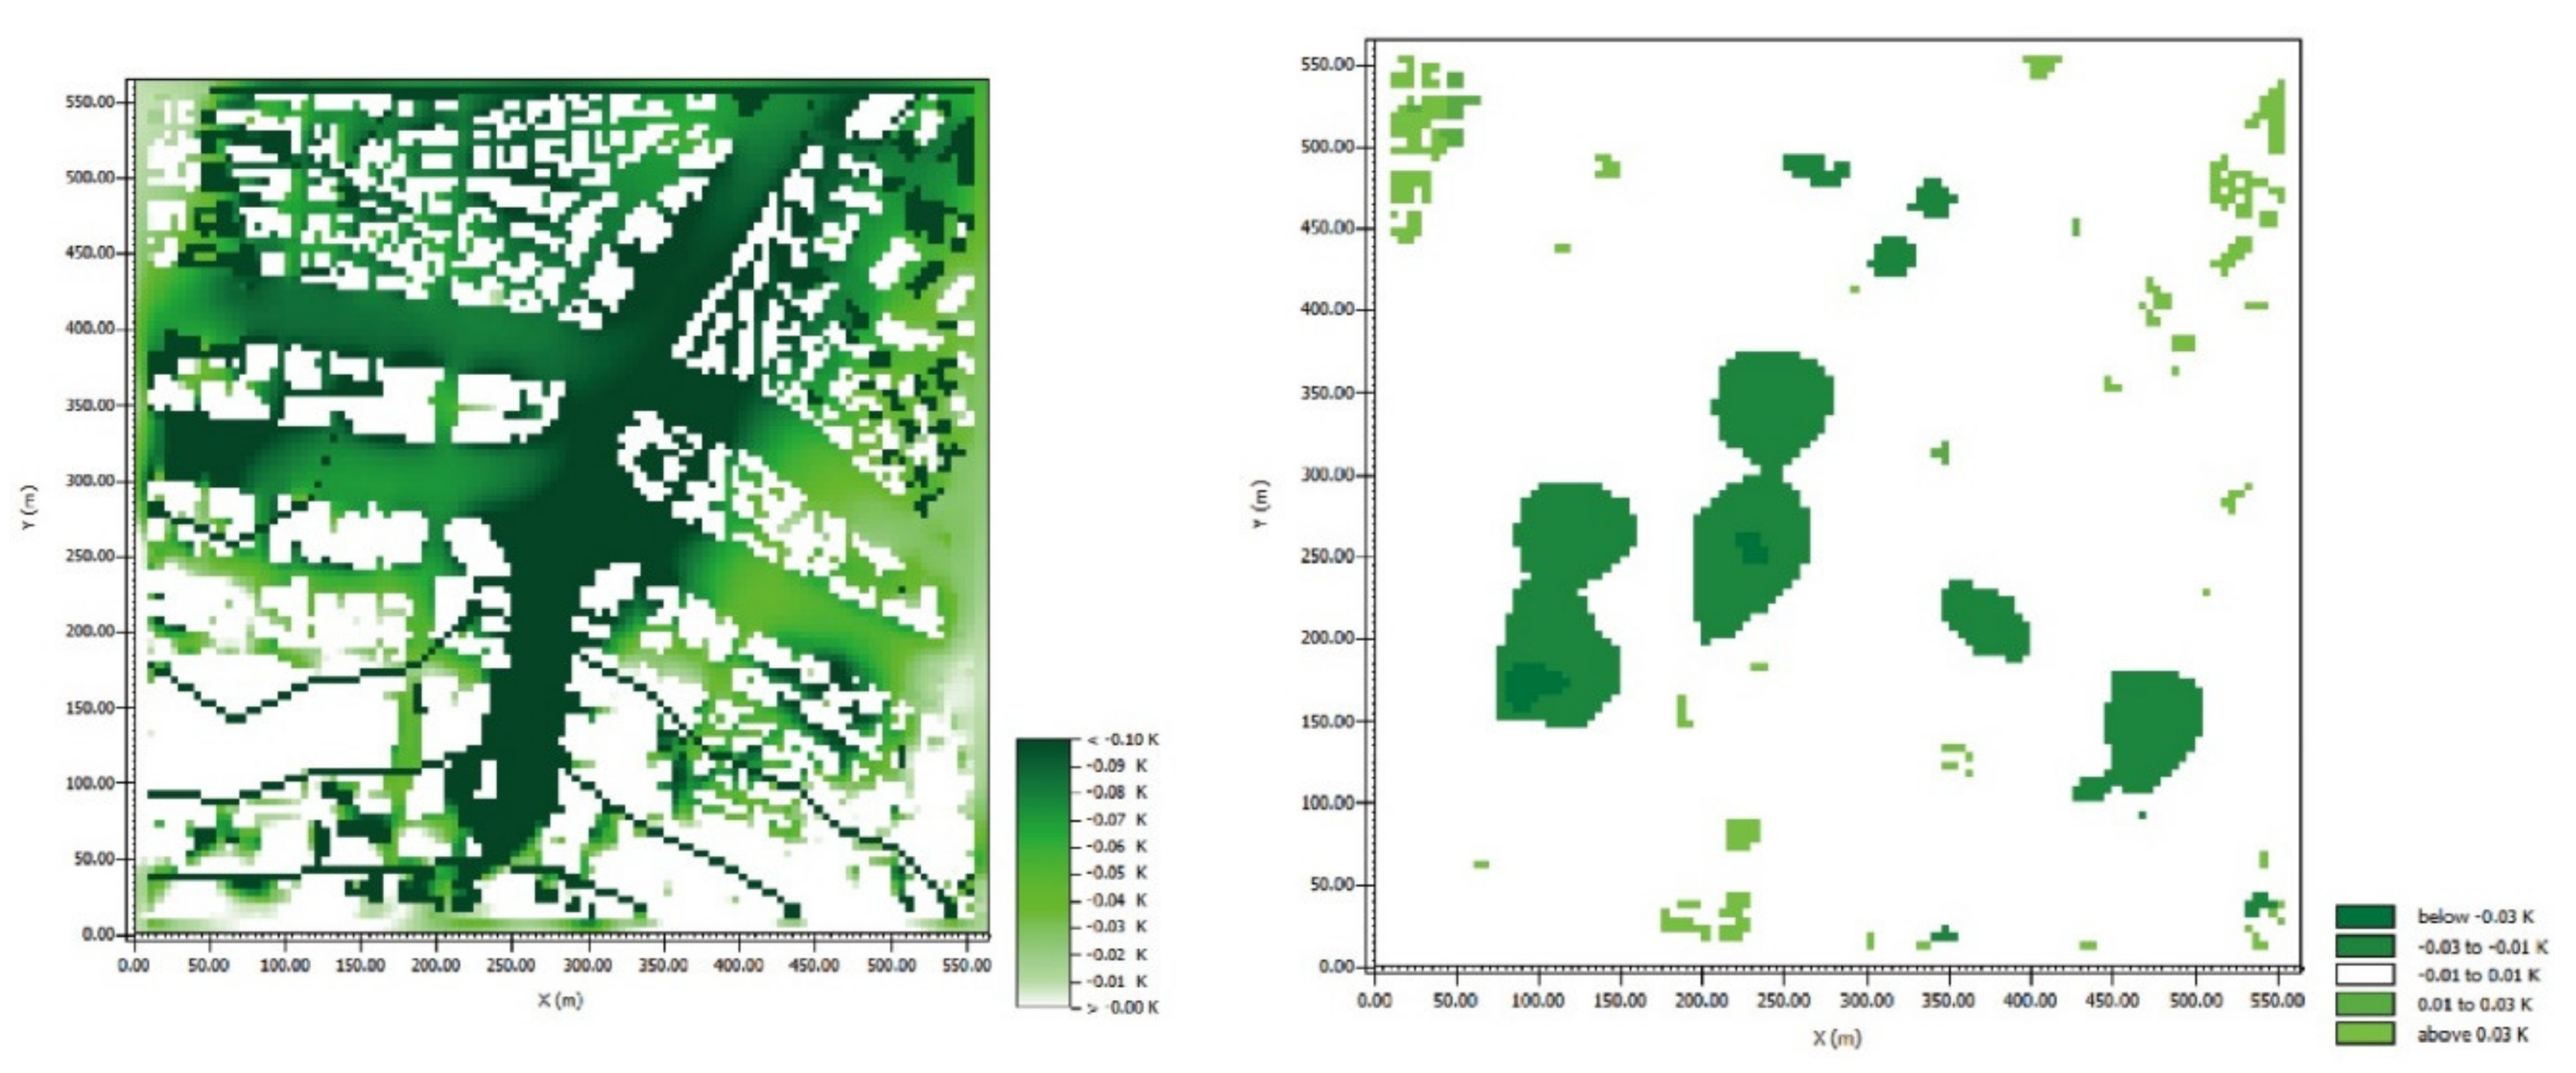
Figure 14.
Plotted data corresponding to 15:00 linear (longitudinal) temperature reduction effect result (left)/linear (longitudinal) extreme rooftop temperature reduction difference (right).
Figure 14.
Plotted data corresponding to 15:00 linear (longitudinal) temperature reduction effect result (left)/linear (longitudinal) extreme rooftop temperature reduction difference (right).


Table 1.
The five rooftop garden configurations tested.
| Extreme Rooftop Garden | Linear (Longitudinal) | Linear (Transverse) | Check Patterned | Unrealized Rooftop Garden |
|---|---|---|---|---|
 |  |  |  |  |
Table 2.
Target location model by type of rooftop garden at Seoul National University.
| Extreme Rooftop Garden | Linear (Longitudinal) | Linear (Transverse) | Check Patterned | Non-Rooftop Garden |
|---|---|---|---|---|
 |  |  |  |  |
Table 3.
Target location model considering type of rooftop garden at Seoul National University Station.
Table 3.
Target location model considering type of rooftop garden at Seoul National University Station.
| Extreme Rooftop Garden | Linear (Longitudinal) | Linear (Transverse) | Check Patterned | Non-Rooftop Garden |
|---|---|---|---|---|
 |  |  |  |  |
Table 4.
Maximum temperature reduction effect by type and time zone (unit: °C).
| Time | Type A | Type B | Type C | Type D | |
|---|---|---|---|---|---|
| Seoul National University | 10:00 | −0.32 | −0.32 | −0.28 | −0.22 |
| 11:00 | −0.27 | −0.27 | −0.23 | −0.19 | |
| 12:00 | −0.27 | −0.26 | −0.21 | −0.18 | |
| 13:00 | −0.24 | −0.23 | −0.18 | −0.17 | |
| 14:00 | −0.18 | −0.17 | −0.15 | −0.14 | |
| 15:00 | −0.22 | −0.21 | −0.20 | −0.17 | |
| Seoul National University Station | 10:00 | −0.67 | −0.63 | −0.43 | −0.41 |
| 11:00 | −0.76 | −0.74 | −0.51 | −0.46 | |
| 12:00 | −0.77 | −0.75 | −0.61 | −0.57 | |
| 13:00 | −0.68 | −0.66 | −0.58 | −0.51 | |
| 14:00 | −0.70 | −0.67 | −0.53 | −0.56 | |
| 15:00 | −0.89 | −0.88 | −0.66 | −0.68 |
Type A means extreme rooftop, Type B refers to longitudinal linear rooftop, Type C means transverse rooftop greening, and Type D means check patterned rooftop.
© 2020 by the authors. Licensee MDPI, Basel, Switzerland. This article is an open access article distributed under the terms and conditions of the Creative Commons Attribution (CC BY) license (http://creativecommons.org/licenses/by/4.0/).
Share and Cite
MDPI and ACS Style
Kim, J.; Lee, S.Y.; Kang, J. Temperature Reduction Effects of Rooftop Garden Arrangements: A Case Study of Seoul National University. Sustainability 2020, 12, 6032. https://0-doi-org.brum.beds.ac.uk/10.3390/su12156032
AMA Style
Kim J, Lee SY, Kang J. Temperature Reduction Effects of Rooftop Garden Arrangements: A Case Study of Seoul National University. Sustainability. 2020; 12(15):6032. https://0-doi-org.brum.beds.ac.uk/10.3390/su12156032
Chicago/Turabian StyleKim, Jaekyoung, Sang Yeob Lee, and Junsuk Kang. 2020. "Temperature Reduction Effects of Rooftop Garden Arrangements: A Case Study of Seoul National University" Sustainability 12, no. 15: 6032. https://0-doi-org.brum.beds.ac.uk/10.3390/su12156032
Note that from the first issue of 2016, this journal uses article numbers instead of page numbers. See further details here.