New Policy Framework with Plastic Waste Control Plan for Effective Plastic Waste Management


Environmental Resources Research, National Institute of Environmental Research, Hwangyeong-ro 42, Seo-gu, Incheon 404-708, Korea
*
Author to whom correspondence should be addressed.
Sustainability 2020, 12(15), 6049; https://0-doi-org.brum.beds.ac.uk/10.3390/su12156049
Submission received: 16 June 2020
/
Revised: 18 July 2020
/
Accepted: 25 July 2020
/
Published: 28 July 2020
(This article belongs to the Special Issue Waste Management and Application of the Principles of the Circular Economy)
Abstract
:With an increasing use of plastic, considerable plastic waste is generated, threatening the environment and public health. In particular, changes in living patterns in urban areas have significantly impacted the rate at which plastic waste increases every year. Thus, governments in many developed countries have implemented numerous policies to reduce plastic waste generation. Among them is the concept of circular economy that aims to protect the environment from plastic pollution and promote growth and innovation in industry and human life through overall changes in designing, producing, using, and recycling plastic products. The Korean government has implemented the Resource Circulation Act (RCA), which includes the concept of circular economy and resource efficiency policy for overall waste management. Following the concept of RCA, the Plastic Waste Control Plan (PWCP) was established for the comprehensive management of plastic waste. Therefore, this study introduces the goals and strategies of PWCP, which has a circulation system of four stages of production, consumption, discharge, and recycling, as well as the major roadblocks in the stages impeding the achievement of the goals and strategies. This study also suggests countermeasures at the government level for solving the major problems in the four stages.
1. Introduction
Due to their flexibility in terms of performance and processing, plastics are widely used in various industrial fields such as advanced electronic products, automobiles, construction, and disposable products. However, plastic waste treatment has emerged as one of the major concerns of the 21st century owing to the continued use of plastic. While most of the plastic wastes are landfilled or incinerated, they are unsustainable and a serious burden on the environment [1]. Furthermore, depending on the circumstances of each country, some plastic waste is illegally discarded or thrown off over mountain tops and in seas. If this continues, approximately 12 billion tons of plastic waste could be dumped in nature by 2050 [2]. Thus, to solve this environmental problem, numerous countries are employing varied strategic systems for effective utilization of plastic waste and promoting the technical use of plastic waste as recycled materials that can replace limited resources. This is done by converting it into plastic raw material and energy in the thermal or oil form through chemical decomposition [3,4,5,6]. These approaches may be similar to the transition to a resource circulation society wherein the concept of a circular economy is introduced [7].
The existing socioeconomic system comprises a linear economic structure of take–make–dispose. Thus, it has been limited in coping with the crisis of environmental problems and resource depletion. However, the circular economic structure can be considered an alternative in the socioeconomic system because it enables used resources to be retained in the socioeconomic system for a long time and waste in the disposal phase to be reused as secondary raw material or as energy to ensure the use of as little natural resources as possible [7,8]. Therefore, establishing a resource efficiency policy based on the circular economy concept is essential for effective plastic waste management. The European Union has adopted a plastic management strategy that includes three basic aims [9]: (1) to promote a circulation system, which includes designing plastic products, discharging after consumption, separating for collection, recycling the plastic products, and encouraging demand for recycled products; (2) to reduce the discarding and abandoning of plastic waste; and (3) to expand research and investment for the circulation system of plastics. This strategy was established as a comprehensive response to two of the 17 Sustainable Development Goals (SDGs) [10] released in 2015: “Ensure sustainable consumption and production patterns” (12th goal) and “Conserve and sustainably use the oceans, seas, and marine resources for sustainable development” (14th goal).
In Korea, the resource efficiency policy for general waste management has been underway. At the same time, the Ministry of Environment has established and implemented the Resource Circulation Act (RCA) [11] in line with the concept of UN SDGs. In addition, the 10-year Resource Circulation Master Plan (RCMP) [12], which includes mid-term and long-term policy directions and detailed strategies, was implemented to realize a circular economy. In 2018, the Plastic Waste Control Plan (PWCP) was established for effective plastic waste management based on the RCA and the RCMP [13]. In this plan, the plastic waste means a synthetic polymer compound waste according to Waste Control Act of Korea. It includes synthetic resin waste, synthetic rubber waste, polyvinyl chloride resin waste, polyurethane foam waste, aquaculture waste, synthetic resin foam waste, packaging waste, and fishing net waste [14]. This new plan has a strategy to establish a circular economy system for plastics and specifically aims to reduce the amount of plastic waste to less than 50% and recycle more than 70% of the plastic waste generated by 2030. Further, PWCP has three basic strategies to achieve the stated goals: (1) to re-establish production and consumption structures to reduce the amount of plastic waste generated; (2) to prepare a step-by-step improvement plan in the circulation system including production, consumption, discharge, and recycling stages; and (3) to reinforce the responsibilities of each agent such as government, municipalities, producers, and consumers.
2. Status of Plastic Waste in Korea
Waste in Korea is largely divided into two types: household type (HT) and industrial type (IT). HT waste is generated by human activities and includes product waste (plastic packaging materials, styrofoam, vinyl, etc.), food waste, waste oil, and animal carcasses. IT waste is generated through production or construction activities at industrial sites, e.g., waste synthetic polymers, process sludge, slag, dust, and waste catalysts. In particular, as shown in Table 1, construction waste, including earth and sand, waste bricks, waste concrete, waste wood, and waste reinforcing bars, generated during building or dismantling are managed separately within the IT.
Table 1 also shows that the total amount of waste generated in Korea was 156.8 million metric tons (MT) in 2017, a 20.0 MT increase from 2010, with an annual average increase of approximately 2.9 MT. Of this, HT waste was 12.4% and IT waste (construction type constituted 45.7%) was 87.6%. HT waste increased by about 0.23 MT per year, from 17.9 MT in 2010 to 19.5 MT in 2017, whereas IT waste increased by about 2.6 MT per year, from 118.8 MT in 2010 to 137.2 MT in 2017. This indicates that the increase in IT waste is more noticeable than HT because it is directly affected by increase in industrial production, expansion of economic activity, and changes in resource-intensive industries and economic structure. In particular, construction type waste is increasing due to rise in construction work, reconstruction, and redevelopment in metropolitan areas. In case of plastic waste, the total amount generated in 2017 was 7.4 MT, with an annual average increase of approximately 0.4 MT from 2010 to 2017. Here, Korea’s plastic waste generation in 2017 was compared with three developed countries (USA, Japan, and Germany). In the United States, plastics waste generation was 35.4 MT in 2017. Whereas, Japan and Germany produced around 9.03 MT and 6.2 MT of plastic waste in 2017, respectively [15,16,17]. This indicates that the generation scale of Korea is between Japan and Germany. HT plastic waste is generated through discarded packaging, beverage bottles, plastic household products, etc. Furthermore, IT plastic waste is generated through waste wires (covered with plastics), waste electrical and electronic products, polyvinyl chloride pipes, other waste synthetic polymer compounds generated in industrial processes, etc. The amount of HT and IT waste generated was 2.8 MT and 4.6 MT (the construction type amounting to approximately 0.5 MT, lower than the non-construction type that was 4.1 MT), respectively, as of 2017; the ratio of plastic waste within the total HT was approximately 14.4%, higher than the plastic waste ratio of 3.4% in IT. Moreover, there was an increase of approximately 1 MT and 1.7 MT for HT and IT, respectively, from 2010 to 2017, with an annual average increase of approximately 0.14 MT and 0.24 MT, respectively. Although the annual average increase of IT was higher than that of HT, the ratio of annual average increase of plastic waste within that of total waste in each type (e.g., HT with 0.14/0.23 = 0.61 and IT with 0.24/17.9 < 0.01 as of 2017) was higher for HT. This implies that the change of annual generation rate of plastic waste can be more affected by activities in human life than those in industrial production or construction, in contrast with the generation rate of total waste affected by industrial activities as mentioned above.
In case of the disposal method, as shown in Table 1, recycling of the total waste constituted the highest at 84.3% in 2017, followed by 9.5% of landfill and 6.2% of incineration. The annual average increase was 0.26 MT (incineration), 0.21 MT (landfill), and 2.39 MT (recycling), indicating the highest increase in recycling. Comparing the proportion of disposal methods in 2010 (incineration at 5.8%, landfill at 9.8%, and recycling at 84.4%) with those in 2017 (incineration at 6.2%, landfill at 9.5%, and recycling at 84.3%), a slight change was observed in incineration and landfill without much change in recycling. This means that the rate of increase in recycling is slowing down, while there is an increasing tendency to rely on incineration. The government has to constantly shift from landfill or incineration to recycling. However, it is difficult to increase the recycling rate of the entire waste because the generation amount of waste is steadily increasing. In detail, regarding HT waste, the proportion of recycling is maintained at 60% (e.g., the recycling volume was 11.7 MT in 2017, an increase of 1.25 MT compared with that in 2010). Conversely, recycling constituted 87.7% of the IT waste, higher than that of HT; in IT construction waste, recycling constituted 97–98%. Next, regarding the disposal method of plastic waste, recycling increased by 0.29 MT annually from 2010 (2.5 MT) to 2017 (4.5 MT), while incineration increased by 0.1 MT annually, and there was a little change in landfill during the same period. The changes between the proportion of disposal methods of plastic waste in 2010 (incineration at 38.3%, landfill at 8.5%, and recycling at 53.2%) and those in 2017 (incineration at 33.8%, landfill at 5.4%, and recycling at 60.8%) indicate a slow transition from incineration and landfill to recycling. Nevertheless, due to the increasing production and consumption of plastic products every year, there was little change in the plastic waste amount sent to landfill, and the amount of incineration shows an increasing tendency (from 1.8 MT in 2010 to 2.5 MT in 2017) along with that of recycling. In particular, regarding waste types, the recycling ratio of HT plastic waste was less than 50%, lower than that of IT (approximately 70% or more). Therefore, one of the key factors for increasing the recycling rate of plastic waste would be to manage HT plastic waste from discharge to final disposal effectively.
3. A New Policy Framework for Effective Plastic Waste Management: PWCP
3.1. RCA
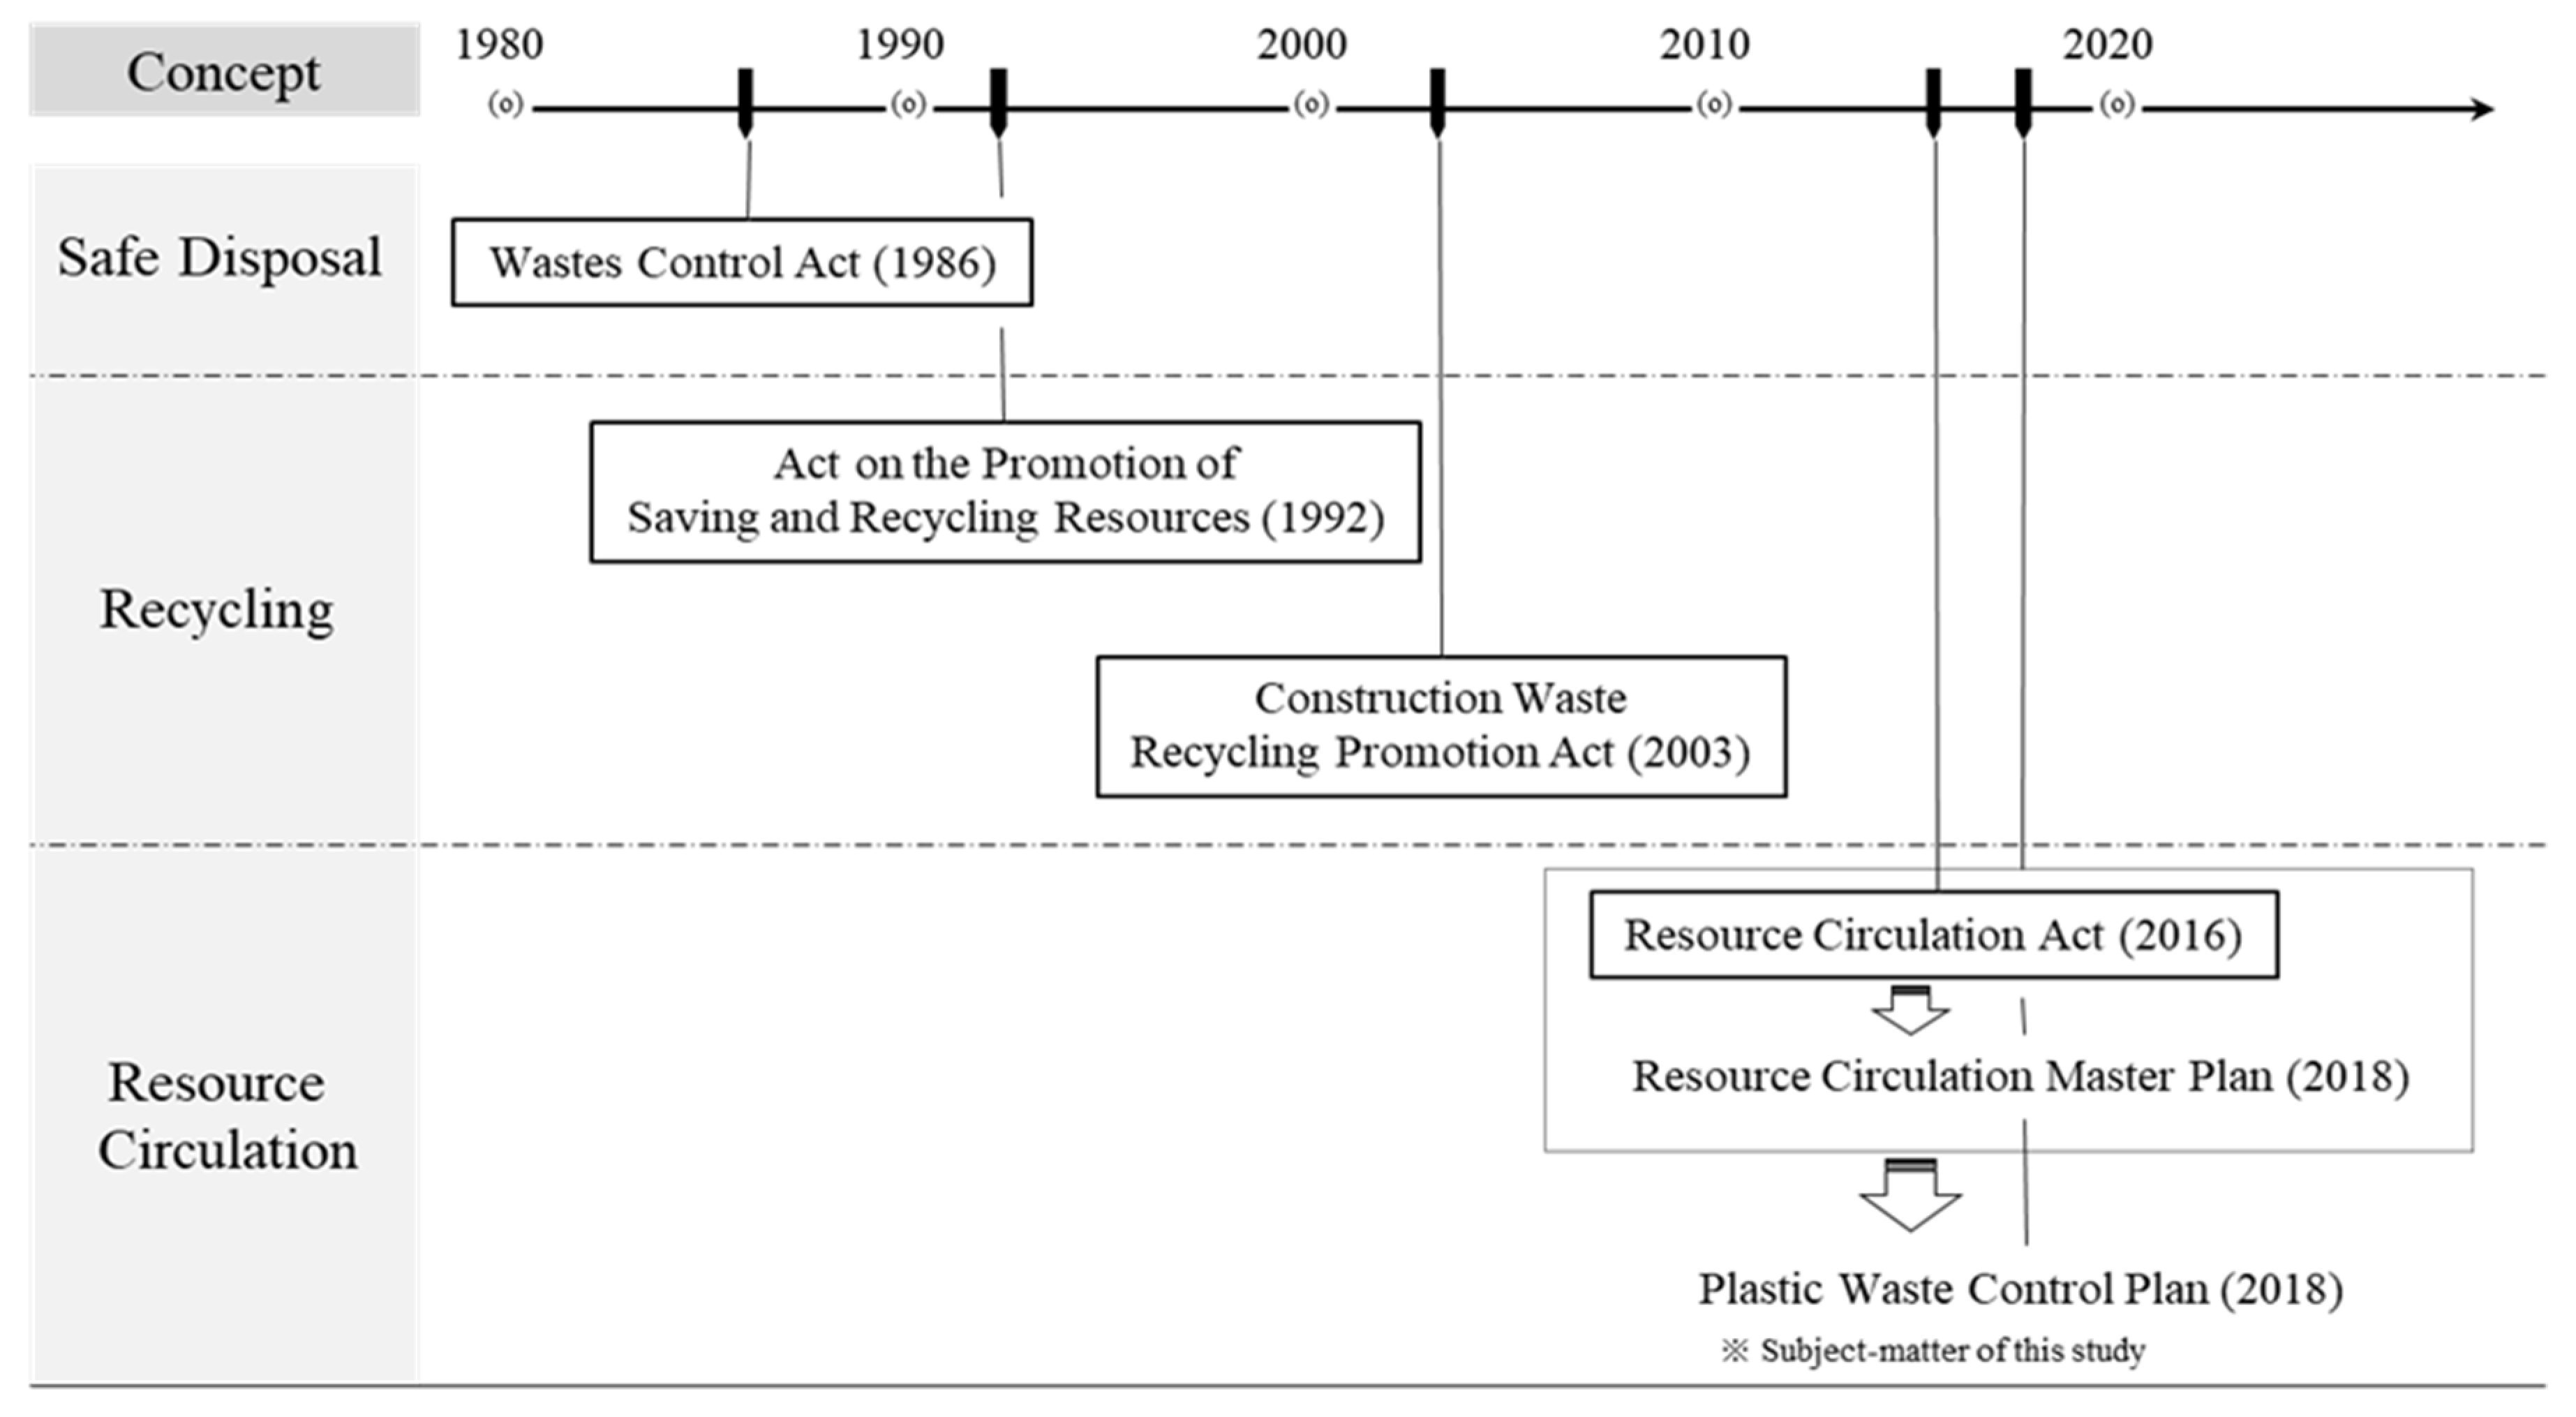
Waste policy in Korea began with the basic concept of “safe disposal” in the 1980s, which led to the Wastes Control Act, as shown in Figure 1 [18].
The idea of waste recycling began to be emphasized from the 1990s to the mid-2000s, thereby leading to the establishment of the Act on the Promotion of Saving and Recycling Resources [19] and the Construction Waste Recycling Promotion Act [20] to use recyclable waste as alternative resources. Since the mid-2000s, as the concept of “Resource Circulation” emerged, efforts have been made to shift from the simple quantitative system to a circulation system where the values of natural and waste resources are promoted. Finally, the RCA was established in May 2016 and implemented in January 2018 [21]. The RCA follows the concept of “resource circulation” to implement a circular economy with a circulation system of production, consumption, discharge, and recycling to minimize waste generation and maximize reuse and recycling instead of landfilling or simple incineration. This is expected to reduce the use of natural resources and non-renewable energy sources, which may help conserve the environment. Additionally, for realizing policy directions and detailed strategies of the RCA, a mid- or long-term RCMP was created in 2018 and will be implemented by 2027 [12]. It provides autonomous decision-making opportunities to each region through regional governance expansion. Moreover, it includes a plan to reduce conflicts between regions by establishing a system that enables the exchange of opinions and information between regions. The RCMP has set three main goals: reduction in waste generation to less than 20%, increase in the recycling rate from the existing 70.3% to 82%, and reduction in the final disposal rate from the existing 9.1% to 3.0%. To realize the main goals, three strategies are established as follows: (1) to divide the circulation system into four stages, namely, production, consumption, discharge, and recycling; (2) to reduce waste generation prior to recycling and produce high-quality recycled products; and (3) to optimize regional integrated waste management based on local governance easily accessible to the public. Table 2 shows three goals and three strategies of RCMP and their countermeasures in each circulation part of production, consumption, discharge, and recycling.
3.2. PWCP with the Concept of RCA
As mentioned in Section 2, two issues are associated with plastic waste. First, according to the increasing use of plastic every year, activities in human lives can affect the change of annual generation rate of plastic waste more than those in industrial production or construction. Second, there is no clear corresponding increase in the recycling rate (the increase may become stagnant), and the recycling rate of HT plastic waste is lower than that of IT. These two issues can be major hurdles in achieving the goals of the RCMP mentioned in Section 3.1. To solve this, there should be a plan that provides a turning point at which the dependence on incineration or landfill is reduced and the recycling rate is increased, and plastic products (packaging, styrofoam, vinyl, plastic bottles, etc.) used or discarded in human activities is better managed. Therefore, the Ministry of Environment, as indicated in Table 2, established in 2018 the PWCP to comprehensively manage plastic waste and plans to implement it by 2030 [13]. PWCP follows the concept of RCA and has three main strategies based on the basic framework of the RCMP: (1) to re-establish the production and consumption structures of plastic products wherein the generation of plastic waste is suppressed; (2) to introduce a circulation system with four stages, like RCMP, and prepare the improvement plan (countermeasures) for each stage to minimize the waste generation and maximize the recycling stage; and (3) to reinforce the accountability of each participant (government, local government, producer, consumer, etc.) in the circulation system. These strategies are expected to achieve two goals: reduce current generation of plastic waste by more than 50% by 2030 and reuse or recycle more than 70% of the plastic waste as raw materials or recycled products through the recycling stage.
To follow the goals and strategies presented in the PWCP, identifying the major problems that block the circulation system with four stages (production, consumption, discharge, and recycling) is necessary. First, in the production stage of the plastic product, to entice consumers, a color may be added to the raw material to give attractive visual effects. It is also possible to attach labels that are difficult to be detached from the surface of a plastic product. In some cases, products are manufactured using the mixture of various raw materials. These practices make recycling difficult. For these reasons, in case of plastic packaging, the guidelines for improving the material and structure of the body, label, cap, and others are suggested and implemented, as indicated in Table 3.
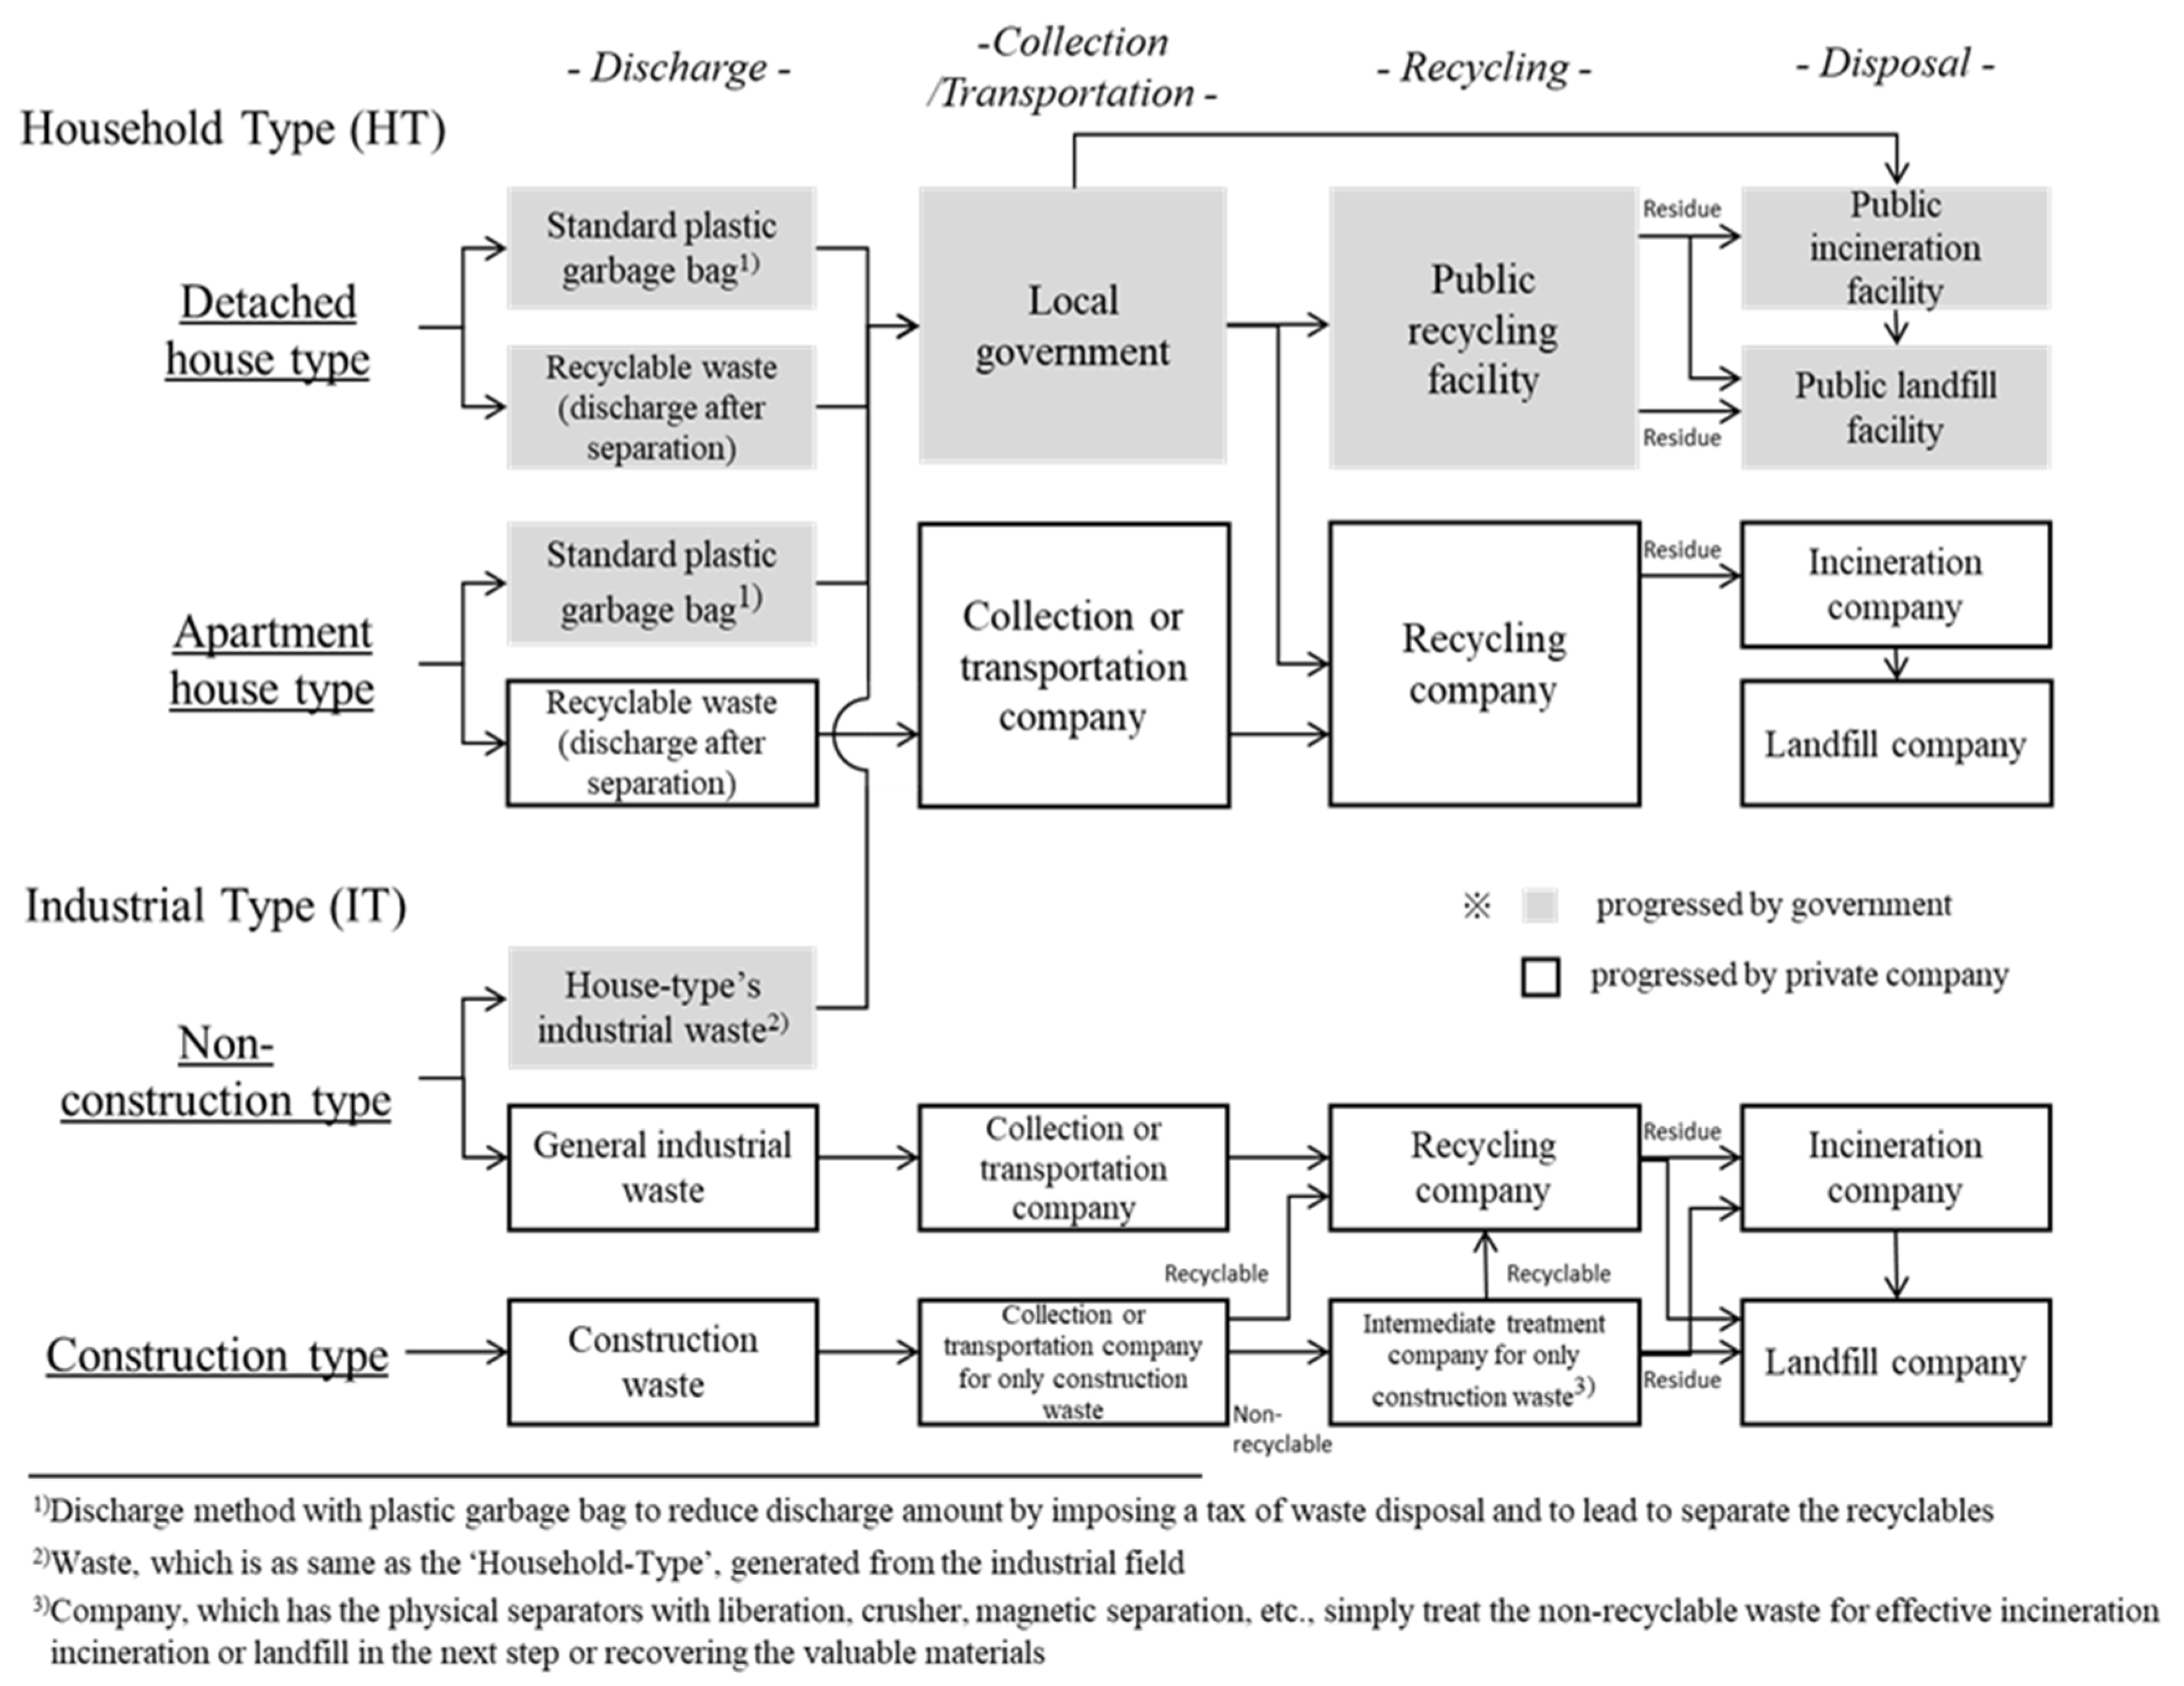
Here the plastic packaging is classified into three grades, in terms of whether it is suitable for recycling by dividing the evaluation for the materials and structures. Grades 1 and 3 make a distinction between the packaging whose material and structure are suitable or unsuitable for recycling. The packaging in Grade 2 is not recyclable but is inevitably used; consumers are recommended to refrain from using it. Despite such efforts by the government, the ratio of packaging with Grade 1 was generally low; in particular, Grade 1 of polyethylene terephthalate (PET) bottles was as low as approximately 2% as of 2015. Second, in the consumption stage, numerous changes have occurred in consumption patterns, such as increased one-person households, diversified consumer age groups, and dependence on online shopping. Due to these changes, a practice such as the use of consumable and unnecessary overpacking has led to increased plastic waste. For example, disposable cups increased from 19.1 billion (2009) to 27.5 billion (2015), and plastic bags increased from 17.6 billion (2009) to 21.1 billion (2015). Third, in the discharge stage, there is a distinction between the discharge and collection parts. In the discharge part, HT plastic waste is dependent on the disposal system using standard plastic garbage bags to reduce discharge amount by imposing waste disposal tax and lead the separation of recyclables. However, the convenience of standard plastic garbage bag can also hinder the growth of waste recycling. For example, there have been many cases wherein considerable foreign material was mixed with recyclable plastic waste and thrown into the garbage bag frequently. Even small amounts of contaminants (such as PET bottles containing cigarette butts) can reduce recycling rate because of the high cost and complicated process required in separating them during the recycling stage. In the collection part, as shown in Figure 2, the collection for HT waste from the detached house is processed by the government after discharging into the two types of standard plastic garbage bags and recyclable waste, while recyclable waste from apartments (except standard plastic garbage bag) is handled by private companies. In case of IT, all the collection processes, except house-type industrial waste, are processed by private companies. It indicates that, as waste collection is more dependent on private companies than the government, the collection system may be affected if private companies refuse to collect it. For example, considerable plastic waste has flowed into Korea since the Chinese import ban [21,22]. In contrast, the volume of plastic waste exported from Korea has declined sharply, leading to an accumulation of domestic plastic waste. This phenomenon has led to a drop in the price of raw plastic materials for recycled plastic products and ultimately to private companies refusing to collect waste. Finally, in the recycling stage, plastic waste was not properly recycled when the recycling industry had trouble making profits. As shown in the part about recycling in Figure 2, the government does some of the recycling in public recycling facilities, but it is limited to only HT waste from detached houses (some are entrusted to private recycling companies). As most of this waste relies on private companies, recycling cannot but be sensitive to the profitability of the recycling industry. Profitability is subject to change due to several important factors. It can be influenced by changes in raw material prices sensitive to international price. Rising costs of the intermediate treatment before recycling in IT construction waste can affect profitability. Further, it may also be sensitive to other factors such as the limited demand market of recycled products, commercialization of recycling-related technologies, environmental stability of recycled products, and public perception.
4. Countermeasures in Four Stages for Achieving Their Goal and Strategies in PWCP
To address the major problems impeding the goals and strategies of the PWCP presented in Section 3.2, the countermeasures in four stages with production, consumption, discharge, and recycling are presented in Table 2. The production stage focused on designing recycling-oriented products and strengthening the producer responsibility for recycling. The consumption stage focused on simplifying packaging and minimizing the use of disposable products. The discharge stage focused on improving the separation and discharge systems and strengthening public management. The recycling stage focused on stabilizing the recycling market, expanding the demand for recycled products, and securing the environmental stability of recycled products. Details of each stage are presented below.
4.1. Production Stage
To reduce the amount of plastic waste generated, in the first stage of circulation system, three basic countermeasures must be suggested. The first countermeasure is to phase out difficult-to-recycle products. The second is to ensure that products, which can be recycled with a simple operation after discharge, are designed as such before the manufacturing process. The third is to strengthen the producer responsibility system wherein producers are mandated to recycle plastic waste. For example, plastic packaging, especially PET bottles used in Korea are composed of different materials with the body made of PET, lid of polypropylene (PP), and label of polystyrene (PS), which leads to difficulties in the recycling stage. Although the material and structure of packaging are systematically evaluated and producers are mandated to follow the guidelines in Table 3, new guidelines (including revised existing guideline in Table 3) must be provided for the unification of materials used in the plastic packaging. Further, the government recommends the following manufacturing direction to improve producers’ design for recycling, composition as a single material, quality of adhesive, and simple treatment method for recycling after use and discharge. For producers who have not implemented this recommendation, the government plans to apply the Resource Circular Assessment wherein the products that are harmful to the environment and detrimental to recycling are identified after evaluation and barred from being used in the future. This assessment has four items of evaluation: circular availability and adequate disposal; prediction of weight, volume, material quality, and composition of waste expected after use and disposal; existence of hazardous substances and their characteristics; and durability. It targets frequently used products, such as PET bottles (for beverages and detergents), foamed synthetic resin products, polyvinyl chloride (PVC) wraps, and PP, polyethylene (PE), and PS bottles. For example, in the case of circular availability and adequate disposal (first item), the plastic products should be evaluated with the guideline, as shown in Table 4, in Resource Circular Assessment.
Next, to reinforce the producer’s responsibility for recycling, the list of items (plastic products) subject to the recycling cost of the manufactured plastic product shared by the producer is to be expanded. Moreover, the producer’s responsibility can also be reinforced by improving the method of estimating the recycling fulfillment rates. In the past, the values of fulfillment rate (D/C) calculated according to the recycling amount (D) compared with the mandatory recycling amount (C) were relatively higher than 100%, and D/C led to lower contributions paid by the producers. However, the values of improved fulfillment rate (D/A) determined by the recycling amount (D) compared with the directly applied manufacturing output (A) are relatively lower than existing values (referring to the comparison of existing and improved fulfillment rate in Table 5), and D/A leads to increased contributions.
4.2. Consumption Stage
The consumption stage focuses primarily on countermeasures to regulate disposable products and packaging wastes generated during consumption. In an offline system, if the products are included in the list of items currently subject to overpacking regulations, the producers are mandated to apply the standards outlined in Table 6 before releasing the overpacked goods.
For online products, new guidelines and legal standards on the prevention of overpacking are needed for the transport-packaging materials used by online markets and parcel delivery companies. Next, in case of disposable products, the primary focus was on reducing the usage of disposable cups. Previously, the disposal cost of the disposable cup was shared by the consumer (of course, when it was returned, the cost was refunded) through the Disposable Cup Deposit System promoted by the brand and the coffee shop to recover disposable cups discharged out of the store. However, it was soon abolished due to the following limitations: raising questions about effectiveness of the system due to the low rate of return, opaque management of the disposal cost paid by a consumer, and absence and controversy about the legal basis of this system. To solve these problems, a framework with new a legal basis for the Disposable Cup Deposit System was established and additional measures, such as expansion of public facilities, introduction of the unmanned collection box, and integrated management of the disposal cost by a third public institution, were suggested. Additionally, disposable cups are defined as regulated items (and will be phased out in the future), as well as plastic straws, cotton swabs, stirrers, spoons, and bags.
4.3. Discharge Stage
The discharge stage is primarily focused on countermeasures to improve the separation rate (the rate that recyclable waste is separated from contaminant or foreign substance) by the discharger prior to discharge and strengthen the management of local government in the collection process. To improve the separation rate, on-site inspections in each region are strengthened by evaluating discharger’s activities by checking the condition of recyclable waste in the discharge stage. It also ensures correct discharge procedure through guidelines (providing separation and discharge methods, removal method of foreign substances, and list and standard of prohibited contaminant) and government-led public relations. In the areas where waste collection is poorly done, a plan is underway to provide a dedicated custodian and secure an exclusive collection site to store for a long duration. Moreover, the role of local governments is strengthened significantly, unlike the existing collection system that was dependent on private companies. For example, as shown in Figure 2, public management is expanded to the recyclable plastic waste of an apartment in HT. In case of IT waste, the role of local governments is strengthened sequentially from the general industrial plastic waste to the construction type. This is expected to provide a quick response at the government level in the event of problems with the collection system, such as the event (private companies refusing to collect) caused by the ban on import of plastic waste by China, as mentioned in Section 3.2.
4.4. Recycling Stage
In the recycling stage, countermeasure priority is given to the guaranteed profitability of the recycling industry, revitalization of the market demand of recycled products, government support for commercialization of recycling technology, and securement of environmental stability of recycled products. For approaching the four countermeasures, the following six measures have been proposed. First, to stabilize the recycling market, an exclusive organization is formed to analyze current trends in transboundary movement of plastic waste, changes in international price, and values of recycled products (or plastic raw materials) in the domestic market. This is expected to ensure the profitability of the recycling industry. Second, if there is a concern about the accumulation of recycled plastic products or raw materials in the recycling market due to an international event, such as the ban on import by China, domestic market recession, and demand chain problems of recycled products, the government will purchase and store them by using the storage system. Third, with a government’s initiative, the plastic waste generated in Korea should be reused or recycled in the domestic recycling industry as a priority by strengthening import controls on the transboundary movement of plastic waste, and related companies are encouraged to raise the output of recycled products. Fourth, to increase the market demand of recycled products, the government activates public projects that utilize recycled products and take preferential measures, such as reducing the amount of contributions paid by producers, for companies that use recycled products. Fifth, the government encourages venture companies to develop and commercialize recycling technology and comes up with a national mid- to long-term research and development (R&D) roadmap that leads to the quality improvement of the recycled product or raw material. Sixth, the environmental stability of recycled products can be ensured by using a strategic environmental assessment, which is a new policy framework for effective waste management in Korea [23]; the concept of this framework pursues important strategies toward waste reduction, preservation of landfill area, stabilization and removal of hazardous substance in wastes, and optimal treatment for energy and material recovery from wastes.
5. Conclusions
Since the waste policy in Korea began with the Waste Control Act enacted in the 1980s, it was followed by the RCA, including the concept of a circular economy and a resource efficiency policy, established in 2016 and implemented in 2018. RCA is expected to conserve the environment by reducing the use of natural resources and non-renewable energy sources and allow our society to advance into a resource circulation society. Further, to realize this, the RCMP was also formed with three main goals: reducing waste generation, increasing recycling rate, and reducing final disposal rate. The entire process in RCMP is presented through the circulation system with four stages of production, consumption, discharge, and recycling.
To achieve the goals of the RCMP, the current status of plastic waste can be a major hurdle. From the status of plastic waste generation and disposal (landfill, incineration, recycling, etc.), two issues can be identified. First, despite the annual increase in the manufacturing of plastic products, recycling rates have recently been stagnant. Second, the recycling rates for HT plastic waste generated through human activities are lower than those for industrial sites. Therefore, to address these issues, the PWCP was established, following the concept of RCA and the basic framework of the RCMP (circulation system with four stages), and it is expected to reduce more than 50% of the amount of plastic waste generation and allow more than 70% of the generated plastic waste to be reused or recycled as raw materials and recycled products via the recycling stage.
In the PWCP, the major problems that block the circulation system with production, consumption, discharge, and recycling stages are identified; major problems include the design and manufacture of difficult-to-recycle plastic products, overpacking, use of disposable products, high dependence on private companies in the processes from discharge of waste to collection, transportation, recycling, final disposal, and difficulty in maintaining profitability of the recycling industry. To address these problems, the PWCP proposes countermeasures for each stage. Countermeasures in the production stage include designing and manufacturing recycling-oriented products and strengthening producers’ responsibility system. In the consumption stage, the countermeasure is to regulate packaging and disposable products, and the discharge stage is to improve the separation rate of the discharger prior to discharge and strengthen the management of local government. Finally, in the recycling stage, countermeasures include ensuring the profitability of the recycling industry, revitalizing market demand for recycled products, commercializing recycling technologies, and securing environmental stability.
Author Contributions
The authors confirm contribution to the paper as follows: data curation, data collection, and basic investigation: Y.-J.K. and N.-H.C.; project administration: T.-W.J.; draft manuscript preparation and writing: S.-K.S.; analysis, interpretation of results, writing-review, and editing: N.U. All authors have read and agreed to the published version of the manuscript.
Funding
This work was supported by a grant from the National Institute of Environmental Research (NIER), funded by the Ministry of Environment (MOE) of the Republic of Korea (NIER-RP2018-087).
Acknowledgments
The authors acknowledge the research support provided by the Ministry of Environment (MOE) of the Republic of Korea. Also, the authors would like to thank Enago (www.enago.co.kr) for the English language review.
Conflicts of Interest
The authors declare no conflict of interest.
References
- Moharir, R.V.; Kumar, S. Challenges associated with plastic waste disposal and allied microbial routes for its effective degradation: A comprehensive review. J. Clean. Prod. 2019, 208, 65–76. [Google Scholar] [CrossRef]
- Geyer, R.; Jambeck, J.R.; Law, K.L. Production, use, and fate of all plastics ever made. Sci. Adv. 2017, 3, e1700782. [Google Scholar] [CrossRef] [PubMed] [Green Version]
- Faraca, G.; Astrup, T. Plastic waste from recycling centres: Characterisation and evaluation of plastic recyclability. Waste Manag. 2019, 95, 388–398. [Google Scholar] [CrossRef] [PubMed]
- Milios, L.; Christensen, L.H.; McKinnon, D.; Christensen, C.; Rasch, M.K.; Eriksen, M.H. Plastic recycling in the Nordics: A value chain market analysis. Waste Manag. 2018, 76, 180–189. [Google Scholar] [CrossRef] [PubMed]
- Rajmohan, K.V.S.; Ramya, C.; Viswanathan, M.R.; Varjani, S. Plastic pollutants: Effective waste management for pollution control and abatement. Curr. Opin. Environ. Sci. Health 2019, 12, 72–84. [Google Scholar] [CrossRef]
- Xu, Q.; Xiang, J.; Ko, J.H. Municipal plastic recycling at two areas in China and heavy metal leachability of plastic in municipal solid waste. Environ. Pollut. 2020, 260, 114074. [Google Scholar] [CrossRef] [PubMed]
- Rossi, E.; Bertassini, A.C.; Ferreira, C.S.; Amaral, W.A.N.; Ometto, A.R. Circular economy indicators for organizations considering sustainability and business models: Plastic, textile and electro-electronic cases. J. Clean. Prod. 2020, 247, 119–137. [Google Scholar] [CrossRef]
- Korhonen, J.; Nuur, C.; Feldmann, A.; Birkie, S.E. Circular economy as an essentially contested concept. J. Clean. Prod. 2018, 175, 544–552. [Google Scholar] [CrossRef]
- European Commission. A European Strategy for Plastics in a Circular Economy. 2018. Available online: https://ec.europa.eu/commission/publications/factsheets-european-strategy-plastics-circular-economy_en (accessed on 10 May 2020).
- United Nations. Transforming Our World: The 2030 Agenda for Sustainable Development. 2016. Available online: https://www.mmv.org/newsroom/publications/transforming-our-world-2030-agenda-sustainable-devevelopment?gclid=EAIaIQobChMIpNT82qC85wIVEXZgCh056QNPEAAYASAAEgLIGfD_BwE (accessed on 10 May 2020).
- Ministry of Environment. Resource Circulation Act (Ver. Korean). 2019. Available online: http://www.law.go.kr (accessed on 10 May 2020).
- Ministry of Environment. Resource Circulation Master Plan (Ver. Korean). 2018. Available online: http://www.me.go.kr/home/web/policy_data/read.do?menuId=10259&seq=7193 (accessed on 10 May 2020).
- Ministry of Environment. Plastic Waste Control Plan (Ver. Korean). 2018. Available online: http://www.me.go.kr/home/web/board/read.do?boardMasterId=1&boardId=862300 (accessed on 10 May 2020).
- National Institute of Environmental Research. Waste Classification System and Method Manual (Ver. Korean). 2017. Available online: http://dl.nanet.go.kr/SearchDetailView.do?cn=MONO1201757971 (accessed on 10 May 2020).
- Handelsblatt. How Germany’s Recycling Ends up in Malaysian Dumps. 2019. Available online: https://www.handelsblatt.com/today/politics/the-plastic-trail-how-germanys-recycling-ends-up-in-malaysian-dumps-/24037020.html (accessed on 10 May 2020).
- Shibata, N. Plastic Recycling Attracts Investment in Japan after China Ban. Nikkei Asian Review 2019. Available online: http://www.asia.nikkei.com (accessed on 10 May 2020).
- United States EPA (Environmental Protection Agency). Plastics: Material-Specific Data. Available online: www.epa.gov (accessed on 10 May 2020).
- Ministry of Environment. Wastes Control Act (Ver. Korean). 2018. Available online: http://www.law.go.kr (accessed on 10 May 2020).
- Ministry of Environment. Act on the Promotion of Saving and Recycling Resources (Ver. Korean). 2019. Available online: http://www.law.go.kr (accessed on 10 May 2020).
- Ministry of Environment. Construction Waste Recycling Promotion Act (Ver. Korean). 2020. Available online: http://www.law.go.kr (accessed on 10 May 2020).
- Brooks, A.L.; Wang, S.; Jambeck, J.R. The Chinese import ban and its impact on global plastic waste trade. Sci. Adv. 2018, 4, eaat0131. [Google Scholar] [CrossRef] [PubMed] [Green Version]
- Wang, C.; Zhao, L.; Lim, M.K.; Chen, W.Q.; Sutherland, J.W. Structure of the global plastic waste trade network and the impact of China’s import Ban. Resour. Conserv. Recycl. 2020, 153, 104591. [Google Scholar] [CrossRef]
- Um, N.; Kang, Y.Y.; Kim, K.H.; Shin, S.K.; Lee, Y. Strategic environmental assessment for effective waste management in Korea: A review of the new policy framework. Waste Manag. 2018, 82, 129–138. [Google Scholar] [CrossRef] [PubMed]
Figure 1.
Flow of waste policy with the concepts of safe disposal, recycling, and resource circulation in Korea (Ministry of Environment, 2019a; Ministry of Environment, 2018b; Ministry of Environment, 2018c; Ministry of Environment, 2019a; Ministry of Environment, 2019b; Ministry of Environment, 2020).

Figure 2.
Process flowchart from the discharge of waste to collection, transportation, recycling, and disposal.
Figure 2.
Process flowchart from the discharge of waste to collection, transportation, recycling, and disposal.


Table 1.
Generation and disposal amount of waste and the ratio of plastic waste.
| MT (1)/Year | |||||||||||
|---|---|---|---|---|---|---|---|---|---|---|---|
| 2010 | 2011 | 2012 | 2013 | 2014 | 2015 | 2016 | 2017 | ||||
| Generation | Household Type (HT) | 17.9 (2) (1.8) (3) | 17.9 (1.8) | 17.9 (2.1) | 17.8 (2.1) | 18.2 (2.2) | 18.7 (2.2) | 19.6 (2.6) | 19.5 (2.8) | ||
| Industrial Type (IT) | Non construction | 53.8 (2.6) | 54.0 (2.8) | 58.0 (3.5) | 58.7 (3.3) | 60.7 (3.6) | 61.6 (4.0) | 64.2 (4.0) | 65.6 (4.1) | ||
| Construction | 65.0 (0.3) | 68.0 (0.4) | 68.1 (0.5) | 67.0 (0.16) | 67.7 (0.6) | 72.4 (0.6) | 72.8 (0.5) | 71.6 (0.5) | |||
| Disposal | Incineration | 7.9 (1.8) | 8.7 (2.1) | 9.2 (2.4) | 8.9 (2.3) | 8.9 (2.3) | 9.3 (2.4) | 9.7 (2.4) | 9.7 (2.5) | ||
| Landfill | 13.4 (0.4) | 13.4 (0.3) | 13.5 (0.4) | 13.5 (0.3) | 13.9 (0.3) | 13.9 (0.3) | 13.9 (0.4) | 14.9 (0.4) | |||
| Recycling | 115.4 (2.5) | 117.8 (2.6) | 121.3 (3.3) | 124.1 (3.4) | 123.8 (3.8) | 129.5 (4.1) | 133 (4.3) | 132.1 (4.5) | |||
(1) Million metric tons; (2) Sum of all types of waste; (3) Amount of only plastic waste.
Table 2.
Comparison of goal, strategy, and countermeasures between Resource Circulation Master Plan (RCMP) and Plastic Waste Control Plan (PWCP) [12,13].
| Resource Circulation Master Plan (RCMP) from 2018 to 2027 | Plastic Waste Control Plan (PWCP) from 2018 to 2030 | ||
|---|---|---|---|
| Goal | - 20% reduction in waste generation - Circulation rate: 70.3 (existing) → over 82% - Final disposal rate: 9.1 (existing) → under 3.0% | - Reduction of plastic-waste generation under 50% - Recycling of generated plastic-waste over 70% (recycling ratio) | |
| Strategy | - Establish a circulation system with a life cycle including production, consumption, discharge, and recycling - Reduce waste generation and promote recycling of high-quality materials - Optimize regional waste disposal based on public participation governance | - Re-establish the production and the consumption structures of plastic products to suppress plastic-waste generation - Improve four stages (production, consumption, discharge, and recycling) of circulation system to expand plastic-waste recycling limits - Reinforce the accountability of each of the participants such as government, local government, producer, and consumer | |
| countermeasures | Production | - Enhancement of resource productivity by industry - Promotion of waste reduction in the production stage - Product design considering resource circulation | - Phasing out difficult-to-recycle products - Design of recycling-oriented product - Strengthening of producer responsibility |
| Consumption | - Suppression of waste in living - Promotion of resource-efficient and eco-friendly consumption - Creating and spreading a culture with a resource circulation concept | - Minimization of packaging in distribution part - Minimization of the use of disposable product in consumption part | |
| Discharge | - Establishment of effective discharge, collection, and screening system - Zero% of direct landfill - Establishment of safety management system about hazardous waste | - Clean separation and discharge of consumers - Reinforcement of public management of blind spots and expansion of government support for private sector | |
| Recycling | - Promotion of high value-added recycling - Improvement of material-oriented recycling - Stabilization of recycling market and promotion of related industries | - Expansion of demand-route for recycled products - Improvement of the quality for recyclable material - Stabilization of recycling market | |
Table 3.
Guidelines for material and structure of plastic packaging [13].
Table 3.
Guidelines for material and structure of plastic packaging [13].
| Material and Structure | Recycling Degree | Notes | ||||
|---|---|---|---|---|---|---|
| Easy (Grade 1) | Medium (Grade 2) | Difficult (Grade 3) | ||||
| Body | Colorless single material | ● | ||||
| Colored single material | Green (1) Sky-blue (2) | ● | - Only green and sky-blue colored materials are rated Grade 2 | |||
| Mixed material | Brown (3) | ● | - Mixed material with only brown colored is rated Grade 2 | |||
| Label | Synthetic resin material with specific gravity less than 1 | Non-adhesive | ● | |||
| Adhesive with water separable | ● | |||||
| Adhesive with non-water separable | ● | - If substitutes are commercialized, this will be downgraded to Grade 3 | ||||
| Synthetic resin material with specific gravity more than 1 | Non-adhesive | ● | - Label with perforated line is recommended - If substitutes are commercialized, this will be downgraded to Grade 3 | |||
| Adhesive | ● | |||||
| Printed directly on the body | ● | |||||
| PVC (4) material, Paper-type, mixed with metal | ● | |||||
| Cap and others | Synthetic resin cap with specific gravity less than 1 | ● | ||||
| Synthetic resin cap, metal cap, PVC cap, and removable materials for other purpose these have the specific gravity more than 1 | ● | |||||
(1) Applied to polyethylene terephthalate (PET) bottle for alcoholic beverages except beer; (2) Applied to PET bottle for (mineral) water to increase a feeling of refreshment; (3) Applied to PET bottle of mixed material for beer to block UV rays; (4) Polyvinyl chloride.
Table 4.
Guideline for evaluation of circular availability and adequate disposal in Resource Circular Assessment [13].
Table 4.
Guideline for evaluation of circular availability and adequate disposal in Resource Circular Assessment [13].
| Guideline | ||
|---|---|---|
| Main Purpose | Improvements in Materials and Components, Ease of Separation, Color, etc. | |
| Applied Products | PET (1) bottle for beverage or detergent | - (Body) Colorless and transparent should be used as a single material. However, when using composite materials due to the characteristic of the product, it should be used in a color that can be easily separated in the recycling stage - (Label) A water-soluble adhesive that does not leave any impurity after detaching the label should be used, and a perforation line should be applied to allow easy separation from the body - (Cap) Cap should be used as same as the material of the body and should be easily separated from the body through specific gravity separation in the recycling stage |
| PP (2), PE (3), and PS (4) bottles For beverage | ||
| Foamed synthetic resin including EPS (5) | - Only single color (only white) should be used - No coating process with any chemical additives is allowed | |
| PVC (6) wrap | - In order to prevent the generation of chlorine compounds during thermal recycling, materials are re placed with PE, etc., which is easy to be recycled | |
(1) Polyethylene terephthalate; (2) polypropylene; (3) Polyethylene; (4) Polystyrene; (5) Expanded polystyrene; (6) Polyvinyl chloride.
Table 5.
Comparison of fulfillment rates of packaging recycling calculated from manufacturing output (A) and mandatory recycling amount (C) [13].
Table 5.
Comparison of fulfillment rates of packaging recycling calculated from manufacturing output (A) and mandatory recycling amount (C) [13].
| Synthetic Resin Packaging | Manufacturing Output (A) (Ton/Year) | Mandatory Recycling Rate (B) (wt.%) | Mandatory Recycling Amount (C) (1) (Ton/Year) | Recycling Amount (D) (Ton/Year) | Fulfillment Rate (2) (wt.%) | |
|---|---|---|---|---|---|---|
| Existing D/C | Improved D/A | |||||
| PET (3) bottle (colorless single material) | 165,470 | 82 | 135,354 | 131,487 | 97.1 | 79.5 |
| PET bottle (colored single material) | 95,090 | 83 | 78,830 | 75,091 | 95.3 | 79.0 |
| PET bottle (mixed material) | 13,431 | 82 | 10,987 | 13,369 | 121.7 | 99.5 |
| Foamed synthetic resin (excluding EPS (4)) | 33,859 | 81 | 27,324 | 32,133 | 117.6 | 99.5 |
| EPS | 9279 | 42 | 3925 | 5265 | 134.1 | 56.7 |
| PVC (5) (single or mixed material) | 4389 | 73 | 3225 | 3209 | 99.5 | 73.1 |
| Other vessel, tray, etc. | 241,799 | 83 | 201,418 | 233,731 | 116.0 | 96.7 |
| Other film form (single or mixed material) | 308,567 | 65 | 201,184 | 319,481 | 158.8 | 103.5 |
(1) Mandatory recycling amount (C) = manufacturing output (A) × (mandatory recycling rate (B, set by the government)/100); (2) Value determining the sum of contribution (paid by a producer) relating to the producer’s responsibility for the recycling of product discharged after use (※ If the value does not exceed 100%, the producer has to pay the contribution. Whereas, if exceeded, the producer can receive support from the government.); (3) Polyethylene terephthalate; (4) Expanded polystyrene; (5) Polyvinyl chloride.
Table 6.
Standard for overpacking regulations [13].
Table 6.
Standard for overpacking regulations [13].
| Applied Packaging | Standard | ||
|---|---|---|---|
| % of Packaging Space | Number of Packaging | ||
| Food and drink | Processed food | Below 15% (below 20% for powdered coffee) | Less than two times |
| Beverage | Below 10% | Less than two times | |
| Alcoholic beverage | Below 10% | Less than two times | |
| Confectionery | Below 20% (below 35% for cake) | Less than two times | |
| Healthy food (Except when the contents are less than 80 mL or 80 g) | Below 15% | Less than two times | |
| Cosmetics | Products for body and hair cleansing | Below 15% | Less than two times |
| Other products | Below 10% (except perfume) | Less than two times | |
| Detergent | Below 15% | Less than two times | |
| General merchandise | Toys and dolls | Below 35% | Less than two times |
| Stationery | Below 30% | Less than two times | |
| Wallet, belt, etc. | Below 30% | Less than two times | |
| Drugs | Below 20% | Less than two times | |
| Clothing | Below 10% | Once | |
© 2020 by the authors. Licensee MDPI, Basel, Switzerland. This article is an open access article distributed under the terms and conditions of the Creative Commons Attribution (CC BY) license (http://creativecommons.org/licenses/by/4.0/).
Share and Cite
MDPI and ACS Style
Shin, S.-K.; Um, N.; Kim, Y.-J.; Cho, N.-H.; Jeon, T.-W. New Policy Framework with Plastic Waste Control Plan for Effective Plastic Waste Management. Sustainability 2020, 12, 6049. https://0-doi-org.brum.beds.ac.uk/10.3390/su12156049
AMA Style
Shin S-K, Um N, Kim Y-J, Cho N-H, Jeon T-W. New Policy Framework with Plastic Waste Control Plan for Effective Plastic Waste Management. Sustainability. 2020; 12(15):6049. https://0-doi-org.brum.beds.ac.uk/10.3390/su12156049
Chicago/Turabian StyleShin, Sun-Kyoung, Namil Um, Yong-Jun Kim, Na-Hyeon Cho, and Tae-Wan Jeon. 2020. "New Policy Framework with Plastic Waste Control Plan for Effective Plastic Waste Management" Sustainability 12, no. 15: 6049. https://0-doi-org.brum.beds.ac.uk/10.3390/su12156049
Note that from the first issue of 2016, this journal uses article numbers instead of page numbers. See further details here.