Ultra-Processed Foods and Food System Sustainability: What Are the Links?


Unité de Nutrition Humaine, INRAE, Université Clermont Auvergne, CRNH Auvergne, F-63000 Clermont-Ferrand, France
*
Author to whom correspondence should be addressed.
Sustainability 2020, 12(15), 6280; https://0-doi-org.brum.beds.ac.uk/10.3390/su12156280
Submission received: 27 June 2020
/
Revised: 31 July 2020
/
Accepted: 31 July 2020
/
Published: 4 August 2020
(This article belongs to the Section Sustainable Food)
Abstract
:Global food systems are no longer sustainable for health, the environment, animal biodiversity and wellbeing, culinary traditions, socioeconomics, or small farmers. The increasing massive consumption of animal foods has been identified as a major determinant of unsustainability. However, today, the consumption of ultra-processed foods (UPFs) is also questioned. The main objective of this review is therefore to check the validity of this new hypothesis. We first identified the main ingredients/additives present in UPFs and the agricultural practices involved in their provision to agro-industrials. Overall, UPF production is analysed regarding its impacts on the environment, biodiversity, animal wellbeing, and cultural and socio-economic dimensions. Our main conclusion is that UPFs are associated with intensive agriculture/livestock and threaten all dimensions of food system sustainability due to the combination of low-cost ingredients at purchase and increased consumption worldwide. However, low-animal-calorie UPFs do not produce the highest greenhouse gas emissions (GHGEs) compared to conventional meat and dairy products. In addition, only reducing energy dense UPF intake, without substitution, might substantially reduce GHGEs. Therefore, significant improvement in food system sustainability requires urgently encouraging limiting UPF consumption to the benefit of mildly processed foods, preferably seasonal, organic, and local products.

1. Introduction
The processing of foods is very important for ensuring food security and safety [1]. For a long time, the security and safety of food have been ensured by salting, drying, smoking, sugaring, pasteurizing, or fermenting. At present, numerous additives, namely, preservatives and antioxidants, are also used. Their use makes it possible to preserve foods during long periods of transport in trucks or boats from a production site to supply megalopolises worldwide and to help typical consumers cover, for example, seasonal gaps or if food storage at the household level is poorly managed [1]. Therefore, to feed humanity, food processing is essential. In addition, some foods require processing to be palatable (e.g., grains), safe (e.g., pasteurized milk), or available year-round (e.g., canned, dried, and frozen fruits and vegetables) [1,2]. Processed foods, especially those of recognized multinational brands [3], in developing countries have a modern image.
Importantly, improvements have been made in addressing food toxicity, notably in developed and emerging countries. However, food nutritional security has deteriorated, as seen from the triple burden of malnutrition that affects all countries worldwide, i.e., under- and over-nutrition and nutritional deficiencies [4]. In particular, over-nutrition has led to explosions in the prevalence of chronic diseases. In 2016, the World Health Organization (WHO) estimated that approximately 650 million adults were obese [5]. According to the same estimates, the rate of type 2 diabetes, currently at 9%, is projected to rise by three percentage points over the next 25 years [6]. Additionally, excess body weight affects over two billion people worldwide [7]. Chronic diseases have progressively replaced infectious diseases.
Since 2009, the concept of ultra-processed foods (UPFs) has rapidly emerged and is now recognized and used by both public institutions (e.g., Food and Agriculture Organization of the United Nations (FAO), World Health Organization (WHO), Pan American Health Organization (PAHO), United Nations Children’s Fund (UNICEF), and The World Bank) and academic researchers worldwide [8,9,10]. In brief, within the proposed NOVA classification of four technological groups, UPFs belong to NOVA group 4 and are notably described in the 2014 Brazilian Dietary Guidelines [11]. They are characterized as having undergone excessive processing and containing additional ‘cosmetic’ ingredients and/or additives of primarily industrial use to mimic, exacerbate, mask or restore sensory properties (aroma, texture, taste and colour) [11,12,13]. In other words, UPFs are artificial foods with organoleptic and sensory properties modified by the addition of ‘cosmetic’ additives and/or highly processed ingredients. Therefore, UPFs are supplying to human organism new unstructured and recombined food matrices, but also new ultra-processed ingredients and additives [12], and whose health effects still needs to be studied on a long term. They are also the reflection of the last nutritional transition that occurred as a major event in the 1980s in Western countries.
Since 2011, at least 260 peer-reviewed papers have used the UPF concept, as defined in the NOVA classification [14] (searched for “UPF” in the article title in the ISI Web of Science on 9 May 2020). A main finding is that the high and/or regular consumption of UPFs has been consistently associated with a higher prevalence of the main chronic diseases and metabolic deregulations in more than thirty-five ecological, epidemiological, and interventional human studies [9] from several different countries, indicating a globalization of UPF consumption. These studies focused on deleterious links with health, while the Brazilian Dietary Guidelines suggested that the massive consumption of UPFs may also be associated with an increased degradation of culinary traditions, social life, and the environment [11], thus affecting several dimensions of the sustainability of the food system itself. However, these suggestions need to be checked further and supported by data from original scientific papers.
Otherwise, according to Johnson et al., the key components of sustainable diets fall into five overarching categories of analysis: (1) agriculture, (2) health, (3) culture, (4) socioeconomics, and (5) the environment [15]. For purposes of comprehensiveness, animal biodiversity and wellbeing, which are much less emphasized in international reports or scientific papers about sustainability, should be integrated together with the preservation of smallholder agriculture. Altogether, the different dimensions of sustainability are summarized in six dimensions (Figure 1) and will guide the discussion and analyses of this review.
In a paper entitled “Production and processing of foods as core aspects of nutrition-sensitive agriculture and sustainable diets”, Keding et al. interestingly emphasize the relevant role that food processing could play in food system sustainability, specifically regarding a sustainable diet [1]. Notably, they write, “When moving along the value chain, agriculture will encounter its limits at some point where food processing starts. While a fluent transition between the different fields of responsibilities without clear boundaries exists, it is important to investigate explicitly the food processing part for its nutrition-sensitiveness similarly to that of agriculture” (pages 826–827) [1], suggesting that processing may play a relevant role in food system sustainability, which has yet to be explored.
In addition, although there may be exceptions depending on country [16], UPFs appear globally less expensive than minimally processed foods [17,18,19], and the growth rates of UPFs worldwide are very high, especially in emerging countries—notably those in Latin America and South Asia—where sales are continuously increasing [8,20]. In addition, it has been shown that the lower the cost of food is, the lower the nutrient density [21]. For example, Maillot et al. reported that a low energy density and a high nutritional quality are each associated with higher diet costs in French adults [22].
From these findings, substantial questions arise: How are the high amounts of UPF ingredients produced and supplied at low cost? How can such a low price be obtained to address such a rapid growth rate worldwide, notably when UPFs are animal based? Therefore, the question addressed in this paper concerns the links between UPFs and food system sustainability, beyond the increased risk of chronic diseases, and regarding the degradation of the other five dimensions of the food system (Figure 1), i.e., environment, biodiversity and animal welfare (Section 3), and cultural and socio-economic dimensions (Section 4). However, before addressing these five dimensions, it is important to determine the ingredients frequently used in UPFs (see Section 2).
This narrative review did not use specific methodology. The main feature of it is describing and appraising published articles, and gathering very sparse and scattered data about UPF regarding food system sustainability, UPF being designated - before the arrival of the UPF concept in 2009 [9,10]—as discretionary, non-core, or junk foods. For this purpose, we used the ISI Web of Science database with notably the following Boolean operators: “ultraprocessed* food* OR ultra-processed food* OR discretionary OR non-core food* OR process* OR diet*” AND “sustainab* OR greenhouse OR water OR environment* OR animal* OR biodiversity OR life cycle OR socioeconomic* OR farmer*…” (among other keywords linked to ‘processing and sustainability dimensions’ as shown in Figure 1).
2. Which Are the Ingredients/Additives Characteristic of Ultra-Processing, and What Is Their Origin?
UPFs are made from many recombined ingredients and/or additives, and we suggested that the link between UPF and food system sustainability is first driven by the massive production of these compounds. This question is addressed by identifying the ingredients/additives characteristic of ultra-processing within the list of UPF ingredients used in these products. Based on the UPF definition by NOVA, Figure 2 schematically represents the way in which a UPF is generally constructed, i.e., through the cracking of raw foods into isolated ingredients that are then recombined in artificial matrices with the addition of industrial ‘cosmetic’ additives that are not commonly used in the kitchen [9,23]. Depending on food products, e.g., ready-to-eat dishes, UPFs may also contain more or less real foods. The processes used to create these markers of ultra-processing include refining, extraction, purification, hydrolysis, and/or chemical modification. Such ingredients include processed carbohydrates such as sugar syrups, maltodextrins, dextrose, malt extracts and polyols, mainly extracted from maize, and wheat, rice, and potato; processed lipids such as refined and/or hydrogenated and inter-esterified oils; and processed proteins such as isolates from soy, milk, pea, egg, and meat, derived hydrolysates, and gluten. In addition to these ingredients, UPFs also contain “cosmetic” additives extracted directly from natural ingredients or chemically synthesized; there are more than 316 authorized at the European level and more than 2500 at the world level, as evaluated by the Joint FAO/WHO Expert Committee on Food Additives (JECFA). The 690,499 foods referenced in the French Open Food Facts database (https://world.openfoodfacts.org/, retrieved on 20 June 2020) make it possible to determine an initial approximation of the frequency of these main ingredients/additives in UPFs (Table 1 and Table 2). This database is today the most comprehensive one about packaged foods, and that gives the list of ingredients for most registered foods. Notably, this database has been previously used for retrieving lists of additives from approximatively 126,000 foods [24].
Starches and glucose-fructose/glucose syrup are by far the most commonly used carbohydrate-based ingredients in UPFs, being found in at least 7.6% and 3.2% of all referenced products, respectively. Ranking third are dextrose (>3.1%) and lactose (>1.6%), followed by malt extract (>1.2%), dextrins/maltodextrins (>1.1%), and invert sugar (>0.6%). For lipids, refined oils are extensively used and are found in at least 9.4% of referenced products, while hydrogenated oils are less commonly used (0.01%). In addition, for proteins, gluten (>1.7%) and milk protein isolates (>3.7%) are the most commonly used, while egg white proteins, gelatine, as well as pea and soy protein are less commonly used, falling in the range of 0.01–0.6%, and protein hydrolysates are used in a minimum of 0.04% of referenced products. Aromas are much more commonly used, being found in at least 10.5% of all referenced products (Table 1).
Concerning additives, the most commonly used are texturing agents such as lecithins (>3.4%), modified starches (>2.4%), xanthan gum (>1.7%), mono- and diglycerides of fatty acids (>1.7%), pectins (>1.5%), diphosphates/pyrophosphates (>1.5%), guar gum (>1.3%), and carraghenans (>1.2%); colouring agents such as capsanthin (>0.7%), carotenes (>0.6%), carmines (>0.5%), and plain caramel (>0.5%); and taste modifiers such as monosodium glutamate (>0.5%), sucralose (>0.4%), acesulfame potassium (>0.3%), aspartame (>0.2%), and steviol glycosides (>0.1%) (Table 2).
Mass production of ultra-processed non-additive ingredients, and of numerous additives processed from the cracking of raw foods, mainly comes from intensive monocultures or livestock of only a few plant/animal varieties (see Section 3.3. related to industrial farming/agriculture). At minimum, their percentage use in foods varies from 0.03 to 12.6 of all foods (Table 1 and Table 2), suggesting a high level of consumption, notably due to the rapid increase in worldwide UPF consumption, especially in Latin America [25]. In the following section, we will therefore analyse how the agricultural system at the basis of these ingredients is linked with sustainability or not, and the impacts of UPF-like product consumption on environmental indicators such as greenhouse gas emissions (GHGEs).
3. Ultra-Processing, Environment, Biodiversity and Animal Welfare
In this section, we addressed the links between massive production and consumption of UPFs and the environment as a whole, including GHGEs, animal/plant biodiversity and animal wellbeing (Figure 1). The issue addressed is mainly the following: “Can diets be healthy and sustainable?” [26], but taking into account the level of food processing, especially UPFs in diets, an issue very rarely considered in previous analyses about food system sustainability.
3.1. General Considerations
In 2013, ten key recommendations were formulated following an extensive review of the available guidance on agricultural programming for nutrition conducted by the FAO [27] and through consultation with a broad range of partners (civil society organizations, non-governmental organizations, government staff, donors, United Nations agencies), particularly through the “Community of Practice: Agriculture-Nutrition” (Ag2Nut) [28]. Three of the recommendations highlighted were to “maintain or improve the natural resource base (water, soil, air, climate, biodiversity)”, to “facilitate production diversification, and increase production of nutrient-dense crops and small-scale livestock” and to “improve processing, storage and preservation”. Otherwise, an increasing number of scientific observers from public institutions or private agencies (e.g., FAO [29,30], Solagro [31], INRAE-Cirad [32], The Lancet Commission [7]) underline, albeit with different wording, the unsustainability of our food systems worldwide.
Concerning more specifically the impact of UPFs on the environment, the Brazilian Dietary Guidelines (2014) intuitively conclude that UPFs can impact the sustained survival of the planet [11]. Based on the first version of the NOVA classification (in three technological groups) [33], Keding et al. schematized three types of food processing within the food system [1]. From this description (Figure 3), it appears that the processing underlying UPFs involves more processing steps, more packaging, and longer transport distances.
Thereafter, authors distinguished processing at the household, village and factory levels with different impacts on the environment, with the main risk of the factory level being “the community as a whole does not often share the profit, which is the main drawback of shifting towards factory food processing [34]” [1]. This is “why Clarke [34] demands that ‘factories need to be well planned and should be not too big as otherwise massive investments may be lost and local lifestyles, cultures and traditions can be seriously and often irretrievably affected’. An alternative approach for factory processing might be village processing [34]” [1]. More generally, in a presentation given at the International Sustainability Conference in 2005 entitled “Nutrition ecological assessment of processed foods”, Riegel et al. [1,35] gave a framework to rate the impact of processed foods not only on health but also on the other different dimension of sustainability, additionally including social, economic and environmental impacts. Concerning the environmental impact, authors proposed to consider agriculture (i.e., favouring low input and organic agriculture), transport (i.e., means of transport and miles per output unit), energy (i.e., consumption per output unit), and water (i.e., consumption per output unit and pollution) [1].
3.2. Food Processing and Carbon/Water Footprint
First, it should be reminded that, in theory, when calculating the carbon footprint of a food product, it is necessary to take into account its entire “life cycle assessment” (LCA), from research and development to the final production of the product, including conditioning until final recycling. In France, the ADEME (French Environment & Energy Management Agency) has analysed the carbon footprint and energy footprint of French foods [36]. The results show that the agricultural production phase generates the most emissions (65%), followed by freight transport (19%), processing (6%), distribution and catering (5%), and consumption (5%). Thus, the ADEME advocates agroecology to reduce GHGEs. However, the LCA index is limited, favouring “high-input intensive agricultural systems and misrepresenting less intensive agro-ecological systems such as organic agriculture”, notably due to a narrow perspective on the holistic functions of global agricultural systems, e.g., operational indicators for environmental issues are lacking [37].
Recently, the FAO reported that UPF consumption in Australia (40% of the total dietary energy consumed, i.e., ≈20% by weight) contributes to more than one-third of all diet-related environmental effects (35% of land and water use, 39% of energy use, 33% of CO2 equivalents) [9]. Such empty caloric dietary trends will lead to nearly double per capita GHG emissions by 2050 [9].
3.2.1. Discretionary Foods
Discretionary foods are very similar to UPFs, as they are defined as energy-dense foods and drinks that are high in saturated fats, sugars, salt and/or alcohol and are not necessary to provide the nutrients that the body needs.
At first glance, eating too many calories favours more GHGEs [38,39]. Therefore, UPFs, which lead to consume more calories than minimally processed foods [40], indirectly generate more GHGEs. Under this assumption, the study by Hendrie et al. [39] is particularly interesting. These authors showed that the overconsumption of energy and excessive discretionary foods contributes 29.4% to the total GHGEs of the Australian population. However, other food groups probably containing UPFs (see Appendix A of their paper) may contribute even more than 30% of the GHGEs of the overall diet. Furthermore, their study shows that reducing discretionary food intake would allow for small increases in emissions from core foods (particularly vegetables, dairy and grains), thereby providing a nutritional benefit at little environmental expense. However, the GHGE calculations in this study are derived from typical LCA and misrepresent less intensive agro-ecological systems [39]. Altogether, a first strategy for reducing GHGEs and to simply fulfil recommended energy needs would be to limit caloric intake from UPFs, i.e., at a level of 15% of recommended ≈2000 kcal/day [41].
Beyond GHGEs, water use is another indicator of the environmental impact of foods. In a recent study about core and discretionary foods consumed daily by a large (>9000) population of self-selected adults, a potential association between a healthier diet and lower environmental impacts was emphasized [42]. Indeed, this study concluded that “excessive consumption of discretionary foods–i.e., energy-dense and nutrient-poor foods high in saturated fat, added sugars and salt, and alcohol–contributes up to 36% of the water-scarcity impacts and is the primary factor differentiating healthier diets with lower water-scarcity footprint from poorer quality diets with higher water-scarcity footprint” [42]. The authors added that very large reductions in the dietary water-scarcity footprint are therefore possible, notably through technological change, product reformulation, and procurement strategies in the agricultural and food industries.
3.2.2. Ultra-Processed Food-Like Products within Dietary Patterns
Because a global evaluation of processing on food system sustainability is not yet available, we first reported the GHGE impacts of dietary patterns, knowing that some diets contain more ultra-processed and/or discretionary foods than others do, e.g., the Western diet [43].
First, Pradhan et al. defined sixteen global food consumption patterns: three low-calorie diets, five moderate-calorie diets, three high-calorie diets, and five very-high-calorie diets (i.e., above 2850 kcal/cap/day)–mostly found in Western countries and the Middle East [44]. Notably, the diet designated ‘#14′ is rich in animal products, sweeteners, and cereals. The results clearly show that diets richer in calories (#11–#16) produce the most GHGEs (>4 kg CO2eq./cap/day). Diets #1 (with cereals contributing to more than 50% of the total energy supply), #3 (with the highest amount of starchy roots), #6 (with the highest fraction of animal products and sugar-sweeteners), and #7 (with the highest amount of vegetable oils) also yield high levels of CO2eq./cap/day. The authors explained that non-CO2 GHGEs from enteric fermentation, rice cultivation, manure management and agricultural soils accounted for their high level of CO2eq./cap/day (>3 kg CO2eq./cap/day) [44]. More generally, countries characterized by high-calorie diets exhibit a production mode that needs high fossil energy inputs (1800–3500 kcal/cap/day) [44].
Then, an Australian study by Hadjikakou et al. [43] evaluated the environmental impact of discretionary foods (generally composed of UPFs) and found that they account for a significant 35%, 39%, 33% and 35% of overall diet-related life cycle water use, energy use, carbon dioxide equivalent and land use, respectively. The authors suggested a ‘divestment’ from discretionary food products by “food substitutions to minimize environmental and social impacts whilst maximizing nutritional quality–especially amongst poorer socioeconomic groups” (page 119) [43].
Otherwise, the contribution of UPF-like products to GHGEs is evaluated in the French survey by Barré et al., where high-fat/sugar/salt foods and mixed dishes contribute approximately 22–23% to GHGEs [45]. The same research team previously showed that soft drinks were the food group with the lowest GHGEs, whereas mixed dishes and sandwiches as well as foods high in fat/salt/sugar produced more GHGEs, air acidification and freshwater eutrophication than fats and condiments, starchy foods, and fruits and vegetables [46] but less than meat, fish, and eggs.
In another study, albeit one in which the degree of processing is not specifically mentioned, considering unhealthy foods close to UPFs, few differences were found for unhealthy food (alcohol or sweet/fatty food) consumption across the categories of dietary GHGEs [47]. However, the percentages of UPFs in other food categories, e.g., eggs, fruits and vegetables, red meat, fat, and dairy products, are very likely not to be 0%. In the UK study by Murakami & Livingstone [48], fats and oils, sugar and confectioneries, and soft drinks corresponded to 18.8% of GHGEs. In the study by Wickramasinghe et al. [49], fatty and sugary foods, either in school lunches or in packed lunches, represented approximately 8.5% of all GHGEs of the meal.
The National Health and Nutrition Examination Survey is a more relevant study because its authors built a food impact database from an exhaustive review of food LCA studies and linked it to over 6000 as-consumed foods and dishes from one-day dietary recall data on nationally representative adults (n = 16,800, follow-up 2005–2010) [50]. Meats, dairy and beverages represented an approximately 80% contribution to total GHGEs; the proportion of UPF within these food categories remains to be determined. Another similar study about the Chinese diet, showing substantially increasing GHGEs from 1989 to 2009 through more fruit, vegetables, meat and dairy, also did not differentiate foods according to the degree of processing [51]. However, the Indian study by Green et al. distinguished GHGEs from primary production, processing, packaging, and waste for each food group [52]. Unsurprisingly, the GHGEs from primary production accounted for between 50% and 75% of GHGE emissions for all food groups, although in some foods, such as dairy and highly processed foods, processing and packaging also make substantial contributions. The authors also observed that GHGEs were highly variable across the thirty-six food groups, with mutton, butter and high-fat dairy products showing the greatest emissions per kg, followed by the “other” (mostly highly processed) food groups.
Concerning dietary optimization with regard to GHGEs, other authors concluded that reducing the consumption of animal-based products, switching to meats and dairy products with lower associated emissions (e.g., pork, chicken and milk), reducing the consumption of savoury snacks, switching to fruits and vegetables with lower emissions, and increasing the consumption of cereals would reduce GHGEs [53]. Similarly, in the Australian study by Hendrie et al. [39], foods wereclustered into core and non-core foods (similar to discretionary foods or UPFs). Non-core foods represented 27.1% of all GHGEs of the diet (3.9 kg CO2eq./cap/day), and by suppressing them from the average diet–with excess calories–to reach a balanced diet (called the “foundation diet”), GHGEs could be reduced by 25%.
In Japan, exploring the factors differentiating the household food carbon footprint, Kanemoto et al. reported high emission intensities for some markers of ultra-processing, i.e., 7.06, 4.57, 7.61, 3.90, and 5.97 t-CO2eq./million yen for sugar, starch, dextrose/syrup/isomerized sugar, vegetable oils and meal, and animal oils and fats, respectively, compared to other typical minimally processed food groups. They noted that soft drinks are associated with a moderate carbon footprint (2.42) [54].
Finally, as pointed out by Aleksandrowicz et al. [55], these studies show that a convergence of healthy, low-GHGE and low-water footprint diets may be possible, though with a careful and realistic substitution of foods processed and supplied to populations [53]. Additionally, UPFs containing no or small amounts of animal source foods tend to have lower environmental impacts [56]. A recent global analysis, based on fifteen different food groups associated with five health outcomes and five aspects of environmental degradation, found that foods associated with improved adult health also often have low environmental impacts [57]. However, as mentioned above, reducing UPF consumption (which can reach up to 29% of the GHGEs of the diet) without substituting core food remains an interesting lever for more sustainable food systems.
3.2.3. What to Do When Ultra-Processed/Discretionary Foods Are Not Available?
Another final issue arises from the following question: “What would be the difference in environmental impact of foods people might consume if UPFs were not available?”. This is the case in some lower-income developing countries where plant-based diets are increasingly supplemented with animal-based calories, which are still mildly processed. Generally, such introduction of animal-based foods might threaten the environment and biodiversity, considering the sourcing of animals coming from either local hunting involving deforestation and/or growing intensive livestock, which demands high energy, land, chemicals, and water. For example, in emerging countries such as China, the increasing demands for meat and dairy drive up GHGEs [51], but increasing the intake of fruits and vegetables for a healthier diet may cancel out the environmental benefits from reducing meat intake [58]. Therefore, not increasing UPF consumption for more non-UPF foods such as animal products is not necessarily a guarantee of any reduction of the environmental footprint, particularly if nutrition transition consumption is based on animal products, independent of their level of processing.
3.3. Ultra-Processed Foods and Intensive Agriculture and Livestock
Due to their massive supply at very low cost, which leads to massive consumption, the probability that UPFs are associated with intensive agriculture and livestock appears very high.
3.3.1. Industrial Farming/Agriculture
Six years ago, Keding et al. wrote, “Maximizing the nutrient output of farming systems for a culturally acceptable and balanced diet, however, has unfortunately never been an objective of agriculture, rather the objective has been to maximize production while minimizing costs [59]. Companies and breeders have influenced food crops, both through the introduction of varieties requiring certain inputs and by encouraging the growth of crops that may be industrially processed [60]. In some areas, replacement of traditional crops, such as legumes, by high yielding modern varieties has badly affected food resilience through the incorrect application of fertilizers and pesticides owing to lack of knowledge or financial resources, resulting in low or no yields at all [61].” [1]. In the same way, Johnston et al. reported that the “… same successful global agro-food system is the dominant force behind many environmental threats, including climate change, simplification of diets, biodiversity loss, and degradation of land, soil, and freshwater [62]. If the current global food system continues to produce and process foods at the current amount and speed, it will continue to degrade the environment and compromise the capacity of the world to produce food in the future and will have irreversible effects on ecosystems [62,63,64,65].” [15].
The FAO also issues a warning with regard to the loss of plant biodiversity: of the 10,000 plant species that can be used as food for humans, only approximately 150 have been commercially cultivated, and only four (rice, wheat, maize, and potatoes) supply 50% of the world’s energy needs [66], with the latter being used for the massive production of starches, modified starches, and sugar syrups used in UPFs.
The restricted diversity of highly cultivated crops has also led to intensive agriculture that is very demanding in terms of pesticides (herbicides, pesticides, etc.) and fertilizers. The French ADEME (Agence de l’environnement et de la maîtrise de l’énergie) specifically calculated the average GHGEs (CO2, N2O and CH4 in kg per kg of active ingredient) of these chemical substances (Table 3).
Among pesticides, insecticides clearly emit the most GHGs, approximately 2–3 times more than the others. Manure in heap emits slightly more GHGs than liquid manure. Finally, among fertilizes, nitrogen is by far the greatest emitter of GHGs. From these simple and synthetic data, it is clear that developing more organic agriculture may significantly reduce the level of GHGEs.
More generally, in 2018, the FAO published a report entitled “Soil pollution, a hidden reality” [67]. The cycle of soil pollution includes pesticides, livestock wastes, fertilizers, and/or irrigation with untreated water. Conventional intensive monocultures are therefore highly demanding in insecticides, pesticides, and fertilizers, and notably serve as the basis for the massive production of ingredients contained in UPFs, producing high amounts of GHGE.
3.3.2. Intensive Livestock
Due to the generally high quantity and very low cost of animal-based UPFs, animal ingredients of these products are very likely to come from intensive livestock, very often associated with animal suffering and/or abuse [68].
According to the FAO, livestock production is widespread around the world, with up to 26% of terrestrial areas dedicated to rangelands and 33% of croplands dedicated to fodder production. Although intensive livestock systems use less land by unit of product, they are often associated with a higher use of inputs and higher concentrations of animals. Such an association can lead to nutrient pollution if the system does not incorporate nutrient capture and recycling technologies; it can also lead to habitat destruction by heavily fertilized feed crops with an impact on biodiversity [69].
According to another FAO report [70], GHGEs along livestock supply chains were estimated at 7.1 gigatons CO2eq./year, representing 14.5% of all human-induced emissions. This sector plays an important role in climate change through feed production, and processing and enteric fermentation from ruminants are the two main sources of GHGEs, representing 45% and 39% of sector emissions, respectively. Land-use change for feed production, i.e., the expansion of pasture and feed crops into forests, accounts for approximately 9% of sector GHGEs. Manure storage and processing represent 10% of emissions, whereas the remainder are attributable to the processing and transportation of animal products, including the consumption of fossil fuel along the sector supply chain, contributing approximately 20% of GHGEs. In this sector, beef and cattle milk contribute 41% and 20% of the sector’s emissions, respectively, while pig and poultry meat and eggs contribute 9% and 8%, respectively. Finally, enteric CH4 accounts for 39.1% of global emissions from livestock supply chains. Intensive livestock systems can also concentrate manure at the site of production, which, if improperly managed, can adversely impact soil and water quality [71].
Conversely, it is also important to note that extensively managed grassland-based systems can provide crucial biodiversity habitats extended to wildlife species [71] but with higher GHGEs per unit of product compared to intensively managed systems [71]. The reason lies in the fact that “these ‘units of product’ usually focus on food or proteins and do not take into account other social and ecosystem services” (page 19) [71], i.e., lacking a holistic perspective, as also discussed by van der Werf [37].
The FAO also reported that high-yielding animals producing more milk per lactation generally exhibit lower GHGE intensities [70]. Notably, the main reason is that the impact per unit of milk is reduced at both the individual cow and dairy herd levels due to the reduced standing biomass (both in lactating and in replacement herds) per unit of milk produced. However, it seems that in such calculations based on LCA [72], the GHGEs produced by deforestation for intensive monocultures to feed animals were not considered–nor was animal suffering in intensive and concentrating conditions (see below). Conversely, on a per cow basis, GHGEs increase with higher yields because higher productivity is usually associated with larger animals and a higher feed intake [72]. Concerning pigs, industrial production produces more GHGEs than backyard production (approximately 8% less) [70].
Otherwise, the role of agriculture as a driver of deforestation has gained recognition in UNFCCC (United Nations Framework Convention on Climate Change) REDD+ (Reducing Emissions from Deforestation and Forest Degradation) negotiations since 2012 [73]. In addition, soybeans and corn for feed are estimated to produce 340 and 1000 kg CO2eq./acre [74].
According to the Friends of the Earth Europe association [68], the intensive production of meat is not healthy because of the use of antibiotics and hormones and because of the overuse of chemicals in food production. In contrast, small-scale urban and rural livestock can make an important contribution to reducing poverty and to healthy food–not just in developing countries.
From the 1960s to the 1970s, “people began to pay attention to animal welfare in intensive breeding after livestock and poultry husbandry changed from extensive range to intensive animal husbandry” [75]. In intensive livestock, including sow confinement and poultry breeding, animal welfare is no longer guaranteed, affecting the quality of animal products [75]. Behind this situation, there is the idea of refusing to sanction change unless supported by scientific evidence, even if ethical considerations can be considered sufficient per se [76]. Since the management of farm animals must take into account their physiological, social and behavioural needs, organic systems are probably a relevant solution for optimal welfare [77].
3.3.3. Loss of Farming Animal Biodiversity
Animal-based UPFs are linked to intensive livestock, and intensive livestock is also reported to be linked to loss of animal biodiversity, which means that UPF massive production is also related to loss of animal biodiversity.
One out of five breeds of livestock are threatened with extinction, and an alert was issued by the FAO in 2008 [78]. Of the 6300 domestic animal breeds, 1350 are threatened with extinction or have already disappeared. Their replacement is for the benefit of a small number of breeding breeds mostly selected for their productivity. A dozen animal species alone provides 90% of the animal protein consumed worldwide. In this respect, there is a race to control animal genetics by a handful of economic actors within the context of industrial agriculture [79]. According to the International Livestock Research Institute (https://www.ilri.org/), five breeds, all from Europe and North America, presently dominate world breeders. The carefully selected Prim’Holstein dairy cow of Dutch–German–American origin [80] is present in 128 countries and provides two-thirds of milk production in the world [79]. Similarly, Large White pigs, which are of English origin, are present in 117 countries, accounting for one-third of the global supply of pigs in the world. The top five also include Saanen goats, which are Swiss in origin (81 countries), the Spanish Merino sheep (60 countries), and white Leghorn laying hens, which are of Italian origin and raised all over the world [79].
Ultimately, as reported by the FAO, virtually one breed has disappeared per month over the last six years, and livestock production around the world is increasingly based on a limited number of breeds [78]. This approach of highly efficient breeds can be questioned in regard to sustainable food systems, particularly specific diseases that can affect these animals, which are selected for their production but not for their disease resistance and are maintained through the use of vaccines and antibiotics.
3.3.4. Plastic Pollution
Overall, the consumption of UPFs is high in Western countries, especially Anglo-Saxon countries, with 307 kg/year per capita in the USA, followed by Canada (230 kg), Germany 219 kg), Mexico (214 kg), Belgium (210 kg), Australia, Norway and the UK (>200 kg/year) [20]. Conversely, it is still low in India (7 kg) and some African, South America and Asian countries (<100 kg) [20]. However, the growth rate of sales is very large in emerging countries, with a 115% increase in sales between 2000 and 2013 for Asian and Pacific regions, 71% in the Middle East and Africa, and 73% in Eastern Europe [20]. Overall, world growth was 44% during this period. Finally, the market share of UPFs is the highest in Asian and Pacific countries, with 29.2%.
Therefore, our massive consumption of over-packaged UPFs worldwide is very likely to generate massive plastic pollution [67] without neglecting plastic bags to bring products from market to home. Indeed, over-packaged UPFs are designed to be consumed while travelling, in isolated situations, and rapidly [11]. Overall, the largest source of plastic production is packaging, driven by the pervasive commercial use of single-use containers destined for immediate disposal [81]. Worldwide, primary plastic waste generation has grown from nearly 0 in 1950 to 300 million metric tons (Mt) in 2015, with approximately 42% being used for food packaging [82] and approximately 79% being accumulated in landfills or the natural environment [83], with dramatic impacts on marine life [84].
In supermarkets, UPFs constitute more than two-thirds of packaged foods in France [13], more than 70% in the USA [85], and even more than 83% in New Zealand [16]. Therefore, it is very likely that returning to more fresh food should drastically alleviate plastic waste. Notably, marine animals are mostly affected through entanglement in and ingestion of plastic litter, and the absorption of polychlorinated biphenyls from ingested plastics is another threat [84]. As reported recently, there is also growing evidence that many single-use materials in contact with food, including plastics, can pose health risks to consumers through chemical migration [86]. It has been shown that harmful chemicals, such as endocrine disruptors, migrate not only in plastic packaging, but also in other materials, such as recycled paperboard.
3.4. Energy Consumption in Food Manufacturing, Packaging and Transport
Overall, energy is intensively used both for manufacturing and for product transport to consumers [87], and the importance of the processing stage in the whole life cycle of elaborated food products has been emphasized by several authors [88,89].
3.4.1. Energy by Food Groups and Processes
This section will focus on the energy spent for food processing, mainly based on the recent and exhaustive review by Ladha-Sabur et al. [87]. First, the authors reported that the food sector consumes approximately 200 EJ (exajoule = 1018 J) globally per year [90,91], of which 45% corresponds to processing and distribution activities [92,93]. Ladha-Sabur et al. found that products that are freeze-dried–such as instant coffee (average of 50.20 MJ/kg) and milk powder (average of 16.22 MJ/kg)–or dried–such as French fries (average of 15.16 MJ/kg) and crisps (average of 17.30 MJ/kg)–consume among the highest amounts of energy [87]. However, value ranges are highly variable according to the energy origin, especially electricity versus fossil fuels (coal, petroleum, and gas), with electricity being much less energy demanding.
Among processed and more processed foods, the highest maximum values are observable for chocolate, sugar, breakfast cereals, instant coffee, factory roasted and wrapped beef, deboned beef meat, beef pies, smoked and cooked pig joints, and distilled spirits. For other foods, notably some candy, cocoa butter, processed cereals, processed fats, food ingredients, light alcohols, soft drinks, pig ham, beef burger and bacon, and tomato-based products, the energy demand ranges from 0.07 to 11.11 MJ/kg.
More specifically, taking food groups separately, the following striking conclusions are drawn [87]: (1) When including grinding, milling, wetting, drying, and baking, data from 1975 to 1996 report that 66 MJ/kg was used for the manufacture of breakfast cereals. The milling of flour appears to be an energy-intensive process [94]. (2) Potato-based products, notably dried products, consume the most energy among vegetables (Figure 4A) [95]. (3) Baking and freezing are the most energy-demanding steps for breads and rolls, biscuits and crackers, cakes, and frozen cakes, pies, and other pastries, i.e., 4.07 (67%), 4.17 (78%), 0.94 (38%) and 1.68 (32%) MJ/kg, respectively [87,96]. (4) Dairy processing is considered one of the most energy-intensive sectors within the food industry [97]. Cheese, including ripening, is the most energy intensive (13.85 MJ/kg), followed by powdered milk (10.30 MJ/kg) (Figure 4B), notably requiring over nine times more water, four times as much raw milk and electricity, and three times more fuel than processed milk [98].
For the latter, UHT and sterilization processes are also energy intensive since higher temperatures are required [87]. (5) Poultry products are the most energy intensive (due to hair and feather removal and singeing operations), while beef, veal and sheep are the least energy intensive [87]. Overall, less processed products, such as butter, fish, eggs, pasta, poultry, beef and milk, consume less end use energy than processed products (e.g., fruit juices, yogurts, cheese, processed vegetable, sugar, bread, bacon, and ham) and ultra-processed-like products (e.g., soft drinks, biscuits, cakes, buns, pastries, crispbreads). Cheese is largely the more demanding in end use energy.
Regarding processes, overall, thermal processes are energy intensive and responsible for a large proportion of the energy consumed in food processing [87]. Then, the highest maximum values are obtained for cooling (depending on temperature differences), drying, freeze-drying, packaging, microwave drying and milk pasteurization. Other preservation processes, such as dehydration or sterilization, have been estimated to account for approximately 29% of the total energy used in the food sector [99]. Globally, the LCA of processed foods is significantly impacted by preservation techniques, as stated by Pardo et al.: “This can be attributed to the large energy and water resources demanded during the preservation treatment. Since heat and electricity production steps often implies hydrocarbon combustion processes, this stage involves most of the air emissions to the atmosphere affecting categories such as climate change or acidification potential” (page 203) [100].
3.4.2. Packaging and Transport
In the study by Pardo and Zufía [100], packaging implies a considerable share of the total evaluated impacts on the environment, particularly for preserving foods through pasteurization with either high hydrostatic processing, autoclaves, modified atmosphere packaging or microwaves, i.e., up to 80% for global warming potential. For example, the GHGE rates from food packaging through the use of fossil fuel (natural gas, coal, and petroleum) may reach 70.54 kg/MMBtu (million British thermal units) for petroleum and 94.67 kg/MMBtu for coal [74].
3.4.3. Ultra-Processing?
Strictly speaking, UPFs are recombination of processed ingredients that already consume energy, as described above, notably through intensive agriculture, transportation, and packaging. Thus, it is tempting to conclude that dispatching them worldwide might produce more GHGEs than consuming local raw and mildly processed foods. However, as described above, discretionary foods, with most of them being UPFs, do not produce the highest level of GHGEs, provided that LCA calculations are sufficiently holistic to consider all sources of GHGEs, from farm to fork. In addition, fragmentation of their production leads authors to assign trends in energy consumption to general food groups rather than specific food products [87]. Otherwise, very few data have been found on the level of energy use for UPF ready-to-eat meals that need to be cooked, preserved, and chilled or frozen [87].
3.4.4. Emerging Techniques
Pardo and Zufía [100] proposed that emerging techniques may reduce the environmental impacts of preservation processing, such as lower energy demand and GHGEs, compared with traditional thermal processes. Environmental impacts may also be reduced with nonthermal technologies, including modified atmosphere packaging or high hydrostatic pressure, requiring less water than equivalent thermal processes [100]. Altogether, the two main targets of emerging techniques are as follows:
- -
- Their capacity to preserve foods by avoiding successive conditions of severe heating/cooling, which contribute to considerable water and heat consumption minimization; and
- -
- Electricity as the basis of the energy consumption source of such techniques, with an important contribution of renewable resources instead of the direct combustion of fossil fuels required for heat generation in conventional thermal treatments [100].
3.5. Partial Conclusions
UPFs appear associated with a poor level of biodiversity, notably due to the few plant and animal varieties that supplied the ingredients used for their production and processing. Moreover, intensive monocultures are very demanding in high input energy, and animal calories found in UPF are associated with high levels of GHGE, as well as deforestation with feed animals in intensive conditions, that are otherwise far from respecting their basic needs and wellbeing. In addition, fractionating raw foods into massive amounts of ingredients for producing UPFs all around the world appears more energy demanding than locally consuming raw or minimally processed foods. Plant-based UPFs are clearly not so energy demanding than animal-based UPFs, but they are not yet associated with a better food system sustainability, especially regarding intensive monocultures. In the following section, we intended to go beyond agricultural and environmental considerations, and to analyse and discuss the impacts of massive UPF consumption on cultural and socio-economic dimensions.
4. Ultra-Processed Foods, and Cultural and Socio-Economic Dimensions
Beyond supplying nutrients and pleasure, diets are influenced not only by social/cultural traditions [102] (e.g., rice in Asia, cheeses in France) but also by religious traditions (e.g., vegetarianism in Hinduism) and socio-economic dimensions, including fair trade, the preservation of small farmers, and healthy food affordability [15]. Therefore, in this section, we addressed the links between massive production and consumption of UPFs, and culinary traditions, social life, and small farmers (Figure 1).
4.1. Ultra-Processed Foods and Culinary Traditions
Regarding social and culinary traditions, the Brazilian Dietary Guidelines warn about the loss of culinary habits in the confrontation of the country with industrialized and standardized products disseminated by means of intensive and aggressive advertising campaigns, leading consumers, particularly younger consumers, to consider genuine food cultures to be uninteresting [11].
If food standardization obviously allows strict and efficient toxicological and hygienic control, conversely, it is also a basis for ultra-processed and unhealthy foods. Indeed, the food safety paradigm has somewhat replaced food diversity and substitutes for healthier foods, as demonstrated in Western and emerging countries where consumers no longer die from food toxins but from chronic diseases and suffer from deficiencies because the empty calories from UPFs do not supply enough protective micronutrients (i.e., hidden hunger) [8,16,17,103,104,105,106].
Food standardization is also accompanied by standardized tastes worldwide [107,108]. Consequently, vacationers and travellers may prefer to buy UPFs abroad with no risk of disliking the product rather than testing a local dish with the risk of not liking it. The same is true for children, who are accustomed at a very young age to a standardized taste and who, upon reaching adulthood, reject real foods with subtler tastes. One can also observe that in numerous emerging and developing countries where the standard of living increases, this translates into the decline of traditional foods, i.e., there is a shift towards a certain homogenization of the way of eating, i.e., towards more animal and UPF calories, which are often considered outward signs of wealth [8].
However, if UPFs are very standardized foods marketed worldwide, there is also a tendency towards diet diversification due to world exchange [108]. At present, it is clear that several countries have access to a much higher food diversity than was available several hundred years ago, but this diversification has more to do with real or gastronomic foods than with UPFs. Moreover, the hyper-palatability of the latter increases the frequency of their consumption, to the detriment of traditional foods, resulting in a real addiction, as observed in obese children in Brazil [109].
4.2. Ultra-Processed Foods and Socioeconomics
Regarding social life, the Brazilian Dietary Guidelines [11] note that ready-to-consume UPFs, which can be consumed anytime and anywhere, “makes meals and sharing of food at table unnecessary”, leads to the isolation of the consumer even if these foods “are disguised by advertisements suggesting that such products promote social interaction, which they do not”.
4.2.1. The Socioeconomic Profiles of the High UPF Consumers
In Westernized countries, populations with higher incomes can purchase foods of greater variety and nutritional value [15]. Thus, it is well demonstrated that there are more obese and diabetic people in low-income populations [110,111] or countries [112,113], notably because less healthy foods (often imported) are less expensive than locally produced foods [15].
Because of the numerous published studies on UPFs, it is now possible to start depicting the socioeconomic status of high-UPF consumers according to country.
- -
- In France, a higher consumption of UPFs was independently associated with being male, being younger, having a lower income level, smoking, being overweight, being obese, and having a lower level of education [114].
- -
- The Spanish SUN cohort of young university graduates, who have a high level of education, revealed other associated factors, including sedentary activities (computer, television) and a high total fat intake together with a low protein and carbohydrate intake [115].
- -
- In the USA, the highest consumers of UPFs (NHANES cohort, 1988–1994) are more likely to be younger, male, non-Hispanic White and current smokers and are less likely to have less than a high school level of education or to have a household income of more than 350% of the poverty level [116]. Similar results in the USA were obtained in the NHANES cohort (2009–2014), showing that subjects who have an income-to-poverty ratio <3.5, 12 years of education, and low physical activity and who are current smokers present the highest UPF consumption [117].
- -
- In South Korea, energy drink intake in Korean adolescents, in isolation or in combination with junk food consumption, was shown to have detrimental effects related to stress, sleep dissatisfaction, mood, and suicidality [118]. Concerning social isolation, Bae et al. showed that adolescent female rats’ body weight gain and daily chow intake were significantly increased by this stress, suggesting that social isolation during adolescence may increase food intake, perhaps preferentially towards palatable food [119]. This result was confirmed in mice that become obese under social isolation stress [120]. Surprisingly, however, although social isolation generally increases the risk of type 2 diabetes, socially connected obese participants pose a higher risk of type 2 diabetes than socially isolated obese participants, potentially because the stigmatization of obesity leads to negative social interactions [121]. Indeed, overweight youth are more likely to experience verbal victimization, feel less supported by their peers, and are less likely to date than youth who are not overweight from mid-adolescence into early young adulthood [122].
Data reported in France and the USA showed that the highest UPF consumers had lower income and educational levels. Since higher UPF consumption is associated with a higher prevalence of obesity [123], this may be related to the well-known fact that lower-income populations in high-income countries often have higher rates of obesity and diabetes than do high-income populations in high-income countries [124]. However, lower-income countries often have lower rates of obesity and diabetes than higher-income countries [125], although conditions will worsen due to the rapid nutrition transition that includes a significant level of UPFs, as shown in developing and emerging countries [20].
4.2.2. Ultra-Processed Foods and Small Farmers
Low-price, ready-to-eat, and highly attractive UPFs may lead to a partial or complete substitution of local and traditional foods, especially in emerging and developing countries.
For example, in Africa, it has been observed that the import of chicken wings destroys local companies [68]. Indeed, the processing of slaughtering by-products into animal feed is prohibited for European poultry companies, and as a result, these countries export them cheaply to developing countries. This is only one example among others, e.g., excess milk in Europe is dried, defatted and exported to Africa, where it is cheaper than local milk.
As reported by Johnston et al. [15], the reason lies in the fact that “current government subsidies to farmers in the United States and parts of Europe enable developed countries to produce large quantities of cheap staple and ultra-processed foods at 40–60% below the cost of local production of similar goods in developing countries [126]. In turn, these less healthy foods as massive imports are considerably less expensive than the locally produced foods, distorting local markets and depressing demand for the more expensive, locally produced, and often times healthier food options [63]”.
Therefore, the adoption of imported UPFs from developed countries may directly threaten small farmers in developing countries, who are then obliged ‘to put the key under the door’ and to feed the slums.
4.3. Partial Conclusions
Overall, UPFs do not appear associated with a high level of social life, being consumed in isolated situations, e.g., in front of screens or on the move. On the contrary, real meals mostly made of real foods are associated with moments of festivity and family sharing. Due to their very low cost, some of them may also threaten small farmers and producers in many countries worldwide, especially in developing countries where local foods may be more expensive. In our developed societies, UPFs are generally more consumed by the poorest and less educated people, contrary to emerging and developing countries where they may appear as outward signs of wealth. Finally, through the high level of standardization, and their lower cost, many of them are progressively replacing some culinary traditions worldwide, especially among the youngest, such traditions appearing less attractive, with more subtle, risky, and demanding tastes.
5. Conclusions
5.1. A Global Synthesis from Published Data
In this review, we intended to answer to the following issue: “are UPFs linked to food system sustainability regarding, beyond human health, the degradation of the other five dimensions of the food system as shown on Figure 1?” First, UPFs, encompassing other designations such as junk, discretionary, non-core, or sometimes street foods, is an updated concept that explains why it was difficult to obtain specific information about their potential associations with the different dimensions of food systems worldwide (Figure 1). Nevertheless, on Figure 5, in reference to Figure 1 and based on the gathered data, we built the potential links between excess UPF consumption and the alteration of the different dimensions of the food system sustainability.
More generally, by combining both the low cost at purchase and increased consumption worldwide, most of these products appear potentially associated with intensive agriculture/livestock, a loss of culinary traditions, the progressive disappearance of small farmers/peasants, increased animal suffering, a loss of biodiversity, and social inequalities (Figure 5).
5.2. Non-UPF Versus UPF?
Although present studies suggest that UPFs do not necessarily produce the highest GHGEs, within a context of overconsumption of animal calories, their contribution to GHGEs could be importantly reduced without negative health effects. It should also be recognized that some non-UPFs may be produced at low cost [127] and/or environmental impact [128] while being highly consumed worldwide, e.g., refined sugars, oils and cereals, but to the detriment of health outcomes (e.g., obesity [129,130] or type 2 diabetes [131]). However, the contribution of some non-UPF food (e.g., palm oil, banana, avocado …) to the degradation of food system sustainability is already well recognized, notably through intensive monocultures with large amounts of inputs and loss of biodiversity.
6. Perspectives: What Measures to Take?
6.1. Better Consideration of the Degree of Processing in Science and Food Policy
If agriculture is considered to produce too many GHGEs, future evaluations from farm to fork should further analyse the level of contribution of UPF processing, packaging, and transport. Similarly, when analysing the associations between food groups and GHGEs, it is important to discriminate the degree of processing of each of the foods included in those groups. Meanwhile, the available data appear sufficient to extend the application of the precautionary principle (applied to human health [132]) and to urgently implement policy regulations for agro-industrials to include nutritional and environmental criteria with regard to processed foods and policy incentives for consumers to shift from UPFs to real raw and mildly processed foods, preferably seasonal, organic and local products.
6.2. The 3V’s RULE Proposal to Counteract Excess UPF Consumption
On that basis and extended to an ethical and sustainable diet, three golden rules for designing a protective diet food system sustainability have been elaborated in our laboratory, and taking into consideration the neglected dimension of the degree of processing (second rule). In French, this new concept is called the 3Vs Rule for Végétal (animal calories not exceeding 15% per day), Vrai (real: ultra-processed calories not exceeding 15% per day), and Varié (varied real foods), using, if possible, local, seasonal, and organic products [42,133]. In line with previous collective experience searching for a generic complex diet protecting both human health and the planet as a whole with a time horizon of 2050 [7,31,32,134,135,136,137,138,139,140], the 3Vs concept is based on a holistic view in that, through its application, it protects humans, animals, and the environment as a whole. Therefore, if removing the second rule concerning the degree of processing, and based on the data of this review, a diet appears no more fully sustainable. Finally, the 3Vs-based diet sustains several, if not all, dimensions of the regionally adapted food systems.
Author Contributions
A.F. conceptualized the review, carried out the data extraction from the literature, and wrote the original draft of the manuscript. E.R. analysed the data and participated in the final writing and validation of the manuscript. A.F. and E.R. performed funding acquisition. All authors have read and agreed to the published version of the manuscript.
Funding
This review article has been funded by the INRAE/Cirad’s GloFoodS (“Transitions for World Food Security”) metaprogramme.
Conflicts of Interest
Anthony Fardet has been a member of the scientific committee of the Siga Society since 2017. Siga has developed a holistic food score based on the degree of processing and is specialized in UPF characterization. He is also a consultant for Wuji & Co. society, and co-president of the scientific committee of the Holistic Care Association. Edmond Rock declares no conflict of interest. The INRAE/Cirad GloFoodS metaprogramme funder had no role in the design of the study; in the collection, analyses, or interpretation of the data; in the writing of the manuscript, or in the decision to publish the results.
Abbreviations
| ADEME | French Environment & Energy Management Agency |
| FAO | Food and Agriculture Organization of the United Nations |
| GHGE | Green House Gas Emission |
| LCA | Life Cycle Assessment |
| PAHO | Pan American Health Organization |
| UNICEF | United Nations Children’s Fund |
| UPF | Ultra-Processed Food |
| WHO | World health Organization |
References
- Keding, G.B.; Schneider, K.; Jordan, I. Production and processing of foods as core aspects of nutrition-sensitive agriculture and sustainable diets. Food Secur. 2013, 5, 825–846. [Google Scholar] [CrossRef]
- Dwyer, J.T.; Fulgoni, V.L., III; Clemens, R.A.; Schmidt, D.B.; Freedman, M.R. Is “processed” a four-letter word? The role of processed foods in achieving dietary guidelines and nutrient recommendations. Adv. Nutr. 2012, 3, 536–548. [Google Scholar] [CrossRef] [PubMed] [Green Version]
- Becquey, E.; Savy, M.; Danel, P.; Dabiré, H.B.; Tapsoba, S.; Martin-Prével, Y. Dietary patterns of adults living in Ouagadougou and their association with overweight. Nutr. J. 2010, 9, 13. [Google Scholar] [CrossRef] [PubMed] [Green Version]
- Gomez, M.I.; Ricketts, K.D. Food value chain transformations in developing countries: Selected hypotheses on nutritional implications. Food Policy 2013, 42, 139–150. [Google Scholar] [CrossRef] [Green Version]
- WHO. Obesity and Overweight. Available online: https://www.who.int/fr/news-room/fact-sheets/detail/obesity-and-overweight (accessed on 11 May 2020).
- WHO. World Report on Diabetes; WHO: Genève, Switzerland, 2016. [Google Scholar]
- The Lancet Commission. The Global Syndemic of Obesity, Undernutrition and Climate Change: The Lancet Commission Report; Lancet: New York, NY, USA, 2019; pp. 1–8. [Google Scholar]
- PAHO; WHO. Ultra-Processed Food and drink Products in Latin America: Sales, Sources, Nutrient Profiles, and Policy Implications; PAHO, WHO: Washington, DC, USA, 2019; pp. 1–72. [Google Scholar]
- FAO; Monteiro, C.A.; Cannon, G.; Lawrence, M.; Louzada, M.L.d.C.; Machado, P.P. Ultra-Processed Foods, Diet Quality, and Health Using the NOVA Classification System; FAO: Rome, Italy, 2019; pp. 1–48. [Google Scholar]
- Monteiro, C.A.; Cannon, G.; Moubarac, J.C.; Levy, R.B.; Louzada, M.L.C.; Jaime, P.C. The UN Decade of Nutrition, the NOVA food classification and the trouble with ultra-processing. Public Health Nutr. 2018, 21, 5–17. [Google Scholar] [CrossRef] [Green Version]
- Ministry of Health of Brazil. Dietary Guidelines for the Brazilian Population; Ministry of Health of Brazil, Secretariat of Health Care, Primary Health Care Department: São Paulo, Brazil, 2014; pp. 1–80. [Google Scholar]
- Fardet, A.; Rock, E. Ultra-processed foods: A new holistic paradigm? Trends Food Sci. Technol. 2019, 93, 174–184. [Google Scholar] [CrossRef]
- Davidou, S.; Christodoulou, A.; Fardet, A.; Frank, K. The holistico-reductionist Siga classification according to degree of food processing: An evaluation of ultra-processed foods in French supermarkets. Food Funct. 2020, 11, 2026–2039. [Google Scholar] [CrossRef]
- Monteiro, C.A.; Levy, R.B.; Claro, R.M.; de Castro, I.R.R.; Cannon, G. A new classification of foods based on the extent and purpose of their processing. Cad. Saude Publica 2010, 26, 2039–2049. [Google Scholar] [CrossRef] [Green Version]
- Johnston, J.L.; Fanzo, J.C.; Cogill, B. Understanding Sustainable Diets: A Descriptive Analysis of the Determinants and Processes That Influence Diets and Their Impact on Health, Food Security, and Environmental Sustainability. Adv. Nutr. 2014, 5, 418–429. [Google Scholar] [CrossRef] [Green Version]
- Luiten, C.M.; Steenhuis, I.H.; Eyles, H.; Ni Mhurchu, C.; Waterlander, W.E. Ultra-processed foods have the worst nutrient profile, yet they are the most available packaged products in a sample of New Zealand supermarkets. Public Health Nutr. 2016, 19, 530–538. [Google Scholar] [CrossRef] [Green Version]
- Gupta, S.; Hawk, T.; Aggarwal, A.; Drewnowski, A. Characterizing ultra-processed foods by energy density, nutrient density and cost. Front. Nutr. 2019, 6, 70. [Google Scholar] [CrossRef] [PubMed] [Green Version]
- Machado, P.P.; Claro, R.M.; Canella, D.S.; Sarti, F.M.; Levy, R.B. Price and convenience: The influence of supermarkets on consumption of ultra-processed foods and beverages in Brazil. Appetite 2017, 116, 381–388. [Google Scholar] [CrossRef] [PubMed]
- Teo, C.R.P.A. The partnership between the Brazilian School Feeding Program and family farming: A way for reducing ultra-processed foods in school meals. Public Health Nutr. 2018, 21, 230–237. [Google Scholar] [CrossRef] [Green Version]
- Pan American Health Organization. Ultra-Processed Food and Drink Products in Latin America: Trends, Impact on Obesity, Policy Implications; Pan American Health Organization: Washington, DC, USA, 2015; pp. 1–76. [Google Scholar]
- Darmon, N.; Drewnowski, A. Contribution of food prices and diet cost to socioeconomic disparities in diet quality and health: A systematic review and analysis. Nutr. Rev. 2015, 73, 643–660. [Google Scholar] [CrossRef]
- Maillot, M.; Darmon, N.; Vieux, F.; Drewnowski, A. Low energy density and high nutritional quality are each associated with higher diet costs in French adults. Am. J. Clin. Nutr. 2007, 86, 690–696. [Google Scholar] [PubMed]
- Monteiro, C.; Cannon, G.; Levy, R.; Moubarac, J.C.; Jaime, P.; Martins, A.P.; Canella, D.; Louzada, M.; Parra, D. The star shines bright. World Nutr. 2016, 7, 28–38. [Google Scholar]
- Chazelas, E.; Deschasaux, M.; Srour, B.; Kesse-Guyot, E.; Julia, C.; Alles, B.; Druesne-Pecollo, N.; Galan, P.; Hercberg, S.; Latino-Martel, P.; et al. Food additives: Distribution and co-occurrence in 126,000 food products of the French market. Sci. Rep. 2020, 10, 3980. [Google Scholar] [CrossRef] [Green Version]
- Popkin, B. Ultra-processed foods’ impacts on health. In 2030/Food, Agriculture and Rural Development in Latin America and the Caribbean; No. 34; Food and Agriculture Organization of the United Nation: Santiago, Chile, 2019. [Google Scholar]
- Fanzo, J.; Davis, C. Can Diets Be Healthy, Sustainable, and Equitable? Curr. Obes. Rep. 2019, 8, 495–503. [Google Scholar] [CrossRef] [Green Version]
- Food and Agriculture Organization of the United Nations (FAO). Synthesis of Guiding Principles on Agriculture Programming for Nutrition; FAO: Rome, Italy, 2013; pp. 1–93. [Google Scholar]
- Agriculture-Nutrition Community of Practice Key Recommendations for Improving Nutrition through Agriculture. Available online: http://unscn.org/files/Agriculture-Nutrition-CoP/Agriculture-Nutrition_Key_recommendations.pdf (accessed on 11 May 2020).
- FAO. Strengthening Sector Policies for Better Food Security and Nutrition Results. Food Systems for Healthy Diets; FAO: Rome, Italy, 2019; pp. 1–48. [Google Scholar]
- Comité de la Sécurité Alimentaire Mondiale/Groupe d’Experts de Haut Niveau (HLPE-FAO). Approches Agroécologiques et Autres Approches Innovantes Pour Une Agriculture Durable et des Systèmes Alimentaires qui Améliorent la Sécurité Alimentaire et la Nutrition; Extrait du Rapport; HLPE-FAO: Rome, Italy, 2019; pp. 1–16. [Google Scholar]
- Solagro. Afterres2050: Un Scénario Soutenable Pour L’agriculture et L’utilisation des Terres en France à L’horizon 2050; Solagro: Toulouse, France, 2014; pp. 1–63. [Google Scholar]
- Le Mouël, C.; de Lattre-Gasquet, M.; Mora, O. Land Use and Food Security in 2050: A Narrow Road (Agrimonde-Terra); Quaé: Versailles, France, 2018; pp. 1–403. [Google Scholar]
- Monteiro, C. The big issue is ultra-processing. World Nutr. 2010, 1, 237–269. [Google Scholar]
- Clarke, B. High-Hopes for Post-Harvest—A New Look at Village-Scale Crop Processing; FAO: Roma, Italy, 2004; pp. 1–36. [Google Scholar]
- Riegel, M.; Schneider, K.; Zach, K.; Hoffmann, I. Nutrition ecological assessment of processed foods. In Proceedings of the International Sustainability Conference, Basel, Switzerland, 13–14 October 2005; p. 1. [Google Scholar]
- Combe, M. L’empreinte Carbone et Energétique de L’alimentation Décortiquée. Techniques de L’ingenieur. 2019. Available online: https://www.techniques-ingenieur.fr/actualite/articles/lempreinte-carbone-et-energetique-de-lalimentation-decortiquee-64142/ (accessed on 1 August 2019).
- Van der Werf, H.M.G.; Knudsen, M.T.; Cederberg, C. Towards better representation of organic agriculture in life cycle assessment. Nat. Sustain. 2020. [Google Scholar] [CrossRef]
- Vieux, F.; Darmon, N.; Touazi, D.; Soler, L.G. Greenhouse gas emissions of self-selected individual diets in France: Changing the diet structure or consuming less? Ecol. Econ. 2012, 75, 91–101. [Google Scholar] [CrossRef]
- Hendrie, G.A.; Baird, D.; Ridoutt, B.; Hadjikakou, M.; Noakes, M. Overconsumption of Energy and Excessive Discretionary Food Intake Inflates Dietary Greenhouse Gas Emissions in Australia. Nutrients 2016, 8, 690. [Google Scholar] [CrossRef] [PubMed] [Green Version]
- Hall, K.D.; Ayuketah, A.; Brychta, R.; Cai, H.; Cassimatis, T.; Chen, K.Y.; Chung, S.T.; Costa, E.; Courville, A.; Darcey, V.; et al. Ultra-Processed Diets Cause Excess Calorie Intake and Weight Gain: An Inpatient Randomized Controlled Trial of Ad Libitum Food Intake. Cell Metab. 2019, 30, 67–77.e3. [Google Scholar] [CrossRef] [PubMed] [Green Version]
- Fardet, A.; Rock, E. Reductionist nutrition research has meaning only within the framework of holistic thinking. Adv. Nutr. 2018, 9, 655–670. [Google Scholar] [CrossRef]
- Ridoutt, B.G.; Baird, D.; Anastasiou, K.; Hendrie, G.A. Diet Quality and Water Scarcity: Evidence from a Large Australian Population Health Survey. Nutrients 2019, 11, 1846. [Google Scholar] [CrossRef] [Green Version]
- Hadjikakou, M. Trimming the excess: Environmental impacts of discretionary food consumption in Australia. Ecol. Econ. 2017, 131, 119–128. [Google Scholar] [CrossRef] [Green Version]
- Pradhan, P.; Reusser, D.E.; Kropp, J.P. Embodied Greenhouse Gas Emissions in Diets. PLoS ONE 2013, 11, e0159285. [Google Scholar] [CrossRef] [Green Version]
- Barré, T.; Perignon, M.; Gazan, R.; Vieux, F.; Micard, V.; Amiot, M.J.; Darmon, N. Integrating nutrient bioavailability and co-production links when identifying sustainable diets: How low should we reduce meat consumption? PLoS ONE 2018, 13, e0191767. [Google Scholar] [CrossRef] [Green Version]
- Masset, G.; Soler, L.G.; Vieux, F.; Darmon, N. Identifying Sustainable Foods: The Relationship between Environmental Impact, Nutritional Quality, and Prices of Foods Representative of the French Diet. J. Acad. Nutr. Diet. 2014, 114, 862–869. [Google Scholar] [CrossRef] [Green Version]
- Seconda, L.; Baudry, J.; Alles, B.; Boizot-Szantai, C.; Soler, L.G.; Galan, P.; Hercberg, S.; Langevin, B.; Lairon, D.; Pointereau, P.; et al. Comparing nutritional, economic, and environmental performances of diets according to their levels of greenhouse gas emissions. Clim. Chang. 2018, 148, 155–172. [Google Scholar] [CrossRef] [Green Version]
- Murakami, K.; Livingstone, M.B.E. Greenhouse gas emissions of self-selected diets in the UK and their association with diet quality: Is energy under-reporting a problem? Nutr. J. 2018, 17, 27. [Google Scholar] [CrossRef] [PubMed]
- Wickramasinghe, K.K.; Rayner, M.; Goldacre, M.; Townsend, N.; Scarborough, P. Contribution of healthy and unhealthy primary school meals to greenhouse gas emissions in England: Linking nutritional data and greenhouse gas emission data of diets. Eur. J. Clin. Nutr. 2016, 70, 1162–1167. [Google Scholar] [CrossRef] [PubMed] [Green Version]
- Heller, M.C.; Willits-Smith, A.; Meyer, R.; Keoleian, G.A.; Rose, D. Greenhouse gas emissions and energy use associated with production of individual self-selected US diets. Environ. Res. Lett. 2018, 13. [Google Scholar] [CrossRef] [PubMed]
- Hawkins, J.; Ma, C.B.; Schilizzi, S.; Zhang, F. China’s changing diet and its impacts on greenhouse gas emissions: An index decomposition analysis. Aust. J. Agric. Resour. Econ. 2018, 62, 45–64. [Google Scholar] [CrossRef]
- Green, R.F.; Joy, E.J.M.; Harris, F.; Agrawal, S.; Aleksandrowicz, L.; Hillier, J.; Macdiarmid, J.I.; Milner, J.; Vetter, S.H.; Smith, P.; et al. Greenhouse gas emissions and water footprints of typical dietary patterns in India. Sci. Total Environ. 2018, 643, 1411–1418. [Google Scholar] [CrossRef]
- Green, R.; Milner, J.; Dangour, A.D.; Haines, A.; Chalabi, Z.; Markandya, A.; Spadaro, J.; Wilkinson, P. The potential to reduce greenhouse gas emissions in the UK through healthy and realistic dietary change. Clim. Chang. 2015, 129, 253–265. [Google Scholar] [CrossRef]
- Kanemoto, K.; Moran, D.; Shigetomi, Y.; Reynolds, C.; Kondo, Y. Meat Consumption Does Not Explain Differences in Household Food Carbon Footprints in Japan. One Earth 2019, 1, 464–471. [Google Scholar] [CrossRef]
- Aleksandrowicz, L.; Haines, A.; Green, R. Sustainable Diet Studies Show Co-Benefits for Greenhouse Gas Emissions and Public Health. Adv. Nutr. 2015, 6, 282–283. [Google Scholar] [CrossRef] [Green Version]
- Poore, J.; Nemecek, T. Reducing food’s environmental impacts through producers and consumers. Science 2018, 360, 987–992. [Google Scholar] [CrossRef] [Green Version]
- Clark, M.A.; Springmann, M.; Hill, J.; Tilman, D. Multiple health and environmental impacts of foods. Proc. Natl. Acad. Sci. USA 2019, 116, 23357–23362. [Google Scholar] [CrossRef] [Green Version]
- He, P.; Baiocchi, G.; Feng, K.; Hubacek, K.; Yu, Y. Environmental impacts of dietary quality improvement in China. J. Environ. Manag. 2019, 240, 518–526. [Google Scholar] [CrossRef] [PubMed]
- Welch, R.M. Linkages between trace elements in food crops and human health. In Micronutrient Deficiencies in Global Crop Production; Alloway, I.B.J., Ed.; Springer: London, UK, 2008; pp. 287–309. [Google Scholar]
- Dinham, B.; Hines, C. Agribusiness in Africa—A Study of the Impact of Big Business on Africa’s Food and Agricultural Production; Earth Resources Research Ltd.: London, UK, 1983. [Google Scholar]
- Lall, S. Understanding Technology Development. Dev. Chang. 1993, 24, 719–753. [Google Scholar] [CrossRef]
- Foley, J.A.; Ramankutty, N.; Brauman, K.A.; Cassidy, E.S.; Gerber, J.S.; Johnston, M.; Mueller, N.D.; O’Connell, C.; Ray, D.K.; West, P.C.; et al. Solutions for a cultivated planet. Nature 2011, 478, 337–342. [Google Scholar] [CrossRef] [PubMed] [Green Version]
- Chicago Council on Global Affairs. Bringing agriculture to the table. In How Agriculture and Food Can Play a Role in Preventing Chronic Disease; The Council: Chicago, IL, USA, 2011; pp. 1–88. [Google Scholar]
- Rockström, J.; Steffen, W.; Noone, K.; Persson, Å.; Chapin Iii, F.S.; Lambin, E.F.; Lenton, T.M.; Scheffer, M.; Folke, C.; Schellnhuber, H.J.; et al. A safe operating space for humanity. Nature 2009, 461, 472. [Google Scholar] [CrossRef] [PubMed]
- Gold, K.; McBurney, R.P.H. Conservation of plant biodiversity for sustainable diets. In Sustainable Diets and Biodiversity: Directions and Solutions for Policy, Research and Action; Burlingame, B.D.S., Ed.; Food and Agriculture Organization: Rome, Italy, 2012; pp. 108–115. [Google Scholar]
- FAO. Agricultural biotechnology in developing countries: Options and opportunities in crops, forestry, livestock, fisheries and agro-industry to face the challenges of food insecurity and climate change (ABDC-10). In Current Status and Options for Biotechnologies in Food Processing and in Food Safety in Developing Countries; Food and Agriculture Organization of the United Nations: Roma, Italy, 2010; pp. 1–53. Available online: http://www.fao.org/3/mb384e/mb384e.pdf (accessed on 11 May 2020).
- FAO. Soil Pollution, a Hidden Reality; FAO: Roma, Italy, 2018; pp. 1–156. [Google Scholar]
- Amis de la Terre Europe (Friends of the Earth Europe). L’atlas de la Viande—La Réalité et les Chiffres sur les Animaux que nous Consommons; Friends of the Earth Europe: Brussels, Belgique, 2015; pp. 1–68. [Google Scholar]
- FAO. Principles for the Assessment of Livestock Impacts on Biodiversity; FAO: Rome, Italy, 2015; pp. 1–150. [Google Scholar]
- FAO. Tackling Climate Change through Livestock—A Global Assessment of Emissions and Mitigation Opportunities; FAO: Roma, Italy, 2013; pp. 1–139. [Google Scholar]
- FAO. Biodiversity and the Livestock Sector Guidelines for Quantitative Assessment; FAO: Rome, Italy, 2019; pp. 1–117. [Google Scholar]
- Gerber, P.; Vellinga, T.; Opio, C.; Steinfeld, H. Productivity gains and greenhouse gas emissions intensity in dairy systems. Livestock Sci. 2011, 139, 100–108. [Google Scholar] [CrossRef]
- Wilkes, A.; Solymosi, K.; Tennigkeit, T. Options for Support to Grassland Restoration in the Context of Climate Change Mitigation; UNIQUE Forestry and Land Use: Freiburg, Germany, 2012; pp. 1–60. [Google Scholar]
- Hitaj, C.; Rehkamp, S.; Canning, P.; Peters, C.J. Greenhouse Gas Emissions in the United States Food System: Current and Healthy Diet Scenarios. Environ. Sci. Technol. 2019, 53, 5493–5503. [Google Scholar] [CrossRef]
- Li, G.Q.; Geng, Y.H.; Pang, H.M. Study on Animal Environmental Welfare in the Intensive Livestock and Poultry Farms. In Proceedings of the 2015 International Conference on Economics, Social Science, Arts, Education and Management Engineering, Xi’an, China, 12–13 December 2015; Yao, Z.L., Chen, Y., Eds.; Atlantis Press: Beijing, China, 2015; Volume 38, pp. 284–289. [Google Scholar]
- Caulfield, M.P.; Cambridge, H. The questionable value of some science-based ’welfare’ assessments in intensive animal farming: Sow stalls as an illustrative example. Aust. Vet. J. 2008, 86, 446–448. [Google Scholar] [CrossRef]
- Gade, P.B. Welfare of animal production in intensive and organic systems with special reference to Danish organic pig production. Meat Sci. 2002, 62, 353–358. [Google Scholar] [CrossRef]
- FAO. L’état des Ressources Zoogénétiques Pour L’alimentation et L’agriculture Dans le Monde—En Bref; Commission des Ressources Génétiques Pour L’alimentation et L’agriculture: Roma, Italy, 2007; pp. 1–577. [Google Scholar]
- Chapelle, S. Élevage Industriel: La Biodiversité Animale Sous Contrôle des Multinationales. Available online: https://multinationales.org/Elevage-industriel-la-biodiversite-animale-sous-controle-des-multinationales#nb1 (accessed on 11 May 2020).
- Gura, S. Livestock breeding in the hands of corporations. Seedling 2008, 1, 1–9. [Google Scholar]
- Barnes, S.J. Understanding plastics pollution: The role of economic development and technological research. Environ. Pollut. 2019, 249, 812–821. [Google Scholar] [CrossRef]
- Plastics Europe. Données du Marché Pour le Secteur Européen des Plastiques—The Facts 2016 an Analysis of European Plastics Production, Demand and Waste Data; Bruxelles, Belgium, 2016; Available online: https://www.plasticseurope.org/fr/resources/market-data (accessed on 11 May 2020).
- Geyer, R.; Jambeck, J.R.; Law, K.L. Production, use, and fate of all plastics ever made. Sci. Adv. 2017, 3, e1700782. [Google Scholar] [CrossRef] [PubMed] [Green Version]
- Derraik, J.G.B. The pollution of the marine environment by plastic debris: A review. Mar. Pollut. Bulletin 2002, 44, 842–852. [Google Scholar] [CrossRef]
- Baldridge, A.S.; Huffman, M.D.; Taylor, F.; Xavier, D.; Bright, B.; Van Horn, L.V.; Neal, B.; Dunford, E. The Healthfulness of the US Packaged Food and Beverage Supply: A Cross-Sectional Study. Nutrients 2019, 11, 1704. [Google Scholar] [CrossRef] [PubMed] [Green Version]
- Jean-Pierre, S.; Susanna, G.; Mia, P.; David, M.; Emma, W.; Foivos, P.; Patrick ten, B.; Emilia, P.; Lacey, C.; Janssens, C. Gaspillage Alimentaire en Europe: Le Plastique à Usage Unique ne Résout pas le Problème. Comment Mieux Faire ? Une Etude de Zero Waste Europe et des Amis de la Terre Europe pour L’alliance Rethink Plastic; Zero Waste Europe et les Amis de la Terre Europe pour L’alliance Rethink Plastic: Brussels, Belgium, 2018; pp. 1–28. [Google Scholar]
- Ladha-Sabur, A.; Bakalis, S.; Fryer, P.J.; Lopez-Quiroga, E. Mapping energy consumption in food manufacturing. Trends Food Sci. Technol. 2019, 86, 270–280. [Google Scholar] [CrossRef]
- Andersson, K.; Ohlsson, T.; Olsson, P. Screening life cycle assessment (LCA) of tomato ketchup: A case study. J. Cleaner Prod. 1998, 6, 277–288. [Google Scholar] [CrossRef]
- Davis, J.; Sonesson, U. Life cycle assessment of integrated food chains—A Swedish case study of two chicken meals. Int. J. Life Cycle Assess. 2008, 13, 574. [Google Scholar] [CrossRef]
- FAO. The Future of Food and Agriculture: Trends and Challenges; FAO: Rome, Italy, 2017; pp. 1–180. [Google Scholar]
- U.S. Energy Information Administration (EIA). International Energy Outlook Executive Summary; U.S. Department of Energy: Washington, DC, USA, 2017; pp. 1–14. [Google Scholar]
- Food and Agriculture Organization of the United Nations. Energy-smart Food for People and Climate; Issue Paper; FAO: Roma, Italy, 2011; pp. 1–78. [Google Scholar]
- Sims, R.; Flammini, A.; Puri, M.; Bracco, S. Opportunities for Agri-Food Chains to Become Energy-Smart; FAO: Roma, Italy, 2015; pp. 1–212. [Google Scholar]
- Aguilera, J.; Simpson, R.; Welti-Chanes, J.; Aguirre, D.; Barbosa-Cánovas, G. Food Engineering Interfaces; Springer: New York, NY, USA, 2011. [Google Scholar]
- Wu, H.; Tassou, S.A.; Karayiannis, T.G.; Jouhara, H. Analysis and simulation of continuous food frying processes. Appl. Thermal Eng. 2013, 53, 332–339. [Google Scholar] [CrossRef]
- Therkelsen, P.; Masanet, E.; Worrell, E. Energy efficiency opportunities in the U.S. commercial baking industry. J. Food Eng. 2014, 130, 14–22. [Google Scholar] [CrossRef]
- Briam, R.; Walker, M.E.; Masanet, E. A comparison of product-based energy intensity metrics for cheese and whey processing. J. Food Eng. 2015, 151, 25–33. [Google Scholar] [CrossRef]
- Foster, C.; Green, K.; Bleda, M.; Dewick, P.; Evans, B.; Flynn, A.; Mylan, J. Environmental Impacts of Food Production and Consumption: A Report to the Department for Environment; Food and Rural Affairs; Manchester Business School: Manchester, UK, 2006; pp. 1–199. [Google Scholar]
- European Commision. Integrated Pollution Prevention and Control—Reference Document of Best Available Techniques in the Food, Drink and Milk Industries; European Commision: Seville, Spain, 2006; pp. 1–682. [Google Scholar]
- Pardo, G.; Zufía, J. Life cycle assessment of food-preservation technologies. J. Clean. Prod. 2012, 28, 198–207. [Google Scholar] [CrossRef]
- Almena, A.; Lopez-Quiroga, E.; Theodoropoulos, C.; Fryer, P.J.; Bakalis, S. Modelling, Simulation and Economical Evaluation of Dry Food Manufacture at Different Production Scales. In Computer Aided Chemical Engineering; Espuña, A., Graells, M., Puigjaner, L., Eds.; Elsevier: Amsterdam, The Netherlands, 2017; Volume 40, pp. 787–792. [Google Scholar]
- Sobal, J.; Khan, L.K.; Bisogni, C. A conceptual model of the food and nutrition system. Soc. Sci. Med. 1998, 47, 853–863. [Google Scholar] [CrossRef]
- Fardet, A.; Méjean, C.; Labouré, H.; Andreeva, V.A.; Féron, G. The degree of processing of foods which are most widely consumed by the French elderly population is associated with satiety and glycemic potentials and nutrient profiles. Food Funct. 2017, 8, 651–658. [Google Scholar] [CrossRef] [PubMed]
- Cornwell, B.; Villamor, E.; Mora-Plazas, M.; Marin, C.; Monteiro, C.A.; Baylin, A. Processed and ultra-processed foods are associated with lower-quality nutrient profiles in children from Colombia. Public Health Nutr. 2018, 21, 142–147. [Google Scholar] [CrossRef] [PubMed] [Green Version]
- Rauber, F.; da Costa Louzada, M.L.; Steele, E.; Millett, C.; Monteiro, C.A.; Levy, R.B. Ultra-Processed Food Consumption and Chronic Non-Communicable Diseases-Related Dietary Nutrient Profile in the UK (2008–2014). Nutrients 2018, 10, 587. [Google Scholar] [CrossRef] [PubMed] [Green Version]
- Louzada, M.L.; Martins, A.P.; Canella, D.S.; Baraldi, L.G.; Levy, R.B.; Claro, R.M.; Moubarac, J.C.; Cannon, G.; Monteiro, C.A. Impact of ultra-processed foods on micronutrient content in the Brazilian diet. Rev. Saude Publica 2015, 49, 1–8. [Google Scholar] [CrossRef]
- Alpha, A. Les ravages de la standardisation des produits et des goûts. Econ. Humanism 2007, 380, 36–39. [Google Scholar]
- Fumey, G. La mondialisation de l’alimentation. L’Information Géographique 2007, 71, 71–82. [Google Scholar] [CrossRef]
- Filgueiras, A.R.; Pires de Almeida, V.B.; Koch Nogueira, P.C.; Alvares Domene, S.M.; Eduardo da Silva, C.; Sesso, R.; Sawaya, A.L. Exploring the consumption of ultra-processed foods and its association with food addiction in overweight children. Appetite 2018, 135, 137–145. [Google Scholar] [CrossRef]
- Bonaccio, M.; Bonanni, A.E.; Di Castelnuovo, A.; De Lucia, F.; Donati, M.B.; de Gaetano, G.; Iacoviello, L.; Moli-sani Project, I. Low income is associated with poor adherence to a Mediterranean diet and a higher prevalence of obesity: Cross-sectional results from the Moli-sani study. BMJ Open 2012, 2, e001685. [Google Scholar] [CrossRef] [Green Version]
- Gough, M.; Lippert, A.M.; Martin, M.A. The Role of Time Use Behaviors in the Risk of Obesity among Low-Income Mothers. Womens Health Issues 2019, 29, 23–30. [Google Scholar] [CrossRef]
- Dunachie, S.; Chamnan, P. The double burden of diabetes and global infection in low and middle-income countries. Trans. R. Soc. Trop. Med. Hyg. 2019, 113, 56–64. [Google Scholar] [CrossRef] [PubMed]
- International Diabetes Federation. IDF Diabetes Atlas, 8th ed.; International Diabetes Federation: Brussels, Belgium, 2017. [Google Scholar]
- Julia, C.; Martinez, L.; Alles, B.; Touvier, M.; Hercberg, S.; Mejean, C.; Kesse-Guyot, E. Contribution of ultra-processed foods in the diet of adults from the French NutriNet-Sante study. Public Health Nutr. 2018, 21, 27–37. [Google Scholar] [CrossRef] [PubMed] [Green Version]
- Rico-Campà, A.; Martínez-González, M.A.; Alvarez-Alvarez, I.; Mendonça, R.d.D.; de la Fuente-Arrillaga, C.; Gómez-Donoso, C.; Bes-Rastrollo, M. Association between consumption of ultra-processed foods and all cause mortality: SUN prospective cohort study. BMJ 2019, 365, 1949. [Google Scholar] [CrossRef] [PubMed] [Green Version]
- Kim, H.; Hu, E.A.; Rebholz, C.M. Ultra-processed food intake and mortality in the USA: Results from the Third National Health and Nutrition Examination Survey (NHANES III, 1988–1994). Public Health Nutr. 2019, 22, 1777–1785. [Google Scholar] [CrossRef]
- Steele, E.M.; Juul, F.; Neri, D.; Rauber, F.; Monteiro, C.A. Dietary share of ultra-processed foods and metabolic syndrome in the US adult population. Prev. Med. 2019, 125, 40–48. [Google Scholar] [CrossRef]
- Park, S.; Lee, Y.; Lee, J.H. Association between energy drink intake, sleep, stress, and suicidality in Korean adolescents: Energy drink use in isolation or in combination with junk food consumption. Nutr. J. 2016, 15, 87. [Google Scholar] [CrossRef] [Green Version]
- Bae, Y.S.; Young, K.J.; June, N.S.; Jong-Ho, L.; Won, J.J. Social isolation stress during adolescence may promote consumption of palatable food in female rats. J. Neurochem. 2009, 110, 199–200. [Google Scholar]
- Cook, K.; Sumis, A.; Kidney, E.; Andrade, F.; Hu, R.; Zhang, X.Y.; Yu, W.; Bouker, K.B.; Clarke, R.; Hilakivi-Clarke, L. Social isolation stress induces obesity and unfolded protein response and autophagy in the mammary gland, and increases mammary tumorigenesis in mice. Anticancer Res. 2014, 34, 5948–5949. [Google Scholar]
- Atasoy, S.; Ladwig, K.H.; Kruse, J.; Lukaschek, K.; Peters, A. Inverse relationship between social isolation and type 2 diabetes incidence in people with obesity: Findings from the MONICA/KORA prospective cohort. J. Psychosom. Res. 2019, 121, 124. [Google Scholar] [CrossRef]
- Ames, M.; Leadbeater, B. Overweight and isolated: The interpersonal problems of youth who are overweight from adolescence into young adulthood. Int. J. Behav. Dev. 2017, 41, 390–404. [Google Scholar] [CrossRef]
- Rauber, F.; Steele, E.M.; Louzada, M.L.d.C.; Millett, C.; Monteiro, C.A.; Levy, R.B. Ultra-processed food consumption and indicators of obesity in the United Kingdom population (2008–2016). PLoS ONE 2020, 15, e0232676. [Google Scholar] [CrossRef]
- Jackson, S.E.; Llewellyn, C.H.; Smith, L. The obesity epidemic—Nature via nurture: A narrative review of high-income countries. SAGE Open Med. 2020, 8, 2050312120918265. [Google Scholar] [CrossRef] [PubMed]
- Kibrom, A.; Ibrahim, H.; Breisinger, C. Food Policies and Obesity in Low and Middle Income Countries; IFRI Middle East and Africa Working Papers: Paris, France, 2020. [Google Scholar]
- Action Aid. Farmgate: The Developmental Impact of Agricultural Subsidies. Available online: https://www.actionaid.org.uk/sites/default/files/content_document/farmgate_3132004_12159.pdf (accessed on 1 August 2019).
- Drewnowski, A.; Darmon, N. The economics of obesity: Dietary energy density and energy cost. Am. J. Clin. Nutr. 2005, 82, 265–273. [Google Scholar] [CrossRef] [PubMed]
- Tilman, D.; Clark, M. Global diets link environmental sustainability and human health. Nature 2014, 515, 518–522. [Google Scholar] [CrossRef]
- Scheelbeek, P.F.D.; Cornelsen, L.; Marteau, T.M.; Jebb, S.A.; Smith, R.D. Potential impact on prevalence of obesity in the UK of a 20% price increase in high sugar snacks: Modelling study. BMJ 2019, 366, l4786. [Google Scholar] [CrossRef] [Green Version]
- Ruanpeng, D.; Thongprayoon, C.; Cheungpasitpom, W.; Harindhanavudhi, T. Sugar and artificially sweetened beverages linked to obesity: A systematic review and meta-analysis. QJM Int. J. Med. 2017, 110, 513–520. [Google Scholar] [CrossRef] [PubMed] [Green Version]
- Sun, Q.; Spiegelman, D.; van Dam, R.M.; Holmes, M.D.; Malik, V.S.; Willett, W.C.; Hu, F.B. White rice, brown rice, and risk of type 2 diabetes in US men and women. Arch. Int. Med. 2010, 170, 961–969. [Google Scholar] [CrossRef] [PubMed]
- Cox, P.; Piqué i Camps, J.; European Parliament; European Parliament. Regulation (EC) No 178/2002 of the European Parliament and of the Council of 28 January 2002 Laying Down the General Principles and Requirements of Food Law, Establishing the European Food Safety Authority and Laying down Procedures in Matters of Food Safety; Parliament, E., Ed.; Journal Officiel des Communautés Européennes: Brussels, Belgium, 2002; Volume 178/2002, pp. 1–24. [Google Scholar]
- Fardet, A.; Rock, E. How to protect both health and food system sustainability? A holistic ‘global health’-based approach via the 3V rule proposal. Public Health Nutr. 2020, in press. [Google Scholar]
- Willett, W.; Rockström, J.; Loken, B.; Springmann, M.; Lang, T.; Vermeulen, S.; Garnett, T.; Tilman, D.; DeClerck, F.; Wood, A.; et al. Food in the Anthropocene: The EAT–Lancet Commission on healthy diets from sustainable food systems. Lancet 2019, 393, 2–8. [Google Scholar] [CrossRef]
- Millenium Institute. Global Food and Nutrition Scenarios—Final Report; Millenium Institute: Washington, DC, USA, 2013; pp. 1–23. [Google Scholar]
- WWF France. Eco2Initiative, Vers une Alimentation bas Carbone, Saine et Abordable—Prospective des Régimes Alimentaires et Evolution de L’empreinte Carbone de L’alimentation en France (Volet 2); WWF France: Le Pré-Saint-Gervais, France, 2018; pp. 1–16. [Google Scholar]
- WWF France. Eco2Initiative, Vers une Alimentation bas Carbone, Saine et Abordable—Etude Comparative Multidimensionnelle de Paniers Alimentaires Durables: Impact Carbone, Qualité Nutritionnelle et Coûts (Volet 1); WWF France: Le Pré-Saint-Gervais, France, 2017; pp. 1–47. [Google Scholar]
- Poux, X.; Aubert, P.M. Une Europe Agroécologique en 2050: Une Agriculture Multifonctionnelle pour une Alimentation Saine Enseignements d’une Modélisation du Système Alimentaire Européen; IDDRI (Institut du Développement Durable et des Relations Internationales): Paris, france, 2018; pp. 1–78. [Google Scholar]
- Karlsson, J.; Röös, E.; Sjunnestrand, T.; Pira, K. Future Nordic Diets: Exploring Ways for Sustainably Feeding the Nordics; Nordisk Ministerråd: Copenhagen, Denmark, 2017; pp. 1–98. [Google Scholar]
- Stolze, M.; Schader, C.; Müller, A.; Frehner, A.; Giuliani, F.; Kopainsky, B.; Soceco, R.; Nathani, C.; Brandes, J.; Rohrmann, S.; et al. Sustainable and Healthy Diets: Trade-Offs and Synergies. Final Scientific Report—NRP 69 “Healthy Nutrition and Sustainable Food Production”; FiBL: Frick, Switzerland, 2019; pp. 1–86. [Google Scholar]
Figure 1.
The potential impacts of ultra-processed foods (UPFs) on the six dimensions of food system sustainability.
Figure 1.
The potential impacts of ultra-processed foods (UPFs) on the six dimensions of food system sustainability.

Figure 2.
Schematic representation of UPFs through fractionation of original raw foods and ingredient recombination with ‘cosmetic’ additives. Figure was originally supplied by the Siga Society©.
Figure 2.
Schematic representation of UPFs through fractionation of original raw foods and ingredient recombination with ‘cosmetic’ additives. Figure was originally supplied by the Siga Society©.

Figure 3.
Three types of food processing within the food system (adapted from Monteiro [33] and Keding et al. [1]).

Figure 4.
Energy consumed in processing: (A) fruits and vegetables, and (B) dairy products (from Ladha-Sabur et al. [87], with permission of Elsevier under the terms of the Creative Commons CC-BY license©).
Figure 4.
Energy consumed in processing: (A) fruits and vegetables, and (B) dairy products (from Ladha-Sabur et al. [87], with permission of Elsevier under the terms of the Creative Commons CC-BY license©).

Figure 5.
A summary of the impact of increased UPF consumption on food system sustainability.


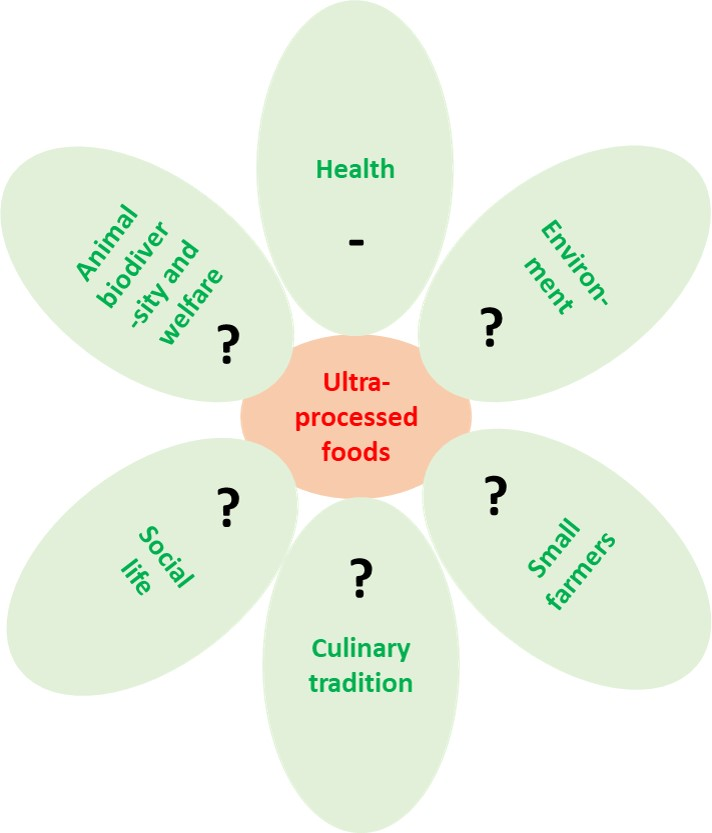
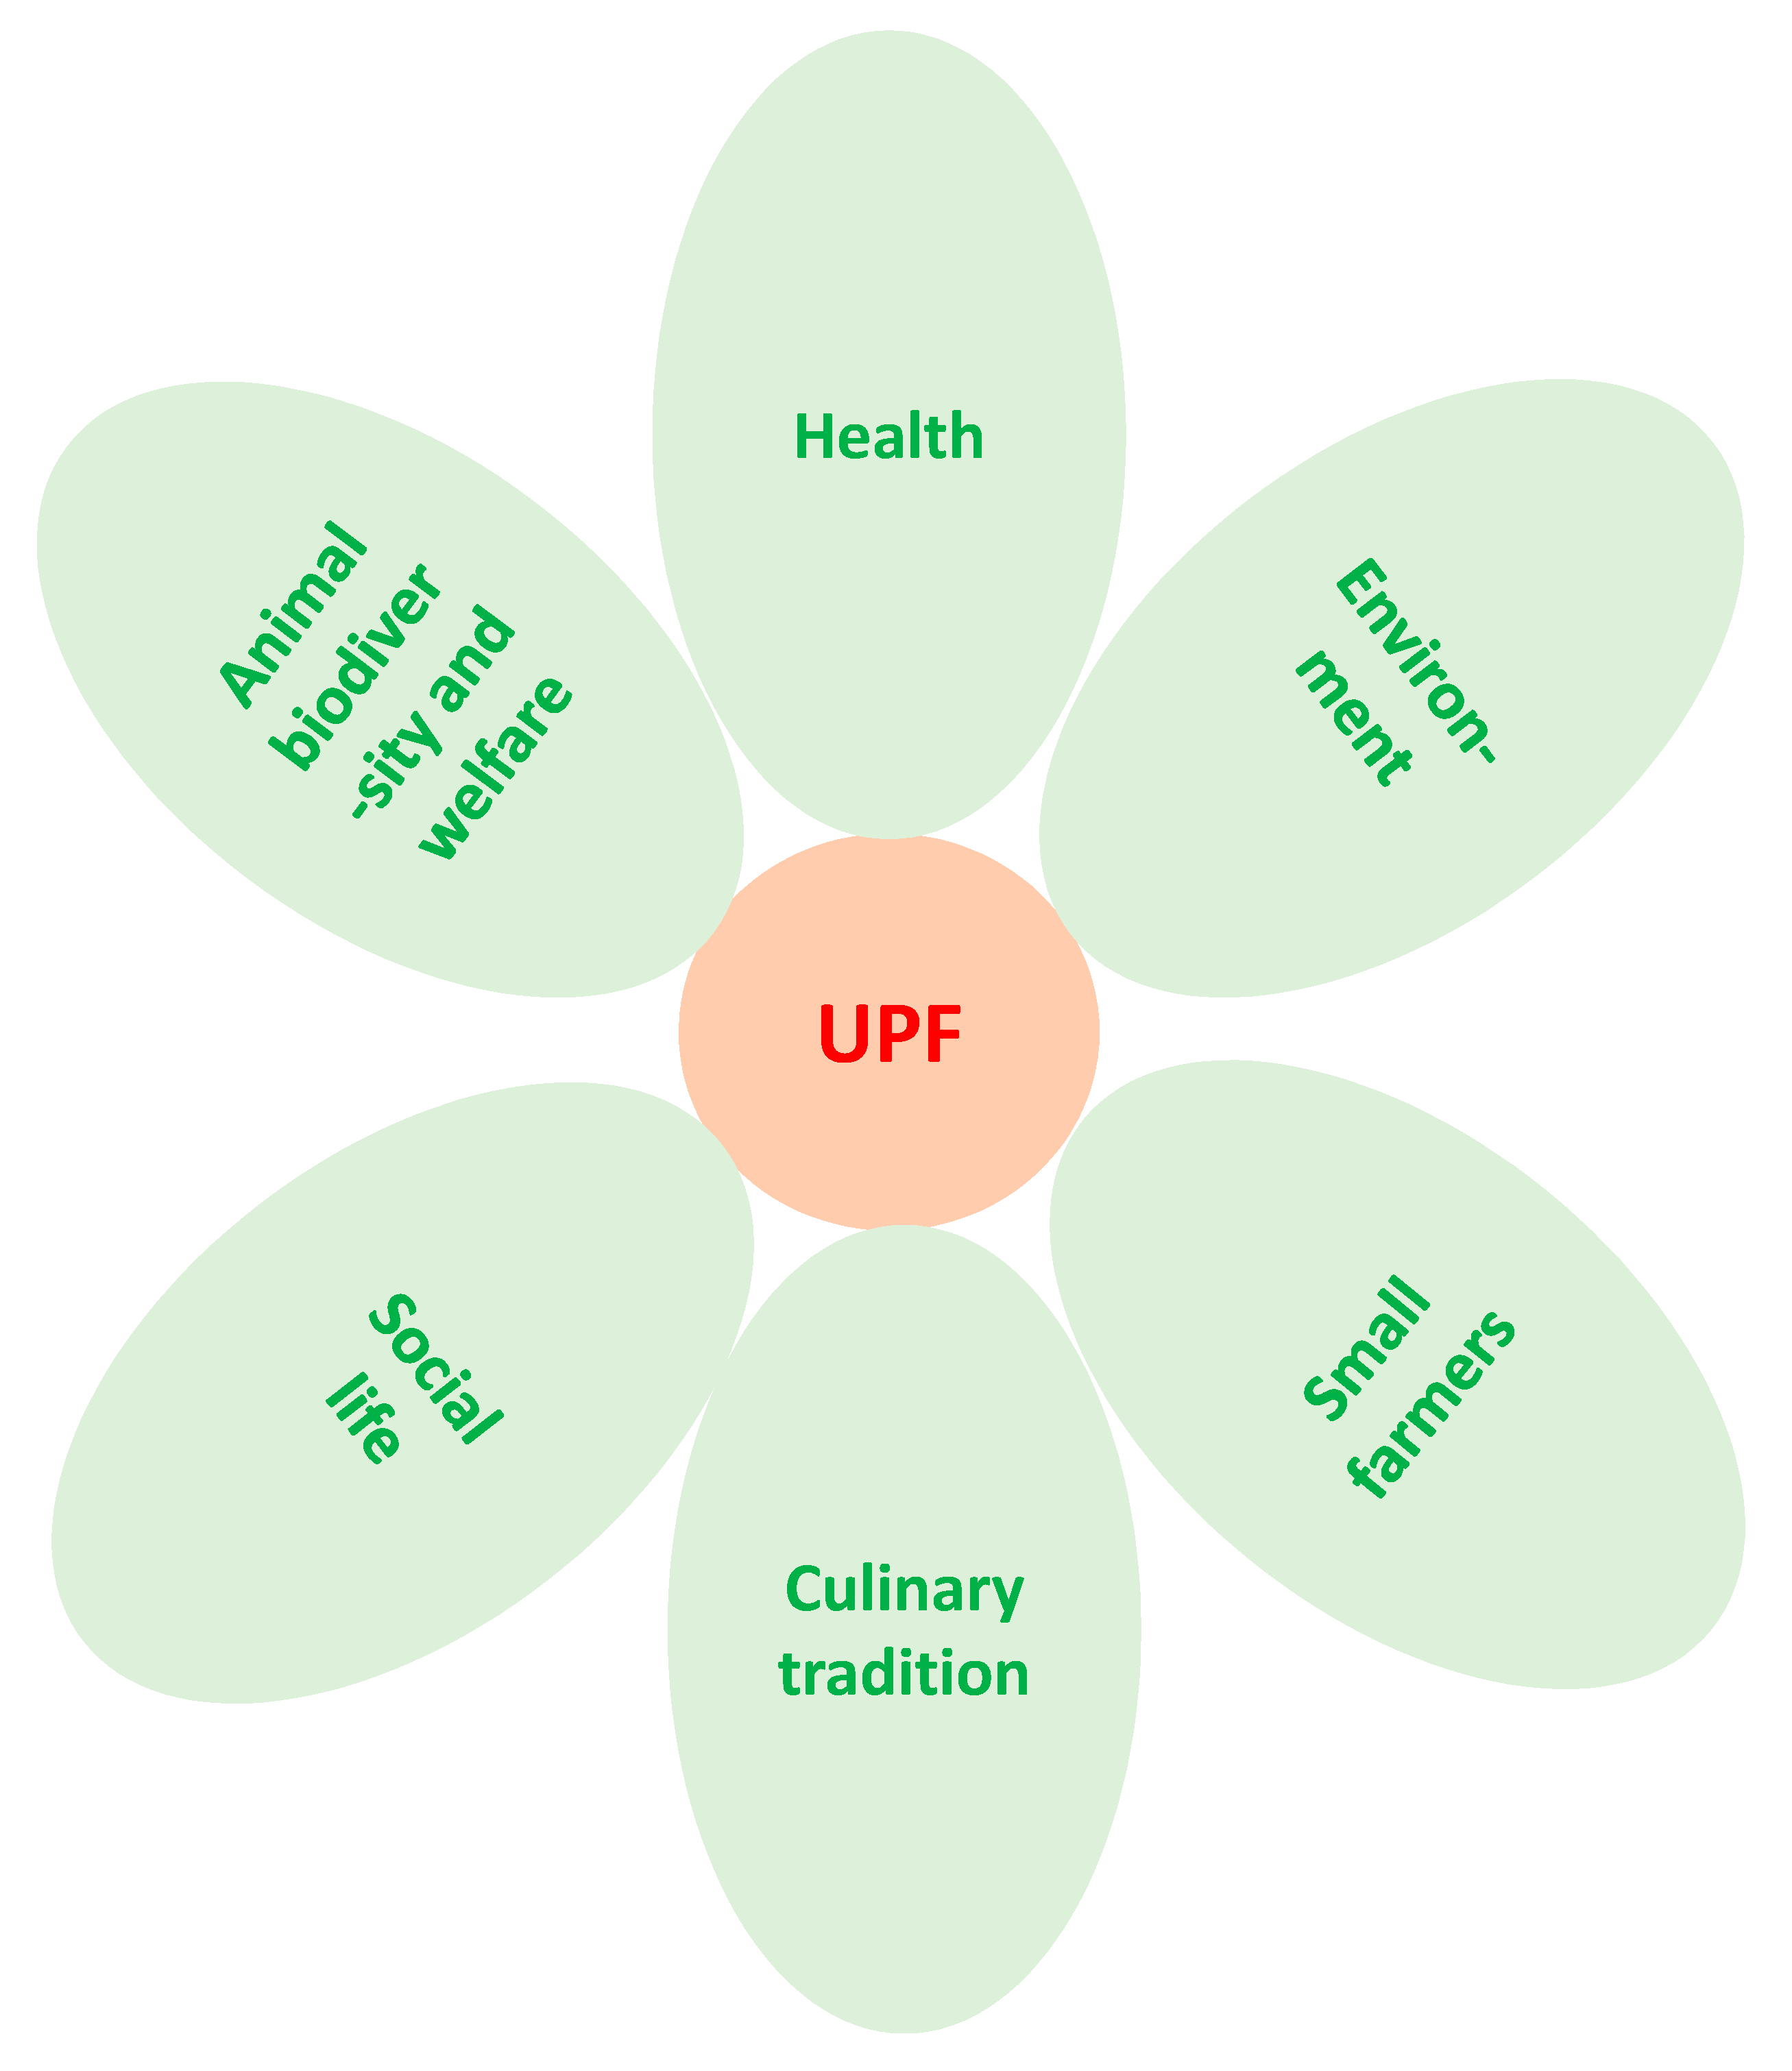
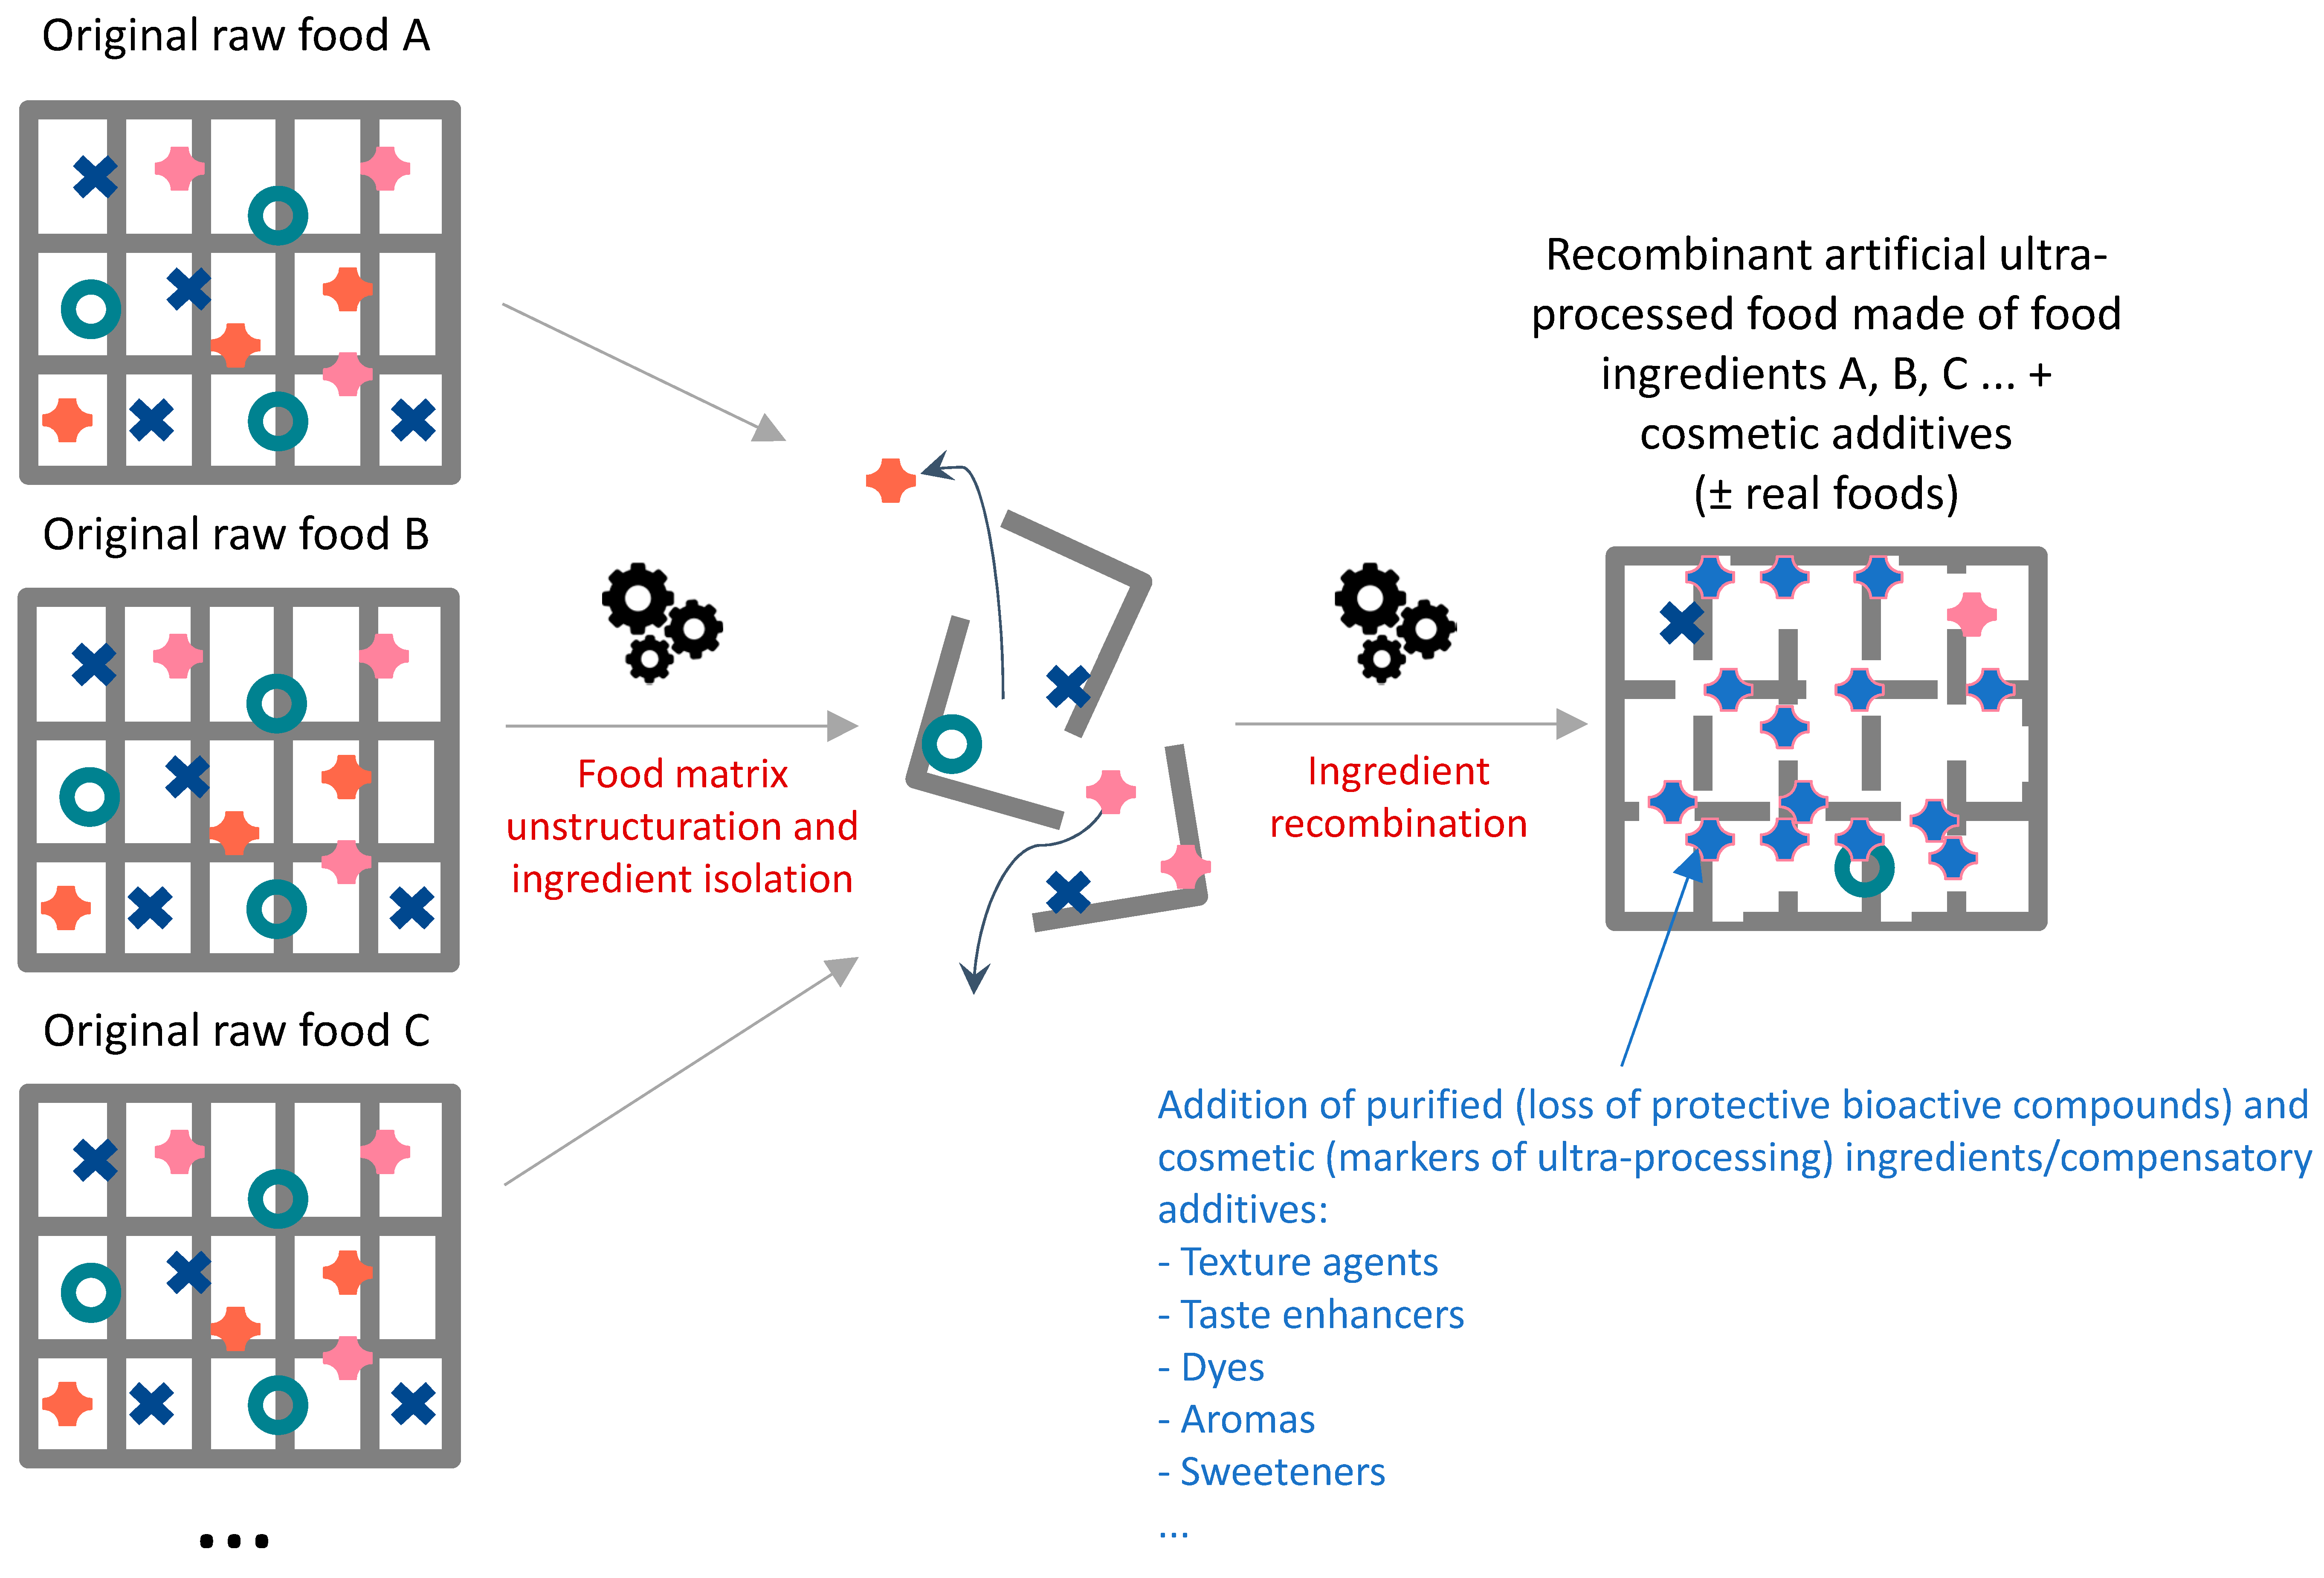
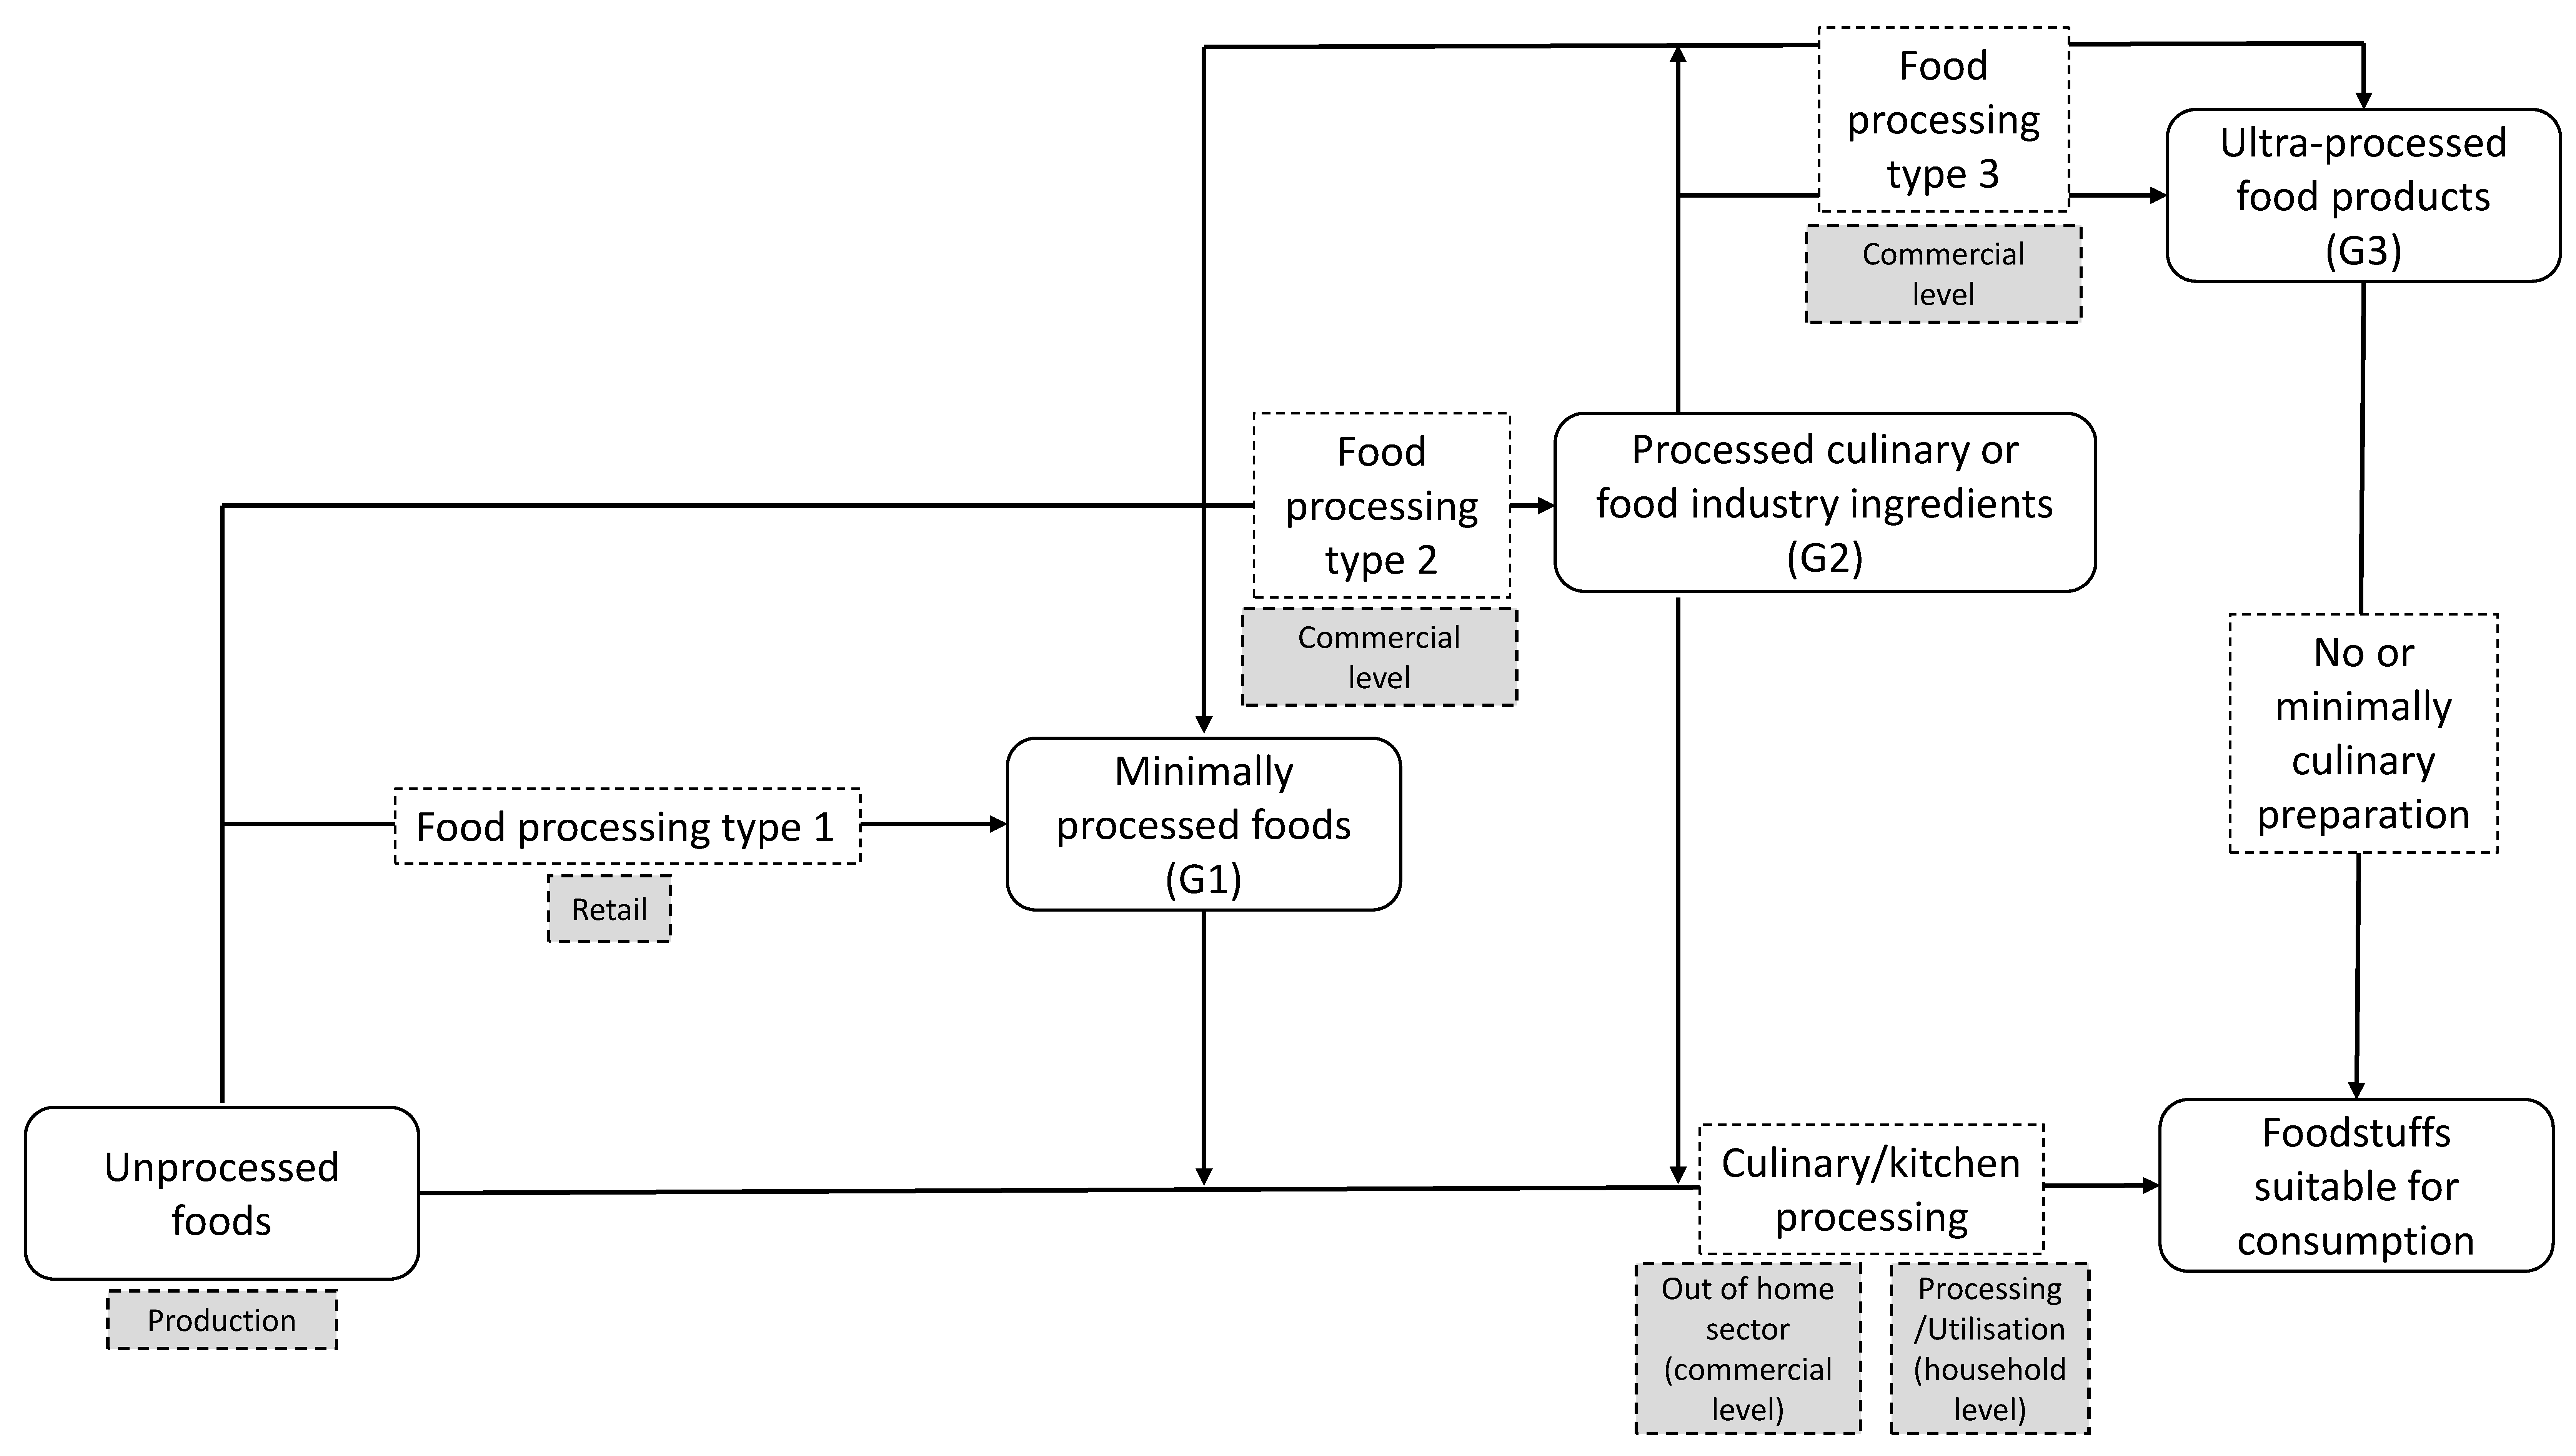
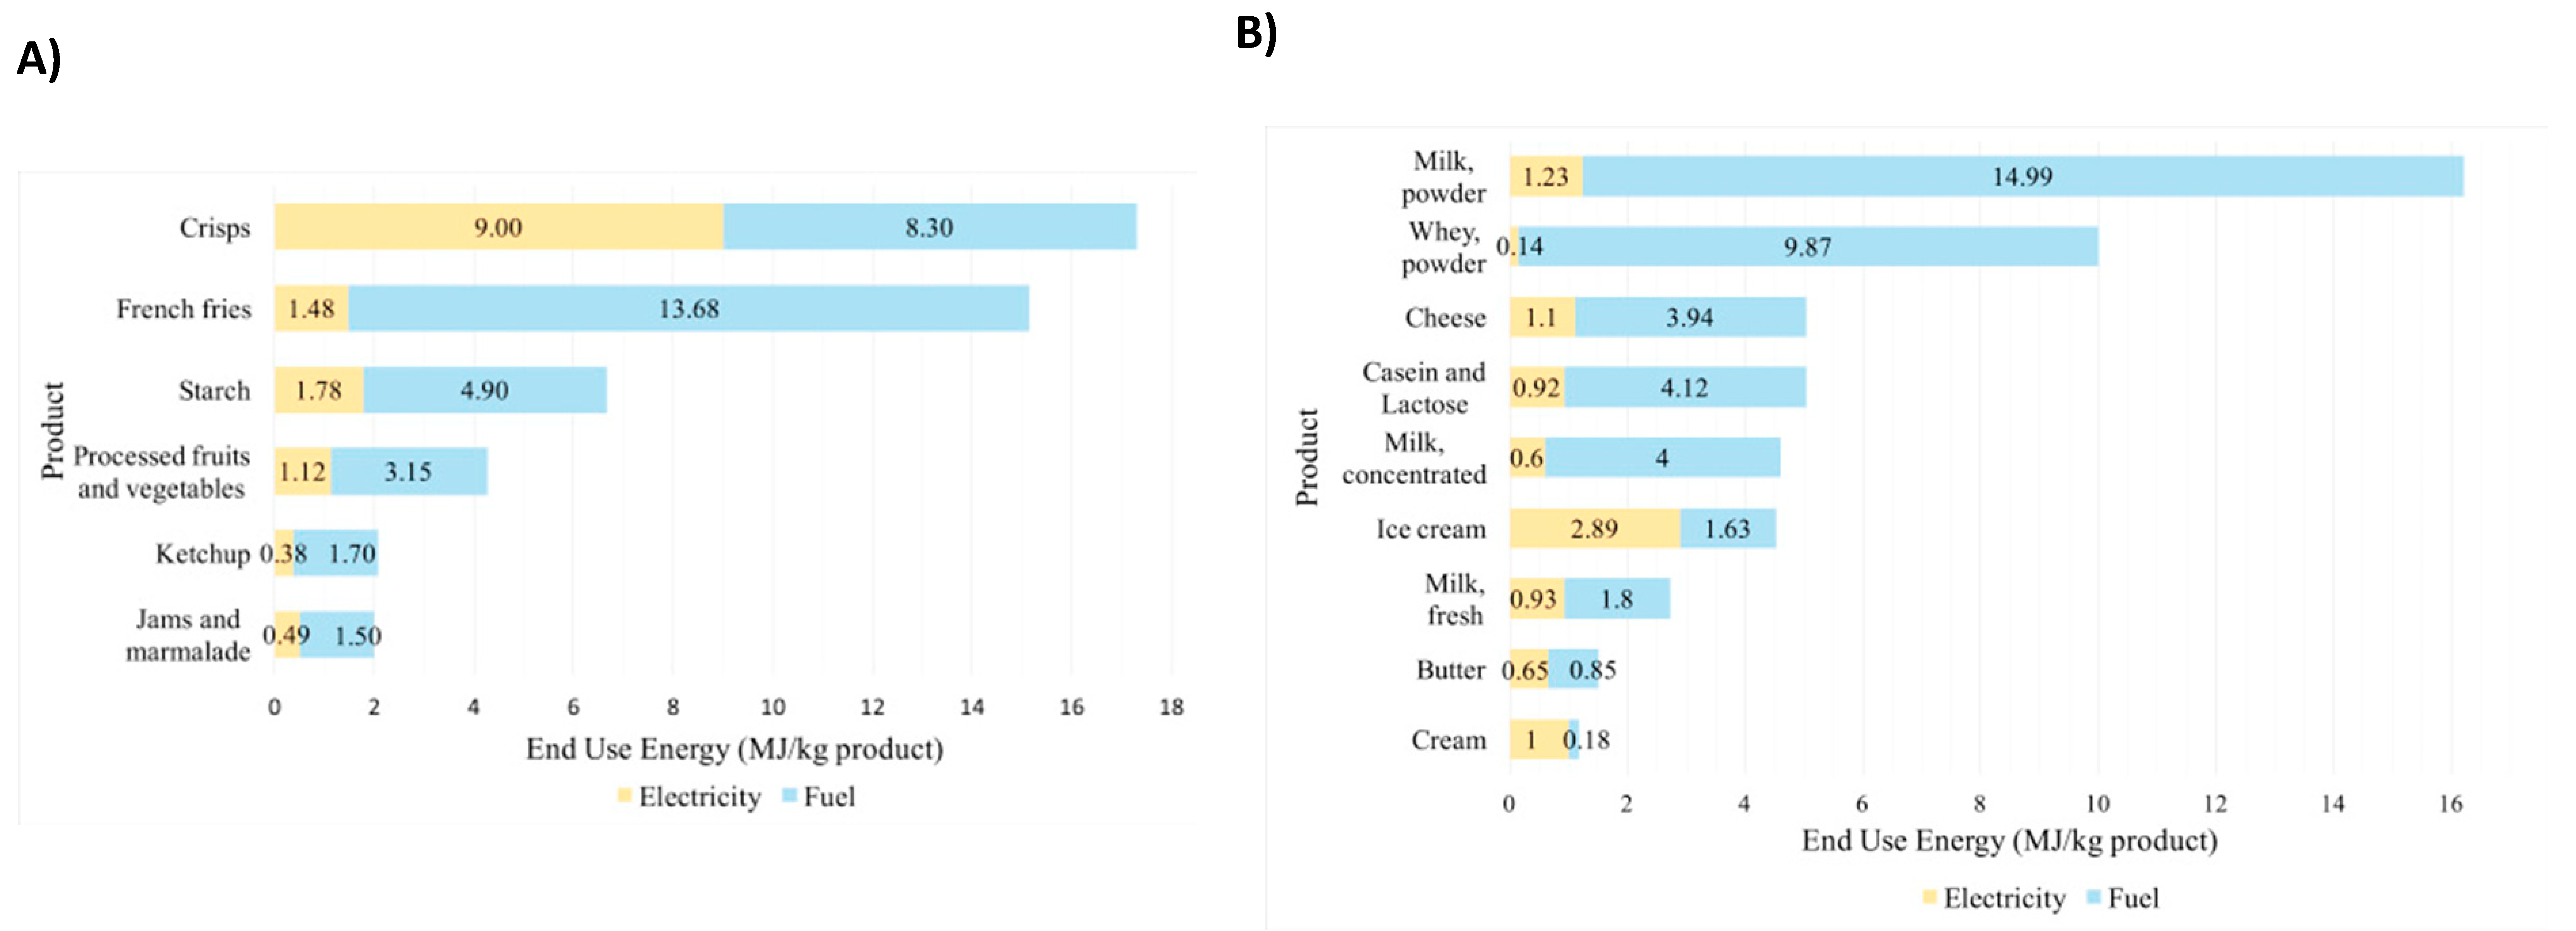
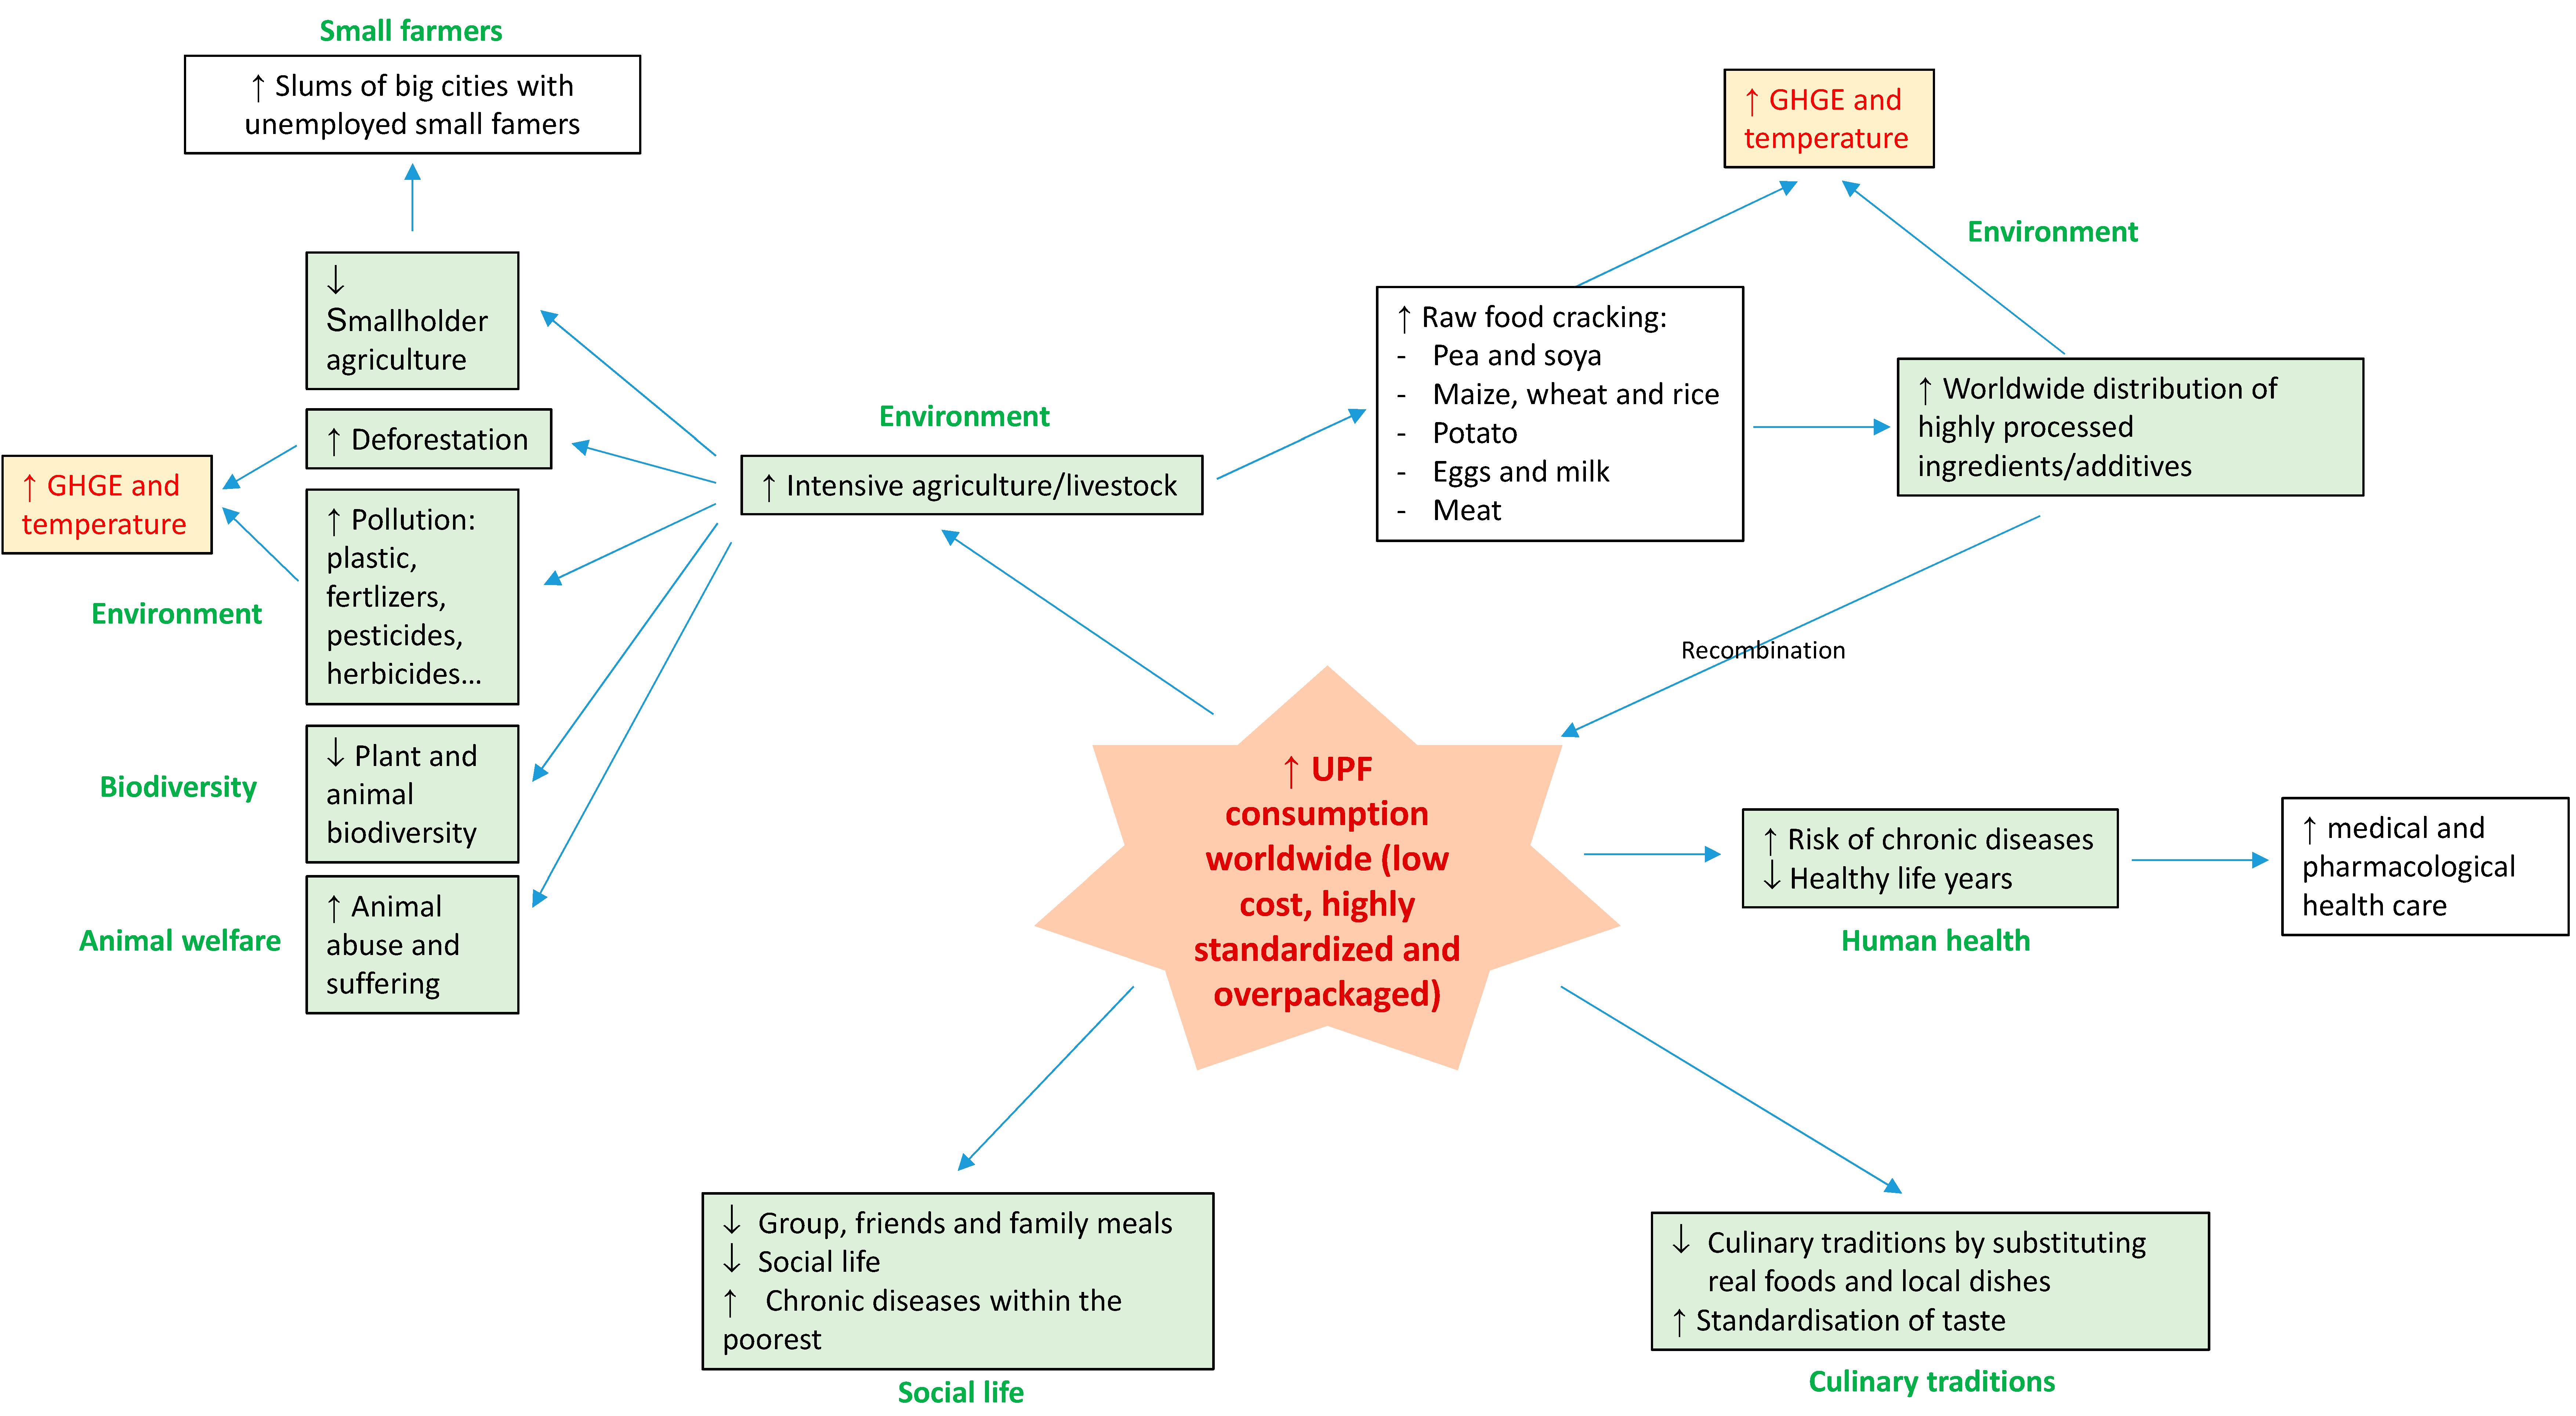
Table 1.
Number of food products for the different non-additive ingredients characteristic of ultra-processing 1.
Table 1.
Number of food products for the different non-additive ingredients characteristic of ultra-processing 1.
| Ingredients | Number of Food Products 2 | Percentage of All Products in the Open Food Facts Database 2 |
|---|---|---|
| Ultra-processed carbohydrates: | ||
| Glucose-fructose syrup/glucose syrup/(oligo)fructose | >52,154 | >7.6 |
| Starch | >22,389 | >3.2 |
| Dextrose | >21,340 | >3.1 |
| Lactose | >11,232 | >1.6 |
| Malt (extract) | >8292 | >1.2 |
| Maltodextrins/dextrins | >7756 | >1.1 |
| Invert sugar | >4349 | >0.6 |
| Ultra-processed lipids: | ||
| Refined plant-based oils and fats 3 | >64,811 | >9.4 |
| Hydrogenated oils | >99 | >0.01 |
| Ultra-processed proteins: | ||
| Milk/whey/casein protein | >11,789 | >1.7 |
| Gluten | >11,428 | >1.7 |
| Gelatine | >3970 | >0.6 |
| Soy protein | >1953 | >0.3 |
| Pea protein | >1289 | >0.2 |
| Protein hydrolysate/hydrolysed proteins | >307 | >0.04 |
| Egg white and protein | >62 | >0.01 |
| Aroma 4: | >72,348 | >10.5 |
1 Collected from the French Open Food Fact database, which contains 690,499 products (on 20 June 2020, as described previously [24]); 2 Ingredient lists are not given for all products in the Open Food Facts database: therefore, given values are only minimum values. 3 Refined oils are not strictly characteristic of UPFs in NOVA classification; however, due to the high level of processing that refined oils undergo, they were considered in this analysis, as in the Siga score methodology [13]. 4 Includes artificial and natural aromas.
Table 2.
Number of food products for the different ‘cosmetic’ additives characteristic of ultra-processing 1.
Table 2.
Number of food products for the different ‘cosmetic’ additives characteristic of ultra-processing 1.
| Additives | Number of Food Products 2 | Percentage of all Products in the Open Food Facts Database 2 |
|---|---|---|
| Texture: | ||
| E322: lecithins | >23,640 | >3.4 |
| E14XX: modified starches | >16,405 | >2.4 |
| E415: xanthan gum | >12,015 | >1.7 |
| E471: mono and diglycerides of fatty acids | >11,828 | >1.7 |
| E440: pectin | >10,172 | >1.5 |
| E450: diphosphates, pyrophosphates | >10,644 | >1.5 |
| E412: guar gum | >9177 | >1.3 |
| E407: carraghenans | >8616 | >1.2 |
| E420: sorbitol | >4285 | >0.6 |
| E406: agar-agar | >842 | >0.1 |
| E1200: polydextrose | >375 | >0.1 |
| E421: mannitol | >235 | >0.03 |
| Colour: | ||
| E160c: paprika extract, capsanthin, capsorubin | >5101 | >0.7 |
| E160a: carotenes | >4347 | >0.6 |
| E120: cochineal, carmines, carminic acid | >3560 | >0.5 |
| E150a: plain caramel | >3097 | >0.5 |
| E133: Brilliant blue FCF | >1450 | >0.2 |
| Flavour/taste: | ||
| E621: monosodium glutamate | >3710 | >0.5 |
| E955: sucralose | >2436 | >0.4 |
| E950: acesulfame potassium | >2329 | >0.3 |
| E951: aspartame | >1249 | >0.2 |
| E960: steviol glycosides | >880 | >0.1 |
| E953: isomalt | >443 | >0.06 |
| E967: xylitol | >394 | >0.06 |
| E954: saccharine | >238 | >0.03 |
1 Collected from the French Open Food Fact database, which contains 690,499 products (on 20 June 2020, as described previously [24]); 2 Ingredient lists are not given for all products in the Open Food Facts database; therefore, given values are only minimum values.
Table 3.
Average GHGEs for the main pesticides and fertilizers 1.
| kg CO2/kg of Active Ingredient | kg CH4/kg of Active Ingredient | kg N2O/kg of Active Ingredient | |
|---|---|---|---|
| Pesticides: | |||
| Herbicides | 8.33217 | 0.02548 | 0.00022 |
| Fungicides | 5.537 | 0.01855 | 0.00015 |
| Insecticides | 23.7 | 0.0543 | 0.00063 |
| Growth regulators | 7.86 | 0.0241 | 0.00021 |
| Fertilizers 2: | kg CO2/unit | kg CO2/unit | kg CO2/unit |
| Manure in heap (ton) | 2940.000 | 0.0647 | 9.120 |
| Liquid manure (m3) | 2920.000 | 0.0988 | 6.960 |
| kg CO2eq./kg of nutrient | |||
| Nitrogen fertilizer | 5.34 | ||
| Phosphate fertilizer | 0.57 | ||
| Potassium fertilizer | 0.45 |
1 Retrieved from the ADEME website (on 20 June 2020) at http://www.bilans-ges.ademe.fr/documentation/UPLOAD_DOC_FR/index.htm?pesticides_et_autres_produits_.htm, and http://www.bilans-ges.ademe.fr/documentation/UPLOAD_DOC_FR/index.htm?engrais_et_composes_azotes.htm. Values are from GES’TIM, the methodological guide for estimating the impacts of agricultural activities on the greenhouse effect; 2 GHGE per kg of nitrogen in the fertilizer.
© 2020 by the authors. Licensee MDPI, Basel, Switzerland. This article is an open access article distributed under the terms and conditions of the Creative Commons Attribution (CC BY) license (http://creativecommons.org/licenses/by/4.0/).
Share and Cite
MDPI and ACS Style
Fardet, A.; Rock, E. Ultra-Processed Foods and Food System Sustainability: What Are the Links? Sustainability 2020, 12, 6280. https://0-doi-org.brum.beds.ac.uk/10.3390/su12156280
AMA Style
Fardet A, Rock E. Ultra-Processed Foods and Food System Sustainability: What Are the Links? Sustainability. 2020; 12(15):6280. https://0-doi-org.brum.beds.ac.uk/10.3390/su12156280
Chicago/Turabian StyleFardet, Anthony, and Edmond Rock. 2020. "Ultra-Processed Foods and Food System Sustainability: What Are the Links?" Sustainability 12, no. 15: 6280. https://0-doi-org.brum.beds.ac.uk/10.3390/su12156280
Note that from the first issue of 2016, this journal uses article numbers instead of page numbers. See further details here.