Quantifying Regulating Ecosystem Services with Increased Tree Densities on European Farmland

 ,
,  ,
,  , and
, and
Abstract
:
1. Introduction
2. Materials & Methods
2.1. Agroforestry Case Study Systems
2.1.1. Iberian Wood Pastures in Portugal and Spain
2.1.2. Grazed Cherry Orchards in Switzerland
2.1.3. Silvoarable Systems in the UK
2.1.4. Short Rotation Coppice Systems in Germany
2.2. Integration of Regulation Services in a Simulation Model
2.2.1. Regulation of Soil Erosion
2.2.2. Regulation of Nitrate Leaching
2.2.3. Carbon Sequestration
2.3. Use of the Model
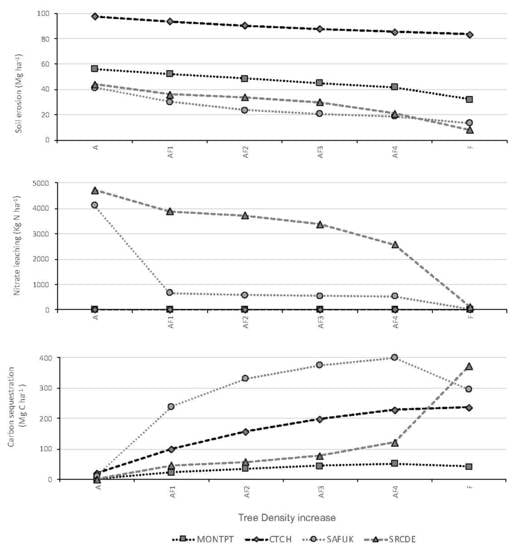
3. Results
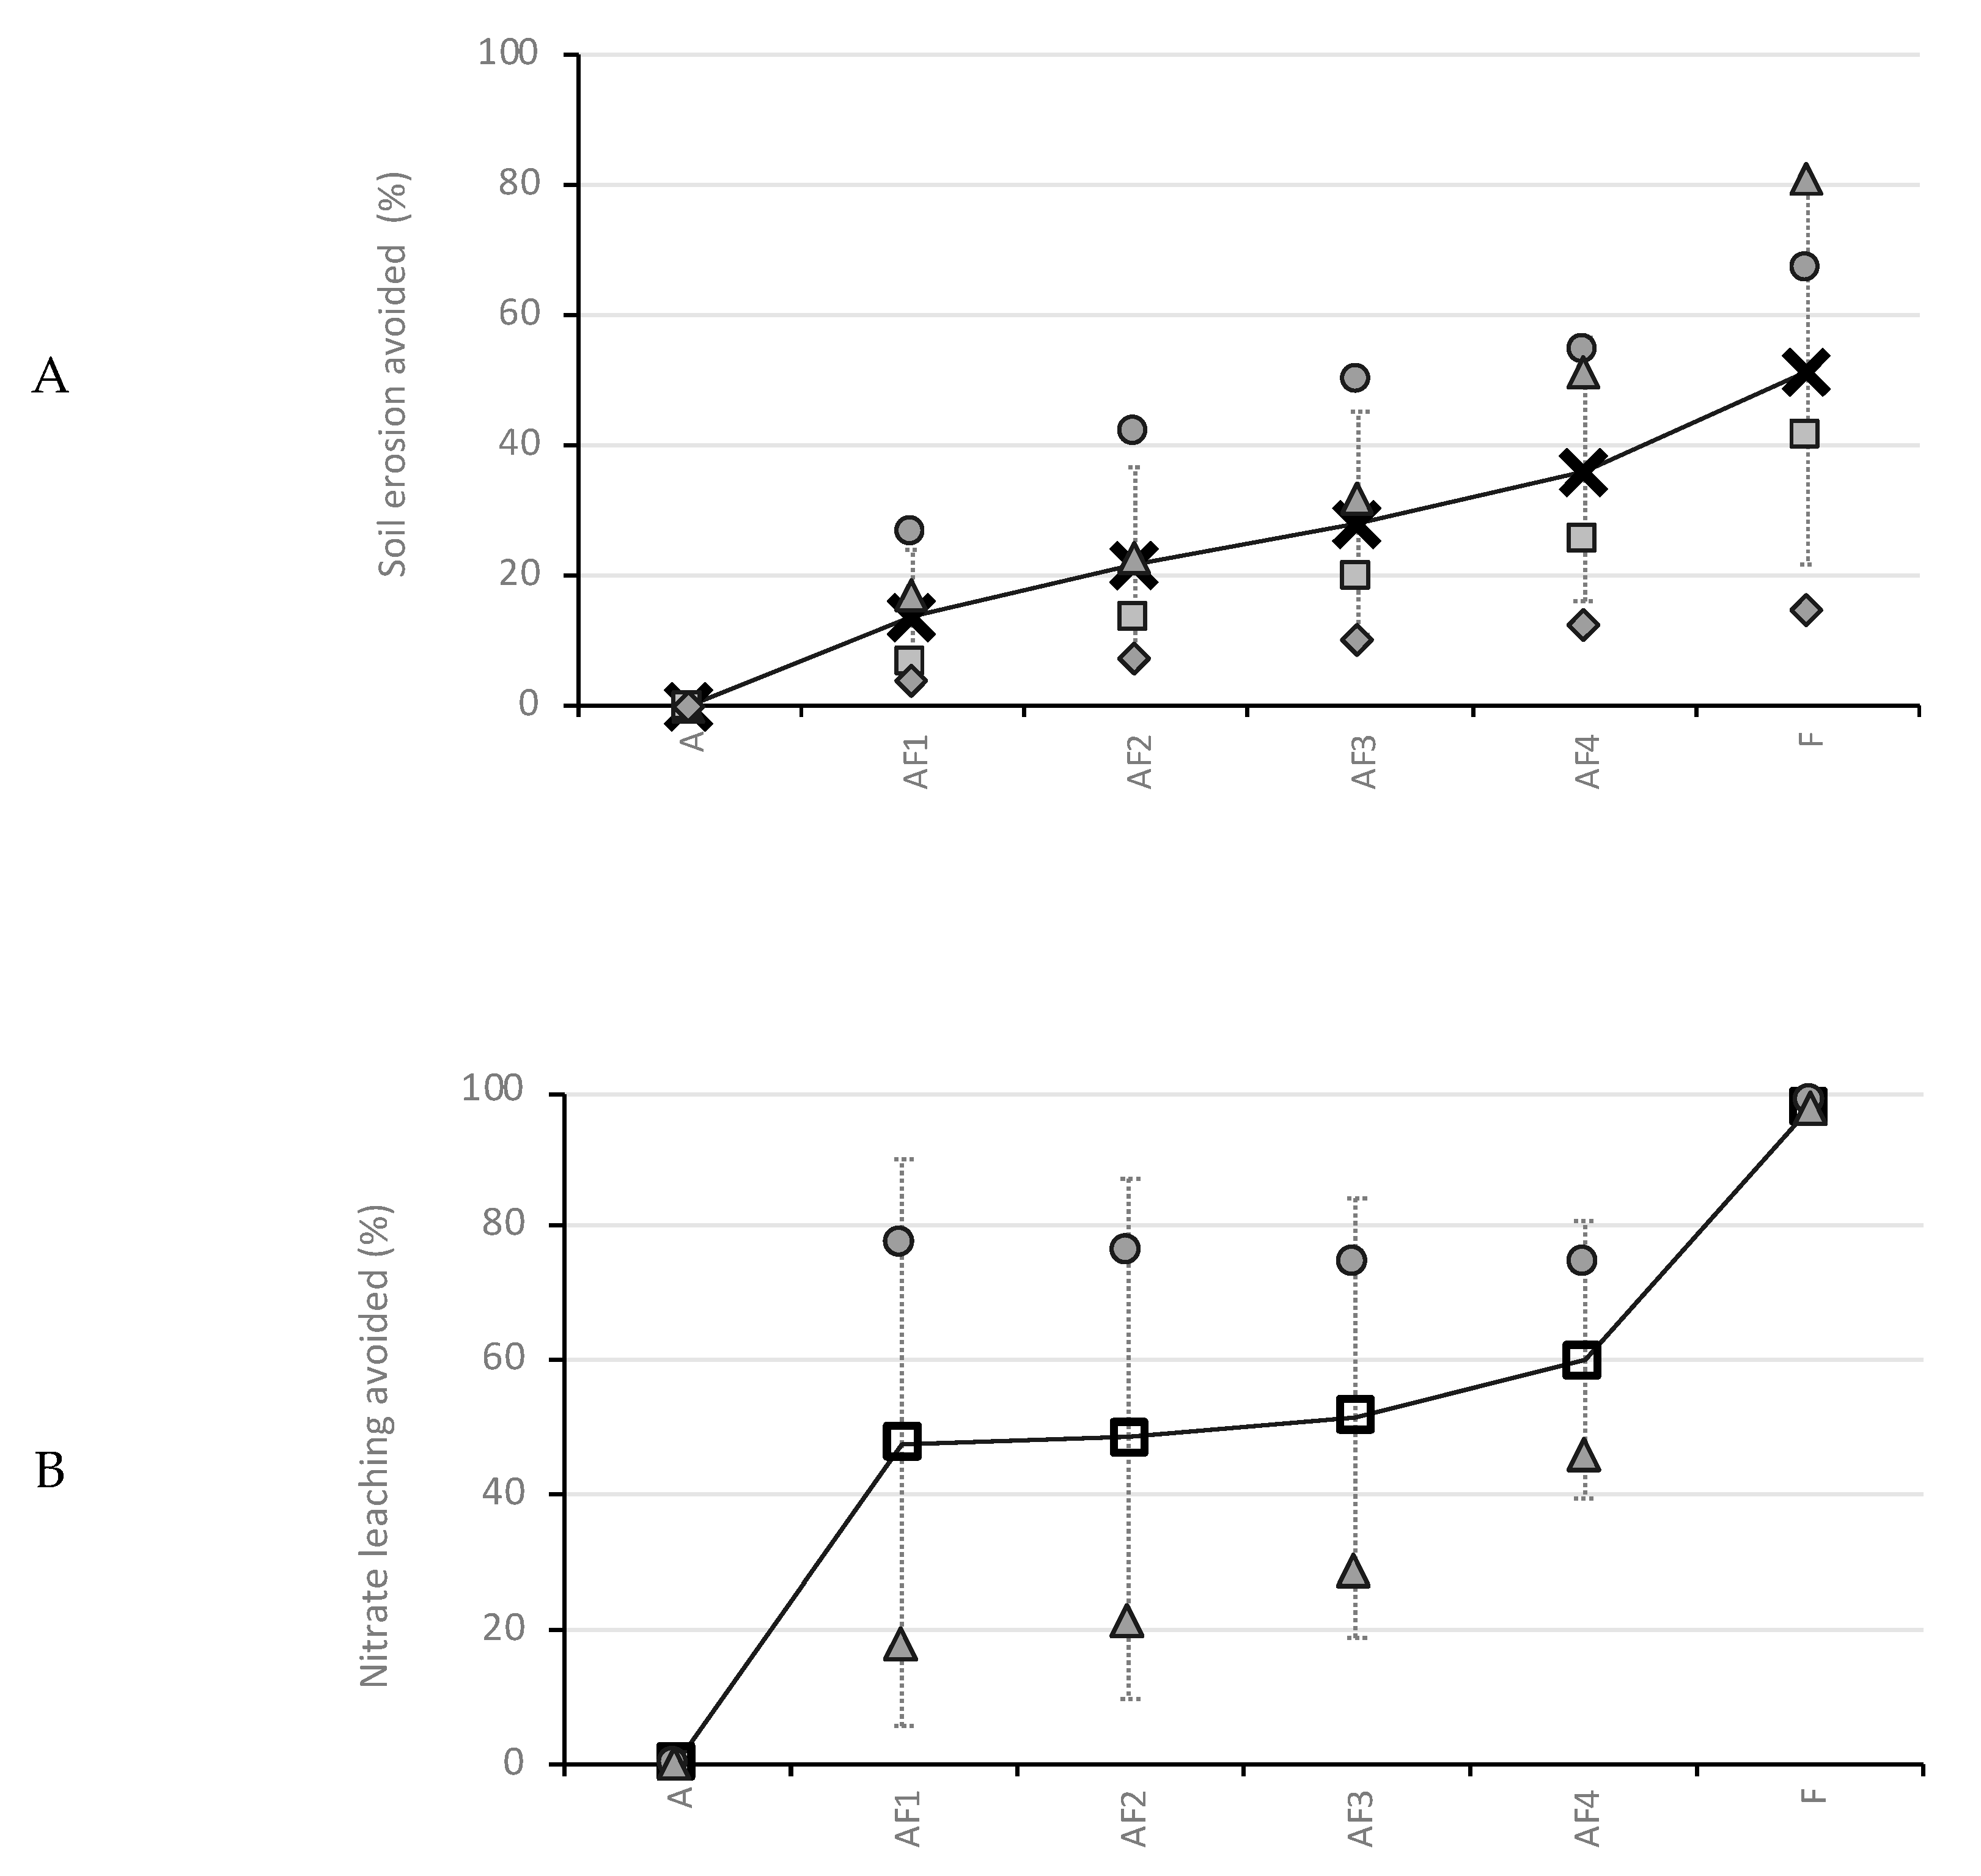
3.1. Soil Erosion
3.2. Nitrate Leaching
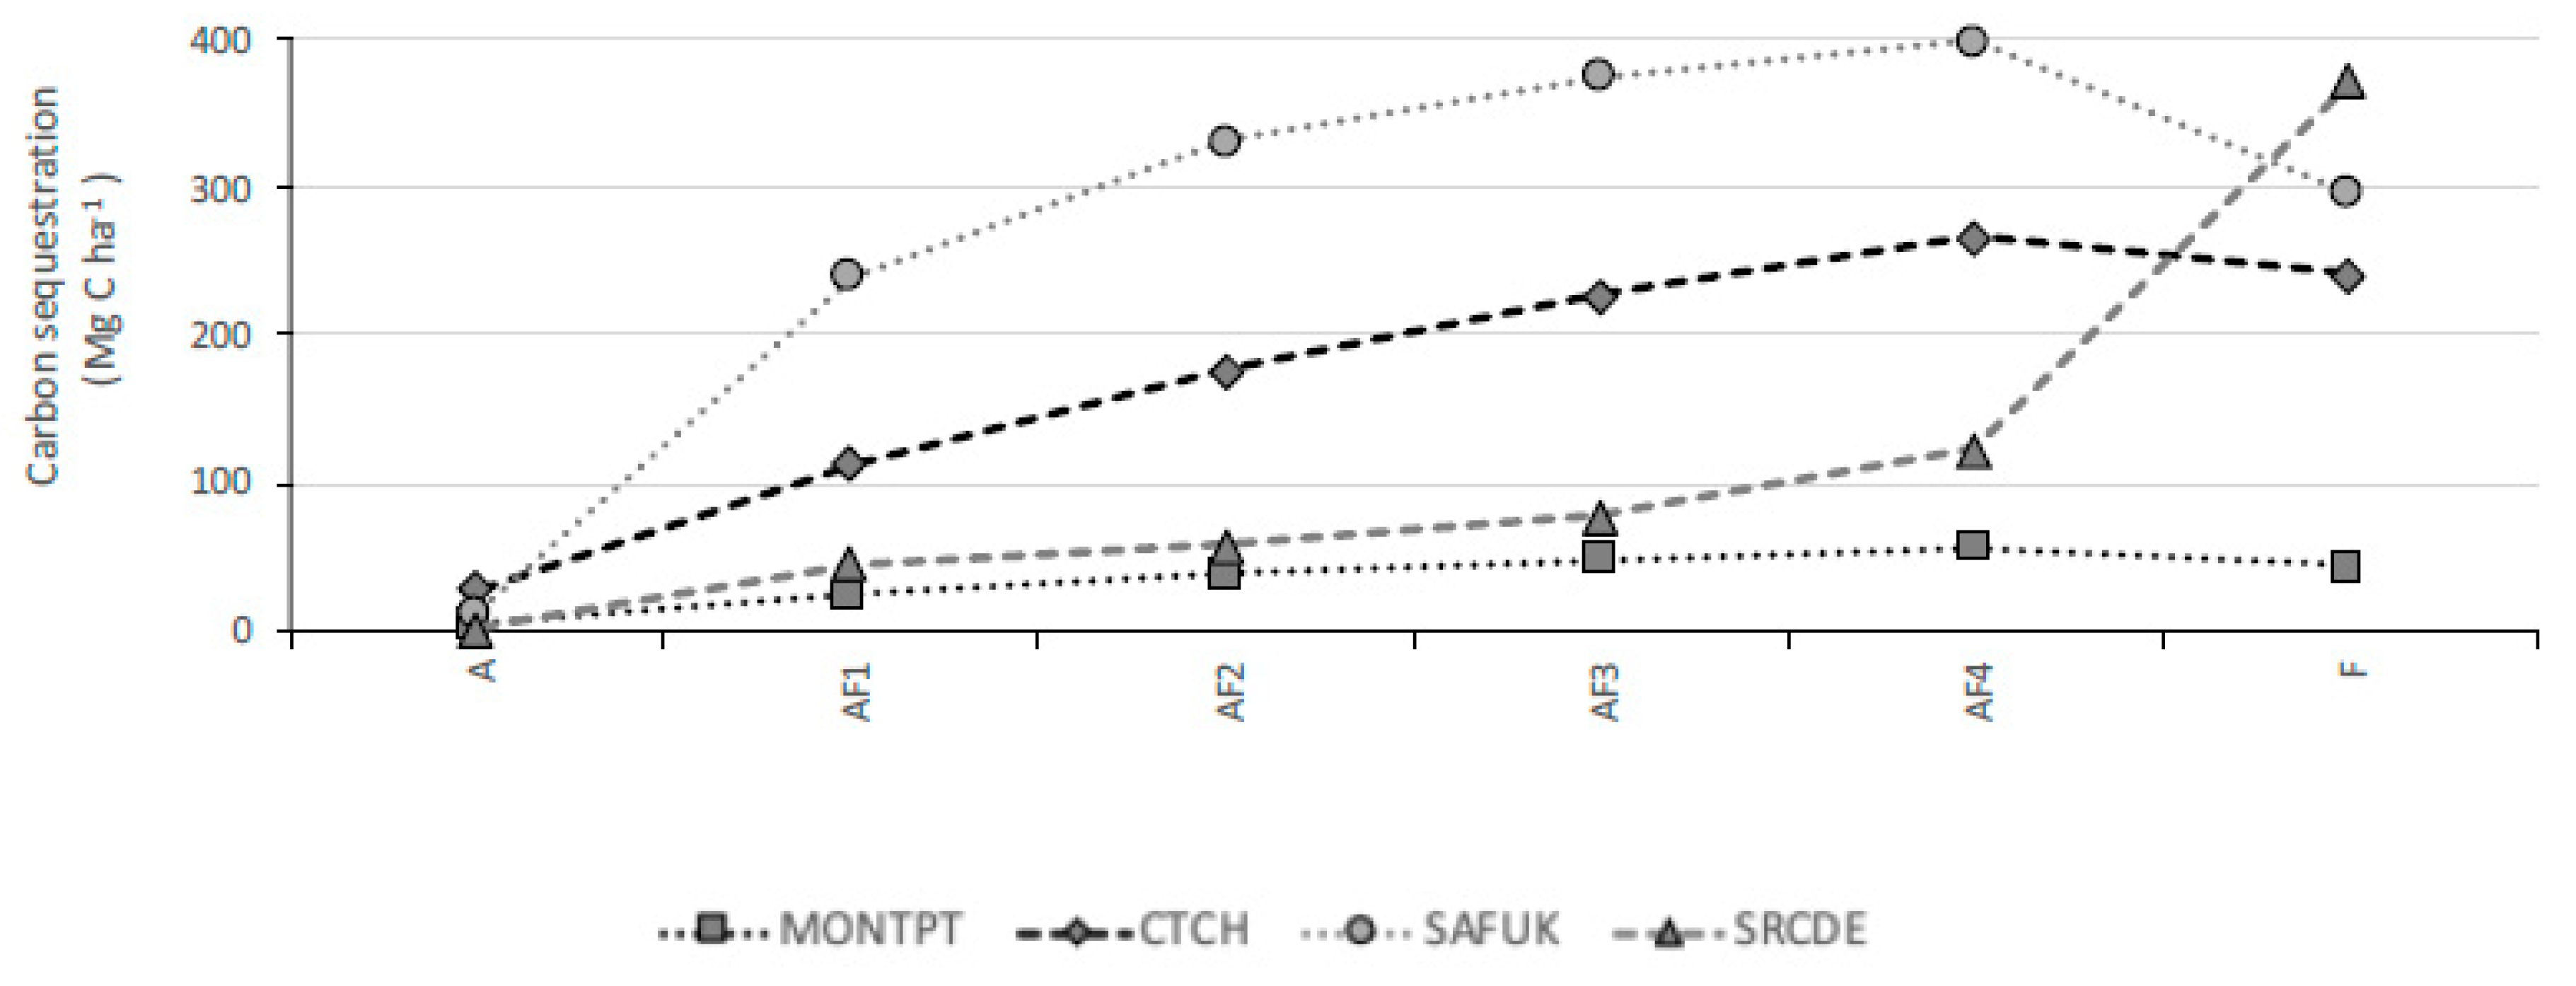
3.3. Carbon Sequestration
4. Discussion
4.1. Soil Erosion
4.2. Nitrate Leaching
4.3. Carbon Sequestration
4.4. Relative Effect of Additional Trees
4.5. Link to Provisioning Services
5. Conclusions
Author Contributions
Funding
Conflicts of Interest
Abbreviations
| AFS | Agroforestry systems |
| CICES | Common International Classification of Ecosystem Services |
| CTCH | Cherry tree pastures in Switzerland |
| MONTPT | Montado in Portugal (MONTPT) |
| SAFUK | Silvoarable systems in the United Kingdom |
| SRCDE | Short rotation coppice systems in Germany |
| PES | Provisioning ecosystem services |
| RES | Regulating ecosystem services |
| RUSLE | Revised universal soil loss equation |
References
- Graves, A.R.; Burgess, P.J.; Palma, J.H.N.; Herzog, F.; Moreno, G.; Bertomeu, M.; Dupraz, C.; Liagre, F.; Keesman, K.; van der Werf, W.; et al. Development and application of bio-economic modelling to compare silvoarable, arable, and forestry systems in three European countries. Ecol. Eng. 2007, 29, 434–449. [Google Scholar] [CrossRef] [Green Version]
- Cannell, M.G.R.; Noordwijk, M.; Ong, C.K. The central agroforestry hypothesis: The trees must acquire resources that the crop would not otherwise acquire. Agrofor. Syst. 1996, 34, 27–31. [Google Scholar] [CrossRef]
- Nair, P.K.R. The coming of age of agroforestry. J. Sci. Food Agric. 2007, 87, 1613–1619. [Google Scholar] [CrossRef]
- Jose, S. Agroforestry for ecosystem services and environmental benefits: An overview. Agrofor. Syst. 2009, 76, 1–10. [Google Scholar] [CrossRef]
- Godfray, H.C.J.; Beddington, J.R.; Crute, I.R.; Haddad, L.; Lawrence, D.; Muir, J.F.; Pretty, J.; Robinson, S.; Thomas, S.M.; Toulmin, C. Food Security: The Challenge of Feeding 9 billion. Science 2012, 327, 812–818. [Google Scholar] [CrossRef] [Green Version]
- Klaa, K.; Mill, P.J.; Incoll, L.D. Distribution of small mammals in an silvorable agroforestry system in Northern England. Agrofor. Syst. 2005, 63, 101–110. [Google Scholar] [CrossRef]
- Cardinael, R.; Chevallier, T.; Barthès, B.G.; Saby, N.P.A.; Parent, T.; Dupraz, C.; Bernoux, M.; Chenu, C. Impact of alley cropping agroforestry on stocks, forms and spatial distribution of soil organic carbon—A case study in a Mediterranean context. Geoderma 2015, 259–260, 288–299. [Google Scholar] [CrossRef] [Green Version]
- Moreno, G.; Aviron, S.; Berg, S.; Crous-Duran, J.; Franca, A.; García de Jalón, S.; Hartel, T.; Mirck, J.; Pantera, A.; Palma, J.H.N.; et al. Agroforestry systems of high nature and cultural value in Europe: Provision of commercial goods and other ecosystem services. Agrofor. Syst. 2017. [Google Scholar] [CrossRef] [Green Version]
- Burgess, P.J.; Rosati, A. Advances in European agroforestry: Results from the AGFORWARD project. Agrofor. Syst. 2018, 92, 801–810. [Google Scholar] [CrossRef] [Green Version]
- Van der Werf, W.; Keesman, K.; Burgess, P.; Graves, A.; Pilbeam, D.; Incoll, L.D.D.; Metselaar, K.; Mayus, M.; Stappers, R.; van Keulen, H.; et al. Yield-SAFE: A parameter-sparse, process-based dynamic model for predicting resource capture, growth, and production in agroforestry systems. Ecol. Eng. 2007, 29, 419–433. [Google Scholar] [CrossRef] [Green Version]
- Crous-Duran, J.; Graves, A.R.; Paulo, J.A.; Mirck, J.; Oliveira, T.S.; Kay, S.; García de Jalón, S.; Palma, J.H.N. Modelling tree density effects on provisioning ecosystem services in Europe. Agrofor. Syst. 2019, 93, 1985–2007. [Google Scholar] [CrossRef] [Green Version]
- García de Jalón, S.; Graves, A.; Moreno, G.; Palma, J.H.N.; Crous-Duran, J.; Kay, S.; Burgess, P.J. Forage-SAFE: A model for assessing the impact of tree cover on wood pasture profitability. Ecol. Model. 2018, 372, 24–32. [Google Scholar] [CrossRef]
- Pinto-Correia, T. Threatened landscape in Alentejo, Portugal: The “montado” and other “agro-silvo-pastoral” systems. Landsc. Urban Plan. 1993, 24, 43–48. [Google Scholar] [CrossRef]
- Pinto-Correia, T.; Ribeiro, N.; Sá-Sousa, P. Introducing the montado, the cork and holm oak agroforestry system of Southern Portugal. Agrofor. Syst. 2011, 82, 99–104. [Google Scholar] [CrossRef] [Green Version]
- Olea, L.; San Miguel-Ayanz, A. The Spanish dehesa. A traditional Mediterranean silvopastoral system linking production and nature conservation. In Sustainable Grassland Productivity, Proceedings of the 21st General Meeting of the European Grassland Federation, Badajoz, Spain, 3–6 April 2006; Organizing Committee of the 21st General Meeting of the European Grassland Federation: Madrid, Spain, 2006; pp. 3–13. [Google Scholar]
- Sereke, F.; Graves, A.; Dux, D.; Palma, J.; Herzog, F. Innovative agroecosystem goods and services: Key profitability drivers in Swiss agroforestry. Agron. Sustain. Dev. 2015, 35, 759–770. [Google Scholar] [CrossRef] [Green Version]
- Eichhorn, M.P.; Paris, P.; Herzog, F.; Incoll, L.D.; Liagre, F.; Mantzanas, K.; Mayus, M.; Moreno, G.; Papanastasis, V.P.; Pilbeam, D.J.; et al. Silvoarable systems in Europe—Past, present and future prospects. Agrofor. Syst. 2006, 67, 29–50. [Google Scholar] [CrossRef]
- Herzog, F. Streuobst: A traditional agroforestry system as a model for agroforestry development in temperate Europe. Agrofor. Syst. 1998, 42, 61–80. [Google Scholar] [CrossRef]
- Burgess, P.J.; Incoll, L.D.; Corry, D.T.; Beaton, A.; Hart, B.J. Poplar (Populus spp) growth and crop yields in a silvoarable experiment at three lowland sites in England. Agrofor. Syst. 2005, 63, 157–169. [Google Scholar] [CrossRef]
- Becker, A.; Kemnitz, D.; Peters, D. Erhebung, Aufbereitung und Analyse Statistischer Daten zum Anbau und zur Verarbeitung Nachwachsender Rohstoffe und Energiepflanzen in Deutschland sowie Weiterentwicklung von Methoden Hierzu; Fachagentur Nachwachsende Rohstoffe: Gülzow-Prüzen, Germany, 2019. [Google Scholar]
- Manning, D.B.; Bemmann, A.; Bredemeier, M.; Lamersdorf, N.; Ammer, C. Bioenergy from Dendromass for the Sustainable Development of Rural Areas; Butler Manning, D., Bemmann, A., Bredemeier, M., Lamersdorf, N., Ammer, C., Eds.; Wiley-VCH: Weinheim, Germany, 2015; ISBN 9783527682973. [Google Scholar]
- Panagos, P.; Borrelli, P.; Poesen, J.; Ballabio, C.; Lugato, E.; Meusburger, K.; Montanarella, L.; Alewell, C. The new assessment of soil loss by water erosion in Europe. Environ. Sci. Policy 2015, 54, 438–447. [Google Scholar] [CrossRef]
- Palma, J.H.N.; Graves, A.R.; Burgess, P.J.; Keesman, K.J.; van Keulen, H.; Mayus, M.; Reisner, Y.; Herzog, F. Methodological approach for the assessment of environmental effects of agroforestry at the landscape scale. Ecol. Eng. 2007, 29, 450–462. [Google Scholar] [CrossRef] [Green Version]
- Palma, J.H.N.; Crous-Duran, J.; Graves, A.R.; Garcia de Jalón, S.; Upson, M.; Oliveira, T.S.; Paulo, J.A.; Ferreiro-Dominguez, N.; Moreno, G.; Burgess, P.J. Integrating belowground carbon dynamics into Yield-SAFE, a parameter sparse agroforestry model. Agrofor. Syst. 2017, 92, 1047–1057. [Google Scholar] [CrossRef]
- García de Jalón, S.; Graves, A.R.; Palma, J.H.N.; Williams, A.; Upson, M.; Burgess, P.J. Modelling and valuing the environmental impacts of arable, forestry and agroforestry systems: A case study. Agrofor. Syst. 2018, 92, 1059–1073. [Google Scholar] [CrossRef] [Green Version]
- Ballabio, C.; Borrelli, P.; Spinoni, J.; Meusburger, K.; Michaelides, S.; Beguería, S.; Klik, A.; Petan, S.; Janeček, M.; Olsen, P.; et al. Mapping monthly rainfall erosivity in Europe. Sci. Total Environ. 2017, 579, 1298–1315. [Google Scholar] [CrossRef] [PubMed] [Green Version]
- Panagos, P.; Meusburger, K.; Ballabio, C.; Borrelli, P.; Alewell, C. Soil erodibility in Europe: A high-resolution dataset based on LUCAS. Sci. Total Environ. 2014, 479–480, 189–200. [Google Scholar] [CrossRef] [PubMed]
- Panagos, P.; Borrelli, P.; Meusburger, K. A New European Slope Length and Steepness Factor (LS-Factor) for Modeling Soil Erosion by Water. Geosciences 2015, 5, 117–126. [Google Scholar] [CrossRef] [Green Version]
- Kay, S.; Crous-Duran, J.; Ferreiro-Domínguez, N.; García de Jalón, S.; Graves, A.; Moreno, G.; Mosquera-Losada, M.R.; Palma, J.H.N.; Roces-Díaz, J.V.; Santiago-Freijanes, J.J.; et al. Spatial similarities between European agroforestry systems and ecosystem services at the landscape scale. Agrofor. Syst. 2018, 92, 1075–1089. [Google Scholar] [CrossRef] [Green Version]
- Panagos, P.; Borrelli, P.; Meusburger, K.; Alewell, C.; Lugato, E.; Montanarella, L. Estimating the soil erosion cover-management factor at the European scale. Land Use Policy 2015, 48, 38–50. [Google Scholar] [CrossRef]
- Panagos, P.; Borrelli, P.; Meusburger, K.; van der Zanden, E.H.; Poesen, J.; Alewell, C. Modelling the effect of support practices (P-factor) on the reduction of soil erosion by water at European scale. Environ. Sci. Policy 2015, 51, 23–34. [Google Scholar] [CrossRef]
- Noy-Meir, I.; Harpaz, Y. Agro-ecosystems in Israel. In Agro-Ecosystems; Harper, J., Gruys, P., Eds.; Elsevier Scientific Publishing: Amsterdam, The Netherlands, 1977; pp. 143–167. [Google Scholar]
- Vlek, P.L.G.; Fillery, I.R.P.; Burford, J.R. Accesion, transformation, and loss of nitrogen in soils of the arid region. Plant Soil 1981, 58, 133–175. [Google Scholar] [CrossRef]
- EMEP Cooperative Programme for Monitoring and Evaluation of the Long-Range Transmission of Air Pollutants in Europe. Available online: www.emep.int (accessed on 7 April 2019).
- Van Keulen, H.; Aarts, H.F.M.; Habekotté, B.; Van Der Meer, H.G.; Spiertz, J.H.J. Soil-plant-animal relations in nutrient cycling: The case of dairy farming system “De Marke”. Eur. J. Agron. 2000, 13, 245–261. [Google Scholar] [CrossRef]
- Otieno, D.O.O.; Mirzaei, H.; Hussain, M.Z.Z.; Li, Y.L.L.; Schmidt, M.W.T.; Wartinger, M.; Jung, E.; Ribeiro, N.; Pereira, J.S.S.; Tenhunen, J. Herbaceous layer development during spring does not deplete soil nitrogen in the Portuguese montado. J. Arid Environ. 2011, 75, 231–238. [Google Scholar] [CrossRef]
- Büchi, L.; Gebhard, C.A.; Liebisch, F.; Sinaj, S.; Ramseier, H.; Charles, R. Accumulation of biologically fixed nitrogen by legumes cultivated as cover crops in Switzerland. Plant Soil 2015, 393, 163–175. [Google Scholar] [CrossRef]
- Draycott, A.P. Sugar Beet; Blackwell Publishing: Oxford, UK, 2006; ISBN 9781405119115. [Google Scholar]
- Bazot, S.; Barthes, L.; Blanot, D.; Fresneau, C. Distribution of non-structural nitrogen and carbohydrate compounds in mature oak trees in a temperate forest at four key phenological stages. Trees Struct. Funct. 2013, 27, 1023–1034. [Google Scholar] [CrossRef]
- Morhart, C.; Sheppard, J.P.; Schuler, J.K.; Spiecker, H. Above-ground woody biomass allocation and within tree carbon and nutrient distribution of wild cherry (Prunus avium L.)—A case study. For. Ecosyst. 2016, 3, 4. [Google Scholar] [CrossRef] [Green Version]
- Euring, D.; Ayegbeni, S.; Jansen, M.; Tu, J.; Gomes Da Silva, C.; Polle, A. Growth performance and nitrogen use efficiency of two Populus hybrid clones (P. nigra × P. maximowiczii and P. trichocarpa × P. maximowiczii) in relation to soil depth in a young plantation. IForest 2016, 9, 847–854. [Google Scholar] [CrossRef]
- Coleman, K.; Jenkinson, D.S. RothC—A model for the turnover of carbon in soil. Eval. Soil Org. Matter Model. 2014, 1–44. [Google Scholar] [CrossRef]
- Steven, A.; Duethman, D.; Gooday, R.; Harris, D.; Newell-Price, P.; Chadwick, D.; Misselbrook, T. Quantitative Assessment of Scenarios for Managing Trade-Off Between Economics, Environment and Media; Project WQ0106; DEFRA: London, UK, 2009. [Google Scholar]
- Agnew, J.M.; Leonard, J.J.; Feddes, J.; Feng, Y. A modified air pycnometer for compost air volume and density determination. Can. Biosyst. Eng. 2003, 45, 6–27. [Google Scholar]
- Van Horn, H.H.; Wilkie, A.C.; Powers, W.J.; Nordstedt, R.A. Components of Dairy Manure Management Systems. J. Dairy Sci. 1994, 77, 2008–2030. [Google Scholar] [CrossRef]
- Palma, J.H.N. Clipick—Climate change web picker. A tool bridging daily climate needs in process based modelling in forestry and agriculture. For. Syst. 2017, 26, 14. [Google Scholar] [CrossRef]
- Palma, J.H.N.; Graves, A.R.; Bunce, R.G.H.; Burgess, P.J.; de Filippi, R.; Keesman, K.J.; van Keulen, H.; Liagre, F.; Mayus, M.; Moreno, G.; et al. Modeling environmental benefits of silvoarable agroforestry in Europe. Agric. Ecosyst. Environ. 2007, 119, 320–334. [Google Scholar] [CrossRef] [Green Version]
- García-Ruiz, J.M.; Beguería, S.; Nadal-Romero, E.; González-Hidalgo, J.C.; Lana-Renault, N.; Sanjuán, Y. A meta-analysis of soil erosion rates across the world. Geomorphology 2015, 239, 160–173. [Google Scholar] [CrossRef] [Green Version]
- Guerra, C.A.; Pinto-correia, T.; Metzger, M.J. Mapping Soil Erosion Prevention Using an Ecosystem Service Modeling Framework for Integrated Land Management and Policy. Ecosystems 2014, 17, 878–889. [Google Scholar] [CrossRef] [Green Version]
- Pimentel, D.; Krummel, J. Biomass energy and soil erosion: Assessment of resource costs. Biomass 1987, 14, 15–38. [Google Scholar] [CrossRef]
- Tolbert, V.; Mann, L.; Tolbert, V. Soil Sustainability in Renewable Biomass Plantings. AMBIO J. Hum. Environ. 2000, 29, 492–498. [Google Scholar] [CrossRef]
- Kort, J.; Collins, M.; Ditsch, D. A review of soil erosion associated to biomass crops. Biomass Bioenergy 1998, 14, 351–359. [Google Scholar] [CrossRef]
- Sylvester-Bradley, R.; Shepherd, M.A. Effects of interposing sugar beet on the nitrogen response of the following wheat crop. J. Sci. Food Agric. 1997, 74, 323–330. [Google Scholar] [CrossRef]
- Nair, V.D.; Nair, P.K.R.; Kalmbacher, R.S.; Ezenwa, I.V. Reducing nutrient loss from farms through silvopastoral practices in coarse-textured soils of Florida, USA. Ecol. Eng. 2007, 29, 192–199. [Google Scholar] [CrossRef]
- Hartmann, L.; Lamersdorf, N. Site Conditions, Initial Growth and Nutrient and Litter Cycling of Newly Installed Short Rotation Coppice and Agroforestry Systems. In Bioenergy from Dendromass for the Sustainable Development of Rural Areas; Butler Manning, D., Bemmann, A., Bredemeier, M., Lamersdorf, N., Ammer, C., Eds.; Wiley-VCH: Weinheim, Germany, 2015; ISBN 978-3-527-33764-4. [Google Scholar]
- Palma, J.H.N.; Paulo, J.A.; Tomé, M. Carbon sequestration of modern Quercus suber L. silvoarable agroforestry systems in Portugal: A YieldSAFE-based estimation. Agrofor. Syst. 2014, 88, 791–801. [Google Scholar] [CrossRef]
- Mathews, G. The Carbon Content of Trees; Forestry Commission Technical Paper 4; Forestry Commission of the United Kingdom: Edinburgh, UK, 1993. [Google Scholar]
- Mirck, J.; Kanzler, M.; Quinkenstein, A. Agforward Project System Report: Alley Cropping in Germany. Agforward Project; BTU Cottbus-Senftenberg: Cottbus, Germany, 2016; Available online: https://www.agforward.eu/index.php/pt/integracao-de-arvores-e-culturas-arvenses-alemanha-862.html?file=files/agforward/documents/WP4%20Initial%20Stakeholder%20report%20BTU%20Arable%20final.pdf (accessed on 15 August 2020).
- Kanzler, M.; Mirck, J. Lessons Learnt—Alley Cropping in Germany; Leaflet of the FP7 AGFORWARD Project; European Comission: Brussels, Belgium, 2017. [Google Scholar]
- Medinski, T.V.; Freese, D.; Böhm, C.; Slazak, A. Soil carbon fractions in short rotation poplar and black locust coppices, Germany. Agrofor. Syst. 2014, 88, 505–515. [Google Scholar] [CrossRef]
- López-Díaz, M.L.; Rolo, V.; Moreno, G. Trees’ role in nitrogen leaching after organic, mineral fertilization: A greenhouse experiment. J. Environ. Qual. 2011, 40, 853–859. [Google Scholar] [CrossRef]
- Graves, A.R.; Burgess, P.J.; Palma, J.H.N.; Keesman, K.J.; van der Werf, W.; Dupraz, C.; van Keulen, H.; Herzog, F.; Mayus, M. Implementation and calibration of the parameter-sparse Yield-SAFE model to predict production and land equivalent ratio in mixed tree and crop systems under two contrasting production situations in Europe. Ecol. Model. 2010, 221, 1744–1756. [Google Scholar] [CrossRef] [Green Version]
- Balandier, P.; De Montard, F.X.; Curt, T. Root competition for water between trees and grass in a silvopastoral plot of ten-year-old Prunus avium. In Ecological Basis of Agroforestry; CRC Press Taylor & Francis Group: Boca Raton, FL, USA, 2003; pp. 253–270. ISBN 9781420043365. [Google Scholar]
- Cardinael, R.; Chevallier, T.; Cambou, A.; Béral, C.; Barthès, B.G.; Dupraz, C.; Durand, C.; Kouakoua, E.; Chenu, C. Increased soil organic carbon stocks under agroforestry: A survey of six different sites in France. Agric. Ecosyst. Environ. 2017, 236, 243–255. [Google Scholar] [CrossRef] [Green Version]
- Stephenson, N.L.; Das, A.J.; Condit, R.; Russo, S.E.; Baker, P.J.; Beckman, N.G.; Coomes, D.A.; Lines, E.R.; Morris, W.K.; Rüger, N.; et al. Rate of tree carbon accumulation increases continuously with tree size. Nature 2014, 507, 90–93. [Google Scholar] [CrossRef] [PubMed]
- Cubera, E.; Nunes, J.M.; Madeira, M.; Gazarini, L. Influence of Quercus ilex trees on herbaceous production and nutrient concentrations in southern Portugal. J. Plant Nutr. Soil Sci. 2009, 172, 565–571. [Google Scholar] [CrossRef]
- Rivest, D.; Rolo, V.V.; López-Díaz, L.; Moreno, G.; Lopez-Diaz, L.; Moreno, G. Shrub encroachment in Mediterranean silvopastoral systems: Retama sphaerocarpa and Cistus ladanifer induce contrasting effects on pasture and Quercus ilex production. Agric. Ecosyst. Environ. 2011, 141, 447–454. [Google Scholar] [CrossRef]
- López-Díaz, M.L.; Rolo, V.; Benítez, R.; Moreno, G. Shrub encroachment of Iberian dehesas: Implications on total forage productivity. Agrofor. Syst. 2015, 89, 587–598. [Google Scholar] [CrossRef]
- Palma, J.H.N.; Graves, A.R.; Crous-Duran, J.; Upson, M.; Paulo, J.A.; Oliveira, T.; García de Jalón, S.; Burgess, P.J. Yield-SAFE Model Improvements. Report for Milestone 29 (6.4) of the AGFORWARD Project; FP7 AGFORWARD Project; European Comission: Brussels, Belgium, 2016. [Google Scholar]
- Van Keulen, H. Nitrogen Requirements of Rice with Special Reference to Java; Central Research Institute for Agriculture: Bogor, Indonesia, 1977; No. 30; pp. 1–67. [Google Scholar]
- Van Keulen, H. Graphical Analysis of Annual Crop Response. Agric. Syst. 1982, 9, 113–126. [Google Scholar] [CrossRef]
- Van Keulen, H.; Wolf, J. Crop. Production as Determined by Nutrient Availability. In Modelling of Agricultural Production: Weather, Soils and Crops; Simulation Monographs: Wageningen, The Netherlands, 1986; pp. 153–181. [Google Scholar]


| Montado | Cherry Orchards | Silvoarable Systems | Short Rotation Coppice | |
| Location | Montemor-o-Novo, Portugal | Gempen, Switzerland | Silsoe, United Kingdom | Forst, Germany |
| Identification | MONTPT | CTCH | SAFUK | SRCDE |
| Altitude (m asl) | 130 | 680 | 70 | 75 |
| Longitude (°) | 38.7023 | 7.2299 | 50.0089 | 51.7890 |
| Latitude (°) | −8.3261 | 6.9943 | 0.4358 | 14.4918 |
| Meteorological conditions | ||||
| Mean annual solar radiation (MJ m−2) | 6080 | 4340 | 3710 | 4078 |
| Mean annual temperature (°C) | 14.1 | 5.5 | 11 | 7.29 |
| Mean annual rainfall (mm) | 693 | 1157 | 747 | 609 |
| Mean wind speed (m s−1) | 3.65 | 2.2 | 5.43 | 3.61 |
| Soil data | ||||
| Soil texture | Medium-fine | Fine | Very fine | Medium |
| Soil depth (cm) | 100 | 50 | 150 | 100 |
| Agroforestry components | ||||
| Tree | Quercusrotundifolia L. | Prunus avium L. | Populus spp. | Populus spp. Max 1 var. |
| Crop | Non-improved Natural grasslands (ng) | Non-improved Natural grasslands (ng) | Wheat (w) Barley (b) Oilseed (o) | Sugar beet (sb) Wheat (w) |
| Crop rotation | none | none | w/w/b/o | sb/w/sb/w |
| Livestock | Iberian pig/cattle | Cattle | - | - |
| Section: Regulation & Maintenance | ||||||
|---|---|---|---|---|---|---|
| Division | Group | Class | Indicator | Method | Unit | Reference |
| Regulation of physical, chemical and biological conditions | Regulation of baseline flows and extreme events | Control of erosion rates | Soil erosion | RUSLE equation | Mg soil ha−1 yr−1 | [22] |
| Water conditions | Regulation of physical, chemical and biological conditions | Nitrate leaching | Nitrogen balance | Kg N ha−1 yr−1 | [23] | |
| Atmospheric composition and conditions | Regulation of chemical composition of atmosphere and oceans | Carbon sequestered | Yield-SAFE | Mg C ha−1 yr−1 | [24] | |
| Factor | MONTPT | CTCH | SAFUK | SRCDE | Units | Reference |
|---|---|---|---|---|---|---|
| R | 519 | 500 | 265 | 426 | MJ mm ha−1 year−1 | [26] |
| K | 0.0305 | 0.055 | 0.0305 | 0.024 | t h MJ−1mm−1 | [27,29] |
| LS | 0.3 | 0.3 | 0.3 | 0.3 | Unitless | [28,29] |
| Ctree | Cork oak: 0.03 | Cherry tree: 0.03 | Populus spp.: 0.03 | Populus spp.: 0.03 | Unitless | [30] |
| Ccrop | Iberian pastures: 0.15 | Swiss pastures: 0.15 | Wheat: 0.21 Barley: 0.21 Oilseed: 0.28 | Wheat: 0.21 Sugar beet: 0.34 | ||
| Cfallow | Fallow: 0.15 | Fallow: 0.15 | Grass: 0.15 | Grass: 0.15 | ||
| P | 1 | 1 | 1 | 1 | Unitless | [31] |
| Crop (Units) | N Content Aboveground (0–1) | N Content Roots (0–1) | N Fertilization Applied (kg N ha−1 yr−1) | Reference |
|---|---|---|---|---|
| Montado grass | 0.02 | 0.02 | 0 | [36] |
| Swiss grass | 0.03 | 0.03 | 0 | [37] |
| Wheat UK | 0.022 | 0.006 | 175 | [25] |
| Barley UK | 0.01 | 0.004 | 145 | |
| Oilseed UK | 0.018 | 0.007 | 200 | |
| Sugar beet DE | 0.00265 | 0.00265 | 120 | [38] |
| Holm oak | 0.012 | 0.0158 | 0 | [39] |
| Cherry tree | 0.012 | 0.0045 | 0 | [40] |
| Poplar spp. | 0.0099 | 0.004 | 0 | [41] |
© 2020 by the authors. Licensee MDPI, Basel, Switzerland. This article is an open access article distributed under the terms and conditions of the Creative Commons Attribution (CC BY) license (http://creativecommons.org/licenses/by/4.0/).
Share and Cite
Crous-Duran, J.; Graves, A.R.; García de Jalón, S.; Kay, S.; Tomé, M.; Burgess, P.J.; Giannitsopoulos, M.; Palma, J.H.N. Quantifying Regulating Ecosystem Services with Increased Tree Densities on European Farmland. Sustainability 2020, 12, 6676. https://0-doi-org.brum.beds.ac.uk/10.3390/su12166676
Crous-Duran J, Graves AR, García de Jalón S, Kay S, Tomé M, Burgess PJ, Giannitsopoulos M, Palma JHN. Quantifying Regulating Ecosystem Services with Increased Tree Densities on European Farmland. Sustainability. 2020; 12(16):6676. https://0-doi-org.brum.beds.ac.uk/10.3390/su12166676
Chicago/Turabian StyleCrous-Duran, Josep, Anil R. Graves, Silvestre García de Jalón, Sonja Kay, Margarida Tomé, Paul J. Burgess, Michail Giannitsopoulos, and João H.N. Palma. 2020. "Quantifying Regulating Ecosystem Services with Increased Tree Densities on European Farmland" Sustainability 12, no. 16: 6676. https://0-doi-org.brum.beds.ac.uk/10.3390/su12166676